the Creative Commons Attribution 4.0 License.
the Creative Commons Attribution 4.0 License.
 | 26 Oct 2020
An idealized model sensitivity study on Dead Sea desertification with a focus on the impact on convection
Samiro Khodayar
Johannes Hoerner
The Dead Sea desertification-threatened region is affected by continual lake level decline and occasional but life-endangering flash floods. Climate change has aggravated such issues in the past decades. In this study, the impact on local conditions leading to heavy precipitation from the changing conditions of the Dead Sea is investigated. Idealized sensitivity simulations with the high-resolution COSMO-CLM (COnsortium for Small-scale MOdelling and Climate Limited-area Modelling) and several numerical weather prediction (NWP) runs on an event timescale are performed on the Dead Sea area. The simulations are idealized in the sense that the Dead Sea model representation does not accurately represent the real conditions but those given by an external dataset. A reference or Dead Sea simulation covering the 2003–2013 period and a twin sensitivity or bare soil simulation in which the Dead Sea is set to bare soil are compared. NWP simulations focus on heavy precipitation events exhibiting relevant differences between the Dead Sea and the bare soil decadal realization to assess the impact on the underlying convection-related processes.
The change in the conditions of the Dead Sea is seen to affect the atmospheric conditions leading to convection in two ways. (a) The local decrease in evaporation reduces moisture availability in the lower boundary layer locally and in the neighbouring regions, directly affecting atmospheric stability. Weaker updraughts characterize the drier and more stable atmosphere of the simulations in which the Dead Sea has been dried out. (b) Thermally driven wind system circulations and resulting divergence/convergence fields are altered, preventing in many occasions the initiation of convection because of the omission of convergence lines. On a decadal scale, the difference between the simulations suggests a weak decrease in evaporation, higher air temperatures and less precipitation (less than 0.5 %).
- Article
(26553 KB) - Full-text XML
- BibTeX
- EndNote


The Eastern Mediterranean and the Middle East is a sensitive climate change area (Smiatek et al., 2011). The anticipated warming in the 21st century combined with the general drying tendency suggests important regional impacts of climate change which should be investigated to assess and mitigate local effects on society and ecosystems. The Dead Sea basin is dominated by semi-arid and arid climates except in the north-western part which is governed by the Mediterranean climate (Greenbaum et al., 2006). It is an ideal area to study climate variation in the Near East. Ashbel and Brooks (1939) already discussed the influence of the Dead Sea on the climate of its neighbouring regions. There is evidence of the change in the climate of the Dead Sea basin caused by the drying of the Dead Sea in the last decades (Alpert et al., 1997; Cohen and Stanhill, 1996; Stanhill, 1994). The Dead Sea is the lowest body of water in the world ( m), and it is surrounded by the Judean Mountains (up to ∼1 km a.m.s.l., above mean sea level) to the west and by the Moab Mountains to the east (up to ∼3 km a.m.s.l.). The area in between is rocky desert. The complex topography of the area favours the combined occurrence of several wind regimes in addition to the general synoptic systems, namely valley and slope winds, Mediterranean breezes, and local lake breezes (e.g. Shafir and Alpert, 2011). These wind systems are of great importance for the living conditions in the region since they influence visibility and the air quality (e.g. Kalthoff et al., 2000; Corsmeier et al., 2005), as well as the atmospheric temperature and humidity. Since the Dead Sea is a terminal lake of the Dead Sea valley, no natural outflow exists; evaporation is the main loss of water. The wind velocity and vapour pressure deficit are identified as the main governing factors of evaporation throughout the year (Metzger et al., 2018). Through the high evaporation, the lake level declines which results in a desertification of the shoreline and a changing fraction of water and land surfaces in the valley. The documented Dead Sea water level drop of about 1 m yr−1 in the last decades (Gavrieli et al., 2005) is mainly due to the massive water consumption upstream, with climate changes being a small contribution to the lake level decrease (Lensky and Dente, 2015). This situation severely affects agriculture, industry and the environmental conditions in the area, thus leading to substantial economic losses (Arkin and Gilat, 2000).
The Jordan River catchment and Dead Sea exhibit in the north annual precipitation in the order of 600–800 mm, whereas in the south, there is an arid climate all year with an annual precipitation of less than 150 mm (Schaedler and Sasse, 2006). Rain occurs between October and May and can be localized or widespread (Dayan and Sharon, 1980; Sharon and Kutiel, 1986). Rainfall varies seasonally and annually, and it is often concentrated in intense showers (Greenbaum et al., 2006) caused mainly by severe convection (Dayan and Morin, 2006). Flash floods are among the most dangerous meteorological hazards affecting the Mediterranean countries (Llasat et al., 2010); thus, knowledge about the processes shaping these events is of high value. This is particularly relevant in arid climates where rainfall is scarce and often local and highly variable. In flood-producing rainstorms, atmospheric processes often act in concert at several scales. Synoptic-scale processes transport and redistribute the excess sensible and latent heat accumulated over the region, and sub-synoptic-scale processes determine the initiation of severe convection and the resulting spatio-temporal rainfall characteristics. The main responsible synoptic weather patterns leading to heavy rainfall in the region are, in general, well-known and have been described in previous publications (e.g. Belachsen et al., 2017; Dayan and Morin, 2006). Belachsen et al. (2017) pointed out that three main synoptic patterns are associated with these heavy rain events: Cyprus low accounting for 30 % of the events, Syrian low to the east of the study region for 44 % and Active Red Sea Trough (ARST) for 26 %. The first two originate from the Mediterranean Sea, while the third is an extension of the African monsoon. Houze (2012) showed that orographic effects lead to enhanced rainfall generation; rain cells are larger where the topography is higher. Sub-synoptic-scale processes play a decisive role in deep convection generation in the region. Convection generated by static instability seems to play a more important role than synoptic-scale vertical motions (Dayan and Morin, 2006). The moisture for developing intensive convection over the Dead Sea region can originate from the adjacent Mediterranean Sea (Alpert and Shay-EL, 1994) and from distant upwind sources (Dayan and Morin, 2006).
In this study, the sensitivity of the local conditions to the changing conditions of the Dead Sea is investigated. The relevance of the Dead Sea as a local source of moisture for precipitating convection, as well as the impact of the energy balance partitioning changes and related processes caused by setting the Dead Sea to bare soil, is investigated. With this purpose, an idealized sensitivity experiment with the high-resolution regional climate model COSMO-CLM (COnsortium for Small-scale MOdelling, COSMO, and Climate Limited-area Modelling, CLM; Böhm et al., 2006) is conducted. The high horizontal grid spacing used (∼2.8 km) resolves relevant orographic and small-scale features of the Dead Sea basin, which is not the case when coarser resolution simulations are performed. Moreover, at this resolution, convection is explicitly resolved instead of being parameterized, which has been already extensively demonstrated to be highly beneficial for the simulation of heavy precipitation and convection-related processes. The benefit of employing high-resolution convection-permitting simulations is mainly at sub-daily timescales (e.g. Prein et al., 2013; Fosser et al., 2014; Ban et al., 2014); however, daily precipitation is also positively affected, particularly in winter time (Fosser et al., 2014). Previous studies in the area applying high-resolution modelling agree with the beneficial impact of a finer resolution against coarser ones (e.g. Rostkier-Edelstein et al., 2014; Hochman et al., 2018; Kunin et al., 2019).
A decadal simulation and several event-based numerical weather prediction (NWP) runs covering the eastern Mediterranean are carried out. A process-understanding methodology is applied to improve our knowledge about how sub-synoptic-scale processes leading to severe convection are affected. The article is organized as follows. Section 2 provides an overview of the data and the methodology used. Then, in Sect. 3, the climatology of the region based on the high-resolution convection-permitting decadal simulation is presented, and the impact of changing conditions of the Dead Sea is examined across scales. Finally, conclusions are discussed in Sect. 4.
2.1 The COSMO-CLM model
In this investigation, the regional climate model (RCM) of the non-hydrostatic COSMO model, COSMO-CLM (CCLM), is used (version 5.0.1). It has been developed by the COnsortium for Small-scale MOdelling (COSMO) and the Climate Limited-area Modelling (CLM) community (Böhm et al., 2006). It uses a rotated geographical grid and a terrain-following vertical coordinate. The model domain covers the southern half of the Levant centred around the Dead Sea with a horizontal resolution of 7 and 2.8 km, 60 vertical levels, and a time step of 60 and 20 s, respectively. Using IFS (Integrated Forecasting System) analysis, which is the spectral weather model of ECMWF (European Centre for Medium-Range Weather Forecast), as driving data for the simulations, a double nesting procedure was employed. The coarsest nest at 0.0625∘ resolution (about 7 km) covers 250 grid points in x direction and 250 grid points in y direction. The size and location of the 7 km domain is considered large enough to take into consideration all possible synoptic situations relevant for the development of extreme phenomena in the study area, as well as the influence of the Mediterranean Sea. The finest nest at 0.025∘ (circa 2.8 km) covers 150×150 grid points, thus a total area of 22 500 grid points, and includes the study area (72 grid points in x direction and 92 in y direction) centred around the Dead Sea.
A Tiedtke (1989) mass-flux scheme is used for moist convection in the 7 km and a reduced Tiedtke mass-flux scheme for shallow convection. Contrary to the CCLM 7 km simulation, in which convection is parameterized, in the CCLM 2.8 km simulation, convection is explicitly resolved (Doms and Baldauf, 2015) so only the reduced Tiedtke mass-flux scheme is used for shallow convection. The model physics includes a cloud physics parameterization with five types of hydrometeors (water vapour, cloud water, precipitation water, cloud ice, precipitation ice), a radiative transfer scheme based on a delta-two-stream solution (Ritter and Geleyn, 1992) and a roughness-length-dependent surface flux formulation based on modified Businger relations (Businger et al., 1971).
Orography data from GLOBE (Global Land One-kilometre Base Elevation Project, GLOBE v1.0) of NOAA (National Oceanic and Atmospheric Administration) and soil data from HWSD (Harmonized Worlds Soil Database) TERRA are used. HWSD is a global harmonization of multiple regional soil datasets with a spatial resolution of 0.008∘ (FAO, 2009), resulting in nine different soil types in the model, namely “ice and glacier”, “rock/lithosols”, “sand”, “sandy loam”, “loam”, “loamy clay”, “clay”, “histosols” and “water”.
Multiple model runs have been performed. A 7 km run from 2003 to 2013 with daily output is used as nesting for two 2.8 km runs over the same time span. The Dead Sea is dried out and replaced with soil types from the surrounding area in one of them (SEN), and the other one is used as a reference (CLIM). For the detailed investigation of convective events on 14 and 19 November 2011, sub-seasonal simulations have been performed with the same settings as the decadal simulation but with additional hourly output.
2.2 Methodology
A decadal simulation covering the 2003–2013 time period was carried out with the convection-permitting 2.8 km COSMO-CLM model. Lateral boundary conditions and initial conditions are derived from the European Centre for Medium-Range Weather Forecasts (ECMWF) data. The COSMO-CLM 7 km is used as a nesting step in between the forcing data and the 2.8 km run. This reference or Dead Sea simulation will be hereafter referred to as the REFCLIM simulation. Parallel to this, an idealized sensitivity experiment (hereafter SENCLIM or bare soil simulation) is carried out in which the Dead Sea conditions are set to bare soil on the −405 m level (depth of the Dead Sea in the GLOBE external dataset; Hastings et al., 1999). After examination of the results, the first year of simulations is considered the spin-up time; thus, our analysis covers the 2004–2013 period.
The precipitation field has been validated using the E-OBS dataset (resolution of 0.1∘ and available for the period 1980–2011; Haylock et al., 2008) and APHRODITE's (Asian Precipitation – Highly Resolved Observational Data Integration Towards Evaluation; Yatagai et al., 2008, 2012) daily gridded precipitation (resolution of 0.25∘ and available for 1980–2007). The APHRODITE data show generalized lower precipitation values than E-OBS but still higher than our simulation, particularly close to the northern Mediterranean shoreline and over coastal flat terrain, whereas the best agreement is in areas dominated by complex terrain. Despite these biases, the comparison of the temporal areal mean of the model simulations at 7 and 2.8 km and the APHRODITE dataset demonstrates that, in general, the model captures quite well the precipitation events. An improvement is seen at the finer resolution.
Regional dry and wet periods are identified and quantified in the simulations by means of the Effective Drought Index (EDI; Byun and Wilhite, 1999; Byun and Kim, 2010). The EDI is an intensive measure that considers daily water accumulations with a weighting function for normalized time passage accumulated precipitation. The values are accumulated at different timescales and converted to standard deviations with respect to the average values. Here we use an accumulation period of 365 d. EDI dry and wet periods are categorized as follows. Moderate dry periods are −1.5< EDI <−1, severe dry periods are −2< EDI <−1.5, and extreme dry periods are EDI <−2. Normal periods are revealed by −1< EDI <1 values.

Figure 1(a) Topography (m a.s.l.), simulation domains (dashed lines, CCLM7km and CCLM2.8km) and study area (bold line). (b) Model soil types (colour scale), topography (black isolines) and study area (bold black line) including the four subdomains being examined, A1–4 (area 1–4).
Based on daily mean values, precipitation and evapotranspiration distributions and possible tendencies in the 10-year period are assessed. To further assess the most affected areas in our study area, these are divided into four subdomains surrounding the Dead Sea that try to respect the orographic pattern in the area (Fig. 3). Annual cycles are thus separately investigated to take into consideration the relevant differences in orography, soil types and distance to the coast among others (Fig. 1), which are known to have a significant impact on the precipitation distribution in the region (e.g. Belachsen, 2017; Houze, 2012). Differences in the annual cycle and temporal evolution of precipitation and evapotranspiration between the REFCLIM and SENCLIM are discussed. Also, differences in the near-surface and planetary boundary layer (PBL) conditions and geopotential height patterns are examined. Geographical patterns of mean evapotranspiration and precipitation and differences with respect to the reference or Dead Sea simulation are assessed. Probability distribution functions (PDFs) and the structure, amplitude and location (SAL; Wernli et al., 2008) analysis methodologies are used to illustrate differences in the mean and extreme precipitation between the reference and the sensitivity experiments. The SAL method is an object-based rainfall verification method. This index provides a quality measure for the verification of quantitative precipitation forecasts considering three relevant aspects of precipitation patterns: the structure (S), the amplitude (A) and the location (L). The A component measures the relative deviation of the domain-averaged rainfall; positive values indicate an overestimation of total precipitation and negative values an underestimation. The component L measures the distance of the centre of mass of precipitation from the modelled one and the average distance of each object from the centre of mass. The component S is constructed in such a way that positive values occur if precipitation objects are too large and/or too flat and negative values if the objects are too small and/or too peaked, quantifying the physical distance between the centres of mass of the two rainfall fields being compared. Perfect agreement between prediction and reference are characterized by zero values for all components of SAL. Values for the amplitude and structure are in the range (−2, 2) for which ±0.66 represents a factor of 2 error. The location component ranges from 0 to 2, where larger values indicate a greater separation between the centres of mass of the two rainfall fields. This is done by selecting a threshold value of one-fifteenth of the maximum rainfall accumulation in the domain (following Wernli et al., 2008). The structure and location components are thus independent of the total rainfall in the domain.
Differences in the temporal evolution of precipitation between the REFCLIM and SENCLIM are identified. In Table 1, those events in which an area-mean (study area, Fig. 1) difference between both simulations higher than ±0.1 mm d−1 exists are selected as potential heavy precipitation events and classified according to their synoptic-scale environment and atmospheric stability conditions (Table 1).
Table 1Classification of heavy precipitation cases in the decadal simulation covering the 2004–2013 period. The areal-mean (study area; Fig. 1) difference (PRECdiffmn) and maximum grid precipitation in the reference (REFPMX) and sensitivity (SENPMX) realizations, the precipitation relative difference (in %), the synoptic situation, and the stability conditions illustrated by maximum grid point CAPE (CAPEmx) and minimum grid point KO index (KOmn) are summarized. Additionally, the nature of the precipitation, localized (L) or widespread (W), and the main sub-area affected (following division in Fig. 1; A1, A2, A3, A4) are listed.
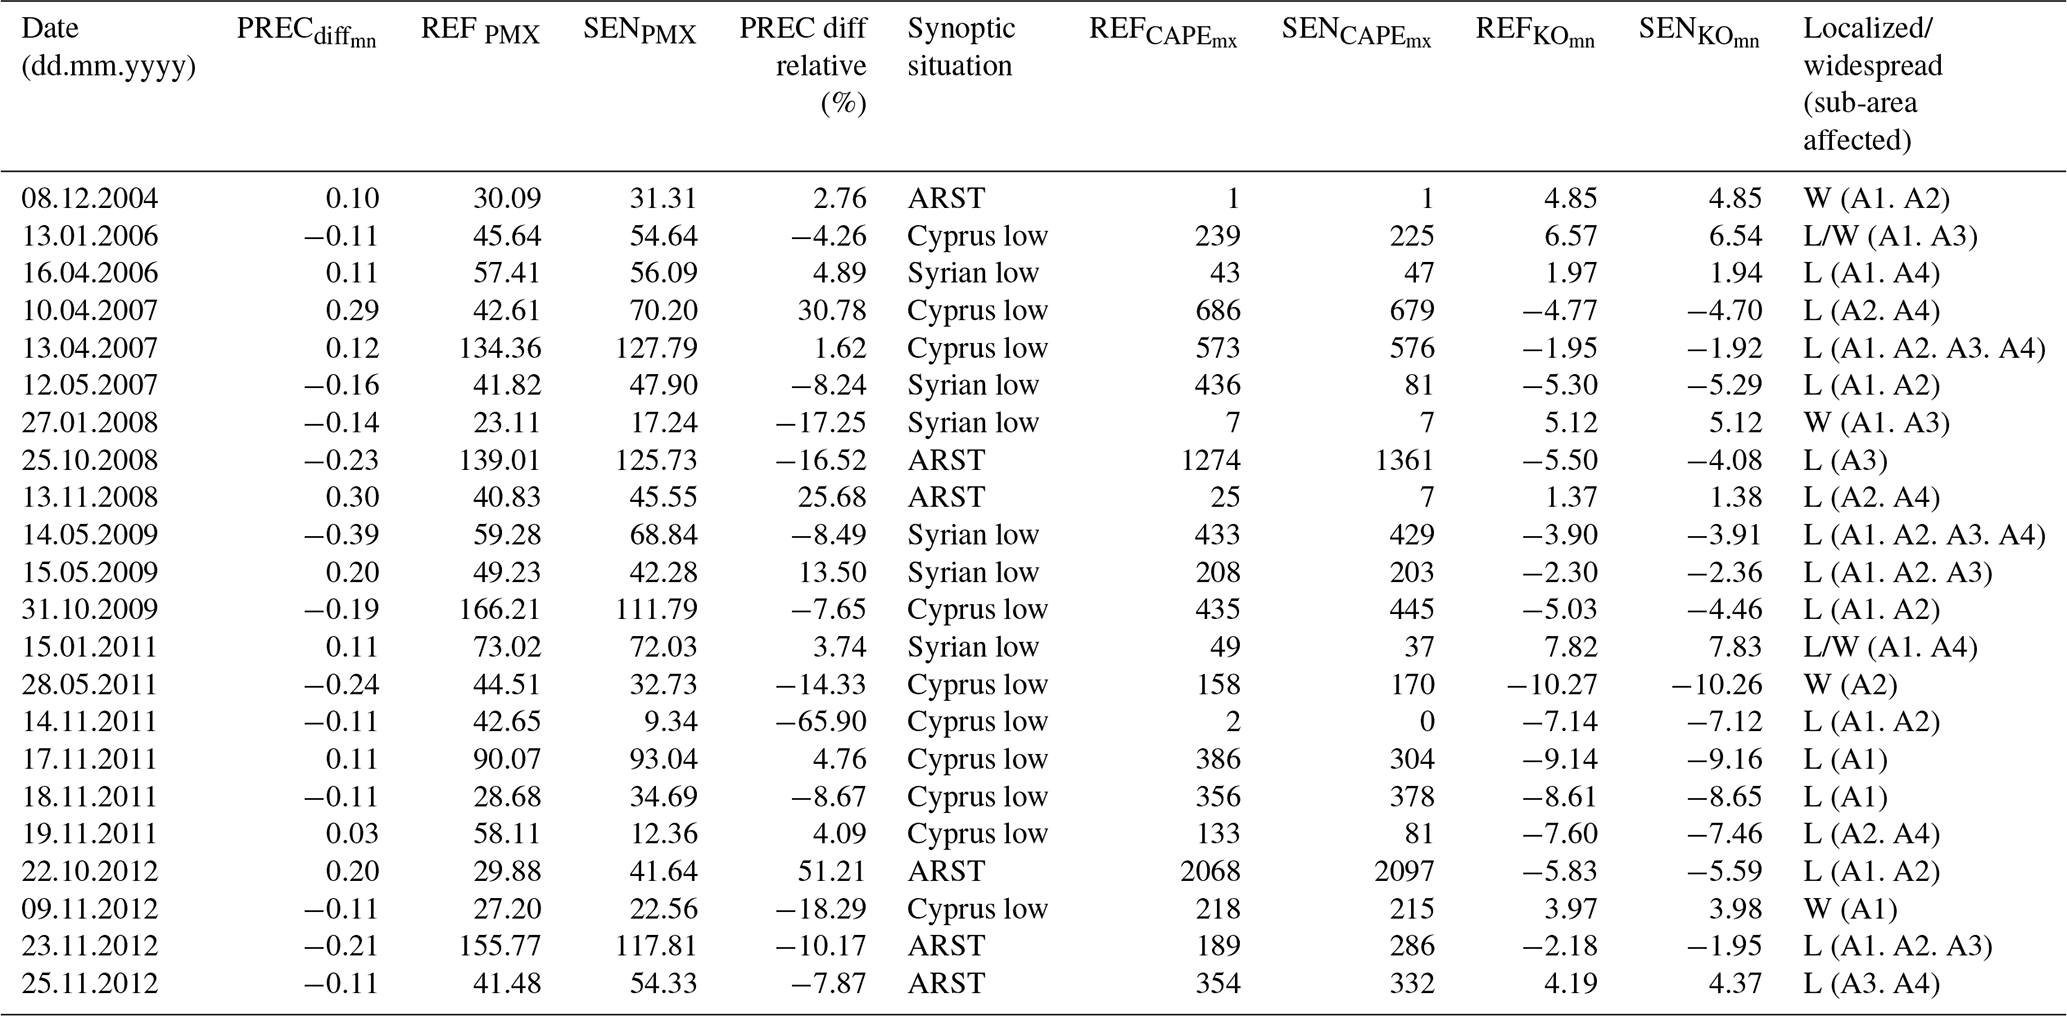
Although Dayan and Morin (2006) discuss that, in general, large-scale vertical motions do not provide the necessary lifting sufficient to initiate convection, it was demonstrated by Dayan and Sharon (1980) that a relationship exists between the synoptic-scale weather systems and deep moist convection; those systems are responsible for the moisturizing and destabilization of the atmosphere prior to convective initiation. They pointed out that indices of instability proved to be the most efficient determinants of the environment characterizing each rainfall type in the region. Thus, two indicators of the atmospheric degree of stability/instability, namely the convective available potential energy (CAPE; Moncrieff and Miller, 1976) and the KO index (Andersson et al., 1989), are examined in this study. CAPE is a widely known index indicating the degree of conditional instability, whereas the KO index, which is estimated based on the equivalent potential temperature at 500, 700, 850 and 1000 hPa (following the recommendations of Bolton, 1980), describes the potential of deep convection to occur as a consequence of large-scale forcing (Andersson et al., 1989; Khodayar et al., 2013). Generally, regions with a KO index less than 2 K and large-scale lifting are identified as favourable for deep convection. Parcel theory (50 hPa mixed layer parcel) and virtual temperature correction (Doswell and Rasmussen, 1994) are applied to these calculations.
Based on the above criteria, a separation was made between events with widespread rainfall and those more localized. Among the latter, we selected two events to illustrate the local impacts on the boundary layer conducive to deep moist convection. In particular, differences in the amount, structure and location of precipitation are assessed by examining the spatial patterns and the SAL verification method. The two selected events for detailed analysis in this study are those showing the larger SAL deviations. Those two cases occur close in time, but they are not the same event. No differences in the soil and atmospheric conditions have been found in the period between the events when the REF and SEN simulations are compared. Even though a more detailed analysis is provided for the two selected cases, all convective events listed in Table 1 have been examined to assess the main impacts on the mechanisms leading to convection. High-resolution simulations with the NWP COSMO 2.8 km model are performed with an hourly output temporal resolution and covering a 3 d period (including 48 h prior to the day of the event from 00:00 UTC) to capture atmospheric pre-conditions conducive to deep moist convection. For this, a reference simulation, REFNWP or Dead Sea simulation, and a sensitivity experiment, SENNWP or bare soil simulation, are carried out for each event.
We have to point out that the external datasets commonly employed to describe relevant features of the Dead Sea region, such as the depth, shape and orography of the Dead Sea, as well as Dead Sea water characteristics at the reference or Dead Sea run, do not accurately represent the reality. In the same direction, biases in relation to different variables such as the precipitation field and evaporation over the Dead Sea have to be considered.
3.1 Climatology of the Dead Sea region
3.1.1 Annual cycle
To assess the climatology of the study region (Fig. 1) the annual evaporation and precipitation cycles based on daily means of the respective quantities are investigated (Fig. 2). Additionally, we examine the evolution of specific humidity (Qv2 m) and temperature at 2 m (T2 m), as well as total column integrated water vapour (IWV) and equivalent low-boundary-layer (<950 hPa) potential temperature (θe<950 hPa). Possible changes in the atmospheric stability conditions are evaluated by examination of CAPE and KO index. In Fig. 2, all grid points over the study region (Fig. 1) and the time period 2004–2013 are considered. Differences between the REFCLIM and the SENCLIM simulations are also discussed.
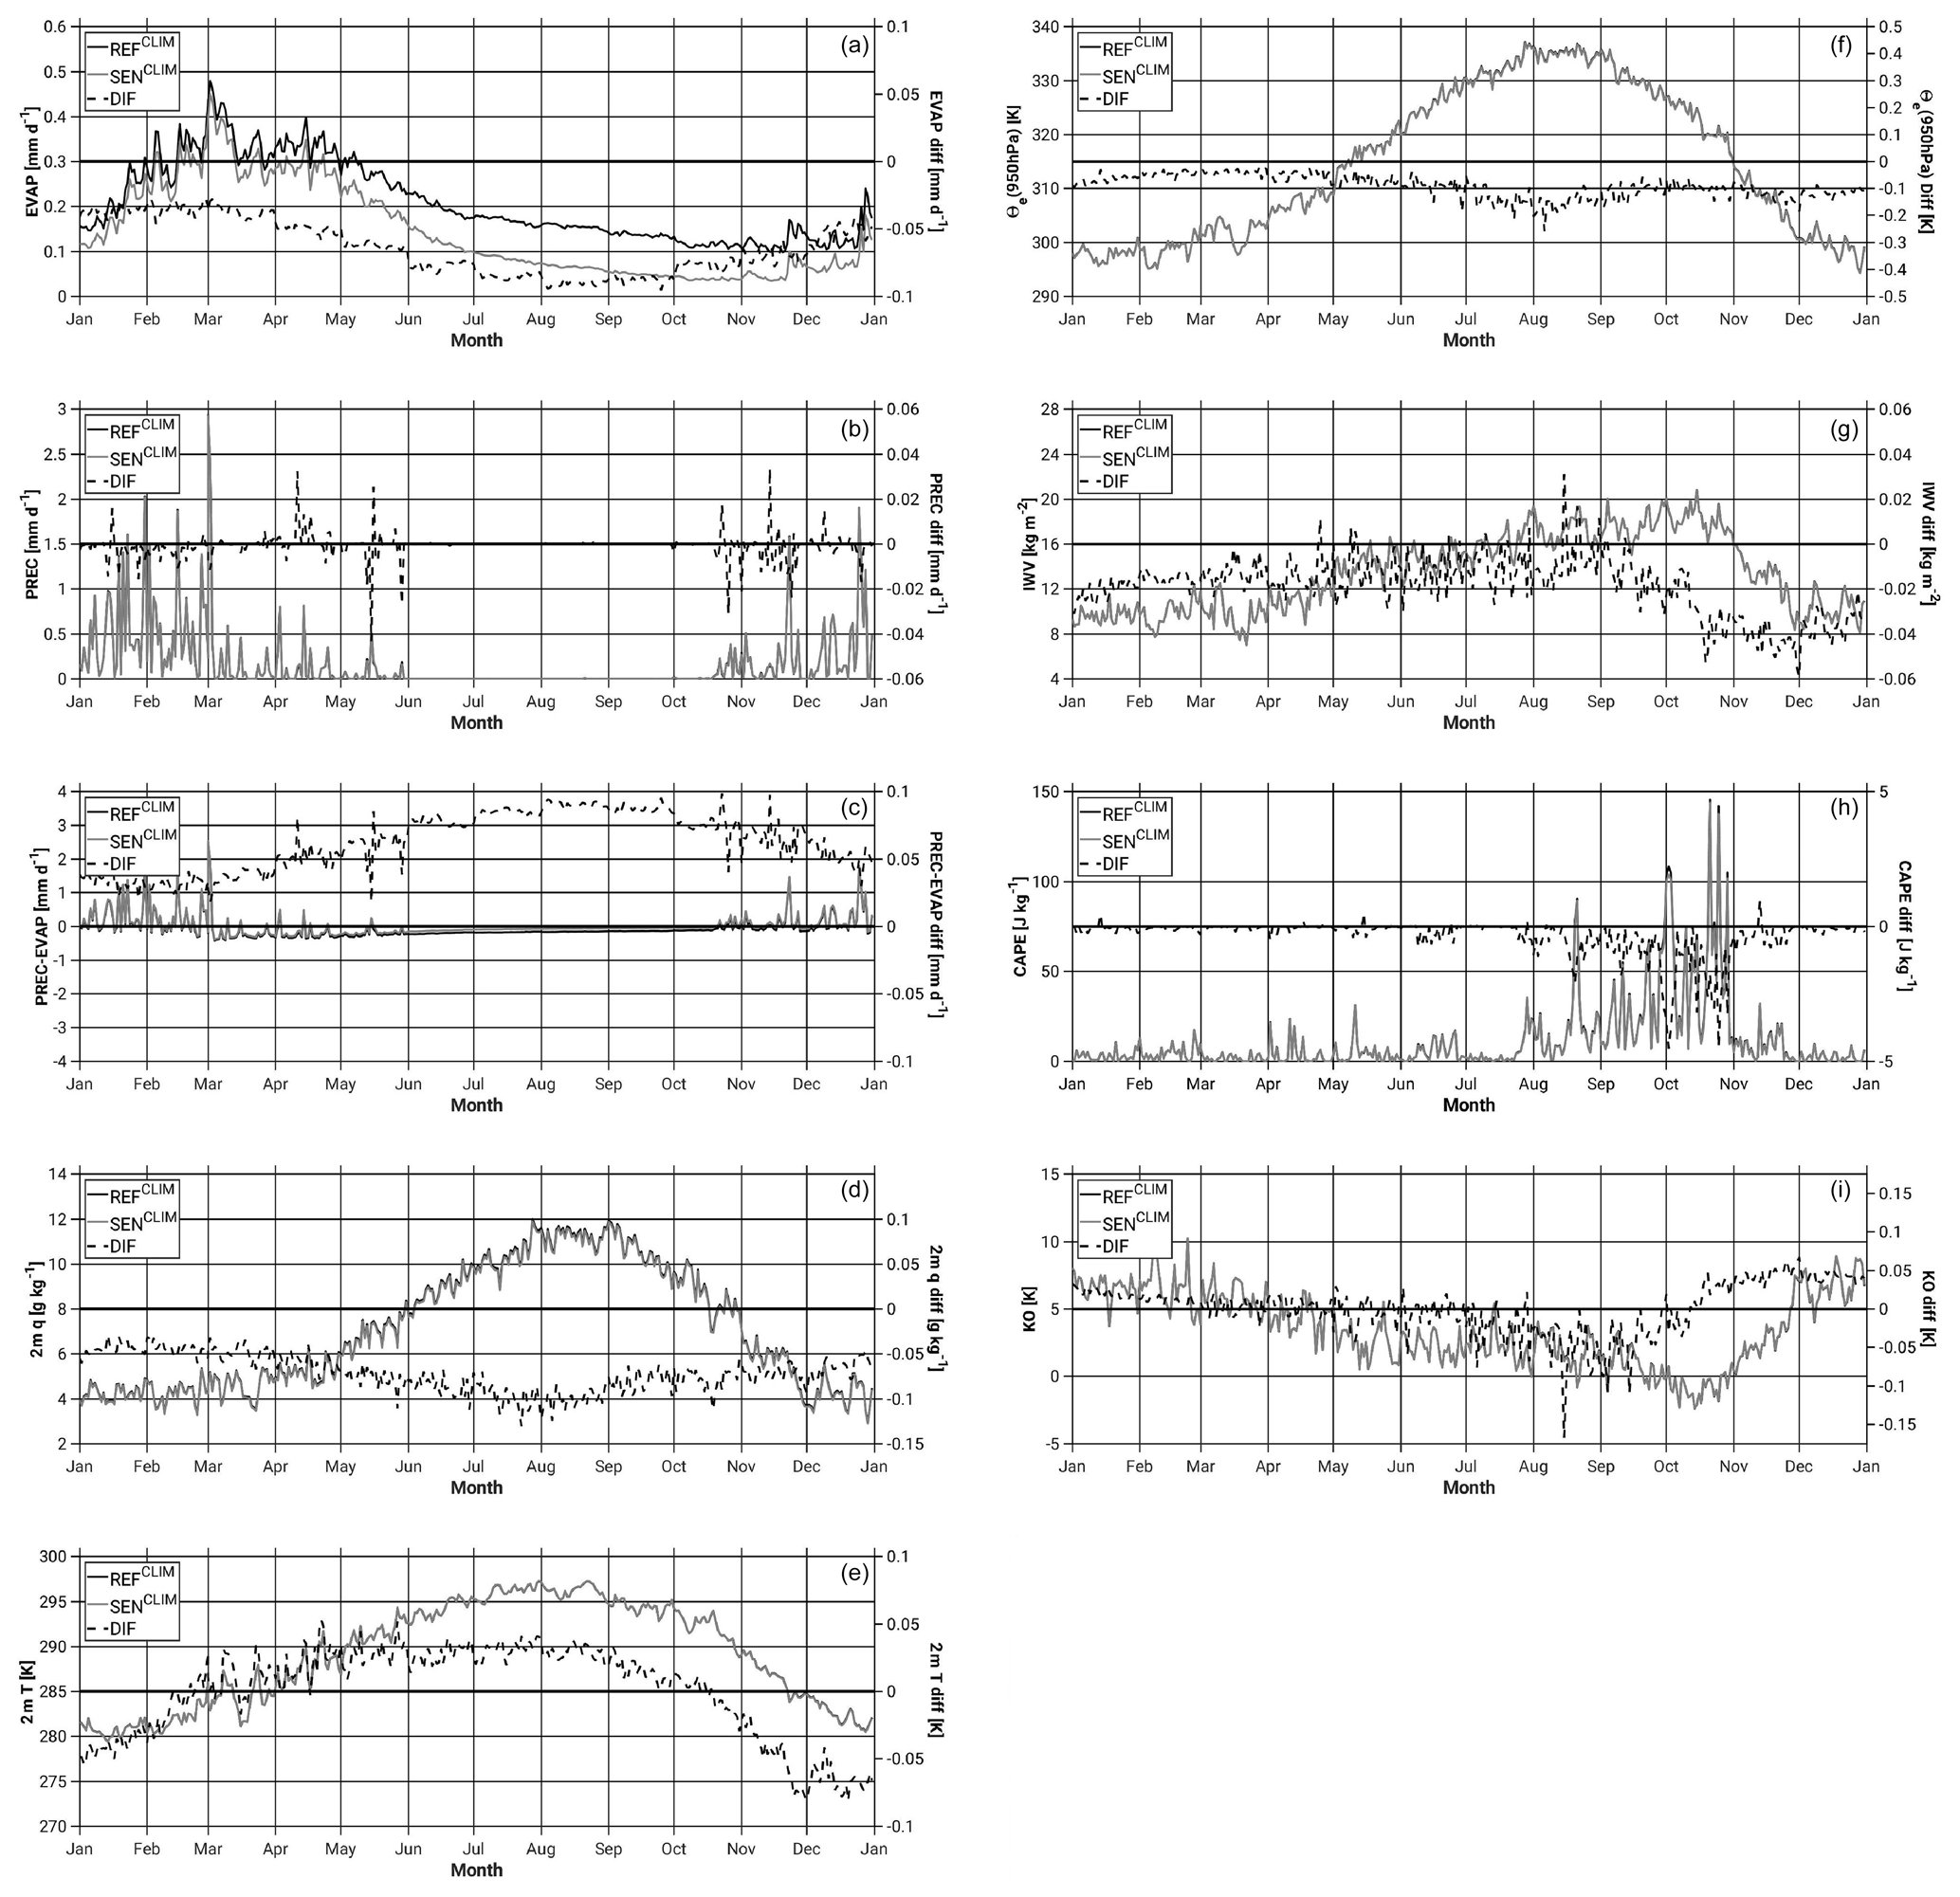
Figure 2Annual cycle of the area-averaged daily accumulation of and differences in (black dashed line; SEN and REF) (a) evaporation, (b) precipitation, and (c) precipitation minus evaporation; (d) specific humidity and (e) temperature at 2 m; (f) θe below 950 hPa; (g) IWV; (h) CAPE; and (i) KO index from the REFCLIM (full black line) and the SENCLIM (full grey line) simulations. All grid points in the study area (Fig. 1) and the period 2004 to 2013 are considered.

Figure 3Annual cycle of the areal daily averages of and differences in (black dashed lines; SEN and REF) (a) precipitation for areas A1, A2, A3 and A4 (see Fig. 1b), (b) evaporation, specific humidity and temperature at 2 m, and CAPE for areas A1 and A2 from the REFCLIM (full black line) and the SENCLIM (full grey line) simulations. Only land points in the study area (Fig. 1) for evaporation and all grid points for the rest of the variables and the 2004 to 2013 period are considered.
The annual cycle of evaporation shows minimum values in the autumn season (around October, ∼0.1 mm d−1) and maximum evaporation in spring (around March, ∼0.4 mm d−1). The dependency of the precipitation cycle is clear with maximum values around March and rain occurring between October and May (Fig. 2a), which is in agreement with observations in the area (Dayan and Sharon, 1980). The difference between the evaporation in the REFCLIM and the SENCLIM simulations indicates a mean decrease in the order of 0.02 mm d−1 (February) to ∼0.1 mm d−1 (August) in the absence of Dead Sea water (SENCLIM). The largest difference is in the dry period (May to October) when water availability is less dependent on precipitation, and evaporation is higher over the Dead Sea in contrast to the minimum values over land (Metzger et al., 2018). In general, there is a decrease of about 0.5 % in mean precipitation in the SENCLIM simulation. In contrast to the differences in evaporation, precipitation differences between the reference or Dead Sea simulation and the sensitivity or bare soil simulation occur in both directions during the rain period from October to May. Examining the total number over the whole decadal simulation, it is seen that the number of dry or wet days (>0.1 mm d−1) or heavy precipitation events is not largely affected in the bare soil simulation. In general, the number of dry days increases (fewer wet days) in the SENCLIM simulation, whereas the number of high intensity events show almost no variation. For each simulation, the difference between precipitation and evaporation is negative mainly in spring and summer, contributing to the dryness in the region. Furthermore, the difference between the REFCLIM and SENCLIM simulations indicates that PREC-EVAP (precipitation minus evaporation) is higher in the SENCLIM simulation probably in relation to the reduced evaporation over the dry sea area and the general decrease in the precipitation amount in the region.
In addition to the reduced evaporation and precipitation (about 0.5 %) in the whole domain in the SENCLIM simulation, a drier and warmer lower troposphere is identified (Fig. 2b), which is in agreement with the observational assessment by Metzger et al. (2018) of the cooling effect of evaporation on air temperature in the region. The annual cycle of IWV and θe<950 hPa in Fig. 2c shows that the impact of the resulting evaporation of the dry Dead Sea is less pronounced when a deeper atmospheric layer is considered. Indeed, the θe<950 hPa evolution is evidence that the warming effect due to the decreased evaporation in the SENCLIM simulation is restricted to the near surface.
In Fig. 2d, the annual cycle of areal mean CAPE displays larger values in the period from August to November, this being the period more favourable for convection. Negative CAPE differences between the REFCLIM and the SENCLIM simulations are presumably in relation to the identified distinct lower-atmospheric conditions, these being more favourable, and consequently CAPE values being higher in the REFCLIM simulation. In the same period, the KO index indicates a potentially more unstable atmosphere, i.e. prone to deep convection because of large-scale forcing, and larger differences between simulations.
In agreement with the well-known precipitation distribution in the region, most of the events occur in A1 (north-west) and A2 (north-east). Also in these subdomains, larger differences between the REFCLIM and SENCLIM simulations are identified, pointing out the relevance of Dead Sea evaporation in the pre-convective environment for rainfall episodes over the study area (Fig. 3a). Considering only land grid points, almost no difference between simulations is found in the evaporation annual cycle of A1 and A2 (Fig. 3b), suggesting the distinct amount of moisture advected towards A1 and A2 from the Dead Sea in REFCLIM and SENCLIM is responsible for the differences in the boundary layer conditions conducive to convection. Also in these subdomains, the dryer and warmer lower boundary layer and the reduced instability in the SENCLIM are recognized.

Figure 4Temporal evolution of the area-averaged monthly accumulated values of (a) evaporation, (b) precipitation and (c) Effective Drought Index (EDI) from the REFCLIM (full black line) and the SENCLIM (full grey line) simulations and differences depicted with black dashed lines. The light grey band in (c) indicates the common soil state (−1< EDI <+1). All grid points in the study area (Fig. 1) and the period 2004 to 2013 are considered.
3.1.2 Inter-annual variability
In Fig. 4, we discuss the inter-annual variability (based on monthly and daily areal mean values) of evaporation, precipitation and drought evolution.
The reduced evaporation in the annual cycle of the SENCLIM simulation for the whole investigation domain resulting from the drying of the Dead Sea and affected evaporation remains from year to year (Fig. 4a). Larger differences between the simulations occur in the May to November months in agreement with the annual cycle in Fig. 2a. This, and the time period of the maximum and minimum, has been constant over the years. A tendency towards lower evaporation in each simulation and higher differences between both at the end of the period are identified. An inter-annual fluctuation is observed in both REFCLIM and SENCLIM simulations. The yearly rate of evaporation shows, for example, in REFCLIM maximum values of about 7 mm in 2011 and around 17 mm in 2012. This is in agreement with the positive correlation expected between precipitation and evaporation; a trend towards decreased precipitation and a correspondence between drier years such as the 2011–2012 period and lower annual evaporation are seen in Fig. 4b. Year to year EDI calculations in Fig. 4c help us identify the regional extreme dry and wet periods. The EDI range of variation from about −1 to 2 for the whole period of simulation indicates that the dry condition is the common environment in the area, while the wet periods, EDI up to 6, could be identified as extreme wet periods (relative to the area), in this case in the form of heavy precipitation events. Maximum positive EDI values are in the first months of the year in agreement with the precipitation annual cycle in Fig. 2, whereas minimal EDI values occur in summer and autumn indicative of the dry conditions in these periods. Differences in the EDI calculations from both simulations reveal distinct precipitation evolutions and denote timing differences in the occurrence of the precipitation events. When the regional climate evolution is examined in combination with the impact on the number of heavy precipitation events (Table 1), the impact is stronger in the dry period of 2011 (Fig. 4a). About six events show relevant differences in this period in contrast to the average three episodes per year.

Figure 5Spatial distribution of (a, b) evaporation in the REFCLIM simulation (a) and the difference between the SENCLIM and the REFCLIM simulations (b) and (c, d) precipitation in the REFCLIM simulation (c) and the difference between the SENCLIM and the REFCLIM simulations (d). The period 2004 to 2013 is considered.
3.1.3 Spatial distribution
The geographical patterns of evaporation and precipitation are presented in Fig. 5. Over the Dead Sea, the simulated average annual evaporation for the period under consideration is in the order of 1500–1800 mm yr−1, in contrast to the values in the deserts to the east and south where the evaporation is less than 20 mm yr−1. Observed annual evaporation of this lake is known to be about 1500 mm and to vary with the salinity at the surface of the lake and freshening by the water inflow (Dayan and Morin, 2006; Hamdani et al., 2018). Over land, higher evaporation is seen over the Judean Mountains and the Jordanian Highlands. A high correlation with the orography and soil types is seen (Fig. 1). Evaporation is probably correlated with rainfall, which in turn is correlated with topography. Particularly in the Jordanian Highlands where maximum evaporation is around 200 mm yr−1, the complex topography coincides with sandy loam soils, whereas most of the soil in study region is defined as loamy clay or clay (Fig. 1). The evaporative difference field between simulations in Fig. 5a shows a highly inhomogeneous patchiness which is not evidence of any relationship with orography or soil type but rather of changes in the precipitation pattern in the SENCLIM simulation, as seen in Fig. 5b.
In agreement with the temporal series of areal mean precipitation in Fig. 3, there is higher annual precipitation in the north-west and north-east with respect to the southern regions. Topographic features exert a large impact on precipitation distribution with maxima of about 175 to 300 mm yr−1 over the Judean Mountains and the Jordanian Highlands. The largest precipitation difference between the REFCLIM and the SENCLIM simulations is identified to the northern end of the Dead Sea valley rather than directly over the Dead Sea area, which shows the importance of advected moisture from the Dead Sea evaporative flux upslope and along the Dead Sea valley, as well as the indirect effects of a different spatial distribution of low-tropospheric water vapour in the occurrence of precipitating convection.
Regarding the impact on the large-scale conditions, differences in the spatial pattern and strength of the 500 hPa geopotential height field are identified over the Dead Sea (not shown). In the 10-year mean, differences of up to 0.002 gpdm higher in SEN than in REF are observed. Around the Dead Sea area, the differences are smaller and more irregular. Generally, the differences are higher in the east of the Dead Sea than in the west.
3.1.4 Precipitation probability distribution function
While the probability for lower intensity precipitation is very similar in the REFCLIM and the SENCLIM simulations, differences are recognized in the higher precipitation intensities from about 150 mm d−1 (Fig. 6a). Particularly above 180 mm d−1, extreme precipitation values occur less frequent in the SENCLIM simulation where a drier, warmer and more stable atmosphere is identified (Fig. 2).
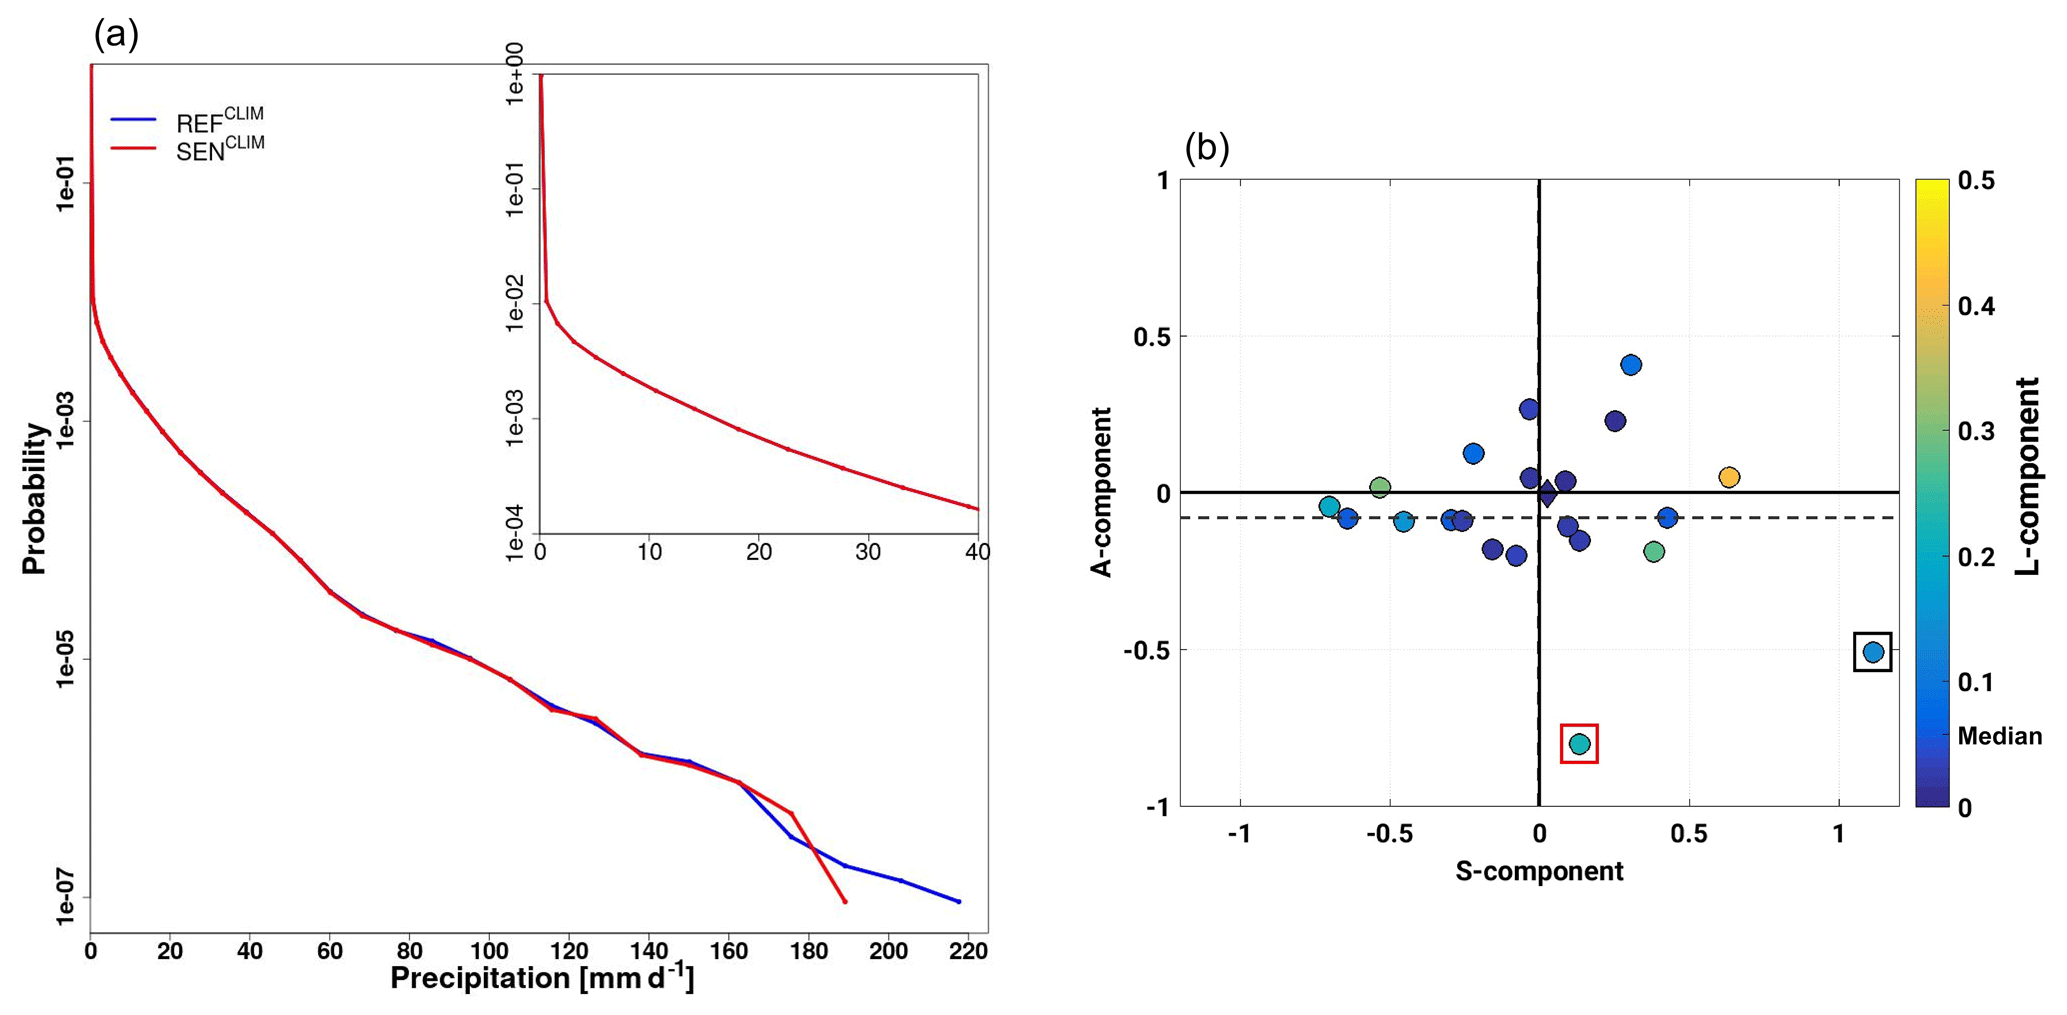
Figure 6(a) Probability density function of daily precipitation intensities. All grid points in the investigation domain (Fig. 1) and the period 2004 to 2013 are considered. (b) SAL diagram between REFCLIM and SENCLIM simulations. Every circle corresponds to a simulated heavy precipitation event (listed in Table 1). The diamond (close to zero–zero) illustrates the mean of all events. The A component is amplitude, the S component is structure, and the L component is location. The inner colour indicates the L component. Boxes point out the two events examined in this study, CASE1 and CASE2 (see Sect. 3.2).
3.1.5 SAL
The use of the SAL method in this study differs from the approach frequently presented in the literature since it is here not our purpose to examine differences between the simulated field and observations (adequate observations for this comparison are not available in the area) but to compare changes regarding the structure, amount and location of the precipitation field between our reference or Dead Sea simulation and sensitivity or bare soil simulation experiments. Figure 6b shows that when the mean precipitation over the whole simulation period is considered, all three SAL components are close to zero, meaning that very small differences are found. However, when single precipitation events in the REFCLIM simulation are compared with the same period in the SENCLIM simulation, larger differences regarding structure, amount and location of rainfall events are found. For further examination of this issue, two exemplary heavy precipitation events (indicated by boxes in Fig. 6b) are analysed in detail. In both cases, a negative A component is recognized; that is, less precipitation falls in the SENCLIM simulation. The S component is also evidence of the change in the structure of the convective cells. The L component is low, meaning that the convective location does not change significantly in the SENCLIM simulation in contrast to the intensity and structure of the cells.
3.2 Sensitivity of atmospheric conditions to the Dead Sea drying: episodic investigation
Among those events exhibiting differences in the precipitation field between both simulations (Table 1 and Fig. 6b), two situations occurring in the time period of 14 to 19 November 2011 are investigated in the following.
In this term, the synoptic situation is characterized by a Cyprus low and its frontal system located over the Dead Sea at about 00:00 UTC on 15 November 2011 and at 12:00 UTC on 18 November 2011. The low-pressure system and its frontal-system-induced strong south-westerly to westerly winds have mean wind velocities of up to 15 m s−1.
In the first situation (hereafter CASE1), in association with the western movement of the cold front, a convective system develops over the Jordanian Highlands with precipitation starting at about 21:00 UTC on 14 November 2011. This convective system is of high interest because of the large difference in its development between the REF14.11 and the SEN14.11 simulations.
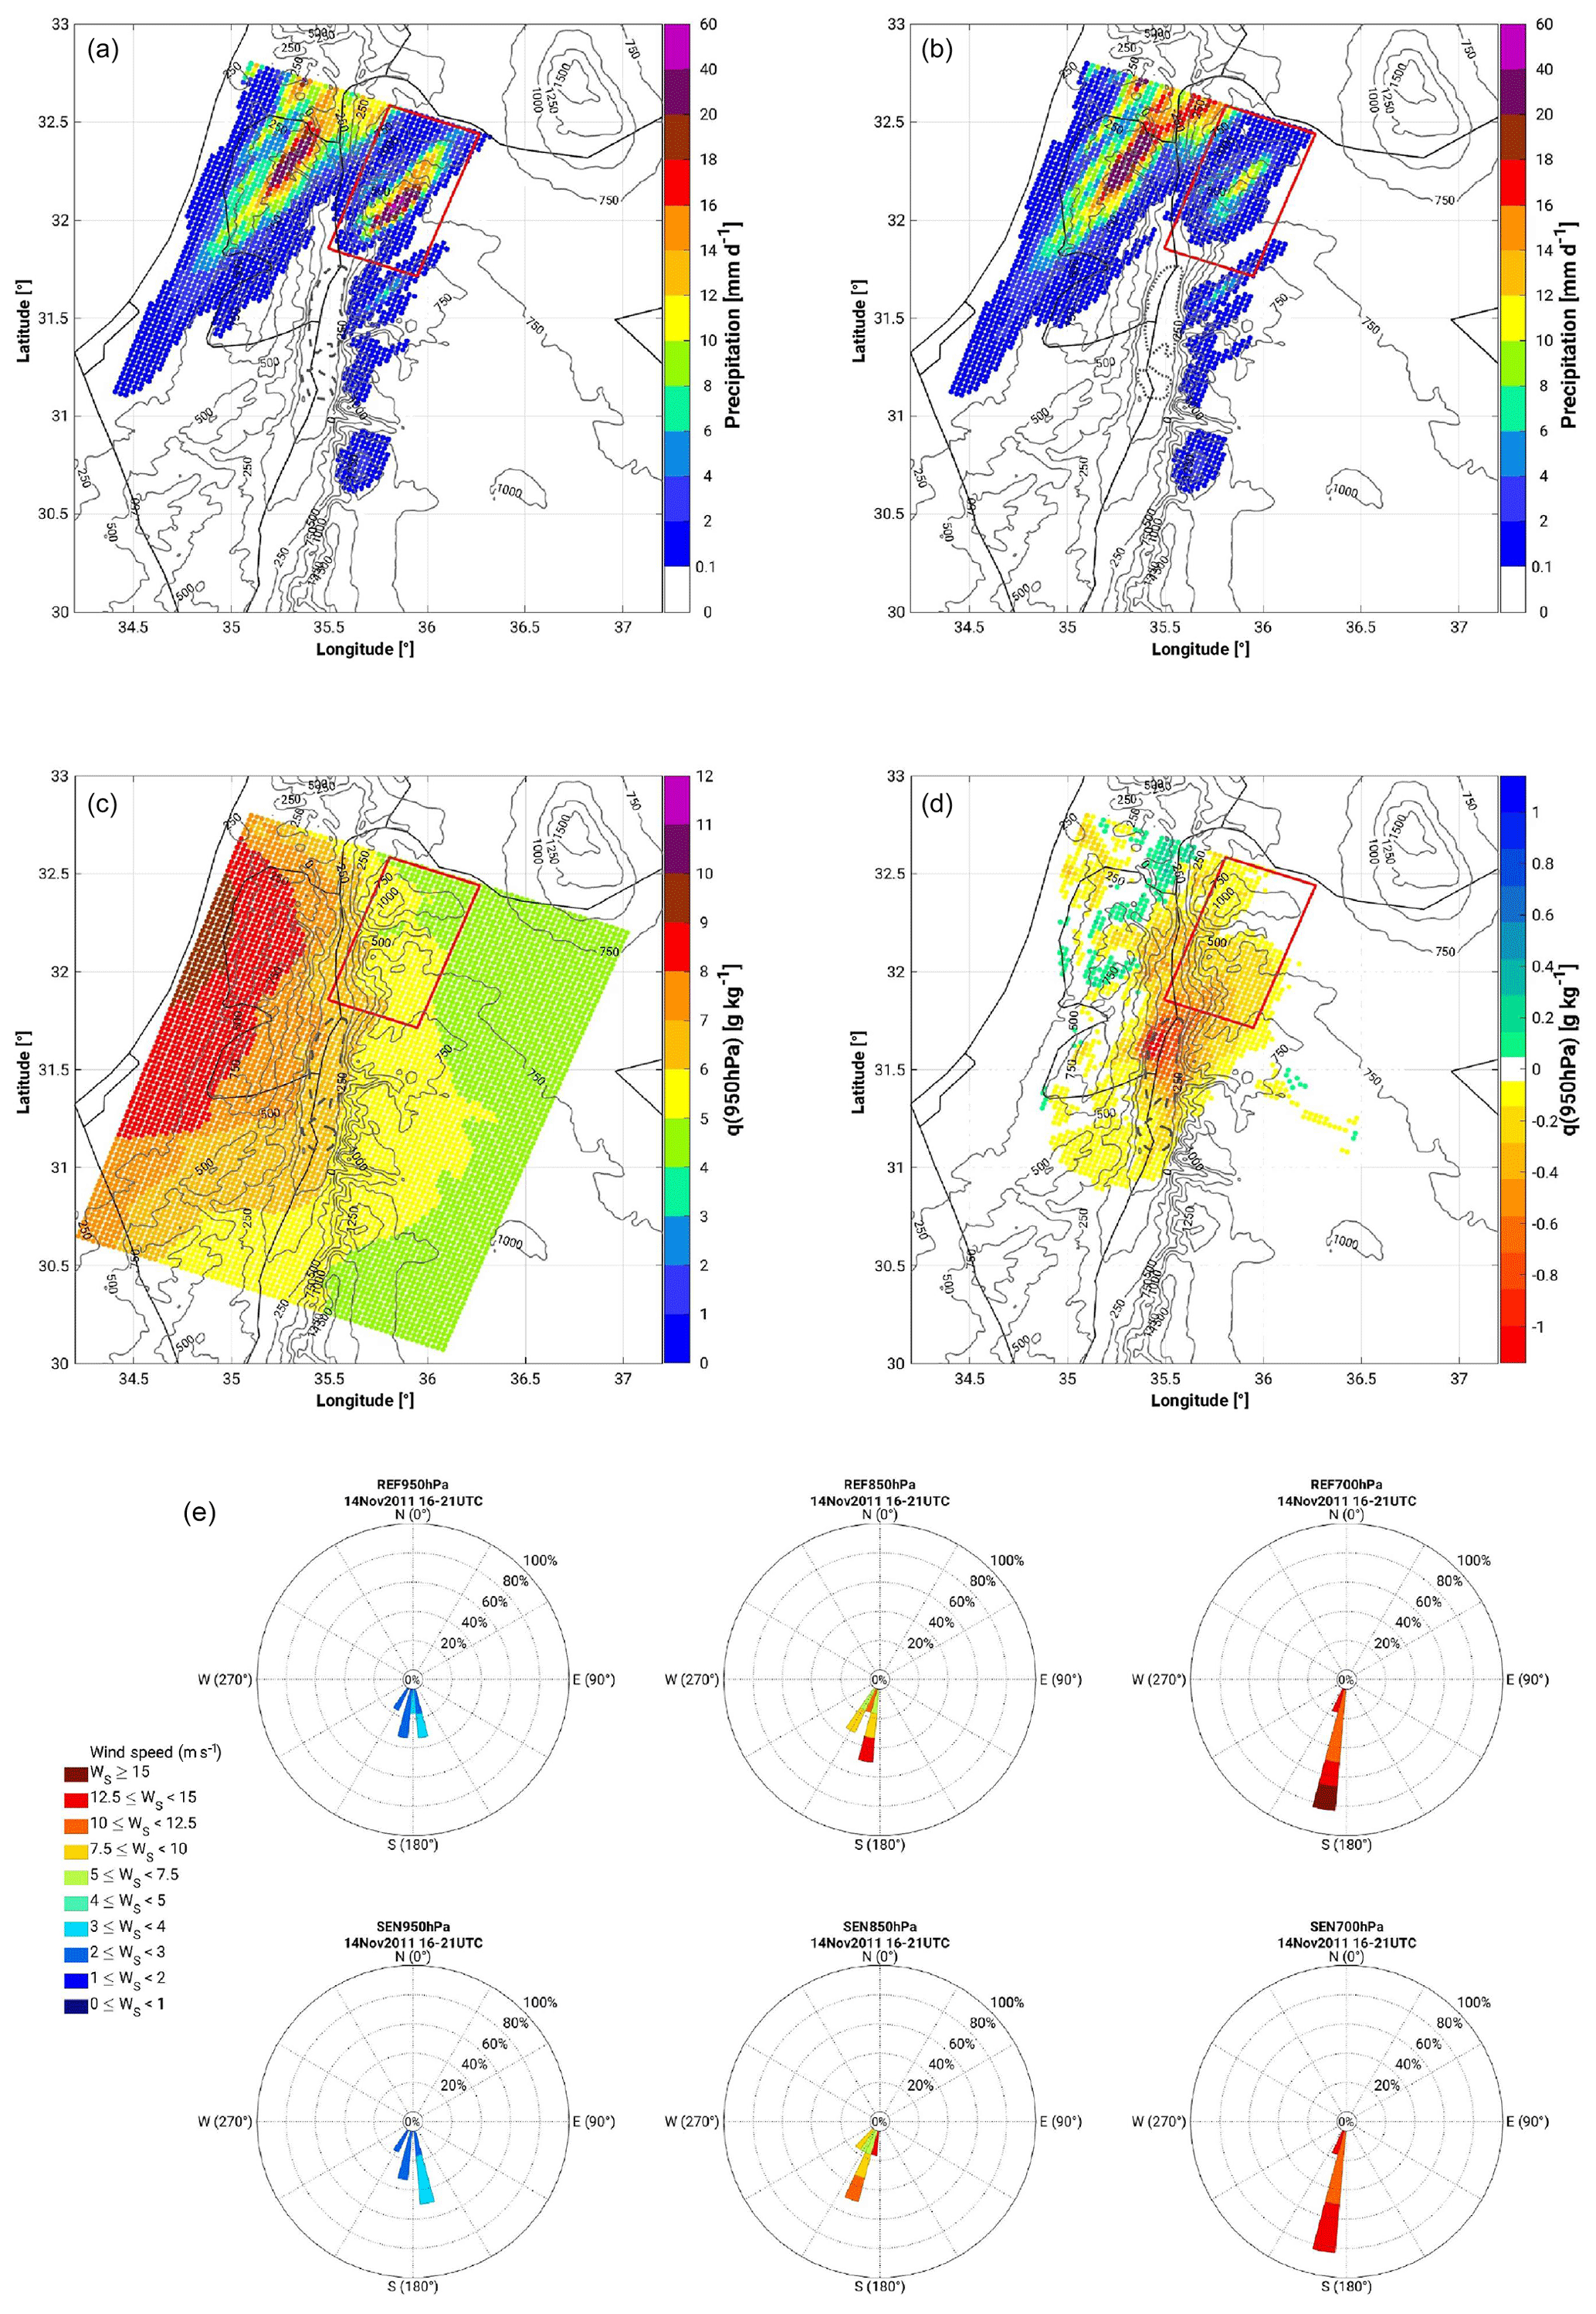
Figure 7Spatial distribution of (a, b) 24 h accumulated precipitation from 14 November 09:00 UTC to 15 November 08:00 UTC from the REF14.11 simulation (a) and the SEN14.11 simulation (b). (c, d) Specific humidity below 950 hPa from the REF14.11 simulation (c) and the difference between the REF14.11 and SEN14.11 simulations (d) as a mean for the 6 h period prior to the initiation of convection in the target area (14 November 16:00 to 21:00 UTC). (e) Wind conditions at 700, 850 and 950 hPa (no relevant differences with respect to the 10 m field) for the same time period. Wind roses are centred at approximately 32.07∘ N, 35.82∘ E in our target area.
In Fig. 7a, the 24 h accumulated precipitation from 14 November 09:00 to 15 November 08:00 UTC in the investigation area is shown for the REF14.11 and the SEN14.11 simulations. Two precipitation areas are seen in the north-western and north-eastern areas of the Dead Sea. A larger difference between models is in the north-eastern region (24 h accumulated precipitation greater than 100 mm d−1 in REF14.11, while it is less than 50 mm d−1 in SEN14.11), which is the focus of our analysis.
The REF14.11 simulation shows that in the 6 h period prior to the initiation of convection, the pre-convective atmosphere and more specifically the lower boundary layer exhibit a moist (IWV ∼24–30 mm; qvPBLmax, maximum specific humidity below 950 hPa, ∼7–10 g kg−1) and unstable (CAPE ∼1100 J kg−1; KO index K; not shown) air mass on the western side of the investigation area, particularly close to the western Mediterranean coast, and drier (IWV ∼8–16; qvPBLmax ∼4–6 g kg−1) and more stable conditions (CAPE <200 J kg−1; KO index ∼0–2 K) on the eastern side of the domain (Fig. 7b). A maximum difference of about 5 g kg−1 from west to east is established in the lower boundary layer.
The main differences between both simulations are over the Dead Sea (IWV difference up to 2 mm and qvPBL, specific humidity below 950 hPa, up to 1.5 g kg−1) and north and north-east of it, but there are almost similar conditions everywhere else. In our target area (subdomain of investigation where the convection episode takes place; red box in Fig. 7) north-east of the Dead Sea, a drier and a more stable atmosphere is identified in the SEN14.11 simulation.
The evolution of the wind circulation systems in the area is similar in both simulations (Fig. 7c). The 700, 850 and 950 hPa winds dominantly blow from the south-south-west during the pre-convective environment, advecting the moist unstable air mass towards the Dead Sea valley and north-east of it and directly affecting the atmospheric conditions at the target area (for a comparison with a climatology of the wind conditions in the region, please see Metzger et al., 2018). In both simulations, the passage of the cold front over the Dead Sea establishes a strong southerly wind from about 10:00 UTC on 14 November 2011.

Figure 8(a, b) Vertical and temporal cross section of equivalent potential temperature (colour scale; K), specific humidity (black isolines; g kg−1), horizontal wind vectors (north pointing upwards; m s−1) and vertical velocity (dashed white contours with 0.1 m s−1 increments) of the REF14.11 (a) and SEN14.11 (b) simulations over a representative grid point in the sub-study region (32.05∘ N, 35.79∘ E). (c, d) Spatial distribution of 10 m horizontal wind (wind vectors; m s−1) and corresponding divergence/convergence field (colour scale; s−1) at 18:00 UTC on 14 November 2011 from the REF14.11 (c) and SEN14.11 (d) simulations.
Prior to this time, dry air was advected below about 850 hPa towards the target area from the east. The turning of the low-level winds and the resulting moistening of the atmosphere is well and equally captured by both simulations (Fig. 8a). Furthermore, at the near surface from about 16:00 UTC, ∼5 h prior to the initiation of convection in the target area, a near-surface convergence line forms at the foothills of the northern part of the Jordanian Highlands, which is also well and equally captured by both simulations (Fig. 8b). The lifting provided by the convergence line triggers convection in the area. However, the drier and more stable atmosphere in the SEN14.11 simulation results in less intense convection, weaker updraughts and reduced precipitation at the eastern slope of the valley.
In the second case, CASE2, we address an episode of localized convection taking place on the north-western edge of the Dead Sea in the REF simulation, whereas no convection develops in the SEN simulation. The isolated convection in the REF simulation left about 50 mm rain in 3 h starting at about 03:00 UTC on 19 November 2011 (Fig. 9).
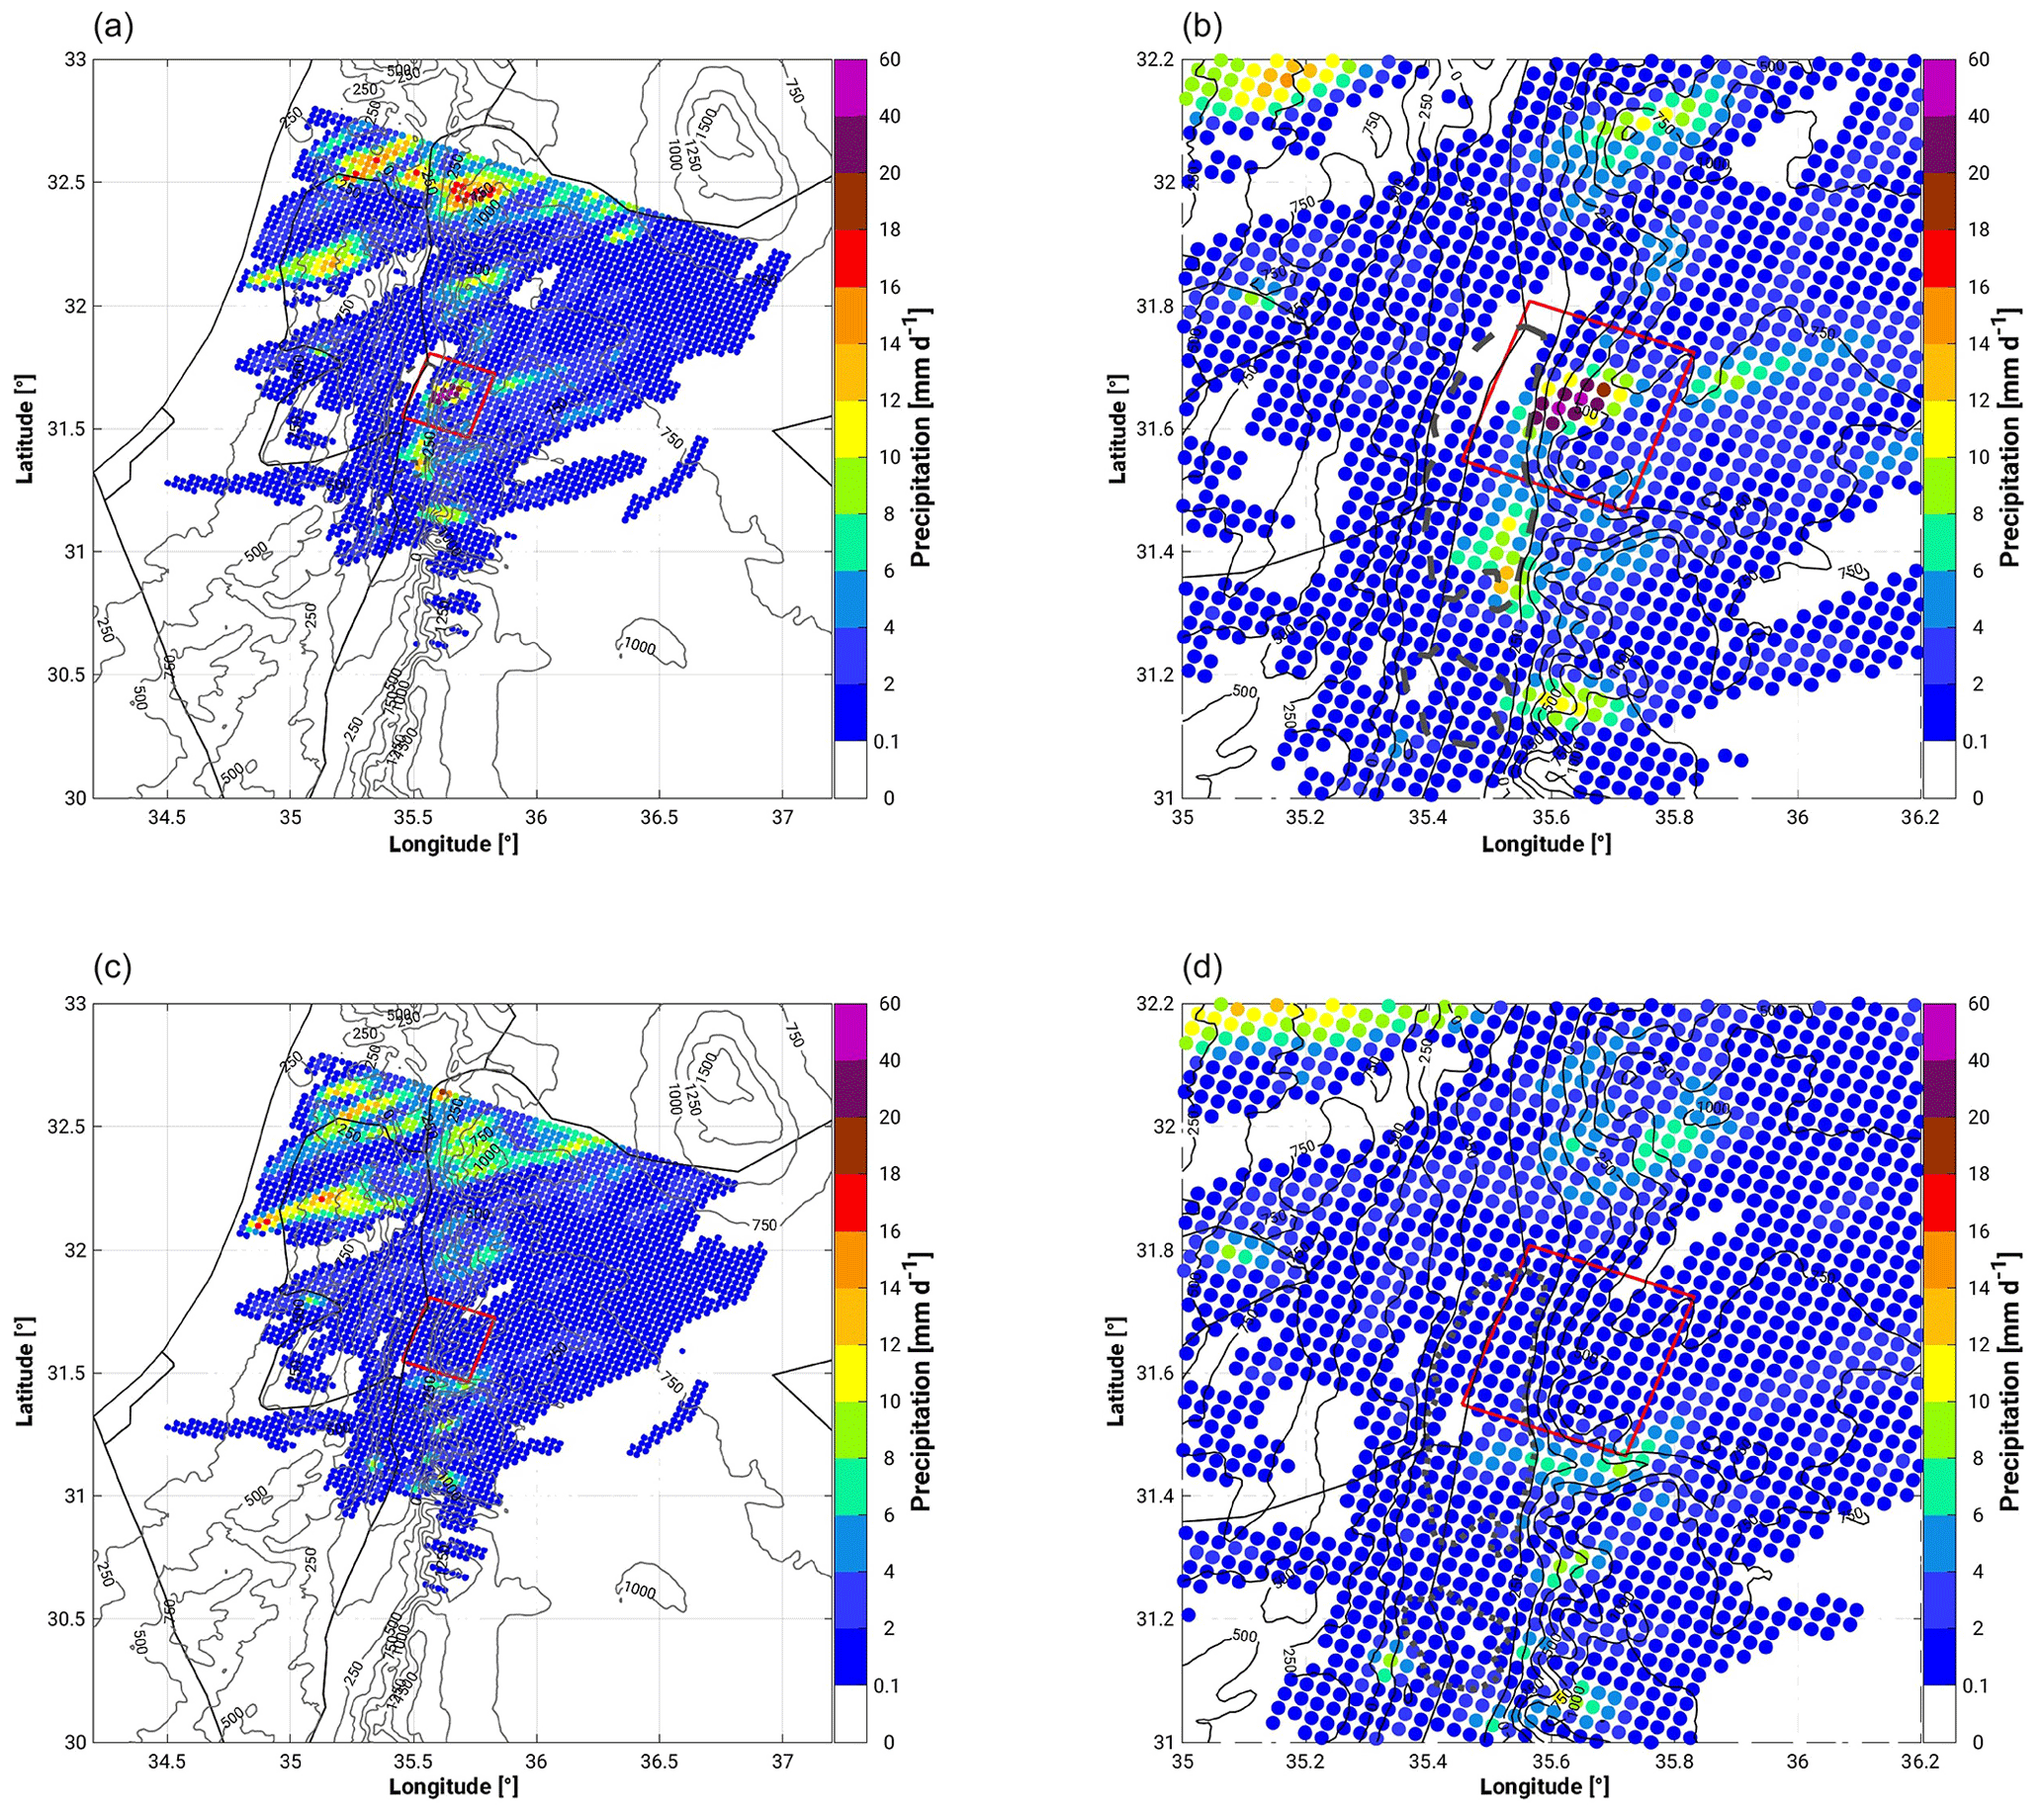
Figure 9The 24 h mean spatial distribution of precipitation from the REF19.11 simulation (a, b) and the SEN19.11 simulation (c, d) for the period 18 November 2011 at 11:00 UTC to 19 November 2011 at 10:00 UTC.
In contrast to CASE1, the modification of the pre-convective environment relevant for convective initiation is in this case dominated by dynamical changes in the mesoscale circulations. Differences in the evolution and strength of the Mediterranean Sea breeze (MSB), the Dead Sea breeze and orographic winds influence atmospheric conditions in the target area leading to the assistance or absence of convection. The most significant difference observed between the simulations is in the development of a strong near-surface convergence line in the REF simulation (which is not present in the SEN simulation, hindering convection in the area), which forms about 2 h before convective initiation (Fig. 10).
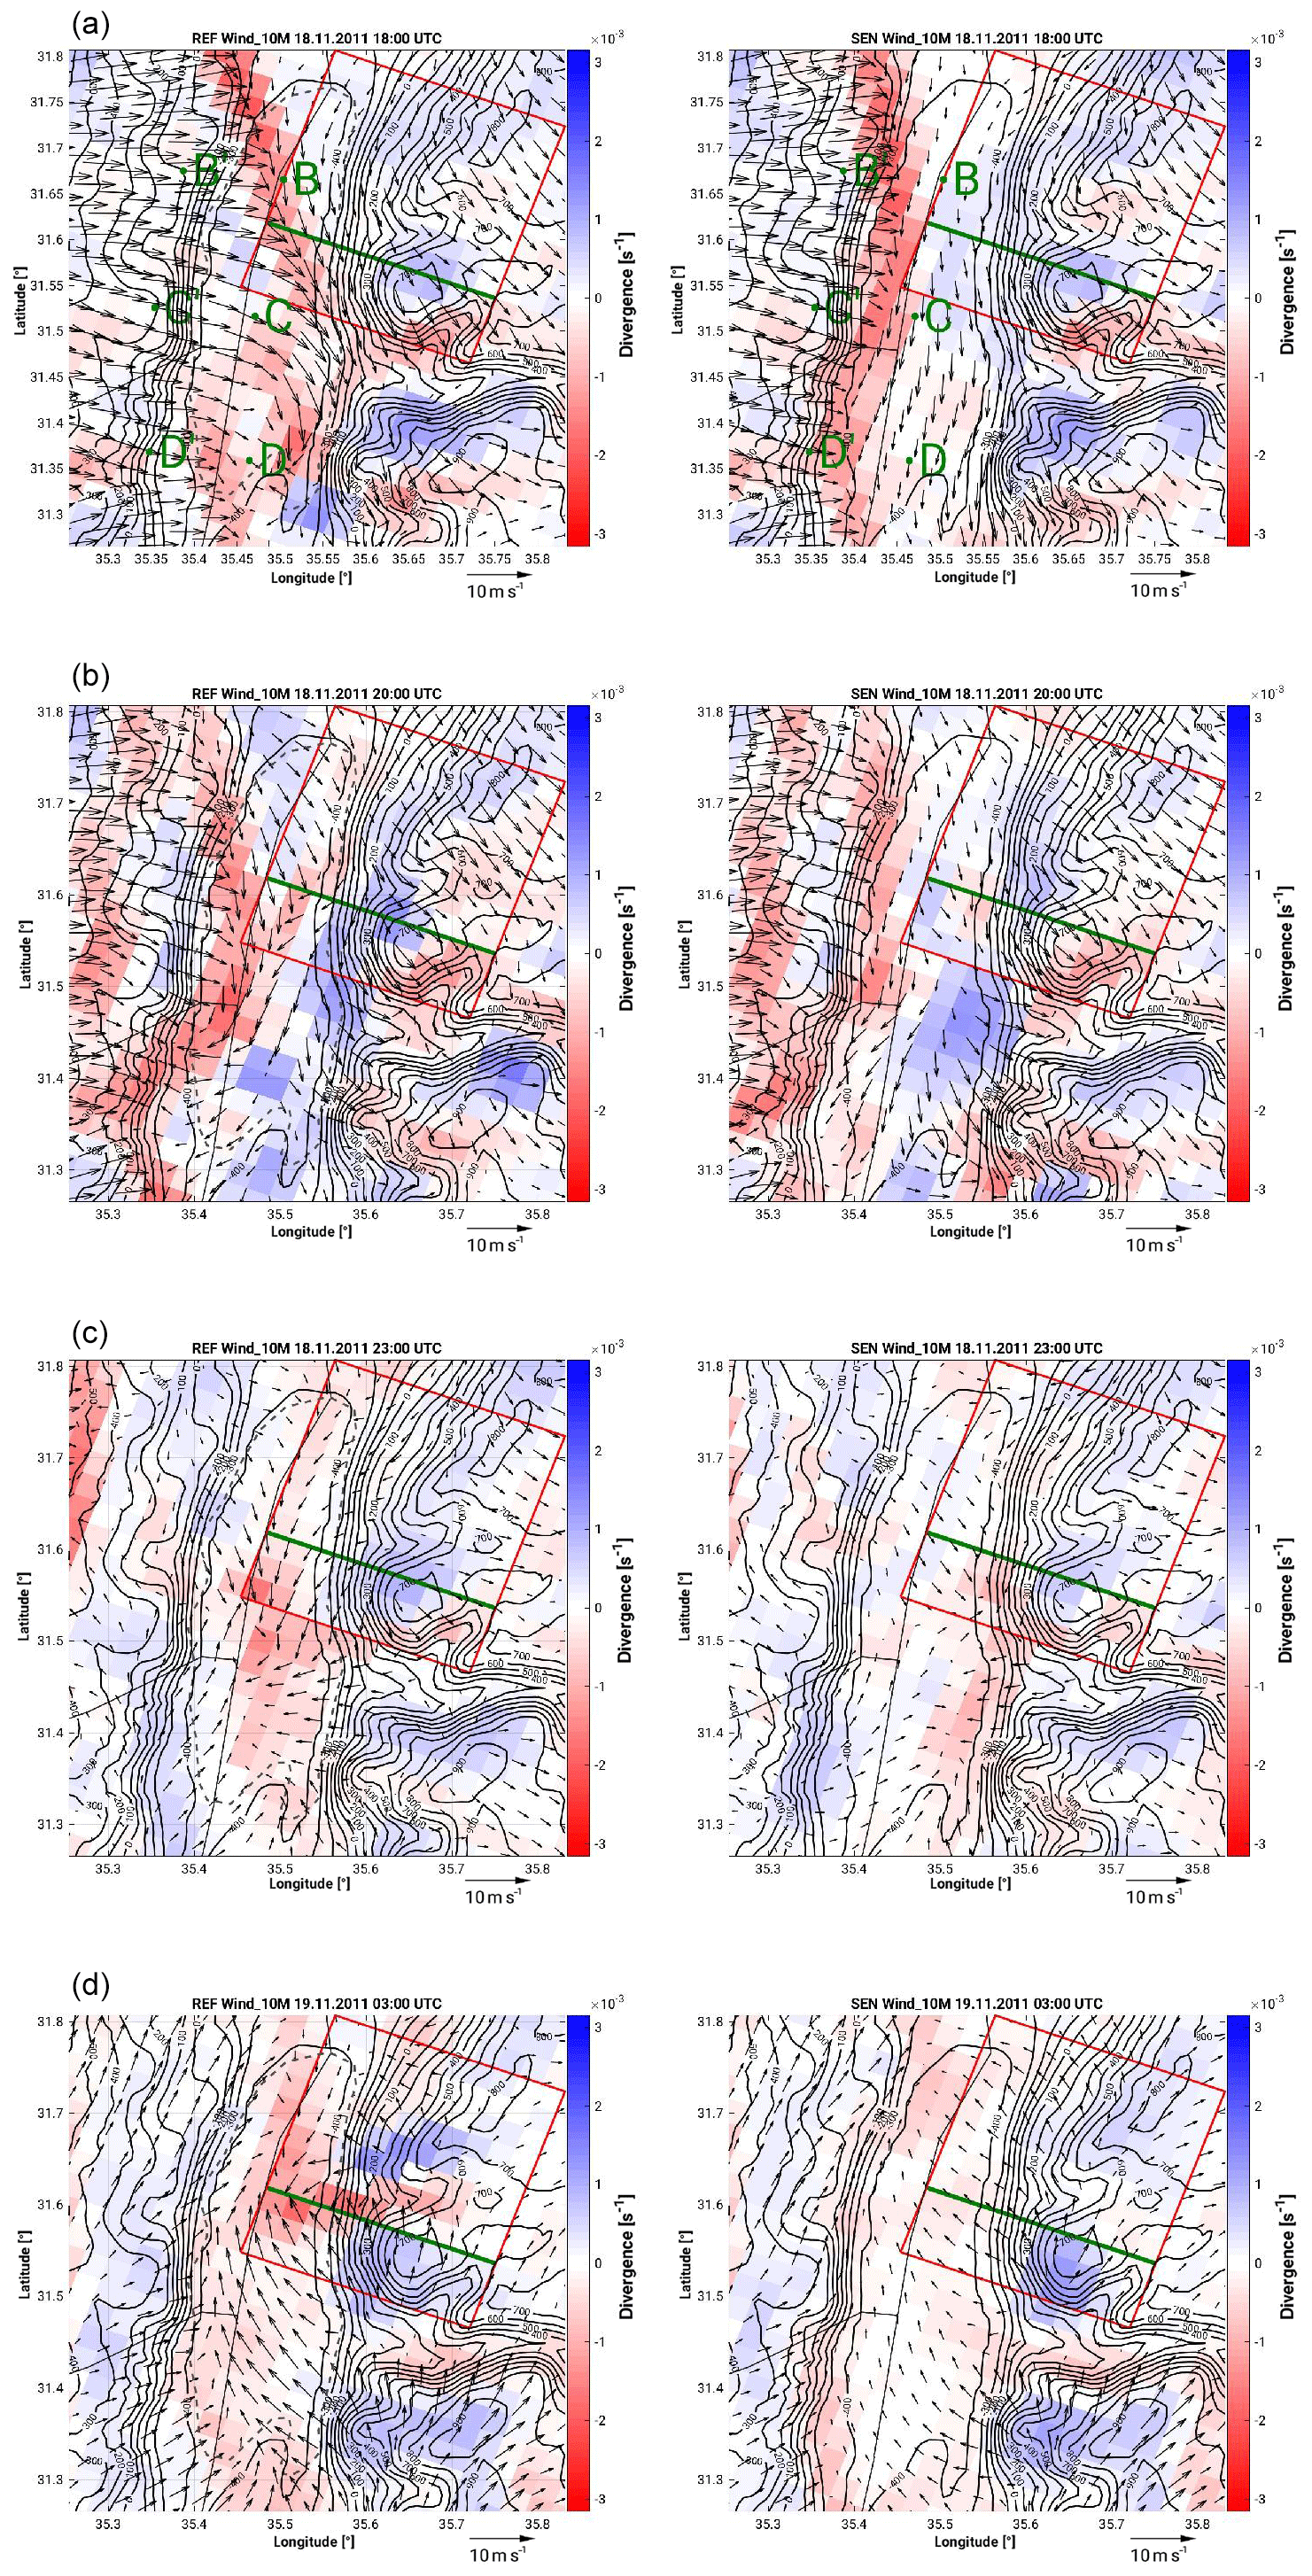
Figure 10Spatial distribution of 10 m horizontal wind (wind vectors; m s−1) and corresponding divergence/convergence field (colour scale; s−1) at 18:00, 20:00 and 23:00 UTC on 19 November and 03:00 UTC on 20 November 2011 from the REF19.11 (left) and SEN19.11 (right) simulations. The topography is indicated by the full black isolines. The transects (B-C-D and B′-C′-D′) corresponding to the locations in which temperature comparisons are made are indicated in (a). The green line indicates the position of the vertical cross section in Fig. 11.
Even in the first hours of 18 November 2011, differences in the speed and direction of the near-surface winds over the Dead Sea and on the eastern flank of the Jordanian Highlands could be identified. A fundamental difference between simulations occurs from about 17:00 UTC when strong westerly winds indicating the arrival of the MSB reach the western shore of the Dead Sea. In the REF19.11 run 1 h later, the MSB strongly penetrates the Dead Sea valley reaching as far as the eastern coast in the central to southern areas. However, in the SEN19.11 simulation, the MSB does not penetrate downward; instead, strong northerly winds flow along the valley (Fig. 10a). Numerous observational and numerical studies carried out to investigate the dynamics of the MSB (e.g. Naor et al., 2017; Vuellers et al., 2018) showed that the downward penetration of the MSB results from temperature differences between the valley air mass which is warmer than the maritime air mass. An examination of temperature differences along a near-surface north–south valley transect (positions in Fig. 10a) indicates a decrease of about 4 ∘C at the near surface over the dried Dead Sea area in contrast to negligible changes on a parallel transect inland on the western coast of the Dead Sea. This is evidence of the notorious impact of the absence of water on the valley's temperature and, thus, gradients in the region. The colder valley temperatures do not favour the downward penetration of the MSB, which strongly affects the atmospheric conditions in the valley. Moreover, a north-easterly land breeze is visible from about 20:00 UTC on the eastern shore of the Dead Sea in the REF19.11 simulation but not in the SEN19.11 simulation (Fig. 10b). This situation reflects an interesting case different from the ones generally presented in former investigations in the area (e.g. Alpert et al., 1997; and Alpert et al., 2006) in which, due to the recent weakening of the Dead Sea breeze mainly because of the drying and shrinking of the sea, the Mediterranean breeze penetrates more strongly and earlier into the Dead Sea valley, increasing the evaporation because of the strong, hot and dry wind.

Figure 11Vertical cross section of equivalent potential temperature (colour scale; K), specific humidity (black isolines; g kg−1), horizontal wind vectors (north pointing upwards; m s−1) and vertical velocity (dashed white contours with 1 m s−1 increments) of the REF19.11 (a, b, c) and SEN19.11 (d, e, f) simulations at 01:00 (a, d), 02:00 (b, e) and 03:00 UTC (c, f). The location of the cross section is indicated in Fig. 10.
Mountain downslope winds develop in both simulations from about 22:00 UTC. After 1 h, a strong northerly valley flow in the northern part of the Dead Sea contrasts with the westerly flow in the SEN19.11 simulation (Fig. 10c). As the valley cools down during night-time in the SEN simulation, T2 m decreases by about 1 K from 20:00 to 03:00 UTC in contrast to the 0.1 K decrease in the Dead Sea in the REF simulation, the temperature gradient weakens, and the northerly valley flow present in the REF simulation is absent in the SEN simulation. During the night, the synoptic conditions gain more influence than the local wind systems governing the conditions in the valley during daytime. South-easterly winds prevail in the valley in both simulations. Much stronger wind velocities are reached in the REF simulation, confirming the sensitivity of large-scale dynamics to near-surface climate-change-induced impacts.
The encounter of the north-north-westerly and south-south-easterly winds over the Dead Sea area in the REF19.11 simulation induces the formation of a convergence zone, which intensifies and extends offshore over the following hours and determines the location of convective initiation. Meanwhile, homogeneous south-easterly winds are observed in the SEN simulation (Fig. 10d).
The differences in the wind circulations contribute to a different distribution of the atmospheric conditions in the target area, particularly low-tropospheric water vapour as seen in the vertical cross sections in Fig. 11. The evolution of the atmospheric conditions in the 3 h period prior to convective initiation evidences the deeper and wetter boundary layer in the REF19.11 simulation at the north-western foothills of the ridge at the Jordanian Highlands. Differences in IWV of up to 2 mm and in instability (CAPE) close to 200 J kg−1 are found in this area (not shown). This is the location of the convergence line where convective updraughts which start close to the ground are triggered, reaching a maximum vertical velocity of about 5 m s−1 above the convergence zone in the REF19.11 simulation.
The drying and shrinking of the Dead Sea has been extensively investigated in the last decades from different points of view. This process has been related to significant local climate changes which affect the Dead Sea valley and neighbouring regions. The climate of the Dead Sea is very hot and dry, but occasionally the Dead Sea basin is affected by severe convection generating heavy precipitation which could lead to devastating flash floods.
In this study, high-resolution COSMO model simulations are used to assess the sensitivity of Dead Sea changes on the occurrence of convective precipitation in the region. A set of high-resolution, ∼2.8 km climate simulations covering the 2003–2013 period and several numerical weather prediction (NWP) runs on an event timescale (∼48–36 h) are performed over the Dead Sea area. On a decadal timescale, two simulations are carried out: the first “reference or Dead Sea” run and a second idealized “sensitivity or bare soil” run in which the Dead Sea is set to bare soil. The NWP simulations focus on two heavy precipitation events exhibiting relevant differences between the reference or Dead Sea and the sensitivity or bare soil decadal runs. A total of four simulations are performed in this case.
As the energy balance partitioning of the Earth's surface changes after setting the Dead Sea area to bare soil conditions, relevant impacts could be identified in the region. From a climatological point of view, less evaporation, higher air temperatures and less precipitation (about 0.5 %) are observed. Reduced evaporation over the Dead Sea occurs from May to October. Atmospheric conditions, such as air temperature and humidity, are mostly affected in the lower-tropospheric levels, which in turn influence atmospheric stability conditions and, hence, precipitating convection. In general, the number of dry/wet days is not largely affected by the changed conditions of the Dead Sea, although these differences could be larger for hourly precipitation; the structure and intensity of the heavier precipitation events are instead changed. While a general and homogeneous decrease in evaporation is seen in the SENCLIM simulation, precipitation deviations occur in both directions, which could suggest an impact on the timing of the events. A relevant year to year variability is observed in evaporation and precipitation which indicates the need of long time series of observations to understand local conditions and to validate model simulations.
The detailed analysis of two heavy precipitation events allowed us to further assess the possible causes and the processes involved regarding the decrease in precipitation intensity or the total omission of convection with respect to the reference or Dead Sea simulation in the absence of Dead Sea water. Two main components strongly affected by the changed conditions of the Dead Sea area are found to be highly relevant for the understanding of the environmental processes in the Dead Sea region.
-
First are the lower-atmospheric boundary layer conditions. Changes in the energy balance affect the atmosphere through the heat exchange and moisture supply. The drying of the Dead Sea in the SEN simulations and the resulting decrease in local evaporation have an impact on Dead Sea basin conditions and the neighbouring areas. A reduction in boundary layer humidity and an increase in temperature result in a general decrease in atmospheric instability and weaker updraughts, indicating reduced deep-convective activity. The main differences in the atmospheric conditions are directly over the Dead Sea, but these conditions are frequently advected to neighbouring areas by the thermally driven wind systems in the region which play a key role in the redistribution of these conditions and the initiation of convection.
-
Second are wind systems in the valley. In the arid region of the Dead Sea basin with varied topography, thermally and dynamically driven wind systems are key features of the local climate. Three different scales of climatic phenomena coexist: the Mediterranean Sea breeze (MSB), the Dead Sea breeze, and orographic, valley and slope winds which are known to temper the climate in the Dead Sea valley (Shafir and Alpert, 2011). The drying of the Dead Sea in the SEN simulation disturbs the thermally driven wind circulations. The Dead Sea breezes are missing, weaker wind speeds characterize the region, and along-valley winds are consequently affected. Furthermore, the dynamics of the Mediterranean breeze penetration into the Jordan Valley are affected.
Consequently, the impacts on the initiation of convection and development are twofold.
-
There is a distinct redistribution of atmospheric conditions, locally or remotely, which leads to different atmospheric conditions that, in the absence of the Dead Sea, result in reduced moisture availability in the lower atmospheric levels and increased stability hindering convection or reducing the intensity of the events.
-
There is a modification of the divergence/convergence field. The absence of the Dead Sea substantially modifies the wind circulation systems over the Dead Sea valley, which leads to the omission of convergence lines which act as a triggering mechanism for convection.
We can conclude that, in general, the lack of sufficient low-atmospheric moisture and the increase in atmospheric stability in addition to an absence or reduction in the intensity of the convergence zones, works against the initiation or intensification of precipitating convection in the area. The relevance of the small-scale variability of moisture and the correct definition and location of convergence lines for an accurate representation of convective initiation illustrate the limitation and the lack of adequate observational networks in the area and the need for high-resolution model simulations of boundary layer processes to predict intense and localized convection in the region.
These results contribute to gaining a better understanding of the sensitivity of local conditions in the Dead Sea valley and neighbouring areas to changing conditions in the Dead Sea. Energy balance partitioning and wind circulation systems are determiners of local climatic conditions, e.g. temperature and humidity fields, as well as aerosol redistribution; therefore, any change should be well understood and properly represented in model simulations of the region. Our results point out, in agreement with past modelling activities in the region, the need to further improve the representation of precipitation fields in the area, particularly close to the Mediterranean coastline. More accurate Mediterranean sea surface temperature input fields have been suggested as being relevant to the reduction of model inaccuracies. Furthermore, a more realistic representation of the lake shape, water salinity and temperature, as well as Dead Sea abundance and depth, must be addressed to more accurately describe present and expected future conditions. In the present study, limitations found in this direction in relation to model and external dataset descriptions, as well as identified biases regarding, for example, moisture sources for HP (heavy precipitation) in the region, MSB and Dead Sea evaporation, are expected to impact our results, and they have to be improved in future efforts in the region. As a further step, the authors will investigate some of these issues in more detail and will assess the impact of model grid resolution on the horizontal and vertical flow field in the region across scales, including the impact on large-scale dynamics. We will also put emphasis on trying to better understand the dynamics of the MSB using high-resolution modelling and especially the contrasting behaviour pointed out in this study. Fine resolution simulations up to 100 m will be performed for this purpose. Furthermore, we will provide a verification of the complex chain of processes in the area using unique measurements in the framework of the interdisciplinary virtual institute DEad SEa Research VEnue (DESERVE; Kottmeier et al., 2016).
COSMO-CLM and COSMO simulations are available upon request to the authors of this paper. Soil data are from HWSD (Harmonized World Soil Database), available at: http://www.fao.org/soils-portal/soil-survey/soil-maps-and-databases/harmonized-world-soil-database-v12/en/, v1.2, last access: 7 April 2017. Orography data are from GLOBE, available at: https://www.ngdc.noaa.gov/mgg/topo/globe.html, last access: 12 May 2017. E-OBS data are available at: https://surfobs.climate.copernicus.eu/dataaccess/access_eobs.php, Version 20.0e, last access: 3 December 2019. APHRODITE data (Asian Precipitation – Highly Resolved Observational Data Integration Towards Evaluation) are available at: http://aphrodite.st.hirosaki-u.ac.jp/download/, V1101, last access: 5 December 2019.
SK wrote the paper, analysed the data, interpreted the results and supervised the work. JH carried out the data analysis and interpretation of results and prepared all the figures.
The authors declare that they have no conflict of interest.
This article is part of the special issue “Hydrological cycle in the Mediterranean (ACP/AMT/GMD/HESS/NHESS/OS inter-journal SI)”. It is not associated with a conference.
The first authors' research was supported by the Bundesministerium für Bildung und Forschung (BMBF; German Federal Ministry of Education and Research). The authors acknowledge their colleagues at the Karlsruhe Institute of Technology (KIT) involved in the interdisciplinary virtual institute Dead Sea Research VEnue (DESERVE) for their support and interesting discussions. We acknowledge Sebastian Helgert and Alberto Caldas Alvarez for their assistance in the preparation of the simulations. This article is a contribution to the HyMeX programme.
The article processing charges for this open-access publication were covered by a Research Centre of the Helmholtz Association.
This paper was edited by Heini Wernli and reviewed by two anonymous referees.
Alpert, P. and Shay-EL, Y.: The Moisture Source for the Winter Cyclones in the Eastern Mediterranean, Israel Meteorological Research Papers, 5, 20–27, 1994.
Alpert, P., Baldi, M., Ilani, R., Krichak, S., Price, C., Rodó, X., Saaroni, H., Ziv, B., Kishcha, P., Barkan, J., Mariotti, A., and Xoplaki, E.: Relations between climate variability in the Mediterranean region and the tropics: ENSO, South Asian and African monsoons, hurricanes and Saharan dust, chap. 2, Dev. Earth Environ. Sci., 4, 149–177, https://doi.org/10.1016/S1571-9197(06)80005-4, 2006.
Alpert, P., Shafir, H., and Issahary, D.: Recent Changes in the Climate At the Dead Sea – a Preliminary Study, Climatic Change, 37, 513–537, https://doi.org/10.1023/A:1005330908974, 1997.
Andersson, T., Andersson, M., Jacobsson, C., and Nilsson, S.: Thermodynamic indices for forecasting thunderstorms in southern Sweden, Meteorol. Mag., 116, 141–146, 1989.
Arkin, Y. and Gilat, A.: Dead Sea sinkholes – an ever-developing hazard, Environ. Geol., 39, 711–722, https://doi.org/10.1007/s002540050485, 2000.
Ashbel, D. and Brooks, C.: The influence of the dead sea on the climate of its neighbourhood, Q. J. Roy. Meteorol. Soc., 65, 185–194, https://doi.org/10.1002/qj.49706528005, 1939.
Ban, N., Schmidli, J., and Schär, C.: Evaluation of the convection-resolving regional climate modeling approach in decade-long simulations, J. Geophys. Res.-Atmos., 119, 7889–7907, https://doi.org/10.1002/2014JD021478, 2014.
Belachsen, I., Marra, F., Peleg, N., and Morin, E.: Convective rainfall in a dry climate: relations with synoptic systems and flash-flood generation in the Dead Sea region, Hydrol. Earth Syst. Sci., 21, 5165–5180, https://doi.org/10.5194/hess-21-5165-2017, 2017.
Böhm, U., Kücken, M., Ahrens, W., Block, A., Hauffe, D., Keuler, K., Rockel, B., and Will, A.: CLM – The Climate Version of LM: Brief Description and Long-Term Applications, COSMO Newsletter, 6, 225–235, 2006.
Bolton, D.: The Computation of Equivalent Potential Temperature, Mon. Weather Rev., 108, 1046–1053, https://doi.org/10.1175/1520-0493(1980)108<1046:TCOEPT>2.0.CO;2, 1980.
Businger, J., Wyngaard, J., Izumi, Y., and Bradley, E.: Flux-Profile Relationships in the Atmospheric Surface Layer, J. Atmos. Sci., 28, 181–189, https://doi.org/10.1175/1520-0469(1971)028<0181:FPRITA>2.0.CO;2, 1971.
Byun, H. and Kim, D.: Comparing the Effective Drought Index and the Standardized Precipitation Index, Options Méditerranéennes, Séries A, Mediterranean Seminars, 95, 85–89, 2010.
Byun, H. and Wilhite, D.: Objective quantification of drought severity and duration, J. Climate, 12, 2747–2756, https://doi.org/10.1175/1520-0442(1999)012<2747:OQODSA>2.0.CO;2, 1999.
Cohen, S. and Stanhill, G.: Contemporary Climate Change in the Jordan Valley, J. Appl. Meteor., 35, 1051–1058, https://doi.org/10.1175/1520-0450(1996)035<1051:CCCITJ>2.0.CO;2, 1996.
Corsmeier, U., Behrendt, R., Drobinski, P., and Kottmeier, C.: The mistral and its effect on air pollution transport and vertical mixing, Atmos. Res., 74, 275–302, https://doi.org/10.1016/j.atmosres.2004.04.010, 2005.
Dayan, U. and Morin, E.: Flash flood – producing rainstorms over the Dead Sea: A review, Geol. Soc. Am., 401, 53–62, https://doi.org/10.1130/2006.2401(04), 2006.
Dayan, U. and Sharon, D.: Meteorological parameters for discriminating between widespread and spotty storms in the Negev, Israel J. Earth Sci., 29, 253–256, 1980.
Doms, G. and Baldauf, M.: A Description of the Nonhydrostatic Regional COSMO-Model, Part I: Dynamics and Numerics, Deutscher Wetterdienst, 1–161, 2015.
Doswell, C. and Rasmussen, E.: The Effect of Neglecting the Virtual Temperature Correction on CAPE Calculations, Weather Forecast., 9, 625–629, https://doi.org/10.1175/1520-0434(1994)009<0625:TEONTV>2.0.CO;2, 1994.
FAO/IIASA/ISRIC/ISSCAS/JRC: Harmonized World Soil Database (version 1.2), FAO, Rome, Italy and IIASA, Laxenburg, Austria, 2009.
Fosser, G., Khodayar, S., and Berg, P.: Benefit of convection permitting climate model simulations in the representation of convective precipitation, Clim. Dynam., 44, 45–60, 2014.
Gavrieli, I., Bein, A., and Oren, A.: The expected impact of the “Peace Conduit” project (the Red Sea – Dead Sea pipeline) on the Dead Sea, Mitigation and Adaptation Strategies for Global Change, 10, 759–777, https://doi.org/10.1007/s11027-005-5144-z, 2005.
GLOBE National Geophysical Data Center: Global Land One-kilometer Base Elevation (GLOBE) v.1, edited by: Hastings, D. and Dunbar, P. K., National Geophysical Data Center, NOAA, 1–134, 1999.
Greenbaum, N., Ben-Zvi, A., Haviv, I., and Enzel, Y.: The hydrology and paleohydrology of the Dead Sea tributaries, Geol. Soc. Am., 401, 63–93, https://doi.org/10.1130/2006.2401(05), 2006.
Hamdani, I., Assouline, S., Tanny, J., Lensky, I., Gertman, I., Mor, Z., and Lensky, N.: Seasonal and diurnal evaporation from a deep hypersaline lake: The Dead Sea as a case study, J. Hydrol., 562, 155–167, https://doi.org/10.1016/j.jhydrol.2018.04.057, 2018.
Haylock, M. R., Hofstra, N., Klein Tank, A. M. G., Klok, E. J., Jones, P. D., and New, M.: A European daily high-resolution gridded dataset of surface temperature and precipitation, J. Geophys. Res.-Atmos., 113, D20119, https://doi.org/10.1029/2008JD010201, 2008.
Hastings, D. A., Dunbar, P. K., and Hittelman, A. M.: Assessing the global land one-km base elsevation DEM, in: Geodesy Beyond 2000, edited by: Schwarz K. P., International Association of Geodesy Symposia, Vol. 121, Springer, Berlin, Heidelberg, https://doi.org/10.1007/978-3-642-59742-8_16, 2000.
Hochman, A., Mercogliano, P., Alpert, P., Saaroni, H., and Bucchignani, E.: High-resolution projection of climate change and extremity over Israel using COSMO-CLM, Int. J. Climatol., 38, 5095–5106, 2018.
Houze, R.: Orographic effects on precipitating clouds, Rev. Geophys., 50, RG1001, https://doi.org/10.1029/2011RG000365, 2012.
Kalthoff, N., Horlacher, V., Corsmeier, U., Volz-Thomas, A., Kolahgar, B., Geiß, H., Möllmann-Coers, M., and Knaps, A.: Influence of valley winds on transport and dispersion of airborne pollutants in the Freiburg-Schauinsland area, J. Geophys. Res.-Atmos., 105, 1585–1597, https://doi.org/10.1029/1999jd900999, 2000.
Khodayar, S., Kalthoff, N., and Schaedler, G.: The impact of soil moisture variability on seasonal convective precipitation simulations, Part I: validation, feedbacks, and realistic initialisation, Meteorol. Z., 22, 489–505, https://doi.org/10.1127/0941-2948/2013/0403, 2013.
Kottmeier, C., Agnon, A., Al-Halbouni, D., Alpert, P., Corsmeier, U., Dahm, T., Eshel, A., Geyer, S., Haas, M., Holohan, E., Kalthoff, N., Kishcha, P., Krawczyk, C., Lati, J., Laronne, J. B., Lott, F., Mallast, U., Merz, R., Metzger, J., Mohsen, A., Morin, E., Nied, M., Rödiger, T., Salameh, E., Sawarieh, A., Shannak, B., Siebert, C., and Weber, M.: New perspectives on interdisciplinary earth science at the Dead Sea: The DESERVE project, Sci. Total Environ., 15, 1045–1058, https://doi.org/10.1016/j.scitotenv.2015.12.003, 2016.
Kunin, P., Alpert, P., and Rostkier-Edelstein, D.: Investigation of sea-breeze/foehn in the Dead Sea valley employing high resolution WRF and observations, Atmos. Res., 229, 240–254, 2019.
Lensky, N. and Dente, E.: The hydrological proecesses driving the accelerated Dead Sea level decline in the past decades, Geol. Surv. Israel Rep., GSI/16/2015, 2015.
Llasat, M. C., Llasat-Botija, M., Prat, M. A., Porcú, F., Price, C., Mugnai, A., Lagouvardos, K., Kotroni, V., Katsanos, D., Michaelides, S., Yair, Y., Savvidou, K., and Nicolaides, K.: High-impact floods and flash floods in Mediterranean countries: the FLASH preliminary database, Adv. Geosci., 23, 47–55, https://doi.org/10.5194/adgeo-23-47-2010, 2010.
Metzger, J., Nied, M., Corsmeier, U., Kleffmann, J., and Kottmeier, C.: Dead Sea evaporation by eddy covariance measurements vs. aerodynamic, energy budget, Priestley–Taylor, and Penman estimates, Hydrol. Earth Syst. Sci., 22, 1135–1155, https://doi.org/10.5194/hess-22-1135-2018, 2018.
Miglietta, M. M., Conte, D., Mannarini, G., Lacorata, G., and Rotunno, R.: Numerical analysis of a Mediterranean “hurricane” over south-eastern Italy: sensitivity experiments to sea surface temperature, Atmos. Res., 101, 412–426, 2011.
Moncrieff, M. and Miller, M.: The dynamics and simulation of tropical cumulonimbus and squall lines, Q. J. Roy. Meteorol. Soc., 102, 373–394, https://doi.org/10.1002/qj.49710243208, 1976.
Naor, R., Potchter, O., Shafir, H., and Alpert, P.: An observational study of the summer Mediterranean Sea breeze front penetration into the complex topography of the Jordan Rift Valley, Theor. Appl. Climatol., 127, 275–284, https://doi.org/10.1007/s00704-015-1635-3, 2017.
Prein, A., Gobiet, A., Suklitsch, M., Truhetz, H., Awan, N., Keuler, K., and Georgievski, G.: Added value of convection permitting seasonal simulations, Clim. Dynam., 41, 2655–2677, 2013.
Ritter, B. and Geleyn, J.-F.: A comprehensive radiation scheme for numerical weather prediction models with potential applications in climate simulations, Mon. Weather Rev., 120, 303–325, 1992.
Rostkier-Edelstein, D., Liu, Y., Wu, W., Kunin, P., Givati, A., and Ge, M.: Towards a high-resolution climatography of seasonal precipitation over Israel, Int. J. Climatol., 34, 1964–1979, 2014.
Schaedler, G. and Sasse, R.: Analysis of the connection between precipitation and synoptic scale processes in the Eastern Mediterranean using self-organizing maps, Meteorol. Z., 15, 273–278, https://doi.org/10.1127/0941-2948/2006/0105, 2006.
Shafir, H. and Alpert, P.: Regional and local climatic effects on the Dead-Sea evaporation, Climatic Change, 105, 455–468, https://doi.org/10.1007/s10584-010-9892-8, 2011.
Sharon, D. and Kutiel, H.: The distribution of rainfall intensity in Israel, its regional and seasonal variations and its climatological evaluation, Int. J. Climatol., 6, 277–291, https://doi.org/10.1002/joc.3370060304, 1986.
Smiatek, G., Kunstmann, H., and Heckl, A.: High-resolution climate change simulations for the Jordan River area, J. Geophys. Res., 116, D16111, https://doi.org/10.1029/2010JD015313, 2011.
Stanhill, G.: Changes in the rate of evaporation from the dead sea, Int. J. Climatol., 14, 465–471, https://doi.org/10.1002/joc.3370140409, 1994.
Vüllers, J., Mayr, G. J., Corsmeier, U., and Kottmeier, C.: Characteristics and evolution of diurnal foehn events in the Dead Sea valley, Atmos. Chem. Phys., 18, 18169–18186, https://doi.org/10.5194/acp-18-18169-2018, 2018.
Wernli, H., Paulat, M., Hagen, M., and Frei, C.: SAL – a novel quality measure for the verification of quantitative precipitation forecasts, Mon. Weather Rev., 136, 4470–4487, 2008.
Yatagai, A., Alpert, P., and Xie, P.: Development of a daily gridded precipitation data set for the Middle East, Adv. Geosci., 12, 1–6, 2008.
Yatagai, A., Kamiguchi, K., Arakawa, O., Hamada, A., Yasutomi, N., and Kitoh, A.: APHRODITE: constructing a long-term daily gridded precipitation dataset for Asia based on a dense network of rain gauges, Bull. Am. Meteorol. Soc., 93, 1401–1415, 2012.