the Creative Commons Attribution 4.0 License.
the Creative Commons Attribution 4.0 License.
 | 23 Oct 2020
Measurement report: Short-term variation in ammonia concentrations in an urban area increased by mist evaporation and emissions from a forest canopy with bird droppings
Local meteorological conditions and natural and anthropogenic sources affect atmospheric NH3 concentrations in urban areas. To investigate potential sources and processes of NH3 variation in urban areas, hourly NH3 and concentrations were measured during November 2017–October 2019 in Nagoya, a central Japanese megacity. Average NH3 concentrations are high in summer and low in winter. Daily minimum NH3 concentrations are linearly correlated with daily minimum air temperatures. By contrast, daily maximum NH3 concentrations increase exponentially with temperature, suggesting that different nighttime and daytime processes and air temperatures affect concentrations. Short-term increases in NH3 concentrations of two types were examined closely. Infrequent but large increases (11 parts per billion (ppb) for 2 h) occurred after mist evaporation during daytime. During 2 years of observations, only one event of this magnitude was identified in Nagoya, although evaporation of mist and fog occurs frequently after rains. Also, short-term increases occur with a large morning peak in summer. Amplitudes of diurnal variation in NH3 concentration (daily maximum minus minimum) were analyzed on days with nonwet and low wind conditions. Amplitudes were small (ca. 2 ppb) in winter, but they increased from early summer along with new leaf growth. Amplitudes peaked in summer (ca. 20 ppb) because of droppings from hundreds of crows before roosting in trees on the campus. High daily maximum NH3 concentrations were characterized by a rapid increase occurring 2–4 h after local sunrise. In summer, peak NH3 concentrations at around 08:00 local time (LT) in sunny weather were greater than in cloudy weather, suggesting that direct sunlight particularly boosts the morning peak. Daily and seasonal findings related to the morning peak imply that stomatal emission at the site causes the increase. Differences between daily amplitudes during the two summers was explained by the different input amounts of reactive nitrogen from bird droppings and rain, suggesting that bird droppings, a temporary rich source of NH3, affected the small forest canopy.
- Article
(10297 KB) - Full-text XML
-
Supplement
(191 KB) - BibTeX
- EndNote


Ammonia (NH3) plays an important role in various atmospheric chemical processes (Behera et al., 2013). In fact, NH3 is a major precursor of fine aerosol particles containing ammonium sulfate and ammonium nitrate (Seinfeld and Pandis, 2016). In addition, aerosol particle acidity is modified by neutralization with NH3 (e.g., Murphy et al., 2017; Song and Osada, 2020). Aerosol particles affect human health and climate. Therefore, reduction in and control of its aerosol concentration are desirable under most circumstances (Dockery et al., 1993; IPCC, 2013). As an important gaseous precursor of aerosol particles, NH3 sources and factors affecting concentrations have been studied for decades. Various natural and anthropogenic sources of NH3 have been identified (Sutton et al., 2008; Behera et al., 2013). Although agricultural NH3 sources such as domestic animals and fertilizer loss are dominant emitters on a global scale, nonagricultural sources such as motor vehicles, industry, garbage, sewage, humans, and wild animals are also major sources, especially in urban areas (e.g., Perrino et al., 2002; Pandolfi et al., 2012; Reche et al., 2012; Sutton et al., 2000). For example, in the UK, Sutton et al. (2000) estimated nonagricultural NH3 emissions as being 19 % of total emissions. As a nonagricultural source, seabirds were also widely recognized as important contributors (Sutton et al., 2000; Blackall et al., 2007; Riddick et al., 2012; Croft et al., 2016).
According to a source–receptor analysis of atmospheric NH3, the effective distance of a strong point source is mostly limited to a few kilometers (Asman et al., 1989; Hojito et al., 2006; Theobald et al., 2012; Shen et al., 2016). Agricultural facilities and seabird colonies acting as strong NH3 sources are normally absent from densely populated urban areas. Therefore, a mixture of various small nonagricultural sources is expected to be the main contributor to local atmospheric NH3, which potentially acts as a precursor of aerosol particles.
Three-way catalytic converters and selective catalytic reduction systems have been applied as after-treatment devices to reduce air pollutant emissions such as CO, hydrocarbons, and NOx in vehicular exhausts. However, exhaust plumes from devices often contains NH3 as a side product created under nonideal conditions of the after-treatments (Kean et al., 2009; Suarez-Bertoa et al., 2017). Vehicular emissions of NH3 engender local and regional increases in ambient concentrations, especially during stagnant, calm wind conditions in some megacities (Osada et al., 2019). In fact, garbage containers have been implicated as a more important contributor than sewage systems in Barcelona, Spain (Reche et al., 2012). Emissions from humans and pets have been implicated in being a major nonagricultural urban source of NH3 (Sutton et al., 2000). Recently, Hu et al. (2014) reported green spaces in downtown Toronto, Canada, as being a potential source of ambient NH3, based on analyses of local, regional, and temporal variations in NH3 concentrations. Similarly, Teng et al. (2017) pointed out the importance of NH3 emissions from urban green spaces in Qingdao, a coastal urban area in northern China. Nevertheless, NH3 emission processes from green spaces are not well known for urban environments. Green spaces in urban areas provide habitable environments for wild animals. Among the wild animals found in urban areas, crows have adapted particularly well to city environments. As a consequence, crow populations have increased in many urban areas in recent years (Ueta et al., 2003; Vuorisalo et al., 2003). They form large roosts in scattered forests in urban areas and drop excreta from trees and wires to the ground during the preroosting assembly and when resting in roosts. Nevertheless, no report has described a study of the potential of NH3 emissions related to bird droppings in urban green areas.
Analysis of hourly concentrations in the atmosphere is useful for ascertaining the sources and processes of ambient NH3. For example, the temporal correlation between vehicular exhaust species such as NOx, CO, and elemental carbon in urban areas has been found for vehicular emissions of NH3 (e.g., Perrino et al., 2002; Nowak et al., 2006; Osada et al., 2019). Moreover, temporal analyses have been made of NH3 concentrations in grassland areas, which have revealed a link between morning peaks and dew formed on plant surfaces during the previous night (Wentworth et al., 2014, 2016). Hourly NH3 measurements are a key technique for ascertaining the bidirectional exchange of NH3 through the canopy layer (e.g., Wyers and Erisman, 1998; Nemiz et al., 2004; Kruit et al., 2007; Hansen et al., 2013; Hrdina et al., 2019) because NH3 transfer is governed by rapidly changing meteorological (sunlight availability, temperature, relative humidity, etc.) and plant physiological (stoma opening and closing, etc.) parameters (Schjoerring et al., 1998, 2000). In fact, NH3 exchange between plants and ambient air occurs mainly through stoma when they open during daytime for photosynthesis (Farquhar et al., 1980). Therefore, the degree and direction of the NH3 exchange are expected to vary diurnally, highlighting the importance of hourly measurements of related parameters.
To investigate potential sources and processes controlling the variation in NH3 concentration, hourly data of NH3 and were recorded from November 2017 through October 2019 in Nagoya, central Japan. The data were analyzed by particularly examining various timescales and the amplitude of diurnal variation in relation to potential reactive nitrogen sources and plant physiology near the site. These data were expected to elucidate the effects of large amounts of bird droppings on ambient NH3 concentrations in urban areas with scattered forests.
Atmospheric observations were made at Nagoya University in Nagoya, located in the central area of the Honshu island of Japan (Fig. 1a). This industrial area, with a busy port, is located about 10 km southwest from the campus of Nagoya University (Fig. 1b). The Nagoya population is about 2.3 million. Despite the large population engaged in various industrial activities, air pollution levels are not so high. Recent annual mean PM2.5 concentrations have been approximately 12 µg m−3 (Nagoya City, 2019: http://www.city.nagoya.jp/kankyo/page/0000117927.html, last access: 20 October 2020). The nearest agricultural activities (farming land) are done about 4 km southeast from the campus. Garbage collection in the city requires (1) that burnable waste, including food waste and other materials, be packed into predesignated plastic bags and (2) that the garbage bags be put out in a specified collection place by 08:00 local time (LT) on a regular (twice per week) collection day, thus preventing unnecessary NH3 emissions during garbage collection. However, the garbage bags might be pecked by crows when deterrents for bird pecking are insufficient, presenting a possible food supply for the adaptation of omnivorous animals, such as crows, in urban areas (Kurosawa et al., 2003). The observation site is located within the campus. Therefore, the effects of residential garbage are expected to be small. The annual mean air temperature in Nagoya is 15.8 ∘C; its annual mean rain amount is about 1540 mm (Japan Meteorological Agency; http://www.jma.go.jp/jma/index.html, last access: 20 October 2020). Seasons in Nagoya have warm, humid summers, with southern winds from the Pacific Ocean, and cold, dry winters, with winds from the northwest originating from continental Eurasia.
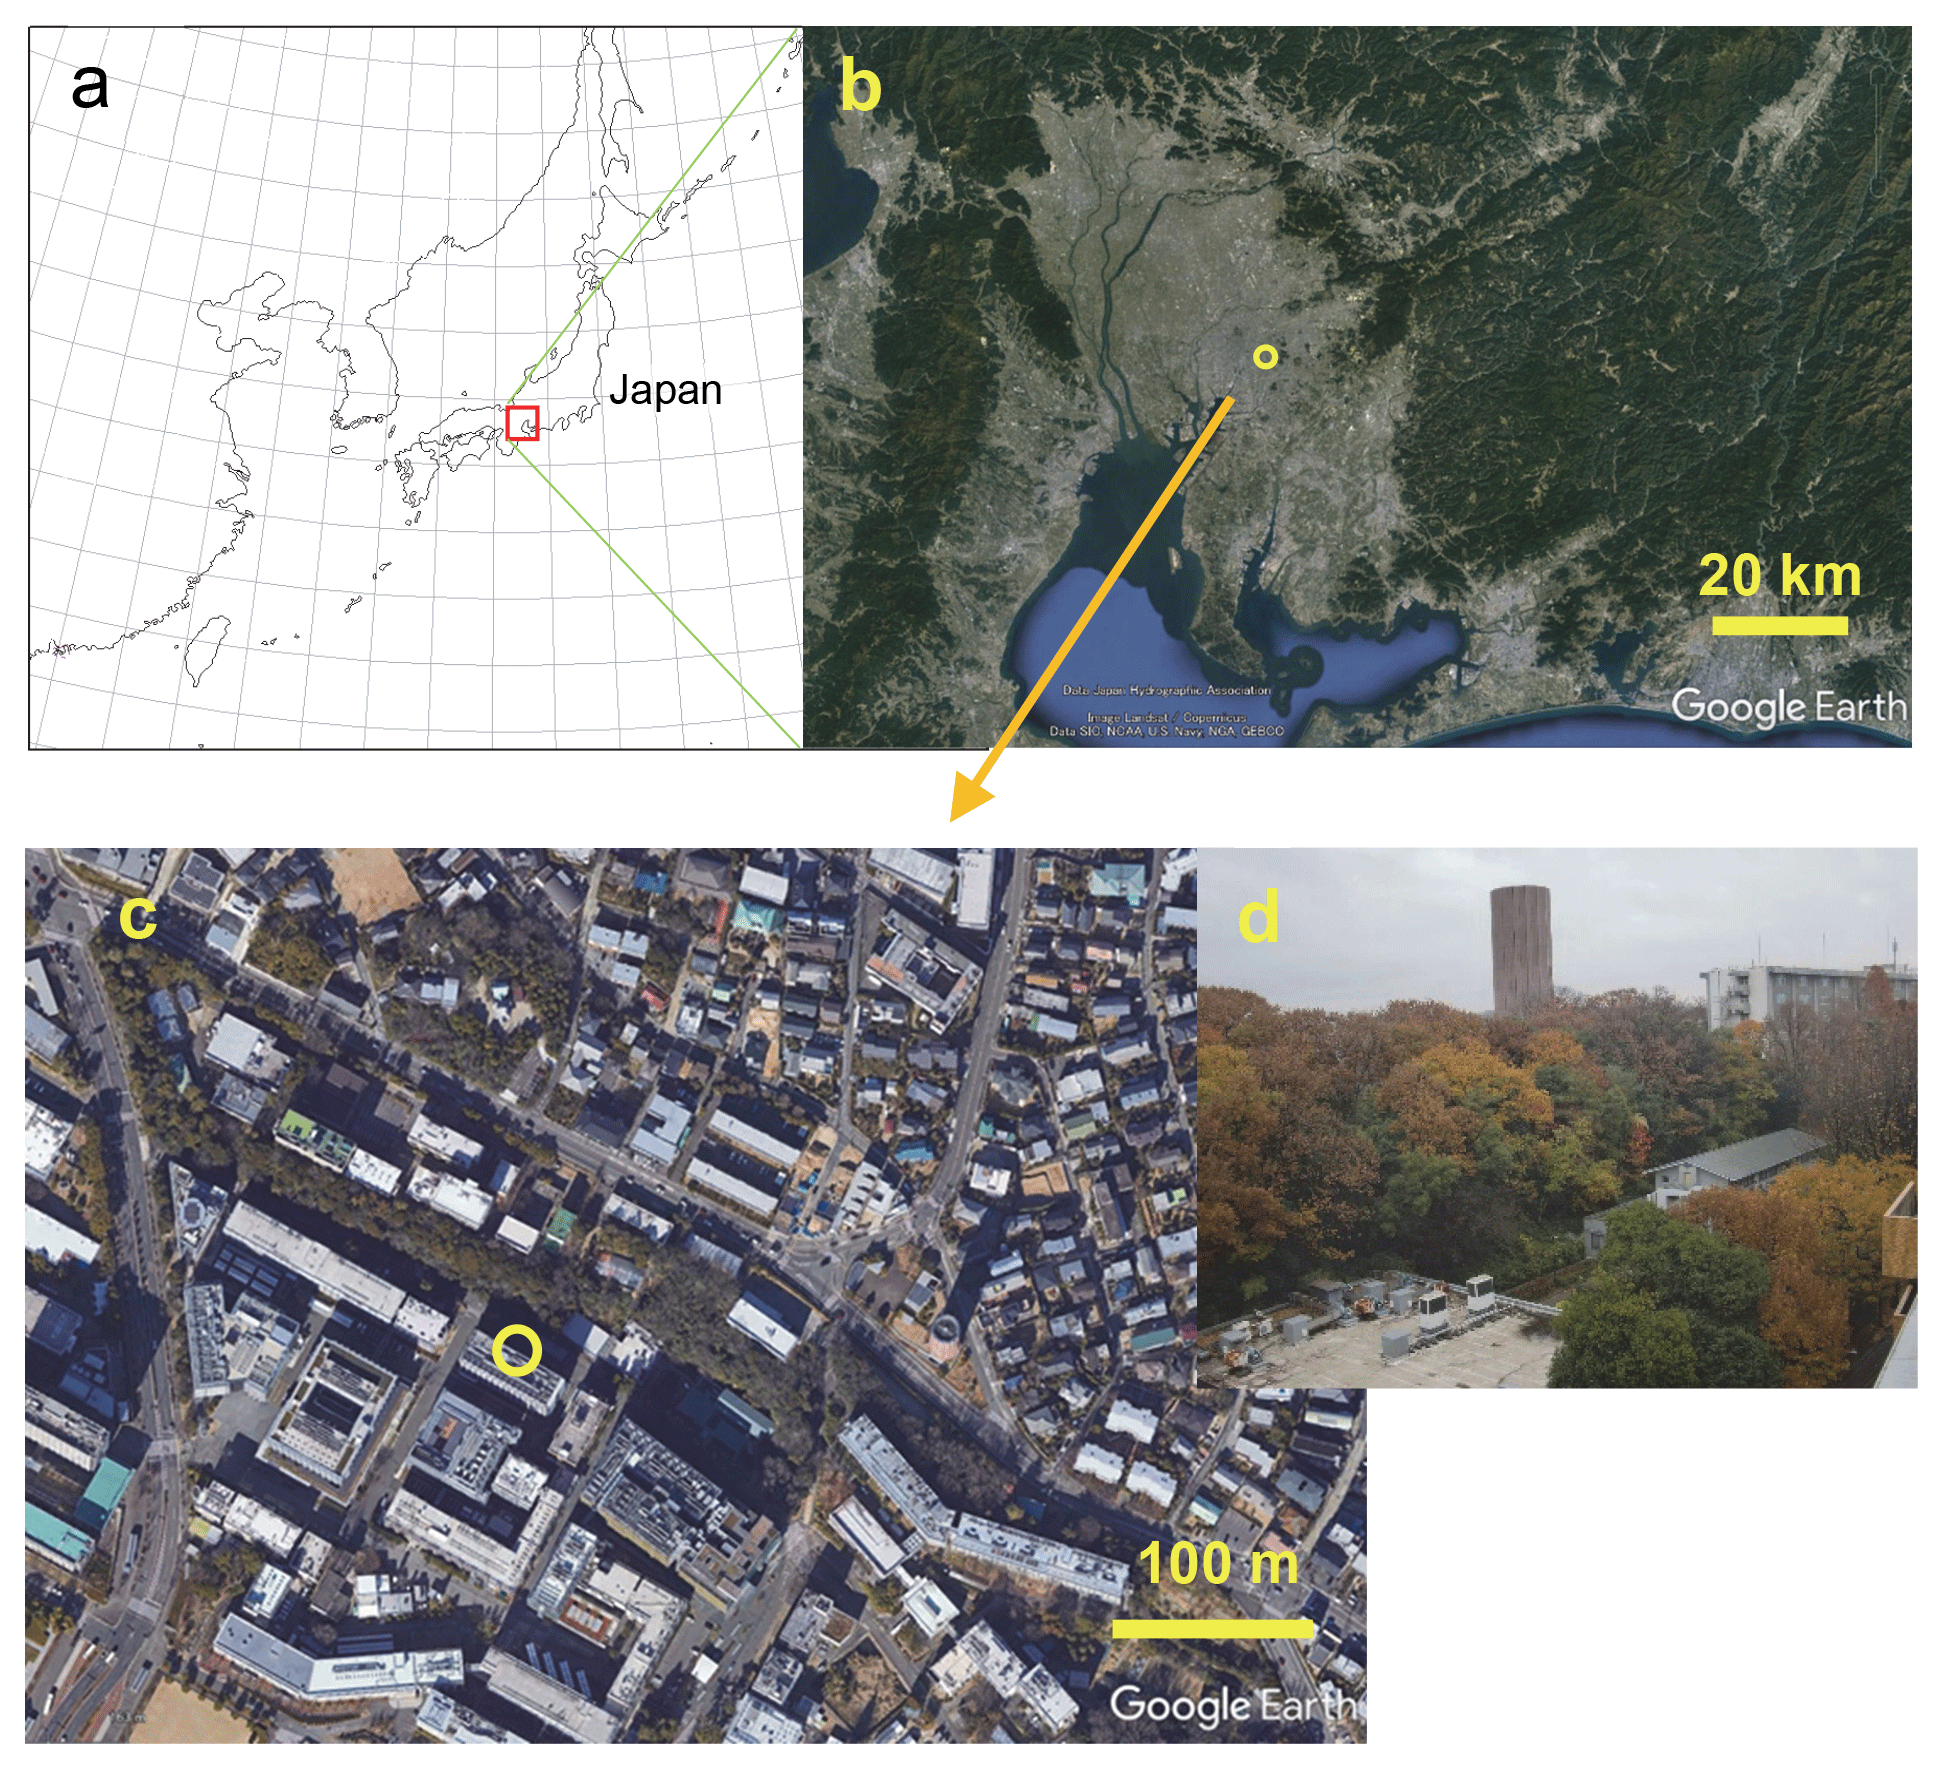
Figure 1(a) Map of the area around the observation site. (b) Satellite image (from © Google Earth) near Nagoya University (open circles – 35.67∘ N, 139.83∘ E) in Nagoya, Japan. A local meteorological station (air temperature, relative humidity, rain, wind speed and direction, solar radiation, and weather records) and a national air pollution monitoring site (NOx and CO) are located at about 2 km north of the site. (c) © Google Earth. Close-up view of the campus. NHx measurements were taken at the Environmental Studies Hall (open circle in c). (d) Outside view from the seventh floor (26 m above the ground) to the northeast, taken in early December.
Measurements of NHx (NH3 and in fine particles) were taken at Nagoya University (35.16∘ N, 136.97∘ E), located in an eastern residential area of Nagoya. Meteorological data (air temperature, relative humidity, etc.) were obtained from the Nagoya Local Meteorological Observatory, ca. 2 km north from Nagoya University (data available from https://www.jma.go.jp/jma/index.html, last access: 20 October 2020). For this study, NOx and CO concentrations were observed at the Nagoya national air pollution monitoring site located ca. 2 km north from Nagoya University (data available from http://soramame.taiki.go.jp/, last access: 20 October 2020).
The equipment used for NHx measurements was set up in a room on the seventh floor (ca. 26 m above the ground) of the Environmental Studies Hall on the main campus of Nagoya University. The northeastern side of the building faced upslope, with a small forest with mixed deciduous and evergreen trees (Fig. 1c). As Fig. 1c shows, the seventh floor height is almost equal to the height of the forest canopy growing about 40 m away on the northeastern slope. Scattered trees and buildings are located on the other side of the hall. Hourly measurements of NHx were conducted using a semicontinuous microflow analytical system (MF-NH3A; Kimoto Electric Co., Ltd.) described in an earlier report (Osada et al., 2011). Two identical sampling lines were used to differentiate total ammonium (NH3 and ) and particulate after removal by a H3PO4-coated denuder. The sample airflow rate of the NHx system was 1 L min−1. After passing an impactor (about 2 µm cutoff diameter) and an inner frosted glass tube (one coated and the other uncoated, with a 3 mm inner diameter and 50 cm long for both), pure water droplets were added immediately to the sample air at 100 µL min−1. The collection efficiency of the system was greater than 95 % for the conditions used in this study. The equilibrated sample water was analyzed, respectively, using a microflow fluorescence analyzer to quantify in the lines of and total ammonium. The NH3 concentration was calculated based on their difference. The temporal resolution was ca. 30 min for one pair of and total ammonium measurements. The detection limit of NH3 concentration was about 0.1 parts per billion by volume (ppbv; Osada et al., 2011) under stable atmospheric NH3 and concentrations. Equivalence of the two sample lines and the span of the calibration slope was checked monthly, using NH3 standard gas at about 4 ppb diluted from 100 parts per million (ppm; Taiyo Nippon Sanso Corporation). The NHx system was calibrated monthly, using a standard solution prepared from a certified 1000 ppm solution (Fujifilm Wako Pure Chemical Corporation).
3.1 Diurnal variation during summer and winter
Results of the measurements taken in summer (July 2018; Fig. 2) and winter (December 2018; Fig. 3) are presented to explain the relation between NH3 concentrations and other parameters. In summer (Fig. 2), the Pacific high-pressure system dominates the Japanese archipelago, engendering continuous good weather with land–sea breeze cycles, with south-southwest winds during the afternoon and north-northeast winds after midnight to early morning. When good weather continued, for example on 14–24 July, regular diurnal variations were found for air temperature and wind speed, namely high in the afternoon and low in the midnight to early morning. During this period, the difference between maximum and minimum NH3 concentrations was large, ranging from nearly 10 to more than 20 ppb. However, the NH3 concentration dropped to a few parts per billion. It remained constantly low for the duration of the rain, with a small diurnal variation because, during 4–7 July, the Baiu front (east Asian rainy front) was active near the site. A similar tendency of low NH3 concentration during rainy days was found during observations, as reported from other studies (Roelle and Aneja, 2002; Ellis et al., 2011). Increased contents of soil pore water dilute in the liquid phase and inhibit its evaporation as NH3. Furthermore, wet surfaces of cuticular leaves absorb ambient NH3 under high relative humidity during rain. Moreover, NH3 concentrations were low during days of higher wind, such as 23 July. The NOx concentrations in July were mostly below 0.02 ppm, with no clear correlation with the NH3 variation.
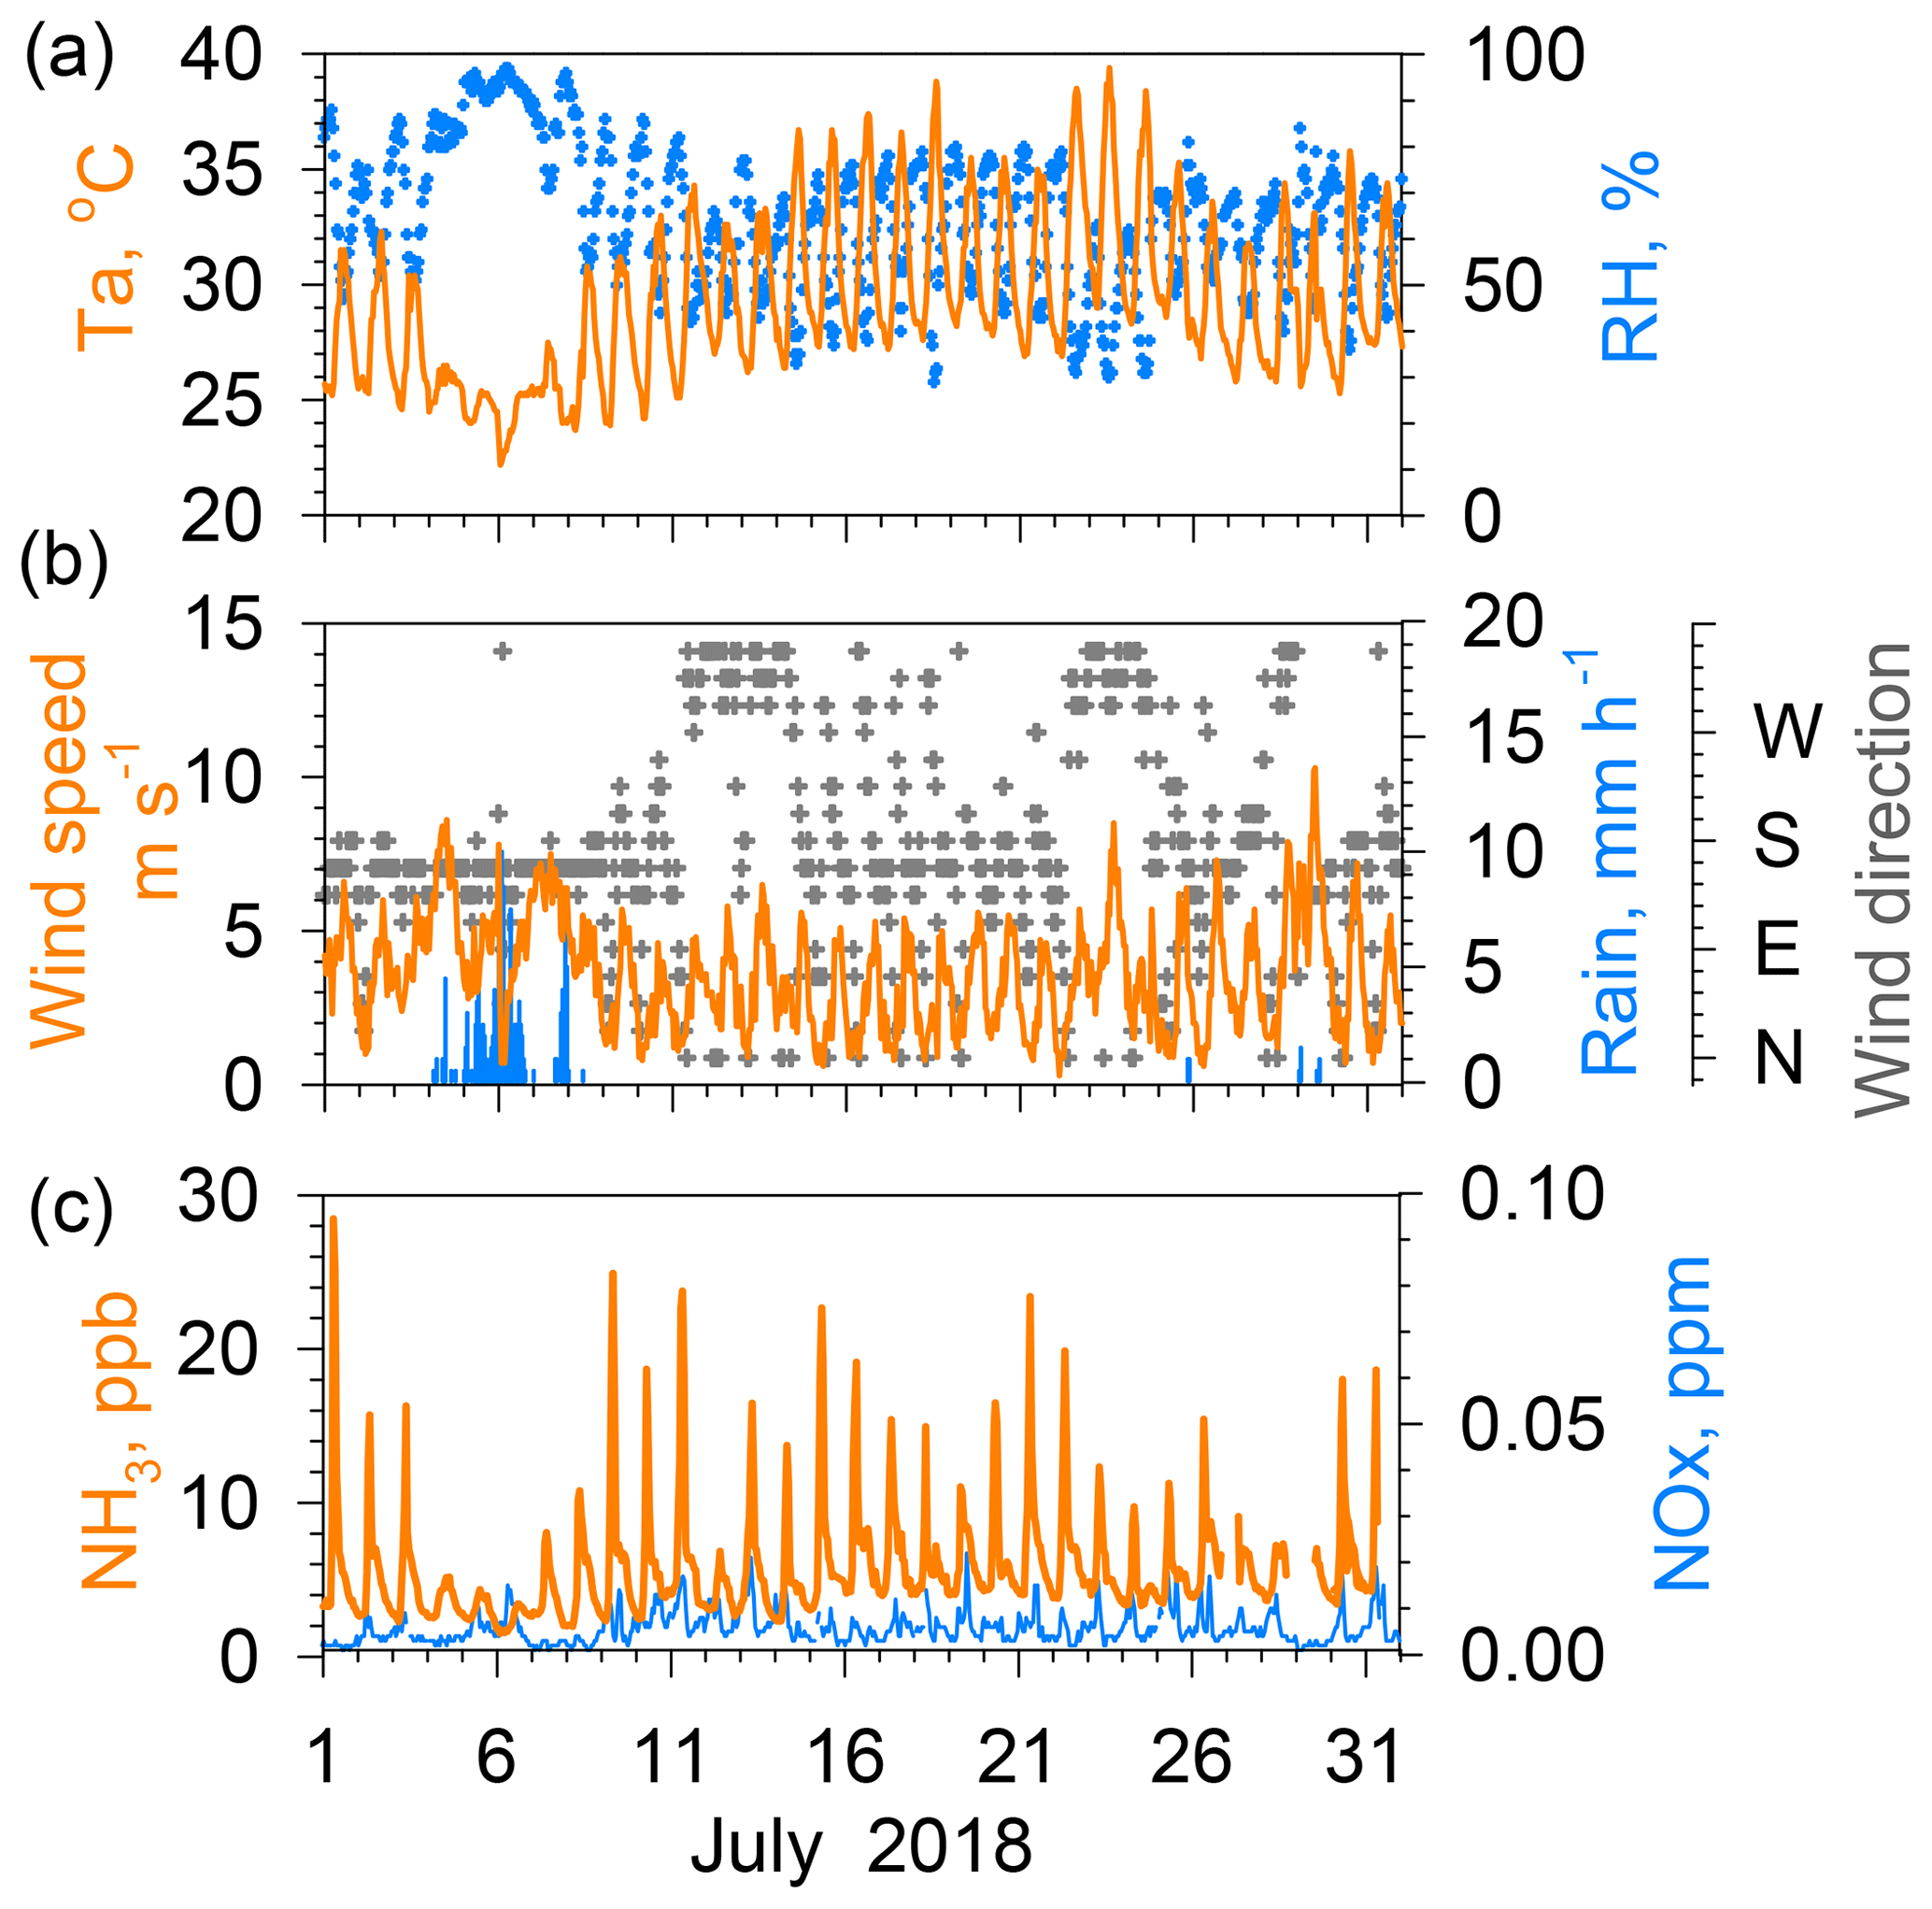
Figure 2(a) Temperature and relative humidity. (b) Wind speed, rain rate, and wind direction. (c) NH3 and NO2 concentrations in Nagoya during July 2018.
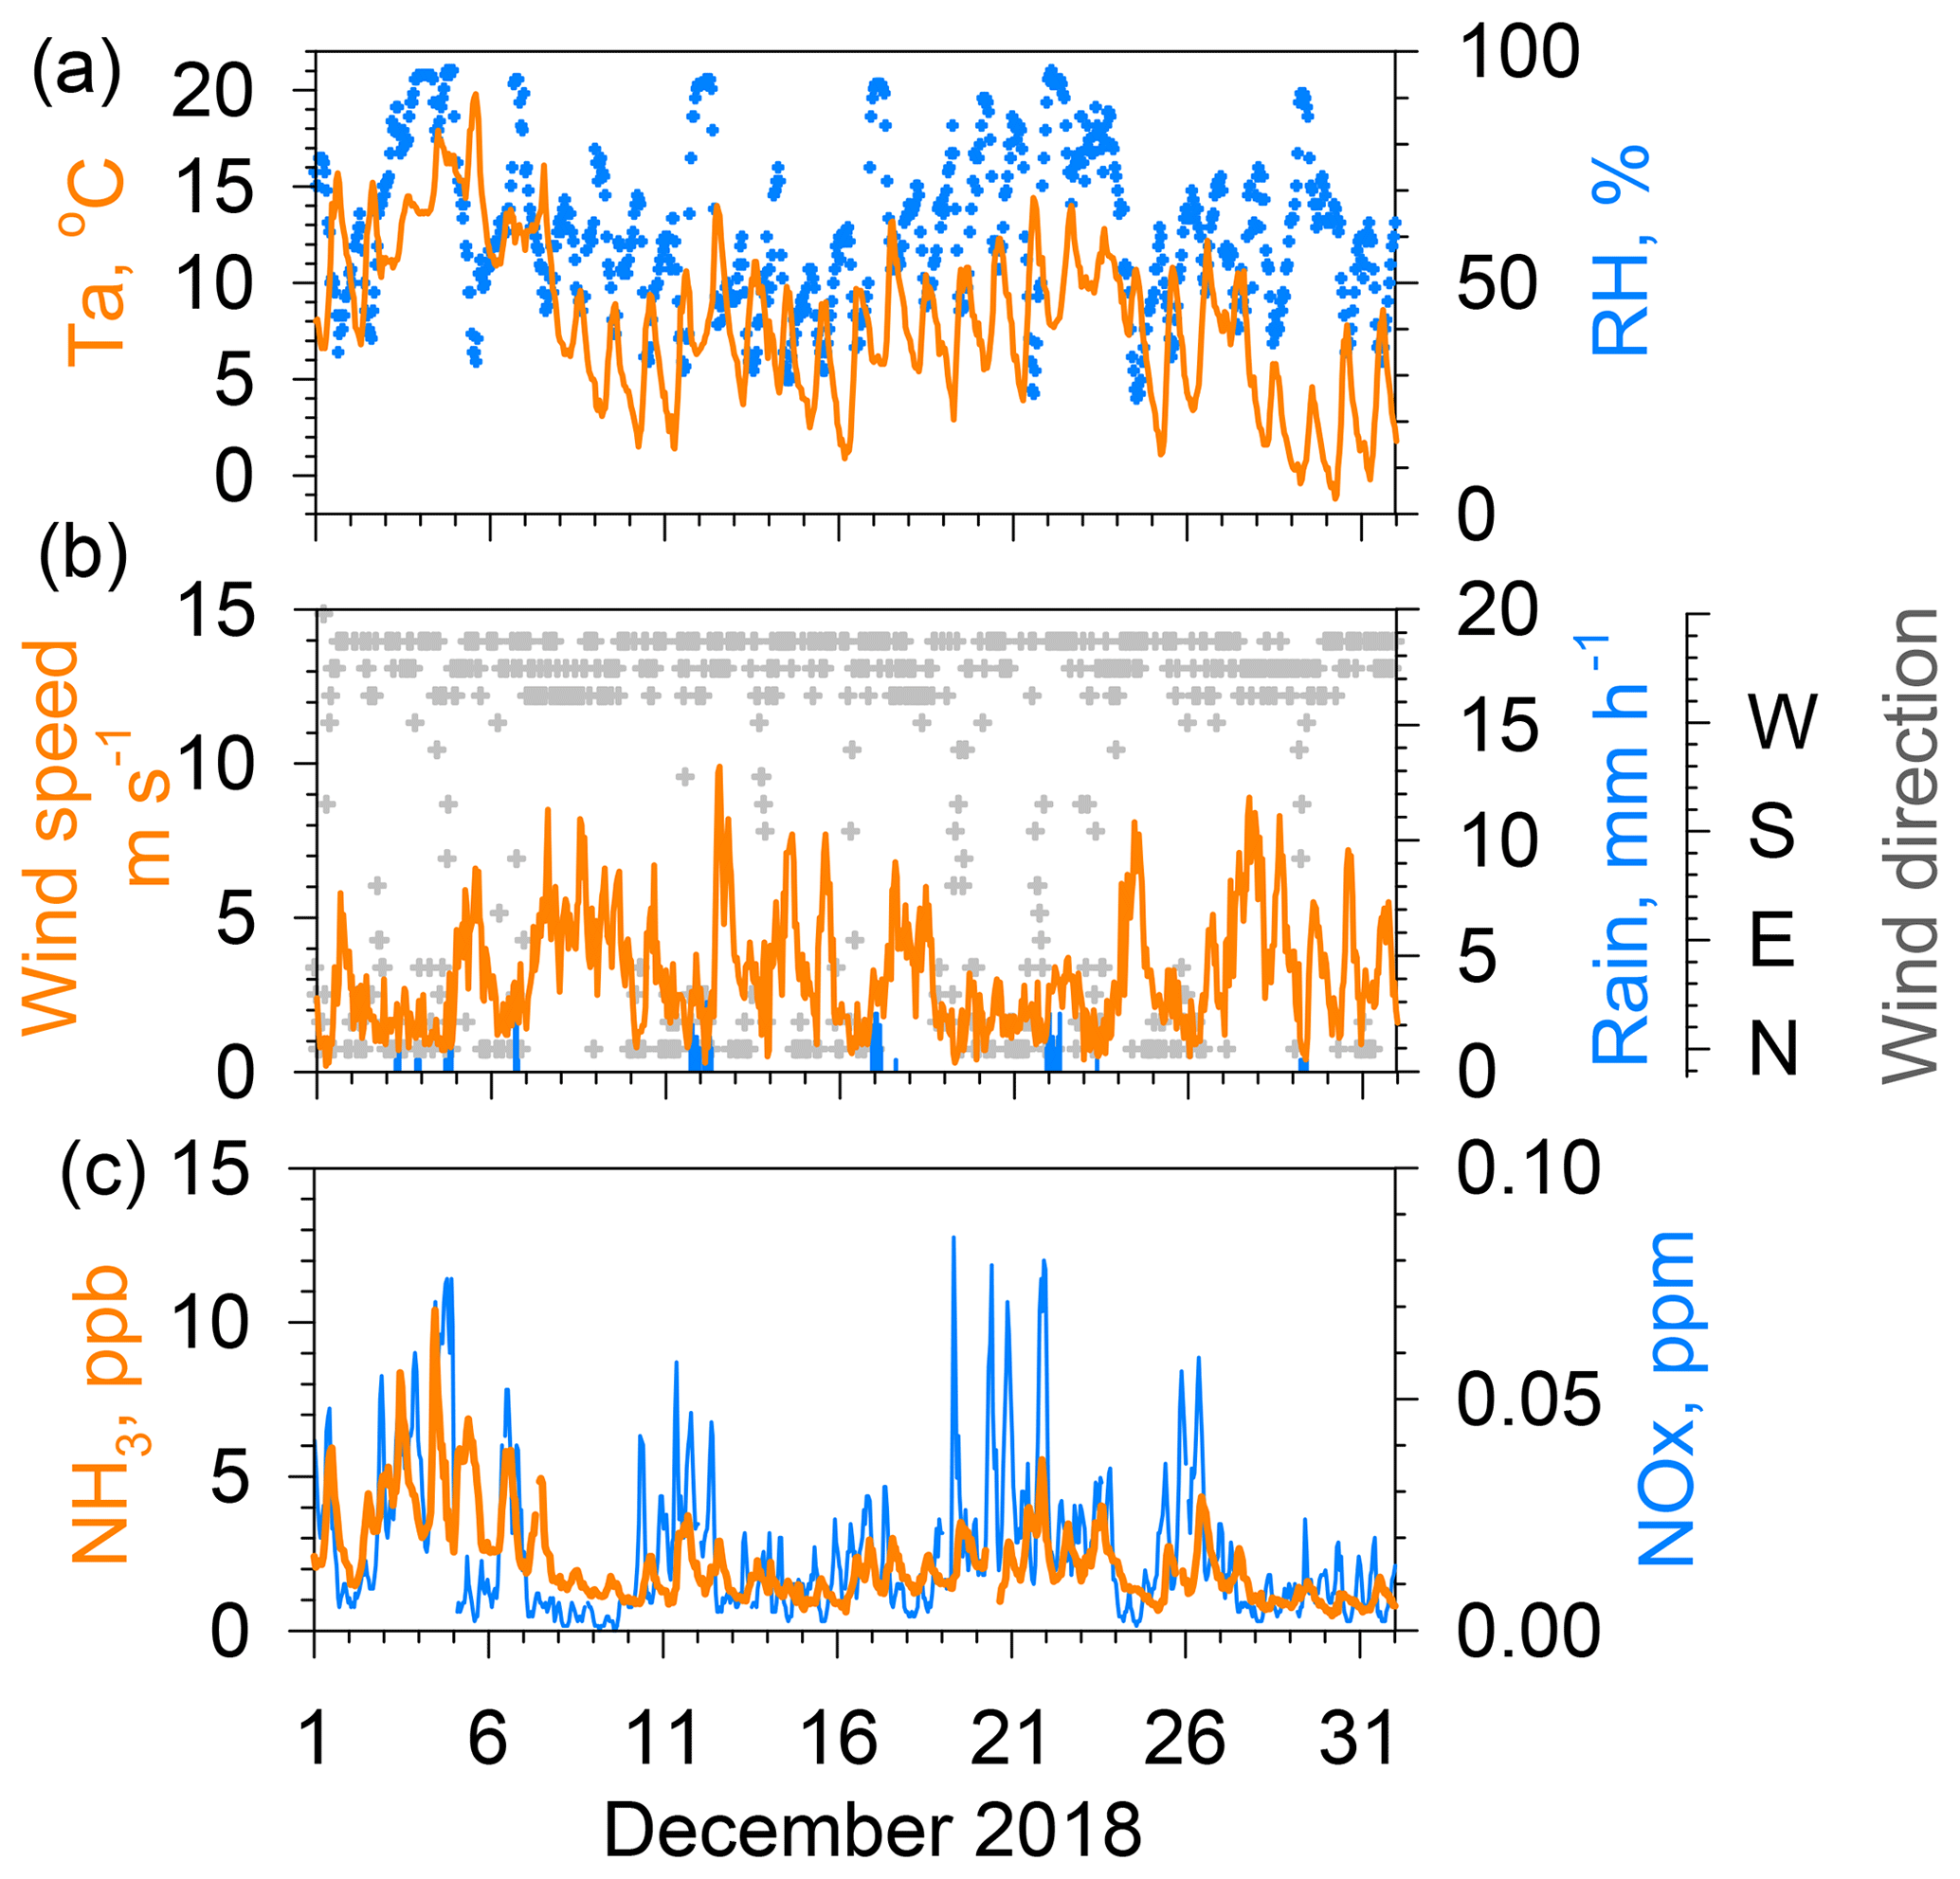
Figure 3Same as Fig. 2 but for results obtained during December 2018. The maximum of the vertical axis for NH3 is reduced to 15 ppb.
Figure 3 presents data of NH3 concentrations and other parameters for December 2018. The maximum value of the vertical axis of NH3 concentrations is 15 ppb, which is half of that shown in Fig. 2. In winter, the amplitude of the diurnal variation in the NH3 concentration was much smaller than in summer. Diurnal wind speed was variable in winter because of the lack of sea breeze circulation. In contrast to summer, the wind speed dependence of NH3 concentrations is clearer, showing higher concentrations under calm winds and lower concentrations under strong wind conditions, because local sources more strongly affect local conditions under stagnant air conditions. With low winds during winter, a surface inversion layer often developed in the lower atmosphere, preventing the vertical diffusion of locally emitted pollutants (e.g., Kukkonen et al., 2005; Osada et al., 2019). It is particularly interesting that temporal variations in daily minimum NH3 concentrations in winter roughly follow the day-to-day variation in the daily minimum temperature. For example, a higher minimum NH3 concentration of about 3 ppb during 2–4 December decreased to ca. 1 ppb around 10 December, which corresponds to a decreasing trend of high to low air temperatures for these days.
In contrast to the modest variation found for July, NOx concentrations in December showed large variation as concentrations were frequently found to be greater than 0.05 ppm during calm winds. In Fig. 3, the concentration peaks on 3–4, 11, 19–23, and 25–26 December were associated with low winds. High NOx concentrations were strongly associated with high CO concentrations (see the Supplement, Fig. S1), suggesting strong contributions of vehicular emissions for both species. Similar NOx, the NH3 concentrations increased under low winds. The similarity of the NH3 temporal variation with that of NOx suggests that motor vehicle emissions partly contribute to the ambient NH3 concentration in winter (Osada et al., 2019). However, neither NH3 nor NHx (NH3 and NH showed a strong correlation with NOx (Fig. S1), suggesting that a source other than vehicular emissions contributes more to NH3 concentrations in winter.

Figure 4Hourly averages of various concentrations and meteorological parameters for several months, namely December 2017 (solid gray line), March (solid blue line), June (solid green line), September (solid orange line) and December (dotted gray line) in 2018, and March (dotted blue line), June (dotted green line), and September (dotted orange line) in 2019. (a) NH3, (b) , (c) air temperature, (d) solar radiation, (e) relative humidity, (f) wind speed, (g) NOx and (h) CO.
Figure 4 depicts average diurnal variations in NH3 and concentrations, air temperature, solar radiation, relative humidity (RH), wind speed (WS), NOx, and CO concentrations from December 2017 through September 2019 for every 3 months. For NH3 variation, seasonal change was readily apparent. Broad and modest maximum of NH3 concentrations were observed at around 12:00 in December and March. In contrast, in June and September, sharp peaks at around 08:00 in the morning were superimposed on the broad and modest variation during colder season. The start time of the NH3 increase in the morning during the warm season was similar to the hours of rising air temperature and dropping relative humidity. In contrast to diurnal variations in NOx and CO concentrations, NH3 concentrations in December and March showed no large morning peak during rush hour between 07:00 and 09:00, suggesting that contributions of NH3 from motor vehicular emissions are apparently limited to those days under calm wind conditions, even in December.
Diurnal variation in concentration was nearly flat for all examples portrayed in Fig. 4. Regarding the relation between concentrations and air temperature, a dissociation of particulate NH4NO3 in the atmosphere is known to be strongly related to temperature as partitioning toward the gas phase is favored under higher air temperatures (Mozurkewich, 1993). However, the concentrations in Fig. 4 were not simply due to diurnal temperature variations. Therefore, NH3 increases at around 12:00 during the cold season are not attributable to the dissociation of NH4NO3. Solar radiation showed higher values at around 12:00. Wind speed was low from midnight to the morning and high during the afternoon and early evening.
Diurnal variation in NH3 concentration is controlled mainly by time variations in (1) atmospheric boundary layer dynamics, (2) dry deposition to cuticular of vegetation and other surfaces, and (3) local emission strength (Sutton et al., 1995; Saylor et al., 2010; Hrdina et al., 2019). First, the boundary layer height increases with surface heating by solar radiation, leading to greater dilution of the NH3 concentration at 12:00. If this is the case, then diurnal variation in NH3 resembles that of NOx and CO. However, it appears to be different in Fig. 4, suggesting the dominance of other factors. Second, the dry deposition velocity of NH3 varies with the wetness of the surfaces. Diurnal variation in RH shows minimum values around 12:00, implying that the NH3 dry deposition in daytime is greater than that during nighttime. Evaporation of dew and evaporation from wet surfaces is also a potential source of NH3, as discussed in greater detail in Sect. 3.2. Lastly, the time variation in local emissions is important, especially for a low wind conditions. Rush hour emissions from motor vehicles were not the major contributor, as discussed earlier. To seek an effective source that is creating the morning peak, diurnal variations were analyzed again for days selected by weather condition (more specifically, duration of sunshine), as presented in Fig. 2.
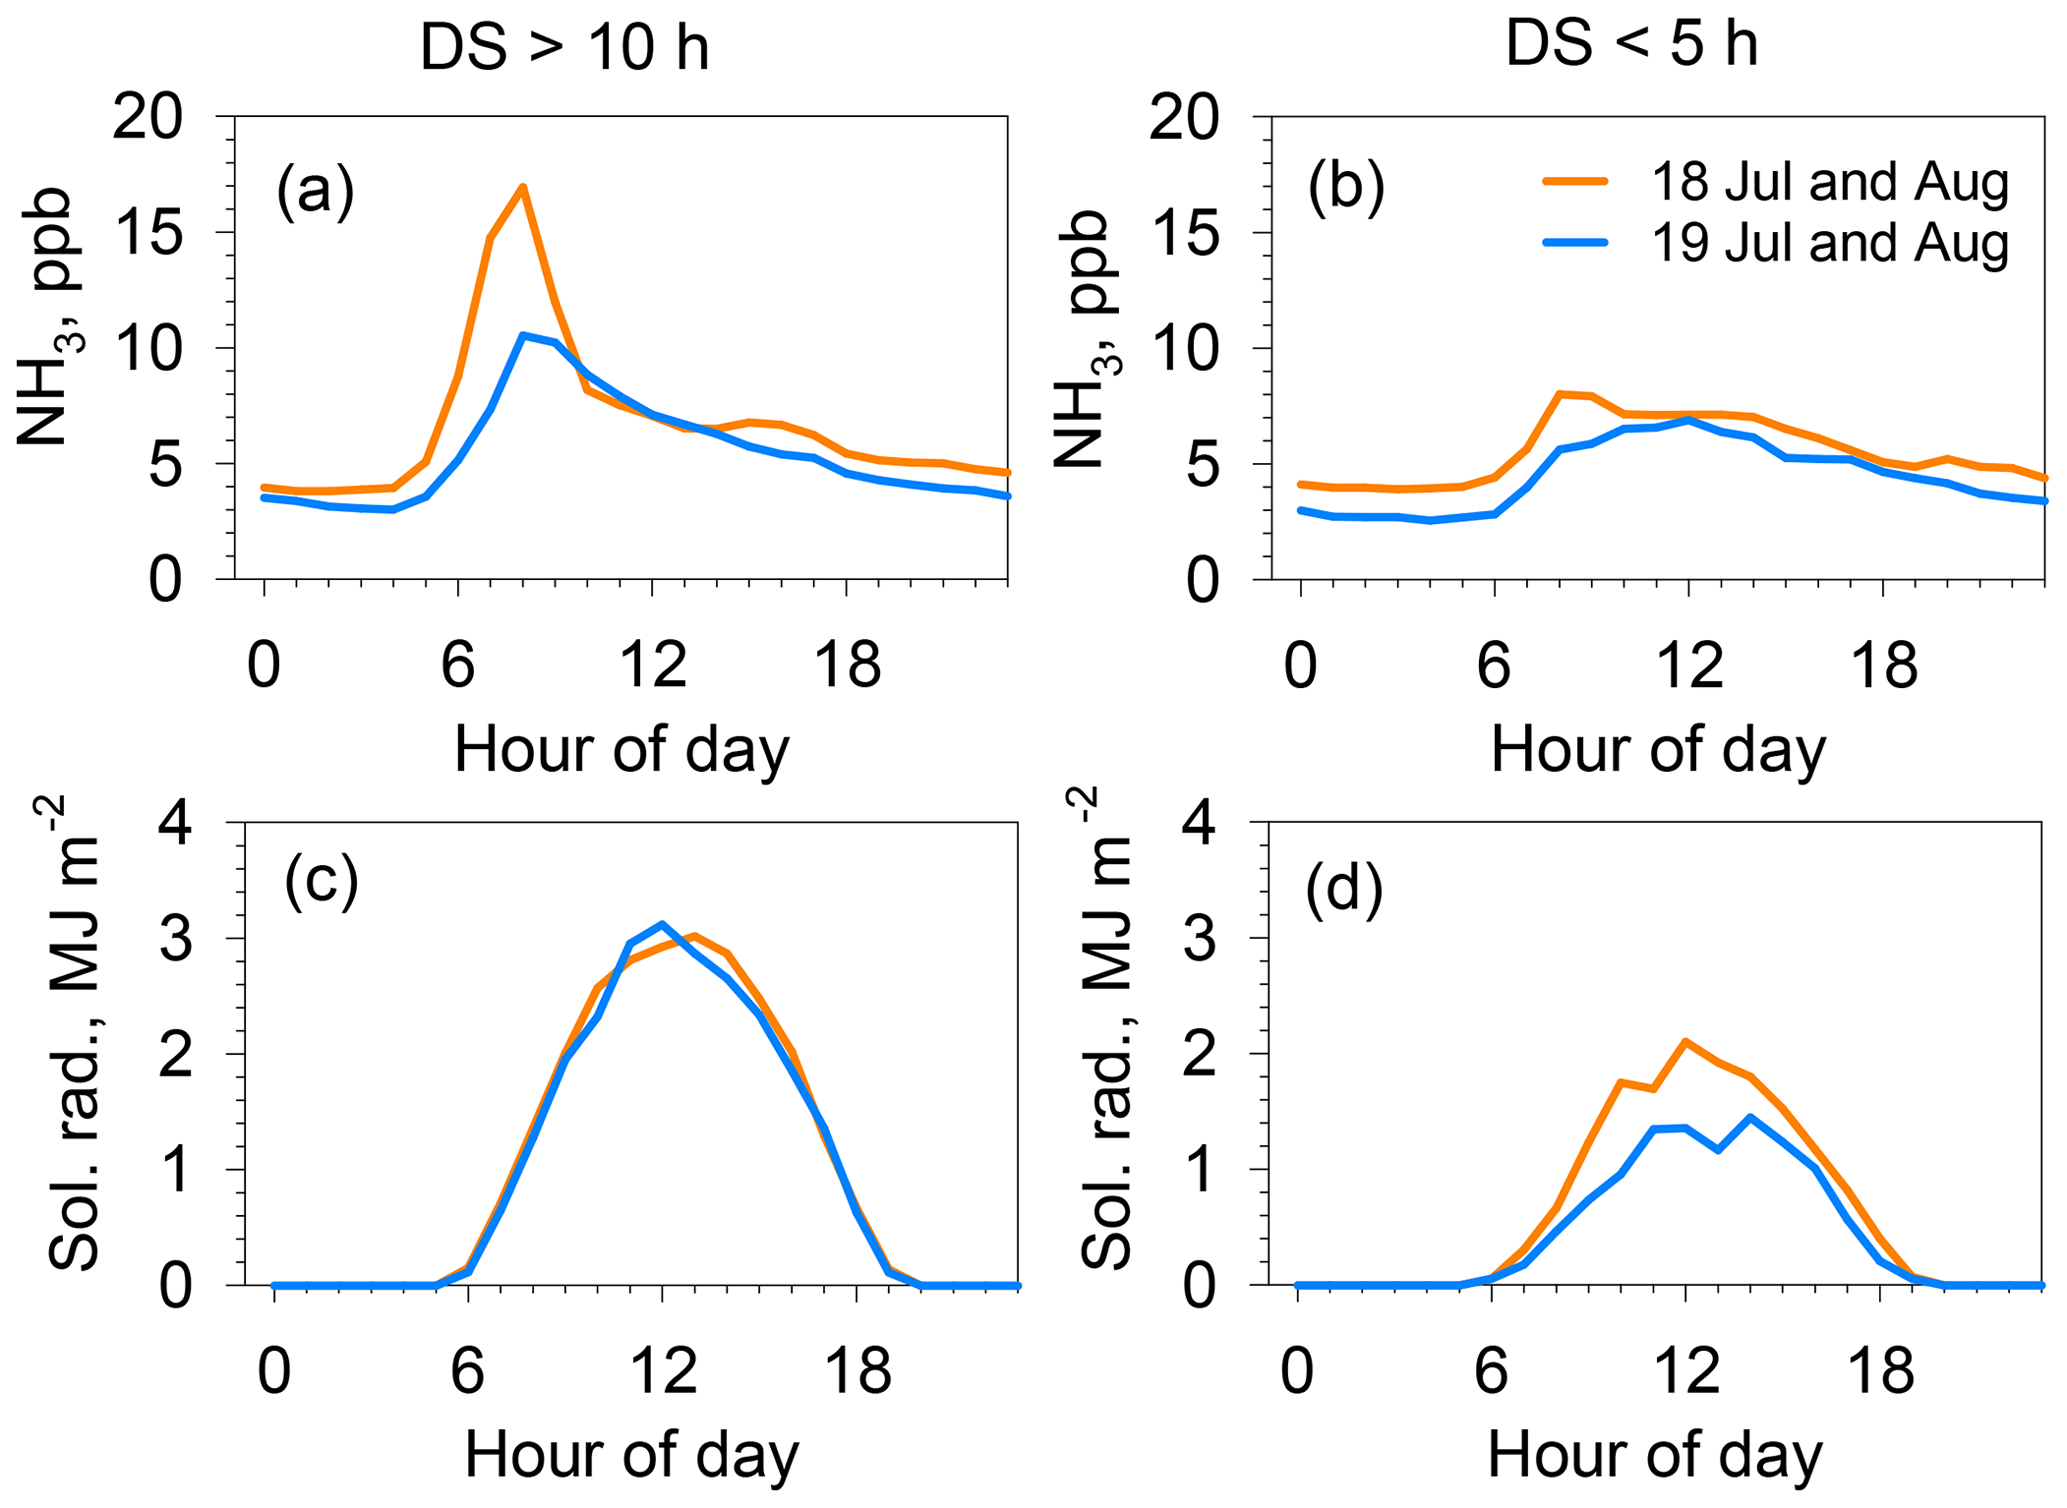
Figure 5Hourly average of NH3 concentration (a, b) and solar radiation (c, d) during July–August in 2018 (orange) and 2019 (blue). (a, c) Averages for fine days, both for daily sunshine > 10 h and daily wind speed < 3 m s−1 (11 d in 2018; 10 d in 2019). (b, d) Averages for cloudy days, for all daily sunshine < 5 h, daily wind speed < 3 m s−1, and daily rain < 3 mm (4 d in 2018; 7 d in 2019).
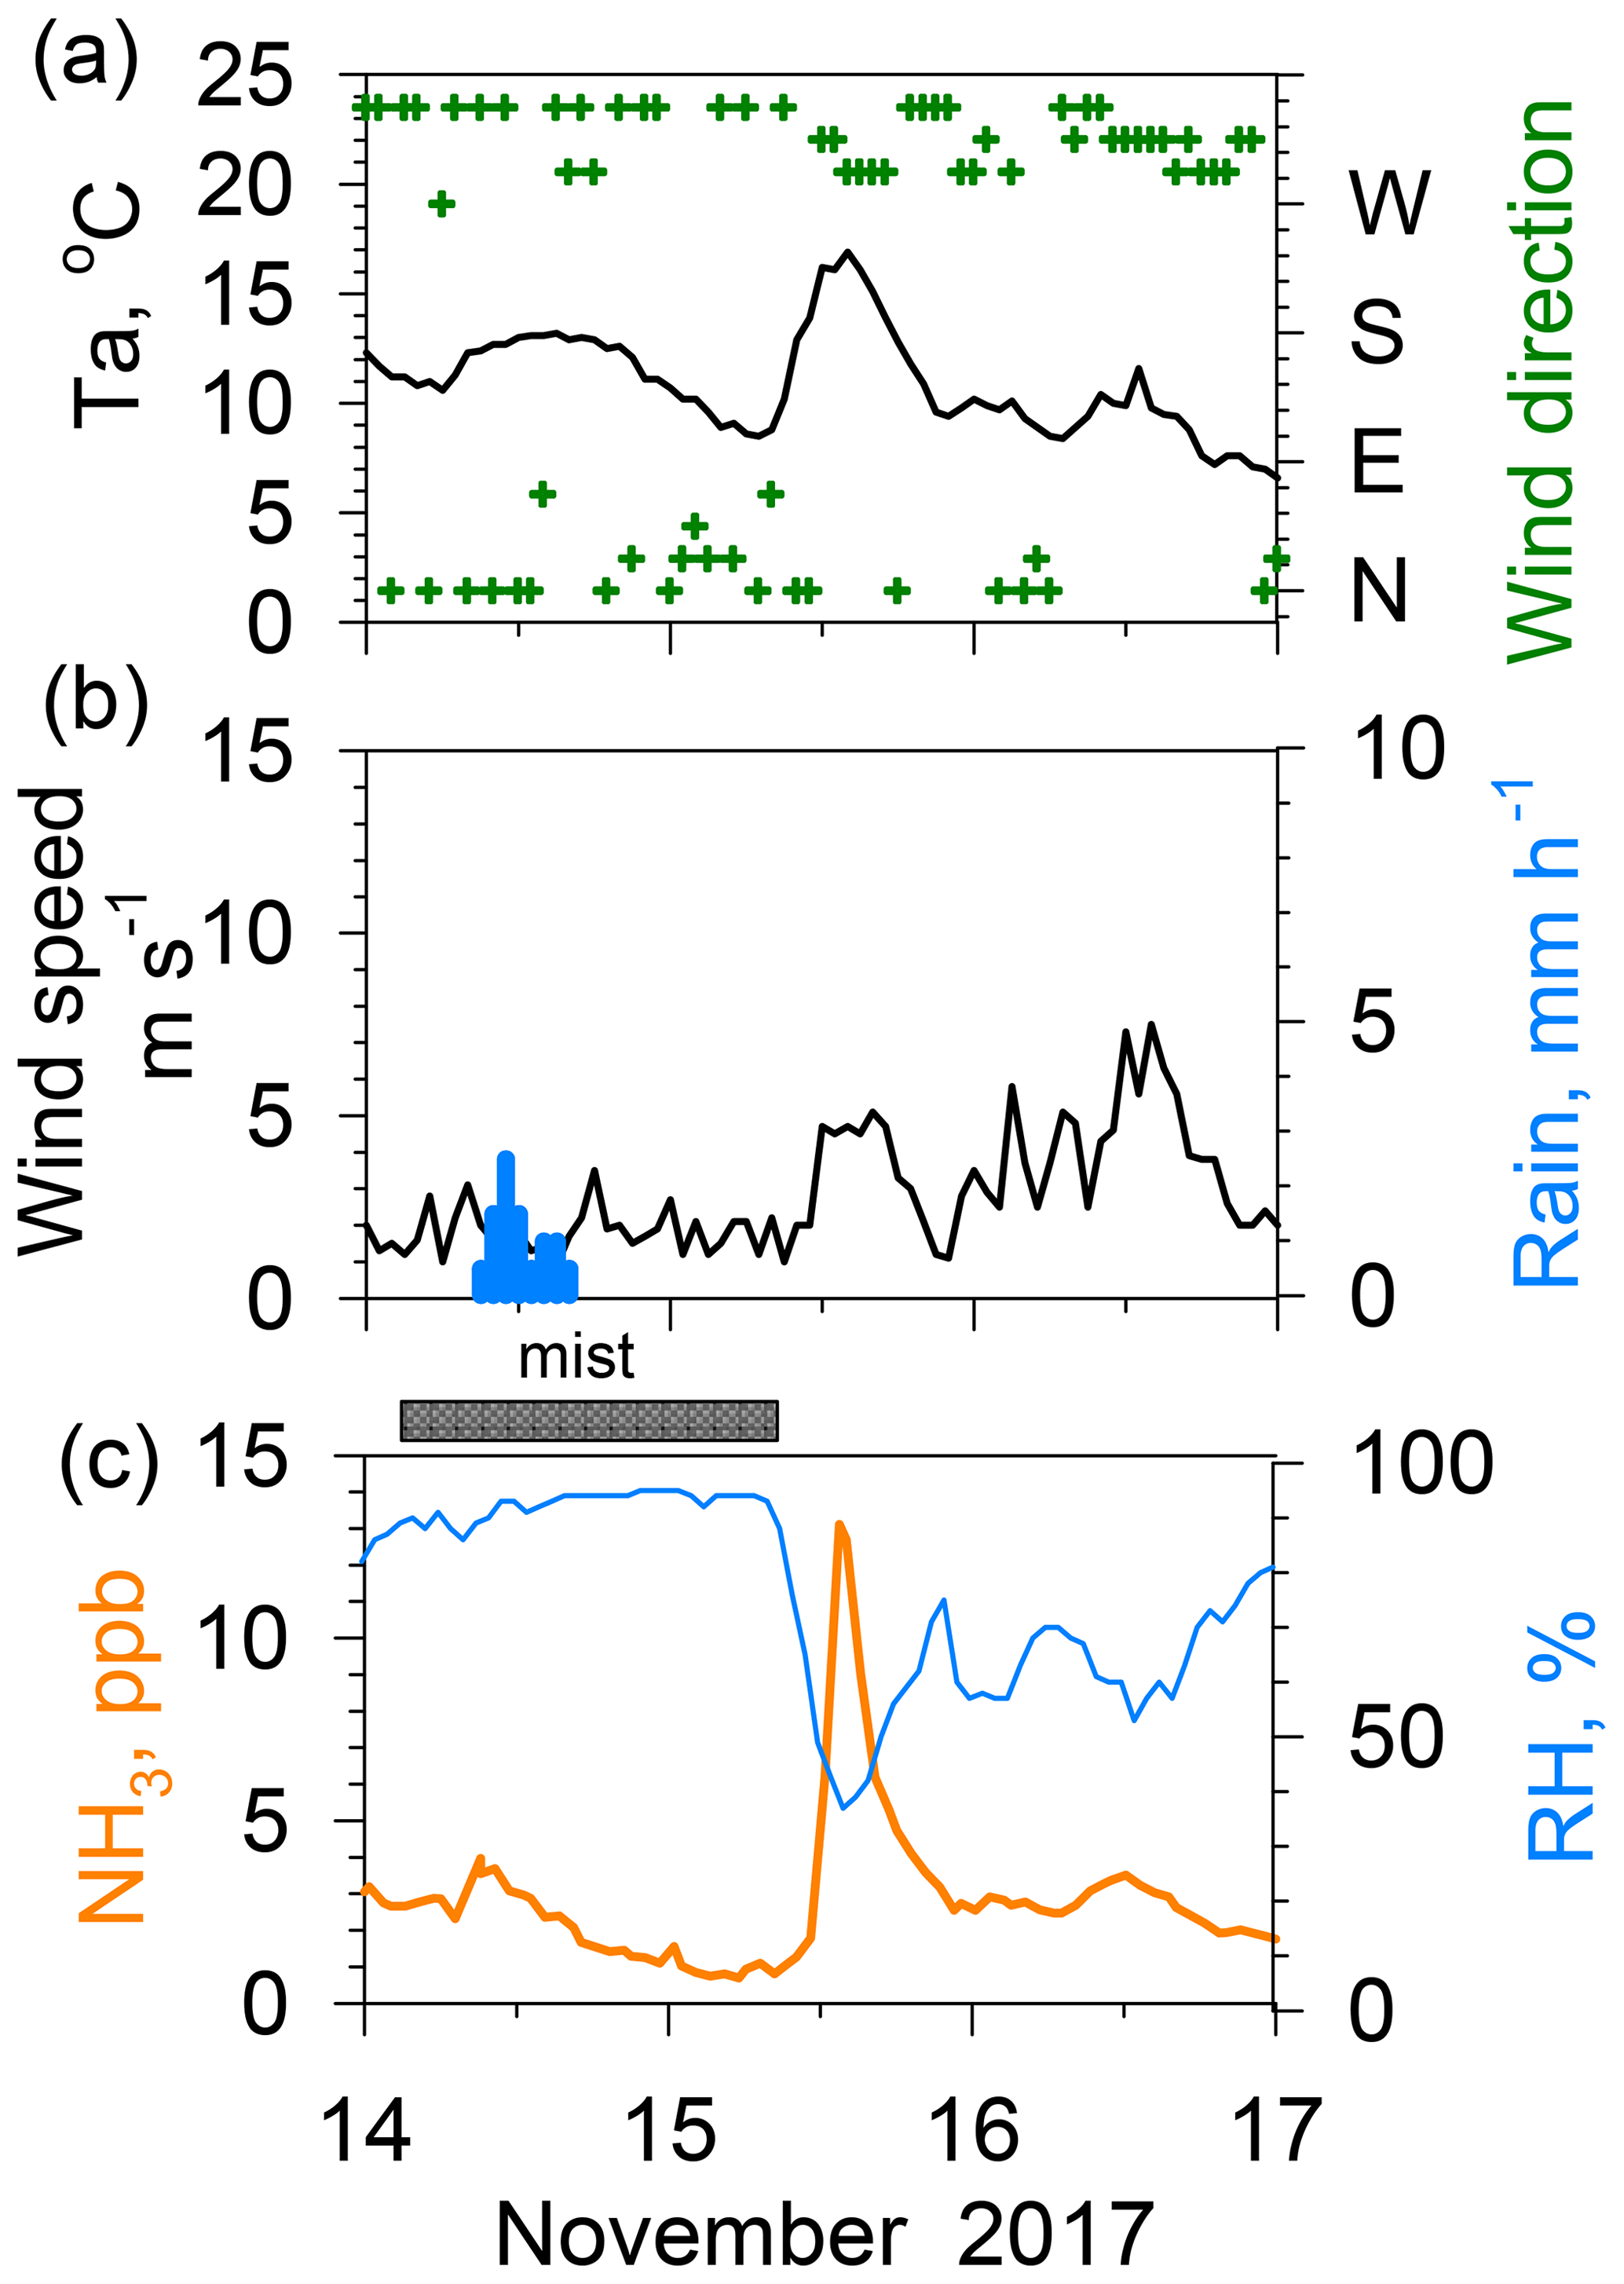
Figure 6Effects of rain–mist events on ambient NH3 concentrations during 14–17 November 2017. (a) Temperature and wind direction. (b) Wind speed and rain rate. (c) NH3 and relative humidity.
Figure 5 depicts the effects of sunshine on the morning peak of NH3 concentrations during July and August for 2018 and 2019. The left column represents the fine weather for days receiving direct sunlight longer than 10 h (clear sky for most of the day). The right column shows cloudy weather, with a sunshine duration shorter than 5 h, and daily rain of less than 3 mm. The NH3 concentration showed a strong peak at 08:00 under fine weather, although the peak concentration was slightly lower in 2019. By contrast, a strong peak was absent on the mornings of cloudy days. This trend with direct solar radiation suggests that the morning peak is attributed to plant physiological activities, such as photosynthesis or stoma opening. The importance of stomatal NH3 emissions is discussed further in Sect. 3.3.
3.2 Peak after mist evaporation
Figure 6 presents an example of a sudden increase from 2 to 13 ppb in NH3 concentration during 2 h associated with the drying mist after rain on 15 November 2017. This magnitude of NH3 increase after rain was only rarely observed during the 2 year study period. Mist is defined as reduced horizontal visibility to 1–10 km because of suspended water droplets in the atmosphere. In Nagoya, mist often occurs before or after rain. In this case, rain ceased in the early evening of 14 November, but the mist persisted until 10:00 on 15 November. Associated with relative humidity dropping sharply from ca. 90 % at 10:00 to ca. 40 % at 12:00, the mist disappeared. The NH3 concentration increased abruptly due to temporal variation in relative humidity (RH). A slight enhancement of the NH3 concentration after the rain has been described in some reports of the literature (Roelle and Aneja, 2002; Ellis et al., 2011). Those reports presented a discussion of the hypothesis on enhancements associated with the combination of an increase in the ammoniacal nitrogen concentration in the soil and diffusion from the soil to the air after the drying pore solution. However, this process requires more time after rain cessation to decrease soil moisture; then, it is too slow to raise the atmospheric NH3 concentration. In contrast, Wentworth et al. (2014, 2016) reported that a rapid increase in NH3 in the morning was attributed to the evaporation of dew containing high concentrations of with nearly neutral pH. They reported that the amount of NH3 volatilized from dew is governed by the ionic composition (an excess amount of , rather than forming less volatile salts from constituents) and pH (gas–aqueous partitioning and chemical equilibria in solution). Although the magnitude of the morning increase reported by Wentworth et al. (2016) was less than half of that of the present case, the timing and quickness of the NH3 increase was similar to those depicted in Fig. 6, suggesting that mist droplet evaporation is a major source process for high NH3. A similar rapid NH3 increase up to 15 ppb during 4 h was observed earlier on 11 December 2015 in Nagoya (Osada et al., 2018). According to an acid rain report in 2017 published by the Nagoya City Institute for Environmental Sciences (NCIES, 2018), the volume-weighted mean pH of the weekly collected rain sample from 13 to 20 November 2017 was 6.0. Based on major ionic data reported for the sample, the fraction or Frac () proposed by Wentworth et al. (2016) was estimated as being 0.14, which suggests the possibility of NH3 evaporation after the drying of the rain. However, rain was observed twice during the sampling period, namely on 14 November (9 mm) and 18 November (16.5 mm). Unfortunately, the chemical composition of rain on 14 November was not known, so a further discussion is difficult. Instead, the duration of mist after the rain might be an important factor in forming a favorable composition for releasing NH3. In fact, the duration of mist after the rain was unusually long (16 h). Therefore, ambient NH3 during the mist was able to dissolve into the droplets better. Subsequently, a large amount of NH3 was released from mist droplets after evaporation, engendering a spike in the NH3 concentration.
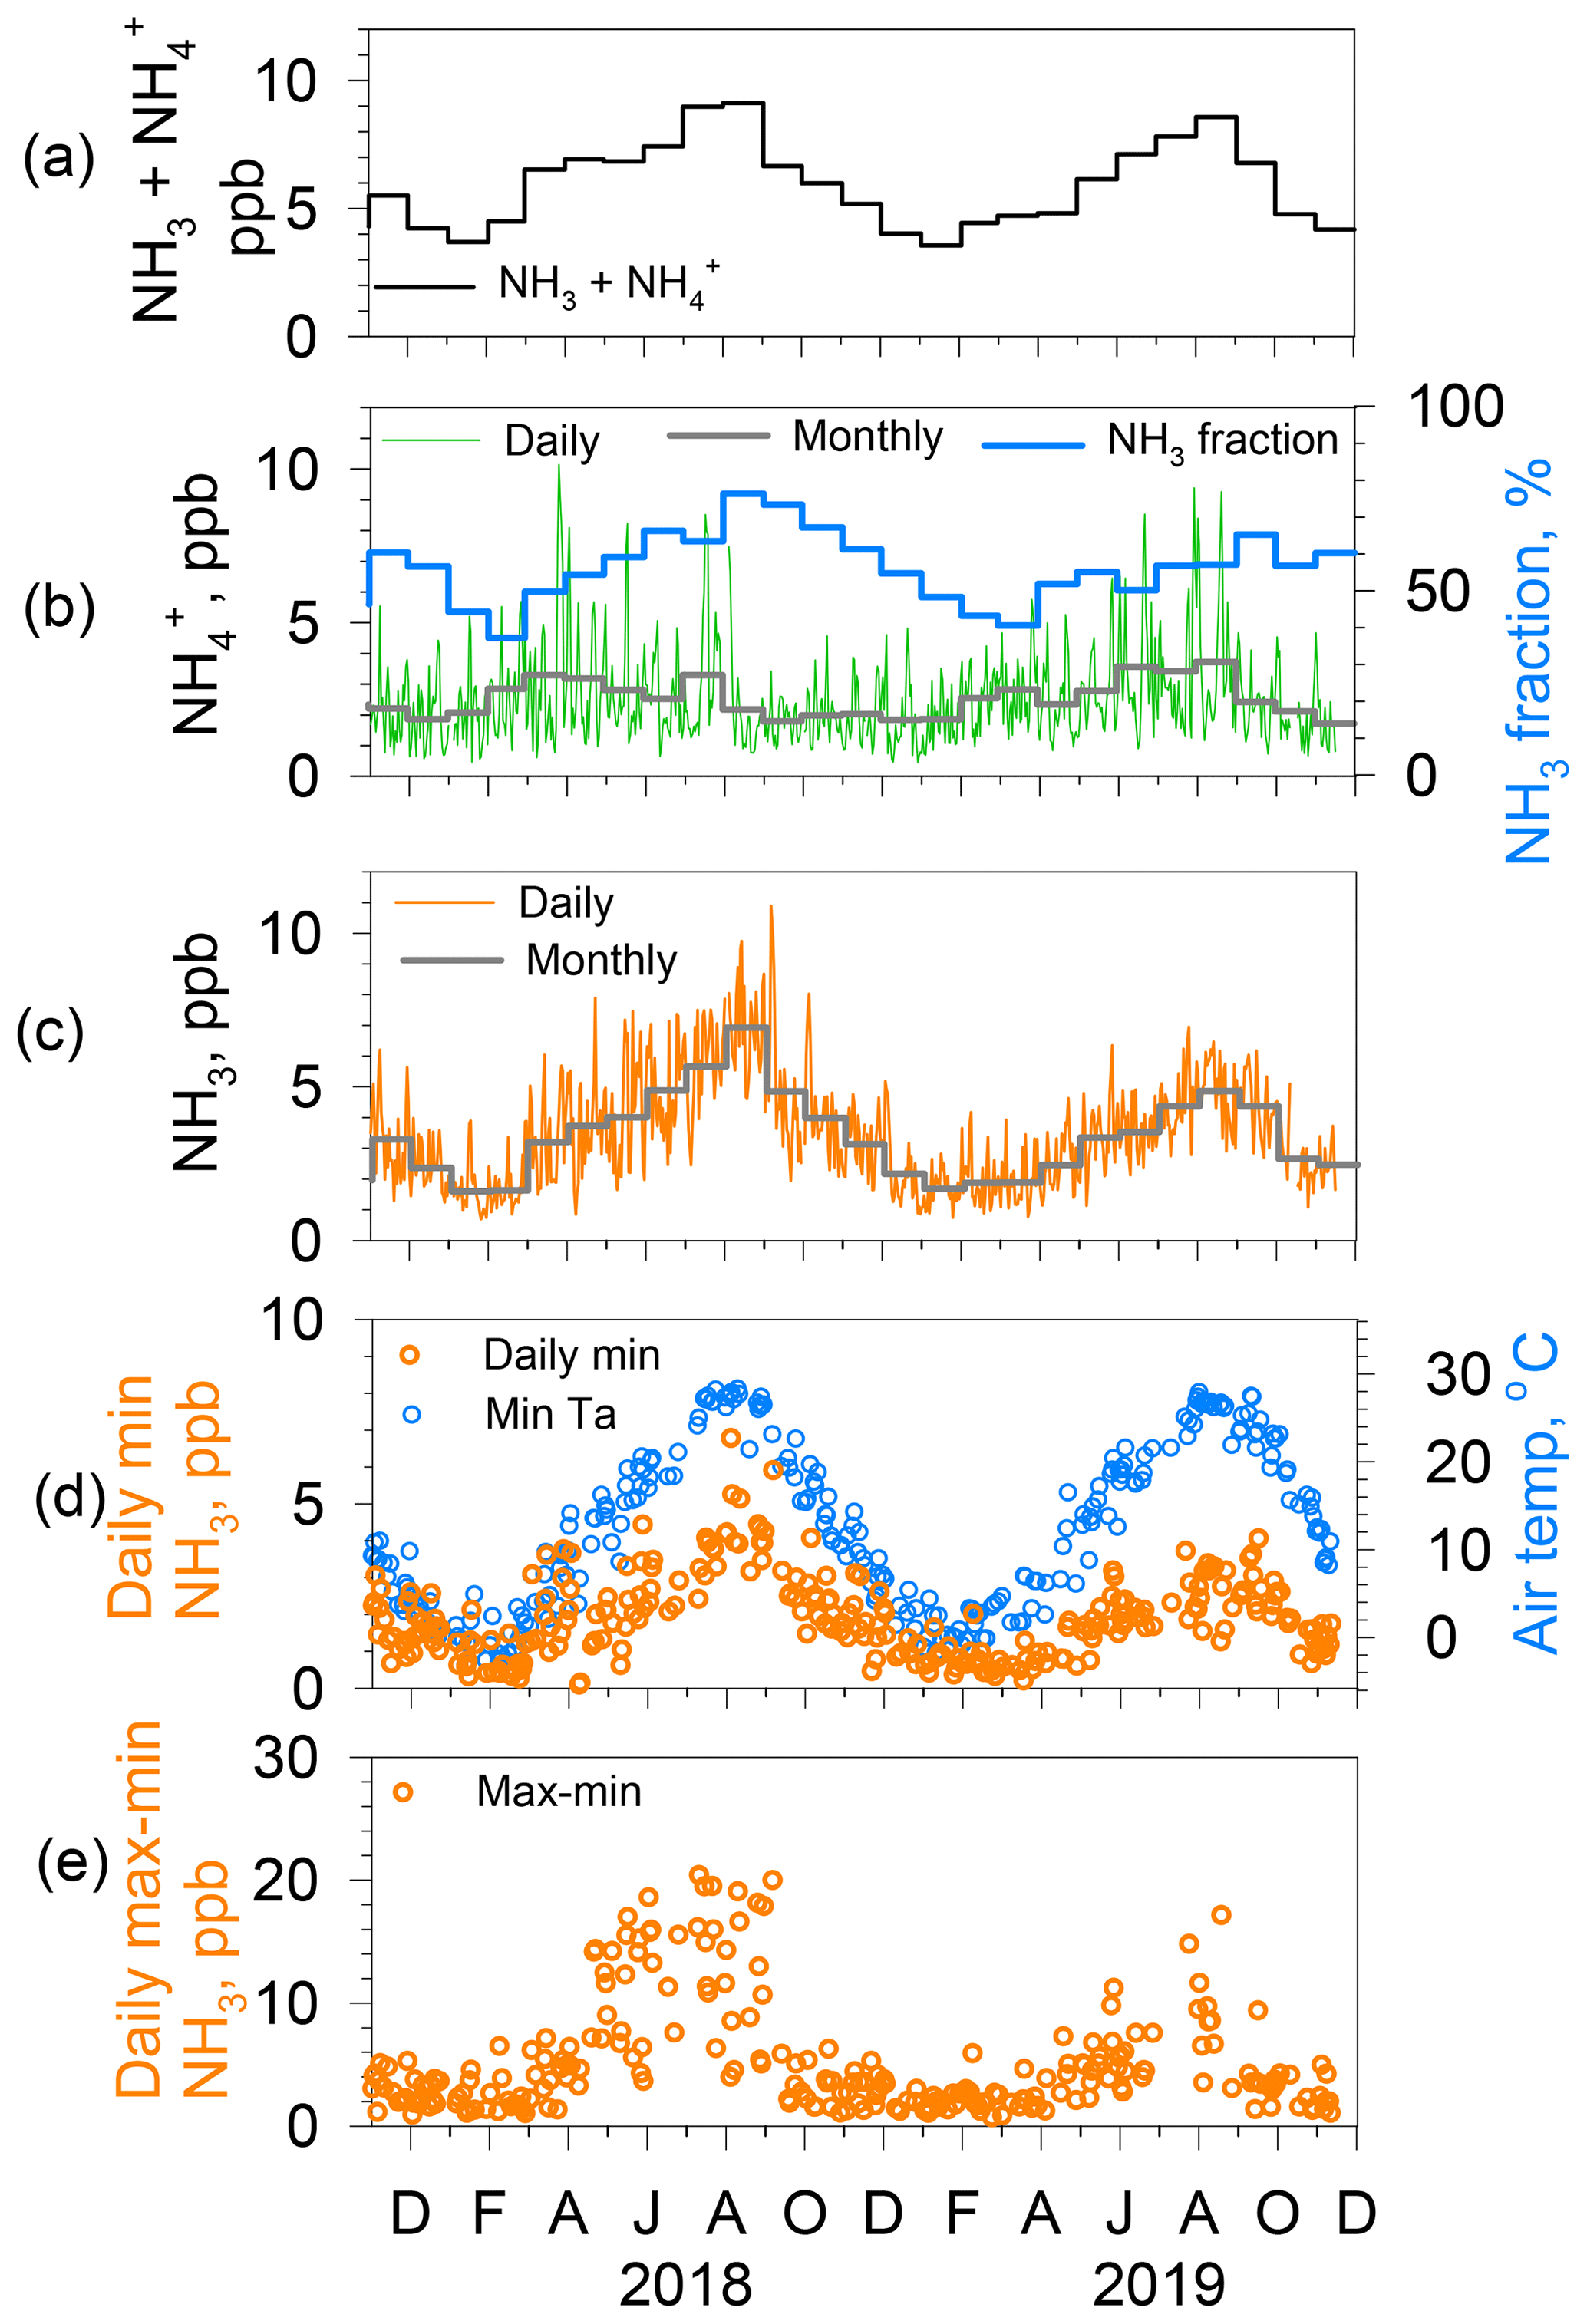
Figure 7(a) Monthly NH3 and concentrations. (b) Daily (thin green line) and monthly (thick gray line) concentrations with NH3 fraction (thick blue line) to the concentration. (c) Daily (thin orange line) and monthly (thick gray line) NH3 concentrations. (d) Daily minimum NH3 concentrations (orange circles) and minimum air temperature (blue circles) for days of both average relative humidity < 70 % and daily average wind speed < 3 m s−1. (e) Range of diurnal NH3 concentrations (max–min: orange circles) for days of both average relative humidity < 70 % and daily average wind speed < 3 m s−1.
3.3 Emissions from the tree canopy surrounding the site: relation to bird droppings
Figure 7 presents the results of a data analysis of NH3 and concentrations. Monthly NHx () concentrations (Fig. 7a) are high in summer and low in winter. Daily and monthly (Fig. 7b) concentrations show higher values from spring to summer and lower in fall and winter, whereas daily and monthly NH3 concentrations (Fig. 7c) depict clear seasonal variation, namely high in summer (maximum in August) and low in winter (minimum in January). Amplitudes of seasonal variations in NH3 are larger than those of . Consequently, NH3 controls the seasonal variation in the NH3 fraction (Fig. 7b), with ca. 60 %–75 % in late summer (maximum in August–September) and 40 %–50 % in late winter to early spring (minimum in February and March). For the NH3 concentration, the monthly minimum (1.6 ppb) in January 2018 was almost equal to that (1.7 ppb) in January 2019, although the monthly maximum (7.0 ppb) in August 2018 was higher than that (4.9 ppb) in August 2019. Furthermore, the day-to-day variation was greater in 2018 than in 2019. To examine the relation with source factors, hourly NH3 concentrations were analyzed for two subjects, namely the daily minimum and the diurnal range (maximum minus minimum) under dry (RH < 70 %) and weak wind (< 3 m s−1) conditions for days with both daily mean values. Reasons for the meteorological limitations were the following: wet surfaces on building walls, litter, soil, and leaves can act as a reservoir, which might change ambient NH3 concentration shortly after evaporation. To avoid this effect, the daily average of relative humidity was set to below 70 % for extraction as nonwet days. As Figs. 2 and 3 show, the wind speed exhibited a strong effect on local source dilution. Therefore, a day of weak wind was selected to illustrate a stronger effect of the local source.
The daily minimum NH3 concentrations are shown together with the daily minimum air temperature (Fig. 7d). As briefly described earlier for Fig. 3, day-to-day variations in the daily minimum NH3 concentration in December covaries with the baseline trend in daily minimum temperature. Analogous to this, the seasonal variation in daily minimum NH3 concentrations closely follows the seasonal variation in the daily minimum temperature, which is high in summer, with larger variation, and low in winter, with less variation during the month. Monthly averages of daily minimum NH3 concentrations were higher in the summer of 2018 (ca. 4 ppb) than those of 2019 (ca. 2.8 ppb), but almost identical values (0.7–1 ppb) were obtained for the respective winters. Daily minimum values of concentration and temperature were usually observed in the early morning before sunrise (Fig. 4). Although vertical profiles of NH3 concentration and meteorological parameters were not available, the ambient NH3 at the time of the daily minimum is presumably derived from a local origin under low wind. The NH3 in the air is equilibrated with the local surfaces of plants and soils. Stomata of plants do not open before sunrise. Therefore, stomatal gas exchange is expected to be negligible before sunrise. Furthermore, plant surfaces are less effective as reservoirs because RH < 70 %. However, pore water or moisture in soil can remain. That moisture might act as a bidirectional exchange source of NH3. For NH3 equilibrium between soil pore water and air, known as a compensation point, important parameters aside from the atmospheric NH3 level include the temperature, pH, and concentrations in the solution (Farquhar et al., 1980). We discuss more details related to this point later, using Fig. 8b.

Figure 8(a) Scatter plot showing the maximum NH3 concentration and average air temperatures for days on which the average relative humidity is below 70 % and the daily average wind speed is below 3 m s−1. (b) Scatter plot showing daily minimum NH3 concentration and minimum air temperature for days on which the average relative humidity is below 70 % and the daily average wind speed is below 3 m s−1. Green and gray curves show compensation points for temperature using Γ values shown in the panels.
Another point is the analysis of the amplitude of diurnal variation as the difference between the maximum and minimum of the day, denoted as daily max–min (Fig. 7e). As anticipated from the difference between summer and winter in daily NH3 variations portrayed in Fig. 4, the daily max–min values were larger in warm months than in cold months. The daily max–min values were found to be quite large in summer (12.8 ppb as averages during July–August in 2018 and 9.2 ppb in 2019) and small in winter (2.3 ppb as the average during January–February in 2018 and 2.2 ppb in 2019). The increase in the daily max–min values began around May and ended gradually in September for these years. The timing of the start and the end for the large amplitude implies a connection with the leaf growth stage of deciduous trees around the site. Although the evergreen trees (Quercus glauca, Pinus, Machilus thunbergii, etc.) are mixed, deciduous trees (Quercus variabilis, Zelkova serrata, Japanese cherry, Liquidambar, Metasequoia glyptostroboides, Aphananthe aspera, etc.) grow in the small forest (ca. 380×30 m) near the site. Figure 1c and d, respectively, show the tree belt and autumn leaves at the front of the building.
To study the emission potential of NH3 from various reservoirs (i.e., apoplastic fluid of plants and soil pore water), the compensation point model is applied for comparison by estimation from temperature and thermodynamic equilibrium among various surfaces and the atmosphere. The compensation point (X) is predicted as the following:
Therein, T denotes the surface reservoir temperature in Kelvin, Γ represents the emission potential equal to the concentration ratio between [] and [H+] in the surface reservoir (Γ= [] ∕ [H+]), and X is given in units of parts per billion or in nanamoles per mole (Nemitz et al., 2004). Greater emission potential represents higher equilibrium NH3 concentration with the surface for the same temperature. Higher temperature raises the equilibrium NH3 concentration, which is present as the gas phase.
Apoplastic fluid in the stomata of plants and pore water in soil are assumed as being the major reservoirs of . To equilibrate apoplastic fluid with ambient atmosphere, stomata must be opened, which is regulated by the plant physiology related to photosynthesis. Consequently, daily maximum NH3 concentrations were observed at about 2–4 h after sunrise. In other words, the initial stage of stomata opening is synchronized well with the timing of the morning increase. The daily maximum NH3 concentrations are shown versus the average air temperature of the day (Fig. 8a). Leaf temperatures were not measured for this study. The ambient temperature was used as a surrogate for leaf temperature. In Fig. 8a, two hypothetical compensation curves are also shown using Γ of 1500 and 200. At air temperatures higher than about 10–15 ∘C, most observed data are shown between these two curves, suggesting that the Γ of the forest canopy around the site is in the range of 200–1500. According to the literature related to compensation points (Massad et al., 2010; Zhang et al., 2010; Hrdina et al., 2019), Γ was several tenths to 105, depending on the type of ground, vegetation, and richness of reactive nitrogen available for plants. For the stomatal emission potential of NH3, the range of 300–3000 for trees of deciduous and evergreen forests was proposed by Zhang et al. (2010). A similar range of values was listed by Massad et al. (2010).
Furthermore, daily minimum NH3 concentrations are shown versus the minimum air temperature of the day (Fig. 8b). As described earlier, the condition observed for daily minimum NH3 concentration is related to the emission potential from soil around the site because stomatal emissions are negligible. Although soil temperatures were not measured for this study, the minimum air temperature was used as a surrogate for nighttime soil temperatures. In Fig. 8b, two hypothetical compensation curves are shown using Γ of 500 and 200. Observed data were in the range of the hypothetical compensation curves only for minimum air temperatures higher than 20 ∘C. Below 20 ∘C, most observed data were over the curve for Γ of 500. Two possibilities can be considered for these relations. One is that higher Γ for soil is responsible for the winter values because litter from deciduous trees can be decomposed by microbial activity. In addition, subsequent production raised Γ higher than 500. Another possibility is that the contribution from vehicular emissions was enhanced by stagnant air pollution in winter (Yamagami et al., 2019).
As shown separately in Fig. 8, concentrations of NH3 in the summer of 2018 were higher than those of 2019 when compared with the same temperature. Γ for the canopy of a site varies with various parameters such as seasonal variation in the plants' stages of growth and supply of reactive nitrogen (Schjoerring et al., 1998, 2000; Massad et al., 2010). Senescent and mature leaves have a high potential for NH3 emissions (Mattsson and Schjoerring, 2003). For deciduous trees related to the present study, new leaves start to grow in April; they mature after June. They turn red in November. The duration of active leaves of deciduous trees roughly accords with the season of the higher daily max–min portrayed in Fig. 7e. However, the values of the daily max–min in summer differed between 2018 and 2019, with no great change in trees on the campus. As discussed in Sect. 3.1, the dry deposition of NH3 is controlled by surface conditions of the soil and cuticular plant surfaces. In the analyses shown in Figs. 7 and 8, drier days were selected, excluding the complexity of wet processes for NH3 exchange between air and various surfaces. In addition, leaf conditions of trees and weeds were almost identical for these years, suggesting that conditions of NH3 dry deposition did not change. In addition, micrometeorological factors govern the transfer velocity that ultimately determines the magnitude of the NH3 exchange. Unfortunately, the meteorological data required for estimating the transfer velocity were not available in this study. Further data for flux estimations are necessary to evaluate NH3 exchange in urban areas. Nonetheless, important suggestions can be made for potential source variation at the site. As input to the system, the amount of reactive nitrogen brought by wet deposition (rain) varies slightly from year to year. According to annual reports of acid rain (NCIES, 2019; 2020), monthly average wet depositions of during May–September were 2.3 mmol m−2 in 2018 and 2.0 mmol m−2 in 2019. Similarly, monthly average wet depositions of during May–September were 2.9 mmol m−2 in 2018 and 2.4 mmol m−2 in 2019. Wet deposition of these species during warm months was slightly (ca. 15 %) higher in 2018 than in 2019. However, the observed differences (ca. 30 %) in the average daily max–min between 2018 and 2019 were almost double those in the wet deposition, requiring more input to explain yearly discrepancies.
To seek more input to the system, the importance of bird droppings at the site is discussed below. From June or July through September or October, the rooftops of buildings and trees on the campus are used frequently by more than several hundred crows for preroosting assembly or flight line assembly in the early evening before going to roost in nests located on or presumably near the campus. Normally, a murder of crows stays a short time (mostly less than 2 h). They then leave to their primary roost area (Nakamura, 2004). More crows gathered in the murder in summer in 2018 than in 2019, which is regarded as the number density of white fecal remains in photographs under trees at the front of the building (see Appendix Fig. A1).
Bird droppings are rich in reactive nitrogen. The nitrogen contents in the dry weight of droppings are 3.5 % for chicken (Nakamura and Yuyama, 2005) and 4.7 % for crows (Fujita and Koike, 2007). The major reactive nitrogen of bird droppings is uric acid, which is readily transformed into by microbial activity in the soil. It is later incorporated and used by plants through the roots. To evaluate the effects of bird droppings at the site, the flux of reactive nitrogen added by bird droppings over the unit area (Fluxbd, mol m−2 d−1) is estimated as shown below.
In that equation, Freq. (number m−2 d−1) represents the input frequency of the excreta shot per day over unit area, W (g shot−1) stands for the dry weight of excreta per excreta shot, R (%) denotes the nitrogen content per dry excreta weight, and 14 is the atomic weight of nitrogen for conversion. For simplicity, the following values are used to estimate Fluxbd: Freq. is once per day per square meter, W is 1 g per shot, and R is 4.7% (Fujita and Koike, 2007). Evaluating the relevance to the assumptions is difficult, but it is believed to be the best guess from the dropping situations observed around the building (Fig. A1). The estimated result is 3.4 mmol m−2 d−1, which is converted to ca. 100 mmol m−2 month−1. This value is nearly 40 times higher than the flux by rain. Fluxbd includes a large uncertainty depending on the number of crows gathered and their behavior on the campus. However, it is useful for a comparison with the reactive nitrogen flux by rain. Even assuming that Freq. is one-tenth of the initial assumption above (0.1 number m−2 d−1), Fluxbd is still larger than the flux from rain. In this study, the dense area of bird droppings was not so large on the campus. However, the excess inputs of reactive nitrogen brought by crows to a small area might engender strong local emissions of NH3 from the soil and through the forest canopy. Indeed, Fujita and Koike (2007) pointed out that jungle crows brought substantial amounts of nutrients to their roost of fragmented forests in an urban area. Populations of crows and the distribution of crow roosts vary with food availability and the trees for sleeping and breeding. Crows have adapted well to urban areas. For that reason, their populations are often increasing in urban areas worldwide (Ueta et al., 2003; Vuorisalo et al., 2003). Through the increase in bird droppings, reactive nitrogen in urban small forests is oversaturated for tree growth and excess nitrogen is emitted as NH3 from the tree canopy. Vegetation in urban environments tends to catch and concentrate gaseous and particulate reactive nitrogen pollutants and to supply them to the ground surface (Decina et al., 2020). The present study yielded a particularly important point, which is that this process is bidirectional for NH3.
Hourly measurements of NH3 and were conducted from November 2017 through October 2019 in Nagoya, central Japan. Monthly average NH3 concentrations were high in summer (7.0 and 4.9 ppb, respectively, for August in 2018 and 2019) and low in winter (1.6 and 1.7 ppb for January 2018 and 2019, respectively). During the study period, a surge event (11 ppb during 2 h) was observed after mist evaporation during daytime, which was very rare at Nagoya, even though the evaporation of mist or fog droplets is expected to be frequent after rain. A plausible condition of the surge event was discussed in terms of the composition and pH of rain. The amplitude of diurnal variation in the NH3 concentration (daily maximum minus minimum) was small (ca. 2 ppb) in winter and large (ca. 10 ppb) in summer. The daily max–min increased from late spring, synchronized with new leaf growth, and peaked in summer during the intense addition of droppings from hundreds of crows assembled on trees and rooftops near the site before going to their roosts. Large diurnal variation in NH3 concentration was characterized by a peak at 2–4 h after sunrise. In summer, the peak NH3 concentration at around 08:00 under fine weather was larger than that under cloudy weather, suggesting that receiving direct sunlight is important for boosting the morning peak. The timing of the seasonal and daily increases in the morning NH3 peak implies that reactive nitrogen inputs from crow droppings and rain increased NH3 emissions from the tree canopy. Preliminary estimates suggest that reactive nitrogen input by crow droppings was greater than the effect of wet deposition. Therefore, crow populations are increasing in some urban areas through adaptation. Reactive nitrogen supplied by crow droppings might become an increasingly important source of NH3 emissions in urban areas.
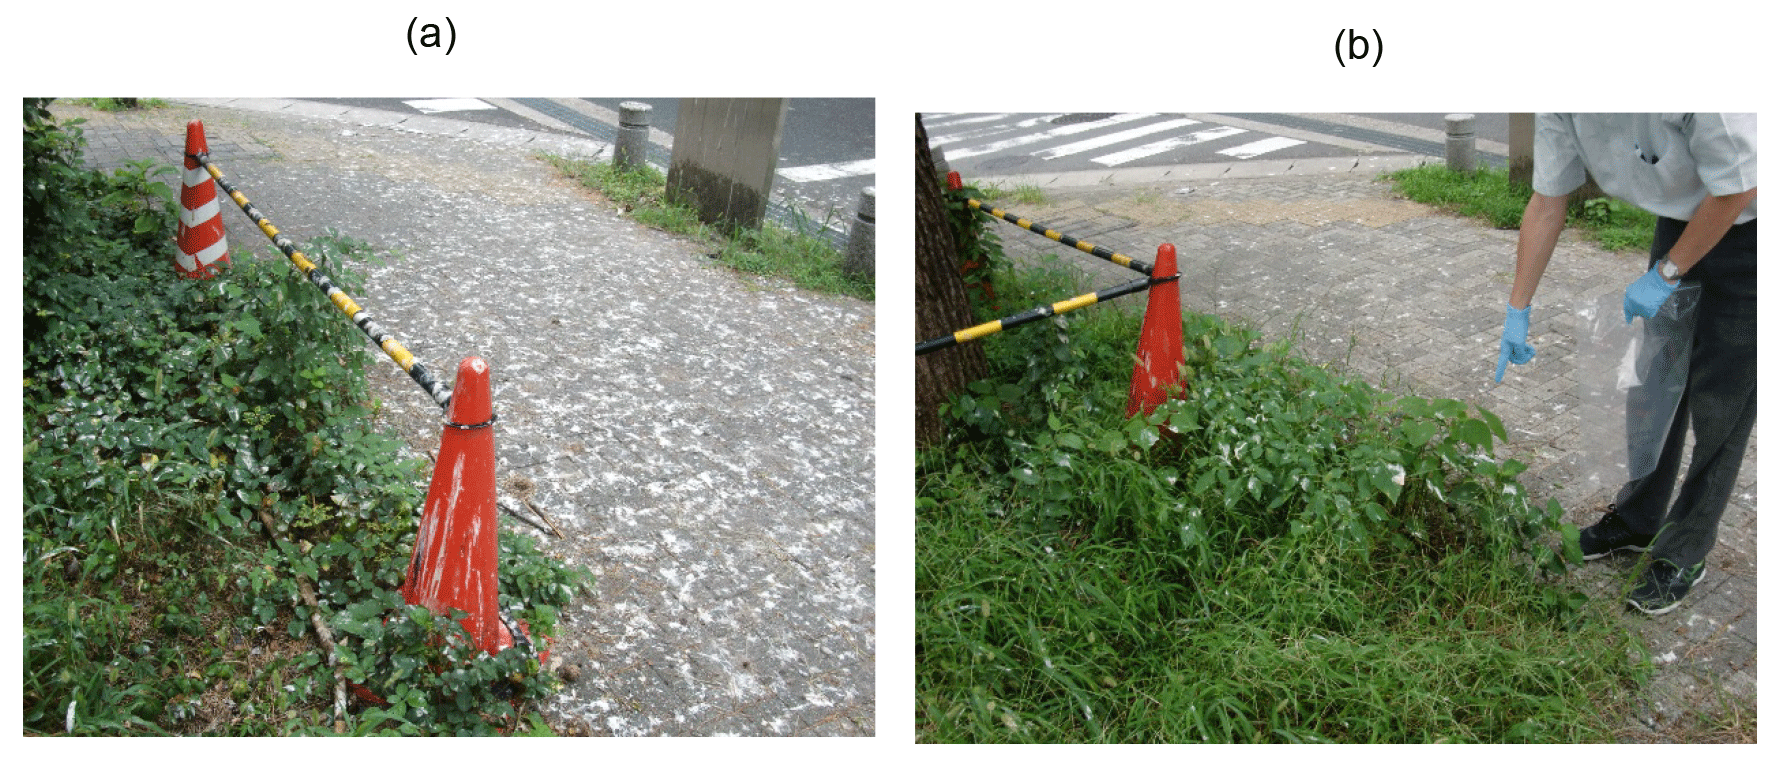
Figure A1Crow droppings (photographs taken at the same place on a 28 July 2018; b 17 October 2019) in front of the Environmental Studies Hall of Nagoya University.
The NHx and other data used in Figs. 2–8 are available from the NAGOYA Repository: http://hdl.handle.net/2237/00032615 (Osada, 2020).
The supplement related to this article is available online at: https://doi.org/10.5194/acp-20-11941-2020-supplement.
The author declares that there is no conflict of interest.
Yasuhiro Hirano for the discussions on soil pH and reactive nitrogen from bird colonies. The constructive comments from the two anonymous referees are also greatly appreciated.
This research was supported by the Environment Research and Technology Development Fund (grant no. 5-1604) of the Environmental Restoration and Conservation Agency.
This paper was edited by Barbara Ervens and reviewed by two anonymous referees.
Asman, W. A., Pinksterboer, E. F., Maas, H. F., Erisman, J. W., Waijers-Ypelaan, A., Slanina, J., and Horst, T. W.: Gradients of the Ammonia Concentration in a Nature Reserve: Model Results and Measurements, Atmos. Environ. 23, 2259–2265, 1989.
Behera S. N., Sharma M., Aneja V. P., and Balasubramanian R.: Ammonia in the atmosphere: a review on emission sources, atmospheric chemistry and deposition on terrestrial bodies, Environmental Science and Pollution Research International, 20, 8092–8131, 2013.
Blackall, T. D., Wilson, L. J., Theobald, M. R., Milford, C., Nemitz, E., Bull, J., Bacon, P. J., Hamer, K. C., Wanless, S., and Sutton, M. A.: Ammonia emissions from seabird colonies, Geophys. Res. Lett., 34, L10801, https://doi.org/10.1029/2006GL028928, 2007.
Croft, B., Wentworth, G. R., Martin, R. V., Leaitch, W. R., Murphy, J. G., Murphy, B. N., Kodros, J. K., Abbatt, J. P. D., and Pierce, J. R.: Contribution of Arctic seabird-colony ammonia to atmospheric particles and cloud–albedo radiative effect, Nat. Comm., 7, 13444, https://doi.org/10.1038/ncomms13444, 2016.
Decina, S. M., Ponette, A. G., and Rindy, J. E.: Urban tree canopy effects on water quality via inputs to the urban ground surface, in: Forest–Water Interactions, edited by: Levia, D., Carlyle-Moses, D., Iida, S., Michalzik, B., Nanko, K., and Tischer, A., Ecological Studies, Springer, Cham, vol. 240, https://doi.org/10.1007/978-3-030-26086-6, 2020.
Dockery, D. W., Pope, C. A., Xu, X., Spengler, J. D., Ware, J. H., Fay, M. E., Ferris, B. G., Jr, and Speizer, F. E.: An association between air pollution and mortality in six US cities, New Engl. J. Med., 329, 1753–1759, 1993.
Ellis, R. A., Murphy, J. G., Markovic, M. Z., VandenBoer, T. C., Makar, P. A., Brook, J., and Mihele, C.: The influence of gas-particle partitioning and surface-atmosphere exchange on ammonia during BAQS-Met, Atmos. Chem. Phys., 11, 133–145, https://doi.org/10.5194/acp-11-133-2011, 2011.
Farquhar, G. D., Firth, P. M., Wetselaar, R., and Weir, B.: On the gaseous exchange of ammonia between leaves and the environment: determination of the ammonia compensation point, Plant Physiol., 66, 710–714, 1980.
Fujita, M. and Koike, F.: Bird transport nutrients to fragmented forests in an urban landscape, Ecol. Appl., 17, 648–654, https://doi.org/10.1890/06-0118, 2007.
Hansen, K., Sørensen, L. L., Hertel, O., Geels, C., Skjøth, C. A., Jensen, B., and Boegh, E.: Ammonia emissions from deciduous forest after leaf fall, Biogeosciences, 10, 4577–4589, https://doi.org/10.5194/bg-10-4577-2013, 2013.
Hojito, M., Hayashi, K., Murano, K., and Mori, A.: The Status of Atmospheric Concentrations of Ammonia in an Intensive Dairy Farming Area in Central Japan, Japanese J. Soil Sci. Plant Nutrition, 77, 53–57, 2006 (in Japanese).
Hrdina, A. H. I., Moravek, A., Schwartz-Narbonne, H., and Murphy, J. G.: Summertime Soil–Atmosphere Ammonia Exchange In The Colorado Rocky Mountain Front Range Pine Forest, Soil Systems, 3, 15, https://doi.org/10.3390/soilsystems3010015, 2019.
Hu, Q., Zhang, L., Evans, G. J., and Yao, X.: Variability of atmospheric ammonia related to potential emission sources in downtown Toronto, Canada, Atmos. Environ., 99, 365–373, 2014.
IPCC: Climate Change 2013: The Physical Science Basis. Contribution of Working Group I to the Fifth Assessment Report of the Intergovernmental Panel on Climate Change, edited by: Stocker, T. F., Qin, D., Plattner, G.-K., Tignor, M., Allen, S. K., Boschung, J., Nauels, A., Xia, Y., Bex, V., and Midgley, P. M., Cambridge University Press, Cambridge, United Kingdom and New York, NY, USA, 1535 pp., 2013.
Kean, A. J., Littlejohn, D., Ban-Weiss, G. A., Harley, R. A., Kirchstetter, T. W., and Lunden, M. M.: Trends in on-road vehicle emissions of ammonia, Atmos. Environ., 43, 1565–1570, 2009.
Kruit, R. R. W., Van Pul, W. A. J., Otjes, R. P., Hofschreuder, P., Jacobs, A. F. G., and Holtslag, A. A. M.: Ammonia fluxes and derived canopy compensation points over non-fertilized agricultural grassland in The Netherlands using the new gradient ammonia – high accuracy – monitor (GRAHAM), Atmos. Environ., 41, 1275–1287, 2007.
Kukkonen, J., Pohjola, M., Sokhi, R. S., Luhana, L., Kitwiroon, N., Fragkou, L., and Denby, B.: Analysis and evaluation of selected local-scale PM10 air pollution episodes in four European cities: Helsinki, London, Milan and Oslo, Atmos. Environ., 39, 2759–2773, 2005.
Kurosawa, R., Kanai, Y., Matsuda, M., and Okuyama, M.: Conflict between humans and crows in greater Tokyo – garbage management as a possible solution, Global Environmental Research, English edition 7, 139–148, 2003.
Massad, R.-S., Nemitz, E., and Sutton, M. A.: Review and parameterisation of bi-directional ammonia exchange between vegetation and the atmosphere, Atmos. Chem. Phys., 10, 10359–10386, https://doi.org/10.5194/acp-10-10359-2010, 2010.
Mattsson, M. and Schjoerring, J. K.: Senescence-induced changes in apoplastic and bulk tissue ammonia concentrations of ryegrass leaves, New Phytol., 160, 489–499, 2003.
Mozurkewich, M.: The dissociation constant of ammonium nitrate and its dependence on temperature, relative humidity and particle size, Atmos. Environ. 27, 261–270, 1993.
Murphy, J. G., Gregoire, P. K., Tevlin, A. G., Wentworth, G. R., Ellis, R. A., Markovic, M. Z., and VandenBoer, T. C.: Observational constraints on particle acidity using measurements and modelling of particles and gases, Faraday Discuss., 200, 379–395, 2017.
Nagoya City Institute for Environmental Sciences (NCIES): Acid rain report 2017, 26 pp., available at: https://www.city.nagoya.jp/kankyo/cmsfiles/contents/0000076/76867/H29_sanseiu_houkokusho.pdf (last access: 20 October 2020), 2018 (in Japanese).
Nagoya City Institute for Environmental Sciences (NCIES): Acid rain report 2018, 26 pp., available at: https://www.city.nagoya.jp/kankyo/cmsfiles/contents/0000076/76867/H30_sanseiuhoukoku.pdf (last access: 20 October 2020), 2019 (in Japanese).
Nagoya City Institute for Environmental Sciences (NCIES): Acid rain report 2019, 26 pp., available at: https://www.city.nagoya.jp/kankyo/cmsfiles/contents/0000076/76560/R1_sanseiuhoukoku.pdf (last access: 20 October 2020), 2020 (in Japanese).
Nakamura, M. and Yuyama, Y.: Development of a composition database for various types of biomass, Technical report of the National Research Institute of Agricultural Engineering, 203, 57–80, 2005 (in Japanese).
Nakamura, S.: Dynamics of flight line assemblies of crows in the Osaka area, Jpn. J. Ornithol., 53, 77–86, 2004 (in Japanese).
Nemitz, E., Sutton, M. A., Wyers, G. P., and Jongejan, P. A. C.: Gas-particle interactions above a Dutch heathland: I. Surface exchange fluxes of NH3, SO2, HNO3 and HCl, Atmos. Chem. Phys., 4, 989–1005, https://doi.org/10.5194/acp-4-989-2004, 2004.
Nowak, J. B., Huey, L. G., Russell, A. G., Tian, D., Neuman, J. A., Orsini, D., Sjostedt, S. J., Sullivan, A. P., Tanner, D. J., Weber, R. J., Nenes, A., Edgerton, E., and Fehsenfeld, F. C.: Analysis of urban gas phase ammonia measurements from the 2002 Atlanta Aerosol Nucleation and Real-Time Characterization Experiment (ANARChE), J. Geophys. Res., 111, D17308, https://doi.org/10.1029/2006JD007113, 2006.
Osada, K., Ueda, S., Egashira, T., Takami, A., and Kaneyasu, N.: Measurement of gaseous NH3 and particulate in the atmosphere by fluorescent detection after continuous air–water droplet sampling, Aerosol Air Qual. Res., 11, 170–178, 2011.
Osada, K., Yamagami, M., Ikemori, F., Hisatsune, K., Nakashima, H., Miwa, A., and Yabutani, S.: Sudden increase in atmospheric NH3 concentration after drying hydrometeor, J. Japan Soc. Atmos. Environ., 53, 130–135, 2018 (in Japanese).
Osada, K., Saito, S., Tsurumaru, H., and Hoshi, J.: Vehicular exhaust contributions to high NH3 and PM2.5 concentrations during winter in Tokyo, Japan, Atmos. Environ., 206, 218–224, 2019.
Osada, K.: Data of figures 2–8 in “Measurement report: Short-term variation of ammonia concentrations in an urban area increased by mist evaporation and emissions from a forest canopy with bird droppings” by Kazuo Osada, available at: http://hdl.handle.net/2237/00032615, last access: 20 October 2020.
Pandolfi, M., Amato, F., Reche, C., Alastuey, A., Otjes, R. P., Blom, M. J., and Querol, X.: Summer ammonia measurements in a densely populated Mediterranean city, Atmos. Chem. Phys., 12, 7557–7575, https://doi.org/10.5194/acp-12-7557-2012, 2012.
Perrino, C., Catrambone, M. D., Di Bucchianico, A. D. M., and Allegrini, I.: Gaseous ammonia in the urban area of Rome, Italy and its relationship with traffic emissions, Atmos. Environ., 36, 5385–5394, 2002.
Reche, C., Viana, M., Pandolfi, M., Alastuey, A., Moreno, T., Amato, F., and Querol, X.: Urban NH3 levels and sources in a Mediterranean environment, Atmos. Environ., 57, 153–164, 2012.
Riddick, S. N., Dragosits, U., Blackall, T. D., Daunt, F., Wanless, S., and Sutton, M. A.: The global distribution of ammonia emissions from seabird colonies, Atmos. Environ., 55, 319–327, 2012.
Roelle, P. A. and Aneja. V. P.: Characterization of ammonia emissions from soils in the upper coastal plain, North Carolina, Atmos. Environ., 36, 1087–1097, 2002.
Saylor, R. D., Edgerton, E. S., Hartsell, B. E., Baumann, K., and Hansen, D. A.: Continuous gaseous and total ammonia measurements from the southeastern aerosol research and characterization (SEARCH) study, Atmos. Environ., 44, 4994–5004, 2010.
Schjoerring, J. K., Husted, S., and Mattsson, M.: Physiological parameters controlling plant–atmosphere ammonia exchange, Atmos. Environ., 32, 491–498, 1998.
Schjoerring, J. K., Husted, S., Mäck, G., Nielsen, K. H., Finnemann, J., and Mattsson, M.: Physiological regulation of plant–atmosphere ammonia exchange, Plant Soil, 221, 95–102, 2000.
Seinfeld, J. H. and Pandis, S. N.: Atmospheric chemistry and physics: from air pollution to climate change John Wiley & Sons, Hoboken, New Jersey, 2016.
Shen, J., Chen, D., Bai, M., Sun, J., Coates, T., Lam, S. K., and Li, Y.: Ammonia deposition in the neighbourhood of an intensive cattle feedlot in Victoria, Australia, Sci. Rep.-UK, 6, 32793, https://doi.org/10.1038/srep32793, 2016.
Song, Q. and Osada, K.: Seasonal variation of aerosol acidity in Nagoya, Japan and factors affecting it, Atmos. Environ., 5, 1000622020, https://doi.org/10.1016/j.aeaoa.2020.100062, 2020.
Suarez-Bertoa, R., Mendoza-Villafuerte, P., Riccobono, F., Vojtisek, M., Pechout, M., Perujo, A., and Astorga, C.: On-road measurement of NH3 emissions from gasoline and diesel passenger cars during real world driving conditions, Atmos. Environ., 166, 488–497, 2017.
Sutton, M. A., Fowler, D., Burkhardt, J. K., and Milford, C.: Vegetation atmosphere exchange of ammonia: canopy cycling and the impacts of elevated nitrogen inputs, Water Air Soil Pollut., 85, 2057–2063, 1995.
Sutton, M. A., Dragosits, U., Tang, Y. S., and Fowler, D.: Ammonia emissions from non-agricultural sources in the UK, Atmos. Environ., 34, 855–869, 2000.
Sutton, M. A., Erisman J. W., Dentener F., and Möller D.: Ammonia in the environment: from ancient times to the present, Environ. Poll., 156, 583–604, 2008.
Teng, X., Hu, Q., Zhang, L., Qi, J., Shi, J., Xie, H., Gao, H., and Yao, X.: Identification of major sources of atmospheric NH3 in an urban environment in northern China during wintertime, Environ. Sci. Technol., 51, 6839–6848, 2017.
Theobald, M. R., Løfstrøm, P., Walker, J., Andersen, H. V., Pedersen, P., Vallejo, A., and Sutton, M. A.: An intercomparison of models used to simulate the short-range atmospheric dispersion of agricultural ammonia emissions, Environ. Modell. Softw., 37, 90–102, 2012.
Ueta, M., Kurosawa, R., Hamao, S., Kawachi, H., and Higuchi, H.: Population change of jungle crows in Tokyo, Global Environ. Res.-English edition, 7, 131–138, 2003.
Vuorisalo, T., Andersson, H., Hugg, T., Lahtinen, R., Laaksonen, H., and Lehikoinen, E.: Urban development from an avian perspective: causes of hooded crow (Corvus corone cornix) urbanisation in two Finnish cities, Landscape Urban Plan., 62, 69–87, 2003.
Wentworth, G. R., Murphy, J. G., Gregoire, P. K., Cheyne, C. A. L., Tevlin, A. G., and Hems, R.: Soil–atmosphere exchange of ammonia in a non-fertilized grassland: measured emission potentials and inferred fluxes, Biogeosciences, 11, 5675–5686, https://doi.org/10.5194/bg-11-5675-2014, 2014.
Wentworth, G. R., Murphy, J. G., Benedict, K. B., Bangs, E. J., and Collett Jr., J. L.: The role of dew as a night-time reservoir and morning source for atmospheric ammonia, Atmos. Chem. Phys., 16, 7435–7449, https://doi.org/10.5194/acp-16-7435-2016, 2016.
Wyers, G. P. and Erisman, J. W.: Ammonia exchange over coniferous forest, Atmos. Environ., 32, 441–451, 1998.
Yamagami, M., Ikemori, F., Nakashima, H., Hisatsune, K., and Osada, K.: Decreasing trend of elemental carbon concentration with changes in major sources at Mega city Nagoya, Central Japan, Atmos. Environ., 199, 155–163, 2019.
Zhang, L., Wright, L. P., and Asman, W. A. H.: Bi-directional air–surface exchange of atmospheric ammonia: A review of measurements and a development of a big-leaf model for applications in regional-scale air-quality models, J. Geophys. Res.-Atmos., 115, D20310, https://doi.org/10.1029/2009JD013589, 2010.