the Creative Commons Attribution 4.0 License.
the Creative Commons Attribution 4.0 License.
 | 23 Oct 2020
Northwestward cropland expansion and growing urea-based fertilizer use enhanced NH3 emission loss in the contiguous United States
Peiyu Cao
Jien Zhang
Avani Khadilkar
The increasing demands of food and biofuel have promoted cropland expansion and nitrogen (N) fertilizer enrichment in the United States over the past century. However, the role of such long-term human activities in influencing the spatiotemporal patterns of ammonia (NH3) emission remains poorly understood. Based on an empirical model and time-series gridded datasets including temperature, soil properties, N fertilizer management, and cropland distribution history, we have quantified monthly fertilizer-induced NH3 emission across the contiguous US from 1900 to 2015. Our results show that N-fertilizer-induced NH3 emission in the US has increased from <50 Gg N yr−1 before the 1960s to 641 Gg N yr−1 in 2015, for which corn and spring wheat are the dominant contributors. Meanwhile, urea-based fertilizers gradually grew to the largest NH3 emitter and accounted for 78 % of the total increase during 1960–2015. The factorial contribution analysis indicates that the rising N fertilizer use rate dominated the NH3 emission increase since 1960, whereas the impacts of temperature, cropland distribution and rotation, and N fertilizer type varied among regions and over periods. Geospatial analysis reveals that the hot spots of NH3 emissions have shifted from the central US to the Northern Great Plains from 1960 to 2015. The increasing NH3 emissions in the Northern Great Plains have been found to closely correlate to the elevated NH deposition in this region over the last 3 decades. This study shows that April, May, and June account for the majority of NH3 emission in a year. Interestingly, the peak emission month has shifted from May to April since the 1960s. Our results imply that the northwestward corn and spring wheat expansion and growing urea-based fertilizer uses have dramatically altered the spatial pattern and temporal dynamics of NH3 emission, impacting air pollution and public health in the US.
- Article
(11709 KB) - Full-text XML
-
Supplement
(1240 KB) - BibTeX
- EndNote


The tremendous increase in synthetic nitrogen (N) fertilizer uses has greatly promoted crop yields in the US since the early 20th century (Cao et al., 2018; Erisman et al., 2008). The predictable rise in food demand may lead to more N fertilizer consumption in the coming decades (Alexandratos and Bruinsma, 2012; David et al., 1997). However, 5 %–9 % of the N applied was lost to the atmosphere through ammonia (NH3) volatilization (0.5–1 Tg N annually) across the US at the beginning of this century, which lowered the N use efficiency (NUE) of crops and caused numerous environmental issues (Bouwman et al., 2002; Cassman et al., 2002; Lu et al., 2019; Tilman et al., 2002). Nationwide, synthetic N-fertilizer-induced NH3 volatilization, contributing to 15 %–30 % of annual total NH3 emission, has been identified as the second contributor to atmospheric NH3 only next to livestock production (Park et al., 2004; Paulot et al., 2014; Reis et al., 2009; US EPA, 2020). Atmospheric NH3 plays a significant role in the formation of atmospheric particulate matters (PM) and is an important component of N deposition (Behera et al., 2013), which can degrade visibility, induce respiratory and cardiovascular disease, cause eutrophication of aquatic ecosystems, cause soil acidification, and reduce biodiversity (Bowman et al., 2008; Galloway et al., 2003). Thus, to quantify fertilizer-derived NH3 emission over space and time is essential in assessing agricultural N budget and improving the accuracy of air quality modeling (Eickhout et al., 2006; Gilliland et al., 2006; Van Grinsven et al., 2015).
However, it is challenging to quantify fertilizer-induced NH3 emissions due to the paucity of information on spatially and temporally varied environmental conditions and various agricultural practices (Behera et al., 2013; Bouwman et al., 2002; Pinder et al., 2006; Sommer et al., 2004). Inverse modeling of atmospheric observations such as N deposition and satellite images has been developed as an indirect approach to estimate seasonal NH3 emissions at the regional and national scales (Gilliland et al., 2006; Liu et al., 2019)). However, this “top-down” approach has difficulty in separating the contribution of each source of NH3 emission. Process-based modeling is a popular “bottom-up” approach for quantifying spatially explicit NH3 emissions over a long period (Cooter et al., 2012; Riddick et al., 2016; Xu et al., 2019). These models require detailed information on local environmental conditions and farming practices that is generally not available. Besides, background emissions (i.e., prior to human disturbances) are always included in such modeling estimations. Another widely used bottom-up approach to estimate the single source of NH3 emission is by emission factor (EF), which represents the proportion of NH3 volatilization from N input. Compared to the constant EFs used to estimate annual NH3 emissions in early studies, more recent empirical estimations have been improved to provide seasonal estimations based on environmental conditions and agricultural management practices (Bouwman et al., 2002; Goebes et al., 2003; Huang et al., 2012; Jiang et al., 2017; Kang et al., 2016). For example, by considering three fertilizer application timings and adopting EFs that consider differences among crop types, environmental factors, and fertilizer types, Paulot et al. (2014) estimated monthly NH3 emission from N fertilizer uses in the US during 2005–2008.
While more recent top-down and bottom-up estimations have quantified the seasonality and spatial heterogeneity of NH3 emissions across the country during a short period, few studies have assessed the spatiotemporal patterns and the factorial contributions of NH3 emissions on a century scale. The lack of long-term assessment and understanding of contributing factors may limit our capability in predicting the dynamics of NH3 emission under future changes in climate, land use, and agricultural management practices (Zhu et al., 2015). The hot spots of intensive agricultural cultivation and N fertilizer uses have shifted from the southeast US to the Midwest and Northern Great Plains during the 20th Century (Cao et al., 2018; Johnston, 2014; Nickerson et al., 2011; Yu et al., 2018; Yu and Lu, 2018). It is reported that land sources of NH3 play an important role in affecting the atmospheric N deposition and PM2.5 (Du et al., 2014; Li et al., 2016; US EPA, 2020), but it remains less known how land use change and N fertilizer management history have altered NH3 emissions since 1900.
Based on spatially explicit time series of cropland distribution maps and N fertilizer management database, we adopted empirical modeling of EF to calculate monthly NH3 emissions from synthetic N fertilizer uses (hereafter, NH3 emission refers to the synthetic N fertilizer-induced NH3 emission unless specified otherwise) in the contiguous US at a resolution of 1 km × 1 km from 1900 to 2015. We examined the magnitude, spatiotemporal pattern, and seasonality of NH3 emissions at national and regional scales driven by changes in historical temperature, land use, and N fertilizer management practices. Our goals are to answer the following questions: (1) how did the NH3 emission change over space and time? (2) What roles did temperature, land use, crop rotation, and N fertilizer use play in determining the changes in NH3 emission? (3) What is the relationship between atmospheric NH deposition dynamics and NH3 emission at seasonal and annual scales?
In this study, we used a widely used residual maximum likelihood model (REML; Bouwman et al., 2002) emission factor (EF) to assess synthetic N fertilizer-induced NH3 emissions. We calculated the REML emission factors based on spatial datasets of air temperature, soil properties, crop type, N fertilizer type, and application method at a resolution of 1 km × 1 km. Our recent work has reconstructed the US state-level crop-specific N fertilizer management history with information of application timing, application method, and fertilizer types from 1900 to 2015 (Cao et al., 2018). In this study, we assigned N fertilizer use rates into exact days each year by linking fertilizer application timings with a harmonized database of crop phenology dates. The daily fertilizer input rate was then aggregated to a monthly time step. We spatialized the monthly N fertilizer use data generated above to the US 1 km gridded cropland distribution maps developed by Yu and Lu (2018). By multiplying N fertilizer use rates with EF, we obtained spatially explicit estimates of NH3 emission at a monthly time step from 1900 to 2015. For display purposes, we resampled the spatial time series of NH3 emissions to 5 km × 5 km resolution with the average NH3 emission depicted in each pixel. To represent the regional difference of NH3 emission and its impact on N deposition, we partitioned the entire contiguous US into seven regions: the Northwest (NW), the Southwest (SW), the Northern Great Plains (NGP), the Southern Great Plains (SGP), the Midwest (MD), the Southeast (SE), and the Northeast (NE) according to the US Global Change Research Program (2020) (Fig. 2).
2.1 REML model
Bouwman et al. (2002) summarized 1667 NH3 volatilization measurements in 148 research papers to assess the effects of a variety of human management practices and environmental factors on NH3 emission at a global scale. Finally, six factors including air temperature, soil pH, soil cation exchange capacity (CEC), crop type, fertilizer type, and application method are considered in the REML model to determine the EF and then calculate the NH3 emission (Eqs. 1 and 2).
In Eq. (1), EF refers to emission factor. FV refers to factor value of each key driver. The values of input data are grouped into broad classes. Tem refers to air temperature and is grouped into two classes above and below 20 ∘C. pH refers to soil pH and has four classes. CEC refers to soil CEC and has four classes. FT refers to fertilizer type, including 12 types. AM refers to N fertilizer application method, including broadcast, incorporate, solution, broadcast and then flood, and incorporate and then flood. CT refers to crop type and is classified as upland crops, grass, and flooded crops. In Eq. (2), NH3 refers to NH3 emission and N fer refers to N fertilizer use rate. More detailed grouping information and the corresponding factor value can be found in Table S1 in the Supplement.
2.2 Input data preparation
2.2.1 Temperature
We downloaded the daily temperature data from high-resolution gridded data products TS 2.1 from station observations by the Climatic Research Unit (CRU) of the University of East Anglia TS 2.1 and North America Regional Reanalysis (NARR) dataset from a combination of modeled and observed data (Mesinger et al., 2006; Mitchell and Jones, 2005). The daily temperature data were further resampled to 1 km × 1 km and aggregated to monthly average temperature.
2.2.2 Soil pH and CEC
We resampled the soil property data (pH and CEC) obtained from Geospatial Data Gateway (gSSURGO, 2020) to 1 km × 1 km resolution. Among a variety of measurements, we adopted the soil pH from ph1to1h2o_r in the attribute table, which uses the negative logarithm at base 10 of the hydrogen ion activity in the soil using the 1:1 soil-to-water ratio method. Meanwhile, we chose cec7_r in the attribute table as our soil CEC indicator, which represents the number of readily exchangeable cations that can be electrically absorbed to negative charges in the soil, soil constituent, or other material at pH 7.0, as estimated by the ammonium acetate method.
2.2.3 Cropland distribution maps
We adopted a newly developed cropland distribution and type maps of the contiguous US at a resolution of 1 km × 1 km from 1900 to 2015 to drive the REML model (Yu et al., 2018; Yu and Lu, 2018). The cropland maps were reconstructed to characterize the area, type, and distribution of cultivated land annually by harmonizing various sources of inventory data and remote sensing images. By using this database, we identified and tracked the percent of cropped land area and what crop was planted in each grid cell each year while excluding summer idle/fallow areas. Ten major crop types identified in the cropland maps and used in this study include corn, soybean, winter wheat, spring wheat, cotton, sorghum, rice, barley, durum wheat, and cropland pasture. All other crops were grouped into a category named others. They helped us put the crop-specific N fertilizer use rate, application timings, and application methods into a spatial context.
2.2.4 Crop phenology
We derived state-level crop phenology information from the USDA-NASS weekly crop progress report, which recorded the fractional acreage that has reached a given crop development stage (USDA-NASS, 2020). We linearly interpolated the weekly crop progress and identified the day at which crop development was 5 %, 15 %, 85 %, and 95 % completed. We extracted the planting and harvesting dates for all major crops except for cropland pasture. For winter wheat, we also obtained the date of dormancy breaking in the early spring (green-up) from 2014 to 2016. To gap-fill the planting date of a specific crop in a given state for missing years, we grouped states by latitude and adopted the distance-weighted interpolation (Eq. 3) using the mean date of the corresponding group.
where Date refers to the date of a given crop development stage that contains missing values, Mean refers to the mean date of the given stage of grouped states, the years i and j are the beginning and ending years of the gap, respectively, and k is the kth missing year.
The survey periods of crop progress provided by USDA-NASS vary across crops and states. For example, the data of durum wheat are available only in the years 2014 and 2015, while the data of barley started from 1996. The records of the other seven crops are available since the 1980s. To extend the crop-specific planting date records back to 1900, we adopted the approach used in the Environmental Policy Integrated Climate (EPIC) crop model (Williams et al., 1989), which considers daily heat unit accumulation (HU, Eq. 4) and heat unit index (HUI, Eq. 5) for crop phenological development estimation. It assumes that crops are ready to be planted or to break dormancy when the mean of daily maximum and minimum temperature equals the base temperature (Tb) (i.e., when HU reaches 0) and are ready to be harvested when the cumulative HU equals potential heat units (PHUs) (i.e., when HUI reaches 1). Based on the days at which 5 %, 15 %, 85 %, and 95 % crop development were completed between 1980 and 2015, we calculated the crop-specific Tb and PHU of each state with daily maximum and minimum temperature smoothed by a 7 d moving window from 1979 to 2015 for four percentages, respectively. Instead of using the temperature at planting in fall as Tb, we used the temperature at green-up in early spring as Tb for winter wheat and fall barley to obtain a more accurate estimation of harvesting dates of these two crops. The averages of Tb and PHU in the earliest five available years of each crop type in each state were applied to Eqs. (4) and (5) to calculate the dates of all four developments of all stages for the unavailable years back to 1900.
where HU is heat unit and indicates the planting date for spring-planted crops and green-up date for fall-planted crops when it reaches 0, Tmax and Tmin are daily maximum and minimum temperature in degrees Celsius, Tb is the crop-specific base temperature in degrees Celsius, and k refers to the day k.
where HUI is the heat unit index, which ranges from 0 to 1 and indicates the harvesting date when it reaches 1. PHU is the potential heat units required for harvesting, i and k are day i and day k, and j refers to crop type j.
2.2.5 Nitrogen fertilizer use dataset
The historical state-level crop-specific N fertilizer use datasets (N fertilizer use rate, N fertilizer types, and application timing) of the US were produced from our previous study (Cao et al., 2018), which includes N fertilizer use rate for 10 major crop types and others during the period 1900–2015.
We calculated the proportion of 11 major single N fertilizers in total fertilizer consumption in each state each year. They include anhydrous ammonia (AnA); aqua ammonia (AqA); ammonium nitrate (AN); ammonium sulfate (AS); nitrogen solution (NS); sodium nitrate (SN); urea; calcium nitrate (CN); diammonium phosphate (DAP); monoammonium phosphate (MAP); and ammonium phosphates (APs). All other N fertilizers were grouped into others. We assumed there is no difference in the share of fertilizer types among crop types within the same state. Thus we split state-level crop-specific N fertilizer use into 12 N fertilizer categories according to this share ratio.
We allocated annual N fertilizer use generated above to daily application by considering N fertilizer application timing (USDA-ERS, 2020) and crop phenology information (USDA-NASS, 2020). According to the USDA survey, we calculated the ratio of four application timings to annual fertilizer consumption of each crop in each state. Four application timings are fall (previous harvest), spring (before planting), at planting, and after planting. Thus, we further split annual N fertilizer use into four application timings by each crop type, each fertilizer type, and each state. We assumed that fall application occurs 1 month after harvesting, whereas before-planting and after-planting applications occur 1 month before and after planting date, respectively. Among the four dates of each crop phenological development stage (i.e., completion for 5 %, 15 %, 85 %, and 95 % area) we generated in Sect. 2.2.4, the period between the dates of 15 % and 85 % completion is the most active range. Therefore, we assumed that 80 % of N fertilizer use allocated in each application timing is applied to the active period (15 %–85 %), while the periods of 5 %–15 % and 85 %–95 % each receive 10 %. We evenly spread the N fertilizer use over every day within the corresponding period of four application timings via dividing N fertilizer use rate by the number of days. After that, we aggregated the daily application to the monthly step. More details can be found in the example shown in Table S2 and Fig. S1 in the Supplement. For winter wheat and fall barley, we allocated the use of N fertilizer after planting to the green-up stage in the following year. For cropland pasture we adopted the application timing strategy from Goebes et al. (2003), in which 1∕30 of the total N fertilizer amount is applied in January, February, October, November, and December; 1∕12 is applied in May, June, July, and August; and 1∕6 is applied in March, April, and September. Because most crops in the others group such as oil seeds, legumes, small grains, fruits, and vegetables are spring-planted crops, we used the average ratio of monthly application to annual total over eight major crops by excluding winter wheat, cropland pasture, and fall barley in each state to extract the monthly application rate of all other crops.
USDA-ERS (2020) also reported how N fertilizer was applied and the percentage of acreage that was treated with the same method of each crop in the surveyed state. We regrouped the methods of the USDA survey according to the categories of the REML model (Table S1). Specially, we assumed that broadcast and then flooded or incorporation and then flooded are only applied to rice. In addition, N fertilizer types AnA and AqA are only incorporated into the soil and NS is only applied as a solution. We calculated the planted area ratio of each application method of nine major crops of each state. We allocated N fertilizer use generated above to different application methods by using the area ratio. Thus, we generated monthly N fertilizer use rates under multiple application methods of each N fertilizer type of each crop type in each state.
Table 1Experiments designed in this study.
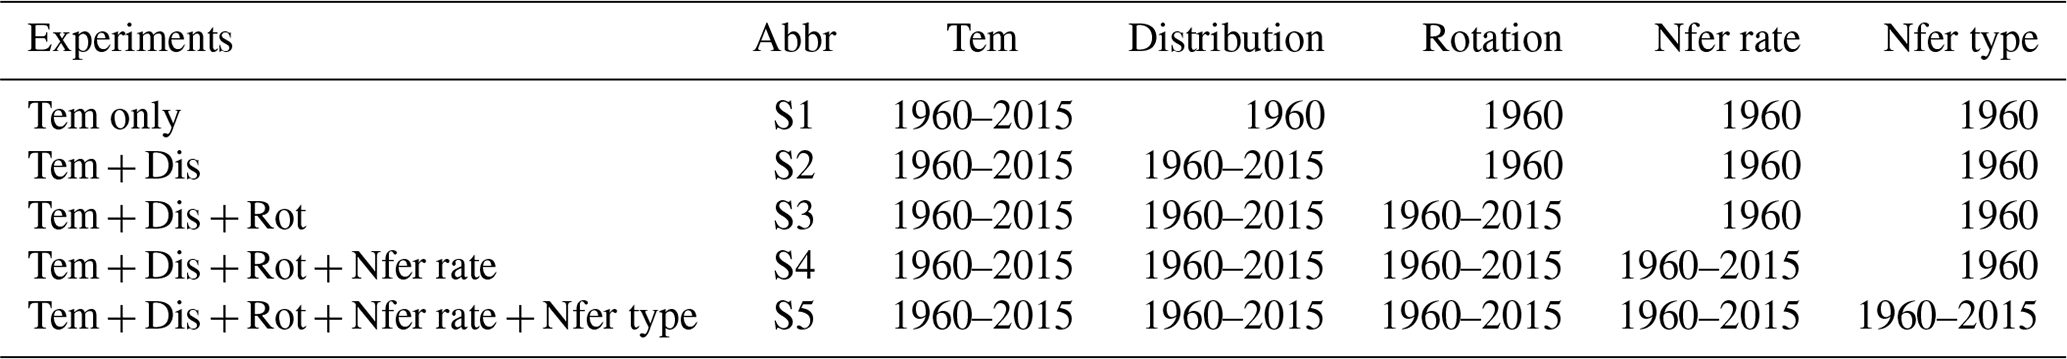
Note: Tem refers to temperature, Dis refers to cropland distribution, Rot refers to Rotation, Nfer rate refers to N fertilizer use rate, and Nfer type refers to N fertilizer type. S5 allows all the factors to change through the study period and provides the major results of this study.
Based on the US gridded crop type distribution maps developed by Yu and Lu (2018), we assigned the aforementioned monthly crop-specific N fertilizer use rate of each N fertilizer type at each timing and by each application method into each 1 km × 1 km grid cell from 1900 to 2015. In addition, we converted the N fertilizer use rate from planting-area-based (g N m−2 cropland area per year) to grid-area-based (g N m−2 land area per year) by timing the spatialized N fertilizer use rate with the corresponding cropland density maps.
2.3 Factorial contribution assessment
Environmental factors and human activities have considerable impacts on the dynamics of NH3 emissions. We set up five simulation experiments to quantify the roles of five major factors including temperature, cropland distribution, cropland rotation, N fertilizer type, and N fertilizer application rate in shaping NH3 emission since the 1960s (Table 1). The first simulation experiment (S1) was designed to mirror the temperature effect by keeping all other four factors unchanged at the level of 1960. We set up the other simulation experiments (S2–S5) by adding the annual change of cropland distribution, cropland rotation, N fertilizer use rate, and N fertilizer type successively to S1. In S2, we allowed the percentage of cropland in each grid cell to change following the prescribed input data but kept the crop type within grid cells unchanged. Conversely, in S3, the cropland percentage and type changed simultaneously through the study period. We further added annual N fertilizer use rates into S4 with N fertilizer type ratio fixed in 1960. We treated 1960 as the baseline year and ran all the simulations from 1960 to 2015. The value difference between the simulated year and 1960 in S1 was calculated to estimate the temperature effect. We calculated the differences between S2 and S1, S3 and S2, S4 and S3, and S5 and S4 to assess the impacts of cropland distribution, cropland rotation, N fertilizer rate, and N fertilizer type, respectively.
2.4 Correlation between NH3 emission and deposited NH concentration
We obtained monthly site monitoring data of precipitation NH concentration for the period 1985–2015 in the North America from the National Atmospheric Deposition Program (NADP, 2020; http://nadp.slh.wisc.edu/data/NTN/ntnAllsites.aspx, last access: 20 October 2020). After aggregating the monthly data to spring (March–June) and a full year at each site, we generated the atmospheric NH concentration maps using the inverse distance weighting interpolation method and resampled the maps to 1 km resolution to make it comparable to our estimated NH3 emission maps. The associations between fertilizer-induced NH3 emission and NH concentration in precipitation during 1985–2015 at each grid cell were examined using Pearson correlation coefficients with statistical significance at p<0.01 and p<0.001.
3.1 Historical NH3 volatilization from crops and N fertilizers
Our estimation indicates that the ratio of national NH3 emission to total N fertilizer input declined from around 5.8 % in the 1920s to below 4 % in the 1970s and then consistently rose back to 5.9 % in the 2010s (Fig. 1a). We find that NH3 emissions from synthetic N fertilizer in the US remained less than 41 Gg N yr−1 before 1950 and then sharply increased to 469 Gg N yr−1 in 1981, followed by a slower rise to 641 Gg N yr−1 by 2015 (Fig. 1a). Regionally, NH3 emissions have consistently increased since the 1960s in the Northern Great Plains and the Northwest. Whereas the NH3 emissions in the remaining regions have leveled off or slightly declined after peaking in the 1980s (Fig. 2).
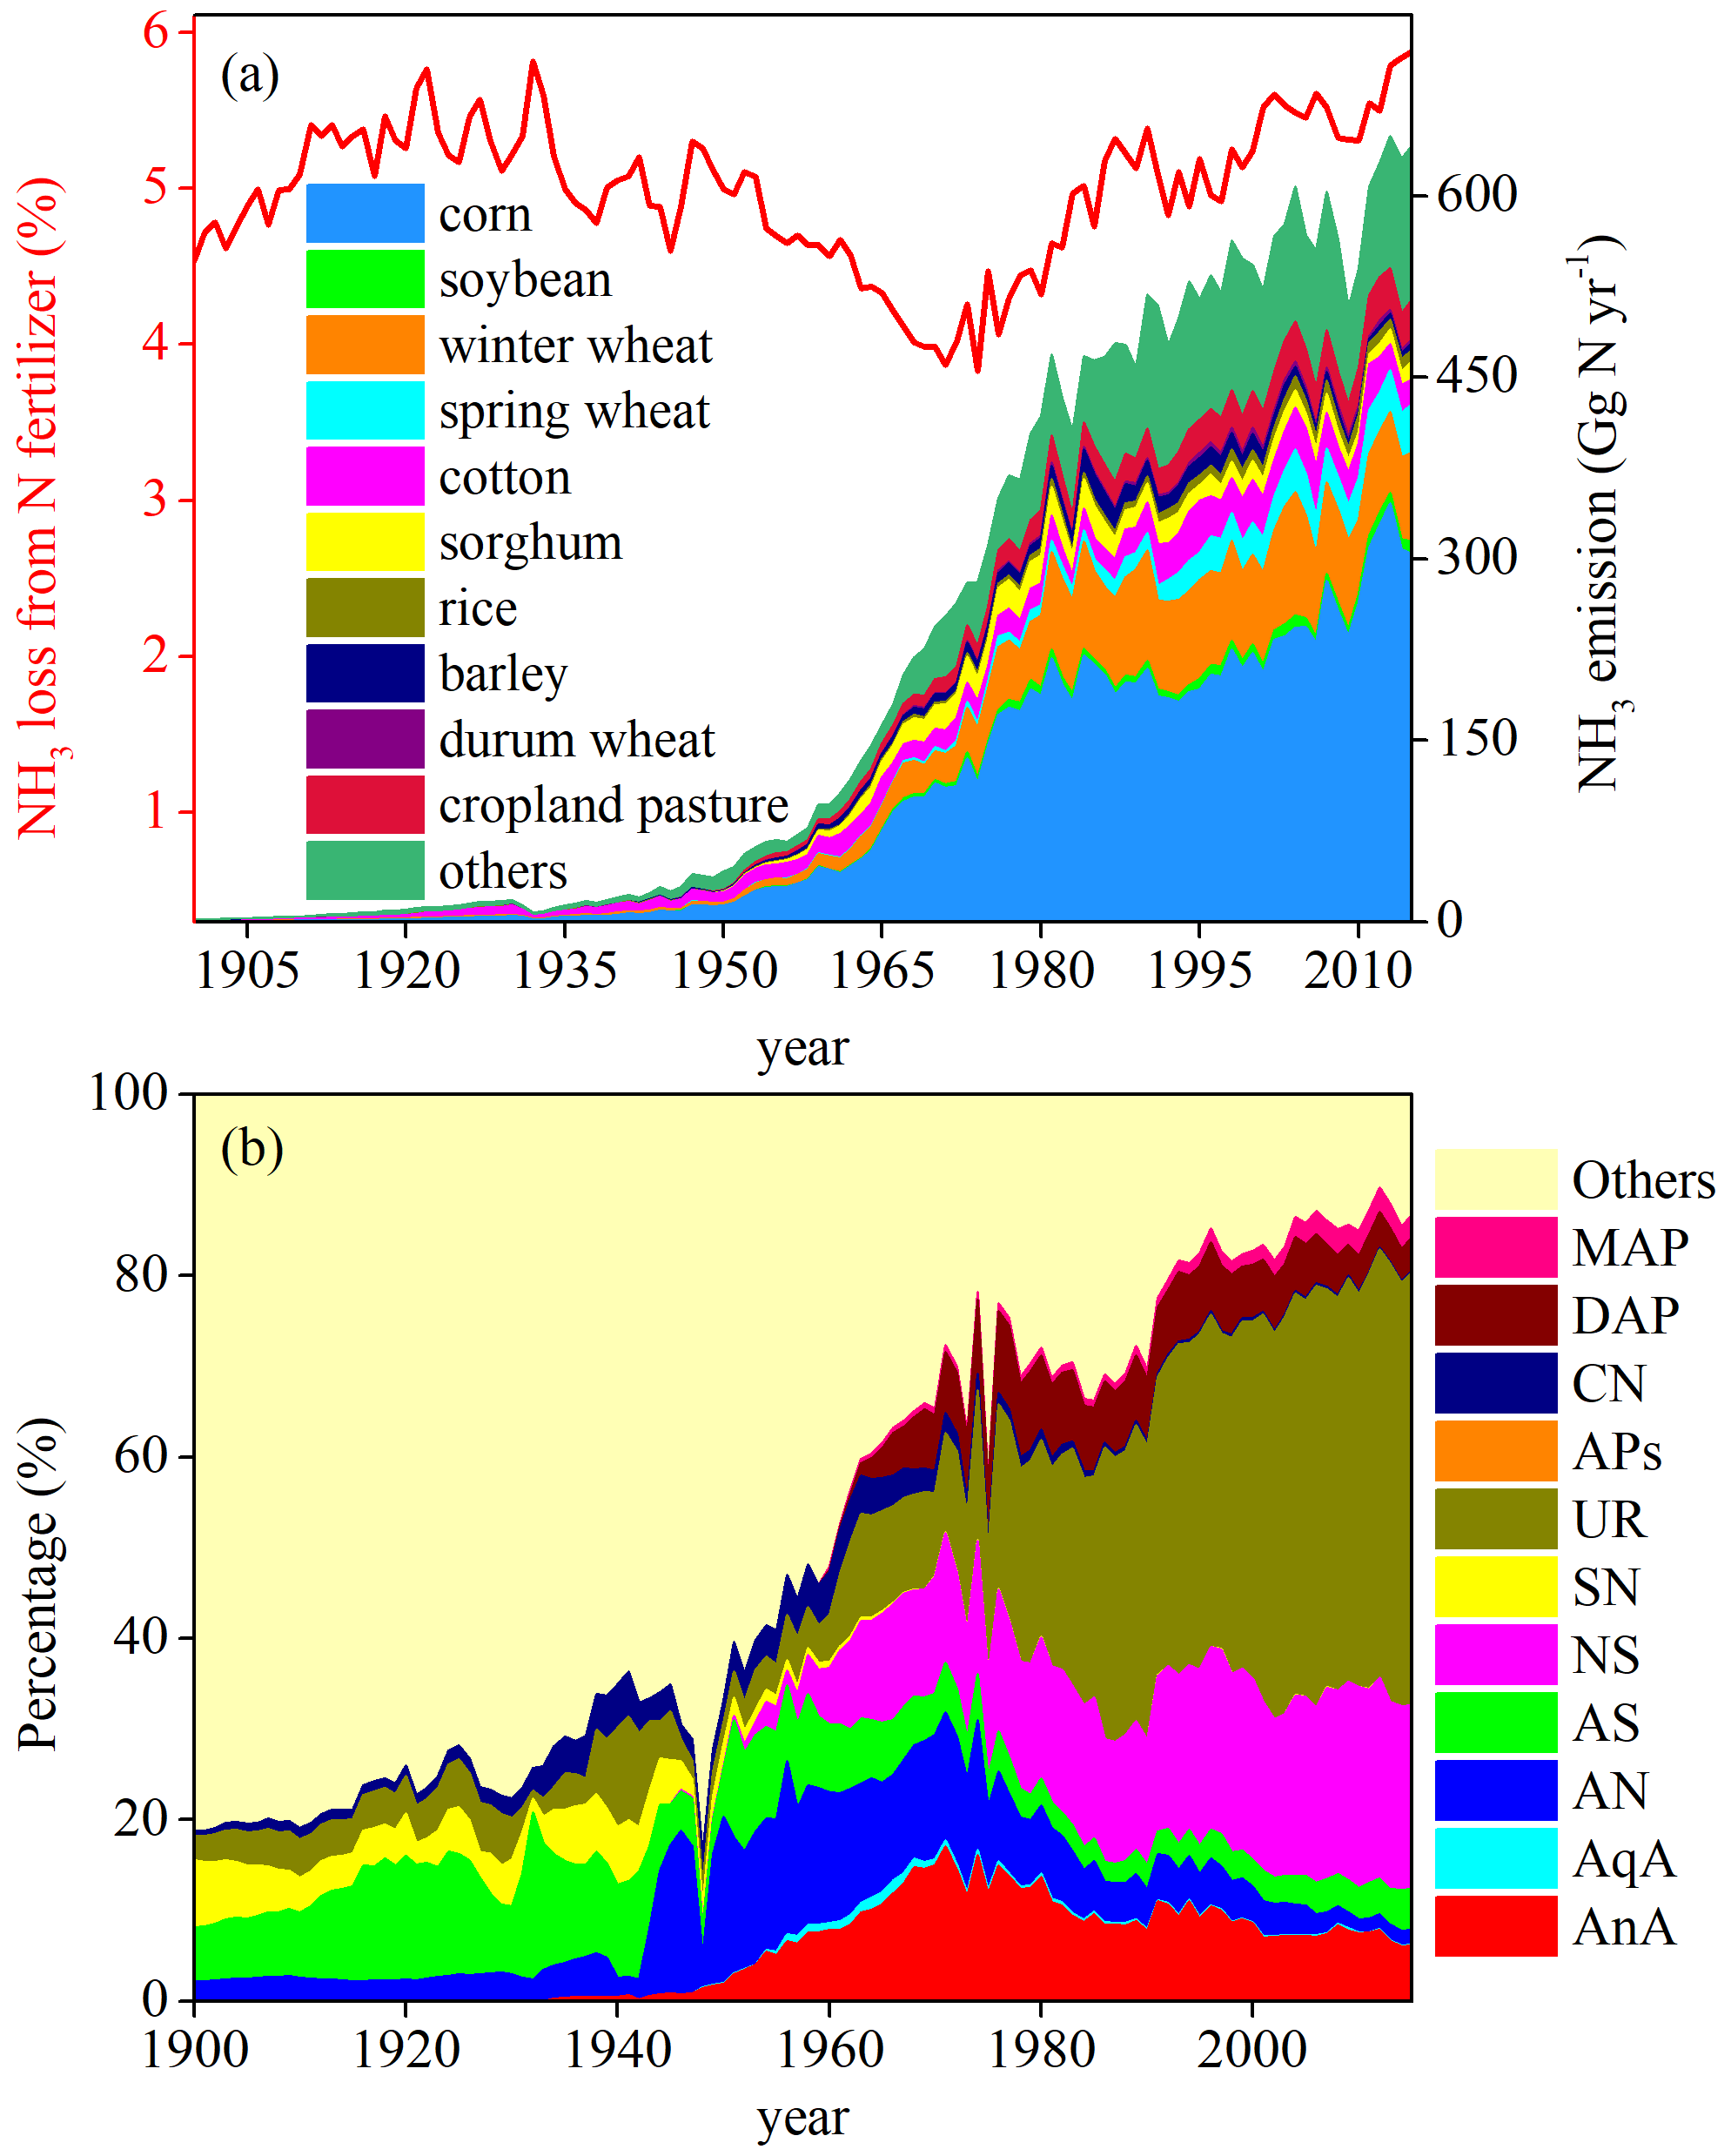
Figure 1Contributions of major crop types and N fertilizer types to historical NH3 emissions since 1900. (a) Crop-specific NH3 emissions and (b) relative contributions of 12 major N fertilizer types to annual total NH3 emission. The solid line in (a) refers to the NH3 loss percentage to total N fertilizer input.
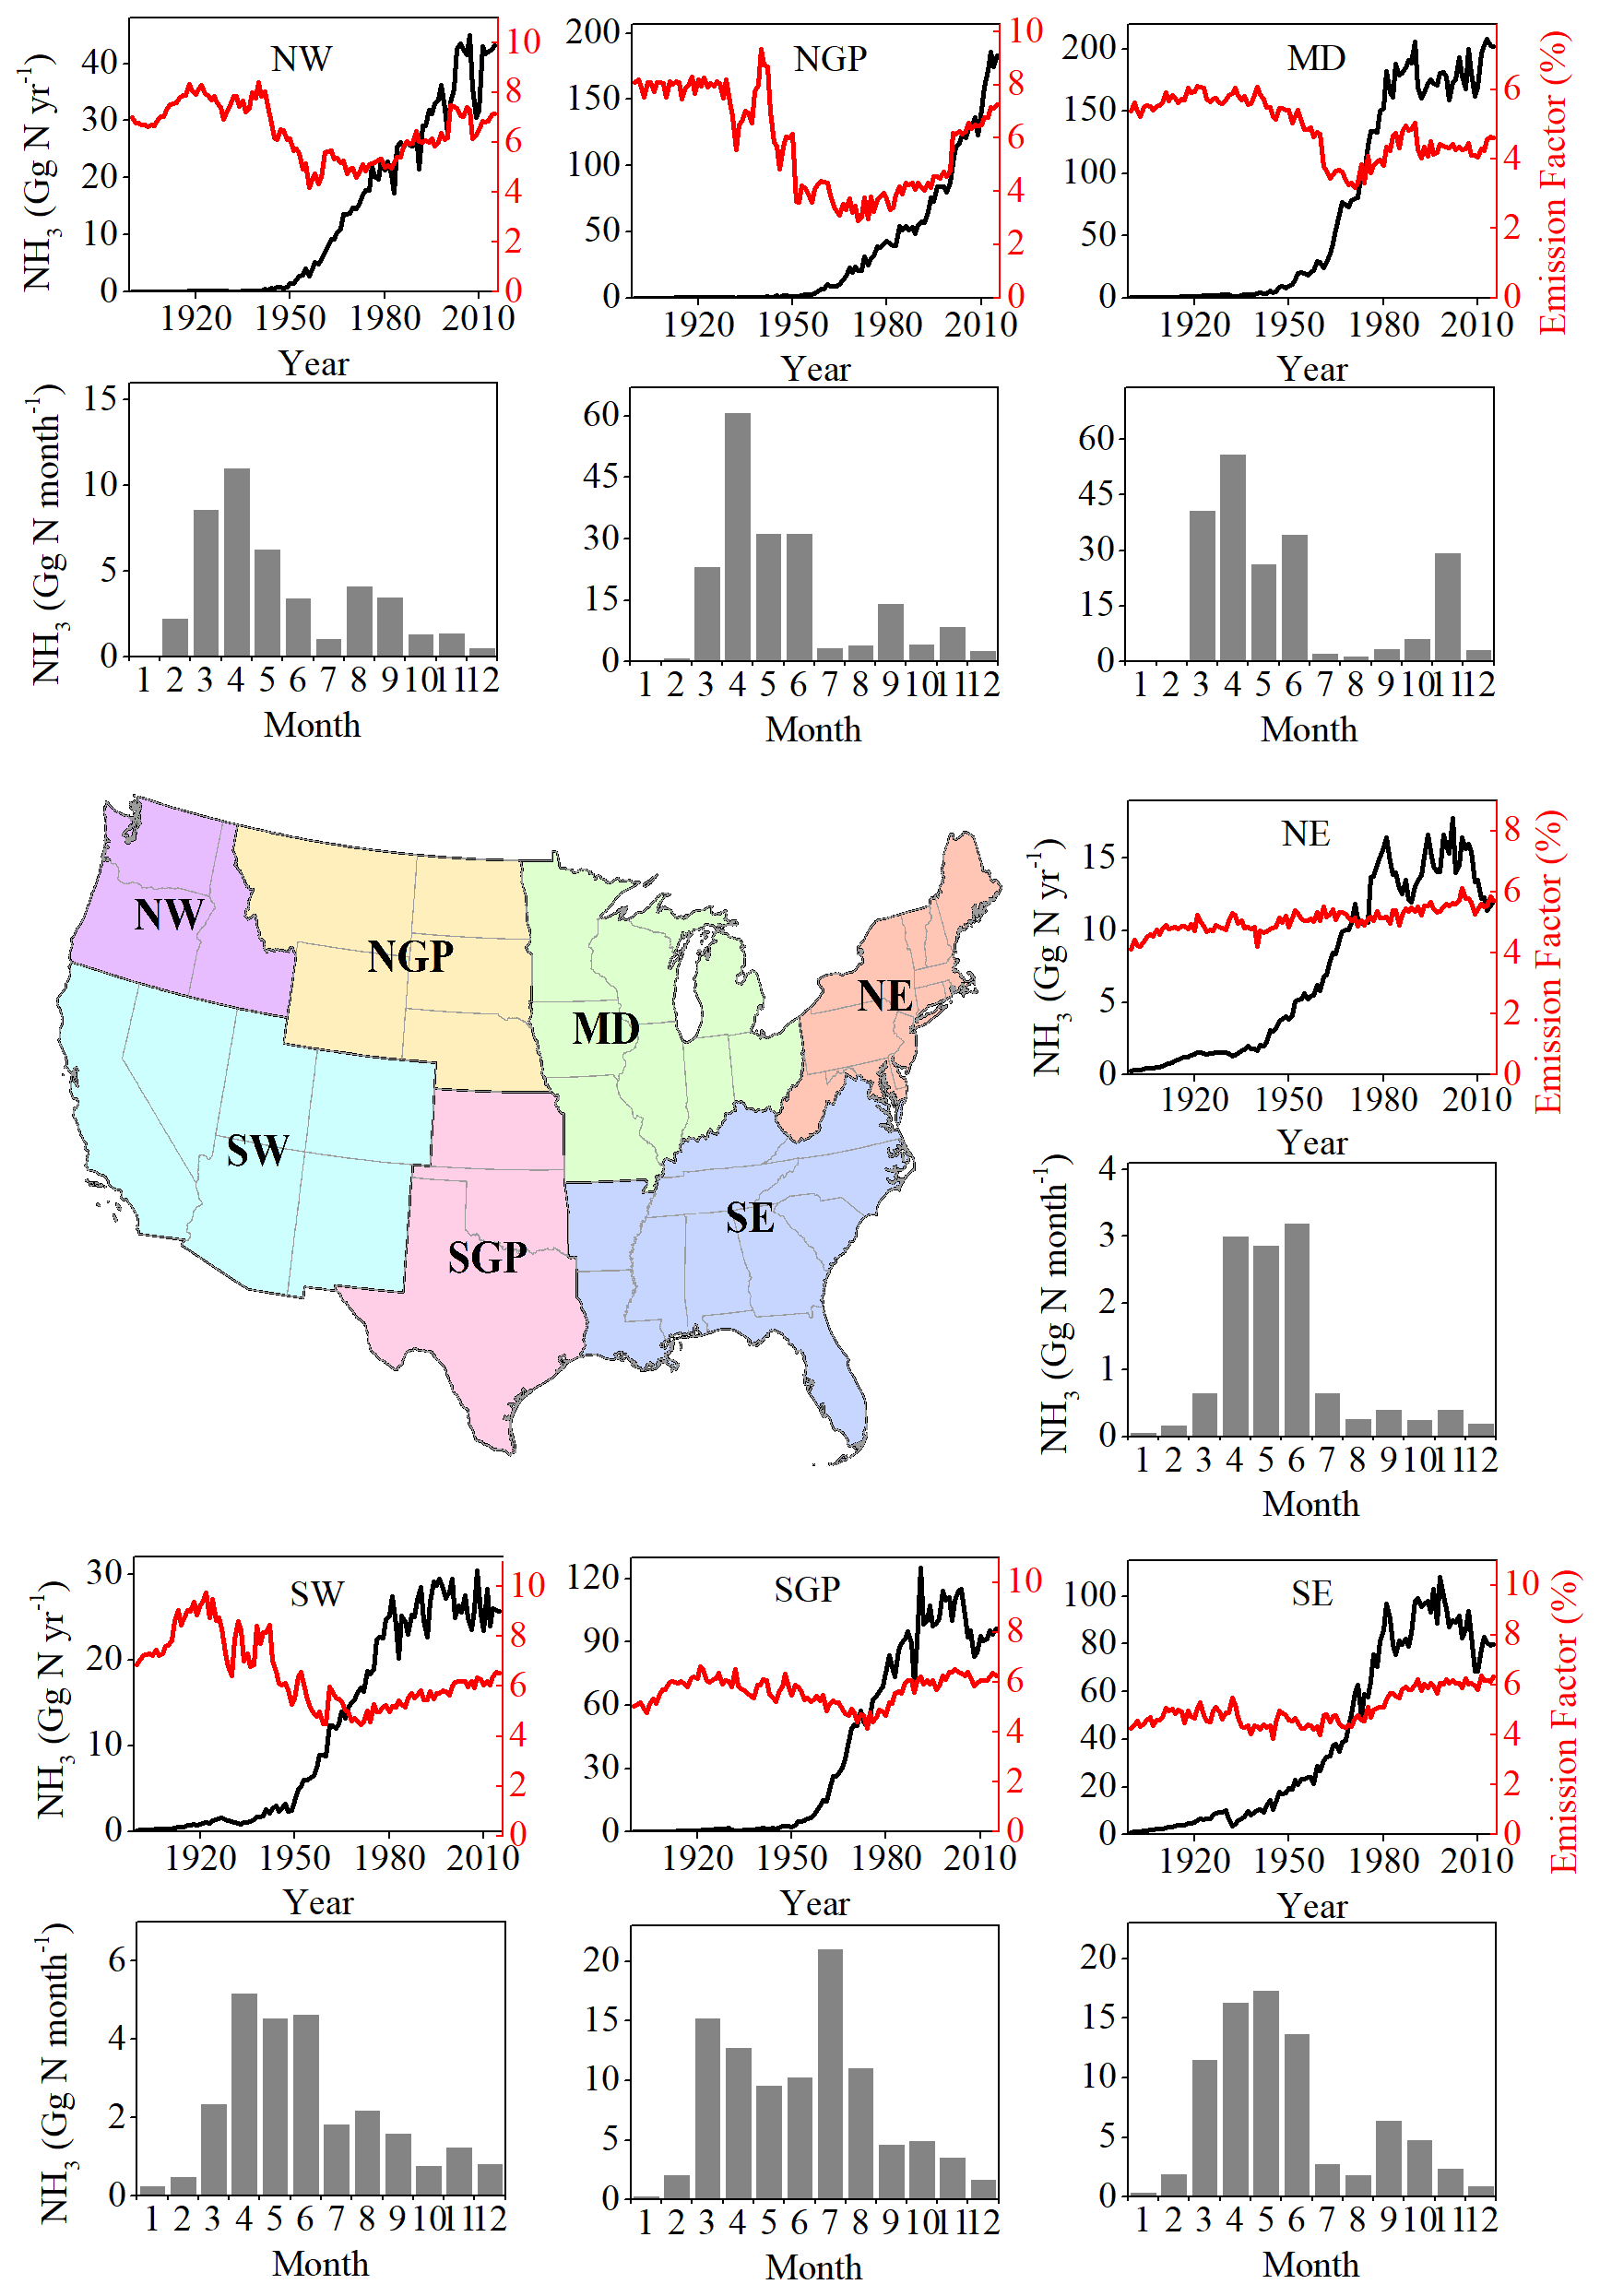
Figure 2Temporal and monthly pattern of NH3 emissions in seven regions of the United States. The seven regions include the Northwest (NW), the Northern Great Plains (NGP), the Midwest (MD), the Northeast (NE), the Southwest (SW), the Southern Great Plains (SGP), and the Southeast (SE). Annual NH3 emission is shown by black lines. Red lines represent the proportion of NH3 emission to N fertilizer input. Grey bars indicate monthly NH3 emissions of each region in 2015.
Among all major crop types, NH3 volatilized from corn accounted for over 40 % of total fertilizer-derived NH3 emission after 1960. Moreover, the increase in NH3 emissions from corn fields was the major driver of the NH3 emission growth in recent decades, contributing to 52 % during 1980–2015 and 83 % during 2000–2015 (Table S3). Although NH3 emission from spring wheat accounted for less than 7 % of total NH3 emissions during 1980–2015, 14 % of the fertilizer-NH3 emission increase can be attributed to spring wheat production.
The contributions of N fertilizer types to total NH3 volatilization varied in different periods (Fig. 1b). All other N fertilizer types, including single (i.e., calcium ammonium nitrate) and mixed N fertilizers, are the dominant source of NH3 emission before the 1960s (>70 %), during which the total NH3 emissions were low. The contribution of urea-based fertilizers (urea and nitrogen solution) increased from 11.5 % in 1960 to 68 % in 2015, accounting for 78 % of the fertilizer-induced NH3 emission increase during this period (Fig. 1b, Table S4).
3.2 Spatiotemporal change in NH3 volatilization
A large increase in NH3 emissions was found across the US from 1960 to 2015. Meanwhile, the hot spot of NH3 emissions has shifted from the central US to the Northern Great Plains and Minnesota (Fig. 3). Before 1960, most states in the US released less than 0.1 g NH3-N m−2 yr−1, except the west and east coasts and a few states in the Midwestern US, such as Indiana and Ohio (Fig. 3a). Since 1980, a tremendous increase in NH3 volatilization (0.2–0.4 g N m−2 yr−1) occurred in the Midwest, the Southern Great Plains, the Southeast, the Northwest, California, and Nebraska, with the highest NH3 emission centered in Indiana and Ohio (0.4–0.6 g N m−2 yr−1) (Fig. 3b). NH3 volatilization further enhanced after 2000, during which hot spots of NH3 volatilization widely expanded in western Minnesota, Texas, and the western Southeast (Fig. 3c). The most intensive NH3 volatilization (>0.6 g N m−2 yr−1) occurred in the Northern Great Plains, the Northwest, and Minnesota in 2015 (Fig. 3d).
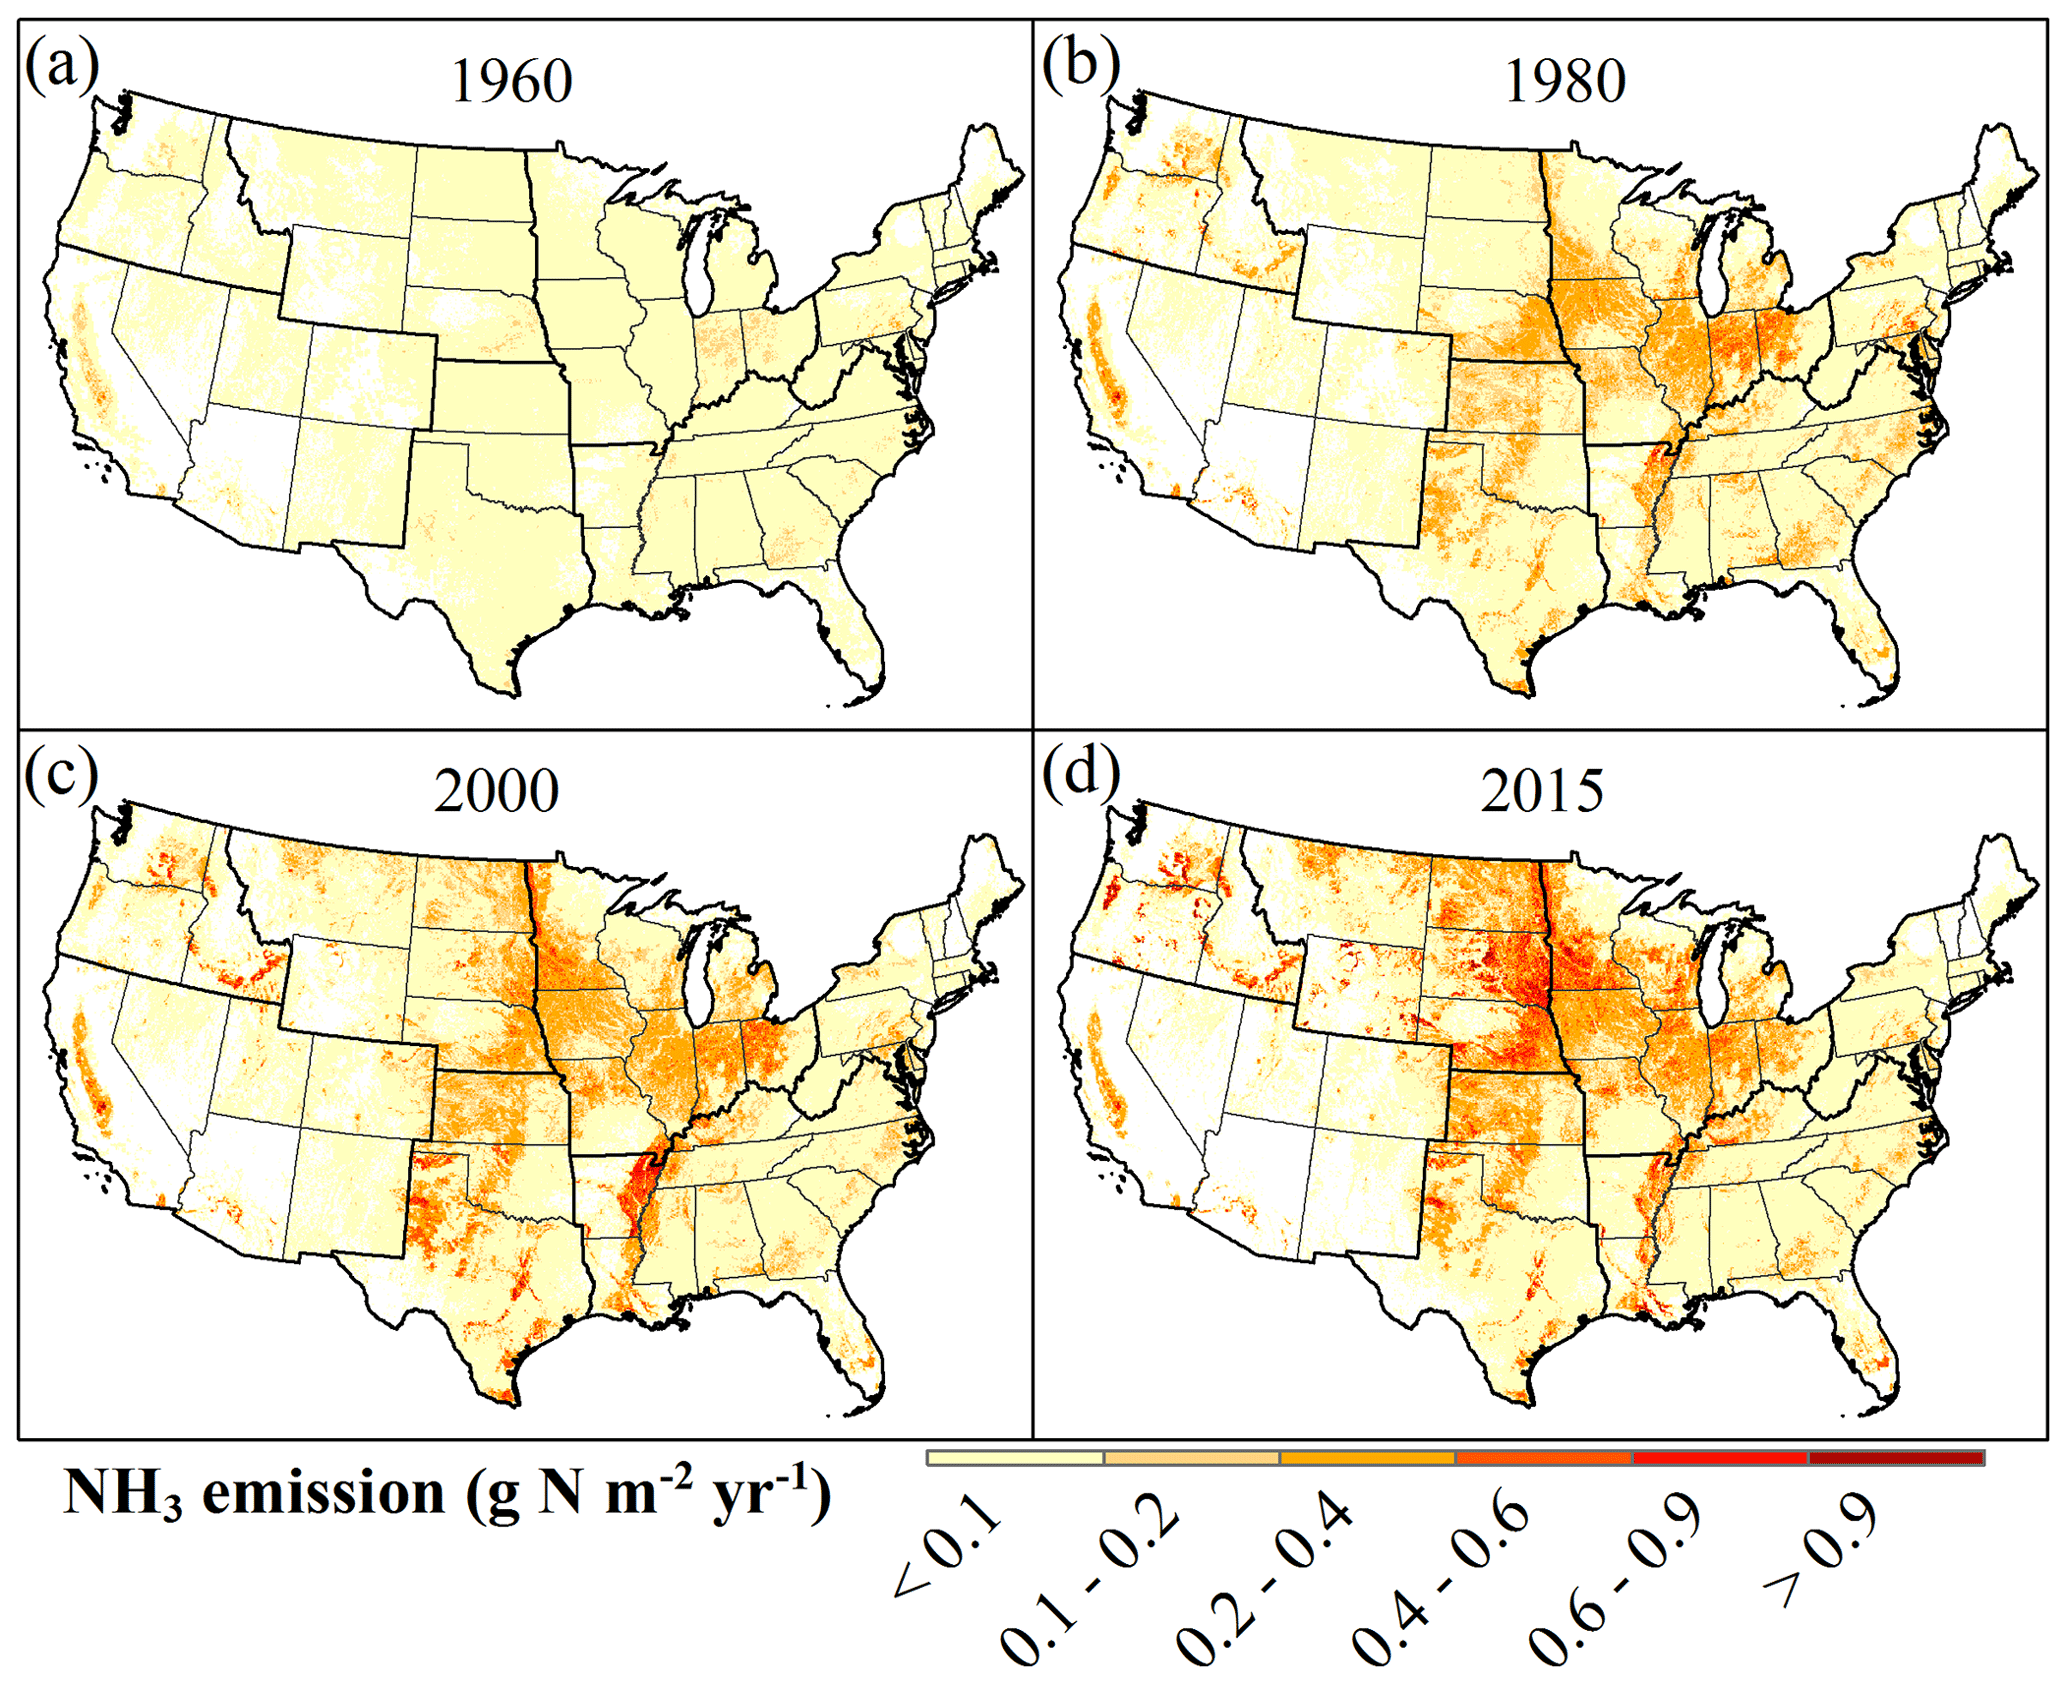
Figure 3Spatial distribution of NH3 emissions in the US from 1960 to 2015. Values represent NH3 emission from synthetic N fertilizer applied over all crops in each 5 km by 5 km grid cell.
We find that the NH3 loss proportion to total N fertilizer use remained less than 6 % in the eastern US before the 1980s. However, 6 %–9 % loss ratios are found in vast areas in the western US, with some areas in South Dakota, Nevada, and Utah losing up to 12 % of N fertilizer via NH3 (Fig. 4). After the 1990s, the Northern Great Plains, the Northwest, and part of the Southwest gradually became major players, with an NH3 loss proportion greater than 12 %.
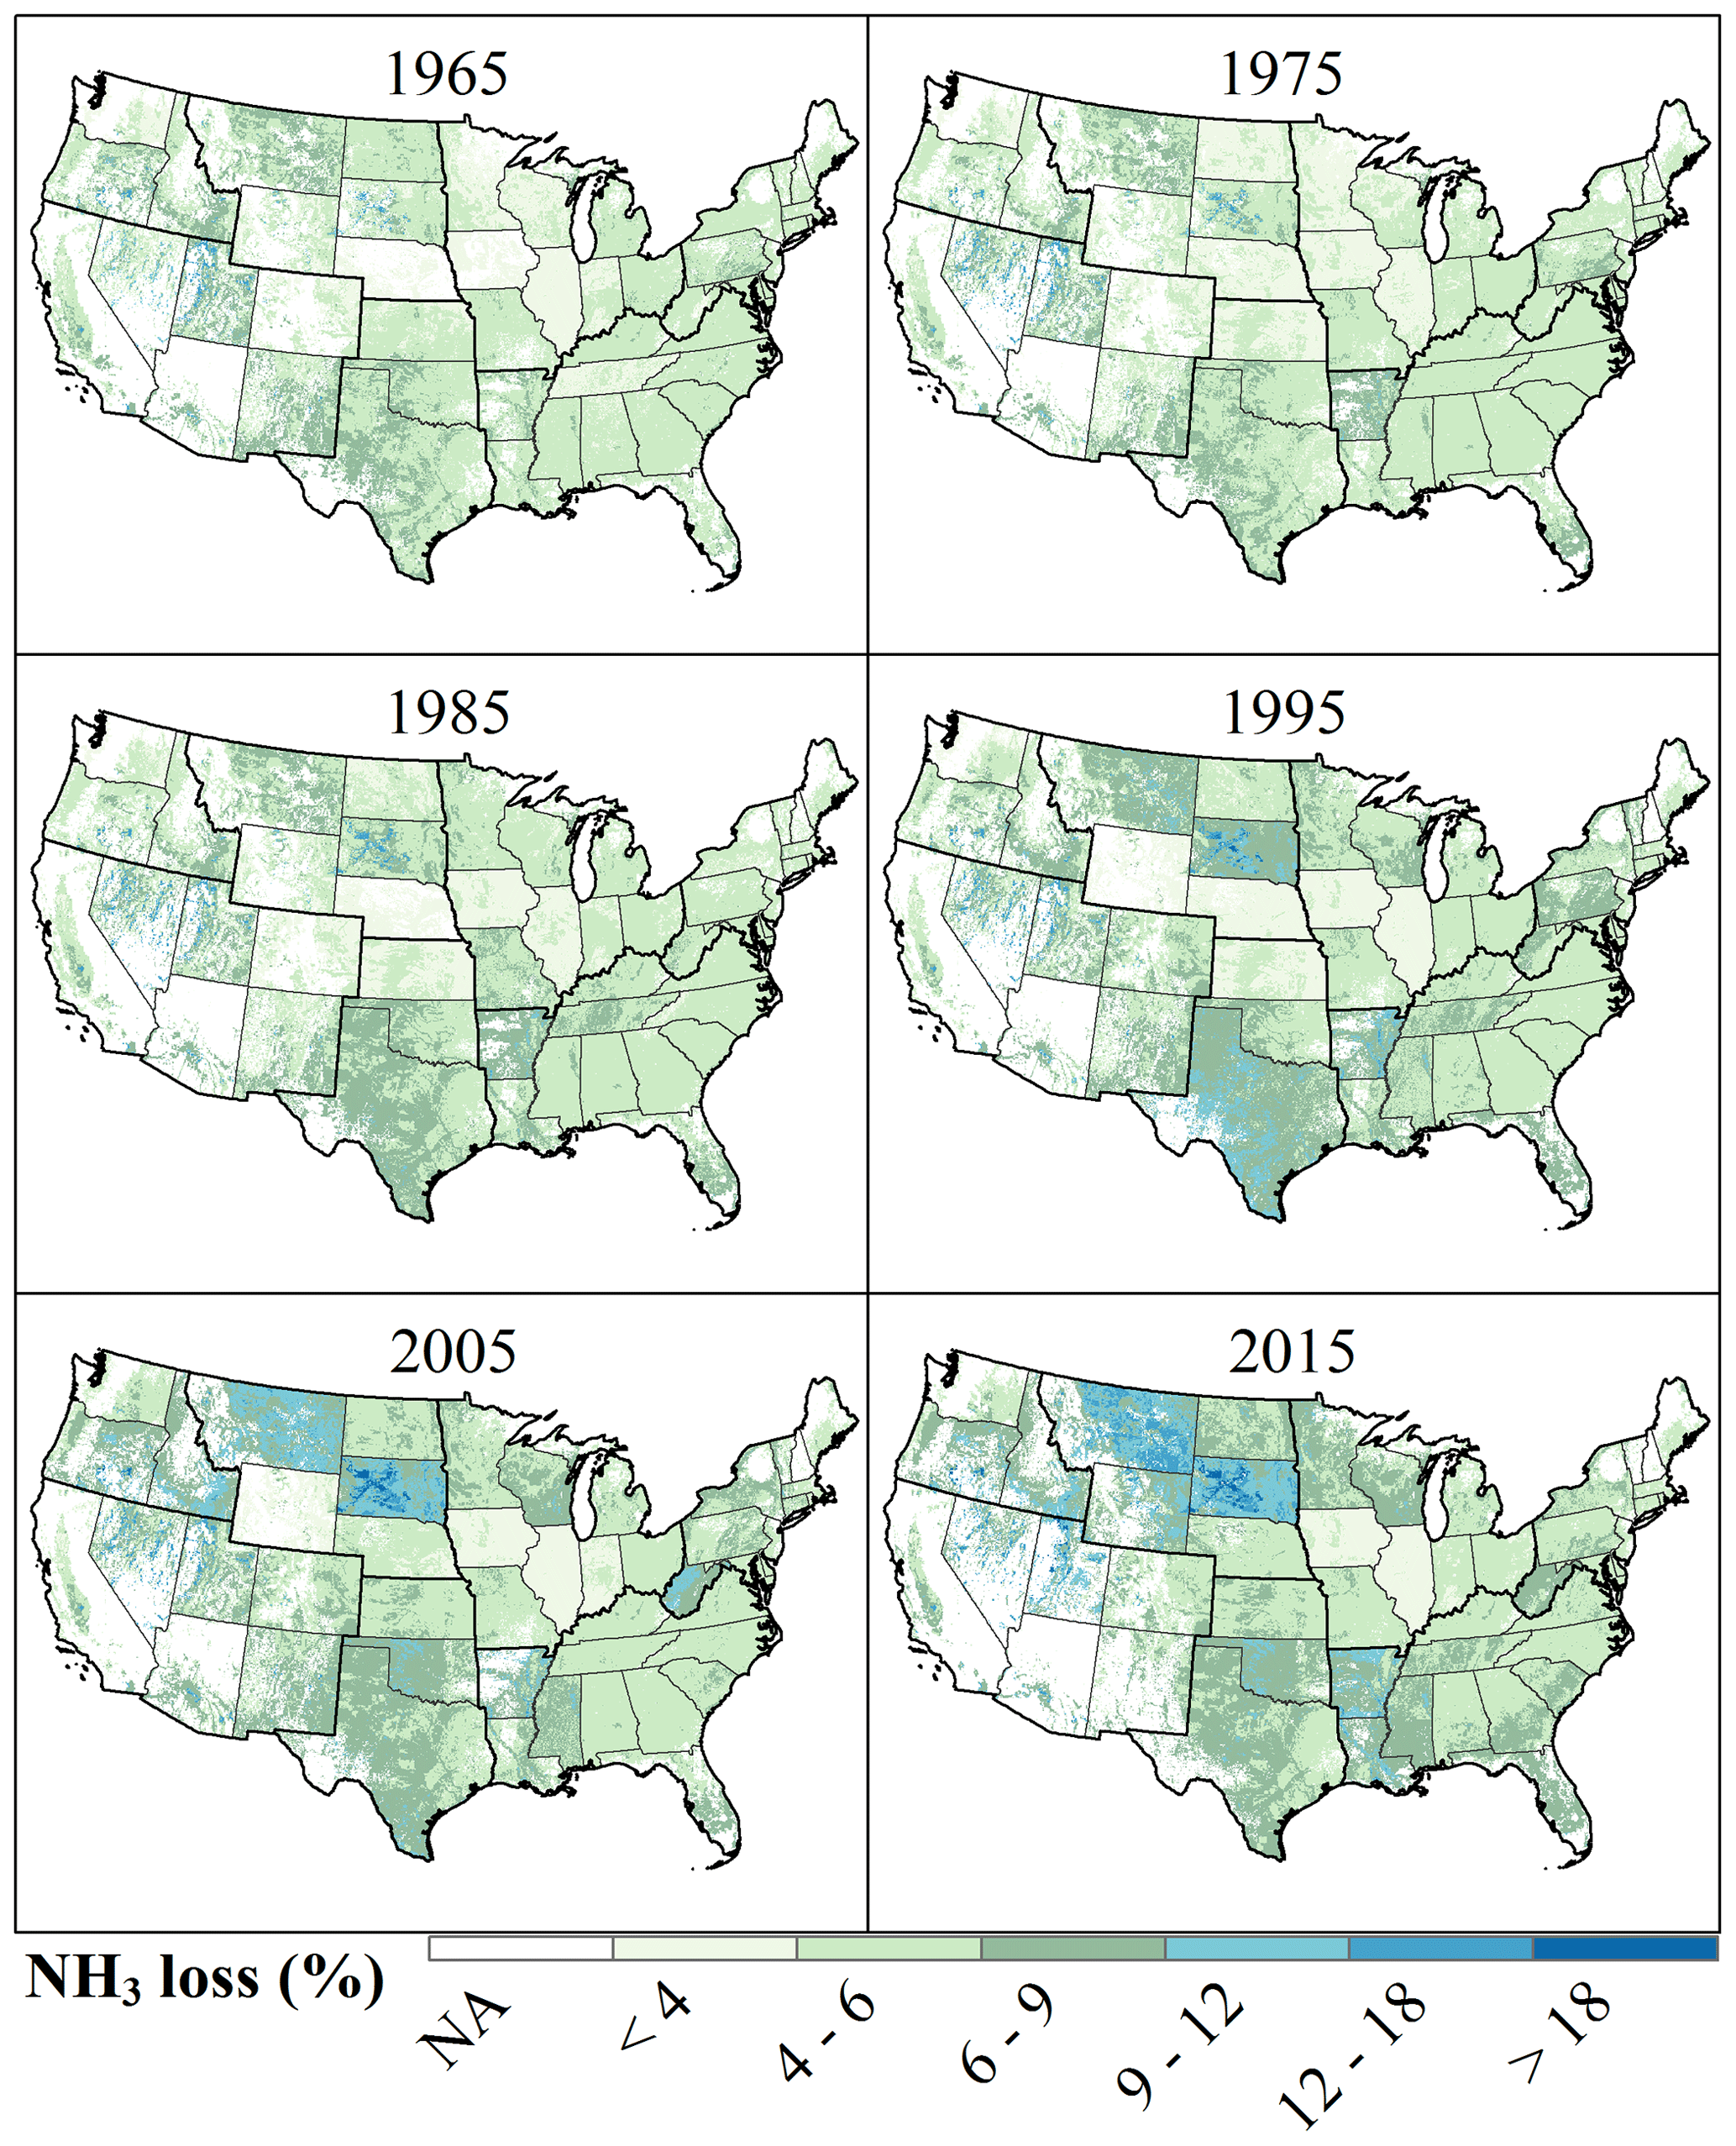
Figure 4Spatial and temporal patterns in NH3 loss proportion relative to total N fertilizer input in the US (the middle year of each decade is selected as an example).
3.3 Monthly NH3 emissions
Our results indicate that, in 2015, NH3 emission levels were high in March–June (Fig. 5). In addition, the emission hot spots showed large spatial variations over months (Fig. 5). Specifically, a vast amount of NH3 (>0.24 g N m−2 per month) volatilized from the Midwest, the Northern Great Plains, and parts of the Northwest in April, while the southern Northern Great Plains and the eastern Midwest served as a major NH3 source (>0.24 g N m−2 per month) in June. In contrast, NH3 emissions in winter (December–February) and August were at a low level (<0.04 g N m−2 per month).
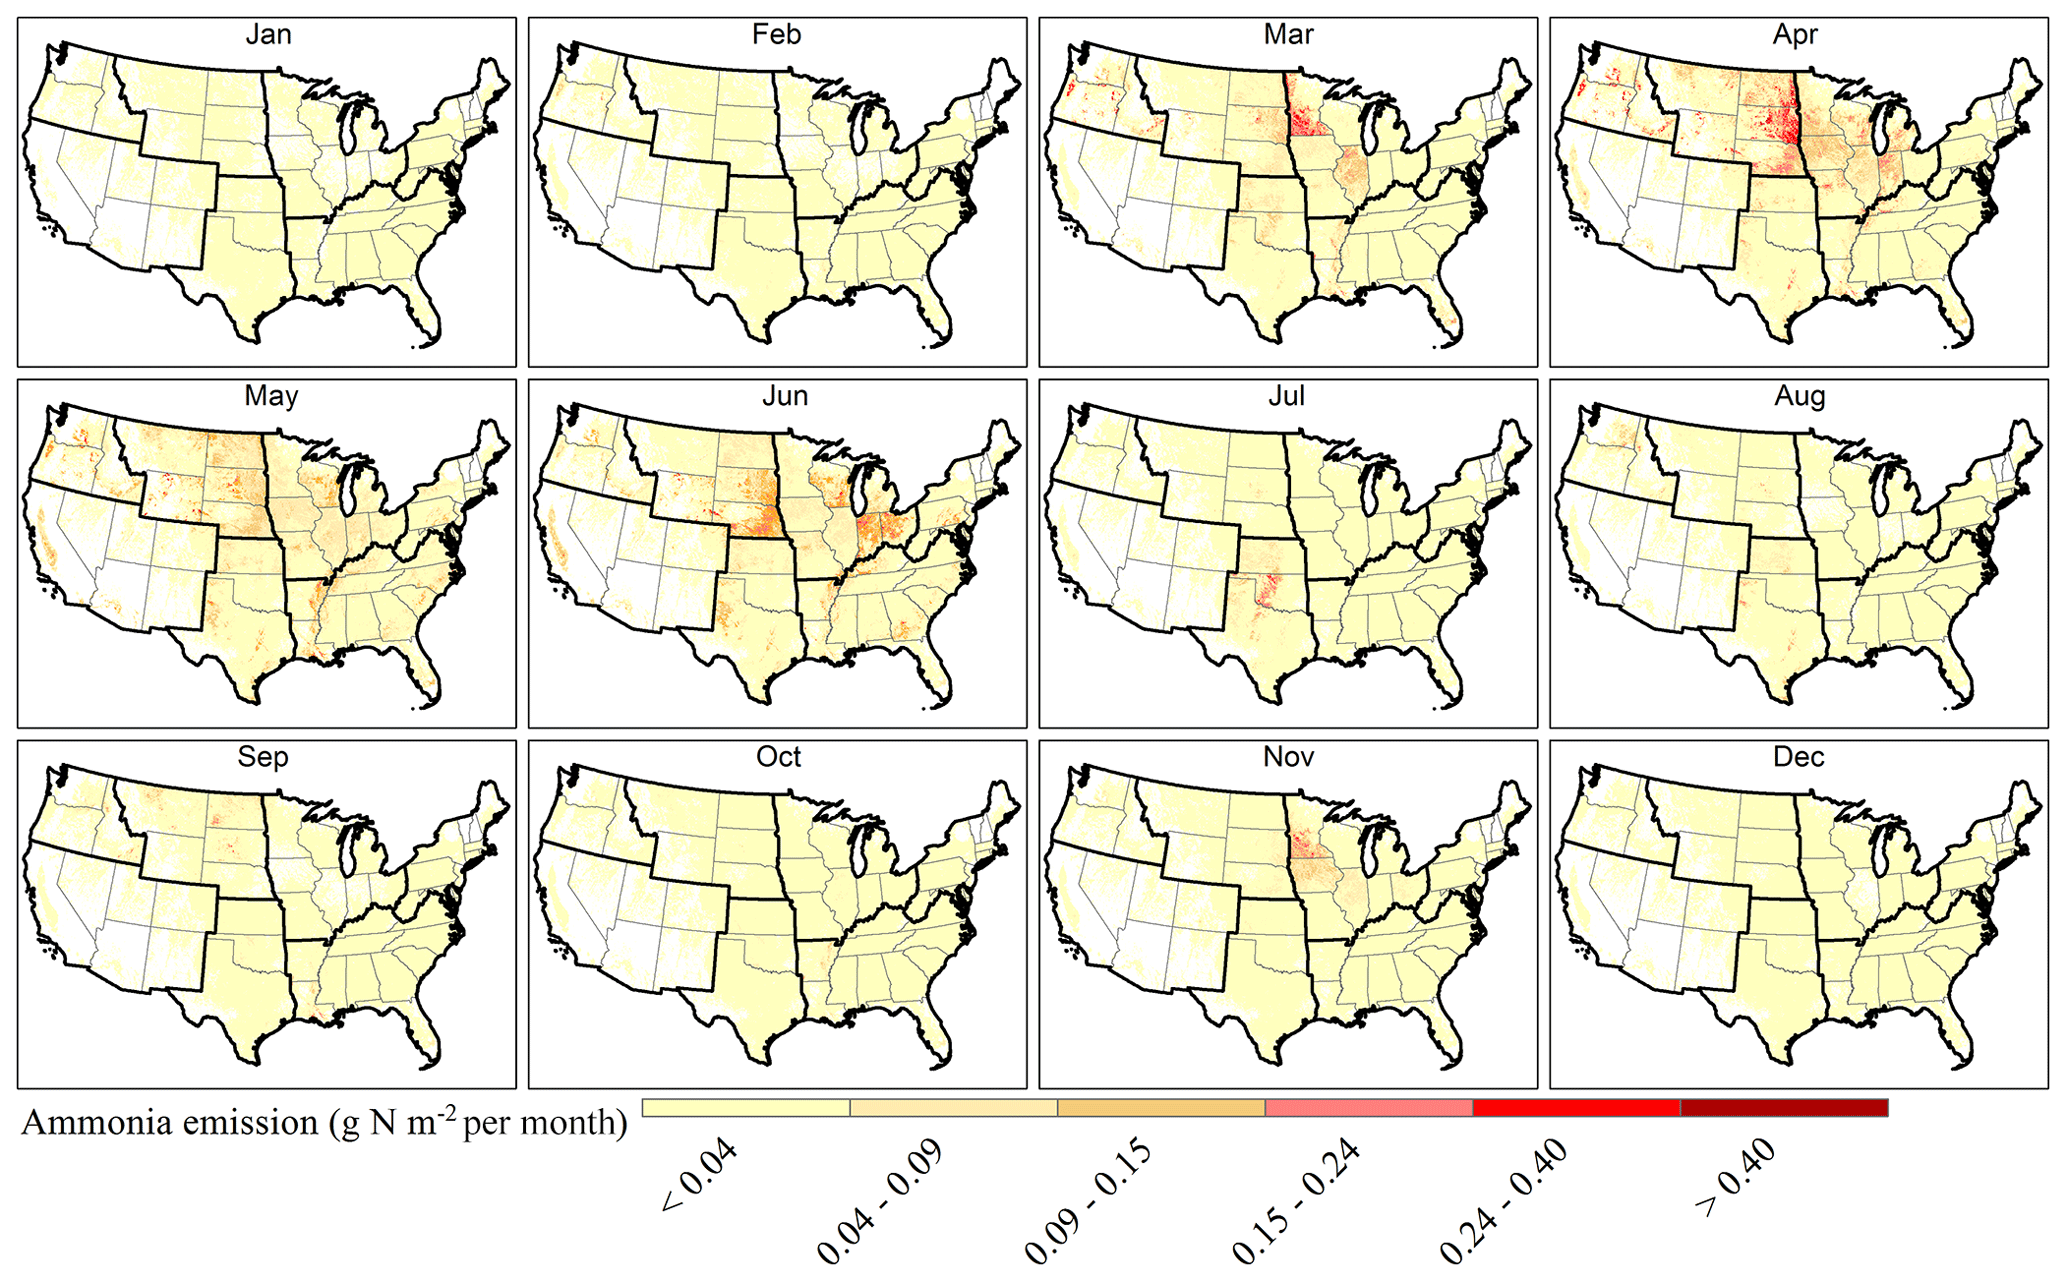
Figure 5Spatial distribution of monthly estimated NH3 emission across the US in 2015.
Monthly NH3 emissions across the nation experienced a dramatic increase since 1960, especially during 1960–1980 (Fig. 6a). Meanwhile, NH3 emissions in March and April showed large interannual fluctuations compared to other months. The NH3 emissions in April have consistently increased by 64 %, from 100 Gg N per month in 1980 to 164 Gg N per month in 2015, while the emissions in June and May slowly increased by 43 % and 42 %, from 70 and 69 Gg N per month to 100 and 98 Gg N per month, respectively. NH3 volatilized in April–June together accounts for 70 % of annual emission (Fig. 6b). Before the 1960s, May dominated the annual emissions, followed by June and April. In this study, we find that maximum emissions have gradually shifted to earlier months and peaked in April since the 1960s. Interestingly, the reduction of emissions in June mainly occurred before the 1960s, whereas the rise of emissions in April mainly occurred after the 1970s (Fig. 6b).

Figure 6Temporal dynamics in monthly NH3 emission (a) and share of each month to annual total (b) from 1930 to 2015. The month legend in (a) is vertically ordered by the NH3 emission rate in 2015.
Besides, our study indicates that the increment of April emission has widely distributed in the western US since 1960, with the largest increase (>20 %) found in the Great Plains and the Northwest (Fig. S2). On the contrary, although minor increases were found in the corn belt, large decreases ( %) in May occurred in the Dakotas, Minnesota, and along the eastern coast of the US.
3.4 Factorial contributions
Our simulation experiments show that N fertilizer input is the dominant contributor to boost NH3 emissions across the US since 1960, especially in the Northeast, the Midwest, the Great Plains, and the Southwest (Fig. 7, Table S5). The roles of other factors affecting NH3 emissions differed among regions and over periods. We find that temperature posed a weakly positive effect on NH3 emission in most regions except the Northern Great Plains and the Northwest during the simulation period. Cropland area and rotation changes overall led to decreases in NH3 emission but had complicated impacts among regions since 1960. In the intensively managed regions, such as the Midwest and the Great Plains, cropland use change slightly increased NH3 emission, whereas it decreased NH3 emission in the Northeast and the Southwest regions (Fig. 7b and h). Crop rotation lowered NH3 emissions in the US and most regions except the Northeast. Changes in N fertilizer type had largely increased NH3 emission in regions such as the Northern Great Plains, the Northwest, and the Southeast, especially after the 1990s.
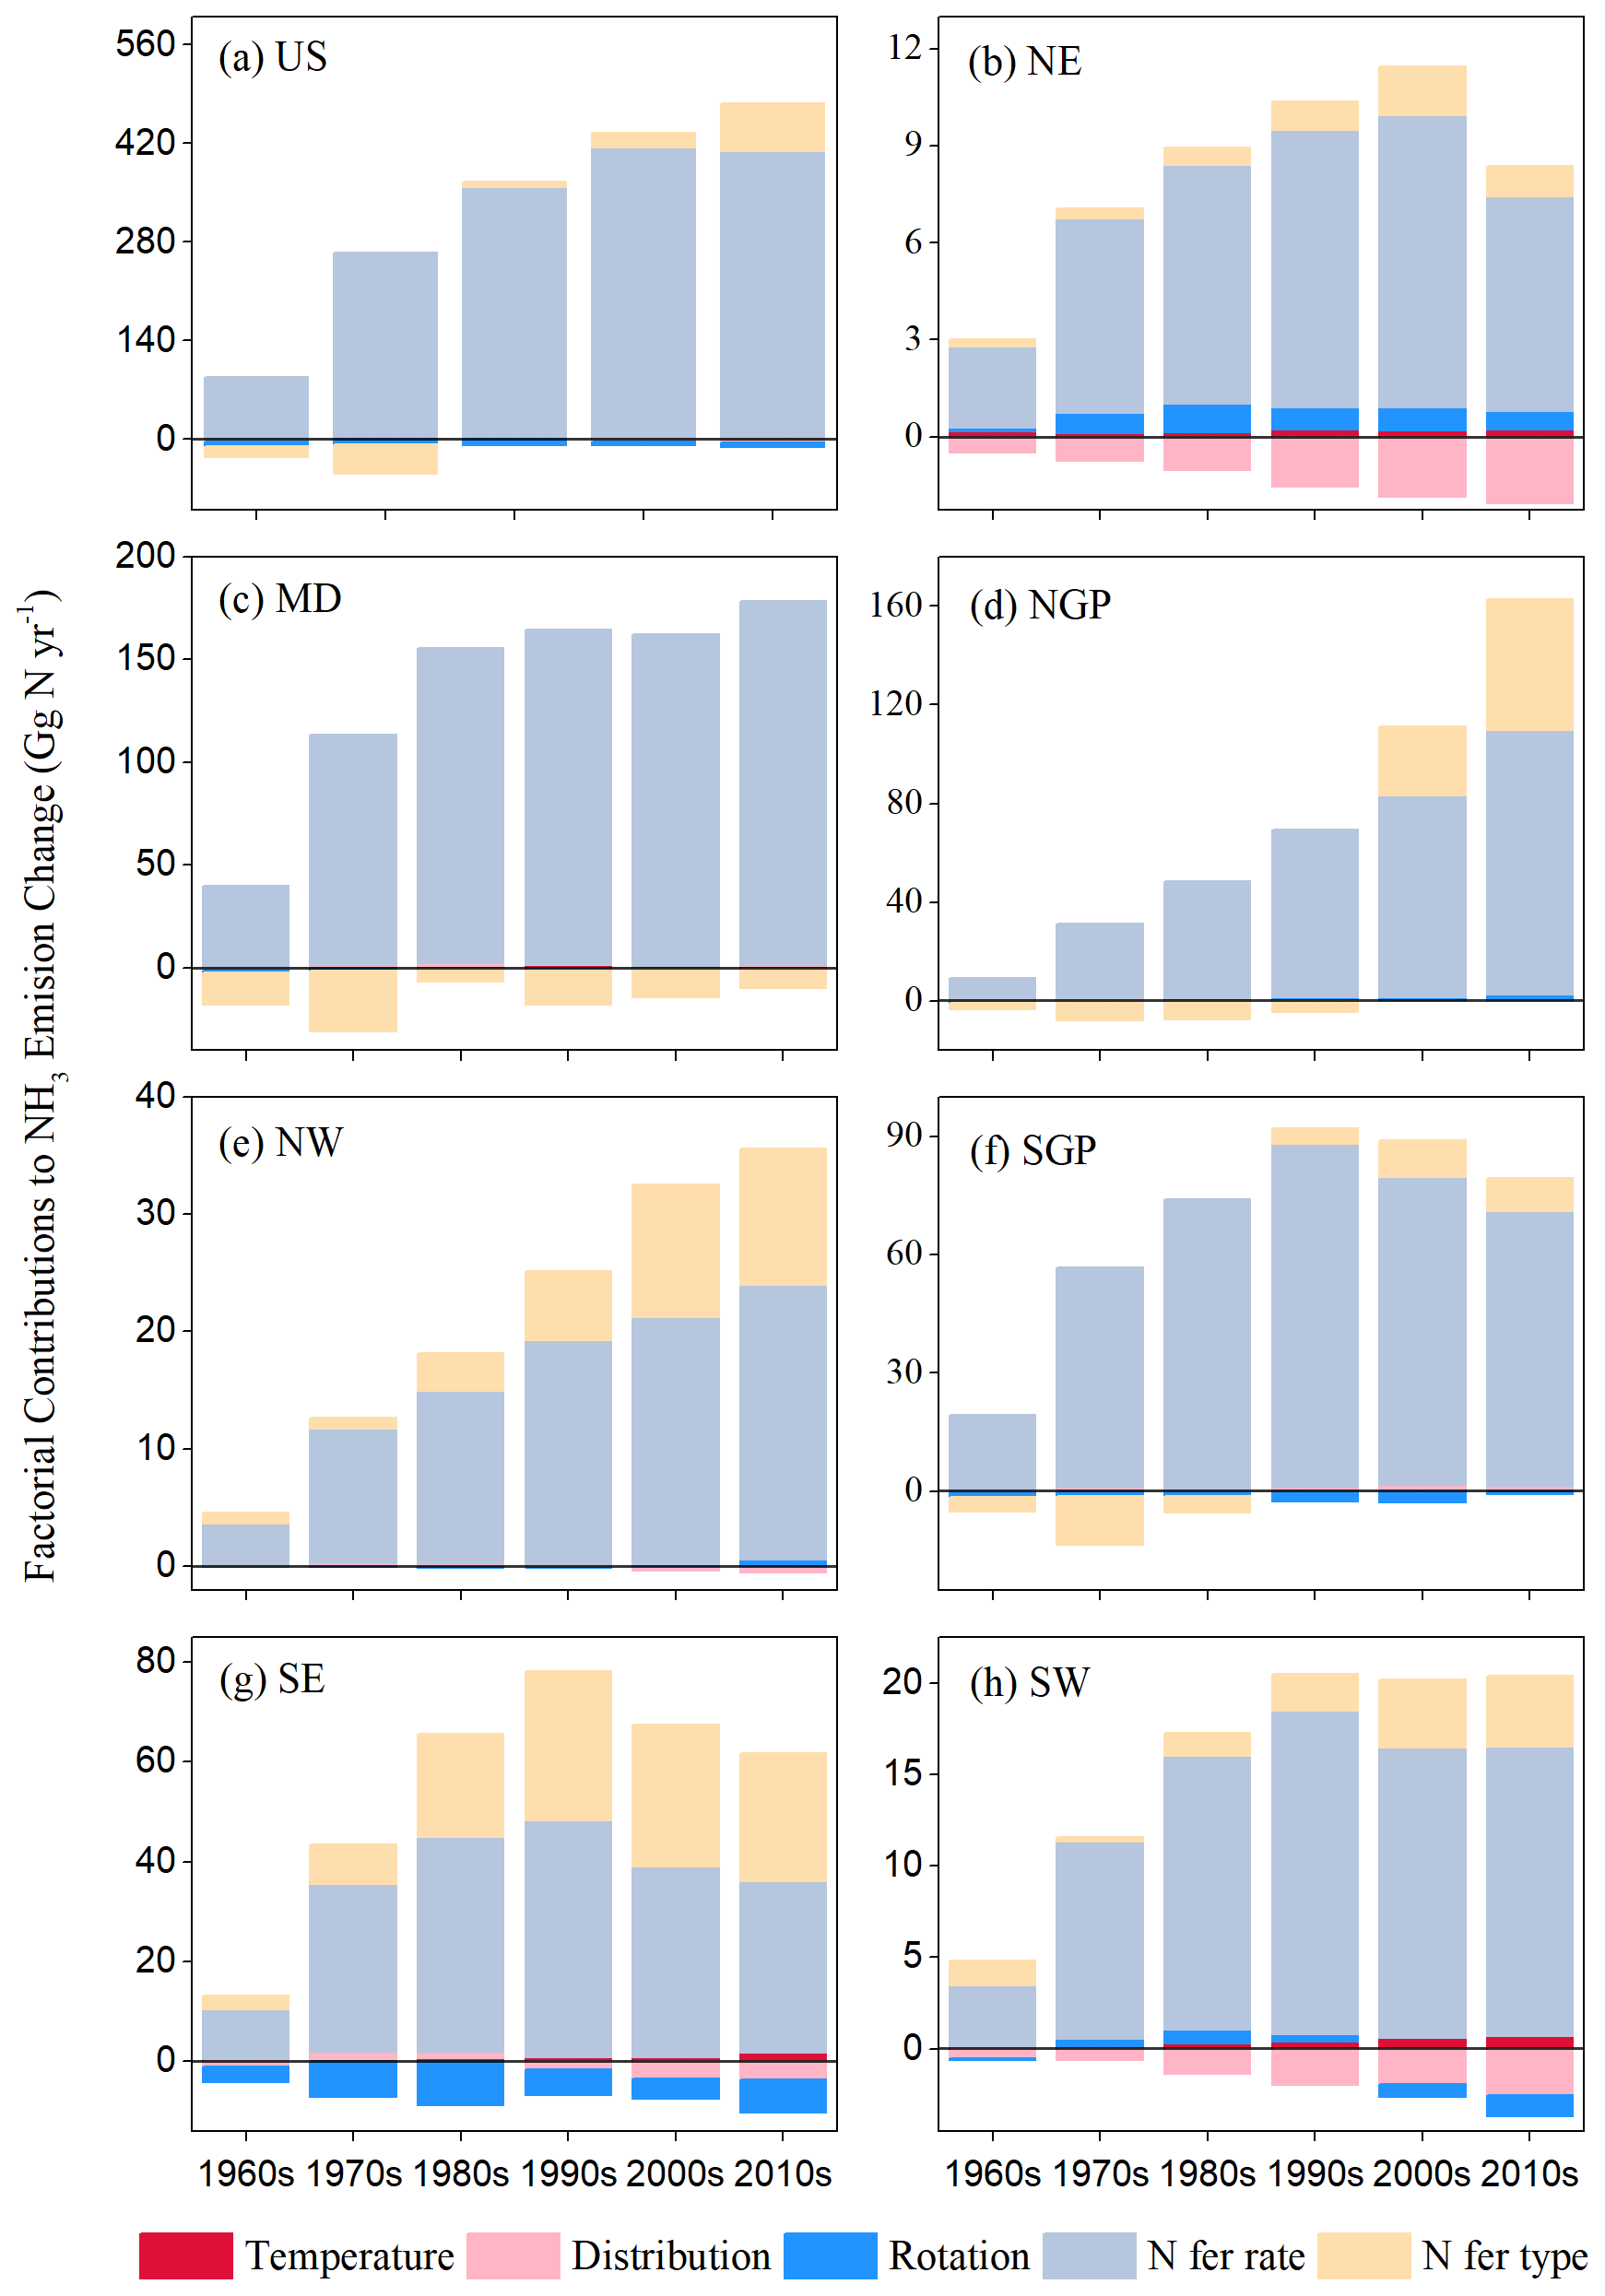
Figure 7Decadal-average factorial contributions of temperature, cropland distribution, cropland rotation, N fertilizer use rate, and N fertilizer type to NH3 emission change in the contiguous US and seven subregions. The seven subregions are the Northeast (NE), the Midwest (MD), the Northern Great Plains (NGP), the Northwest (NW), the Southern Great Plains (SGP), the Southeast (SE), and the Southwest (SW).
4.1 Comparison with previous studies
We compared our estimates of annual NH3 emissions across the contiguous US with the previously published results (Fig. 8). The magnitudes of NH3 emission estimates differ significantly, ranging from 460 to 756 Gg N yr−1, among previous studies due to the difference of data sources (e.g., N fertilizer and cropland distribution) and estimation approaches (e.g., bottom-up and top-down) they adopted. Our estimated NH3 emissions are much lower than those estimated by two inventories, in which non-agricultural N fertilizer uses have been included (US EPA, 2020) and the emission factor is less constrained by environmental drivers (Goebes et al., 2003). For example, our estimate of NH3 emission in 1995 is 40 % lower than an early study (i.e., 756 Gg N yr−1 as estimated by Goebes et al. (2003) vs. 504 Gg N yr−1 in this study). This may be because the EF Goebes et al. (2003) used was only based on N fertilizer type, while we considered the combined effects of temperature, soil properties, crop type, and N fertilizer management to modify the EF. Conversely, our estimated NH3 emission is very close to a bottom-up inventory (490 Gg N yr−1 from Park et al. (2004) vs. 521 Gg N yr−1 from this study) and a top-down estimation (540 Gg N yr−1 from Gilliland et al. (2006) vs. 512 Gg N yr−1 from this study). In contrast, two studies, considering more constraints on EF, such as canopy absorption and wind speed, had smaller NH3 estimations (Bash et al., 2013; Paulot et al., 2014). For example, the NH3 emission of 2002 by Bash et al. (2013), which considered the effect of canopy absorption and release additionally, is 20 % lower than our estimate (460 Gg N yr−1 from Bash et al. (2013) vs. 564 Gg N yr−1 from this study).

Figure 8Comparison of annual NH3 emission estimates between this study and others. (a) Paired comparison between our result and individual research; (b) boxes include 25 %–75 % of NH3 emission of all chosen years estimated by our study and other studies, respectively. White lines are mean values, and whiskers represent the min–max range of data. NH3 emission estimated by Paulot et al. (2014) represents the average of 2005–2008, against which we compared our estimate of 2006.
We also compared the spatial pattern of NH3 emissions in 2011 estimated by our study with that from the US National Emissions Inventory (US EPA, 2020). The spatial patterns revealed by these two studies were similar: the hot spots of NH3 emissions concentrated in the Northern Great Plains, parts of the Northwest, the corn belt, and the rice belt, and relatively lower NH3 emissions were found along the eastern coast of the US (Fig. S3).
We further explored the monthly variations in the estimated NH3 emissions among studies (Fig. 9). All studies agreed that the majority of NH3 is released in spring and June while winter is the minimum NH3 emissions season (Gilliland et al., 2006; Goebes et al., 2003; Pinder et al., 2006). April was commonly identified as the peak NH3 emission month by three of these studies, which is consistent with our estimates. Conversely, EPA NEI, considering canopy uptake and release of NH3, found a delayed peak in May. Several studies found relatively higher NH3 emissions in March (Gilliland, 2003; Goebes et al., 2003; Pinder et al., 2006). Our estimate in 2004 also showed the same pattern, in which the planting date was early. However, NH3 emission in March was very low in 2011 from our study due to the delayed planting date and thus resulted in greater April NH3 emission. Owing to the limited data of actual fertilizer use history, these studies used the recommendation from fertilizer experts to spread the N fertilizer after planting over February and March in the following year at the green-up of winter wheat with a fixed ratio. However, we allocated this proportion of N fertilizer to early spring based on the annual green-up date of winter wheat in each state derived from USDA-NASS. The discrepancies in crop phenology and N fertilizer application timing also introduced more disagreements to the secondary peak in fall (Fig. 9). Different from a single large peak in October estimated by EPA NEI, other studies found two smaller peaks in September and November. Our results, however, indicated relatively smaller emissions compared to other studies, which is because the ratio of N fertilizer application in fall we extracted from USDA-ERS is smaller. Although some states, such as Iowa, applied a considerable proportion of annual N fertilizer input in fall, the N fertilizer use in fall is low in the entire US. In summary, our estimate of monthly NH3 emission is generally consistent with other studies but with large interannual variations based on crop phenology surveys.
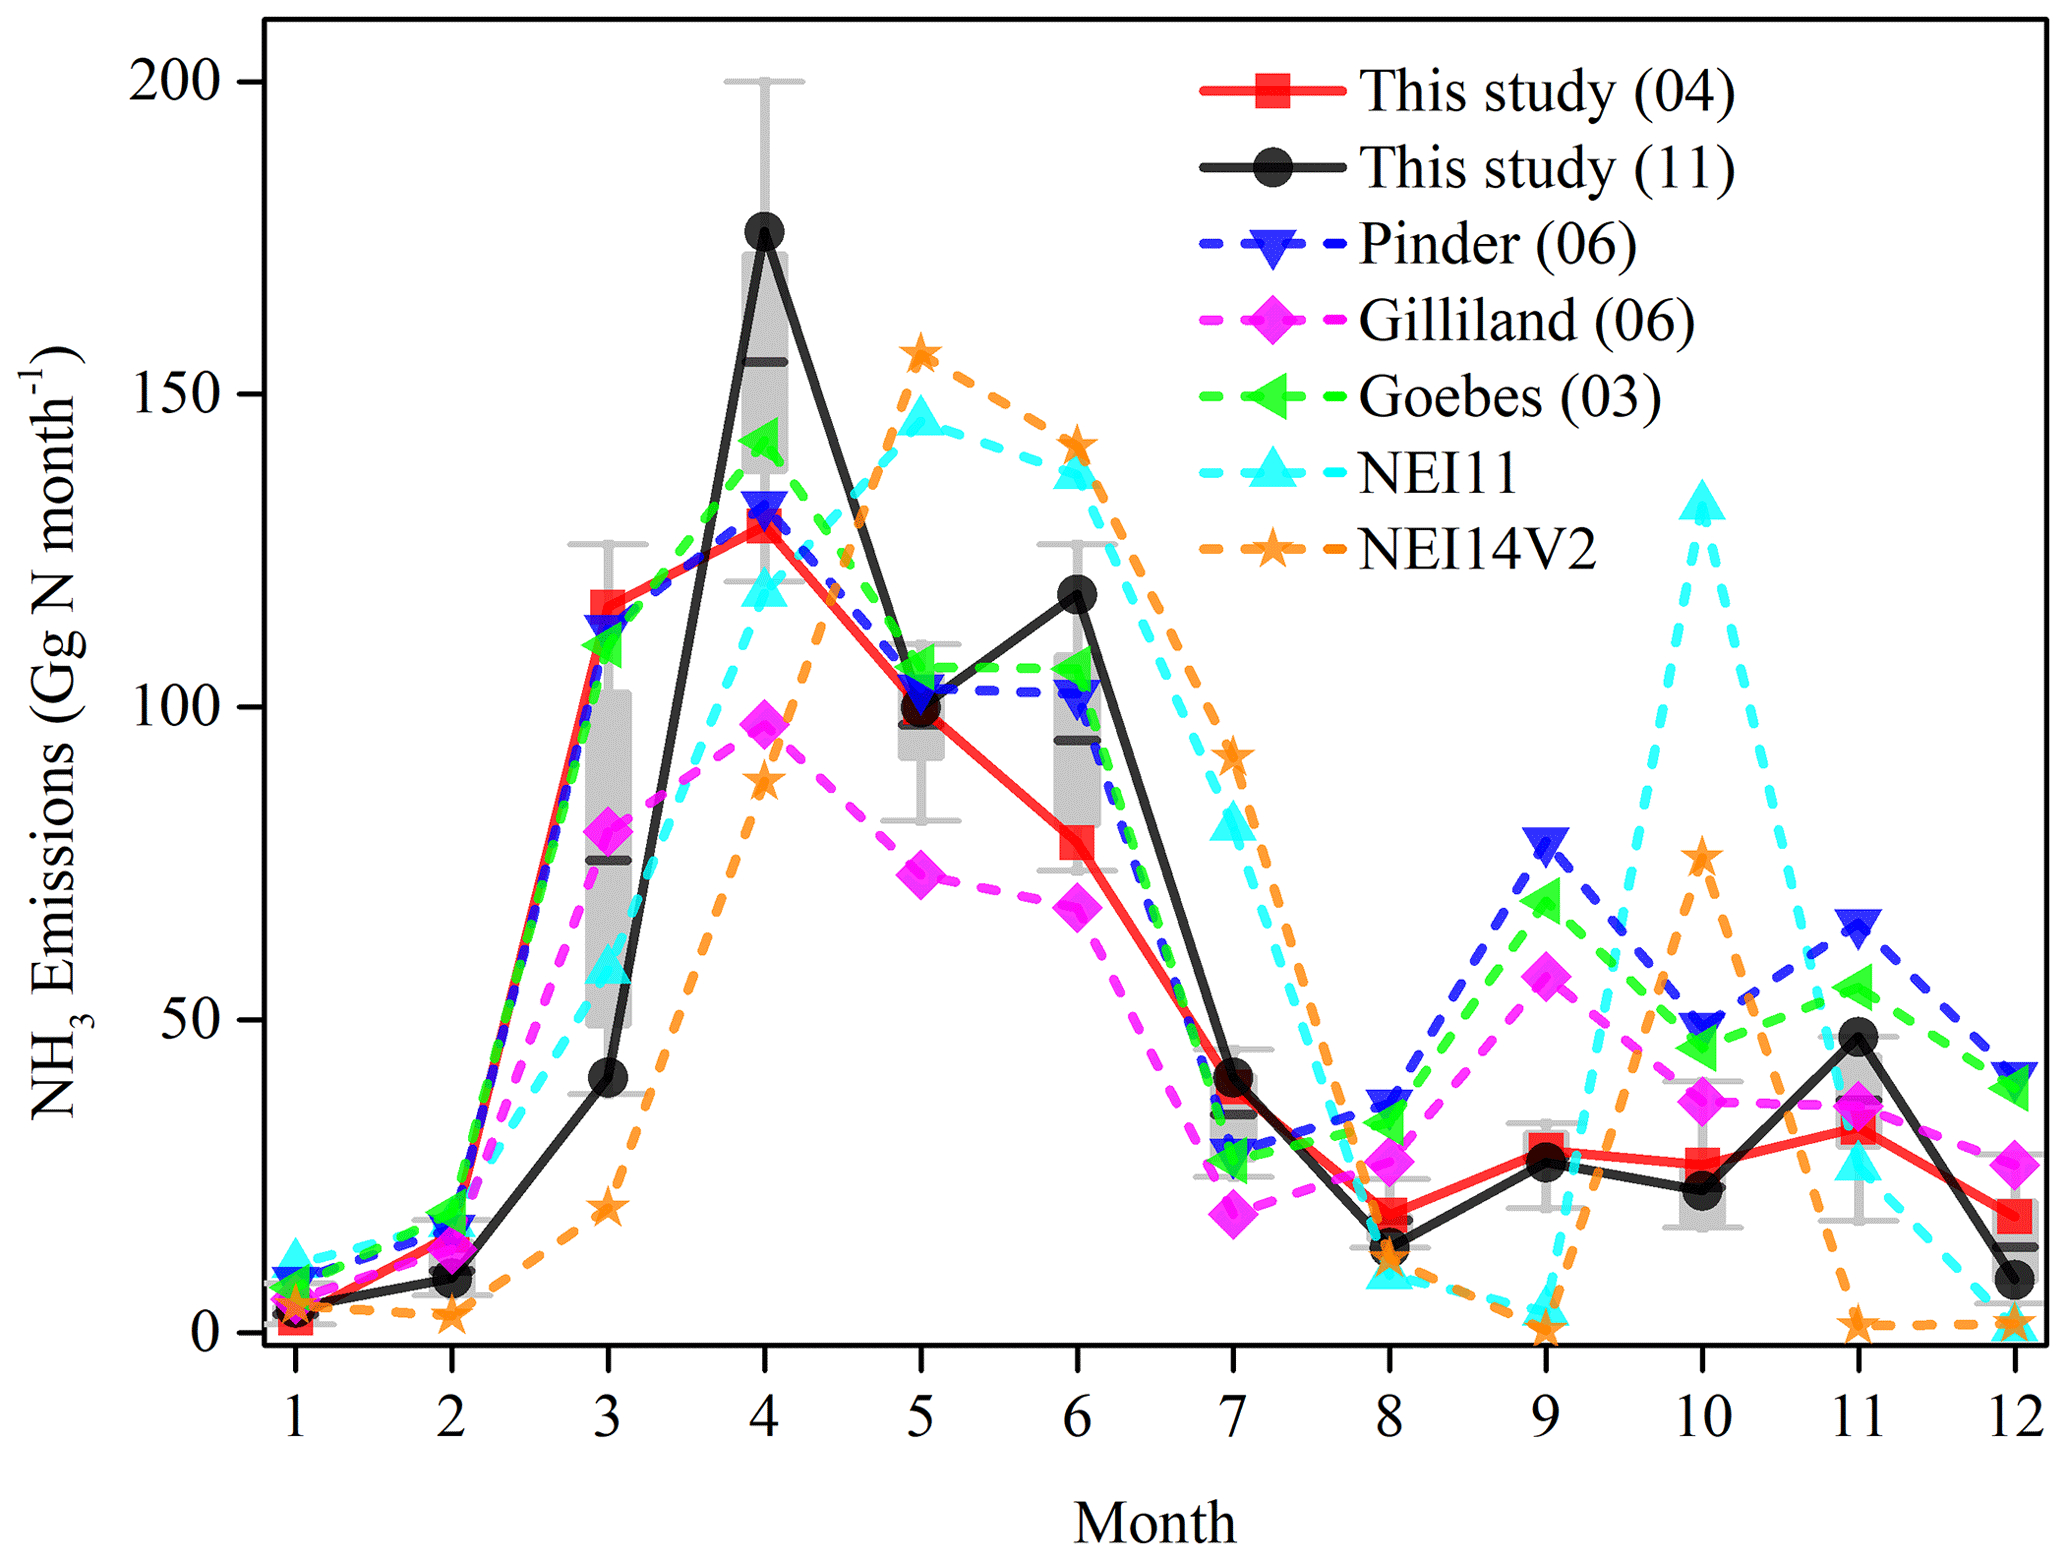
Figure 9Comparison of monthly NH3 emission patterns between our estimate and other studies. Two typical monthly patterns of NH3 emission in this study were used. The estimate of 2004 represents the pattern when planting date is early, whereas the simulation of 2011 stands for the pattern when planting date is delayed. Two simulations using different approaches by EPA NEI were chosen in the comparison. Grey boxes include 25 %–75 % of monthly NH3 emissions during 2005–2015 estimated by this study, black lines are mean values, and whiskers comprise the whole range of data.
4.2 Spatiotemporal change in the NH3 emissions
The “V” shape of historical national and regional NH3 emission factors mainly resulted from the changing preference in using different N fertilizer types (Cao et al., 2018). The decline in the early stage from the 1920s to the 1970s was due to the decrease in the use of ammonium sulfate, while the rising emission factor from the 1970s to the present was caused by the popularity of urea-based fertilizer (Figs. 1b and 7, Table S4). In addition, the N fertilizer use hot spots shifting to more alkaline areas, such as the Northern Great Plains, may contribute to this increasing trend. The NH3 emission factor estimated by our study is close to 6 % in the US and is significantly lower than the estimated global EFs, ranging from 11 % to 14 % (Bouwman et al., 2002; Paulot et al., 2014; Vira et al., 2020). This indicates that agricultural management in the US is more efficient in reducing NH3 loss compared to other counties. However, the NH3 emission factor varied substantially across the US, ranging from 2.5 % to 29 % (Fig. 4). We found the highest loss proportion (>12 %) in the Northern Great Plains and the Northwest. Adopting better N fertilizer management practices, such as appropriate application timing and method, is recommended to reduce NH3 emission in these high-loss regions.
NH3 emissions from synthetic N fertilizer in the US increased rapidly during 1960–1980, which may be attributed to cropland expansion (Nickerson et al., 2011) and the dramatic increase in N fertilizer use rate in most crop types (Cao et al., 2018). However, the national increases in total NH3 emissions from fertilizer use slowed down after 1980. Compared to the stable or declining trend in the other five regions, the NH3 emission of the Northern Great Plains and the Northwest kept increasing to recent years, which contributed to the post-1980 increase in national NH3 emissions (Fig. 2). We recognized NH3 emissions from corn and spring wheat dominated the increase in total NH3 emissions after the 1980s (Fig. 1a and Table S1). The conclusion drawn from our factorial contribution analysis shows that changes in cropland area and rotation have a minor influence on NH3 emission in the nation (Fig. 7), which is primarily because N fertilizer input was kept constant at the level of 1960. Besides, the cropland area changes represent the summation of cropland expansion and abandonment across the country, resulting in a relatively small contribution to NH3 emission increases. The USDA Crop Production Historical Report shows that the largest increases in planted areas among all non-legume crop types from the period of 1960–1980 to the period of 1995–2015 were corn and spring wheat, increasing by 12 % and 22 %, respectively (Fig. S4). Specifically, the increases in corn and spring wheat planting area were mainly found in Kansas, Minnesota, and the states in the Northern Great Plains and the Northwest (Fig. S4). In addition, the average N fertilizer use rates of corn and spring wheat have grown to be the second and third highest among other crop types since 2000 (Cao et al., 2018). Therefore, the rapid increase in corn and spring wheat cropland area combined with high N fertilizer use rate in the Northern Great Plains and the Northwest contributed to the increasing US NH3 emissions after the 1980s (Cao et al., 2018; Nickerson et al., 2011; Yu and Lu, 2018).
Urea-based fertilizer has been proven to trigger high NH3 volatilization (Sommer et al., 2004). With two major urea-based fertilizer types, urea and nitrogen solution, increased by over 4000 % and 300 % since 1980, respectively (Fig. S5), the Northern Great Plains and the Northwest have grown to be the most urea-based fertilizer use regions since 1980 (Cao et al., 2018), which contributed to the steep increase in NH3 emission during this period (Figs. 2 and 7). Even worse, the alkaline soil in the Northern Great Plains and the Northwest led to a high risk of NH3 emission compared to other regions. For example, Iowa and Illinois in the Midwest received the most intensive N fertilizer in 2015 (Cao et al., 2018) but they emitted less intensive NH3, which might be due to the neutral to weakly acidic soil. Under the enhanced effect of alkaline soil in the Northern Great Plains and the Northwest, the increasing urea-based N fertilizer use and the northwestward corn and spring wheat expansion together greatly boosted the NH3 loss proportion, which may contribute to the decreasing crop NUE in these regions (Lu et al., 2019) (Fig. 4). Although soil acidification through long-term agricultural land use may offset the effects of the increasing use of urea-based fertilizer, more effective policies and agricultural management are still needed in those high-NH3-loss-proportion regions (Veenstra and Lee, 2015; Dai et al., 2018), which can prevent air quality deterioration and enhance crop NUE. Applying urease inhibitor with urea-based fertilizer was proven an effective practice to decrease NH3 loss (Pan et al., 2016; Soares et al., 2012; Tian et al., 2015). In addition, 4R management (Right fertilizer source, Right rate, Right timing, and Right place) is effective in mitigating high NH3 emissions.
4.3 Monthly peak of NH3 emissions shifting from 1930 to 2015
The application timings of N fertilizer differ dramatically across the US (Cao et al., 2018), which highly influences the seasonality of NH3 emissions in different regions (Paulot et al., 2014). Corn and spring wheat producers in the Midwest, the Northern Great Plains, and the Northwest apply most N fertilizer in spring before planting (Cao et al., 2018), resulting in the largest NH3 emission in April (Fig. 2). Conversely farmers in the Southern Great Plains prefer to apply most N fertilizer after planting for cotton and a considerable amount of N fertilizer at green-up for winter wheat, resulting in peaks in summer and early spring. As corn and spring wheat expanded into Minnesota, the Northern Great Plains, and the Northwest, as well as the increased use in urea-based fertilizer, NH3 emissions from these areas rapidly gained the weight of total NH3 emissions of the country. The hot spots of NH3 emission shifted from the central US to the Northern Great Plains and Minnesota (Fig. 3). This change advanced the monthly NH3 emission peak at the national scale (Fig. 6). In addition, the monthly peak shifting was also driven by an advanced crop planting date. Due to the development of genotypes and improvement of agricultural management and equipment, the corn-planting date became earlier by approximately 2 weeks between the 1980s and the 2000s in the corn belt (Kucharik, 2006). In addition, widespread springtime warming across much of North America has also pushed toward an earlier planting date since the 1940s (Duvick, 1989; Hu et al., 2005; Schwartz et al., 2006).
4.4 Effects of increasing NH3 emissions on NH deposition
Although the central US is the hot spot of NH deposition, the largest increase in wet NH deposition was found in the Northern Great Plains and Minnesota from 1985 to 2015 (Du et al., 2014; Li et al., 2016). Our result shows that the increase in NH3 emissions from synthetic N fertilizer in the Northern Great Plains, the Northwest, and Kansas was significantly correlated to the increase in NH concentration in precipitation during 1985–2015 (Figs. 10 and S6). NH deposition is highly affected by local NH3 emissions because NH3 volatilized into the atmosphere has a very short lifetime and deposits close to the source quickly. Therefore, in addition to growing forest fire and livestock numbers (Abatzoglou and Williams, 2016), our study reveals that NH3 emissions from increasing N fertilizer use played an important role in influencing the interannual variability of NH deposition in the northwestern US over recent decades. Whereas with decreasing NH3 emissions from N fertilizer in parts of Washington, Wisconsin, Florida, the Southeast and the Northeast since 1980 (Fig. 2), the NH deposition promoted by an increasing forest fire, rapid urbanization, and growing livestock population (Fenn et al., 2018) showed strong negative relations with NH3 emissions in these regions. In addition to NH deposition, the PM2.5 also showed an increasing trend in Minnesota, the Northern Great Plains, and the Northwest from 2002 to 2013 (US EPA, 2020). Since NH3 in the atmosphere is heavily involved in formatting PM2.5, the increase in fertilizer-induced NH3 emissions may contribute to the PM2.5 increase in these regions. Therefore, the increase in NH3 emissions induced by northwestward corn and spring wheat expansion and consequent urea-based fertilizer use might largely enhance the environmental stress in these regions.
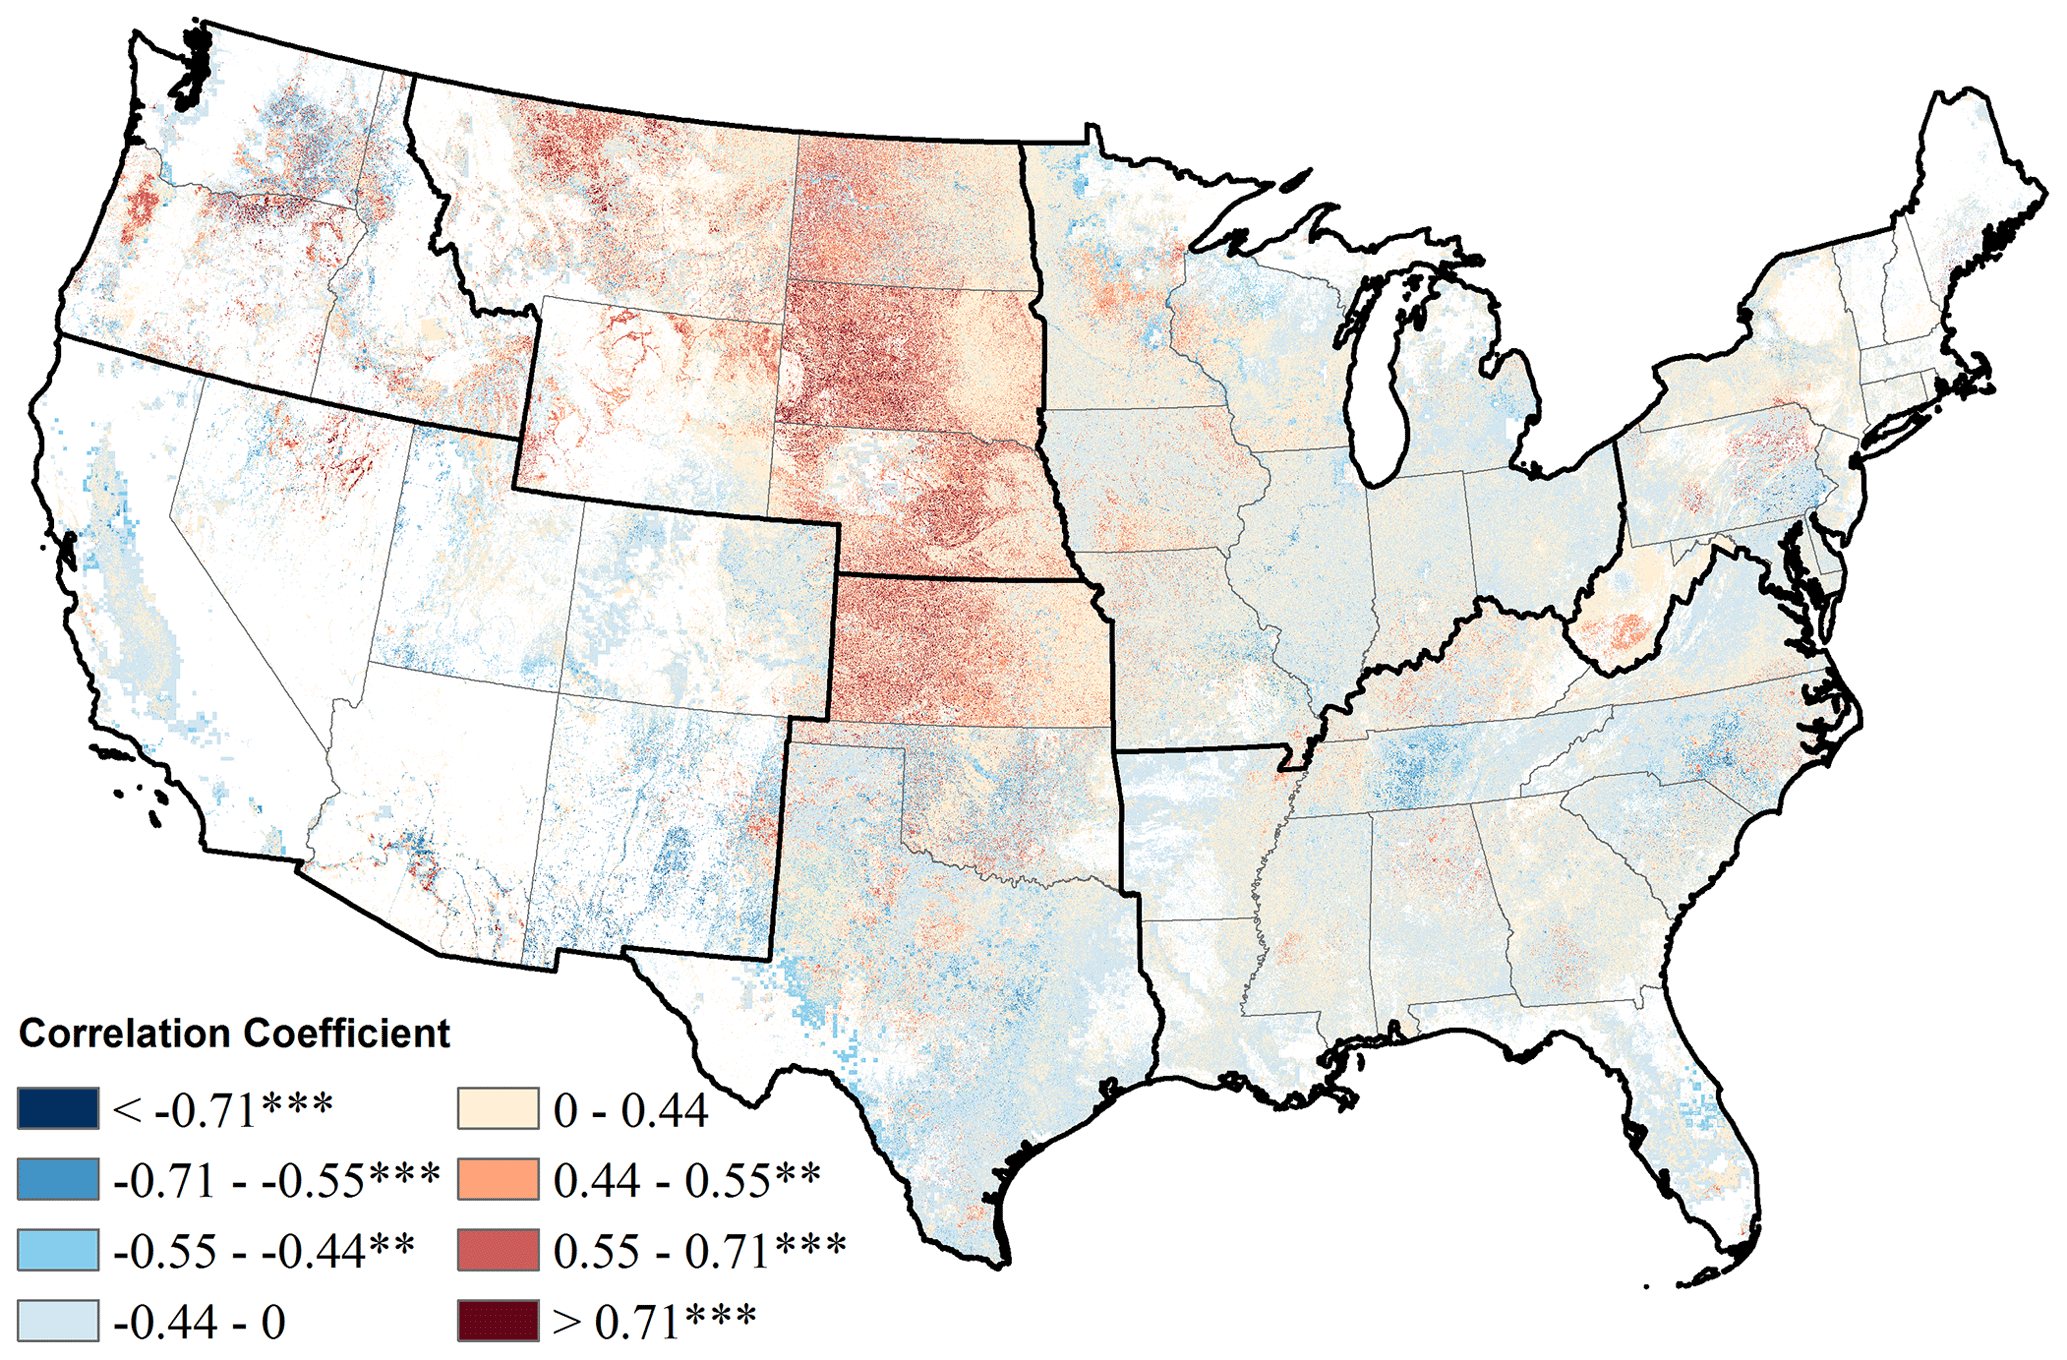
Figure 10Correlation coefficient between annual NH3 emission from N fertilizer uses and annual NH concentration in precipitation between 1985 and 2015. The correlation coefficient was calculated between the two time series at each 1 km × 1 km grid cell. refers to p value < 0.01; refers to P value < 0.001.
4.5 Uncertainty
The major uncertainty sources in this study include the following aspects. (1) State-level N management data (rate, application timing, application method, and the fraction of each N fertilizer type) were used to calculate NH3 emissions over the contiguous US in our study because of the paucity of sub-state details. (2) The crop-specific N application timing and method derived from the latest survey years were assumed to be unchanged over time due to the scarcity of interannual survey data. This assumption may cause bias in the monthly pattern of NH3 emissions. For example, urea-based fertilizer, which is suitable for spring application, has been increasingly used to replace fall-applied anhydrous ammonia since 1960; we may underestimate NH3 emissions in fall before 2000. (3) The ratio of each N fertilizer type was assumed to be constant across crop types in each state in a year. This may cause biases because farmers may apply different types of N fertilizers to different crops. (4) We allocated each N fertilizer type to the same application timing for each crop of each state based on state-level crop-specific application timing. However, farmers may only apply a certain N fertilizer at the time when its maximum profit can be achieved. For example, due to the high potential loss, nitrogen solution is seldom applied in fall after harvest. (5) Although we considered the effects of temperature, soil properties, crop type, and N fertilizer type and application method on NH3 emission estimate, other factors such as wind speed, soil moisture, nitrification and urease inhibitors, and different N fertilizer use rate level may also significantly influence NH3 emissions (Behera et al., 2013; Jiang et al., 2017; Lam et al., 2017). Increasing evidence suggests that NH3 emissions increase exponentially with increasing N fertilizer rate (Jiang et al., 2017). Zhou et al. (2016) developed a nonlinear Bayesian tree regression model as a function of N fertilizer rate to estimate NH3 emission in China and found the estimates match well with observations and satellite-based products. Thus, we may underestimate NH3 emissions under a high N fertilizer use rate. Another example is the use of nitrification and urease inhibitors. Nitrification inhibitors have been found to increase NH3 loss while urease inhibitors can limit NH3 volatilization (Lam et al., 2017). Therefore, the uncertainty of usage of nitrification and urease inhibitor is likely to misrepresent NH3 emissions. In addition, considering the bidirectional exchange process may improve the accuracy of seasonal NH3 emission estimation (Bash et al., 2013). However, our work builds upon the newly developed N fertilizer management and crop phenology dataset that combines crop-specific N fertilizer use rate, fertilizer type, application timing, application method, and phenology for each state ranging from 1900 to 2015. The REML model we are using makes sufficient use of this information and provides higher levels of details over space and time.
This study comprehensively examined the spatiotemporal patterns of NH3 emission owing to the changes in temperature, cropland area, rotation, and N fertilizer management in the US from 1900 to 2015. We also examined the relationship between NH3 emission and NH concentration in precipitation over the last 3 decades. The gridded monthly time-series estimations of NH3 emission, at a spatial resolution of 1 km × 1 km, could serve as a solid database for national and regional air quality modeling and N budget assessment.
Our results indicate that NH3 emission from synthetic N fertilizer use in the US rapidly increased from <50 Gg N yr−1 before the 1960s to 641 Gg N yr−1 in 2015, among which corn and spring wheat are the major contributors. In addition, enhanced use of urea-based fertilizers strengthened the N loss through NH3 emission after 1960. Spatially, the intensive NH3 emission spots have shifted from the central US to the Northern Great Plains since 1960 due to the northwestward cropland expansion onto the alkaline soils. Springtime warming, cropland expansion, and N fertilizer management practice changes also altered the seasonal pattern of NH3 emission in the US, shifting the peak emission month from May to April since the 1960s. Moreover, our analyses reveal that the increasing deposited NH concentration in the Northern Great Plains could be greatly attributed to the increasing NH3 emission in this region since 1985. In summary, our work highlights the importance of comprehensively assessing the environmental consequences of agricultural production. We call for proper fertilizer management practices in reducing NH3 emission and improving nitrogen use efficiency.
The estimated NH3 emission dataset derived from this study is publicly available via figshare at https://doi.org/10.6084/m9.figshare.11692038.v3 (Cao et al., 2020).
The supplement related to this article is available online at: https://doi.org/10.5194/acp-20-11907-2020-supplement.
CL and PC designed the research. PC compiled the database and carried out the data analysis. PC drafted the manuscript, with the guidance of CL and JZ. All the co-authors contributed to and reviewed the manuscript.
The authors declare that they have no conflict of interest.
This work was supported by the Iowa Nutrient Research Center and NSF Dynamics of Coupled Natural and Human Systems (CNH) program (1924178).
This research has been supported by the NSF Dynamics of Coupled Natural and Human Systems (CNH) program (grant no. 1924178).
The article processing charges for this open-access
publication were covered by the Iowa State University Library.
This paper was edited by Jennifer G. Murphy and reviewed by Fabien Paulot and one anonymous referee.
Abatzoglou, J. T. and Williams, A. P.: Impact of anthropogenic climate change on wildfire across western US forests, P. Natl. Acad. Sci. USA, 113, 11770–11775, https://doi.org/10.1073/pnas.1607171113, 2016.
Alexandratos, N. and Bruinsma, J.: World agriculture towards 2030/2050: the 2012 revision, ESA working paper No. 12-03, FAO, Rome, 2012.
Bash, J. O., Cooter, E. J., Dennis, R. L., Walker, J. T., and Pleim, J. E.: Evaluation of a regional air-quality model with bidirectional NH3 exchange coupled to an agroecosystem model, Biogeosciences, 10, 1635–1645, https://doi.org/10.5194/bg-10-1635-2013, 2013.
Behera, S. N., Sharma, M., Aneja, V. P., and Balasubramanian, R.: Ammonia in the atmosphere: A review on emission sources, atmospheric chemistry and deposition on terrestrial bodies, Environ. Sci. Pollut. Res., 20, 8092–8131, https://doi.org/10.1007/s11356-013-2051-9, 2013.
Bouwman, A. F., Boumans, L. J. M., and Batjes, N. H.: Estimation of global NH3 volatilization loss from synthetic fertilizers and animal manure applied to arable lands and grasslands, Global Biogeochem. Cy., 16, 8–14, https://doi.org/10.1029/2000GB001389, 2002.
Bowman, W. D., Cleveland, C. C., Halada, Ĺ., Hreško, J., and Baron, J. S.: Negative impact of nitrogen deposition on soil buffering capacity, Nat. Geosci., 1, 767–770, https://doi.org/10.1038/ngeo339, 2008.
Cao, P., Lu, C., and Yu, Z.: Historical nitrogen fertilizer use in agricultural ecosystems of the contiguous United States during 1850–2015: application rate, timing, and fertilizer types, Earth Syst. Sci. Data, 10, 969–984, https://doi.org/10.5194/essd-10-969-2018, 2018.
Cao, P., Lu, C., Zhang, J., and Khadilkar, A.: Ammonia emission from agricultural synthetic nitrogen fertilizer use in the contiguous U.S. during 1900–2015: a set of gridded time-series data, Figshare, https://doi.org/10.6084/m9.figshare.11692038.v3, 2020.
Cassman, K. G., Dobermann, A. R., and Walters, D. T.: Agroecosystems, Nitrogen-use Efficiency, and Nitrogen Management, Ambio, 31, 132–140, https://doi.org/10.1579/0044-7447-31.2.132, 2002.
Cooter, E. J., Bash, J. O., Benson, V., and Ran, L.: Linking agricultural crop management and air quality models for regional to national-scale nitrogen assessments, Biogeosciences, 9, 4023–4035, https://doi.org/10.5194/bg-9-4023-2012, 2012.
Dai, F., Lv, Z., and Liu, G.: Assessing Soil Quality for Sustainable Cropland Management Based on Factor Analysis and Fuzzy Sets: A Case Study in the Lhasa River Valley, Tibetan Plateau, Sustainability, 10, 1–17, https://doi.org/10.3390/su10103477, 2018.
David, M. M. B., Gentry, L. L. E., Kovacic, D. A., and Smith, K. M. K.: Nitrogen balance in and export from an agricultural watershed, J. Environ. Qual., 26, 1038–1048, https://doi.org/10.2134/jeq1997.00472425002600040015x, 1997.
Du, E., Vries, W. de, Galloway, J. N., Hu, X., and Fang, J.: Changes in wet nitrogen deposition in the United States between 1985 and 2012, Environ. Res. Lett., 9, 95004, https://doi.org/10.1088/1748-9326/9/9/095004, 2014.
Duvick, D. N.: Possible genetic causes of increased variability in US maize yield, in: Variability in grain yields: Implications for agricultural research and policy in developing countries, edited by: Anderson, J. R. and Hazel, P. B. R., John Hopkins Univ. Press, Baltimore, MD, 147–156, 1989.
Eickhout, B., Bouwman, A. F., and van Zeijts, H.: The role of nitrogen in world food production and environmental sustainability, Agr. Ecosyst. Environ., 116, 4–14, https://doi.org/10.1016/j.agee.2006.03.009, 2006.
Erisman, J. W., Sutton, M. A., Galloway, J., Klimont, Z., and Winiwarter, W.: How a century of ammonia synthesis changed the world, Nat. Geosci., 1, 636–639, https://doi.org/10.1038/ngeo325, 2008.
Fenn, M. E., Bytnerowicz, A., Schilling, S. L., Vallano, D. M., Zavaleta, E. S., Weiss, S. B., Morozumi, C., Geiser, L. H., and Hanks, K.: On-road emissions of ammonia: An underappreciated source of atmospheric nitrogen deposition, Sci. Total Environ., 625, 909–919, https://doi.org/10.1016/j.scitotenv.2017.12.313, 2018.
Galloway, J. N., Aber, J. D., Erisman, J. W., Seitzinger, S. P., Howarth, R. W., Cowling, E. B., and Cosby, B. J.: The Nitrogen Cascade, Bioscience, 53, 341–356, https://doi.org/10.1641/0006-3568(2003)053[0341:TNC]2.0.CO;2, 2003.
Gilliland, A. B.: Seasonal NH3 emission estimates for the eastern United States based on ammonium wet concentrations and an inverse modeling method, J. Geophys. Res., 108, 4477, https://doi.org/10.1029/2002JD003063, 2003.
Gilliland, A. B., Wyat Appel, K., Pinder, R. W., and Dennis, R. L.: Seasonal NH3 emissions for the continental united states: Inverse model estimation and evaluation, Atmos. Environ., 40, 4986–4998, https://doi.org/10.1016/j.atmosenv.2005.12.066, 2006.
Goebes, M. D., Strader, R., and Davidson, C.: An ammonia emission inventory for fertilizer application in the United States, Atmos. Environ., 37, 2539–2550, https://doi.org/10.1016/S1352-2310(03)00129-8, 2003.
gSSURGO – Gridded Soil Survey Geographic: Database for the Conterminous United States, United States Dep. Agric. Nat. Resour. Conserv. Serv., available at https://gdg.sc.egov.usda.gov/, last access: 20 October 2020.
Hu, Q., Weiss, A., Feng, S., and Baenziger, P. S.: Earlier winter wheat heading dates and warmer spring in the U.S. Great Plains, Agr. Forest Meteorol., 135, 284–290, https://doi.org/10.1016/j.agrformet.2006.01.001, 2005.
Huang, X., Song, Y., Li, M., Li, J., Huo, Q., Cai, X., Zhu, T., Hu, M., and Zhang, H.: A high-resolution ammonia emission inventory in China, Global Biogeochem. Cy., 26, 1–14, https://doi.org/10.1029/2011GB004161, 2012.
Jiang, Y., Deng, A., Bloszies, S., Huang, S., and Zhang, W.: Nonlinear response of soil ammonia emissions to fertilizer nitrogen, Biol. Fertil. Soils, 53, 269–274, https://doi.org/10.1007/s00374-017-1175-3, 2017.
Johnston, C. A.: Agricultural expansion: land use shell game in the U.S. Northern Plains, Landsc. Ecol., 29, 81–95, https://doi.org/10.1007/s10980-013-9947-0, 2014.
Kang, Y., Liu, M., Song, Y., Huang, X., Yao, H., Cai, X., Zhang, H., Kang, L., Liu, X., Yan, X., He, H., Zhang, Q., Shao, M., and Zhu, T.: High-resolution ammonia emissions inventories in China from 1980 to 2012, Atmos. Chem. Phys., 16, 2043–2058, https://doi.org/10.5194/acp-16-2043-2016, 2016.
Kucharik, C. J.: A Multidecadal Trend of Earlier Corn Planting in the Central USA, Agron. J., 98, 1544–1550, https://doi.org/10.2134/agronj2006.0156, 2006.
Lam, S. K., Suter, H., Mosier, A. R., and Chen, D.: Using nitrification inhibitors to mitigate agricultural N2O emission: a double-edged sword?, Global Change Biol., 23, 485–489, https://doi.org/10.1111/gcb.13338, 2017.
Li, Y., Schichtel, B. A., Walker, J. T., Schwede, D. B., Chen, X., Lehmann, C. M. B., Puchalski, M. A., Gay, D. A., and Collett, J. L.: Increasing importance of deposition of reduced nitrogen in the United States, P. Natl. Acad. Sci. USA, 113, 5874–5879, https://doi.org/10.1073/pnas.1525736113, 2016.
Liu, L., Zhang, X., Wong, A. Y. H., Xu, W., Liu, X., Li, Y., Mi, H., Lu, X., Zhao, L., Wang, Z., Wu, X., and Wei, J.: Estimating global surface ammonia concentrations inferred from satellite retrievals, Atmos. Chem. Phys., 19, 12051–12066, https://doi.org/10.5194/acp-19-12051-2019, 2019.
Lu, C., Zhang, J., Cao, P., and Hatfield, J. L.: Are We Getting Better in Using Nitrogen: Variations in Nitrogen Use Efficiency of Two Cereal Crops Across the United States, Earth's Future, 7, 939–952, https://doi.org/10.1029/2019EF001155, 2019.
Mesinger, F., DiMego, G., Kalnay, E., Mitchell, K., Shafran, P. C., Ebisuzaki, W., Jović, D., Woollen, J., Rogers, E., Berbery, E. H., Ek, M. B., Fan, Y., Grumbine, R., Higgins, W., Li, H., Lin, Y., Manikin, G., Parrish, D., and Shi, W.: North American Regional Reanalysis, B. Am. Meteorol. Soc., 87, 343–360, https://doi.org/10.1175/BAMS-87-3-343, 2006.
Mitchell, T. D. and Jones, P. D.: An improved method of constructing a database of monthly climate observations and associated high-resolution grids, Int. J. Climatol., 25, 693–712, https://doi.org/10.1002/joc.1181, 2005.
NADP – National Atomspheric Deposition Program: NADP Program Office, Madison, WI, available at: http://nadp.slh.wisc.edu/ntn/annualmapsByYear.aspx, last access: 20 October 2020.
Nickerson, C., Ebel, R., Borchers, A., and Carriazo, F.: Major Uses of Land in the United States, 2007, available at: https://www.ers.usda.gov/webdocs/publications/44625/11159_eib89_2_.pdf?v=41055 (last access: 20 October 2020), 2011.
Pan, B., Lam, S. K., Mosier, A., Luo, Y., and Chen, D.: Ammonia volatilization from synthetic fertilizers and its mitigation strategies: A global synthesis, Agr. Ecosyst. Environ., 232, 283–289, https://doi.org/10.1016/j.agee.2016.08.019, 2016.
Park, R. J., Jacob, D. J., Field, B. D., Yantosca, R. M., and Chin, M.: Natural and transboundary pollution influences on sulfate-nitrate-ammonium aerosols in the United States: Implications for policy, J. Geophys. Res.-Atmos., 109, D15204, https://doi.org/10.1029/2003JD004473, 2004.
Paulot, F., Jacob, D. J., Pinder, R. W., Bash, J. O., Travis, K., and Henze, D. K.: Ammonia emissions in the United States, European Union, and China derived by high-resolution inversion of ammonium wet deposition data: Interpretation with a new agricultural emissions inventory (MASAGE_NH3), J. Geophys. Res. Atmos., 119, 4343–4364, https://doi.org/10.1002/2013JD021130, 2014.
Pinder, R. W., Adams, P. J., Pandis, S. N., and Gilliland, A. B.: Temporally resolved ammonia emission inventories: Current estimates, evaluation tools, and measurement needs, J. Geophys. Res.-Atmos., 111, D16310, https://doi.org/10.1029/2005JD006603, 2006.
Reis, S., Pinder, R. W., Zhang, M., Lijie, G., and Sutton, M. A.: Reactive nitrogen in atmospheric emission inventories, Atmos. Chem. Phys., 9, 7657–7677, https://doi.org/10.5194/acp-9-7657-2009, 2009.
Riddick, S., Ward, D., Hess, P., Mahowald, N., Massad, R., and Holland, E.: Estimate of changes in agricultural terrestrial nitrogen pathways and ammonia emissions from 1850 to present in the Community Earth System Model, Biogeosciences, 13, 3397–3426, https://doi.org/10.5194/bg-13-3397-2016, 2016.
Schwartz, M. D., Ahas, R., and Aasa, A.: Onset of spring starting earlier across the Northern Hemisphere, Global Change Biol., 12, 343–351, https://doi.org/10.1111/j.1365-2486.2005.01097.x, 2006.
Soares, J. R., Cantarella, H., and de Menegale, M. L. C.: Ammonia volatilization losses from surface-applied urea with urease and nitrification inhibitors, Soil Biol. Biochem., 52, 82–89, https://doi.org/10.1016/j.soilbio.2012.04.019, 2012.
Sommer, S. G., Schjoerring, J. K., and Denmead, O. T.: Ammonia emission from mineral fertilizers and fertilized crops, Adv. Agron., 82, 82004–82008, 2004.
Tian, Z., Wang, J. J., Liu, S., Zhang, Z., Dodla, S. K., and Myers, G.: Application effects of coated urea and urease and nitrification inhibitors on ammonia and greenhouse gas emissions from a subtropical cotton field of the Mississippi delta region, Sci. Total Environ., 533, 329–338, https://doi.org/10.1016/j.scitotenv.2015.06.147, 2015.
Tilman, D., Cassman, K. G., Matson, P. A., Naylor, R., and Polasky, S.: Agricultural sustainability and intensive production practices, Nature, 418, 671–677, https://doi.org/10.1038/nature01014, 2002.
USDA-ERS – US Department of Agriculture – Economic Research Service: Tailored Report: Crop Production Practices, available at: https://data.ers.usda.gov/reports.aspx?ID=17883, last access: 20 October 2020.
USDA-NASS – US Department of Agriculture – National Agricultural Statistics Service: Field Crops Crop Progress, available at: https://www.nass.usda.gov/Quick_Stats/Lite/index.php, last access: 20 October 2020.
US EPA – Environmental Protection Agency: 2011 National Emissions Inventory Data, available at: https://www.epa.gov/air-emissions-inventories/2011-national-emissions-inventory-nei-data, last access: 20 October 2020.
US Global Change Research Program: Fourth National Climate Assessment, available at: https://www.globalchange.gov/nca4, last access: 20 October 2020.
Van Grinsven, H. J. M., Bouwman, L., Cassman, K. G., van Es, H. M., McCrackin, M. L., and Beusen, A. H. W.: Losses of Ammonia and Nitrate from Agriculture and Their Effect on Nitrogen Recovery in the European Union and the United States between 1900 and 2050, J. Environ. Qual., 44, 356–367, https://doi.org/10.2134/jeq2014.03.0102, 2015.
Veenstra, J. J. and Lee, B. C.: Soil profile transformation after 50 years of agricultural land use, Soil Sci. Soc. Am. J., 79, 1154–1162, https://doi.org/10.2136/sssaj2015.01.0027, 2015.
Vira, J., Hess, P., Melkonian, J., and Wieder, W. R.: An improved mechanistic model for ammonia volatilization in Earth system models: Flow of Agricultural Nitrogen version 2 (FANv2), Geosci. Model Dev., 13, 4459–4490, https://doi.org/10.5194/gmd-13-4459-2020, 2020.
Williams, J. R., Jones, C. A., Kiniry, J. R., and Spanel, D. A.: The EPIC crop growth model, Am. Soc. Agricult. Biol. Eng., 32, 0497–0511, https://doi.org/10.13031/2013.31032, 1989.
Xu, R., Tian, H., Pan, S., Prior, S. A., Feng, Y., Batchelor, W. D., Chen, J., and Yang, J.: Global ammonia emissions from synthetic nitrogen fertilizer applications in agricultural systems: Empirical and process-based estimates and uncertainty, Global Change Biol., 25, 314–326, 2019.
Yu, Z. and Lu, C.: Historical cropland expansion and abandonment in the continental U.S. during 1850 to 2016, Global Ecol. Biogeogr., 27, 322–333, https://doi.org/10.1111/geb.12697, 2018.
Yu, Z., Lu, C., Cao, P., and Tian, H.: Long-term terrestrial carbon dynamics in the Midwestern United States during 1850–2015: Roles of land use and cover change and agricultural management, Global Change Biol., 24, 2673–2690, https://doi.org/10.1111/gcb.14074, 2018.
Zhou, F., Ciais, P., Hayashi, K.,. Galloway, J., Kim, D. G., Yang, C., Li, S., Liu, B., Shang, Z., and Gao, S.: Re-estimating NH3 emissions from Chinese cropland by a new nonlinear model, Environ. Sci. Technol., 50, 564–572, https://doi.org/10.1021/acs.est.5b03156, 2016.
Zhu, L., Henze, D. K., Bash, J. O., Cady-Pereira, K. E., Shephard, M. W., Luo, M., and Capps, S. L.: Sources and Impacts of Atmospheric NH3: Current Understanding and Frontiers for Modeling, Measurements, and Remote Sensing in North America, Curr. Pollut. Rep., 1, 95–116, https://doi.org/10.1007/s40726-015-0010-4, 2015.