the Creative Commons Attribution 4.0 License.
the Creative Commons Attribution 4.0 License.
 | 21 Oct 2020
Roll vortices induce new particle formation bursts in the planetary boundary layer
Janne Lampilahti
Hanna Elina Manninen
Katri Leino
Riikka Väänänen
Antti Manninen
Stephany Buenrostro Mazon
Tuomo Nieminen
Matti Leskinen
Joonas Enroth
Marja Bister
Sergej Zilitinkevich
Juha Kangasluoma
Heikki Järvinen
Veli-Matti Kerminen
Tuukka Petäjä
Markku Kulmala
Recent studies have shown the importance of new particle formation (NPF) to global cloud condensation nuclei (CCN) production, as well as to air pollution in megacities. In addition to the necessary presence of low-volatility vapors that can form new aerosol particles, both numerical and observational studies have shown that the dynamics of the planetary boundary layer (BL) plays an important role in NPF. Evidence from field observations suggests that roll vortices might be favorable for inducing NPF in a convective BL. However, direct observations and estimates of the potential importance of this phenomenon to the production of new aerosol particles are lacking. Here we show that rolls frequently induce NPF bursts along the horizontal circulations and that the small clusters and particles originating from these localized bursts grow in size similar to particles typically ascribed to atmospheric NPF that occur almost homogeneously at a regional scale. We outline a method to identify roll-induced NPF from measurements and, based on the collected data, estimate the impact of roll vortices on the overall aerosol particle production due to NPF at a boreal forest site (83 % ± 34 % and 26 % ± 8 % overall enhancement in particle formation for 3 and 10 nm particles, respectively). We conclude that the formation of roll vortices should be taken into account when estimating particle number budgets in the atmospheric BL.
- Article
(4130 KB) - Full-text XML
- BibTeX
- EndNote


Atmospheric new particle formation (NPF) is a globally important source of aerosol particles and cloud condensation nuclei (CCN) (Dunne et al., 2016; Gordon et al., 2017; Kerminen et al., 2018; Kulmala et al., 2004), having potentially large influences on climate via aerosol–cloud interactions (Boucher et al., 2013), as well as on human health by increasing ultrafine particle number concentrations. NPF involves the formation of molecular clusters (∼ 1.5 nm) in the atmosphere, and under specific conditions these clusters may grow to larger aerosol particles in the sub-100 nm size range. Under atmospheric background conditions, increased concentrations of nucleation mode (sub-25 nm) particles likely come from recent NPF. When the particles are larger than ∼ 50 nm in diameter, they can act as nuclei for cloud droplets (Kerminen et al., 2012) and influence radiative and other properties of clouds (e.g., Gryspeerdt et al., 2014; Rosenfeld et al., 2014).
Numerical studies have shown that fluctuations in ambient temperature and relative humidity caused by, for example, small-scale turbulence, large eddies such as roll vortices (Easter and Peters, 1994) or mixing over a temperature inversion (Nilsson and Kulmala, 1998) can lead to significant enhancements in the new particle formation rate compared to only mean conditions. This is because the formation rate has a nonlinear dependence on temperature and the gas-phase concentrations of the precursor vapors. Therefore, fluctuations in these variables, as opposed to mean conditions in which the fluctuations are averaged out, can have a net enhancing effect on the source strength of aerosol particles by NPF.
In observational studies, increased nucleation mode particle concentrations have been measured in atmospheric layers where turbulent fluctuations were enhanced, for example, in turbulent layers inside the residual layer (Wehner et al., 2010) and in the inversion capping a shallow mixed layer (Platis et al., 2015; Siebert et al., 2004). Other airborne measurements have found that during NPF, the number concentration of nucleation mode particles shows considerable – up to an order of magnitude – variation within the boundary layer (BL) (Crumeyrolle et al., 2010; Leino et al., 2019; O'Dowd et al., 2009; Schobesberger et al., 2013; Väänänen et al., 2016). One possible reason for this could be the effect of BL dynamics.
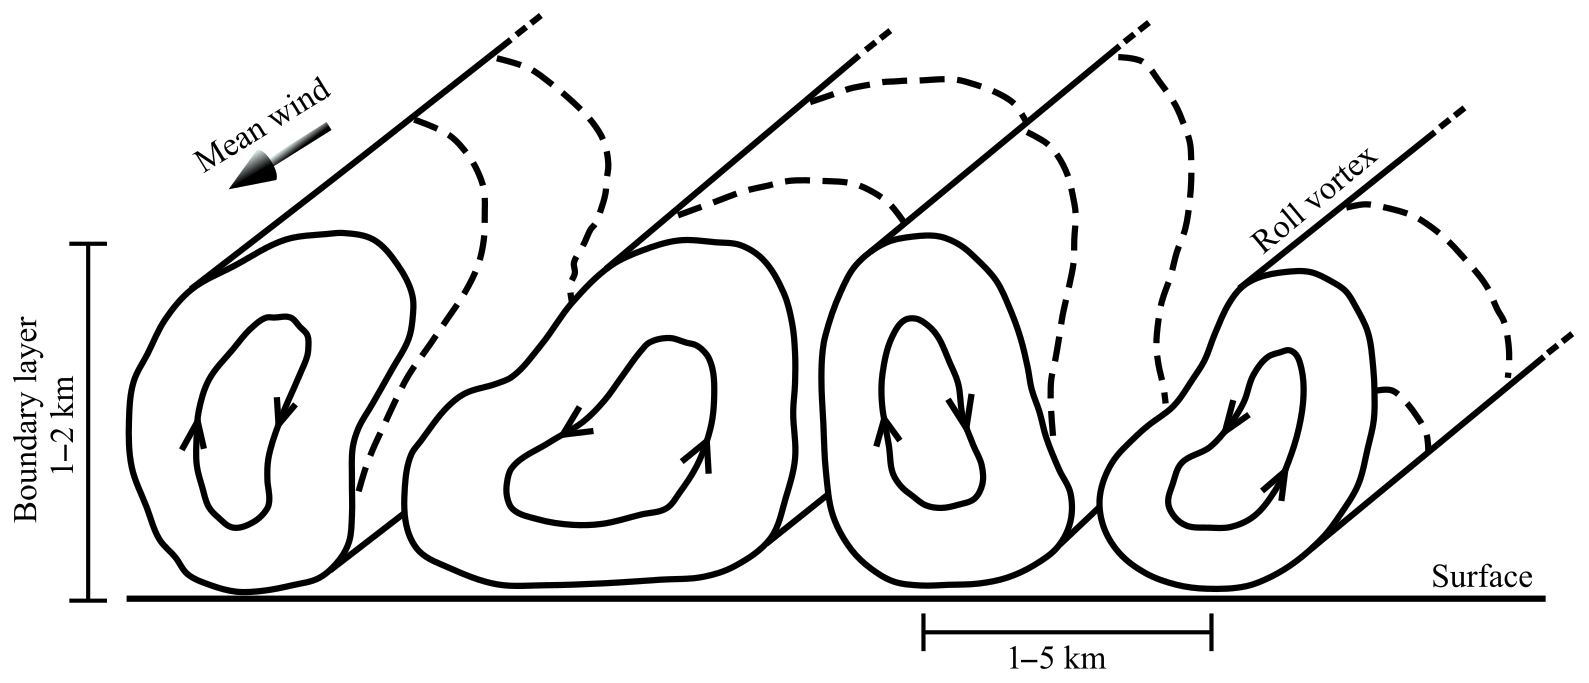
Convection in the BL often organizes into counter-rotating horizontal roll vortices or rolls that extend to the top of the BL (Fig. 1; e.g., Atkinson and Wu Zhang, 1996; Etling and Brown, 1993; Young et al., 2002). In addition, sweep ejection type and gravity-wave-induced vortices can develop over tall canopies (Finnigan et al., 2009; Patton et al., 2011). Buzorius et al. (2001) and Nilsson et al. (2001) noted that roll vortices commonly occurred during NPF events and suggested that they might be especially conducive to NPF.
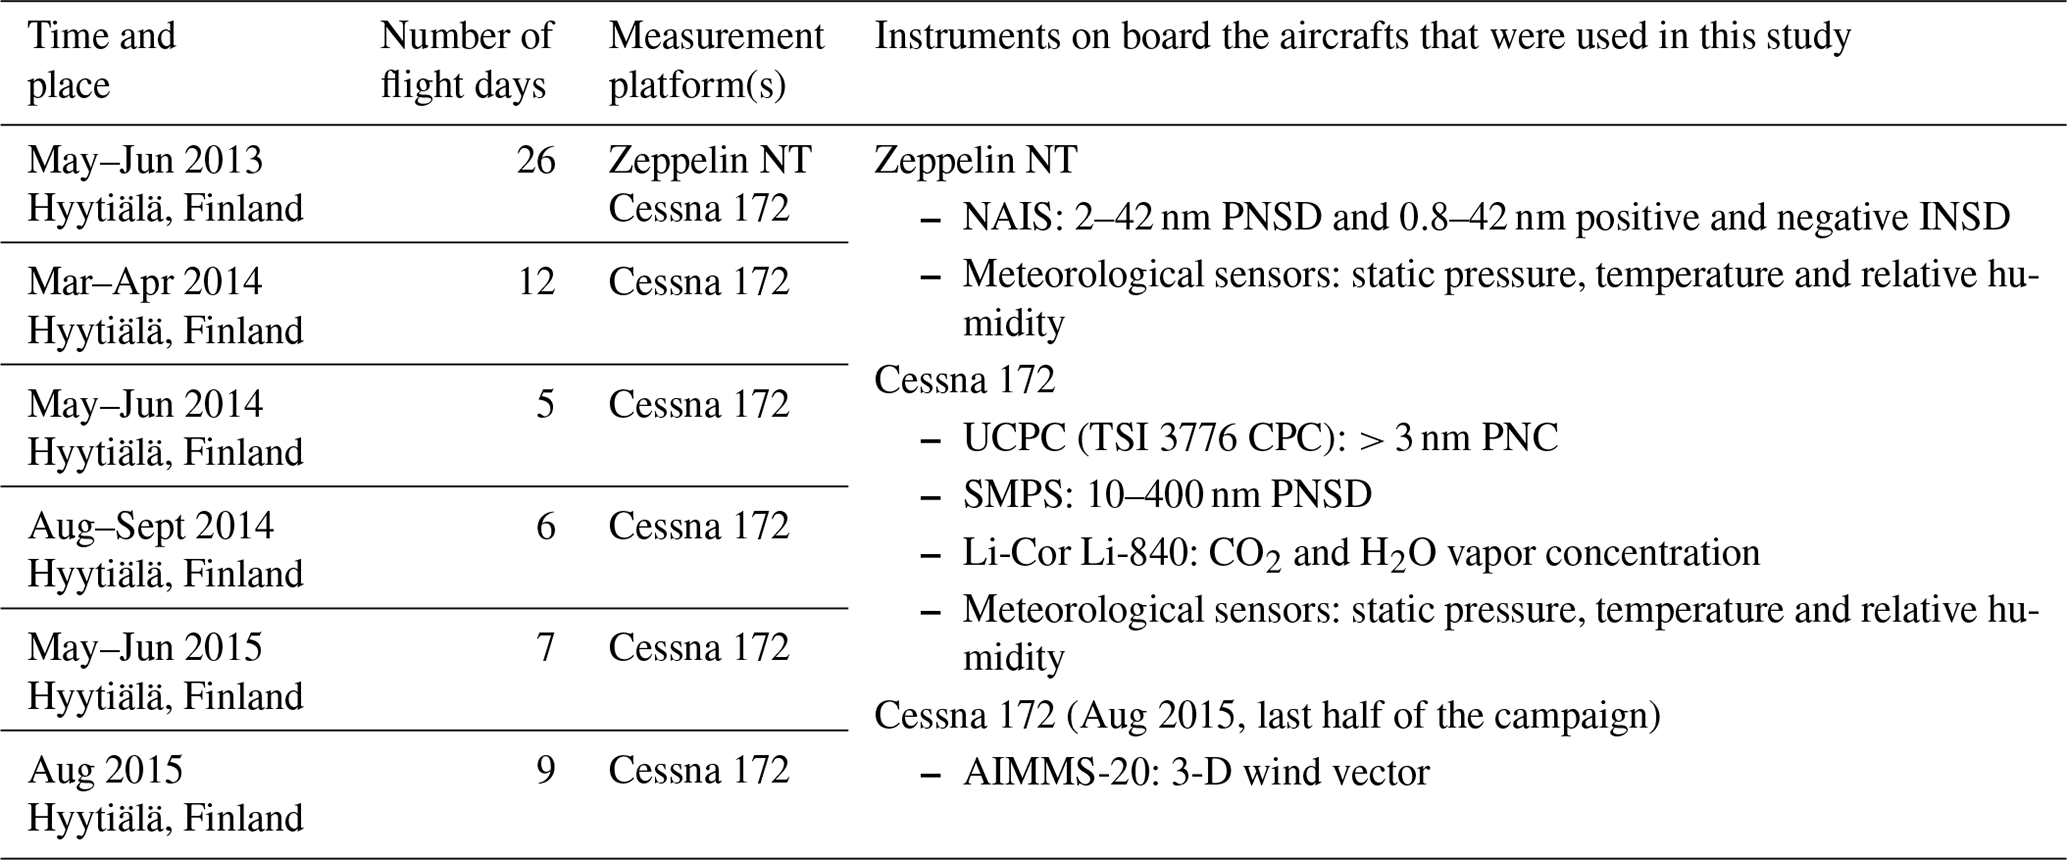
Table 1Summary of airborne measurement campaigns from which data were utilized in this study. PNSD is particle number-size distribution, INSD is ion number-size distribution, and PNC is particle number concentration.
For example, in the boreal forest, the vegetation is an important source of volatile organic compounds that can be oxidized into low-volatility organic vapors (Ehn et al., 2014). Due to higher wind speeds, the shear generation of turbulence close to the vegetation is stronger in rolls than in cellular type convection (Zilitinkevich et al., 2006). Therefore, roll updrafts are particularly efficient at transporting vapors and molecular clusters from the surface to the top of the BL. On top of the BL, decreased temperature, turbulence and mixing over the inversion layer can lead to a supersaturation of the vapors and activation of the clusters, leading to subsequent NPF (Easter and Peters, 1994; Nilsson and Kulmala, 1998). The newly formed particles grow in size in the weaker and wider downdraft and end up close to the surface where they may be deposited on surfaces or continue growing while being transported in the air. These processes are illustrated in Fig. 2. The period for this sequence of processes is roughly 1 h (Easter and Peters, 1994).

Direct observations of the effects of roll vortices on NPF are lacking. In this study, we have analyzed co-located airborne and ground-based measurements from southern Finland during 2013–2015 in order to determine the effect of roll vortices on NPF.
We analyzed data from airborne measurement campaigns conducted between 2013 and 2015 in southern Finland (see Table 1 for a summary of the airborne campaigns). These measurements had a general goal of measuring the vertical and horizontal distribution of aerosol particles in the lower atmosphere over a rural boreal forest area with a special emphasis on NPF. The airborne observations were complemented by the continuous and comprehensive aerosol measurements at the SMEAR II (Station for Measuring Ecosystem–Atmosphere Relations) station (Hari and Kulmala, 2005). The main tool to detect roll vortices was a nearby weather radar. Wind data from the airborne and ground-based measurements were also used. All the times are reported in UTC+2.
2.1 Zeppelin measurements
In May–June 2013, in the framework of the PEGASOS (Pan-European Gas-AeroSOls climate interaction Study) project, aerosol particle and gas-phase measurements were performed over Hyytiälä and Jämi in southern Finland using an instrumented Zeppelin NT (Neue Technologie) airship.
Here we analyzed measurements from the onboard neutral cluster and air ion spectrometer (NAIS) (Mirme et al., 2010; Mirme and Mirme, 2013) from 8 May 2013. The NAIS measured the particle number-size distribution in the diameter range of 2–42 nm and ion number-size distribution in the diameter range of 0.8–42 nm at a 4 min time resolution. We used the total particle data from the positive polarity of the instrument.
During the measurement, the inlet of the NAIS was pushed out from the window of the Zeppelin's gondola. The data were corrected for diffusional losses in the 1 m long, 37 mm inner diameter inlet tube (Gormley and Kennedy, 1948) and converted to standard conditions (293.15 K and 1 atm) using Eq. (1), which can be derived using the ideal gas law:
where N refers to number concentration, T to temperature and p to pressure. The temperature and pressure recorded by the instrument were used in the corrections. Any losses occurring at the inlet nozzle were assumed to be negligible due to the small size of the measured particles and relatively low airspeed so that the particles closely followed streamlines.
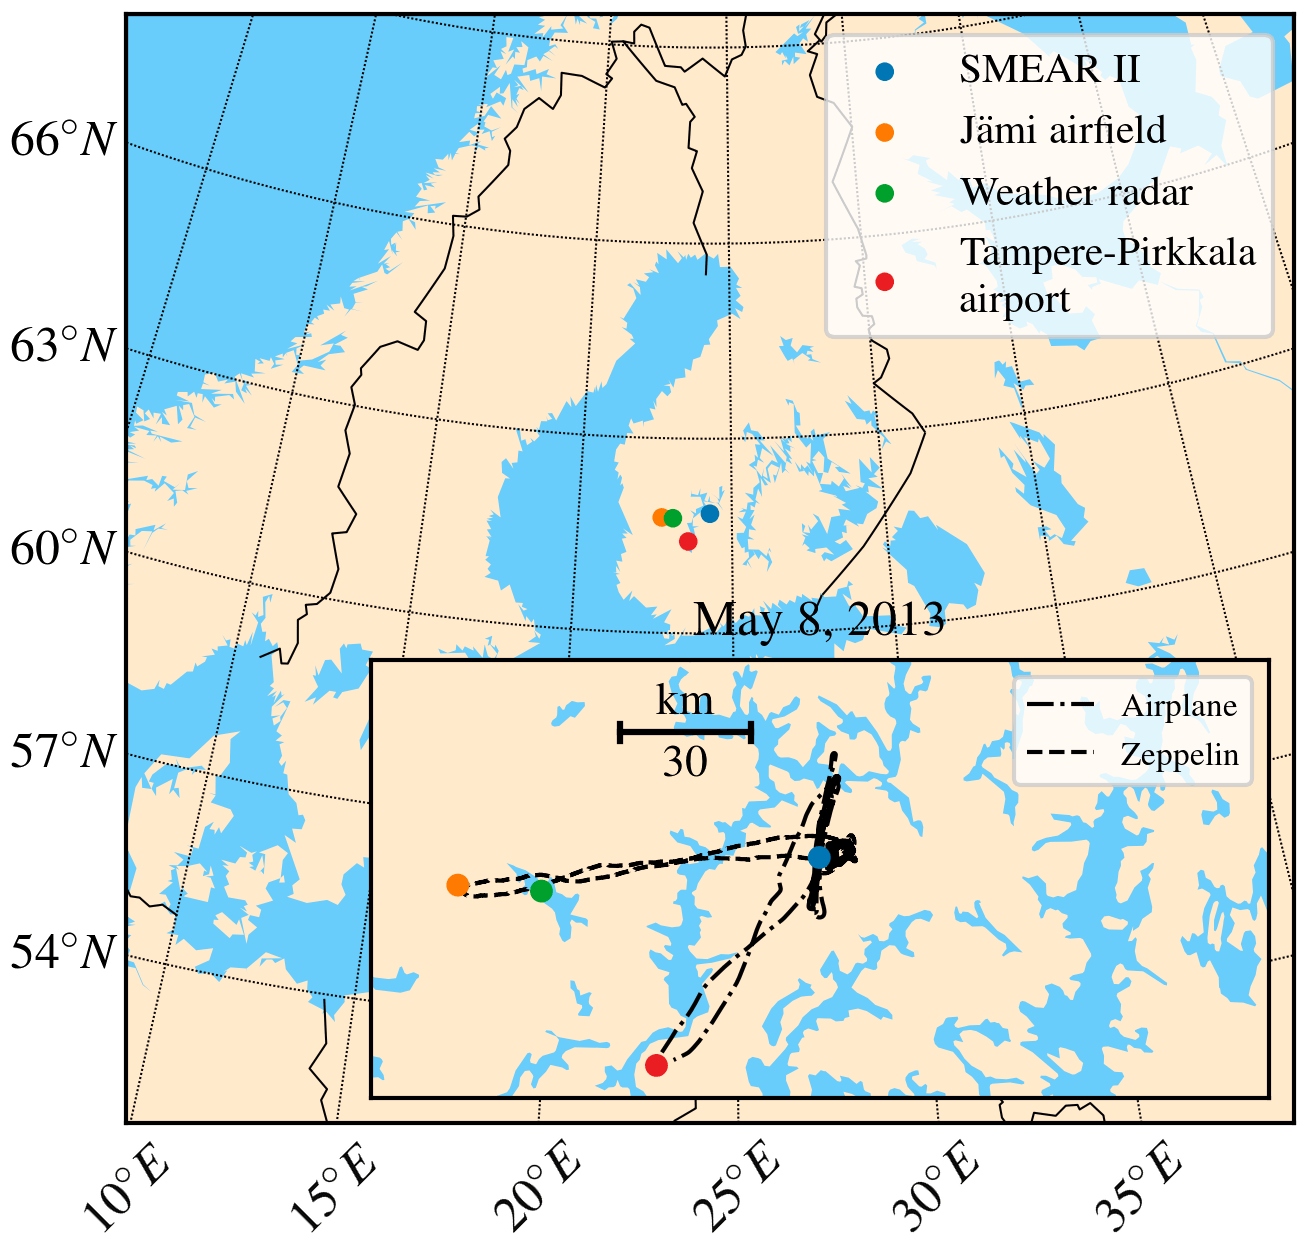
Figure 3The locations of the Tampere-Pirkkala airport (ICAO: EFTP), Jämi airfield (ICAO: EFJM), Ikaalinen weather radar and SMEAR II station marked on a map. As an example, the aircraft measurement tracks on 8 May 2013 are included.
The Zeppelin measurements consisted of consecutive profiles. Each profile was a slow and even ascent (∼ 25 min) from ∼ 100 m up to ∼ 1 (above ground level) followed by a fast descent (∼ 5 min), while the speed relative to the surrounding air (airspeed) was kept at ∼ 20 m s−1. The vertical profiles were flown over the same circular area, which was only ∼ 4 km in diameter (see Fig. 3). The flights started and ended at the Jämi airfield (61∘46′43′′ N, 22∘42′58′′ E, 154 , above sea level).
2.2 Airplane measurements
The University of Helsinki has organized several airborne measurement campaigns around Hyytiälä using an instrumented Cessna 172 airplane. Descriptions of the measurement setups can be found in previous studies (Leino et al., 2019; Schobesberger et al., 2013; Väänänen et al., 2016).
We used the particle number concentration in the 3–20 nm size range as an indication of particles that likely originated from NPF. The 3–20 nm particle number concentration was calculated by subtracting the total particle number concentration measured by the scanning mobility particle sizer (SMPS) in the size range of 20–400 nm from the number concentration measured by the ultrafine condensation particle counter (UCPC). We skipped the smallest size bins of the SMPS because they were in some cases noisy.
In order to detect roll vortices on board the airplane, we installed a turbulence probe (AIMMS-20, Aventech Research) at the end of the 2015 campaign. The AIMMS-20 was capable of measuring the 3-D wind vector at 20 Hz, but for the analysis, we averaged the data to 1 s.
Typical measurement tracks consisted of ∼ 30 km long flight segments flown roughly perpendicular to the mean wind direction over the same area while doing a single vertical profile from 100 to 3000 (Fig. 3). The ascent and descent speeds were ∼ 1 m s−1. The measurement airspeed was 36 m s−1. Usually two 2.5 h flights were flown during a single day: one in the morning and one in the afternoon. Vertically, the measurements covered all parts of the BL, as well as the lowest kilometer of the free troposphere. The flights started and ended at the Tampere-Pirkkala airport (61∘24′55′′ N, 23∘35′16′′ E, 119 ).
2.3 Ground-based measurements
The airborne measurements were complemented by the measurements at the SMEAR II field station. The measurement station is located in Hyytiälä, Finland (61∘50′40′′ N, 24∘17′13′′ E, 180 ), and is surrounded by flat terrain and coniferous forest. The station represents the background conditions found in the boreal forest regions of northern latitudes (Hari and Kulmala, 2005).
The key aerosol instruments included in this study were the station's differential mobility particle sizer (DMPS) (Aalto et al., 2001), the NAIS (Manninen et al., 2009) and the particle size magnifier (PSM) (Vanhanen et al., 2011). The time resolutions of the DMPS and the NAIS were 10 and 4 min, respectively, and from the NAIS we used particle data from the positive polarity. The DMPS measured the particle number-size distribution in the size range of 3–1000 nm. The PSM measured particle number-size distribution between 1 and 2 nm, and the time resolution was 12 min. The DMPS sampled the air from a vertical inlet at 8 and the NAIS through a wall inlet at 2 ; both were inside the canopy. The PSM was sampling in a 35 m tall tower above the forest canopy. The aerosol particle data from the station were not converted to standard conditions since the correction would be negligible.
Measurements of meteorological variables (temperature, relative humidity, wind direction and speed) and vertical particle flux from the station's mast (at 33.6 ) were available at 1 and 30 min time resolutions, respectively. The meteorological variables were measured at 33.6 . The system measuring the vertical particle flux used an ultrasonic 3-D anemometer combined with a condensation particle counter (CPC) at 23 The CPC had a 10 nm cutoff size. The vertical particle flux was calculated using the eddy covariance method (Buzorius et al., 2000).
2.4 NPF event analysis
NPF event analysis, as described by Kulmala et al. (2012), was done for the flight measurement days. First, the measurement days were classified by visual inspection into three different NPF event classes (NPF event days, undefined days and nonevent days) based on the DMPS data. NPF event days display a continuously and smoothly growing particle mode starting from the smallest detectable size. This indicates a regional NPF event. On undefined days, sub-25 nm particles are only intermittently (less than 1 h) observed without apparent growth, or a growing Aitken mode (25–100 nm) appears, possibly arising from an NPF episode elsewhere. On nonevent days, no increase in sub-25 nm particle number concentration is observed.
Particle growth rate (GR) is the rate of change in particle diameter. We used the so-called mode-fitting method to determine the particle GRs. The method involves fitting log-normal curves over the particle size distributions on the growing particle mode, defining the peaks as the geometric mean particle diameters of the mode and then using the change in the geometric mean diameter with respect to time to calculate the GR.
The formation rate of particles of the diameter d is defined as the rate at which the freshly formed particles enter the size range [d, d+Δd] as a result of their formation and growth. The formation rate Jd was calculated using the following equation (Kulmala et al., 2012):
where Nd is the number concentration of particles in the size range [], GR is the growth rate, and CoagSd is the coagulation sink for the particles in the size range. We calculated the CoagSd from the DMPS data, and for the number concentrations, we used NAIS data so that the final time resolution of the formation rate was 4 min. The size ranges used from the NAIS data were 3–6 nm for J3 and 10–20 nm for J10.
2.5 Determination of BL height
The height of the BL was determined from the aircraft measurements by inspecting the vertical profiles of relative humidity and potential temperature. The purpose was to determine if the roll-induced NPF events were observed inside the BL or above it.
We used two of the methods outlined by Seidel et al. (2010). The height of the BL was determined to be approximately at the altitude where there was a minimum vertical gradient in relative humidity and a maximum vertical gradient in potential temperature.
2.6 Detection of roll vortices
Inspecting satellite images for cloud streets was one way to deduce the presence of rolls (Etling and Brown, 1993). For this, NASA's Worldview online tool was used. One limitation of this method was that clear sky rolls or rolls underneath a cloud cover could not be identified. The measurement flight time and the time of the satellite image were also often separated by several hours, and the meteorological conditions could change during that time.
The roll axis can deviate from the mean BL flow direction (Miura, 1986), which causes the rolls to slowly move perpendicular to the mean BL flow direction, leaving low-frequency periodic variation in the time series of the wind components when measured from a stationary point (Buzorius et al., 2001; Smedman, 1991). This provided us with one way to determine if roll circulation was taking place. The wind components vertical and parallel to the roll axis would always be in phase opposition, while the phases of the wind components perpendicular to the roll axis and parallel to the roll axis would be separated by either 90 or −90∘ depending on the direction of the roll movement (Brooks and Rogers, 1997; Vandemark et al., 2001). The variation in wind due to rolls could be directly observed in the smoothed wind components measured on board the airplane by the turbulence probe.
Insects tend to congregate in the updraft zones of rolls, and they can be seen as clear air echoes by weather radars (Wainwright et al., 2017; Wilson et al., 1994). In our case, the Finnish Meteorological Institute's C-band (5.6 GHz) weather radar in Ikaalinen (61∘46′1.6′′ N, 23∘4′47.6′′ E, 154 ) provided information on the existence and location of planetary BL rolls. The analysis of the radar data was based on the processed radar imagery. Most of the flight tracks were in the range of 50–70 km from the radar, and during the summer season, insects are usually abundant enough that the rolls are visible in the radar images over the area of airborne observations. The spatial resolution of the radar measurements is set by the antenna beam width and pulse duration. The Ikaalinen radar's resolution in the measurement range was 500 m, and the 1.0∘ beam covers about a 1 km wide range over the target area. Some small rolls may be unresolvable because of the radar resolution, but more probably the detection would have been limited already by the weakness of the circulation of these tiny rolls to get enough insects airborne and high enough.
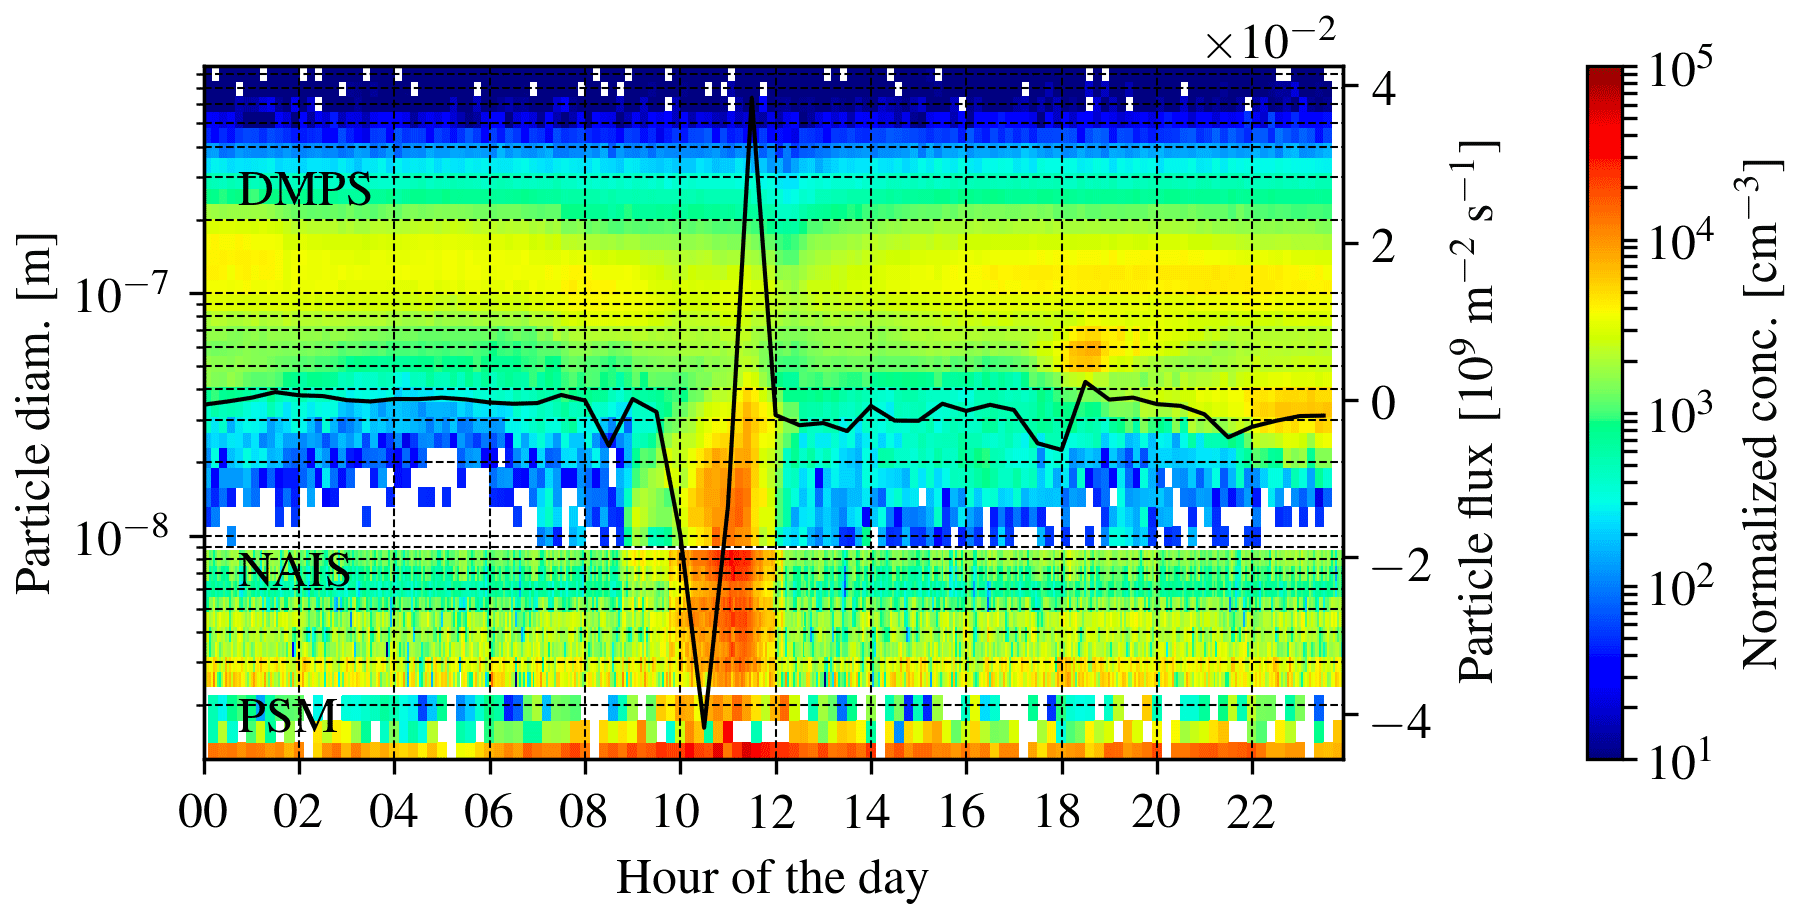
Figure 4The particle number-size distribution in the range of 1–1000 nm (composite of PSM, NAIS and DMPS data; see the Methods section for instrument details) measured at the SMEAR II station on 21 August 2015. The black line is the vertical flux of particles greater than 10 nm measured above the forest canopy (23 m height, negative sign means downward flux).
Figure 4 shows a frequent observation in the ground-based aerosol particle measurements: a momentary increase in the number concentration of freshly formed clusters and aerosol particles during daytime coupled with a relatively large fluctuation in the vertical particle flux. In Fig. 4, the freshly formed clusters and aerosol particles were observed between 10:00 and 12:00.

Figure 5In (a–c), the sections of the measurement airplane's flight track are colored by number concentrations of particles greater than 3 nm. The grids have a 4 km×4 km spacing, the plus sign marks the position of the SMEAR II station, and the time intervals for the flight track sections are displayed on top of the panels. In (d–f), the same flight tracks are colored by vertical wind speed smoothed using a 30 s moving average. The positive sign refers to updraft and the negative sign to downdraft. The large arrows show the mean wind speed and direction measured on board the airplane. The flight tracks were flown inside the convective BL between 120 and 620 The small arrows show that the maxima in the particle number concentration were located in the roll downdrafts.
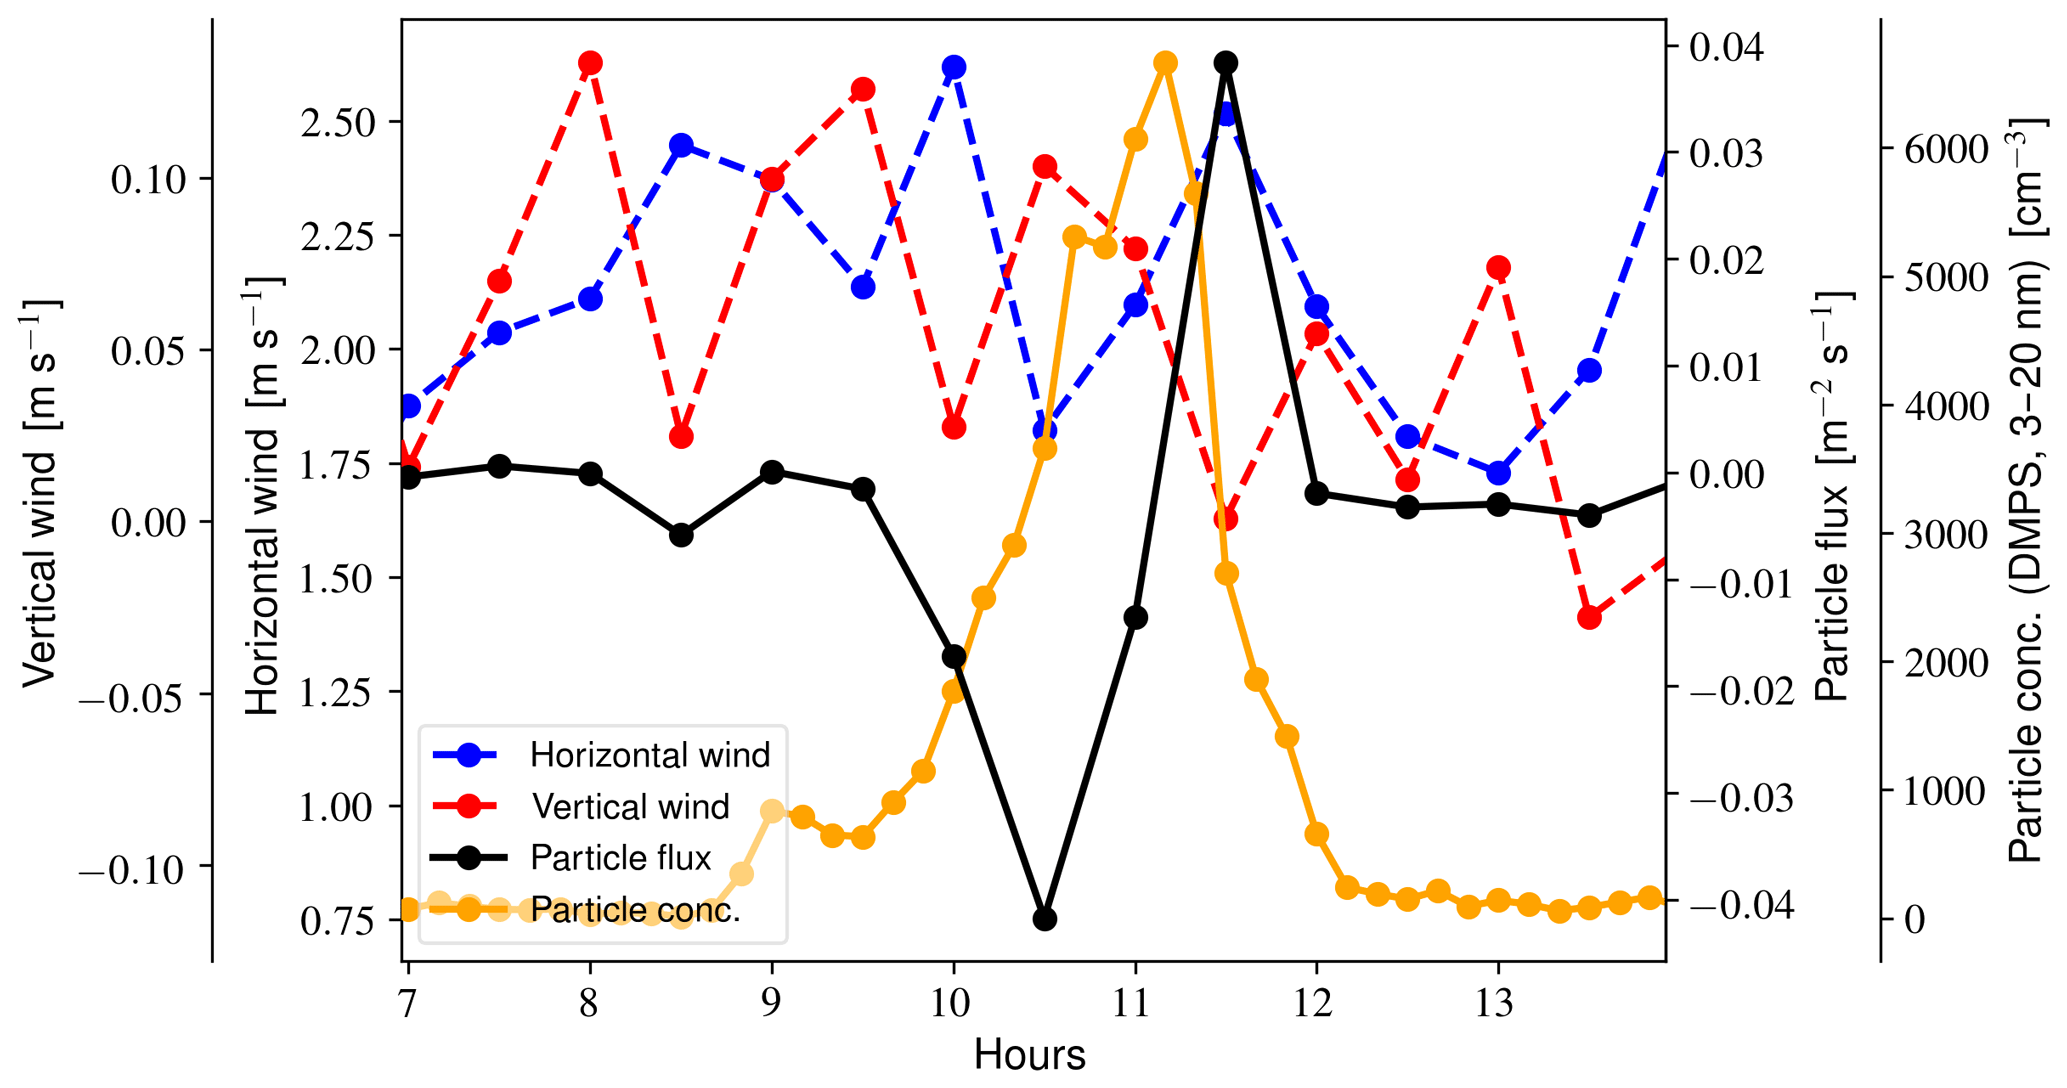
Figure 6Time series of the vertical wind (33.6 ), horizontal wind (33.6 ), vertical flux of particles greater than 10 nm (23 ) and number concentration of 3–20 nm particles inside the canopy (8 ) on 21 August 2015.
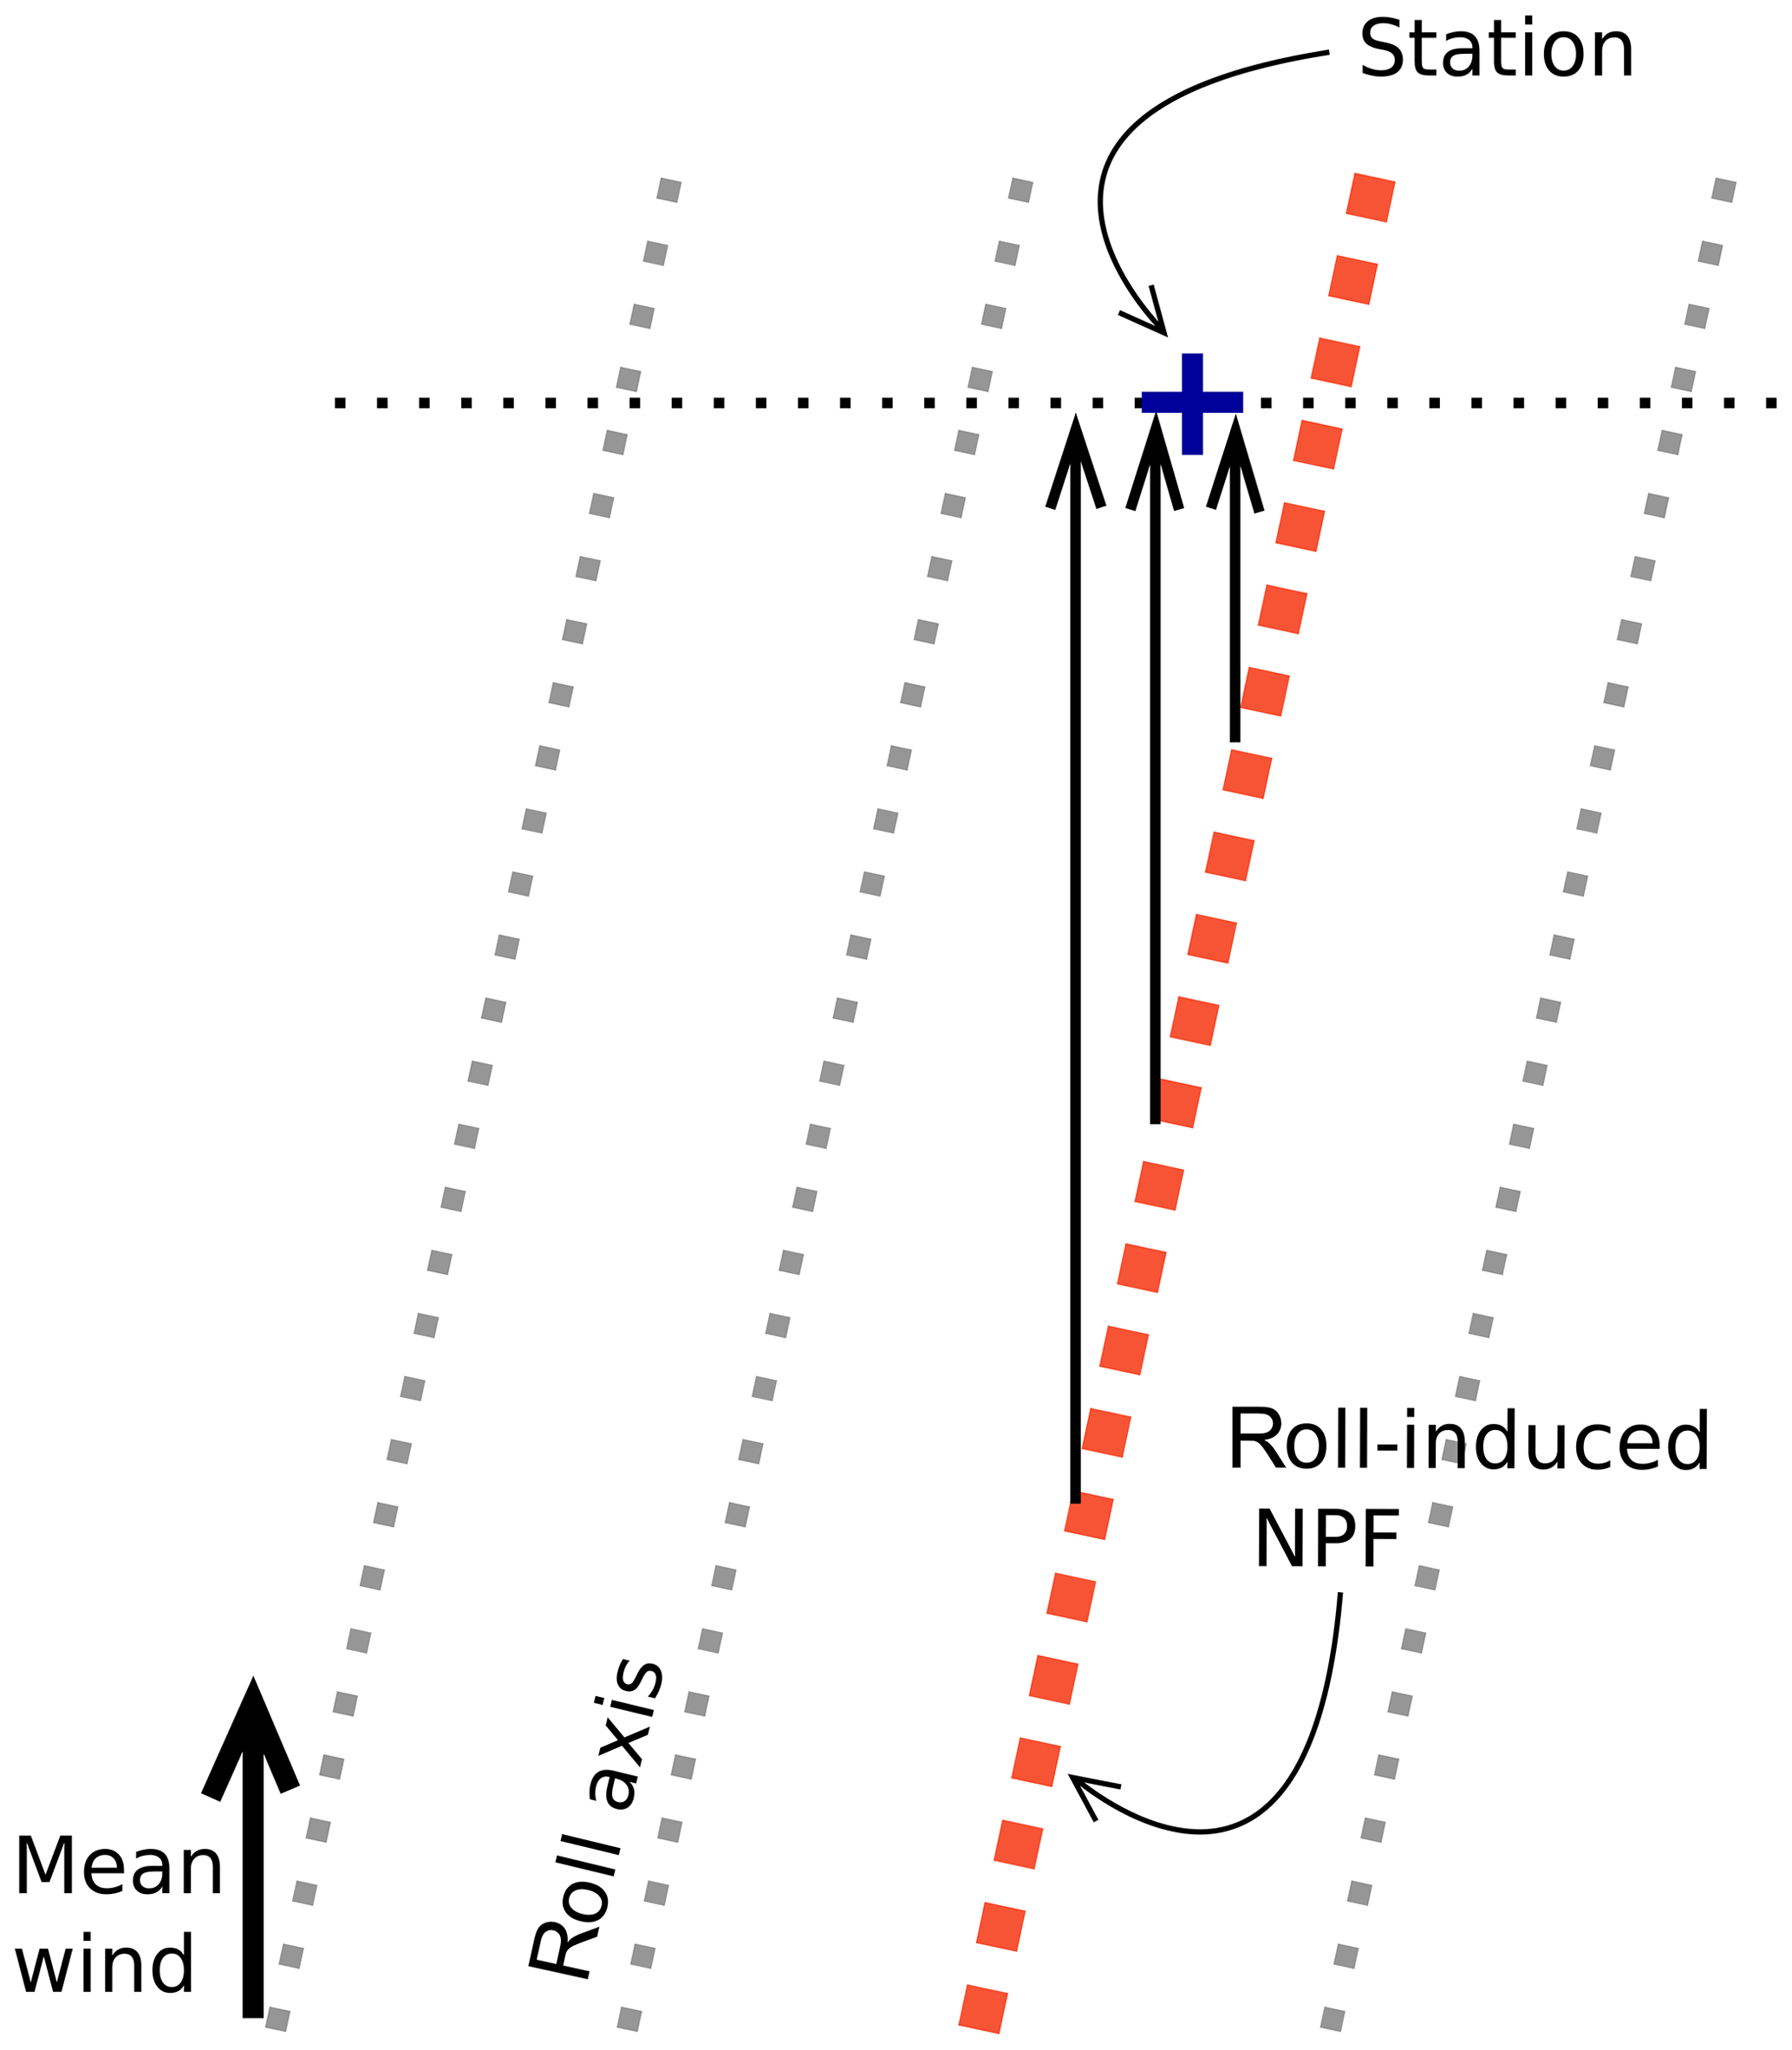
Figure 7Schematic diagram illustrating how a difference in the direction of the mean wind and the roll axis causes the rolls (and the roll-induced NPF) to move over a stationary point perpendicular to the mean wind direction.
Concurrent airplane measurements flown over the measurement station on that day (Fig. 5) showed that the location of increased aerosol particle number concentration was directly on top of the SMEAR II station. The increased number concentrations were observed over multiple overpasses, indicating that the concentrated zone was elongated along the mean wind direction. The vertical wind speed measurements on board the airplane revealed the presence of rolls as being regularly alternating up- and downdrafts that were approximately aligned with the mean wind. The maximum number concentrations occurred in two adjacent roll downdrafts. Increased number concentrations were not observed above the BL, no pollution sources were close by, and the sky was cloudless.
Wind measurements from the mast of the measurement station (Fig. 6) showed that roll vortices were slowly moving perpendicular to the mean wind (this is due to a slight difference in the directions of the mean wind and the roll axis; see Fig. 7 for an illustration). The periodic anticorrelation between the horizontal and the vertical wind components is a clear indication of roll vortices drifting over the measurement location perpendicular to the mean wind direction. This explains why particles were observed only momentarily at the field station; they were connected to specific rolls that drifted over the station. Overall, the observations on this day show that the roll circulation was locally inducing the formation of new aerosol particles.
In Fig. 6, one observes that the fluctuations in vertical particle flux do not match the fluctuations in vertical wind due to rolls. This is likely because of the following reason. During a sunny August day with moderate wind, turbulence dominates vertical transport close to the canopy, so the variations in particle number concentration and vertical particle flux close to the canopy are decoupled from the roll circulation. When the roll-induced NPF first moves over the field site, the number concentration above the turbulent layer increases and the particles start to mix downwards. Inside the turbulent layer, the particle flux becomes negative, and the number concentration starts to increase. As more and more particles are mixed downwards, the number concentration increases inside the turbulent layer, while the particle flux becomes less negative. As the roll-induced NPF moves away, the vertical particle flux can become positive if the number concentration below the flux measurement becomes higher than the number concentration above.
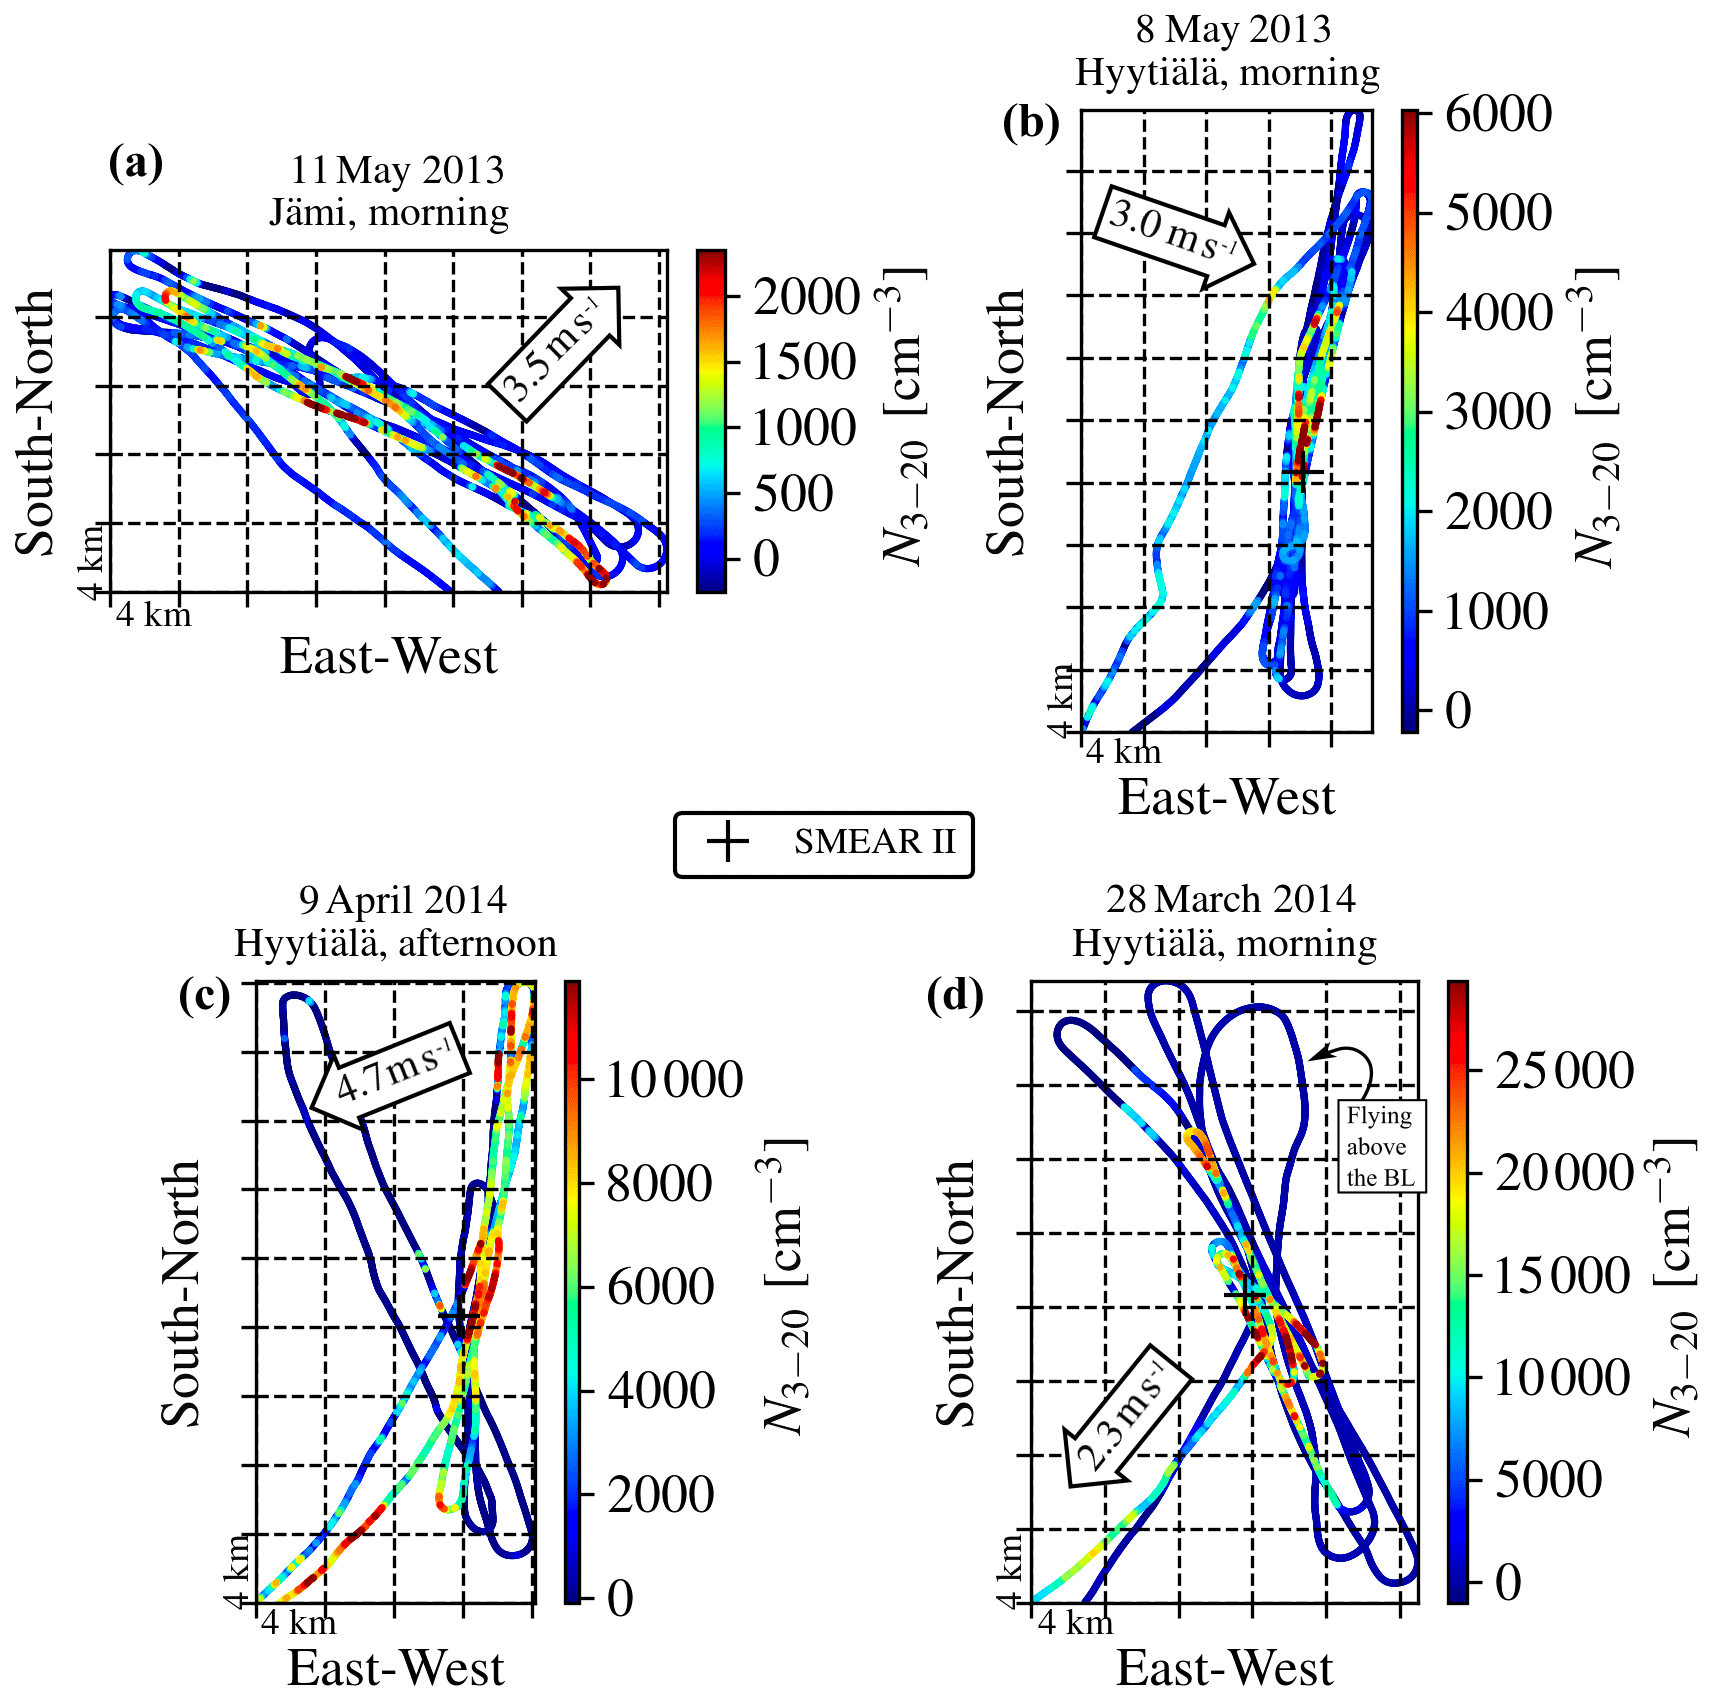
Figure 8Panels (a–d) show the research airplane's flight tracks colored by particle number concentration in the 3–20 nm diameter range on four different measurement flights. The higher particle number concentrations are displayed on top in order to make the roll-induced NPF more clearly visible. The arrows show the mean wind direction and speed from the SMEAR II mast.
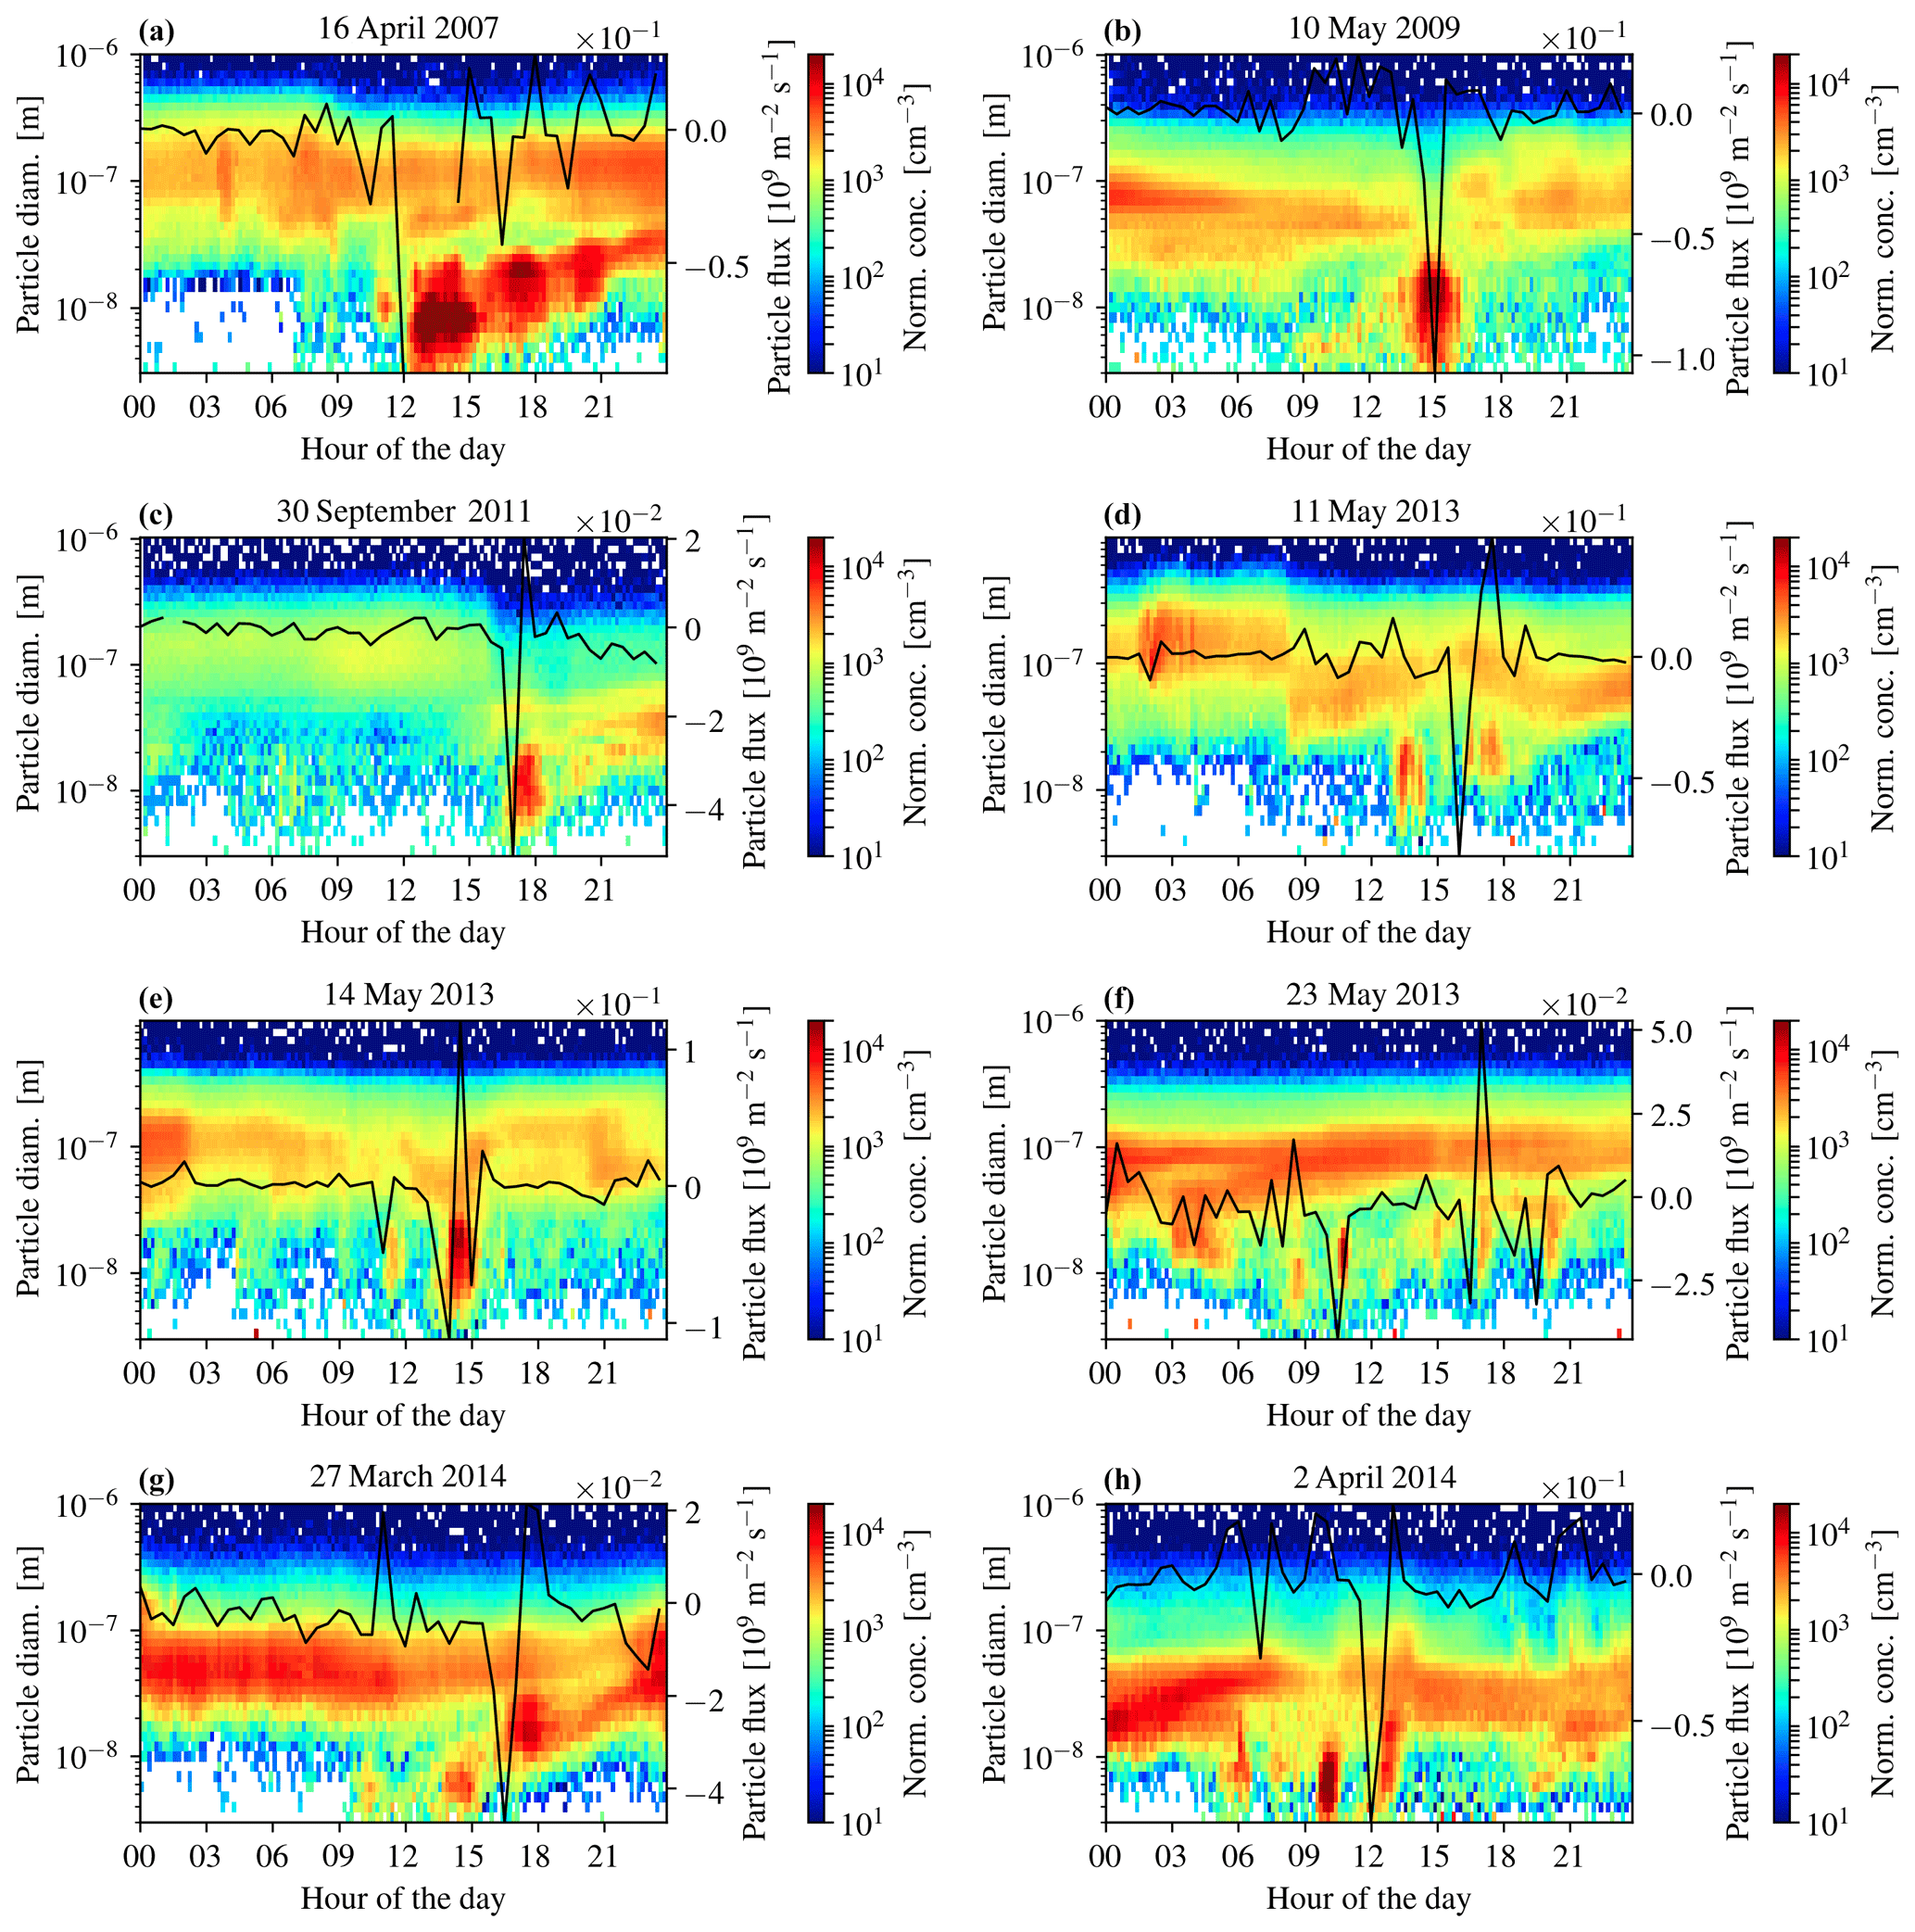
Figure 9Panels (a–h) show 3–1000 nm particle number-size distribution measured at the SMEAR II station by the DMPS during some of the days when there was roll-induced NPF. In addition, the black line shows the vertical flux of particles greater than 10 nm measured at 23 m height.
We defined two conditions to identify roll-induced NPF from the measurement data.
-
Condition (i). A roughly 1–5 km wide region with an increased sub-20 nm particle number concentration was observed on the flight track during consecutive overpasses when the airplane was flying perpendicular to the mean wind direction inside the BL. This implies a long and narrow region of freshly formed particles inside the BL that is roughly aligned with the mean wind (see Fig. 8 for examples).
-
Condition (ii). In the ground-based measurements, the number concentration of sub-20 nm particles momentarily (lasting between 0.5 and 2 h) increased, and this increase was associated with opposite fluctuations in the vertical particle flux (see Fig. 9 for examples). This would be due to the roll-induced NPF moving over the measurement station, and it requires that the rolls are not aligned with the mean BL flow.
The roll-induced NPF condition (ii) never occurred at the same time without condition (i) being also true, but condition (i) did occur without condition (ii). This is likely because when the rolls were not aligned with the mean wind, the roll-induced NPF could be observed from the airplane, as well as from the station, whereas if the rolls were aligned with the mean wind, then the roll-induced NPF could still be observed from the airplane but not from the measurement station.
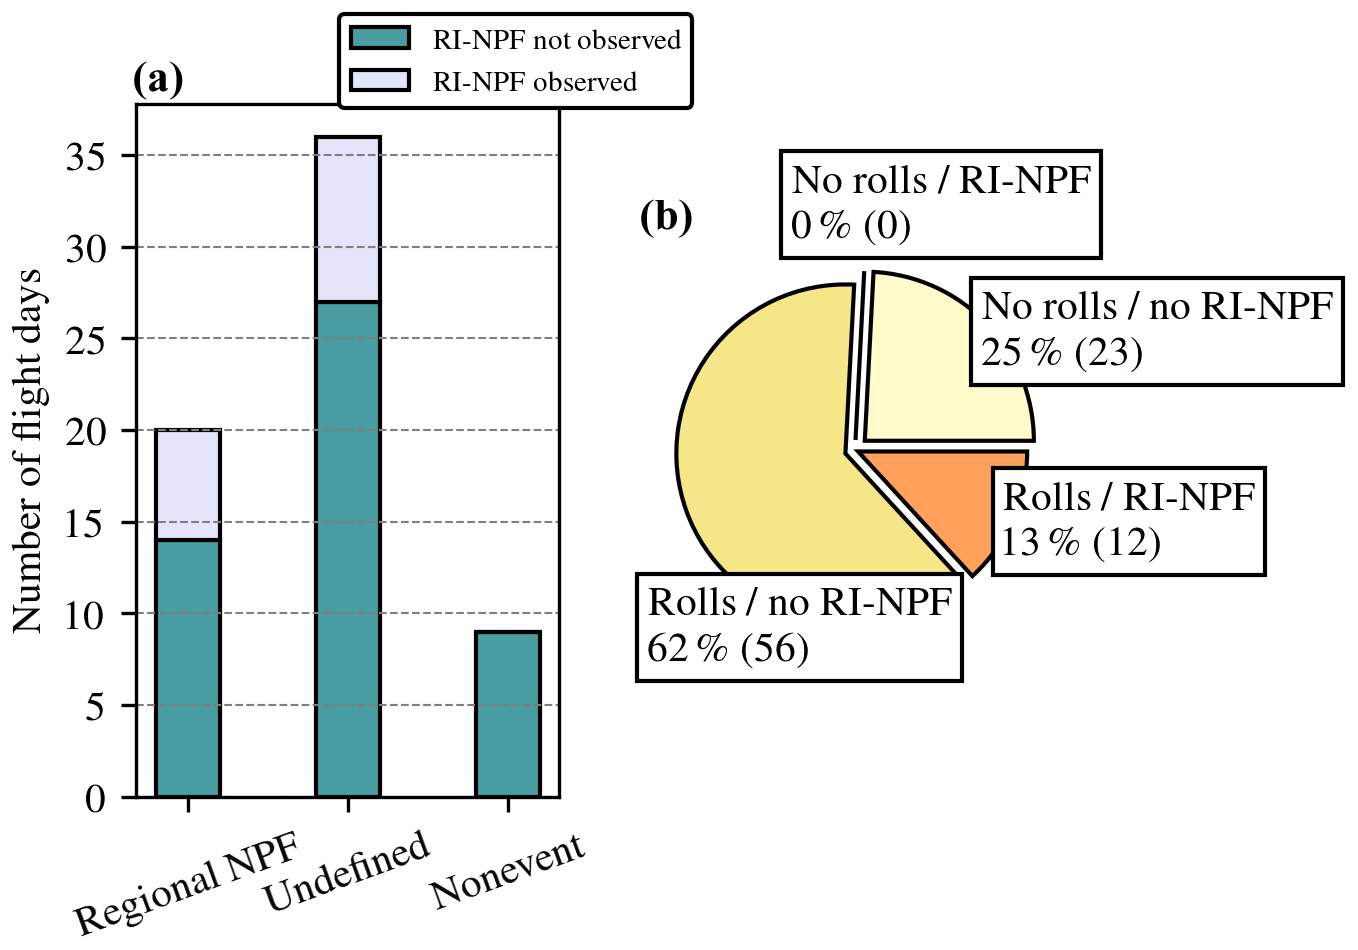
Figure 10Panel (a) shows how the roll-induced NPF (RI-NPF) observations distribute into different NPF event classes on the flight days. Panel (b) shows the classification of each measurement flight into four different classes based on whether rolls and/or RI-NPF over the same area were observed or not. Note that the data in (a) consist of flight days, while the data in (b) consist of individual flights (there could be more than one flight per day).
The airborne measurement data were classified with respect to NPF events and for the presence of roll vortices and roll-induced NPF. Roll-induced NPF was observed on 30 % (6∕20) of the regional NPF event days and on 22 % (8∕36) of the days classified as undefined (Fig. 10a). According to radar and satellite observations, the counter-rotating horizontal circulations were always present during the roll-induced NPF (Fig. 10b), and according to Fisher's exact test, this association was statistically significant (p=0.03). Roll vortices do not guarantee that roll-induced NPF occurs since many other factors, such as a sufficient amount of sunlight and low enough sinks for low-volatility vapors and small clusters, are also important in determining whether atmospheric NPF occurs or not (Dada et al., 2017; Hamed et al., 2007).
The timescale that a roll-induced NPF moves over the measurement station is roughly 1 h. This timescale is similar to the period of a typical roll vortex, and it allows us to estimate the total effect of a roll on NPF. Using condition (ii), we identified some of the clearest cases of roll-induced NPF (29 d and 46 roll-induced NPF events) from only the ground-based measurements during 2006–2017.
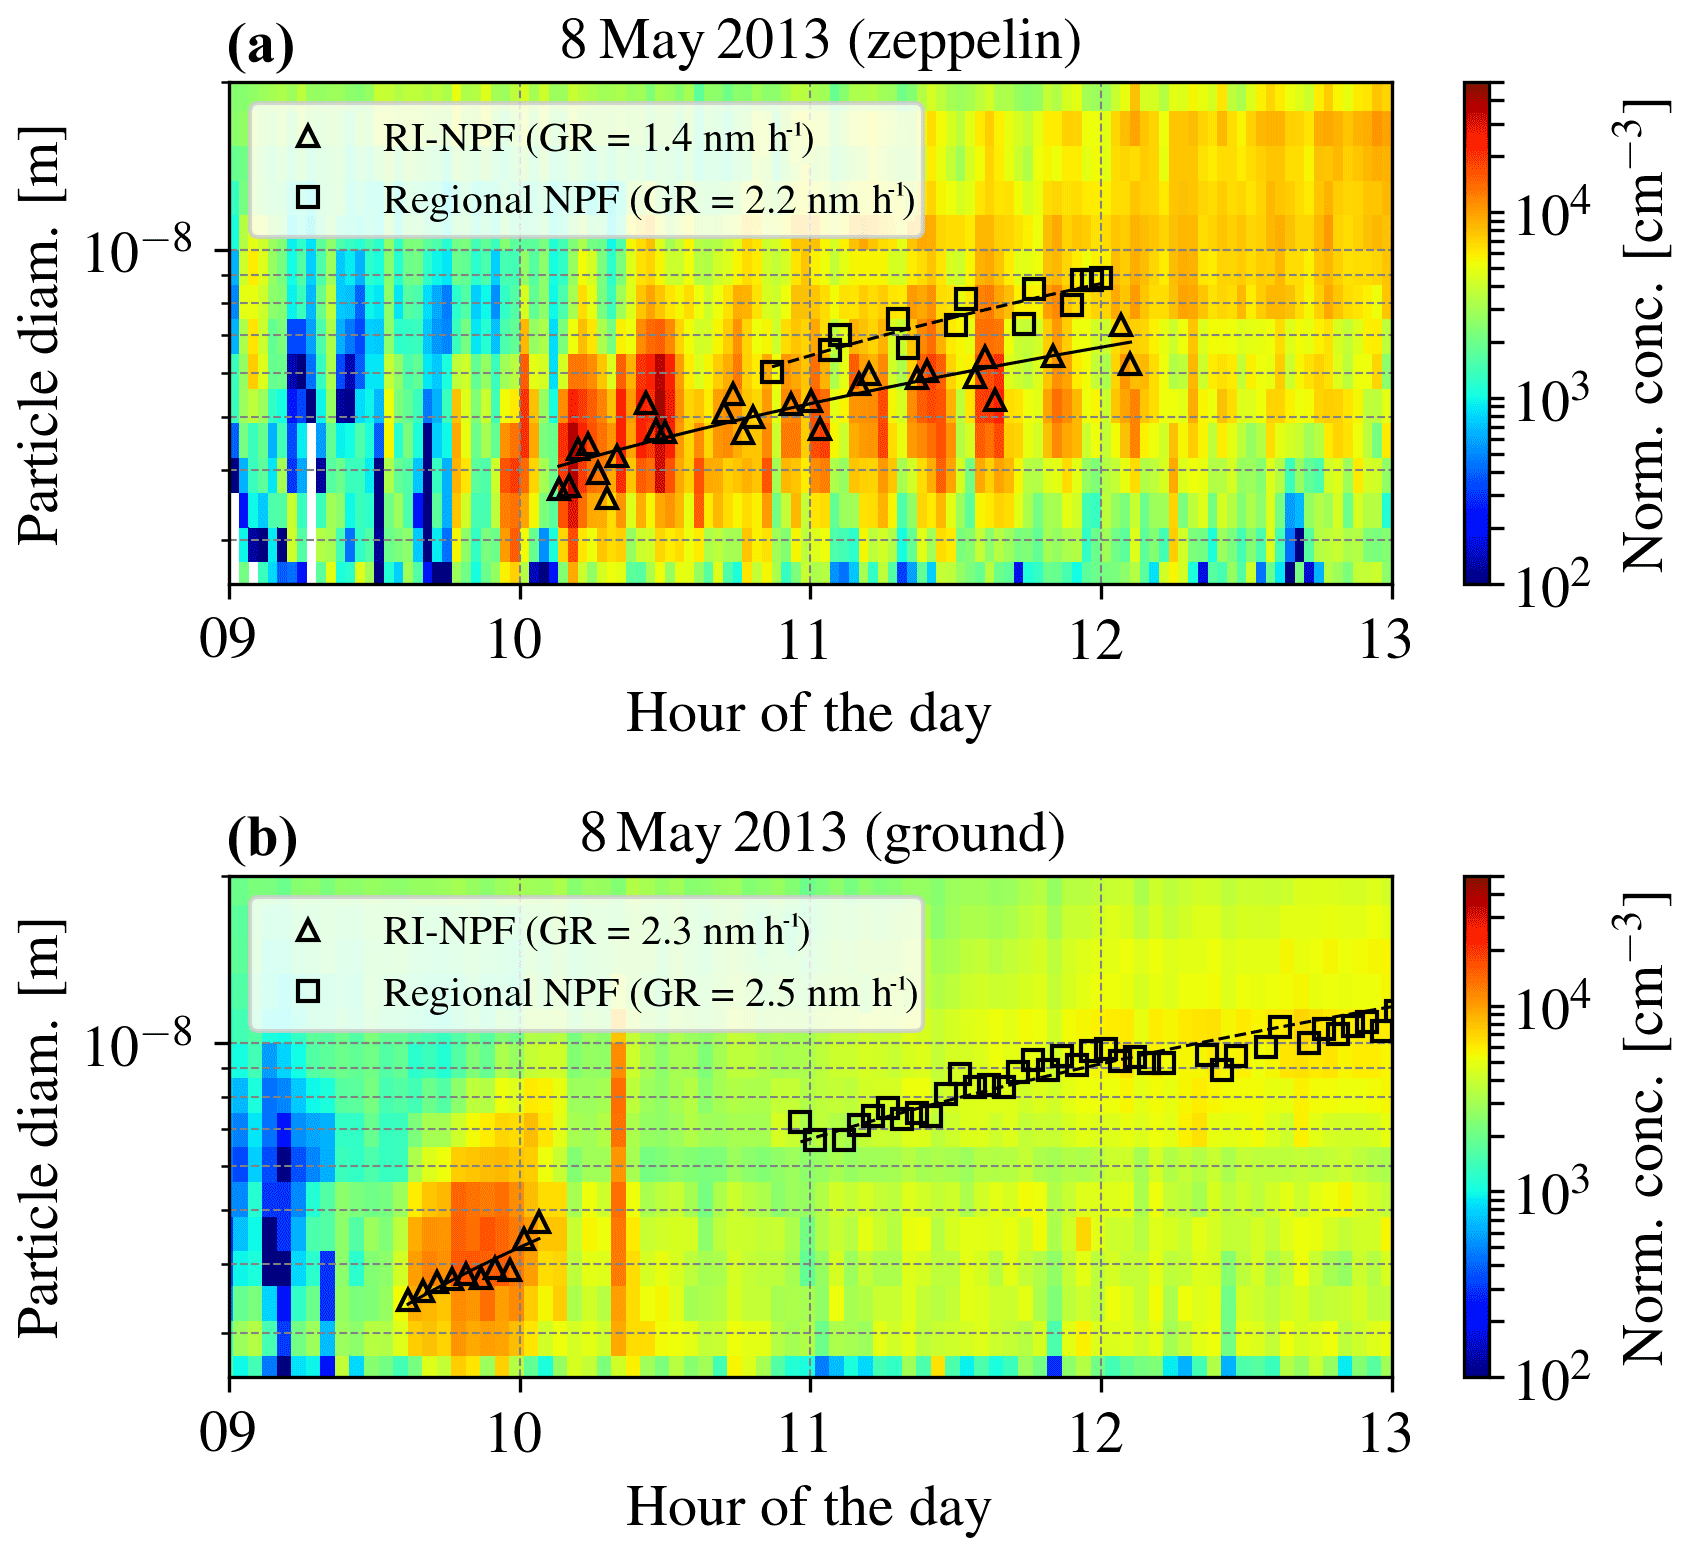
Figure 11The particle number-size distribution (positive polarity) between 2.5 and 20 nm measured by the NAIS (a) on board the Zeppelin and (b) at the field station on 8 May 2013. Between 10:00 and 12:00, the Zeppelin consecutively flew through the roll-induced NPF (RI-NPF) event leaving concentrated “stripes” on the particle number-size distribution. Between 09:30 and 10:00, the roll-induced NPF event moved over the field station. The black triangles and squares show the fitted mean mode diameters to the roll-induced and regional NPF event particles, respectively. Figure 8b shows the simultaneous observations from the airplane. The roll-induced NPF event was moving over the measurement area from southwest to northeast. Weather radar observations showed that rolls were present over the measurement site, and power spectra of the wind components from the station's mast showed that the rolls were moving over the site at the same rate (one roll in ∼ 20 min) and in the same direction as the roll-induced NPF.
Multiple roll-induced NPF events during a single day were observed on 13 of 29 d. We noted the time and the geometric mean mode diameter at the beginning of each roll-induced NPF event. By looking at the change in particle diameter from subsequent roll-induced NPF events, we were able to estimate the GR. In addition, on 8 May 2013 we could calculate the GR from a single roll-induced NPF event by following it with the Zeppelin aircraft (Fig. 11). We found that the median GR of the roll-induced NPF particles was 1.8 nm h−1 (interquartile range, IQR = 1.2–2.2). The median size range for the GR estimation was 7.5–15 nm. This is similar to the median GR of 2.5 nm h−1 for 3–25 nm particles reported by Nieminen et al. (2014) for regional-scale NPF events observed at the station.
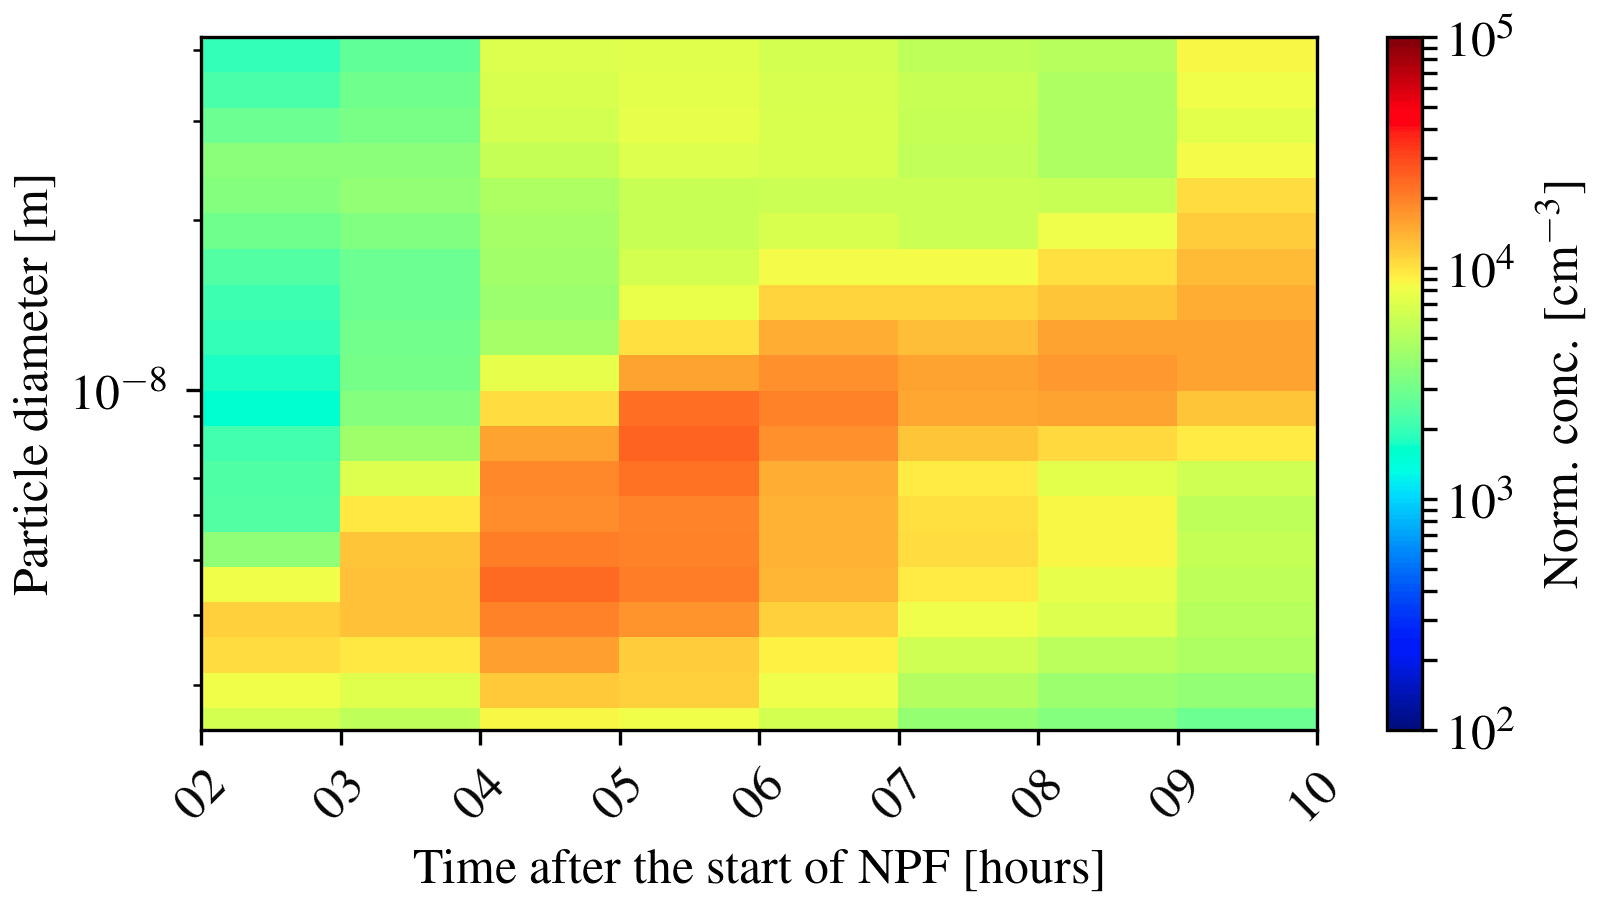
Figure 12The particle number-size distribution above was constructed using the SMEAR II station's NAIS data by taking the roll-induced NPF observations (29 d and 46 different roll-induced NPF events) and distributing them along the time axis according to their geometric mean diameter while assuming a growth rate of 1.8 nm h−1 (median of the obtained GRs) and start of the NPF at t=0 h.
We aggregated all the roll-induced NPF observations into 1 h averaged bins using the median GR and the geometric mean diameters of the particles, assuming that the particles were formed at t = 0 h. We calculated the median number-size distribution in each 1 h bin (Fig. 12). Then we calculated the formation rates and their uncertainties. We assumed that the roll-induced NPF GRs were normally distributed with the mean equal to the median GR and standard deviation given by IQR∕1.35. We randomly sampled a GR and binned the roll-induced NPF number-size distributions into 1 h bins. For each 1 h bin, we assumed that the number concentrations in each size bin followed a normal distribution with the mean (μ) equal to the median and standard deviation (σ) equal to IQR∕1.35. We sampled a number concentration from each of the bins according to σiX+μi, where i numbers the bins and X is a normally distributed random variable. Using the same X for all the bins assured that the number concentration did not have unnecessary fluctuations. Based on the sampled number concentrations, we calculated the formation rates for 3 and 10 nm particles. We repeated this procedure 1000 times in order to estimate the peak J3 and J10 and their uncertainties.
The resulting peak formation rate was 1.9 (IQR = 1.0–3.2) for 3 nm particles and 0.4 (IQR = 0.2–0.6) for 10 nm particles. Nieminen et al. (2014) found that for regional-scale NPF events during springtime, the median formation rates of 3 and 10 nm particles were 1.0 and 0.52 , respectively.
In addition, we estimated the fraction of area covered by the roll-induced NPF. We assumed that the roll-induced NPF events extend much longer along the rolls, which is supported by the aircraft data. This means that for the area fraction, we need to estimate what the spacing of the roll-induced NPF events is perpendicular to the direction of the rolls.
If the wind conditions stay the same during the period when the multiple roll-induced NPF events move over the station, then we can assume that the rolls move over the station at a steady pace. This means that dividing the time that subsequent roll-induced NPF events observed during the same day spent on top of the measurement station by the total time it took for the roll-induced NPF events to move over the site can be used as an area fraction estimate. According to measurements from the mast, on average the wind conditions during the observations did not change significantly.
We found that the fraction of area covered by the roll-induced NPF was 0.46 (IQR = 0.39–0.64). The roll systems are regionally roughly homogeneous (as demonstrated by cloud streets caused by the rolls in satellite images), so we can assume that the fraction of area covered by the roll-induced NPF events applies regionally, and the phenomenon is not limited to the close vicinity of the site.
We combined the median formation rates, the median area coverage and the statistics obtained from the aircraft campaigns and estimated using Eq. (3) how much, in terms of percentage increase, the roll-induced NPF enhances the production of new aerosol particles in Hyytiälä:
Here, A is the median area fraction, n is the number of roll-induced and regional NPF events observed, and Jd is the median formation rate of particles at the diameter d. The uncertainty was calculated by using the propagation of uncertainty. We estimate that compared to only regional NPF, the roll-induced NPF enhances the production of new aerosol particles by 61 % ± 39 % and 24 % ± 7 % for 3 and 10 nm particles, respectively. In addition to the enhancement of regional NPF, there were several days during which practically no NPF would have taken place without roll-induced NPF, such as the case study in Fig. 4.
We studied what the effect of roll vortices on atmospheric NPF in the BL is by analyzing airborne and ground-based measurements done over a rural boreal forest in southern Finland. We found that roll-induced NPF can considerably enhance the production of new aerosol particles over a boreal forest and that these particles can grow to larger, potentially CCN sizes similar to particles produced by regional NPF. Roll-induced NPF seems to occur in only some of the roll vortices, which is likely related to variability in the rolls. In order to fully understand roll-induced NPF, better measurement and analysis methods need to be developed, for example, by measuring the fluxes of sub-10 nm particles and doing airborne flux measurements. More measurements with the turbulence probe on board need to be performed. It would also be interesting to study the cluster composition during roll-induced NPF.
NPF is a ubiquitous phenomenon in the global atmosphere (Kerminen et al., 2018; Kulmala et al., 2004); likewise, roll vortices are a common feature in the planetary BL around the world (Atkinson and Wu Zhang, 1996; Etling and Brown, 1993; Young et al., 2002). Therefore, roll-induced NPF is expected to take place in several other environments around the world as well. Hence, unstable stratification and the formation of roll vortices need to be taken into account in order to understand the overall role of atmospheric NPF in particle number and CCN budgets.
The airborne and ground-based data from Hyytiälä were uploaded online as a dataset (https://doi.org/10.5281/zenodo.3688471; Lampilahti et al., 2020). The weather radar data from Ikaalinen was provided by the Finnish Meteorological Institute. The data are available upon request (janne.lampilahti@helsinki.fi).
JL, KL, RV, AM, SBM, HEM and JK carried out the airborne measurements. ML processed and interpreted the weather radar data. MB, SZ and HJ helped with the analysis of meteorological data. JL prepared the paper with contributions from all coauthors. JE modeled particle losses in the inlet used in the airplane measurements. TN, VMK, TP and MK assisted in data analysis and writing the paper.
The authors declare that they have no conflict of interest.
We appreciate the efforts that the Zeppelin NT pilots and ground crews made to this work. We acknowledge Thomas F. Mentel and Franz Rohrer from Forschungszentrum Jülich, Germany. We thank Erkki Järvinen and the pilots at Airspark Oy for operating the research airplane. We acknowledge the use of imagery from the NASA Worldview application (https://worldview.earthdata.nasa.gov/, last access: 15 October 2020) operated by the NASA and Goddard Space Flight Center's Earth Science Data and Information System (ESDIS) project.
This research has been supported by the European Research Council (grant no. 742206), Horizon 2020 (grant no. 654109), the Academy of Finland (grant nos. 272041, 280700, 314798 and 314799), the FP7 Environment (grant no. PEGASOS (265148)) and the Russian Science Foundation (grant no. 15-17-20009).
Open-access funding provided by Helsinki University Library.
This paper was edited by Thomas Karl and reviewed by three anonymous referees.
Aalto, P., Hämeri, K., Becker, E., Weber, R., Salm, J., Mäkelä, J. M., Hoell, C., O'Dowd, C. D., Hansson, H.-C., Väkevä, M., Koponen, I. K., Buzorius, G., and Kulmala, M.: Physical characterization of aerosol particles during nucleation events, Tellus B, 53, 344–358, https://doi.org/10.3402/tellusb.v53i4.17127, 2001.
Atkinson, B. W. and Wu Zhang, J.: Mesoscale shallow convection in the atmosphere, Rev. Geophys., 34, 403–431, https://doi.org/10.1029/96RG02623, 1996.
Boucher, O., Randall, D., Artaxo, P., Bretherton, C., Feingold, G., Forster, P., Kerminen, V.-M., Kondo, Y., Liao, H., Lohmann, U., Rasch, P., Satheesh, S. K., Sherwood, S., Stevens, B., and Zhang, X. Y.: Clouds and Aerosols, in Climate Change 2013: The Physical Science Basis. Contribution of Working Group I to the Fifth Assessment Report of the Intergovernmental Panel on Climate Change, edited by: Stocker, T. F., Qin, D., Plattner, G.-K., Tignor, M., Allen, S. K., Boschung, J., Nauels, A., Xia, Y., Bex, V., and Midgley, P. M., Cambridge University Press, Cambridge, UK and New York, NY, USA, 571–658, available at: http://www.climatechange2013.org (last access: 15 October 2020), 2013.
Brooks, I. M. and Rogers, D. P.: Aircraft Observations of Boundary Layer Rolls off the Coast of California, J. Atmos. Sci., 54, 1834–1849, https://doi.org/10.1175/1520-0469(1997)054<1834:AOOBLR>2.0.CO;2, 1997.
Buzorius, G., Rannik, Ü., Mäkelä, J. M., Keronen, P., Vesala, T., and Kulmala, M.: Vertical aerosol fluxes measured by the eddy covariance method and deposition of nucleation mode particles above a Scots pine forest in southern Finland, J. Geophys. Res.-Atmos., 105, 19905–19916, https://doi.org/10.1029/2000JD900108, 2000.
Buzorius, G., Rannik, Ü., Nilsson, D., and Kulmala, M.: Vertical fluxes and micrometeorology during aerosol particle formation events, Tellus B, 53, 394–405, https://doi.org/10.1034/j.1600-0889.2001.530406.x, 2001.
Crumeyrolle, S., Manninen, H. E., Sellegri, K., Roberts, G., Gomes, L., Kulmala, M., Weigel, R., Laj, P., and Schwarzenboeck, A.: New particle formation events measured on board the ATR-42 aircraft during the EUCAARI campaign, Atmos. Chem. Phys., 10, 6721–6735, https://doi.org/10.5194/acp-10-6721-2010, 2010.
Dada, L., Paasonen, P., Nieminen, T., Buenrostro Mazon, S., Kontkanen, J., Peräkylä, O., Lehtipalo, K., Hussein, T., Petäjä, T., Kerminen, V.-M., Bäck, J., and Kulmala, M.: Long-term analysis of clear-sky new particle formation events and nonevents in Hyytiälä, Atmos. Chem. Phys., 17, 6227–6241, https://doi.org/10.5194/acp-17-6227-2017, 2017.
Dunne, E. M., Gordon, H., Kürten, A., Almeida, J., Duplissy, J., Williamson, C., Ortega, I. K., Pringle, K. J., Adamov, A., Baltensperger, U., Barmet, P., Benduhn, F., Bianchi, F., Breitenlechner, M., Clarke, A., Curtius, J., Dommen, J., Donahue, N. M., Ehrhart, S., Flagan, R. C., Franchin, A., Guida, R., Hakala, J., Hansel, A., Heinritzi, M., Jokinen, T., Kangasluoma, J., Kirkby, J., Kulmala, M., Kupc, A., Lawler, M. J., Lehtipalo, K., Makhmutov, V., Mann, G., Mathot, S., Merikanto, J., Miettinen, P., Nenes, A., Onnela, A., Rap, A., Reddington, C. L. S., Riccobono, F., Richards, N. A. D., Rissanen, M. P., Rondo, L., Sarnela, N., Schobesberger, S., Sengupta, K., Simon, M., Sipilä, M., Smith, J. N., Stozkhov, Y., Tomé, A., Tröstl, J., Wagner, P. E., Wimmer, D., Winkler, P. M., Worsnop, D. R., and Carslaw, K. S.: Global atmospheric particle formation from CERN CLOUD measurements, Science, 354, 1119–1124, https://doi.org/10.1126/science.aaf2649, 2016.
Easter, R. C. and Peters, L. K.: Binary homogeneous nucleation: temperature and relative humidity fluctuations, nonlinearity, and aspects of new particle production in the atmosphere, J. Appl. Meteorol., 33, 775–784, https://doi.org/10.1175/1520-0450(1994)033<0775:BHNTAR>2.0.CO;2, 1994.
Ehn, M., Thornton, J. A., Kleist, E., Sipilä, M., Junninen, H., Pullinen, I., Springer, M., Rubach, F., Tillmann, R., Lee, B., Lopez-Hilfiker, F., Andres, S., Acir, I.-H., Rissanen, M., Jokinen, T., Schobesberger, S., Kangasluoma, J., Kontkanen, J., Nieminen, T., Kurtén, T., Nielsen, L. B., Jørgensen, S., Kjaergaard, H. G., Canagaratna, M., Maso, M. D., Berndt, T., Petäjä, T., Wahner, A., Kerminen, V.-M., Kulmala, M., Worsnop, D. R., Wildt, J., and Mentel, T. F.: A large source of low-volatility secondary organic aerosol, Nature, 506, 476–479, https://doi.org/10.1038/nature13032, 2014.
Etling, D. and Brown, R. A.: Roll vortices in the planetary boundary layer: A review, Bound.-Lay. Meteorol., 65, 215–248, https://doi.org/10.1007/BF00705527, 1993.
Finnigan, J. J., Shaw, R. H., and Patton, E. G.: Turbulence structure above a vegetation canopy, J. Fluid Mech., 637, 387–424, https://doi.org/10.1017/S0022112009990589, 2009.
Gordon, H., Kirkby, J., Baltensperger, U., Bianchi, F., Breitenlechner, M., Curtius, J., Dias, A., Dommen, J., Donahue, N. M., Dunne, E. M., Duplissy, J., Ehrhart, S., Flagan, R. C., Frege, C., Fuchs, C., Hansel, A., Hoyle, C. R., Kulmala, M., Kürten, A., Lehtipalo, K., Makhmutov, V., Molteni, U., Rissanen, M. P., Stozkhov, Y., Tröstl, J., Tsagkogeorgas, G., Wagner, R., Williamson, C., Wimmer, D., Winkler, P. M., Yan, C., and Carslaw, K. S.: Causes and importance of new particle formation in the present-day and preindustrial atmospheres, J. Geophys. Res.-Atmos., 122, 8739–8760, https://doi.org/10.1002/2017JD026844, 2017.
Gormley, P. G. and Kennedy, M.: Diffusion from a Stream Flowing through a Cylindrical Tube, P. Roy. Irish Acad. A, 52, 163–169, 1948.
Gryspeerdt, E., Stier, P., and Partridge, D. G.: Satellite observations of cloud regime development: the role of aerosol processes, Atmos. Chem. Phys., 14, 1141–1158, https://doi.org/10.5194/acp-14-1141-2014, 2014.
Hamed, A., Joutsensaari, J., Mikkonen, S., Sogacheva, L., Dal Maso, M., Kulmala, M., Cavalli, F., Fuzzi, S., Facchini, M. C., Decesari, S., Mircea, M., Lehtinen, K. E. J., and Laaksonen, A.: Nucleation and growth of new particles in Po Valley, Italy, Atmos. Chem. Phys., 7, 355–376, https://doi.org/10.5194/acp-7-355-2007, 2007.
Hari, P. and Kulmala, M.: Station for measuring ecosystem-atmosphere relations (SMEAR II), Boreal Environ. Res., 10, 315–322, 2005.
Kerminen, V.-M., Paramonov, M., Anttila, T., Riipinen, I., Fountoukis, C., Korhonen, H., Asmi, E., Laakso, L., Lihavainen, H., Swietlicki, E., Svenningsson, B., Asmi, A., Pandis, S. N., Kulmala, M., and Petäjä, T.: Cloud condensation nuclei production associated with atmospheric nucleation: a synthesis based on existing literature and new results, Atmos. Chem. Phys., 12, 12037–12059, https://doi.org/10.5194/acp-12-12037-2012, 2012.
Kerminen, V.-M., Chen, X., Vakkari, V., Petäjä, T., Kulmala, M., and Bianchi, F.: Atmospheric new particle formation and growth: review of field observations, Environ. Res. Lett., 13, 103003, https://doi.org/10.1088/1748-9326/aadf3c, 2018.
Kulmala, M., Vehkamäki, H., Petäjä, T., Dal Maso, M., Lauri, A., Kerminen, V.-M., Birmili, W., and McMurry, P. H.: Formation and growth rates of ultrafine atmospheric particles: a review of observations, J. Aerosol Sci., 35, 143–176, https://doi.org/10.1016/j.jaerosci.2003.10.003, 2004.
Kulmala, M., Petäjä, T., Nieminen, T., Sipilä, M., Manninen, H. E., Lehtipalo, K., Dal Maso, M., Aalto, P. P., Junninen, H., Paasonen, P., Riipinen, I., Lehtinen, K. E. J., Laaksonen, A., and Kerminen, V.-M.: Measurement of the nucleation of atmospheric aerosol particles, Nat. Protoc., 7, 1651–1667, https://doi.org/10.1038/nprot.2012.091, 2012.
Lampilahti, J., Manninen, H. E., Leino, K., Väänänen, R., Manninen, A., Buenrostro Mazon, S., Nieminen, T., Leskinen, M., Enroth, J., Bister, M., Zilitinkevich, S., Kangasluoma, J., Järvinen, H., Kerminen, V.-M., Petäjä, T., and Kulmala, M.: Data set of airborne and ground-based atmospheric measurements from Hyytiälä, Finland, Zenodo, https://doi.org/10.5281/zenodo.3688471, 2020.
Leino, K., Lampilahti, J., Poutanen, P., Väänänen, R., Manninen, A., Buenrostro Mazon, S., Dada, L., Franck, A., Wimmer, D., Aalto, P. P., Ahonen, L. R., Enroth, J., Kangasluoma, J., Keronen, P., Korhonen, F., Laakso, H., Matilainen, T., Siivola, E., Manninen, H. E., Lehtipalo, K., Kerminen, V.-M., Petäjä, T., and Kulmala, M.: Vertical profiles of sub-3 nm particles over the boreal forest, Atmos. Chem. Phys., 19, 4127–4138, https://doi.org/10.5194/acp-19-4127-2019, 2019.
Manninen, H. E., Petäjä, T., Asmi, E., Riipinen, N., Nieminen, T., Mikkilä, J., Horrak, U., Mirme, A., Mirme, S., Laakso, L., Kerminen, V.-M., and Kulmala, M.: Long-term field measurements of charged and neutral clusters using Neutral cluster and Air Ion Spectrometer (NAIS), Boreal Environ. Res., 14, 591–605, 2009.
Mirme, S. and Mirme, A.: The mathematical principles and design of the NAIS – a spectrometer for the measurement of cluster ion and nanometer aerosol size distributions, Atmos. Meas. Tech., 6, 1061–1071, https://doi.org/10.5194/amt-6-1061-2013, 2013.
Mirme, S., Mirme, A., Minikin, A., Petzold, A., Hõrrak, U., Kerminen, V.-M., and Kulmala, M.: Atmospheric sub-3 nm particles at high altitudes, Atmos. Chem. Phys., 10, 437–451, https://doi.org/10.5194/acp-10-437-2010, 2010.
Miura, Y.: Aspect ratios of longitudinal rolls and convection cells observed during cold air outbreaks, J. Atmos. Sci., 43, 26–39, https://doi.org/10.1175/1520-0469(1986)043<0026:AROLRA>2.0.CO;2, 1986.
Nieminen, T., Asmi, A., Dal Maso, M., Aalto, P. P., Keronen, P., Petäjä, T., Kulmala, M., and Kerminen, V.-M.: Trends in atmospheric new-particle formation: 16 years of observations in a boreal-forest environment, Boreal Environ. Res., 19, 191–214, 2014.
Nilsson, E. D. and Kulmala, M.: The potential for atmospheric mixing processes to enhance the binary nucleation rate, J. Geophys. Res.-Atmos., 103, 1381–1389, https://doi.org/10.1029/97JD02629, 1998.
Nilsson, E. D., Rannik, Ü., Kulmala, M., Buzorius, G., and O'Dowd, C. D.: Effects of continental boundary layer evolution, convection, turbulence and entrainment, on aerosol formation, Tellus B, 53, 441–461, https://doi.org/10.1034/j.1600-0889.2001.530409.x, 2001.
O'Dowd, C. D., Yoon, Y. J., Junkermann, W., Aalto, P., Kulmala, M., Lihavainen, H., and Viisanen, Y.: Airborne measurements of nucleation mode particles II: boreal forest nucleation events, Atmos. Chem. Phys., 9, 937–944, https://doi.org/10.5194/acp-9-937-2009, 2009.
Patton, E. G., Horst, T. W., Sullivan, P. P., Lenschow, D. H., Oncley, S. P., Brown, W. O. J., Burns, S. P., Guenther, A. B., Held, A., Karl, T., Mayor, S. D., Rizzo, L. V., Spuler, S. M., Sun, J., Turnipseed, A. A., Allwine, E. J., Edburg, S. L., Lamb, B. K., Avissar, R., Calhoun, R. J., Kleissl, J., Massman, W. J., Paw U, K. T., and Weil, J. C.: The Canopy Horizontal Array Turbulence Study, B. Am. Meteorol. Soc., 92, 593–611, https://doi.org/10.1175/2010BAMS2614.1, 2011.
Platis, A., Altstädter, B., Wehner, B., Wildmann, N., Lampert, A., Hermann, M., Birmili, W., and Bange, J.: An Observational Case Study on the Influence of Atmospheric Boundary-Layer Dynamics on New Particle Formation, Bound.-Lay. Meteorol., 158, 67–92, https://doi.org/10.1007/s10546-015-0084-y, 2015.
Rosenfeld, D., Andreae, M. O., Asmi, A., Chin, M., Leeuw, G. de, Donovan, D. P., Kahn, R., Kinne, S., Kivekäs, N., Kulmala, M., Lau, W., Schmidt, K. S., Suni, T., Wagner, T., Wild, M., and Quaas, J.: Global observations of aerosol-cloud-precipitation-climate interactions, Rev. Geophys., 52, 750–808, https://doi.org/10.1002/2013RG000441, 2014.
Schobesberger, S., Väänänen, R., Leino, K., Virkkula, A., Backman, J., Pohja, T., Siivola, E., Franchin, A., Mikkilä, J., Paramonov, M., Aalto, P. P., Krejci, R., Petäjä, T., and Kulmala, M.: Airborne measurements over the boreal forest of southern Finland during new particle formation events in 2009 and 2010, Boreal Environ. Res., 18, 145–164, 2013.
Seidel, D. J., Ao, C. O., and Li, K.: Estimating climatological planetary boundary layer heights from radiosonde observations: Comparison of methods and uncertainty analysis, J. Geophys. Res.-Atmos., 115, D16113, https://doi.org/10.1029/2009JD013680, 2010.
Siebert, H., Stratmann, F., and Wehner, B.: First observations of increased ultrafine particle number concentrations near the inversion of a continental planetary boundary layer and its relation to ground-based measurements, Geophys. Res. Lett., 31, L09102, https://doi.org/10.1029/2003GL019086, 2004.
Smedman, A.-S.: Occurrence of roll circulations in a shallow boundary layer, Bound.-Lay. Meteorol., 57, 343–358, https://doi.org/10.1007/BF00120053, 1991.
Väänänen, R., Krejci, R., Manninen, H. E., Manninen, A., Lampilahti, J., Buenrostro Mazon, S., Nieminen, T., Yli-Juuti, T., Kontkanen, J., Asmi, A., Aalto, P. P., Keronen, P., Pohja, T., O'Connor, E., Kerminen, V.-M., Petäjä, T., and Kulmala, M.: Vertical and horizontal variation of aerosol number size distribution in the boreal environment, Atmos. Chem. Phys. Discuss., https://doi.org/10.5194/acp-2016-556, in review, 2016.
Vandemark, D., Mourad, P. D., Bailey, S. A., Crawford, T. L., Vogel, C. A., Sun, J., and Chapron, B.: Measured changes in ocean surface roughness due to atmospheric boundary layer rolls, J. Geophys. Res.-Oceans, 106, 4639–4654, https://doi.org/10.1029/1999JC000051, 2001.
Vanhanen, J., Mikkilä, J., Lehtipalo, K., Sipilä, M., Manninen, H. E., Siivola, E., Petäjä, T., and Kulmala, M.: Particle size magnifier for nano-CN detection, Aerosol Sci. Tech., 45, 533–542, https://doi.org/10.1080/02786826.2010.547889, 2011.
Wainwright, C. E., Stepanian, P. M., Reynolds, D. R., and Reynolds, A. M.: The movement of small insects in the convective boundary layer: linking patterns to processes, Sci. Rep.-UK, 7, 5438, https://doi.org/10.1038/s41598-017-04503-0, 2017.
Wehner, B., Siebert, H., Ansmann, A., Ditas, F., Seifert, P., Stratmann, F., Wiedensohler, A., Apituley, A., Shaw, R. A., Manninen, H. E., and Kulmala, M.: Observations of turbulence-induced new particle formation in the residual layer, Atmos. Chem. Phys., 10, 4319–4330, https://doi.org/10.5194/acp-10-4319-2010, 2010.
Wilson, J. W., Weckwerth, T. M., Vivekanandan, J., Wakimoto, R. M., and Russell, R. W.: Boundary layer clear-air radar echoes: Origin of echoes and accuracy of derived winds, J. Atmos. Ocean. Tech., 11, 1184–1206, https://doi.org/10.1175/1520-0426(1994)011<1184:BLCARE>2.0.CO;2, 1994.
Young, G. S., Kristovich, D. A., Hjelmfelt, M. R., and Foster, R. C.: Rolls, streets, waves and more: A review of quasi-two-dimensional structures in the atmospheric boundary layer, B. Am. Meteorol. Soc., 83, ES54–ES69, 2002.
Zilitinkevich, S. S., Hunt, J. C. R., Esau, I. N., Grachev, A. A., Lalas, D. P., Akylas, E., Tombrou, M., Fairall, C. W., Fernando, H. J. S., Baklanov, A. A., and Joffre, S. M.: The influence of large convective eddies on the surface-layer turbulence, Q. J. Roy. Meteorol. Soc., 132, 1426–1456, https://doi.org/10.1256/qj.05.79, 2006.