the Creative Commons Attribution 4.0 License.
the Creative Commons Attribution 4.0 License.
 | 06 Oct 2020
Evaluating China's fossil-fuel CO2 emissions from a comprehensive dataset of nine inventories
Tom Oda
Xiaohui Lin
Monica Crippa
Dabo Guan
Greet Janssens-Maenhout
Xiaolin Ma
Yuli Shan
Shu Tao
Haikun Wang
Rong Wang
Lin Wu
Xiao Yun
Qiang Zhang
Fang Zhao
China's fossil-fuel CO2 (FFCO2) emissions accounted for approximately 28 % of the global total FFCO2 in 2016. An accurate estimate of China's FFCO2 emissions is a prerequisite for global and regional carbon budget analyses and the monitoring of carbon emission reduction efforts. However, significant uncertainties and discrepancies exist in estimations of China's FFCO2 emissions due to a lack of detailed traceable emission factors (EFs) and multiple statistical data sources. Here, we evaluated China's FFCO2 emissions from nine published global and regional emission datasets. These datasets show that the total emissions increased from 3.4 (3.0–3.7) in 2000 to 9.8 (9.2–10.4) Gt CO2 yr−1 in 2016. The variations in these estimates were largely due to the different EF (0.491–0.746 t C per t of coal) and activity data. The large-scale patterns of gridded emissions showed a reasonable agreement, with high emissions being concentrated in major city clusters, and the standard deviation mostly ranged from 10 % to 40 % at the provincial level. However, patterns beyond the provincial scale varied significantly, with the top 5 % of the grid level accounting for 50 %–90 % of total emissions in these datasets. Our findings highlight the significance of using locally measured EF for Chinese coal. To reduce uncertainty, we recommend using physical CO2 measurements and use these values for dataset validation, key input data sharing (e.g., point sources), and finer-resolution validations at various levels.
- Article
(4468 KB) - Full-text XML
-
Supplement
(1037 KB) - BibTeX
- EndNote


Anthropogenic emissions of carbon dioxide (CO2) are one of the major accelerators of global warming (IPCC, 2007). Global CO2 emissions from fossil-fuel combustion and industry processes increased to 36.23 Gt CO2 yr−1 in 2016, with a mean growth rate of 0.62 Gt CO2 yr−1 over the last decade (Le Quéré et al., 2018). In 2006, China became the world's largest emitter of CO2 (Jones, 2007). CO2 emissions from fossil-fuel combustion and cement production in China were 9.9 Gt CO2 in 2016, accounting for approximately 28 % of all global fossil-fuel-based CO2 emissions (Le Quéré et al., 2018; IPCC AR5, 2013). To avoid the potential adverse effects from climate change (Zeng et al., 2008; Qin et al., 2016), the Chinese government has pledged to peak its CO2 emissions by 2030 or earlier and to reduce CO2 emissions per unit gross domestic product (GDP) by 60 %–65 %, less than the 2005 levels (SCIO, 2015). Thus, an accurate quantification of China's CO2 emissions is the first step toward understanding its carbon budget and making carbon control policy.
The total emission estimates for China are thought to be uncertain or biased due to the lack of reliable statistical data and/or the use of generic emission factors (EFs) (e.g., Guan et al., 2012; Liu et al., 2015b). National and provincial data-based inventories use activity data from different sources. The Carbon Dioxide Information Analysis Center (CDIAC) uses national energy statistics from the United Nations (UN) (Andres et al., 2012), and both the Open-Data Inventory for Anthropogenic Carbon Dioxide (ODIAC) and Global Carbon Project (GCP) mainly use CDIAC total estimates, and thus they are identical in time series (Le Quéré et al., 2018; Oda et al., 2018). The Emissions Database for Global Atmospheric Research (EDGAR) and Peking University CO2 (PKU-CO2, hereafter named PKU) derive emissions from the energy balance statistics of the International Energy Agency (IEA) (Janssens-Maenhout et al., 2019; Wang et al., 2013). In contrast, provincial data-based inventories developed within China all use the provincial energy balance sheet from the China Energy Statistics Yearbook (CESY), National Bureau of Statistics of China (NBS) (Cai et al., 2018; Liu et al., 2013, 2015a; Shan et al., 2018). There are generally four sources of EFs, i.e., (1) the Intergovernmental Panel on Climate Change (IPCC) default values, which have been adopted by ODIAC and EDGAR (Andres et al., 2012; Janssens-Maenhout et al., 2019; Oda et al., 2018); (2) National Development and Reform Commission (NDRC) (NDRC, 2012b); (3) China's National Communication, which reports to the United Nations Framework Convention on Climate Change (UNFCCC) (NDRC, 2012a); and (4) the China Emission Accounts and Datasets (CEADs) EF, which are locally optimized through large sample measurements (Liu et al., 2015b). The existing estimates of global total FFCO2 emissions are comparable in magnitude, with an uncertainty that is generally within ±10 % (Le Quéré et al., 2018; Oda et al., 2018). However, there are significant differences in these values at the national scale (Marland et al., 2010; Olivier et al., 2014), with the uncertainty ranging from a few percent to more than 50 % in the estimated emissions for individual countries (Andres et al., 2012; Boden et al., 2016; Oda et al., 2018).
Along with total emissions estimates, the spatial distribution of emissions is important for several reasons: (1) spatial gridded products enhance our basic understanding of CO2 emissions; (2) spatial distributions are key inputs (as priors) for transport and data assimilation models, which influence the carbon budget (Bao et al., 2020); and (3) spatial distributions can be used for policy making toward emissions reductions and can provide useful information for the deployment of instruments in emissions monitoring for high-emissions areas recognized by multiple inventories (Han et al., 2020). At the global level, gridded emissions datasets are often based on the disaggregation of country-scale emissions (Janssens-Maenhout et al., 2019; Wang et al., 2013). Thus, gridded emissions data are subjected to errors and uncertainties due to total emissions calculations and emissions' spatial disaggregation (Andres et al., 2016; Oda et al., 2018; Oda and Maksyutov, 2011). For example, the Carbon Dioxide Information Analysis Center (CDIAC) distributes national energy statistics at a resolution of using population density as a proxy (Andres et al., 2011, 2016). Further, to improve the spatial resolution of the emissions inventory, the Open-Data Inventory for Anthropogenic Carbon dioxide (ODIAC) distributes national emissions based on CDIAC and BP statistics with satellite nighttime lights and power plant emissions (Oda et al., 2018; Oda and Maksyutov, 2011). EDGAR derives emissions from the energy balance statistics of the International Energy Agency (IEA) and obtains country-specific activity datasets from BP plc, the United States Geological Survey (USGS), the World Steel Association, the Global Gas Flaring Reduction Partnership (GGFR)/US National Oceanic and Atmospheric Administration (NOAA), and the International Fertilizer Association (IFA). Gridded emissions maps at a resolution of are produced using spatial proxy data based on population density, traffic networks, nighttime lights, and point sources, as described in Janssens-Maenhout et al. (2019). Based on subnational fuel, population, and other geographically resolved data, a high-resolution inventory of global CO2 emissions was developed at Peking University (Wang et al., 2013).
To accurately calculate emissions, a series of efforts have been made to quantitatively evaluate China's CO2 emissions using national or provincial activity data, local EF, and detailed datasets of point sources (Cai et al., 2018; Li et al., 2017; Wang et al., 2013). The China High Resolution Emission Database (CHRED) was developed by Cai et al. (2018) and Wang et al. (2014) based on provincial statistics, traffic networks, point sources, and industrial and fuel-specific EF. CHRED was featured based on its exclusive point source data from 1.58 million industrial enterprises from the First China Pollution Source Census. The Multiresolution Emission Inventory for China (MEIC) was developed by Zhang et al. (2007), Lei et al. (2011), and Liu et al. (2015a) at Tsinghua University through the integration of provincial statistics, unit-based power plant emissions, population density, traffic networks, and EF (Li et al., 2017; Zheng et al., 2018a, b). The MEIC uses the China Power Emissions Database (CPED), in which the unit-based approach is used to calculate emissions for each coal-fired power plant in China with detailed unit-level information (e.g., coal use, geographical coordinates). Regarding mobile emissions sources, a high-resolution mapping approach is adopted to constrain vehicle emissions using a county-level activity database. CEADs was constructed by Shan et al. (2016, 2018) and Guan et al. (2018) based on different levels of inventories to provide emissions at the national and provincial scales. CEADs uses coal EF from large-sample measurements (602 coal samples and samples from 4243 coal mines), which are assumed to be more accurate than the IPCC default EFs.
However, regardless of these efforts, China's CO2 emissions remain uncertain due to the large discrepancy among current estimates, of which the difference ranges from 8 % to 24 % of total estimates (Shan et al., 2016, 2018). Several studies have undertaken efforts to quantify the possible uncertainty in China's FFCO2, such as differences due to estimation approaches (Berezin et al., 2013), energy statistics (Hong et al., 2017; Han et al., 2020), spatial scales (Wang and Cai, 2017), and point source data. Importantly, the authors note that the lack of a comprehensive understanding and comparison of the potential uncertainty in estimates of China's FFCO2, including spatial, temporal, proxy, and magnitude components, cause Chinese emissions data to be more uncertain, and thus it is important to present, analyze, and explain such differences among inventories.
Here, we evaluated the uncertainty in China's FFCO2 estimates by synthesizing global gridded emissions datasets (ODIAC, EDGAR, and PKU) and China-specific emission maps (CHRED, MEIC, and the Nanjing University CO2 (NJU) emission inventory). Moreover, several other inventories were used in the evaluation analysis, such as the Global Carbon Budget from the Global Carbon Project and the National Communication on Climate Change of China (NCCC).
The aims of this study were to (1) quantify the magnitude and the uncertainty in China's FFCO2 estimates using the spread of values from state-of-the-art inventories and to (2) identify the spatiotemporal differences of China's FFCO2 emissions among the existing emission inventories and explore the underlying reasons for such differences. To our knowledge, this is the first comprehensive evaluation of the most up-to-date and predominantly publicly available carbon emission inventories for China.
An evaluation analysis was conducted from nine inventories including six gridded datasets (listed in Table 1, ODIAC, EDGAR, PKU, CHRED, MEIC, and NJU) and three other datasets (GCP/CDIAC, CEADs, and NCCC) containing statistical data. We selected the year 2012 for spatial analysis because this is the most recent year available for all the gridded datasets and also because 2012 was a peak year of emissions due to the strong reductions following the impact of the 12th Five-Year Plan. Specifically, the global fossil-fuel CO2 emissions datasets included the year 2017 version of ODIAC (ODIAC2017), version 4.3.2 of EDGAR (EDGARv4.3.2), and PKU-CO2, all of which use the Carbon Monitoring for Action (CARMA) as the point source. The China-specific emissions data used were from 2007 from CHRED, MEIC v1.3, and NJU-CO2 v2017, all of which use China Energy Statistical Yearbook (CESY) activity data. Moreover, three inventories were used as references, i.e., GCP/CDIAC, CEADs, and NCCC, because GCP and ODIAC use CDIAC for the majority of the years, except the most recent 2 years, which were extrapolated using BP data. These three inventories were treated as an inventory in a time-series comparison. Data were collected from the official websites of ODIAC, EDGAR, PKU, and six tabular statistical datasets and were also acquired from the authors who developed CHRED, MEIC, and NJU. See the supporting information for more details on the data sources and the methodology used for each dataset.
We evaluated the abovementioned datasets from three aspects: data sources, boundary (emission sectors), and methodology (Fig. 1, Tables 1 and S1 and S2 in the Supplement). In regard to the data source, there are two levels: national data, such as UN or IEA statistics, and provincial-level data, such as CESY. The emission sectors mainly include fossil-fuel production, industry production and processes, households, transportation, aviation/shipping, agriculture, natural biomass burning from wildfires, and the waste from these datasets; Table S1 in the Supplement lists the sectors included in each inventory. In addition, for methodology, the analysis of the inventories includes the total estimates (activity data and EF) aspect and the spatial disaggregation of point, line, and area sources. Figure 1 shows the conceptual procedure followed for the total emissions estimates and how the gridded maps were produced for all the inventories, and thus it is important to know the differences in the activity data, EF and spatial proxy data, and spatial disaggregation methods used by previous scholars to understand the differences among the inventories in regard to total emissions estimates and spatial characteristics.
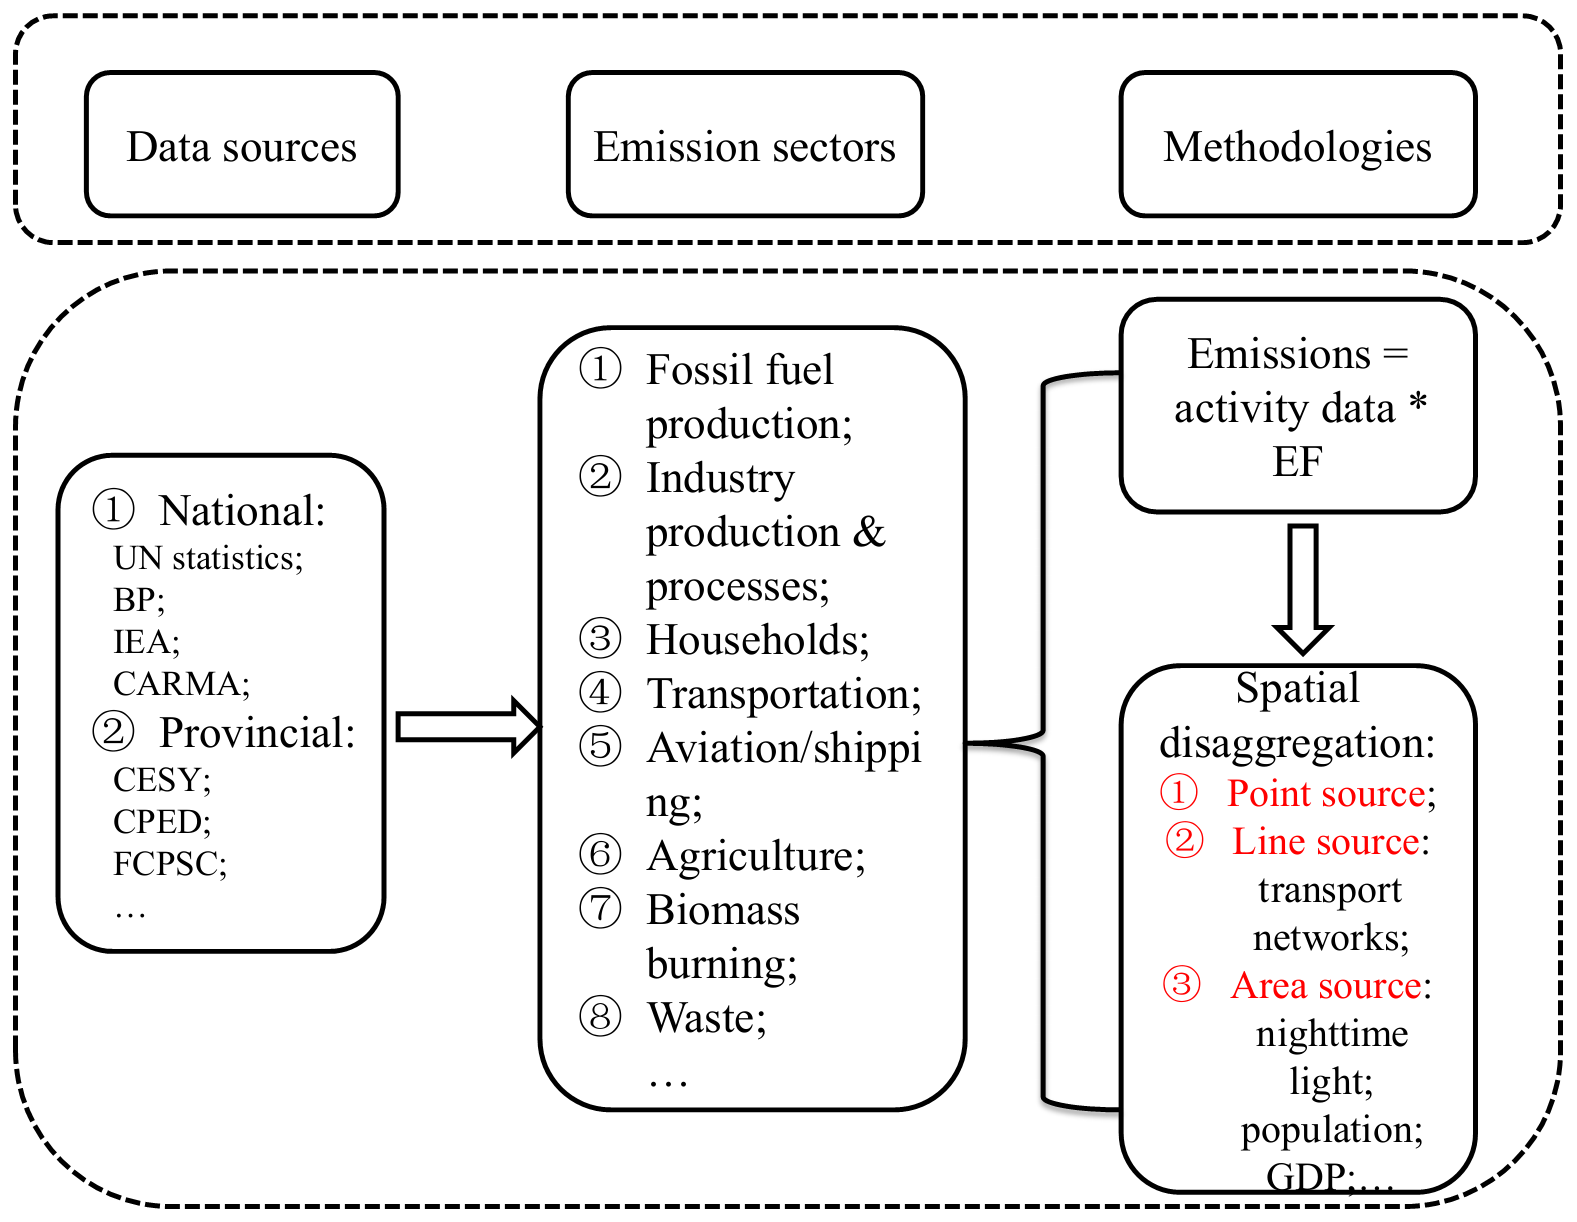
Figure 1Conceptual diagram for data evaluation based on data sources, emission sectors, and methodologies.
The preprocessing of six gridded CO2 emission datasets included several steps, which are described as follows. First, global maps of CO2 emissions (i.e., ODIAC, EDGAR, and PKU) were reprojected using the Albers Conical Equal Area projection (that of CHRED). Next, the nearest neighbor algorithm was used to resample different spatial resolutions into a pixel size of 10 km×10 km, and this method takes the value from the cell closest to the transformed cell as the new value. Second, the national total emissions were derived using the ArcGIS zonal statistics tool from CHRED, while the other emissions were from tabular data provided by the data owners. Finally, the grids for each inventory were sorted in ascending order and then plotted on a logarithmic scale to represent the distribution of emissions. To identify the contribution of high-emission grids, emissions at the grid level that exceeded 50 kt CO2 and the top 5 % emitting grids were selected for analysis.
Table 1General information of the emissions datasets*.
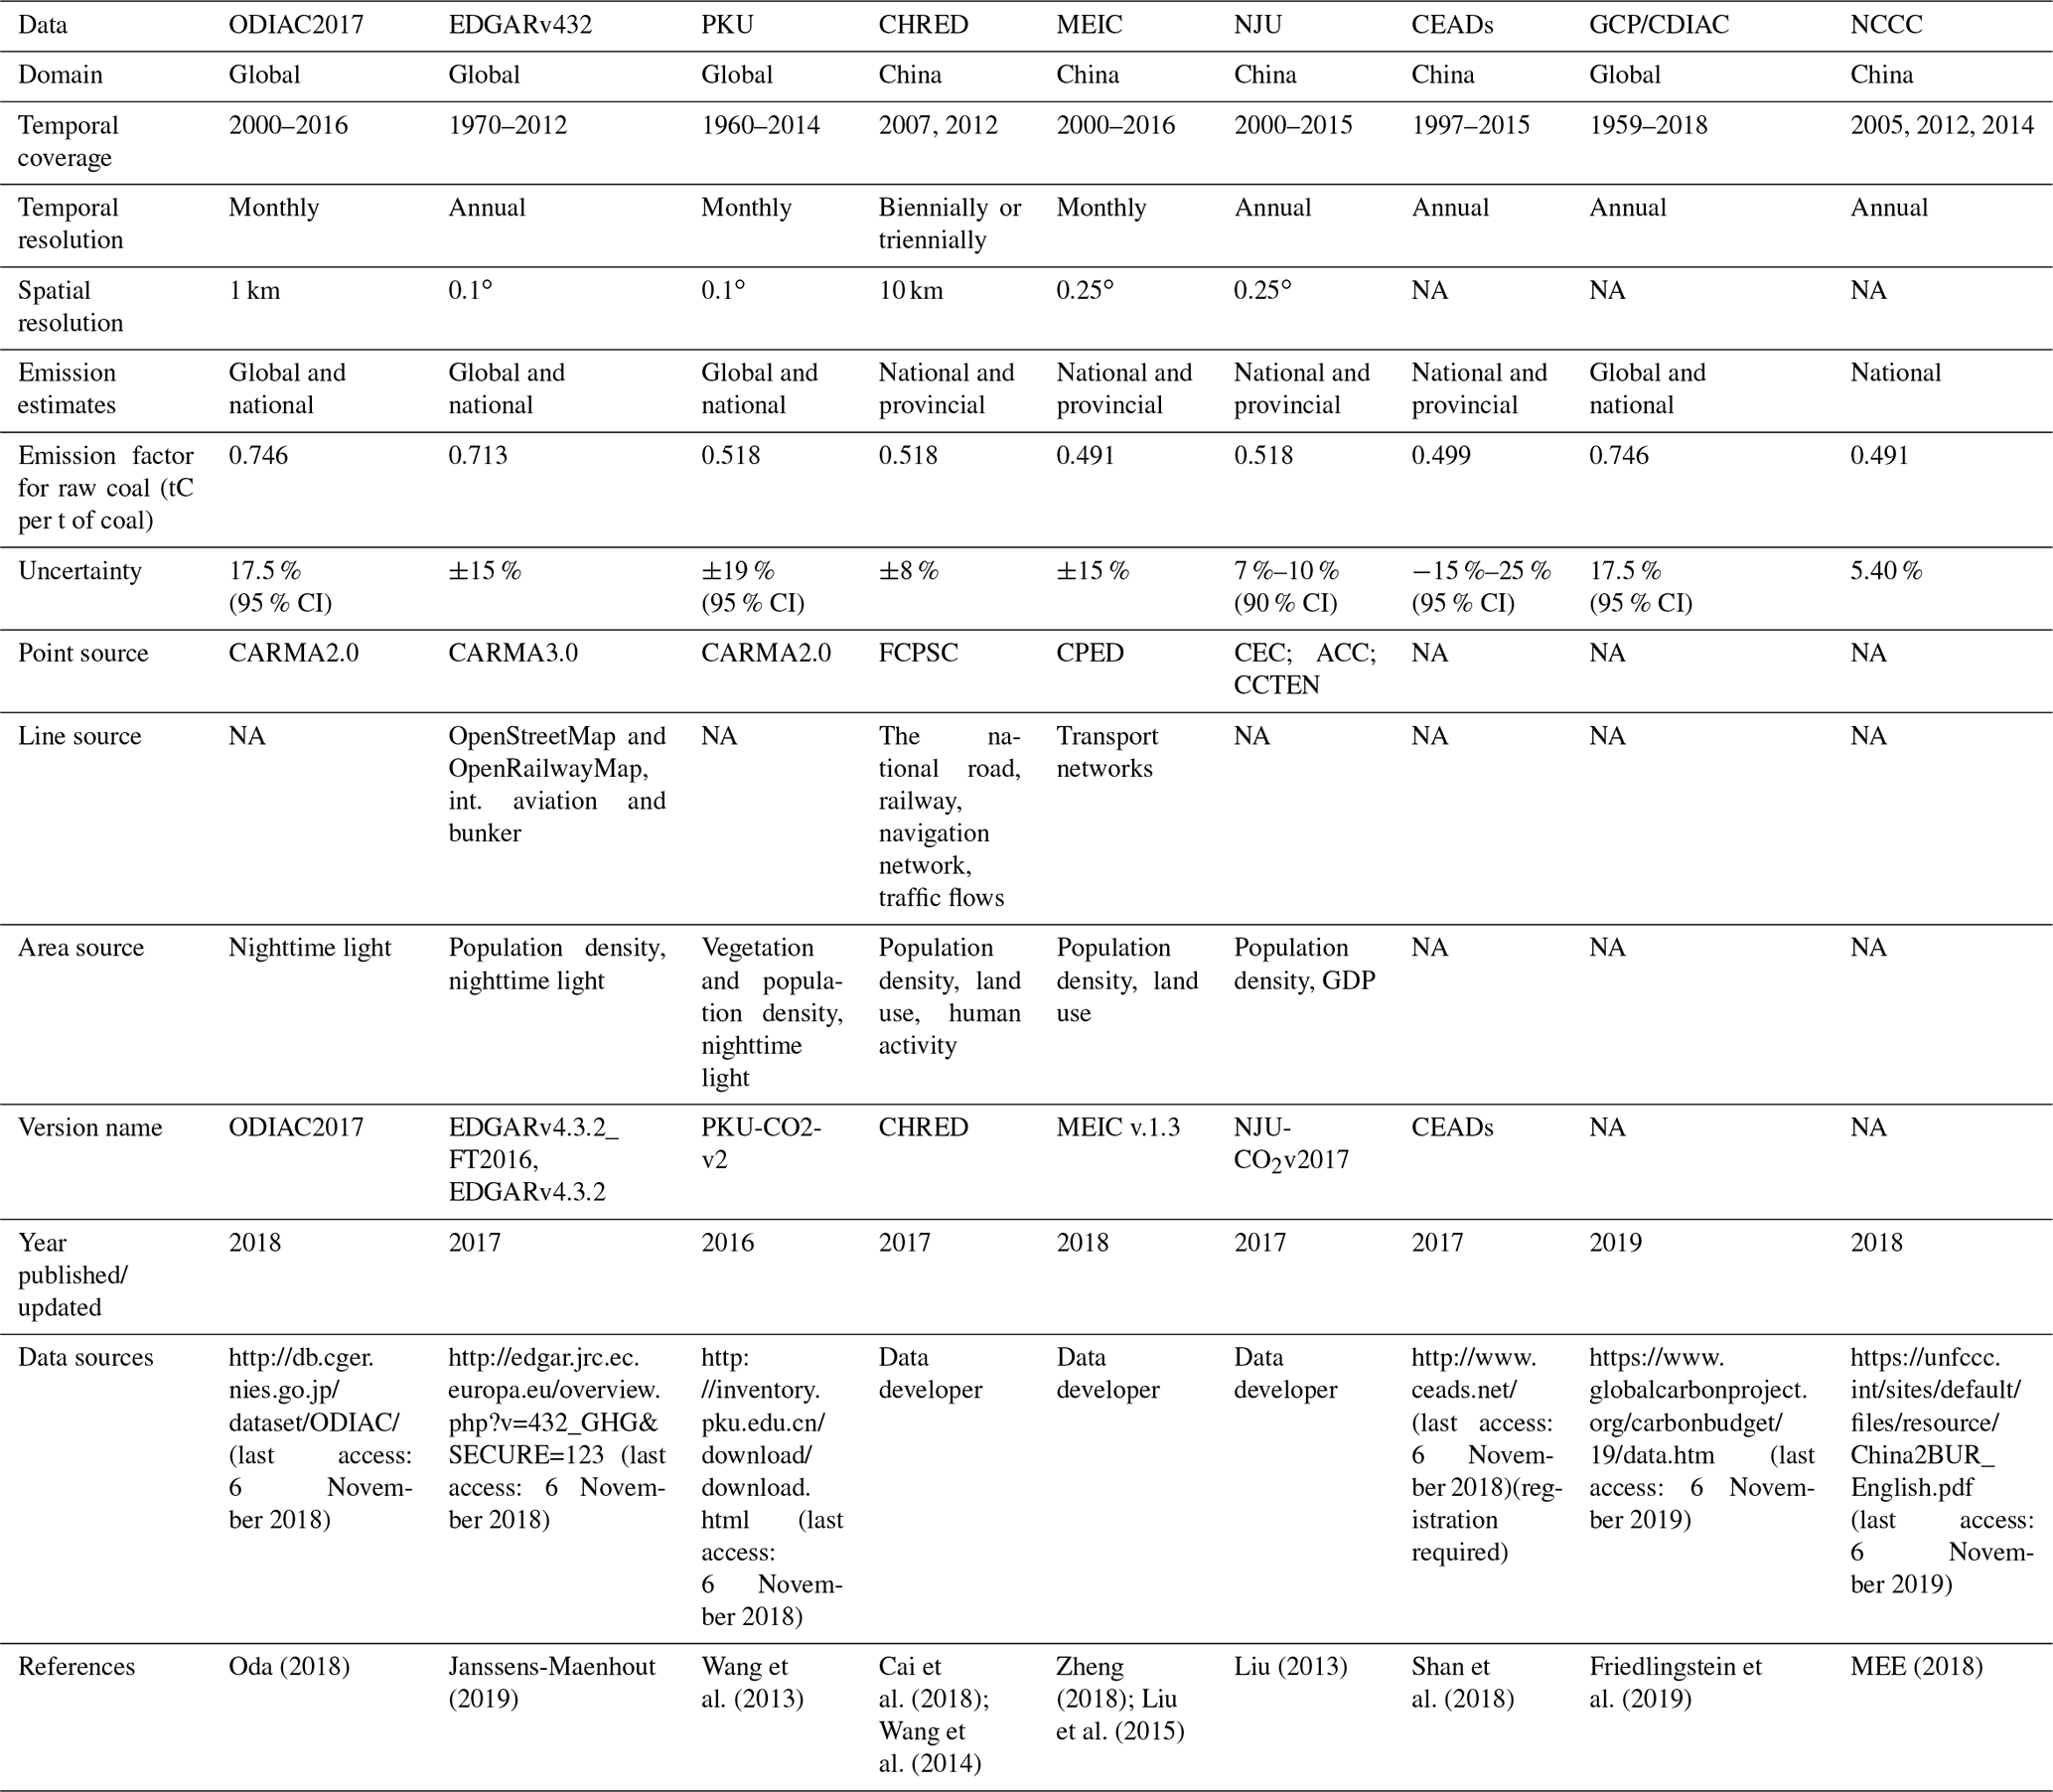
* CI: confidence interval; FCPSC: the First China Pollution Source Census; CPED: China Power Emissions Database; CEC: Commission for Environmental
Cooperation;
ACC: China Cement Almanac; CCTEN: China Cement Industry
Enterprise Indirectory; GDP: gross domestic product; NA: not available.
4.1 Total emissions and recent trends
The interannual variations of China's CO2 emissions from 2000 to 2016 were evaluated from six gridded emission maps and three national total inventories (Fig. 2). All the datasets show a significant increasing trend in the period of 2000 to 2013 from 3.4 to 9.9 Gt CO2. The range of the nine estimates increased simultaneously from 0.7 to 2.1 Gt CO2 (both are 21 % of the corresponding years' total emissions). In the second period (from 2013 to 2016), the temporal variations mostly levelled off or even decreased. Specifically, the emissions estimated from PKU and CEADs showed a slight downward trend, even though they used independent activity data from IEA (2014) and the National Bureau of Statistics (2016), and this downward trend was attributed to changes in the industrial structure, improved combustion efficiency, emissions control, and slowing economic growth (Guan et al., 2018; Zheng et al., 2018a).
There is a large discrepancy among the current estimates, ranging from 8.0 to 10.7 Gt CO2 in 2012. NJU had the highest emissions during the periods of 2005–2015, followed by EDGAR, MEIC, and CDIAC/GCP/ODIAC, while CEADs (National) and PKU were significantly lower (Fig. 2). These discrepancies are mainly because of three reasons: (1) the EF for raw coal was greater for EDGAR and ODIAC than the other databases. The EFs were different for different fossil-fuel types and cement production (Table S2 in the Supplement). Because coal consumption constituted 70 %–80 % of total emissions, the coal EF was more significant than the others. The EFs were different for the three major fossil-fuel types (raw coal, oil, and natural gas) and cement production (Tables 1 and S2 in the Supplement). In addition, the EFs were obtained from either the IPCC default values or local optimized values from different sources. The EFs do not change over time in these inventories, although they should, due to the unavailability of EFs over time; (2) differences in activity data; i.e., NJU, MEIC, and CEADs (Provincial) use provincial data from National Bureau of Statistics (2016), while CEADs (National) and PKU use national data from CESY (2016) and IEA (2014), respectively (Tables 1 and S1 in the Supplement), such that the sum of provincial emissions is higher than the national total; and (3) differences in emission definitions (Tables 1 and S1 in the Supplement, emissions sectors). Although we tried to ensure that these datasets would be as comparable as possible, minor differences in emissions sources (sectors) remained. For example, EDGAR contains abundant industry process-related emissions, whereas CEADs only considers cement production (Janssens-Maenhout et al., 2019). EDGAR and MEIC have similar trends, except for their magnitudes, and MEIC is usually greater than EDGAR. This is a combined effect of the above three reasons. Moreover, MEIC uses provincial energy data from CESY (2016), whereas EDGAR uses national-level data from IEA (2014). However, MEIC's EF is lower than that of EDGAR. These opposing effects bring the datasets closer in magnitude. Both the gridded products (ODIAC, EDGAR, MEIC, and NJU) and national inventory (GCP/CDIAC) show small differences in the magnitude of total emissions estimates and trends from 2000 to 2007, where the differences in magnitude increase gradually from 2008 onward. Although the range increases with time, the relative difference remains at approximately 21 % of the corresponding years' total estimates, indicating potentially systematic differences, such as the fact that EFs remain stable.
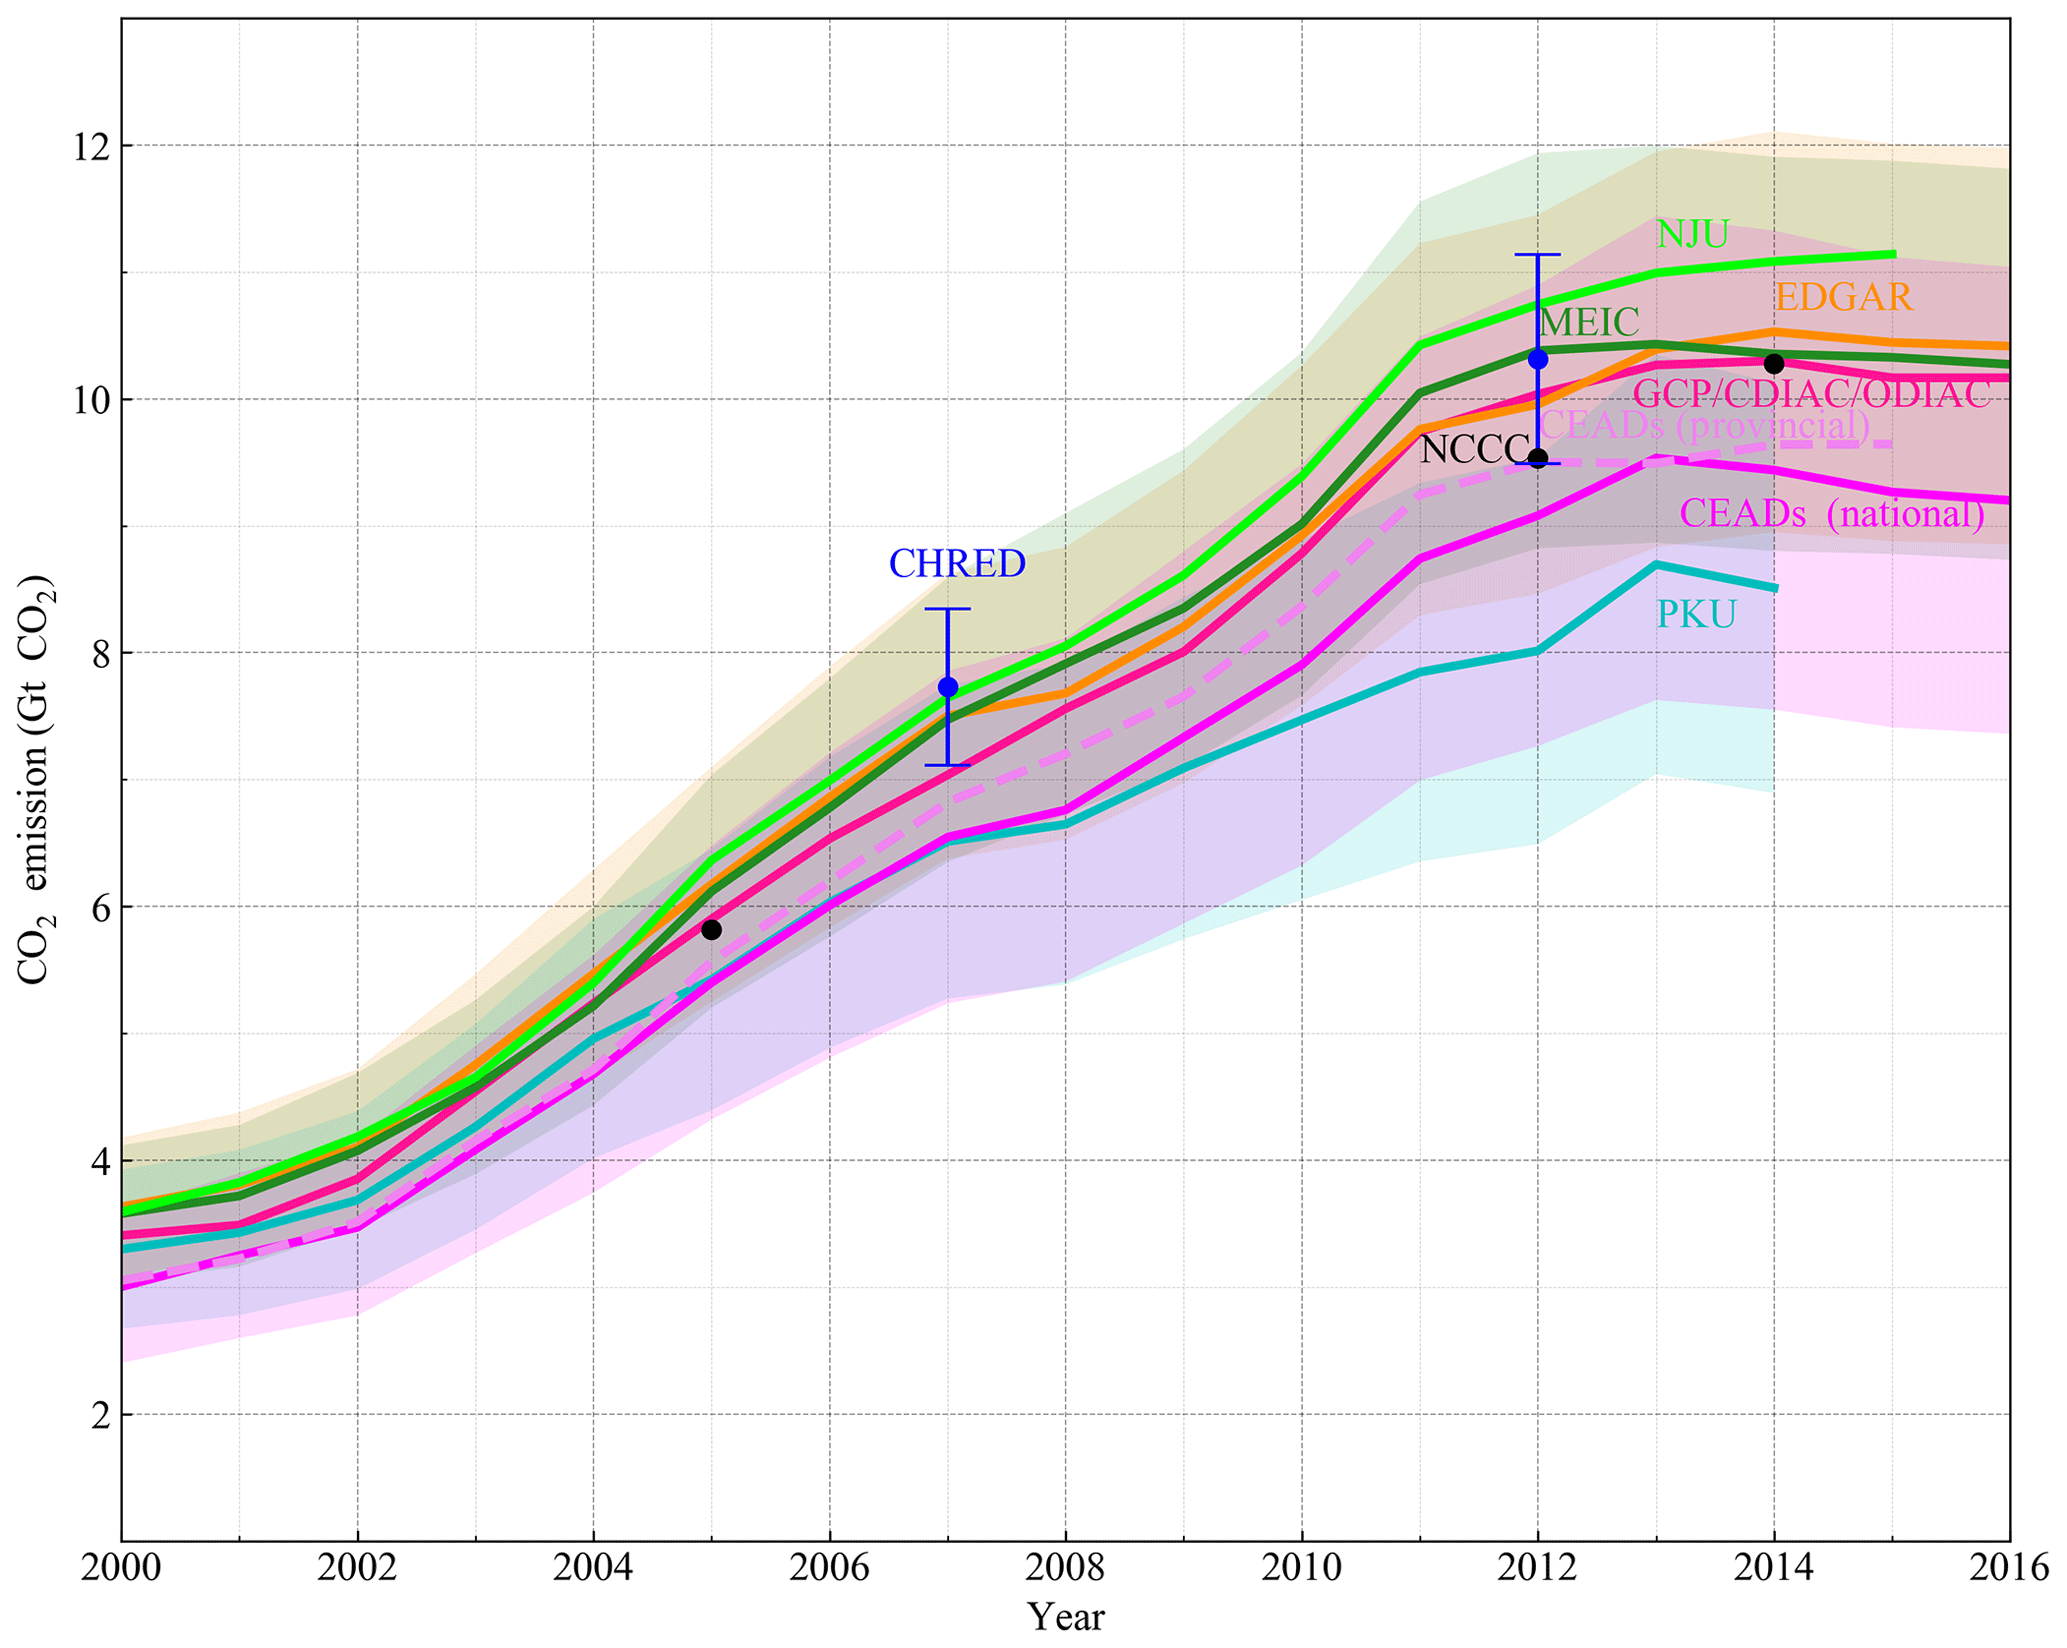
Figure 2China's total FFCO2 emissions from 2000 to 2016. The emissions are from the combustion of fossil fuels and cement production from different sources (EDGARv4.3.2_FT2016 includes international aviation and marine bunker emissions). To maintain comparability and avoid differences resulting from emission disaggregation (e.g., Oda et al., 2018), the values of the six gridded emission inventories are tabular data provided by the data developers before spatial disaggregation. Prior to 2014, GCP data were taken from CDIAC, and those from 2015 to 2016 were calculated based on BP data and the fraction of cement production emissions in 2014. The shaded area (error bar for CHRED) indicates uncertainties from the coauthors' previous studies (see Table 1).
4.2 Spatial distribution of FFCO2 emissions
The evaluation of spatially explicit FFCO2 emissions is fundamentally limited by the lack of direct physical measurements at the grid scale (e.g., Oda et al., 2018). Thus, we attempted to characterize the spatial patterns of China's carbon emissions by presenting the available emissions estimates. We compared six gridded products, including ODIAC, EDGAR, PKU, CHRED, MEIC, and NJU, for the year 2012, which was the most recent year for which all six datasets were available. Spatially, the CO2 emissions from the different datasets are concentrated in eastern China (Fig. 3). The high-emission areas were mostly distributed in city clusters (e.g., Beijing–Tianjin–Hebei (Jing–Jin–Ji), the Yangtze River Delta, and the Pearl River Delta) and densely populated areas (e.g., the North China Plain, the Northeast China Plain, and the Sichuan Basin). These major spatial patterns are primarily due to the use of spatial proxy data and are also in accordance with previous studies (Guan et al., 2018; Shan et al., 2018). However, there were notable differences among the different estimates at finer spatial scales. Large carbon emissions regions were found in the North China Plain and the Northeast China Plain for ODIAC (Fig. 3a), PKU (Fig. 3c), MEIC (Fig. 3e), and NJU (Fig. 3f), which ranged from 1000 to 10 000 t CO2 km−2. However, high levels of emissions located in the Sichuan Basin were found from PKU, MEIC, and NJU but not from ODIAC. This discrepancy in identifying significant CO2 emissions was probably due to emissions from rural settlements with high population densities (e.g., Sichuan Basin), which did not appear strongly in satellite nighttime lights or on the ODIAC map (Wang et al., 2013). The more diffusive distributions of MEIC and NJU were attributed to the abundance of point sources, with or without line source and area source proxies. Moreover, EDGAR, PKU, CHRED, MEIC, and NJU all showed relatively low emissions in western China, but the emissions from ODIAC were zero due to the lack of nighttime light in that region, which tended to distribute more emissions toward strongly lit (at night) urban regions (Wang et al., 2013).
EDGAR, CHRED, and MEIC all showed traffic line source emissions by inducing traffic networks in the spatial disaggregation. The line emissions (such as expressways or arterial highways) depicted a more detailed spatial distribution in CHRED than in either EDGAR or MEIC. This discrepancy could be attributed to the different road networks and corresponding weighting factors used by each. CHRED disaggregated emissions from the transport sector based on traffic networks and traffic flows (Cai et al., 2018). MEIC applied the traffic network from the China Digital Road-network Map (CDRM) (Zheng et al., 2017), and EDGAR traffic networks were obtained from OpenStreetMap and OpenRailwayMap (Geofabrik, 2015). ODIAC considered point and area sources while lacking line source emissions in the spatial disaggregation, which places more emissions in populated areas than in suburbs (Oda et al., 2018). Oda and Maksyutov (2011) noted the possible utility of street lights to represent line source spatial distributions even without the associated specific traffic spatial data. The spatial distributions of traffic emissions are highly uncertain, with biases of 100 % or more (Gately et al., 2015), which is largely due to mismatches between the downscaling proxies and the actual vehicle activity distribution.
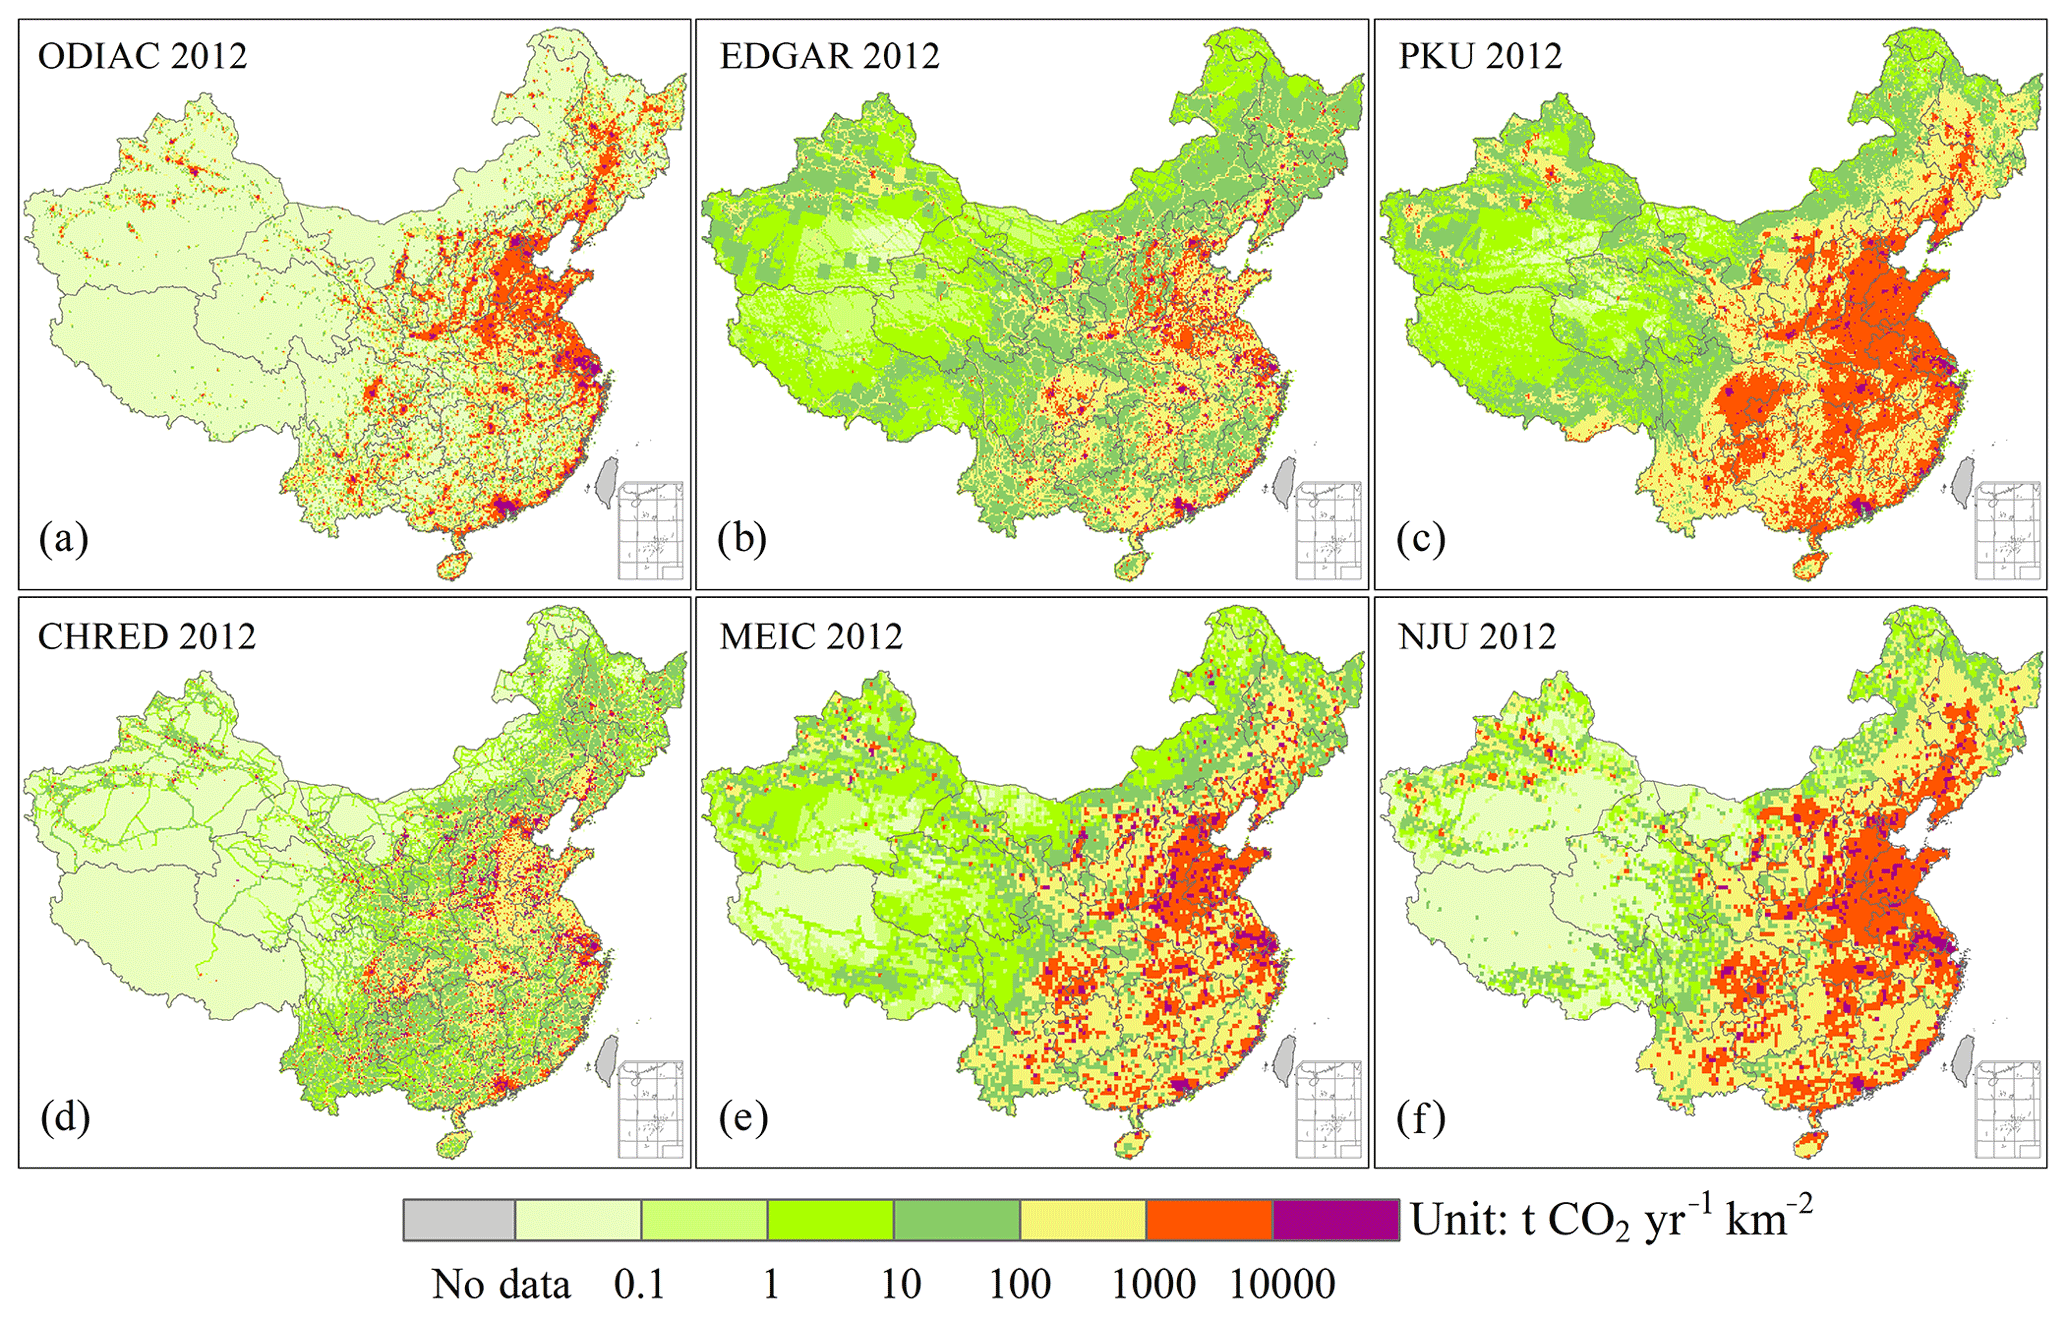
Figure 3Spatial distributions of ODIAC (a), EDGAR (b), PKU (c), CHRED (d), MEIC (e), and NJU (f) at a 10 km resolution for 2012. ODIAC was aggregated from 1 km data, such that MEIC, PKU, and EDGAR were resampled from 0.25, 0.1, and 0.1∘.
4.3 CO2 emissions at the provincial level
The provincial-level results showed more consistency than the grid-level results in terms of spatial distribution. All the products agreed that the eastern and southern provinces were high emitters (>400 Mt CO2 yr−1, Figs. 4 and S3 in the Supplement), while the western provinces were low emitters (<200 Mt CO2 yr−1, Figs. 4 and S3 in the Supplement). The five most emitting provinces were Shandong, Jiangsu, Hebei, Henan, and Inner Mongolia, with emissions values ranging from 577±48 to 820±102 Mt CO2 in 2012 (Fig. 4). Meanwhile, the provinces located in the western area with low economic activity and population density showed low carbon emissions (<200 Mt CO2, Figs. 4 and S3 in the Supplement). There is a clear discrepancy in the provincial-level emissions among the different estimates, and the mean standard deviation (SD) for the 31 provinces' emissions was 62 Mt CO2 (or 20 %) in 2012. A large SD (>100 Mt CO2) occurred in high-emitting provinces, such as Shandong, Jiangsu, Inner Mongolia, Shanxi, Hebei, and Liaoning. For Shandong Province, the inventories varied from 675 to 965 Mt CO2 yr−1, with a relative SD of 12 % (Figs. 4 and 5), and for the other high-emitting provinces, the relative SD ranged from 12 % to 48%, which implied that the uncertainty could be further reduced.
Because estimates based on provincial energy statistics are assumed to be more accurate than those derived from the disaggregation of national totals using spatial proxies, we evaluated the provincial emissions of each inventory using the provincial-based inventory mean (CHRED, MEIC, and NJU) (Fig. 5). The results showed that emissions derived from the provincial energy statistics are highly correlated, with R values ranging from 0.99 to 1.00 and slopes ranging from 0.96 to 1.04. In contrast, the estimates for ODIAC, EDGAR, and PKU, which used IEA national energy statistics, showed an obvious disparity, especially in the five most emitting provinces, suggesting the significant impact of spatially disaggregated approaches in the allocation of total emissions. The potential implication is that when performing spatial disaggregation, national-data-based inventories can use provincial fractions as constraints.
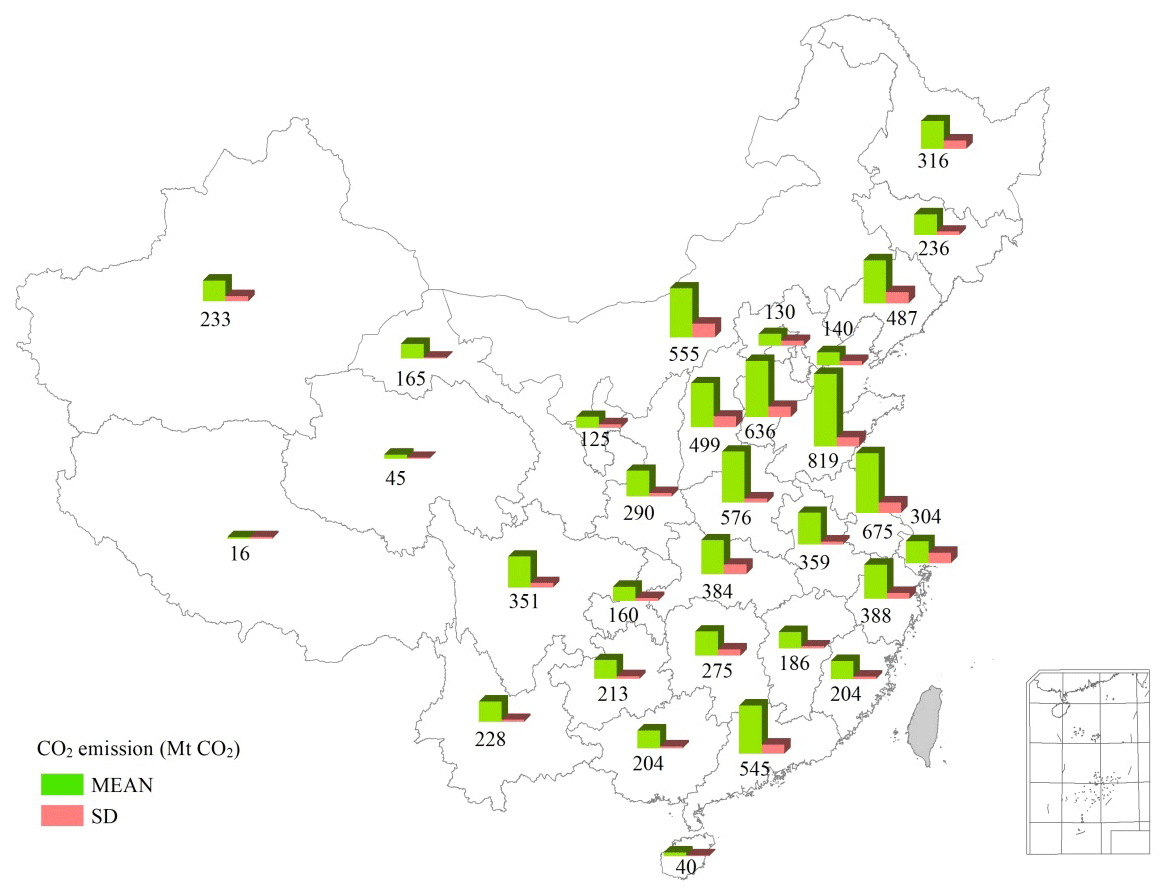
Figure 4Provincial mean total emissions for ODIAC, EDGAR, PKU, CHRED, MEIC, and NJU in 2012. The numbers beneath the green bars are the provincial total CO2 emissions in Mt.
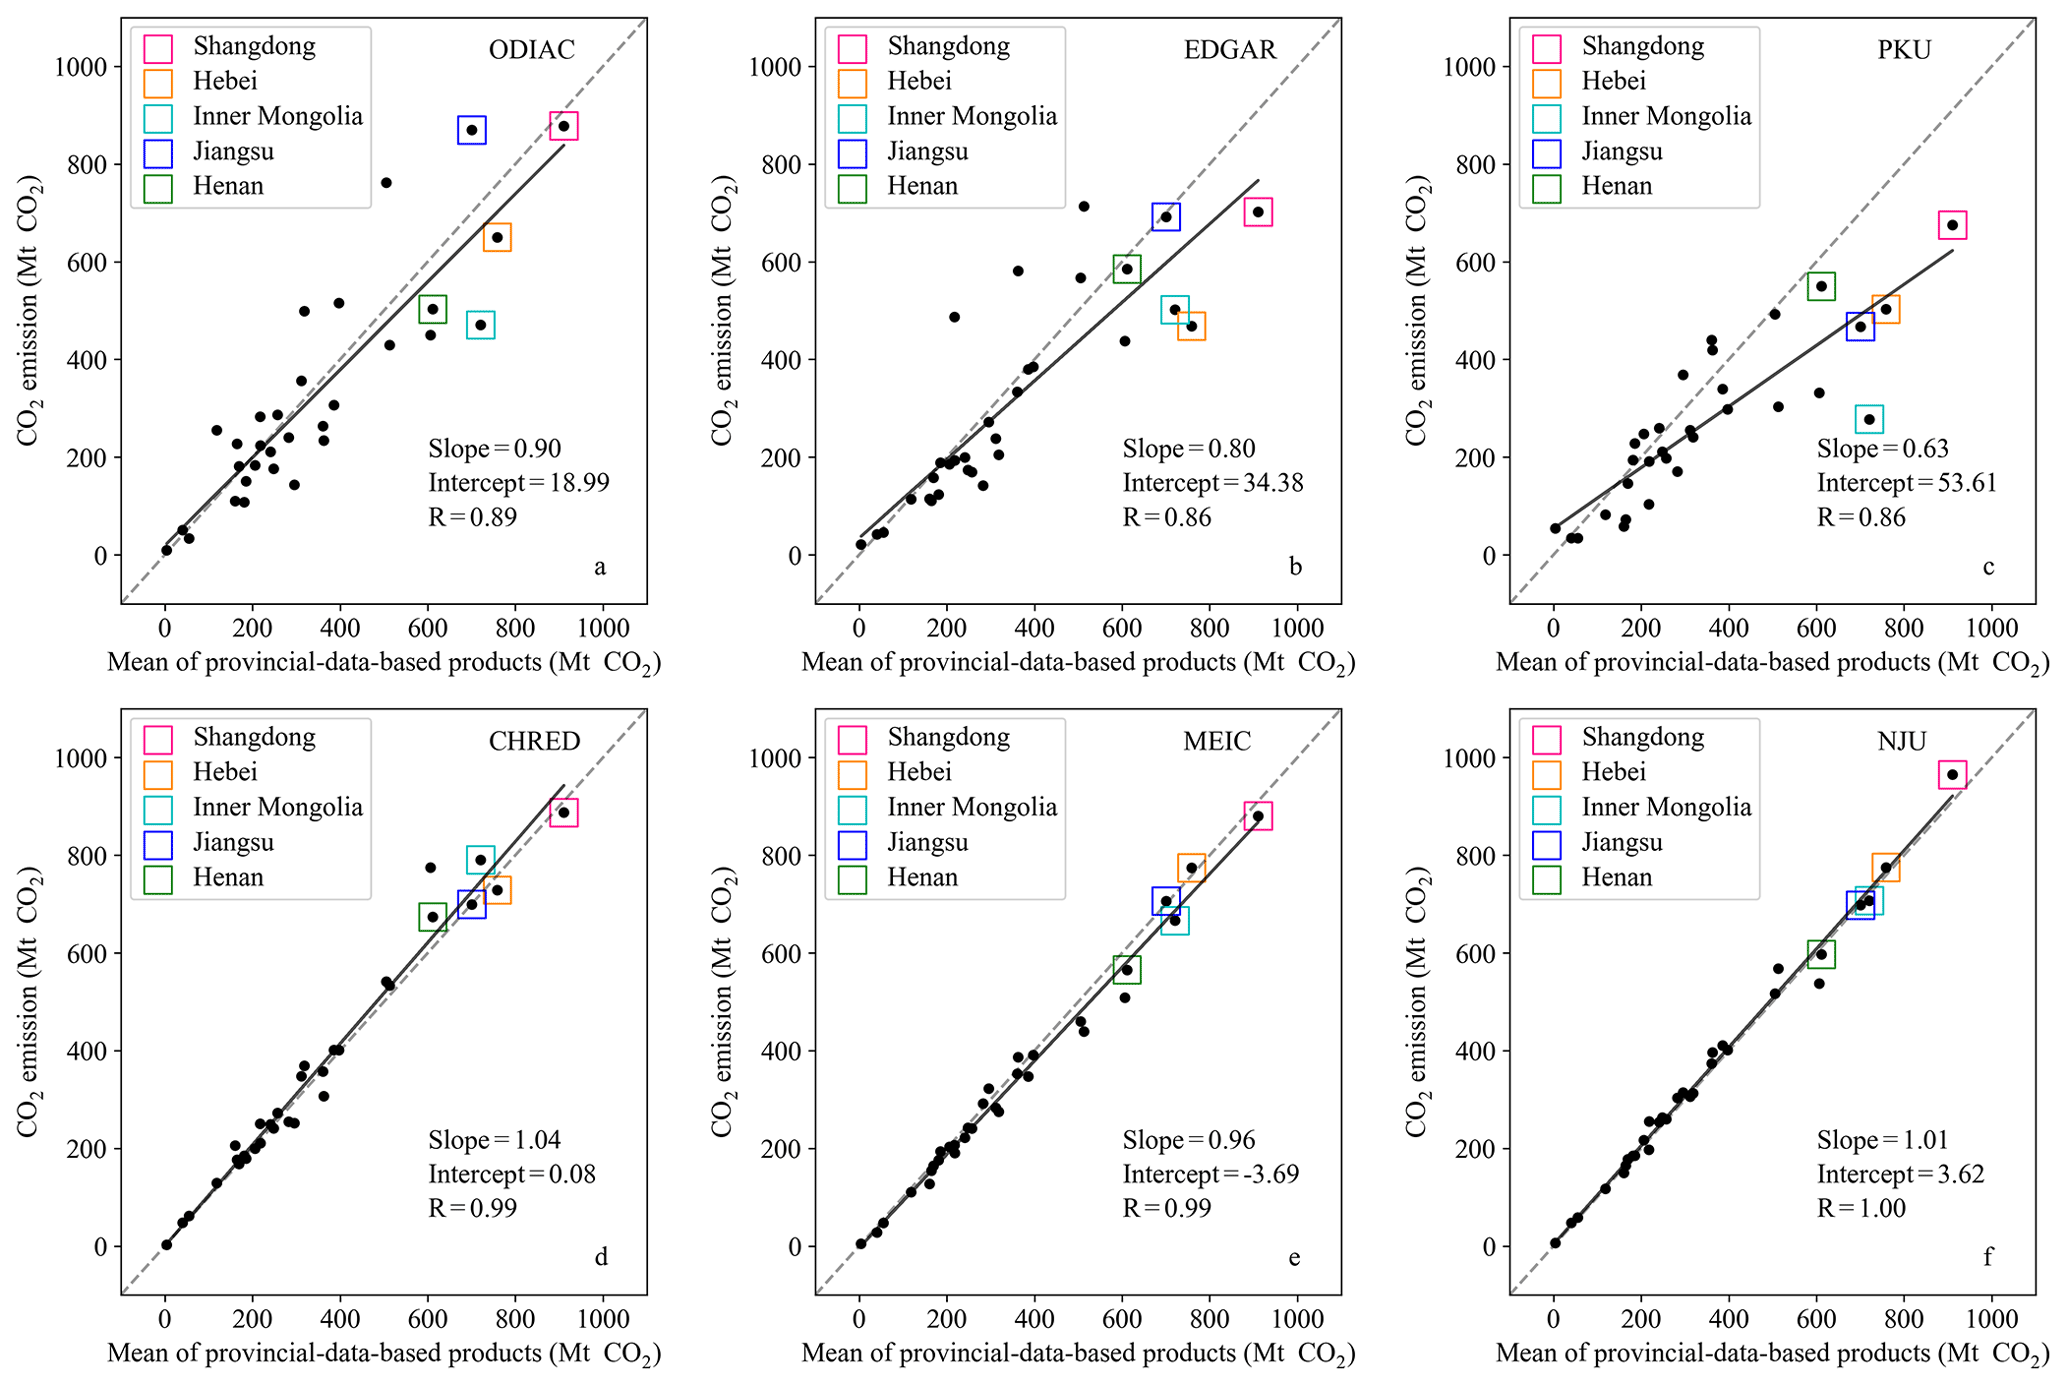
Figure 5Scatter plots of the provincial total emissions for ODIAC, EDGAR, PKU, CHRED, MEIC, and NJU in 2012 with the five most emitting provinces highlighted, and the x axis is the mean of provincial-data-based products (CHRED, MEIC, and NJU).
4.4 Statistics of CO2 emissions at the grid level
To further characterize the spatial pattern of China's CO2 emissions, the probability density function (PDF), cumulative emissions, and top 5 % emitting grids were analyzed to identify the spatial differences from the distribution of grid cell emissions (Fig. 6). As illustrated in Fig. 4a, ODIAC showed a significant number of cells with zero emissions (62 %) (Fig. 6a), with medium-emitting grids (500–50 000 t CO2 km−2) constituting 30 % and high-emitting grids (>50 000 t CO2 km−2) constituting 3 %. Although the low-emissions cells (1–500 t CO2 km−2) were mainly located in EDGAR (58 %) and CHRED (69 %) (Fig. 6b and d) and the medium-emitting grids constituted 30 %–40%, the high-emitting grids only amounted to 2 %–3%. This situation could have a significant impact on the cumulative national total emissions (Fig. 6g). The frequency distribution of high-emissions grids revealed differences in the point source data. MEIC showed the largest number of high-emitting cells (500–500 000 t CO2 km−2, 5 % in comparison with the others, which were at 2 %–3%, Fig. 6e) by using a high-resolution emissions database (CPED) that included more power plant information (Li et al., 2017; Liu et al., 2015a). Furthermore, ODIAC and EDGAR agreed well regarding the high emissions (>100 000 t CO2 km−2) because their point source emissions were both from the CARMA database (Table 1). Moreover, CARMA is the only global database that tracks CO2 that gathers and presents the best available estimates of CO2 emissions for 50 000 power plants around the world, of which approximately 15 000 have latitude and longitude information with emissions greater than 0. The database includes approximately one-quarter of all greenhouse gas emissions. However, CARMA is no longer active (the last update was 28 November 2012), and the geolocations of power plants are not sufficiently accurate, especially in China (Byers et al., 2019; Liu et al., 2013, 2015a; Wang et al., 2013). Therefore, users must perform corrections themselves (Liu et al., 2013, 2015a; Oda et al., 2018; Wang et al., 2013; Janssens-Maenhout et al., 2019).
As shown in the cumulative emissions plot (Fig. 6g), PKU and NJU showed very similar cumulative curves, and the situation was similar for EDGAR and CHRED. Moreover, the total emissions for EDGAR and CHRED were largely determined by a small proportion of high-emitting grids that showed a steep increase at the last stage of the cumulative curves (Fig. 6g), and the top 5 % emitting grids accounted for approximately 90 % of the total emissions (Fig. 6e), which is greater than the comparable values of 82 %, 71 %, 58 %, and 51 % for ODIAC, MEIC, NJU, and PKU, respectively. The emissions from PKU, MEIC, and NJU were relatively evenly distributed because CHRED was mainly derived from enterprise-level point sources (Cai et al., 2018). In contrast, the emissions of PKU were the most evenly distributed, and the emissions from the top 5 % emitting grids only accounted for 51 % (Fig. 6g) because PKU incorporated special area source survey data for Chinese rural areas from a 34 489-household energy-mix survey and a 1670-household fuel-weighing campaign (Tao et al., 2018). Moreover, the use of a spatial disaggregation proxy based on population density also contributed to this spatial pattern. Similarly, MEIC and NJU were evenly distributed because of the same activity data from CESY, National Bureau of Statistics (Table 1).
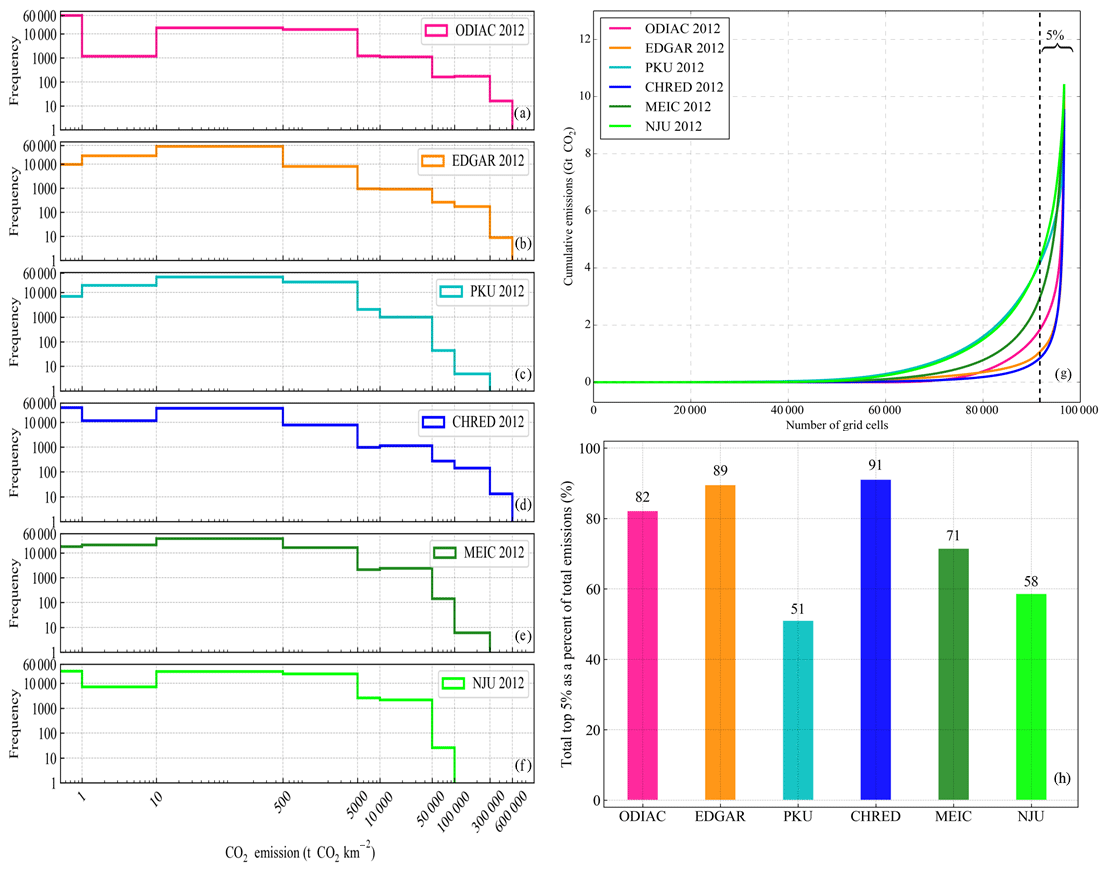
Figure 6Frequency counts (a–f), cumulative emissions (g) (grids are sorted from low to high), and the top 5 % emitting grid plots (h) for ODIAC, EDGAR, PKU, CHRED, MEIC, and NJU in 2012 at a 10 km resolution.
To identify the locations of hotspots, bubble plots (Fig. S2 in the Supplement) demonstrated the spatial distribution of high-emitting grid cells that were greater than 50 kt CO2 km−2. CHRED, EDGAR, and ODIAC showed similar patterns, with high-emitting grids concentrated in city clusters (e.g., Jing–Jin–Ji, the Yangtze River Delta, and the Pearl River Delta) and the eastern coast (Fig. S2 in the Supplement). EDGAR and ODIAC both derived their power plant emissions from CARMA, but ODIAC was likely to place more emissions than EDGAR over urbanized regions with lights, especially in the North China Plain. The emissions of CPED and CARMA were similar in China, with a minor difference of 2 %, although the number of power plants varied significantly (2320 vs. 945) (Liu et al., 2015a), which implied that CARMA tended to allocate similar emissions to fewer plants than CPED.
5.1 Activity data differences in the datasets and their effects
The activity data sources, data level, and sectors are the significant determinants of total emissions. As seen in Fig. 1, activity data and EF determine the total emission estimates and affect the spatial distributions by using disaggregation proxies for point, line, and area sources. It has been well-discussed that the sum of provincial data is greater than the national total (Guan et al., 2012; Hong et al., 2017; Liu et al., 2013; Z. Liu et al., 2015; Shan et al., 2018). CEADs (provincial) is 8 %–18 % greater than CEADs (national) after year 2008 (Fig. 2). Thus, the province-based estimates (e.g., NJU and MEIC) are greater than CEADs (national). This difference could be attributed to the differences in national and provincial statistical systems and artificial factors, such as the fact that some provincial energy balance sheets were adjusted to achieve an exact match between supply and consumption (Hong et al., 2017). For example, provincial statistics suffer from data inconsistency and double counting problems (Zhang et al., 2007; Guan et al., 2012). One possible way to improve these statistics is to use the provincial consumption fractions to rescale the national total consumption when distributing emissions to grids. Hong et al. (2017) found that the ratio of the maximum discrepancy to the mean value was 16 % due to the use of different versions of national and provincial data in CESY. Ranges of 32 %–47% of CO2 emissions from the power sector (mainly coal use) were found among the inventories, while for the transport sector (mainly liquid fuels), the fractions ranged from 7 % to 9%. Apart from such differences, one peak of FFCO2 emissions was identified by most datasets in 2013, which were largely found to be due to slowing economic growth (National Bureau of Statistics, 1998–2017), changes in the industrial structure (Mi et al., 2017; Guan et al., 2018), and a decline in the share of coal used for energy (Qi et al., 2016). Strategies for reducing emissions could be based on such uniformed trends, while making reduction policies for provinces requires the support of provincial energy-based datasets instead of national energy-based datasets.
Estimates with more sectors are usually higher than those with fewer sectors. In regard to the incorporation of different emissions sectors, EDGAR includes international aviation and bunkers (Janssens-Maenhout et al., 2019) and NJU incorporates waste (Liu et al., 2013) (Table S1 in the Supplement), and thus both were higher than the others. Moreover, for MEIC v.1.3 downloaded from the official website, biofuel combustion (which accounted for approximately 5.7 % of the total) was included; however, the version used here was specially prepared to exclude biofuel to increase the comparability of the database. In addition, CEADs industry processes only include cement production and were thus lower than those (e.g., NJU and EDGAR) that include more processes (iron and steel, etc.) (Janssens-Maenhout et al., 2019; Shan et al., 2018; Liu et al., 2013). The PKU dataset used IEA energy statistics with more detailed energy subtypes. The emissions factors were based on more detailed energy subtypes with lower EFs, while other inventories used the averages of large groups (Table 1), such that the sum of more detailed subtypes might not equal the total of large groups due to the incompleteness of the statistics. These factors could explain the reasons for the lower emissions estimate (Wang et al., 2013). A further comparison with IEA, EIA, and BP estimates with only energy-related emissions also confirmed that estimates with more sectors would be greater than those with fewer (Fig. S1 in the Supplement).
5.2 Effects of emission factors on the total emissions
Carbon emissions are calculated from activity data and EFs, and the uncertainty in estimates is typically reported as 5 %–10%, while the maximum difference in this study reached 33.8 % (or 2.7 PgC) in 2012. One major reason for this difference is the EF used by these inventories (Table 1). The EF for raw coal ranged from 0.491 to 0.746. For example, CEADs used 0.499 tC per t of coal based on large-sample measurements, while EDGAR used 0.713 from the default values recommended by IPCC (Janssens-Maenhout et al., 2019; Z. Liu et al., 2015; Shan et al., 2018), and the differences were largely due to the low quality and high ash content of Chinese coal. The variability of lignite and coal quality is quite significant. In Z. Liu et al. (2015), the carbon content of lignite ranged from 11 % to 51%, with a mean ± SD of 28 %±13 (n=61). Furthermore, another study showed that the uncertainty from EFs (−16 % to 24 %) was significantly greater than that from activity data (−1 % to 9 %) (Shan et al., 2018). We recommended substituting the IPCC default coal EF with the CEADs EF. Regarding plant-level emissions from coal consumption, the collection of EFs measured at fields representing the quality and type of various coals is much needed to calibrate the large point source emissions, and we call for the inclusion of physical measurements for the calibration and validation of existing datasets (Bai et al., 2007; Dai et al., 2012; Kittner et al., 2018; Yao et al., 2019). Different fuel types contribute differently to emissions factors; i.e., for the same net heating value, natural gas emitted the least amount of carbon dioxide (61.7 kg CO2 TJ−1 energy), followed by oil (65.3 kg CO2 TJ−1 energy) and coal (94.6 kg CO2 TJ−1 energy). Similarly, one successful example of the reduction of air pollutants and CO2 was that the Chinese government initiated the “project of replacement of coal with natural gas and electricity in North China” in 2016 (Zheng et al., 2018a). Moreover, the nonoxidation fraction of 8 % used in Z. Liu et al. (2015) for coal was attributable to the differences when compared with a default nonoxidation fraction of 0 %, as recommended by IPCC (2006) in EDGAR (Janssens-Maenhout et al., 2019). Moreover, the average qualities of coal vary with time, yet we lacked such time-series quality data on raw coal. Bottom-up inventories typically use time-invariant EFs for CO2 due to the lack of information on coal heating values over time; similarly, the MEIC model also uses constant EFs of CO2 (Zheng et al., 2018). Teng and Zhu (2015) recommended time-varied conversion factors from raw coal to standard coal as well as changing the raw coal to commodity coal in energy balance statistics because the latter has relatively efficient statistics on EF.
5.3 Spatial distribution of point, line and area sources
5.3.1 Point sources in datasets and their effects on spatial distribution
Point source emissions account for a large proportion of total emissions (Hutchins et al., 2017). Power plants consumed approximately half of the total coal production in the past decade (F. Liu et al., 2015). Thus, the accuracy of point sources was extremely important for improving emission estimates. ODIAC, EDGAR, and PKU all distributed power plant emissions from the CARMA dataset. However, the geolocation errors in China are relatively large, and only 45 % of power plants are located in the same grid in CARMA v2.0 according to the real power plant locations that were identified by visual inspection in Google Maps (Wang et al., 2013). This discrepancy is because CARMA generally treats city-center latitudes and longitudes as the approximate coordinates of power plants (Wheeler and Ummel, 2008; Ummel, 2012).
F. Liu et al. (2015) found that CARMA neglected approximately 1300 small power plants in China. Thus, CARMA allocated similar emissions to a more limited number of plants than CPED (Table S2 in the Supplement, 720, 1706, and 2320 point sources for ODIAC, EDGAR, and MEIC, respectively), and ODIAC had fewer point sources due to the elimination of incorrect geolocations. The high-emitting grids in CHRED were attributed to the 1.58 million industrial enterprises from the First China Pollution Source Census (FCPSC) that were used as point sources (Wang et al., 2014). Following the CARMA example, we call on the open source of large point sources for datasets and reinforce the importance of Chinese scientists adjusting the locations of point sources from CARMA.
5.3.2 Effects of spatial disaggregation methods on line and area sources
Downscaling methods are widely used because of their uniformity and simplicity due to the lack of detailed spatial data. The disaggregation methods used (e.g., nighttime light, population) by inventories significantly affect the resulting spatial pattern. For example, ODIAC mainly uses nighttime light from satellite images to distribute emissions. Thus, the hotspots concentrate more strongly in high nighttime light regions. However, the use of remote sensing data tends to underestimate industrial and transportation emissions (Ghosh et al., 2010). For instance, coal-fired power plants do not emit strong lights and may be far from cities because transmission lines are used. Electricity generation and use usually occur in different locations, and stronger nighttime light does not always indicate higher CO2 emissions (Cai et al., 2018; Doll et al., 2000). Furthermore, nighttime lights ignore some other main fossil-fuel emissions, such as household cooking with coal. The good correlation between nighttime light and CO2 emissions is usually on a larger-scale basis (national or continental) (Oda et al., 2010; Raupach et al., 2010), while this relationship fails in populated or industrialized rural areas.
Transport networks are also used in several inventories for spatial disaggregation. EDGAR and CHRED both showed clear transport emissions, especially in western China. EDGAR uses three road types and their corresponding weighting factors to disaggregate line source emissions. CHRED uses national traffic networks and their flows to distribute traffic emissions (Cai et al., 2012, 2018). It is easier to obtain traffic networks but rather difficult to obtain traffic flows and vehicle kilometer travelled (VKT) data, and thus the weighting factors method is significantly easier to apply.
Population is widely used in spatial disaggregation (Andres et al., 2014, 2016; Janssens-Maenhout et al., 2019). CDIAC emissions maps originally used static population data to distribute emissions but have recently changed to a temporally varying population proxy, which has largely reduced uncertainty. However, the unified algorithm for spatial disaggregation, such as the population density approach, encounters difficulties in depicting the uneven development of rural and urban areas, and instead, it usually uses interpolation for a limited number of base years and does not truly vary across years at high spatial resolution (Andres et al., 2014). Furthermore, downscaling approaches may introduce approximately 50 % error per pixel, which are spatially correlated (Rayner et al., 2010), a problem that must be considered in future studies.
Moreover, big cities have virtually eliminated the use of coal (Guan et al., 2018; Zheng et al., 2018a), while in rural areas, the use of coal has often increased (Meng et al., 2019). For example, a national survey showed that China's rural residential coal consumption fractions for heating increased from 19.2 % to 27.2 % (Tao et al., 2018). These transitions have impacts on the spatial distribution of both CO2 and air pollutants. In addition, the high-resolution CO2 emissions can serve as a potential proxy for fossil-fuel emissions (Wang et al., 2013); thus, further improvements to spatial disaggregation should consider these transitions and the survey data.
The datasets of ODIAC, EDGAR, PKU, and CEADs are freely available from http://db.cger.nies.go.jp/dataset/ODIAC/ (Oda, 2018), http://edgar.jrc.ec.europa.eu/overview.php?v=432_GHG&SECURE=123 (Janssens-Maenhout, 2018), http://inventory.pku.edu.cn/download/download.html (Wang and Tao, 2018), and http://www.ceads.net/ (Shan and Guan, 2018), respectively. CHRED, MEIC, and NJU are available from the data developers upon request.
Data and methodology descriptions of the nine datasets and supplementary figures on emission estimates. The supplement related to this article is available online at: https://doi.org/10.5194/acp-20-11371-2020-supplement.
PFH and NZ conceived and designed the study. PFH and XHL collected and analyzed the datasets. PFH, XHL, NZ, and TO wrote the paper, with contributions from all the coauthors.
The authors declare that they have no conflict of interest.
We thank Bofeng Cai from the Chinese Academy for Environmental Planning for kindly providing the CHRED data and his suggestions for improving the manuscript.
This research has been supported by the Ministry of Science and Technology of the People's Republic of China (grant no. 2017YFB0504000).
This paper was edited by Joshua Fu and reviewed by three anonymous referees.
Andres, R. J., Gregg, J. S., Losey, L., Marland, G., and Boden, T. A.: Monthly, global emissions of carbon dioxide from fossil fuel consumption, Tellus, 63, 309–327, 2011.
Andres, R. J., Boden, T. A., Bréon, F.-M., Ciais, P., Davis, S., Erickson, D., Gregg, J. S., Jacobson, A., Marland, G., Miller, J., Oda, T., Olivier, J. G. J., Raupach, M. R., Rayner, P., and Treanton, K.: A synthesis of carbon dioxide emissions from fossil-fuel combustion, Biogeosciences, 9, 1845–1871, https://doi.org/10.5194/bg-9-1845-2012, 2012.
Andres, R. J., Boden, T. A., and Higdon, D.: A new evaluation of the uncertainty associated with CDIAC estimates of fossil fuel carbon dioxide emission, Tellus B, 66, 23616, https://doi.org/10.3402/tellusb.v66.23616, 2014.
Andres, R. J., Boden, T. A., and Higdon, D. M.: Gridded uncertainty in fossil fuel carbon dioxide emission maps, a CDIAC example, Atmos. Chem. Phys., 16, 14979–14995, https://doi.org/10.5194/acp-16-14979-2016, 2016.
Bai, X. F., Li, W. H., Chen, Y. F., and Jiang, Y.: The general distributions of trace elements in Chinese coals, Int. J. Coal Sci. Technol., 4, 172–182, 2007.
Bao, Z., Han, P., Zeng, N., Liu, D., Wang, Y., Tang, G., Yao, B., and Zheng, K.: Observation and modeling of vertical carbon dioxide distribution in a heavily polluted suburban environment, Atmos. Ocean. Sci. Lett., 13, 371–379, https://doi.org/10.1080/16742834.2020.1746627, 2020.
Berezin, E. V., Konovalov, I. B., Ciais, P., Richter, A., Tao, S., Janssens-Maenhout, G., Beekmann, M., and Schulze, E.-D.: Multiannual changes of CO2 emissions in China: indirect estimates derived from satellite measurements of tropospheric NO2 columns, Atmos. Chem. Phys., 13, 9415–9438, https://doi.org/10.5194/acp-13-9415-2013, 2013.
Boden, T. A., Marland, G., and Andres, R. J.: Global, Regional, and National Fossil-Fuel CO2 Emissions, Carbon Diox-ide Information Analysis Center, Oak Ridge National Labo-ratory, US Department of Energy, Oak Ridge, TN, USA, https://doi.org/10.3334/CDIAC/00001_V2016, 2016.
Byers, L., Friedrich, J., Hennig, R., Kressig, A., Li, X., McCormick, C., and Malaguzzi, V. L.: A Global Database of Power Plants, World Resources Institute, Washington, DC, available at: https://www.wri.org/publication/global-database-power-plants (last access: 26 August 2020), 2019.
Cai, B., Yang, W., Cao, D., Liu, L., Zhou, Y., and Zhang, Z.: Estimates of China's national and regional transport sector CO2 emissions in 2007, Energ. Pol., 41, 474–483, 2012.
Cai, B., Liang, S., Zhou, J., Wang, J., Cao, L., Qu, S., Xu, M., and Yang, Z.: China high resolution emission database (CHRED) with point emission sources, gridded emission data, and supplementary socioeconomic data, Resour. Conserv. Recycl., 129, 232–239, https://doi.org/10.1016/j.resconrec.2017.10.036, 2018.
Dai, S., Ren, D., Chou, C.-L., Finkelman, R. B., Seredin, V. V., and Zhou, Y.: Geochemistry of trace elements in Chinese coals: A review of abundances, genetic types, impacts on human health, and industrial utilization, Int. J. Coal Geol., 94, 3–21, https://doi.org/10.1016/j.coal.2011.02.003, 2012.
Doll, C. H., Muller, J.-P., and Elvidge, C. D.: Night-time Imagery as a Tool for Global Mapping of Socioeconomic Parameters and Greenhouse Gas Emissions, AMBIO, 29, 157–162, 2000.
Friedlingstein, P., Jones, M. W., O'Sullivan, M., Andrew, R. M., Hauck, J., Peters, G. P., Peters, W., Pongratz, J., Sitch, S., Le Quéré, C., Bakker, D. C. E., Canadell, J. G., Ciais, P., Jackson, R. B., Anthoni, P., Barbero, L., Bastos, A., Bastrikov, V., Becker, M., Bopp, L., Buitenhuis, E., Chandra, N., Chevallier, F., Chini, L. P., Currie, K. I., Feely, R. A., Gehlen, M., Gilfillan, D., Gkritzalis, T., Goll, D. S., Gruber, N., Gutekunst, S., Harris, I., Haverd, V., Houghton, R. A., Hurtt, G., Ilyina, T., Jain, A. K., Joetzjer, E., Kaplan, J. O., Kato, E., Klein Goldewijk, K., Korsbakken, J. I., Landschützer, P., Lauvset, S. K., Lefèvre, N., Lenton, A., Lienert, S., Lombardozzi, D., Marland, G., McGuire, P. C., Melton, J. R., Metzl, N., Munro, D. R., Nabel, J. E. M. S., Nakaoka, S.-I., Neill, C., Omar, A. M., Ono, T., Peregon, A., Pierrot, D., Poulter, B., Rehder, G., Resplandy, L., Robertson, E., Rödenbeck, C., Séférian, R., Schwinger, J., Smith, N., Tans, P. P., Tian, H., Tilbrook, B., Tubiello, F. N., van der Werf, G. R., Wiltshire, A. J., and Zaehle, S.: Global Carbon Budget 2019, Earth Syst. Sci. Data, 11, 1783–1838, https://doi.org/10.5194/essd-11-1783-2019, 2019.
Gately, C. K., Hutyra, L. R., and Sue Wing, I.: Cities, traffic, and CO2: A multidecadal assessment of trends, drivers, and scaling relationships, P. Natl. Acad. Sci., 112, 4999–5004, https://doi.org/10.1073/pnas.1421723112, 2015.
Geofabrik: Openstreetmap, available at: https://www.openstreetmap.org (last access: 26 August 2020) and OpenRailwayMap, 2015.
Ghosh, T., Elvidge, C. D., Sutton, P. C., Baugh, K. E., Ziskin, D., and Tuttle, B. T.: Creating a Global Grid of Distributed Fossil Fuel CO2 Emissions from Nighttime Satellite Imagery, Energies, 3, 1895–1913, https://doi.org/10.3390/en3121895, 2010.
Guan, D., Liu, Z., Geng, Y., Lindner, S., and Hubacek, K.: The gigatonne gap in China's carbon dioxide inventories, Nat. Clim. Change, 2, 672–675, https://doi.org/10.1038/nclimate1560, 2012.
Guan, D., Meng, J., Reiner, D. M., Zhang, N., Shan, Y., Mi, Z., Shao, S., Liu, Z., Zhang, Q., and Davis, S. J.: Structural decline in China's CO2 emissions through transitions in industry and energy systems, Nat. Geosci., 11, 551–555, https://doi.org/10.1038/s41561-018-0161-1, 2018.
Han, P., Lin, X., Zeng, N., Oda, T., Zhang, W., Liu, D., Cai, Q. C., Crippa, M., Guan, D., Ma, X., Janssens-Maenhout, G., Meng, W., Shan, Y., Tao, S., Wang, G., Wang, H., Wang, R., Wu, L., Zhang, Q., Zhao, F., and Zheng, B.: Province-level fossil fuel CO2 emission estimates for China based on seven inventories, J. Cleaner Prod., 277, 123377, https://doi.org/10.1016/j.jclepro.2020.123377, 2020.
Hong, C., Zhang, Q., He, K., Guan, D., Li, M., Liu, F., and Zheng, B.: Variations of China's emission estimates: response to uncertainties in energy statistics, Atmos. Chem. Phys., 17, 1227–1239, https://doi.org/10.5194/acp-17-1227-2017, 2017.
Hutchins, M. G., Colby, J. D., Marland, G., and Marland, E.: A comparison of five high-resolution spatially-explicit, fossil-fuel, carbon dioxide emission inventories for the United States, Mitig. Adapt. Strateg. Glob. Change, 22, 947, https://doi.org/10.1007/s11027-016-9709-9, 2017.
IEA: Energy Balances of OECD and non-OECD countries, in: Beyond 2020 Online Database, International Energy Agency, Paris, 2014.
IPCC: IPCC Guidelines for National Greenhouse Gas Inventories, edited by: Eggleston, S., Buendia, L., Miwa, K., Ngara, T., Tanabe, K., IPCC-TSU NGGIP, IGES, Hayama, Japan, available at: https://www.ipcc-nggip.iges.or.jp/public/2006gl/index.html (last access: 15 June 2020), 2007.
IPCC AR5: IPCC 2013: The Physical Science Basis. In: Contribution of Working Group I to the Fifth Assessment Report of the Intergovernmental Panel on Climate Change, edited by: Stocker, T., Qin, D., Plattner, G., Tignorand, M., Allen, S., Boschungand, J., Nauels, A., Xia, Y., Bex, V., and Midgley, P., Cambridge University Press, Cambridge, UK, 2013.
Janssens-Maenhout, G.: EDGAR v4.3.2 Global Atlas of the three major greenhouse gas emissions for the period 1970–2012, available at: http://edgar.jrc.ec.europa.eu/overview.php?v=432_GHG&SECURE=123, last access: 4 November 2018.
Janssens-Maenhout, G., Crippa, M., Guizzardi, D., Muntean, M., Schaaf, E., Dentener, F., Bergamaschi, P., Pagliari, V., Olivier, J. G. J., Peters, J. A. H. W., van Aardenne, J. A., Monni, S., Doering, U., Petrescu, A. M. R., Solazzo, E., and Oreggioni, G. D.: EDGAR v4.3.2 Global Atlas of the three major greenhouse gas emissions for the period 1970–2012, Earth Syst. Sci. Data, 11, 959–1002, https://doi.org/10.5194/essd-11-959-2019, 2019.
Jones, N.: China tops CO2 emissions, Nature News, https://doi.org/10.1038/news070618-9, 2007.
Kittner, N., Fadadu, R. P., Buckley, H. L., Schwarzman, M. R., and Kammen, D. M.: Trace Metal Content of Coal Exacerbates Air-Pollution-Related Health Risks: The Case of Lignite Coal in Kosovo, Environ. Sci. Technol., 52, 2359–2367, https://doi.org/10.1021/acs.est.7b04254, 2018.
Le Quéré, C., Andrew, R. M., Friedlingstein, P., Sitch, S., Pongratz, J., Manning, A. C., Korsbakken, J. I., Peters, G. P., Canadell, J. G., Jackson, R. B., Boden, T. A., Tans, P. P., Andrews, O. D., Arora, V. K., Bakker, D. C. E., Barbero, L., Becker, M., Betts, R. A., Bopp, L., Chevallier, F., Chini, L. P., Ciais, P., Cosca, C. E., Cross, J., Currie, K., Gasser, T., Harris, I., Hauck, J., Haverd, V., Houghton, R. A., Hunt, C. W., Hurtt, G., Ilyina, T., Jain, A. K., Kato, E., Kautz, M., Keeling, R. F., Klein Goldewijk, K., Körtzinger, A., Landschützer, P., Lefèvre, N., Lenton, A., Lienert, S., Lima, I., Lombardozzi, D., Metzl, N., Millero, F., Monteiro, P. M. S., Munro, D. R., Nabel, J. E. M. S., Nakaoka, S., Nojiri, Y., Padin, X. A., Peregon, A., Pfeil, B., Pierrot, D., Poulter, B., Rehder, G., Reimer, J., Rödenbeck, C., Schwinger, J., Séférian, R., Skjelvan, I., Stocker, B. D., Tian, H., Tilbrook, B., Tubiello, F. N., van der Laan-Luijkx, I. T., van der Werf, G. R., van Heuven, S., Viovy, N., Vuichard, N., Walker, A. P., Watson, A. J., Wiltshire, A. J., Zaehle, S., and Zhu, D.: Global Carbon Budget 2017, Earth Syst. Sci. Data, 10, 405–448, https://doi.org/10.5194/essd-10-405-2018, 2018.
Lei, Y., Zhang, Q., Nielsen, C., and He, K.: An inventory of primary air pollutants and CO2 emissions from cement production in China, 1990–2020, Atmos. Environ., 45, 147–154, https://doi.org/10.1016/j.atmosenv.2010.09.034, 2011.
Li, M., Zhang, Q., Kurokawa, J.-I., Woo, J.-H., He, K., Lu, Z., Ohara, T., Song, Y., Streets, D. G., Carmichael, G. R., Cheng, Y., Hong, C., Huo, H., Jiang, X., Kang, S., Liu, F., Su, H., and Zheng, B.: MIX: a mosaic Asian anthropogenic emission inventory under the international collaboration framework of the MICS-Asia and HTAP, Atmos. Chem. Phys., 17, 935–963, https://doi.org/10.5194/acp-17-935-2017, 2017.
Liu, M., Wang, H., Wang, H., Oda, T., Zhao, Y., Yang, X., Zang, R., Zang, B., Bi, J., and Chen, J.: Refined estimate of China's CO2 emissions in spatiotemporal distributions, Atmos. Chem. Phys., 13, 10873–10882, https://doi.org/10.5194/acp-13-10873-2013, 2013.
Liu, F., Zhang, Q., Tong, D., Zheng, B., Li, M., Huo, H., and He, K. B.: High-resolution inventory of technologies, activities, and emissions of coal-fired power plants in China from 1990 to 2010, Atmos. Chem. Phys., 15, 13299–13317, https://doi.org/10.5194/acp-15-13299-2015, 2015.
Liu, Z., Guan, D., Wei, W., Davis, S. J., Ciais, P., Bai, J., Peng, S., Zhang, Q., Hubacek, K., Marland, G., Andres, R. J., Crawford-Brown, D., Lin, J., Zhao, H., Hong, C., Boden, T. A., Feng, K., Peters, G. P., Xi, F., Liu, J., Li, Y., Zhao, Y., Zeng, N., and He, K.: Reduced carbon emission estimates from fossil fuel combustion and cement production in China, Nature, 524, 335, https://doi.org/10.1038/nature14677, 2015.
Marland, G., Hamal, K., and Jonas, M.: How Uncertain Are Estimates of CO2 Emissions?, J. Indust. Ecol., 13, 4–7, 2010.
MEE, Ministry of Ecology and Environment of the People's Republic of China: The People's Republic of China Second Biennial Update Report on Climate Change, available at: https://unfccc.int/sites/default/files/resource/China 2BUR_English.pdf (last access: 8 June 2019), 2018.
Meng, W., Zhong, Q., Chen, Y., Shen, H., Yun, X., Smith, K. R., Li, B., Liu, J., Wang, X., Ma, J., Cheng, H., Zeng, E. Y., Guan, D., Russell, A. G., and Tao, S.: Energy and air pollution benefits of household fuel policies in northern China, P. Natl. Acad. Sci. USA, 116, 16773, https://doi.org/10.1073/pnas.1904182116, 2019.
Mi, Z., Meng, J., Guan, D., Shan, Y., Liu, Z., Wang, Y., Feng, K., and Wei, Y.-M.: Pattern changes in determinants of Chinese emissions, Environ. Res. Lett., 12, 074003, https://doi.org/10.1088/1748-9326/aa69cf, 2017.
National Bureau of Statistics: China Statistical Yearbook 1998–2016, China Statistics Press, 1998–2017.
National Bureau of Statistics: China Energy Statistical Yearbook 2016, China Statistics Press, Beijing, 2016.
NDRC: The People's Republic of China Second National Communication on Climate Change, available at: http://qhs.ndrc.gov.cn/zcfg/201404/W020140415316896599816.pdf (last access: 12 May 2020), 2012a.
NDRC: Guidelines for China's Provincial GHG Emission Inventories, 2012b.
Oda, T.: The Open-source Data Inventory for Anthropogenic CO2, available at: http://db.cger.nies.go.jp/dataset/ODIAC/, last access: 6 November 2018.
Oda, T. and Maksyutov, S.: A very high-resolution (1 km×1 km) global fossil fuel CO2 emission inventory derived using a point source database and satellite observations of nighttime lights, Atmos. Chem. Phys., 11, 543–556, https://doi.org/10.5194/acp-11-543-2011, 2011.
Oda, T., Maksyutov, S., and Elvidge, C. D.: Disaggregation of national fossil fuel CO2 emissions using a global power plant database and DMSP nightlight data, Proc. of the 30th Asia-Pacific Advanced Network Meeting, 220–229, 2010.
Oda, T., Maksyutov, S., and Andres, R. J.: The Open-source Data Inventory for Anthropogenic CO2, version 2016 (ODIAC2016): a global monthly fossil fuel CO2 gridded emissions data product for tracer transport simulations and surface flux inversions, Earth Syst. Sci. Data, 10, 87–107, https://doi.org/10.5194/essd-10-87-2018, 2018.
Olivier, J. G. J., Janssens-Maenhout, G., Muntean, M., and Peters, J. A. H. W.: Trends in global CO2 emissions: 2014 report, JRC93171/PBL1490 report, ISBN: 978-994-91506-91587-91501, 2014.
Qi, Y., Stern, N., Wu, T., Lu, J., and Green, F.: China's post-coal growth, Nat. Geosci., 9, 564–566, https://doi.org/10.1038/ngeo2777, 2016.
Qin, D., Ding, Y., and Mu, M. (eds.): Climate and Environmental Change in China: 1951–2012, in: Springer Environmental Science & Engineering, Springer-Verlag, Berlin, Heidelberg, 2016.
Raupach, M. R., Rayner, P. J., and Paget, M.: Regional variations in spatial structure of nightlights, population density and fossil-fuel CO2 emissions, Energ. Pol., 38, 4756–4764, https://doi.org/10.1016/j.enpol.2009.08.021, 2010.
Rayner, P. J., Raupach, M. R., Paget, M., Peylin, P., and Koffi, E.: A new global gridded data set of CO2 emissions from fossil fuel combustion: Methodology and evaluation, J. Geophys. Res.-Atmos., 115, D19306, https://doi.org/10.1029/2009JD013439, 2010.
SCIO, The State Council Information Office of China: Enhanced Actions on Climate Change: China's Intended Nationally Determined Contributions, available at: http://www.scio.gov.cn/xwfbh/xwbfbh/wqfbh/33978/35364/xgzc35370/Document/1514539/1514539.htm (last access: 16 August 2019), 2015.
Shan, Y. and Guan, D.: CEADs datasets, available at: http://www.ceads.net/, last access: 6 November 2018.
Shan, Y., Liu, J., Liu, Z., Xu, X., Shao, S., Wang, P., and Guan, D.: New provincial CO2 emission inventories in China based on apparent energy consumption data and updated emission factors, Appl. Energ., 184, 742–750, 2016.
Shan, Y., Guan, D., Zheng, H., Ou, J., Li, Y., Meng, J., Mi, Z., Liu, Z., and Zhang, Q.: China CO2 emission accounts 1997–2015, Sci. Data, 5, 170201, https://doi.org/10.1038/sdata.2017.201, 2018.
Tao, S., Ru, M. Y., Du, W., Zhu, X., Zhong, Q. R., Li, B. G., Shen, G. F., Pan, X. L., Meng, W. J., Chen, Y. L., Shen, H. Z., Lin, N., Su, S., Zhuo, S. J., Huang, T. B., Xu, Y., Yun, X., Liu, J. F., Wang, X. L., Liu, W. X., Cheng, H. F., and Zhu, D. Q.: Quantifying the rural residential energy transition in China from 1992 to 2012 through a representative national survey, Nat. Energ., 3, 567–573, https://doi.org/10.1038/s41560-018-0158-4, 2018.
Teng, F., and Zhu, S.: Which estimation is more accurate? A technical comments on Nature Paper by Liu et al on overestimation of China's emission, Sci. Technol. Rev., 33, 112–116, 2015.
Ummel, K.: Carma Revisited: An Updated Database of Carbon Dioxide Emissions from Power Plants Worldwide, Working Papers, 2012.
Wang, J., Cai, B., Zhang, L., Cao, D., Liu, L., Zhou, Y., Zhang, Z., and Xue, W.: High resolution carbon dioxide emission gridded data for China derived from point sources, Environ. Sci. Technol., 48, 7085–7093, 2014.
Wang, M. and Cai, B.: A two-level comparison of CO2 emission data in China: Evidence from three gridded data sources, J. Clean. Prod., 148, 194–201, https://doi.org/10.1016/j.jclepro.2017.02.003, 2017.
Wang, R. and Tao, S.: PKU-CO2: High-resolution mapping of combustion processes and implications for CO2 emissions, available at: http://inventory.pku.edu.cn/download/download.html, last access: 6 November 2018.
Wang, R., Tao, S., Ciais, P., Shen, H. Z., Huang, Y., Chen, H., Shen, G. F., Wang, B., Li, W., Zhang, Y. Y., Lu, Y., Zhu, D., Chen, Y. C., Liu, X. P., Wang, W. T., Wang, X. L., Liu, W. X., Li, B. G., and Piao, S. L.: High-resolution mapping of combustion processes and implications for CO2 emissions, Atmos. Chem. Phys., 13, 5189–5203, https://doi.org/10.5194/acp-13-5189-2013, 2013.
Wheeler, D., and Ummel, K.: Calculating CARMA: Global Estimation of CO2 Emissions from the Power Sector, Working Papers, 2008.
Yao, B., Cai, B., Kou, F., Yang, Y., Chen, X., Wong, D. S., Liu, L., Fang, S., Liu, H., Wang, H., Zhang, L., Li, J., and Kuang, G.: Estimating direct CO2 and CO emission factors for industrial rare earth metal electrolysis, Resour. Conserv. Recycl., 145, 261–267, https://doi.org/10.1016/j.resconrec.2019.02.019, 2019.
Zeng, N., Ding, Y., Pan, J., Wang, H., and Gregg, J.: Climate Change–the Chinese Challenge, Science, 319, 730–731, https://doi.org/10.1126/science.1153368, 2008.
Zhang, Q., Streets, D. G., He, K., and Klimont, Z.: Major components of China's anthropogenic primary particulate emissions, Environ. Res. Lett., 2, 045027, https://doi.org/10.1088/1748-9326/2/4/045027, 2007.
Zheng, B., Zhang, Q., Tong, D., Chen, C., Hong, C., Li, M., Geng, G., Lei, Y., Huo, H., and He, K.: Resolution dependence of uncertainties in gridded emission inventories: a case study in Hebei, China, Atmos. Chem. Phys., 17, 921–933, https://doi.org/10.5194/acp-17-921-2017, 2017.
Zheng, B., Tong, D., Li, M., Liu, F., Hong, C., Geng, G., Li, H., Li, X., Peng, L., Qi, J., Yan, L., Zhang, Y., Zhao, H., Zheng, Y., He, K., and Zhang, Q.: Trends in China's anthropogenic emissions since 2010 as the consequence of clean air actions, Atmos. Chem. Phys., 18, 14095–14111, https://doi.org/10.5194/acp-18-14095-2018, 2018a.
Zheng, B., Zhang, Q., Davis, S. J., Ciais, P., Hong, C., Li, M., Liu, F., Tong, D., Li, H., and He, K.: Infrastructure Shapes Differences in the Carbon Intensities of Chinese Cities, Environ. Sci. Technol., 52, 6032–6041, https://doi.org/10.1021/acs.est.7b05654, 2018b.