the Creative Commons Attribution 4.0 License.
the Creative Commons Attribution 4.0 License.
 | 10 Sep 2020
Vertical profiles of light absorption and scattering associated with black carbon particle fractions in the springtime Arctic above 79° N
W. Richard Leaitch
John K. Kodros
Megan D. Willis
Sarah Hanna
Hannes Schulz
Elisabeth Andrews
Heiko Bozem
Julia Burkart
Peter Hoor
Felicia Kolonjari
John A. Ogren
Sangeeta Sharma
Knut von Salzen
Allan K. Bertram
Andreas Herber
Jonathan P. D. Abbatt
Jeffrey R. Pierce
Despite the potential importance of black carbon (BC) for radiative forcing of the Arctic atmosphere, vertically resolved measurements of the particle light scattering coefficient (σsp) and light absorption coefficient (σap) in the springtime Arctic atmosphere are infrequent, especially measurements at latitudes at or above 80∘ N. Here, relationships among vertically distributed aerosol optical properties (σap, σsp and single scattering albedo or SSA), particle microphysics and particle chemistry are examined for a region of the Canadian archipelago between 79.9 and 83.4∘ N from near the surface to 500 hPa. Airborne data collected during April 2015 are combined with ground-based observations from the observatory at Alert, Nunavut and simulations from the Goddard Earth Observing System (GEOS) model, GEOS-Chem, coupled with the TwO-Moment Aerosol Sectional (TOMAS) model (collectively GEOS-Chem–TOMAS; Kodros et al., 2018) to further our knowledge of the effects of BC on light absorption in the Arctic troposphere. The results are constrained for σsp less than 15 Mm−1, which represent 98 % of the observed σsp, because the single scattering albedo (SSA) has a tendency to be lower at lower σsp, resulting in a larger relative contribution to Arctic warming. At 18.4 m2 g−1, the average BC mass absorption coefficient (MAC) from the combined airborne and Alert observations is substantially higher than the two averaged modelled MAC values (13.6 and 9.1 m2 g−1) for two different internal mixing assumptions, the latter of which is based on previous observations. The higher observed MAC value may be explained by an underestimation of BC, the presence of small amounts of dust and/or possible differences in BC microphysics and morphologies between the observations and model. In comparing the observations and simulations, we present σap and SSA, as measured, and σap∕2 and the corresponding SSA to encompass the lower modelled MAC that is more consistent with accepted MAC values. Median values of the measured σap, rBC and the organic component of particles all increase by a factor of 1.8±0.1, going from near-surface to 750 hPa, and values higher than the surface persist to 600 hPa. Modelled BC, organics and σap agree with the near-surface measurements but do not reproduce the higher values observed between 900 and 600 hPa. The differences between modelled and observed optical properties follow the same trend as the differences between the modelled and observed concentrations of the carbonaceous components (black and organic). Model-observation discrepancies may be mostly due to the modelled ejection of biomass burning particles only into the boundary layer at the sources. For the assumption of the observed MAC value, the SSA range between 0.88 and 0.94, which is significantly lower than other recent estimates for the Arctic, in part reflecting the constraint of σsp<15 Mm−1. The large uncertainties in measuring optical properties and BC, and the large differences between measured and modelled values here and in the literature, argue for improved measurements of BC and light absorption by BC and more vertical profiles of aerosol chemistry, microphysics and other optical properties in the Arctic.
- Article
(6778 KB) - Full-text XML
- BibTeX
- EndNote


Aerosol particles responsible for Arctic haze (Mitchell, 1956) originate from midlatitude pollution sources during winter and spring (e.g. Holmgren et al., 1974; Rahn et al., 1977; Rahn, 1981; Shaw, 1983; Barrie and Hoff, 1985; Radke et al., 1984; Schnell and Raatz, 1984; Barrie, 1986). During late spring and summer, the Arctic is cleansed of haze particles by increased levels of precipitation (e.g. Garrett et al., 2011), resulting in a much cleaner, sometimes pristine, troposphere. At lower altitudes, Europe and northern Asia are thought to be the dominant source regions of Arctic haze, with contributions from south and/or central Asian sources dominating at higher altitudes (e.g. Stohl, 2006; Fisher et al., 2011; Sharma et al., 2013; Qi et al., 2017; Xu et al., 2017). Although surface-based concentrations of Arctic haze components have declined since studies of Arctic haze first began (Heidam et al., 1999; Sirois and Barrie, 1999; Sharma et al., 2004; 2006; Quinn et al., 2009; Hirdman et al., 2010; Sinha et al., 2017), it is unclear how total atmospheric burdens have changed (e.g. Sharma et al., 2013), and horizontal inhomogeneities with scales of 50–100 km (Hansen and Rosen, 1985) complicate this issue.
Radiative forcing by Arctic haze particles may be an important regional driver of Arctic climate change (e.g. Law and Stohl, 2007; Quinn et al., 2008). Characterised by a unimodal number distribution centred between 200 and 300 nm diameter (e.g. Bigg, 1980; Heintzenberg, 1980; Radke et al., 1984; Leaitch et al., 1989; Staebler, 1994), the effectiveness of Arctic haze particles at scattering light (e.g. Delene and Ogren, 2002; Schmeisser et al., 2017) is one reason why the net effect of the Arctic aerosol has been estimated to cool the Arctic atmosphere (Najafi et al., 2015; Navarro et al., 2016). Black carbon (BC) is the primary anthropogenic light-absorbing component of Arctic haze (e.g. Leighton, 1983; Valero et al., 1984; Hansen and Rosen, 1984; Blanchet and List, 1987; Valero et al., 1989; Pueschel and Kinne, 1995; Hansen and Nazarenko, 2004; Flanner et al., 2007; McConnell et al., 2007; Law and Stohl, 2007; Quinn et al., 2008; Schindell and Faluvegi, 2009; Brock et al., 2011). Mitigation of BC emissions has been proposed as a provisional means of slowing Arctic warming (Shindell and Faluvegi, 2008; Kopp and Mauzerall, 2010; Stohl et al., 2015; Sand et al., 2016), but considerable uncertainty surrounds radiative forcing by BC in the Arctic. Despite profiles of black carbon and optical properties in recent years (e.g. Brock et al., 2011; McNaughton et al., 2011; Schwarz et al., 2010; Spackman et al., 2010; Wofsy et al., 2011; Ferrero et al., 2016; Markowicz et al., 2017), there remains a shortage of such observational data that limit evaluation of models of Arctic BC and light absorption (e.g. Samset et al., 2013) because the Arctic is subject to transport from many pollution sources at southern latitudes during winter and spring, and variability exists in altitude, both in location and from year to year.
Here, we use a combination of airborne and ground-based observations plus modelling to examine particle light scattering coefficients (σsp), light absorption coefficients (σap) and single scatter albedos (SSAs) at the green wavelength of 550 nm, from near the surface to 500 hPa, over a region of the Arctic Ocean between 79.9 and 83.4∘ N. Recent Arctic studies, ground-based and airborne, indicate SSA values ranging from 0.92 to 0.97 during the month of April for a wavelength of 550 nm (Delene and Ogren, 2002; Brock et al., 2011; McNaughton et al., 2011; Schmeisser et al., 2017), which means that roughly 5 % of the light incident on a population of Arctic haze particles is absorbed. The present work, part of the Canadian Network on Climate and Aerosols: Addressing Key Uncertainties in Remote Canadian Environments (NETCARE), contributes knowledge concerning Arctic optical properties and warming of the Arctic lower troposphere by BC during April at higher latitudes.
Airborne measurements of σap that are based on the transmission of light through a filter, as used here, are constrained by instabilities during changes in pressure (i.e. altitude) and generally higher detection limits (DLs) associated with flight conditions. To reduce the skewness of observations imposed by these constraints, we expand our data set of σap values by employing a linear relationship between measured σap and the refractory black carbon mass concentrations (rBC) of Schulz et al. (2018). This approach enables a more comprehensive representation of values below DLs. In the airborne component of this data set, over 98 % of 1 min averages of σsp exceeding detection limit (0.9 Mm−1) are below 15 Mm−1. By constraining the discussion to values of σsp less than 15 Mm−1, we address the largest component of Arctic haze, exclusive of the direct influence from strong plumes. Since most Arctic pollution in April is from long-range transport, the lower σsp suggests that these particles, on average, spent longer times in the Arctic atmosphere and thus are more indicative of the “chronic” Arctic haze discussed by Brock et al. (2011). Furthermore, the SSAs for particle populations that fall within this constraint have been found to decrease more sharply with decreasing σsp (e.g. Targino et al., 2005; Andrews et al., 2011), making these populations more efficient at warming the atmosphere. Our primary objective is to demonstrate the large uncertainty in our knowledge of the absorption by BC at lower σsp in an area of the high Arctic with a low frequency of observations. Details of the methods employed are described in Sect. 2. In Sect. 3, results are presented, and vertical profiles of σap and SSAs are compared with simulated values. Section 4 is a broader discussion of the results, and conclusions are given in Sect. 5.
2.1 Observations overview
A total of 10 research flights were conducted in the Arctic using the Alfred Wegener Institute (AWI) Polar 6 aircraft, beginning on 5 April 2015 and ending on 21 April 2015. The first and only flight from Longyearbyen, Svalbard, Norway, is not discussed here as it was used to correct some instrument and sampling issues. Subsequently, four flights were conducted from Alert, Nunavut, Canada, during 7–9 April (two flights on 8 April), two flights from Eureka, Nunavut, Canada (11 and 13 April), and three flights from Inuvik, Northwest Territories (NWT), Canada, on 20–21 April (two flights on 20 April). Tracks of the flights out of Alert and Eureka can be found in Kodros et al. (2018), Schulz et al. (2018) and Willis et al. (2018). The flights out of Inuvik were conducted within a 300 km radius of Inuvik (68.4∘ N, 133.7∘ W). Sampling of submicron particles from the Polar 6 during NETCARE is discussed by Leaitch et al. (2016), Schulz et al. (2018) and Willis et al. (2018). All airborne and model data presented here are referenced to a temperature of 20 ∘C and pressure of 1013.25 hPa. The Polar 6 data are restricted to between 2 min after takeoff and 2 min prior to landing to avoid local contamination.
Ground-based observations of σsp, σap, refractory BC (rBC) and particle microphysics are routinely conducted at the Dr. Neil Trivett Global Atmosphere Watch Observatory at Alert, Nunavut (82.5∘ N, 62.5∘ W). The site is approximately 7 km southeast of the main Alert station that is operated by the Canadian Department of National Defense. The impact of the camp on observations at the Alert observatory (hereafter, referred to as Alert) has been found to be insignificant for particles larger than about 50 nm diameter (Leaitch et al., 2018), and the observations are filtered for air arriving from within a 45∘ arc centred on the station. The Alert optical properties data reported here are for particles less than 1 µm diameter.
2.2 Aerosol optical measurements
Particle light scattering coefficients (σsp) at wavelengths of 450, 550 and 700 nm were measured with a TSI Incorporated model 3563 three-wavelength volume-integrating nephelometer on the Polar 6 and at Alert. To account for the absence of a forward-scattering measurement where the collimated light beam is dumped (i.e. truncation of the total scattering between 0–7 and 170–180∘), the correction described by Anderson and Ogren (1998) was applied. A span check of the nephelometer calibration is routinely performed at Alert using CO2, and span checks of the nephelometer used on the Polar 6 were conducted before and after the study.
Values of σap at Alert are derived from a three-wavelength particle soot absorption photometer (PSAP), as discussed by Sharma et al. (2017). The σap on the Polar 6 were measured using a continuous light absorption photometer (CLAP), a three-wavelength filter-based instrument operating at 467, 528 and 652 nm. Based on the PSAP design, the CLAP, designed and built by the National Oceanic and Atmospheric Administration (NOAA), samples consecutively on one of eight spots on one 47 mm glass fibre filter (Pallflex E70-2075W), which improves functionality in situations where filter changes are more difficult, such as remote sites and aircraft (Ogren et al., 2017). For both the PSAP and CLAP, the σap are derived from the change in light transmission through a spot on the filter, accumulating particles relative to light transmission through a reference spot. Both the PSAP and CLAP data were corrected for multiple scattering arising from the filter medium and accumulating particles using an empirical algorithm described by Bond et al. (1999) and Ogren (2010). To avoid artifacts associated with filter disturbances due to rapid pressure fluctuations, the Polar 6 absorption data are limited to in-flight pressure variations, as recorded within the nephelometer, of less than 2 hPa over a 2 min period, encompassing each 1 min sample. Recently, Düsing et al. (2019) found that changes in water uptake by filter material used in particle absorption measurements can influence the light absorption measurement. In the present case, because the ambient temperatures were −20 ∘C or colder and the temperatures at the intake of the nephelometer, which was situated next to the CLAP, ranged from +14 to +30 ∘C, we expect little influence from relative humidity on our results. As discussed in Sect. 3.2, in some circumstances these corrections may fail to correct overestimates of σap due to multiple scattering (Cappa et al., 2008a, b; Lack et al., 2008; Sinha et al., 2017).
The estimated detection limits (DLs) for σap and σsp on the Polar 6 are 0.75 and 0.9 Mm−1, respectively, at 550 nm wavelength and for 1 min averages. The DLs are calculated from the maximum of 2 times the standard deviation of the raw measurement during in-flight zeroes, which are also constrained to pressure variations of 2 hPa or less. The σsp DL was adjusted for the truncation correction, and the σap DL was adjusted for multiple scattering. Of approximately 2000 1 min averaged data points collected over nine flights, 220 absorption data points remain, mostly after scrutiny for pressure variations, followed by the removal of remaining points below DLs. Uncertainties in the Polar 6 σap are considered in Sect. 3.3.
The DLs for σap and σsp measured at Alert are 0.1 Mm−1 and 0.4 Mm−1, respectively, and represent DLs for the 1 h averages of Alert data used here. Based on Sherman et al. (2015) and Ogren et al. (2017), uncertainties in σap at 1 Mm−1 and σsp at 10 Mm−1 are 60 % and 24 %, respectively. After discriminating for local influences and removal of compromised data (e.g. zeroes), the Alert data set comprises 1505 1 h averages, or approximately 70 % of the February–April 2015 time period. The months of February and March are included to broaden the comparison with the model results.
The σap from the Polar 6 and from Alert were adjusted to the nephelometer wavelengths assuming a 1∕λ relationship, and the σap, σsp and SSAs for both platforms are reported for wavelengths of 450 nm (blue), 550 nm (green) and 700 nm (red). The SSAs, given by , were calculated for the green values of σsp and σap.
2.3 rBC and physical measurements
Size distributions for particles with diameters in the range of 85–1000 nm were measured on the Polar 6 using an ultrahigh sensitivity aerosol spectrometer (UHSAS; Droplet Measurement Technologies); hereafter, all particle sizes are given as diameters. The UHSAS is a laser-based aerosol spectrometer. Checks of concentration and sizing were done with nearly monodisperse particles of ammonium sulfate. Details of the measurements used here are discussed by Schulz et al. (2018). The size distributions from the UHSAS are used to estimate submicron particle volume concentrations. Submicron particle volume concentrations at Alert are estimated from size distribution measurements with a TSI Incorporated 3034 scanning mobility particle sizer (SMPS) spectrometer, previously discussed by Leaitch et al. (2013, 2018). As discussed by Willis et al. (2018), size distributions from the UHSAS were compared with those from the TSI Incorporated 3034 SMPS at the Alert from four flights when the Polar 6 flew between 60 and 200 m above the ocean (sea ice) surface a few kilometres north of Alert. The volume concentrations calculated from the two measurements for the 85–500 nm size range compared within 20 % for all flights.
Refractory black carbon (rBC) was measured on the Polar 6 using a Droplet Measurement Technologies single particle soot photometer (SP2). The SP2 detects individual particles using an intra-cavity Nd:YAG laser operating at 1064 nm. Incandescence from components of particles absorbing at 1064 nm (i.e. BC) is detected by a pair of photomultiplier tubes, and the peak amplitude of the thermal radiation is proportional to the mass of refractory material (Moteki and Kondo, 2007; Slowik et al., 2007). The detection range of the SP2 used here is 0.60 to 330 fg rBC or approximately 85–700 nm mass equivalent diameter for an rBC density of 1.8 g cm−3 (Bond and Bergstrom, 2006; Bond et al., 2013). Mass calibrations are based on Fullerene soot particles that were size selected using a differential mobility analyzer. The mobility diameters were converted to rBC mass concentrations following Gysel et al. (2011). Schulz et al. (2018) describe the data set used here, and they estimate the uncertainty at ±15 %. The rBC measurements conducted at Alert, also made using a SP2, are discussed by Sharma et al. (2017).
Non-refractory aerosol mass concentrations were measured aboard Polar 6 with an Aerodyne high-resolution time-of-flight aerosol mass spectrometer (ToF-AMS; DeCarlo et al., 2006). These measurements are described in detail by Willis et al. (2019). Briefly, the ToF-AMS measured non-refractory aerosol between about 70 and 700 nm in vacuum aerodynamic diameter. Detection limits for sulfate and total organic aerosol, based on 10 s time resolution, were 0.01 and 0.08 µg m−3, respectively.
Coarse particles (>2 µm diameter) on the Polar 6 were measured with a GRIMM model 1.129 optical particle counter. Model 1.129 measures particles larger than 0.25 µm, but only the coarse particle concentrations are used here. As shown by comparisons with a particle-measuring system model FSSP-300 probe operated under one wing of the Polar 6, the coarse particles tend to be sampled less effectively than the submicron particles, but they are still an indicator of the presence of coarse particles, and, more importantly, the coarse particles entering the Polar 6 sample manifold.
2.4 Modelling
The observations of σsp, σap and SSAs are compared to version 10.01 of the GEOS-Chem chemical-transport model (http://geos-chem.org, last access: 1 September 2020), driven by Modern-Era Retrospective analysis for Research and Applications (MERRA) reanalysis meteorology fields. The February–April 2015 simulation was preceded by a 2 month spin up. This version of GEOS-Chem uses a horizontal resolution of 4∘ latitude by 5∘ longitude (approximately 440 km×72 km in the flight region near Alert and Eureka and 440 km×200 km near Inuvik) with 47 vertical layers. Relevant to the observations presented here, 24 vertical layers cover the pressure region from the surface to 500 hPa, 12 of which are from the surface to 850 hPa, spaced equally by 15.5 hPa. Aerosol microphysics is simulated using the TwO-Moment Aerosol Sectional (TOMAS) microphysics scheme (Adams and Seinfeld, 2002) coupled with GEOS-Chem (GEOS-Chem–TOMAS), including tracers for sulfate, BC, organic aerosol, sea salt, dust and aerosol water. More details are found in Adams and Seinfeld (2002), Lee et al. (2013), Lee and Adams (2012), and Kodros et al. (2018). Here, particle water is excluded from the calculations because the observed particles were relatively dry; during the flights, the outside air temperature was −15 ∘C or less, and the measured temperature of air entering the nephelometer, which was situated near the CLAP, ranged at +14 ∘C or higher, indicating very low values of relative humidity at the point of measurement. Also, no significant particle water was indicated in the ToF-AMS data. Aerosol optical properties are calculated using monthly averaged aerosol mass and number concentrations with refractive indices from the Global Aerosol Data Set (GADS; Kopke et al., 1997). To calculate aerosol optical properties, we assume two of the BC mixing states discussed by Kodros et al. (2018): (1) “Allcore”, in which BC is fully mixed with other chemical species in a core–shell morphology within each size section, where BC forms the core of the particle and hydrophilic aerosol species form a concentric shell around the BC core; (2) “Rshell”, in which BC is mixed within a particle, again as a core surrounded by hydrophilic species, but the size-dependent fraction of BC-containing particles' core sizes and hydrophilic coating thicknesses are constrained by the observed sizes and the modelled BC mass concentration, as described by Kodros et al. (2018). These two states are illustrated in Fig. 2 of Kodros et al. (2018), where they are referred to as “rshell constrained” (Fig. 2b) and “allCoreShell” (Fig. 2d). Particle mass, including BC mass, is conserved. The Allcore state is less realistic because every particle contains a BC core, whereas Arctic observations identify BC in roughly 10 %–20 % of the particles (e.g. Sharma et al., 2017). As a result, the Allcore mixing assumption overestimates absorption (e.g. Alvarado et al., 2016). Rshell, which is based on observations, has a smaller fraction of coating material participating in absorption enhancement, resulting in lower absorption compared with Allcore; Rshell absorption is higher than that of the externally mixed assumption (Kodros et al., 2018). The Mie code of Bohren and Huffman (1983) for two concentric spheres is used to calculate σspt, σap and SSAs.
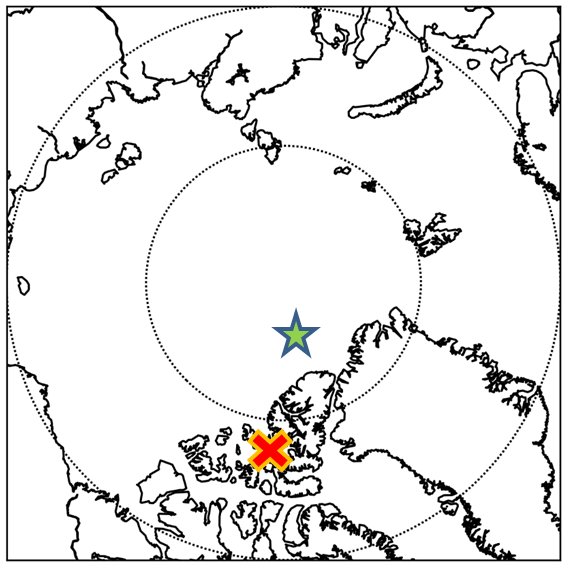
Figure 1Map of the Arctic centred on the North Pole. Stars show centre of model grids used in this study. Green – northwest Alert (NW Alert) grid; orange – Axel grid. Grid sizes are approximately 440 km(N–S)×72 km (E–W).
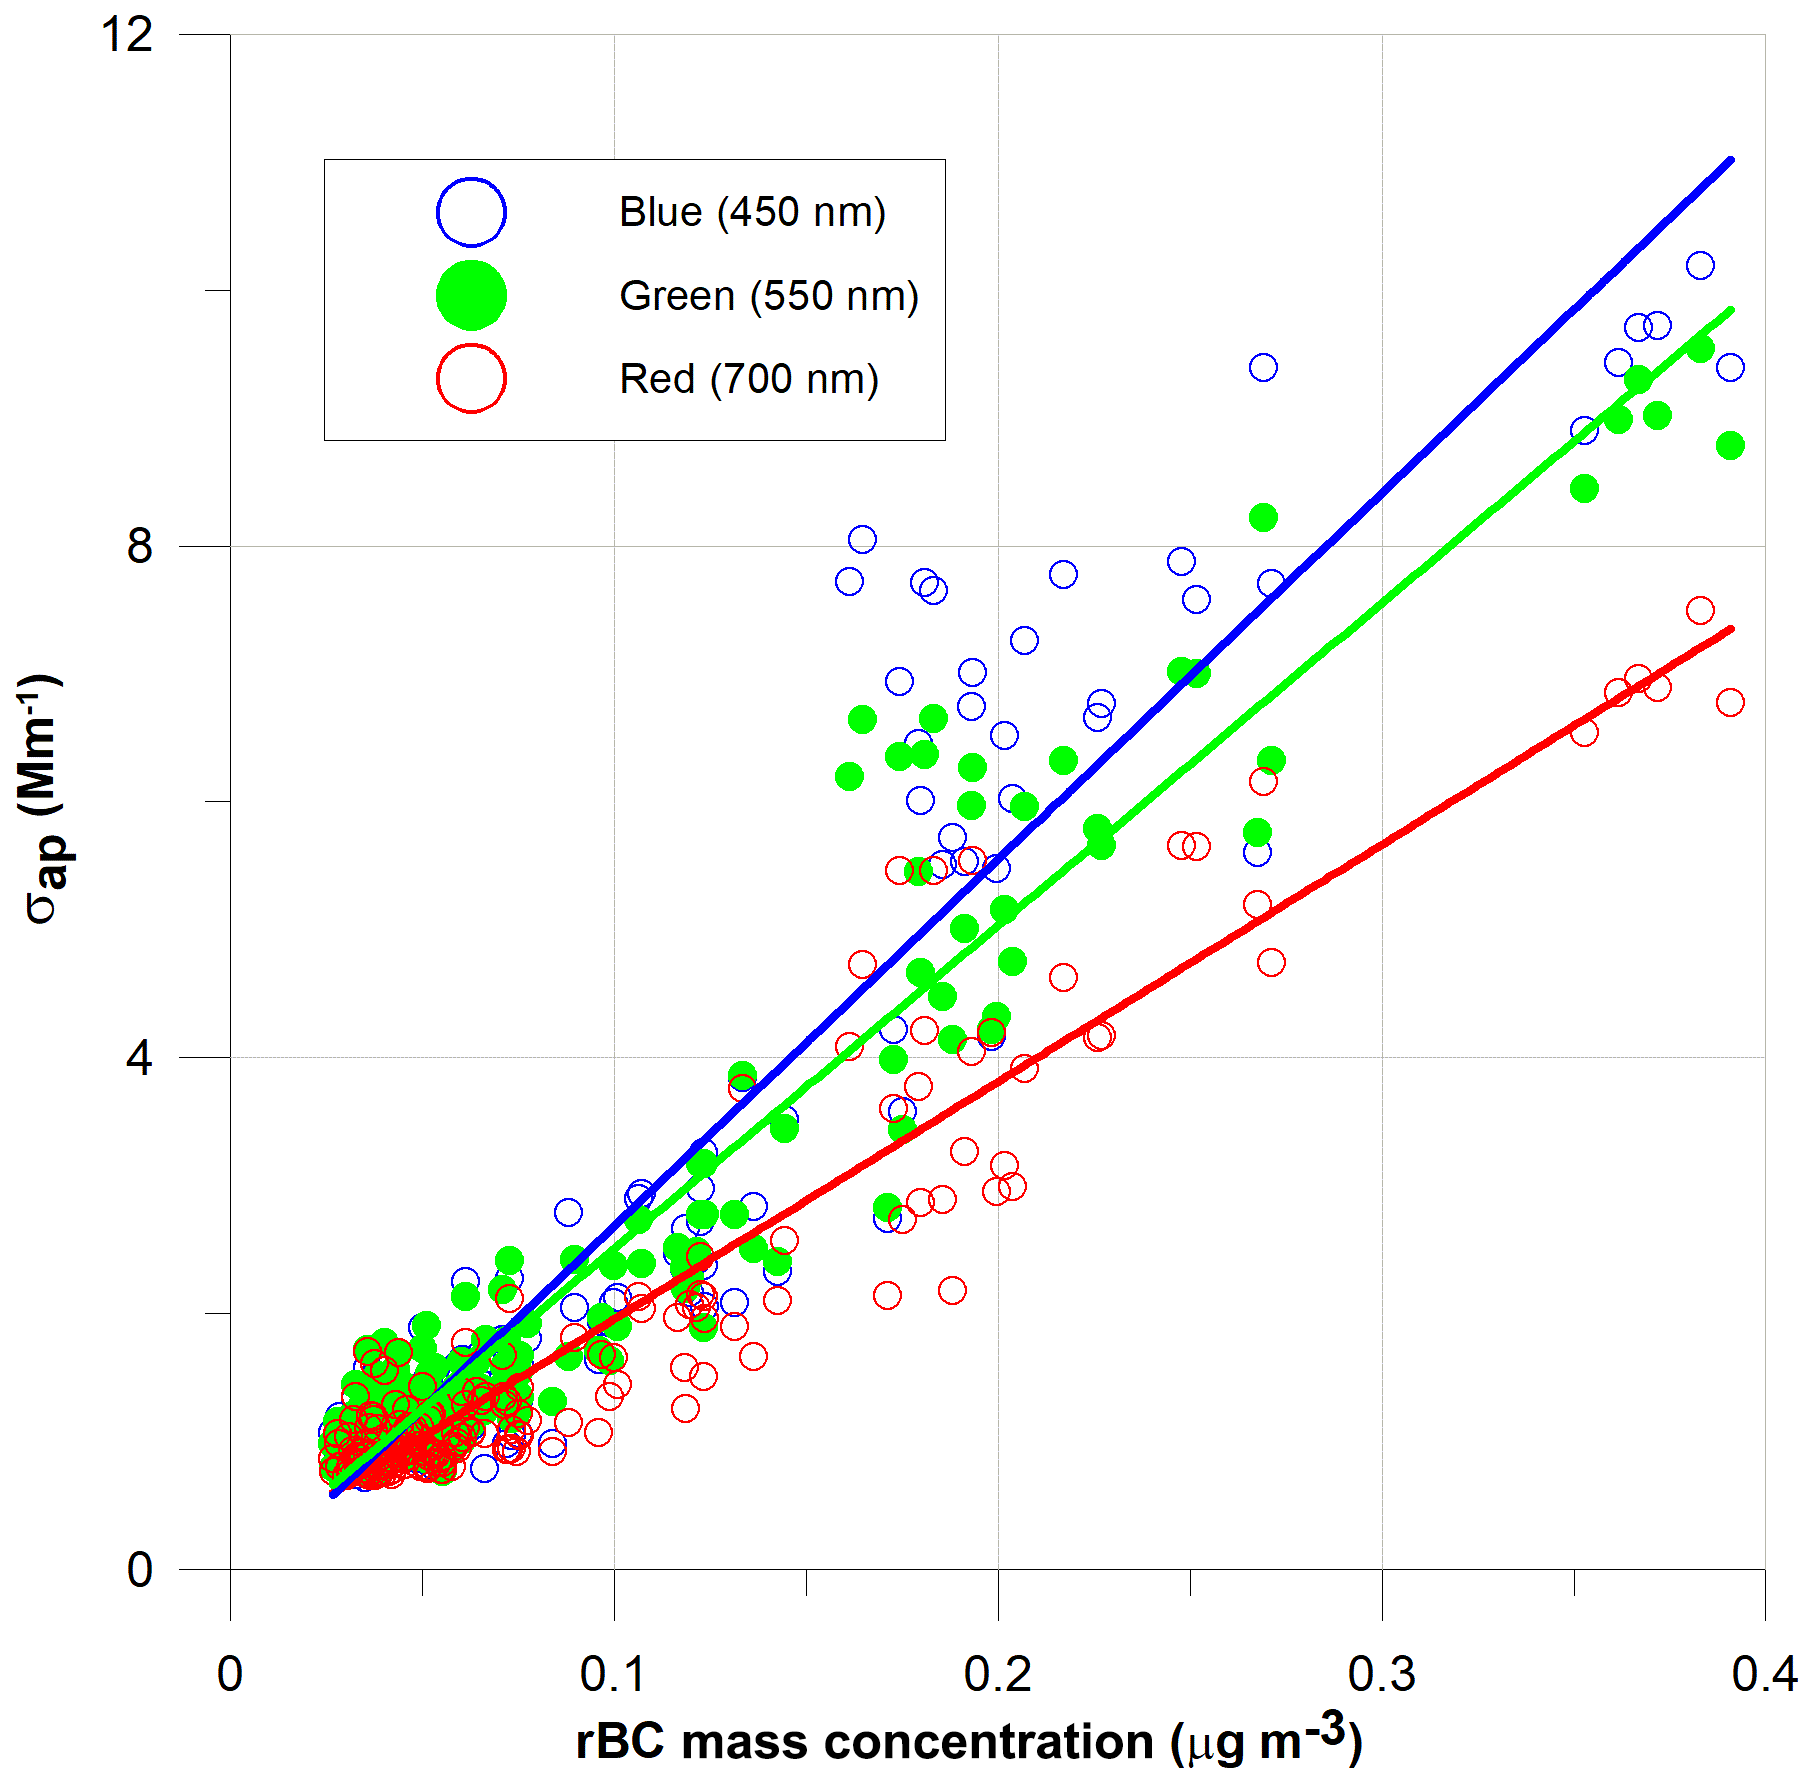
Figure 2Particle light absorption coefficient (σap) at three wavelengths (450, 550 and 700 nm) plotted against the refractory black carbon (rBC) mass concentrations for all above-detection-limit data collected during Polar 6 flights from Alert, Nunavut, Eureka, Nunavut, and Inuvik, Northwest Territories (NWT). Regression lines are shown for reference.
Emissions are derived from the Emissions Database for Global Atmospheric Research (EDGAR) Hemispheric Transport of Air Pollution (HTAP) version 2.2 (Janssens-Maenhout et al., 2015). Following Xu et al. (2017), BC and organic carbon emissions from gas flaring derived from the Evaluating the Climate and Air Quality Impacts of Short-Lived Pollutants (ECLIPSE) emission inventory (Klimont et al., 2017) are included. Biomass burning emissions are from the Fire INventory from NCAR (FINN) for the year 2015 (Wiedinmyer et al., 2011), but the particles are only injected into the boundary layer in this case. Dust emissions follow the Dust Entrainment and Deposition (DEAD) model scheme (Zender et al., 2003), and sea salt aerosol emissions are based on Jaeglé et al. (2011). The model uses a refractive index for BC of 1.9+0.79i, as recommended by Bond and Bergstrom (2006). See Liu et al. (2020) for a review of the refractive index of BC. The refractive index differs from the value of 1.75+0.45i used by Kodros et al. (2018). That aside, details of the application of this version of the model to the Arctic, and a detailed discussion of the role of mixing state on absorption by BC, are given by Kodros et al. (2018).
The data used here are from two vertical columns of the model as follows: one column includes Axel Heiberg Island and the Arctic Ocean west of the island; the second is all Arctic Ocean to the west and slightly north of Alert. Hereafter, the two grids are referred to as “Axel” and “NW Alert”. They are centred on 78∘ N, 95∘ W and 86∘ N, 75∘ W, respectively, as indicated by the stars in Fig. 1. The model grid that includes Alert is not used in order to avoid problems that might be associated with modelling of the significant terrain of Ellesmere Island.
In Sect. 3.1, we identify the strongest influences of dust on the σap observed from the Polar 6. In Sect. 3.2, we consider the mass absorption coefficients (MACs) for BC based on the observations (Alert and Polar 6) and the model, including MACs at low BC mass concentrations. In Sect. 3.3, we present the profile data of rBC, median σap, median SSAs, σsp and sulfate and organic mass concentrations and compare them with like quantities from the GEOS-Chem–TOMAS model. The regression between σap and rBC is used to increase the number of σap and SSA values from which the medians are derived, enabling the influence of values below DLs and during pressure changes to be better represented.
3.1 Dust absorption
Figure 2 shows the blue (450 nm), green (550 nm) and red (700 nm) σap plotted as a function of rBC for the nine Polar 6 flights. A number of points in the rBC range of 0.15–0.3 µg m−3 lie well above their respective linear regression lines. Those points represent measurements from two of the flights conducted out of Inuvik in plumes above 3 km, with trajectories that trace back over northern China and Mongolia. In Fig. 3, the scattering Ångström exponents for green and red wavelengths are plotted against the number concentrations of particles larger than 2 µm. The Inuvik points are identified separately from the Alert and Eureka points, and the coarse particle influence associated with the Inuvik points is evident. The pattern of the lower Ångström exponent points (<0.8) vs. the increasing number concentrations of coarse particles agrees with the results of Hallar et al. (2015) for Asian dust measured at a mountain top in Colorado and with our general knowledge of aerosol optical properties (e.g. Aryal et al., 2014; Clarke et al., 2007; Russell et al., 2010). We assume that the Inuvik points with a scattering Ångström exponent of less than 0.8 and coarse particle number concentrations greater than 0.5 cm−3 are strongly influenced by dust.
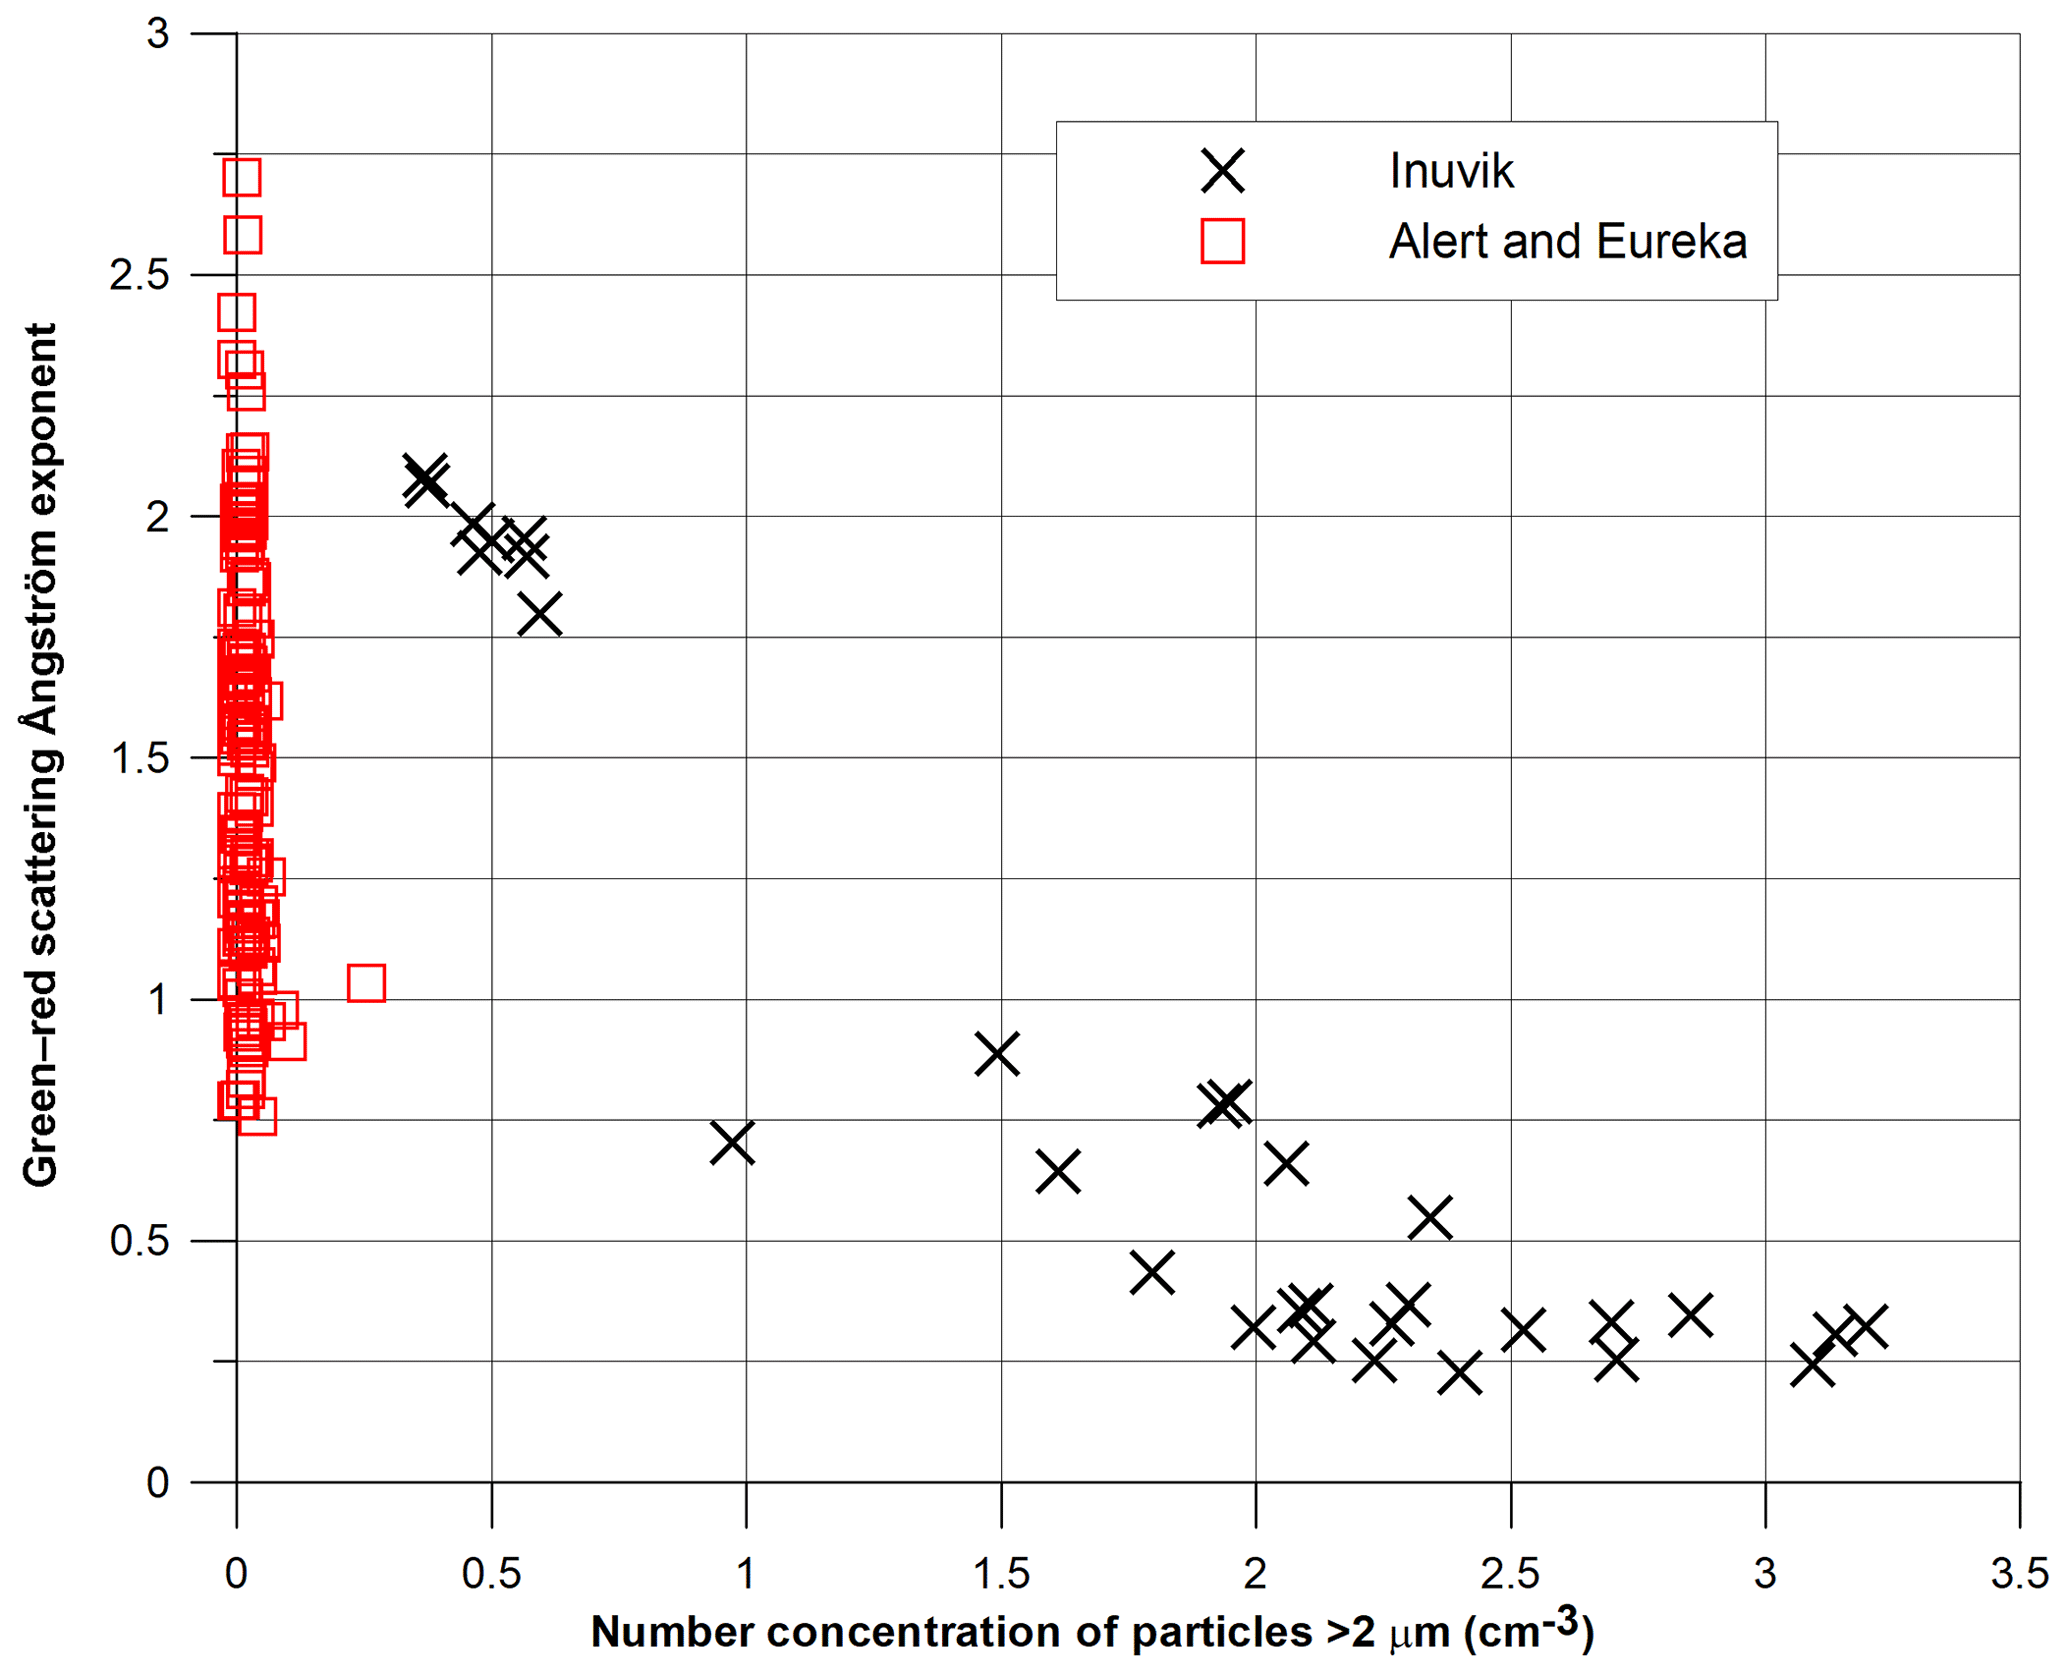
Figure 3Light scattering Ångström exponent between green and red wavelengths plotted against the number concentrations of coarse particles (>2 µm diameter). Data are separated between those collected during flights from Alert and Eureka (red boxes) and from Inuvik (black crosses).
The SSAs from both the Polar 6 and Alert are plotted against σsp at 550 nm, in Fig. 4. The Polar 6 points are from the Polar 6 CLAP and nephelometer measurements, and the dust-influenced points associated with the Inuvik flights are highlighted. The Alert data cover the period from February to 14 April 2015, when the Polar 6 left that region. Alert data from February and March 2015 are included, in part to provide a larger comparison base with the model and in part to demonstrate consistency of the Polar 6 data with those from Alert, since the latter only reaches into the 0.75 < σap < 1.6 Mm−1 region during February. As in previous observations (e.g Targino et al., 2005; Andrews et al., 2011; Schmeisser et al., 2018), lower values of SSAs are more frequent at these smaller σsp. Hereafter, we only consider data that fall into the region of green σsp<15 Mm−1, which represent 98 % of the above DL Polar 6 data collected over Alert and Eureka and 85 % of the above DL Alert data (February to 14 April, inclusive). With these constraints, strong contributions to σap from dust are removed. As next discussed, this improves the linear regression of σap with rBC.

Figure 4Single scattering albedo (SSA) at the green wavelength (550 nm) plotted against the particle light scattering coefficient (σsp) at 550 nm. Data are separated between those collected at the Alert observatory (blue crosses) and those collected from the Polar 6 (P6) aircraft (black dots). In addition, points influenced most strongly by dust are circled in orange. Lines of equal particle light absorption (σap) are for reference.
3.2 Mass absorption
The regression of σap with rBC for the combined Polar 6 and Alert data (1–14 April), constrained as just discussed, has a slope of 18.4 m2 g−1 and intercept of +0.15 (Fig. 5). In Fig. 5, separate regressions through the Alert data and through the Polar 6 data overlap at a confidence level of greater than 95 %. The σap–rBC slope represents the average MAC of rBC in the measured particles, but this value is about twice that typically found for Arctic measurements at the green wavelength (e.g. 9.5 m2 g−1, McNaughton et al., 2011; 8 m2 g−1, Sharma et al., 2017; 9.8 m2 g−1, Zanatta et al., 2018). Modelled σap are plotted against modelled BC for the NW Alert grid and Rshell mixing assumption in Fig. 6. These modelled values include a significant dust presence in many cases. We estimate the model MAC values for BC by constraining the dust concentrations to less than 0.2 µg m−3, as shown by the black points in Fig. 6. For the case in Fig. 6, the MAC value for BC is 9.3 m2 g−1. The modelled MAC value for BC is estimated at 13.1 m2 g−1 for the NW Alert grid and Allcore mixing assumption. For the Axel grid, the estimated MAC value for BC is 8.8 m2 g−1 for the Rshell assumption and 14.0 m2 g−1 for the Allcore assumption. Due to a smaller influence of the coating material on absorption enhancement relative to the Allcore case, the lower Rshell results in a MAC value that is more consistent with those mentioned above.
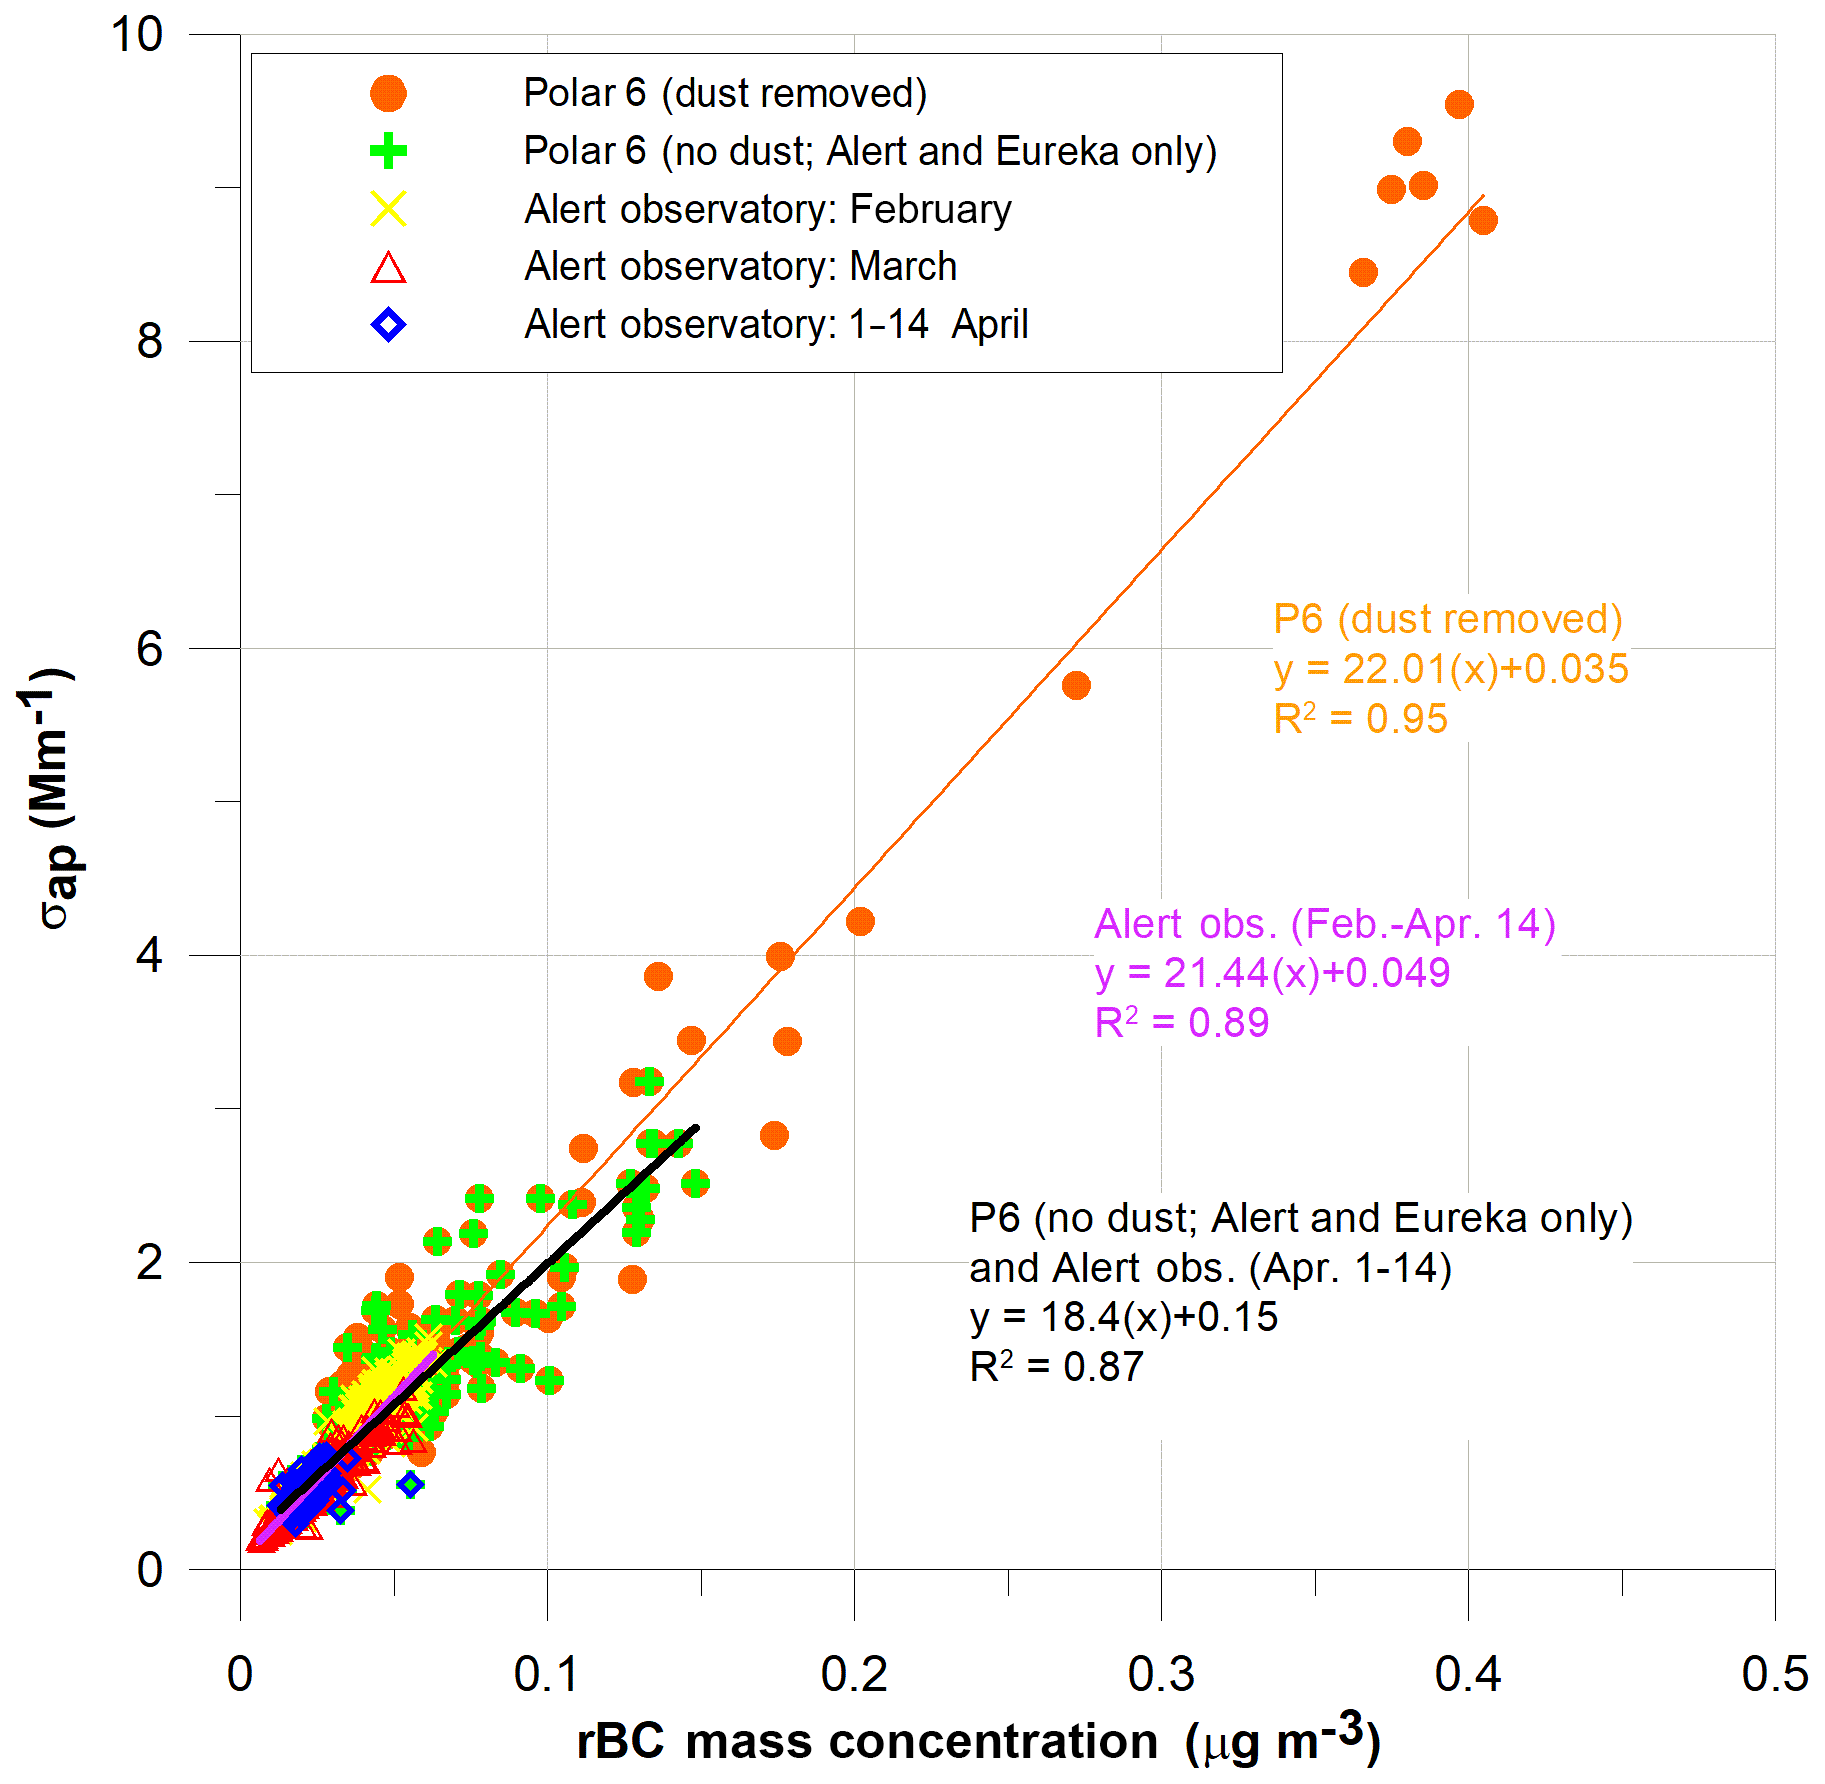
Figure 5Particle light absorption coefficient (σap) at 550 nm plotted against refractory black carbon (rBC) mass concentrations for all above-detection-limit data collected during Polar 6 flights from Alert, Eureka and Inuvik, NWT, with major dust influence removed (orange dots), for data collected during Polar 6 flights from Alert and Eureka only (green crosses) and for data collected at the Alert observatory. The Alert observatory data are separated between those collected during February, March and 1–14 April, where the latter corresponds most closely with the Polar 6 flights out of Alert and Eureka. Regressions are shown for all Polar 6 data (major dust removed; orange curve), for all Alert observatory data (purple curve) and for the Polar 6 data from Alert and Eureka combined with the Alert observatory data for 1–14 April (black curve).
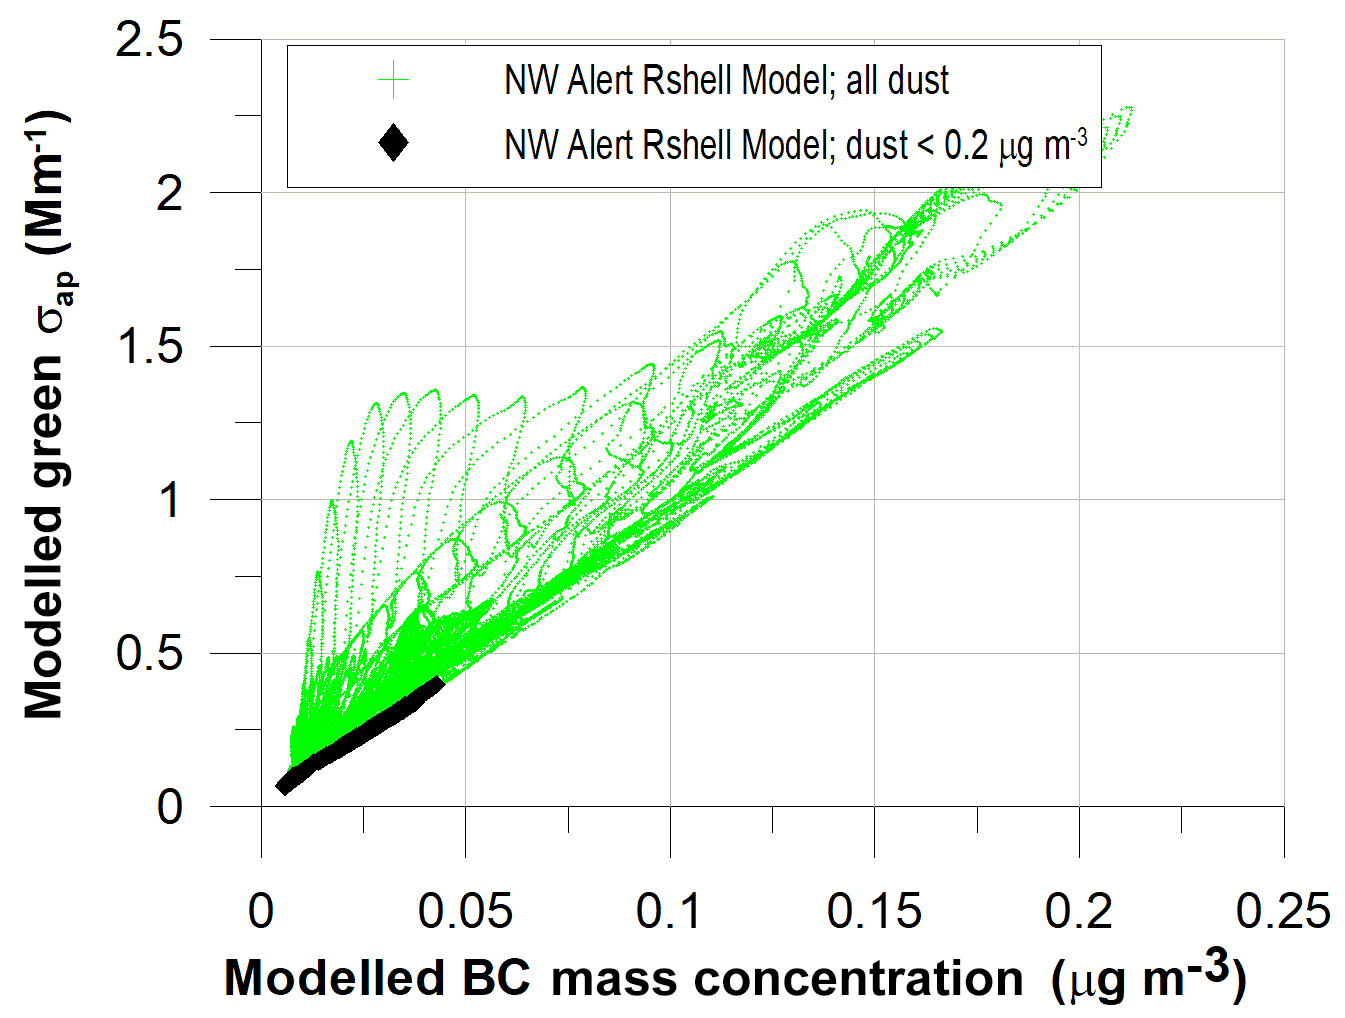
Figure 6Modelled light absorption coefficients (σap) at 550 nm plotted against black carbon (BC) mass concentrations for the NW Alert grid and the Rshell assumption (green). The black diamonds indicate the data limited to those points with dust concentrations less than 0.2 µg m−3.
We acknowledge that the model indicates a significant contribution from dust, and possibly other non-BC components, to atmospheric absorption in the Arctic. Average modelled profiles of the contributions to absorption from BC and non-BC absorbing components of particles, assuming an external mixture, are shown in Fig. 7 for the NW Alert grid box, split between particles less than 700 nm diameter and particles greater than 700 nm diameter. The nonabsorbing components include brown carbon and dust. For particles smaller than 700 nm, the simulations suggest BC is, on average, the stronger absorbing component of the particles, with contributions from non-BC components approaching those from BC below 600 hPA. For particles larger than 700 nm, absorption by non-BC components, primarily dust, dominates in this model. As shown in Fig. 3, there were relatively few coarse particles sampled from the Polar 6 in the regions around Alert and Eureka at any altitude, which represents a discrepancy between the observations and simulations.

Figure 7Modelled profile data of the contributions to absorption from BC (black crosses) and non-BC-absorbing components (orange triangles) for (a) particles less than 700 nm diameter and (b) particles >700 nm diameter. The simulations are for the NW Alert grid box and based on an external mixture.
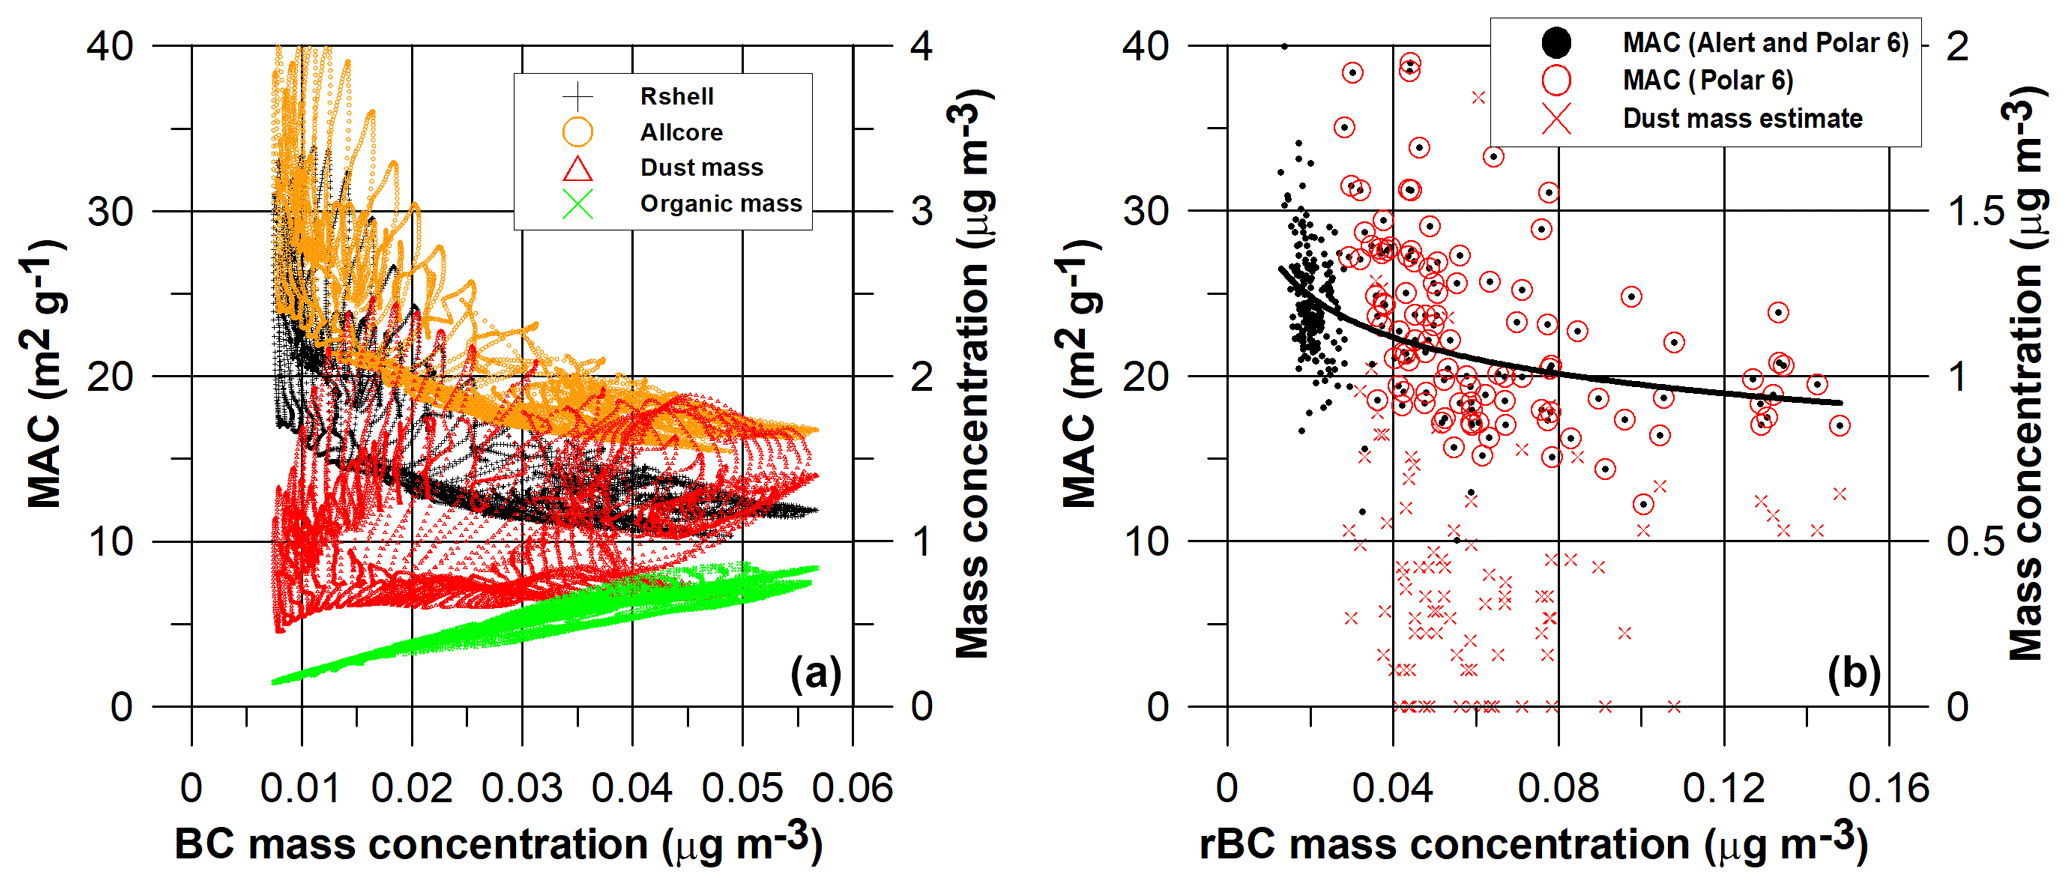
Figure 8(a) Modelled BC mass absorption coefficient (MAC) plotted against modelled BC for the Allcore (orange circles) and the Rshell (black crosses) assumptions; modelled dust mass concentrations constrained to dust less than 1.5 µg m−3 vs. modelled BC mass concentrations (red triangles); and modelled organic aerosol (OA) mass concentrations vs. BC mass concentrations (green crosses). All modelled values are for 1–14 April 2015. (b) MAC values from Polar 6 flights and Alert observatory (1–14 April) plotted against measured refractory black carbon (rBC) mass concentrations (black dots); dust mass concentrations (red crosses) estimated from particle size distributions onboard the Polar 6 plotted against rBC mass concentrations; and MAC values associated with Polar 6 measurements only are identified (red circles). In (b), the black line is a power law fit to the black points. Power law fits were chosen since, based on the linear fit between absorption and rBC (Fig. 5), the expectation is that MAC will vary inversely with the BC mass concentration. The confidence level in the negative slopes is greater than 99 %.
The σap–rBC regressions of the observations and the simulations have positive intercepts (the standard error of the intercept for the Polar 6 plus Alert (1–14 April) fit, based on the measurement error, is 0.034, and statistically, the intercept is greater than 0.1 at a confidence level of >99 %). The intercept is due to increases in individual MAC values with decreasing concentrations of BC, as shown in Fig. 8a for the model and Fig. 8b for the observations. In these plots, MACs should be constant across all BC if absorption is solely due to BC without enhancements from factors such as lensing or other absorbing components. The relative increases in absorption at lower BC will contribute to reduced SSA values at lower σsp. The persistence of lower dust concentrations at low BC concentrations in the modelled MAC values (Fig. 8a) likely contributed to the increase in MACs at lower BC; as the BC concentrations decrease up to 100 times below the dust concentrations, absorption by dust, with its lower imaginary refractive index (0.0065 in the model), may approach absorption by BC and increase the apparent MACs for BC. Because the modelled organic aerosol (OA) concentrations decrease proportionately with decreasing BC (Figs. 10 and 15) and the imaginary refractive index is lower (0.0065), absorbing OA cannot explain the increase in the simulated MACs at lower BC. For the observations (Fig. 8b), smaller amounts of potentially absorbing dust also may be present at lower BC concentrations. The mass concentrations of coarse particles, estimated from the Polar 6 size distributions, assuming a density of 2 g cm−3, are present across all rBC concentrations. We cannot distinguish whether the composition of these coarse particles is dust or sea salt, but, in accordance with the model, the observations suggest that dust may be a factor in the increasing MAC value at lower BC concentrations. Of course, factors that might enhance absorption by BC cannot be ruled out; for example, a relative increase in the coating thickness surrounding smaller BC cores at lower BC mass concentrations might contribute to an increased enhancement factor (Fig. 9). We add that the absolute absorption values at lower BC are small, and there is substantial uncertainty associated with the large amount of absorption data from the Polar 6 that lie below the detection limit. Despite the significance of the intercept for the Polar 6 plus Alert (1–14 April) data (Fig. 5), it is an extrapolation based on the assumption that the absorption data below detection limits follow the same linear fit.
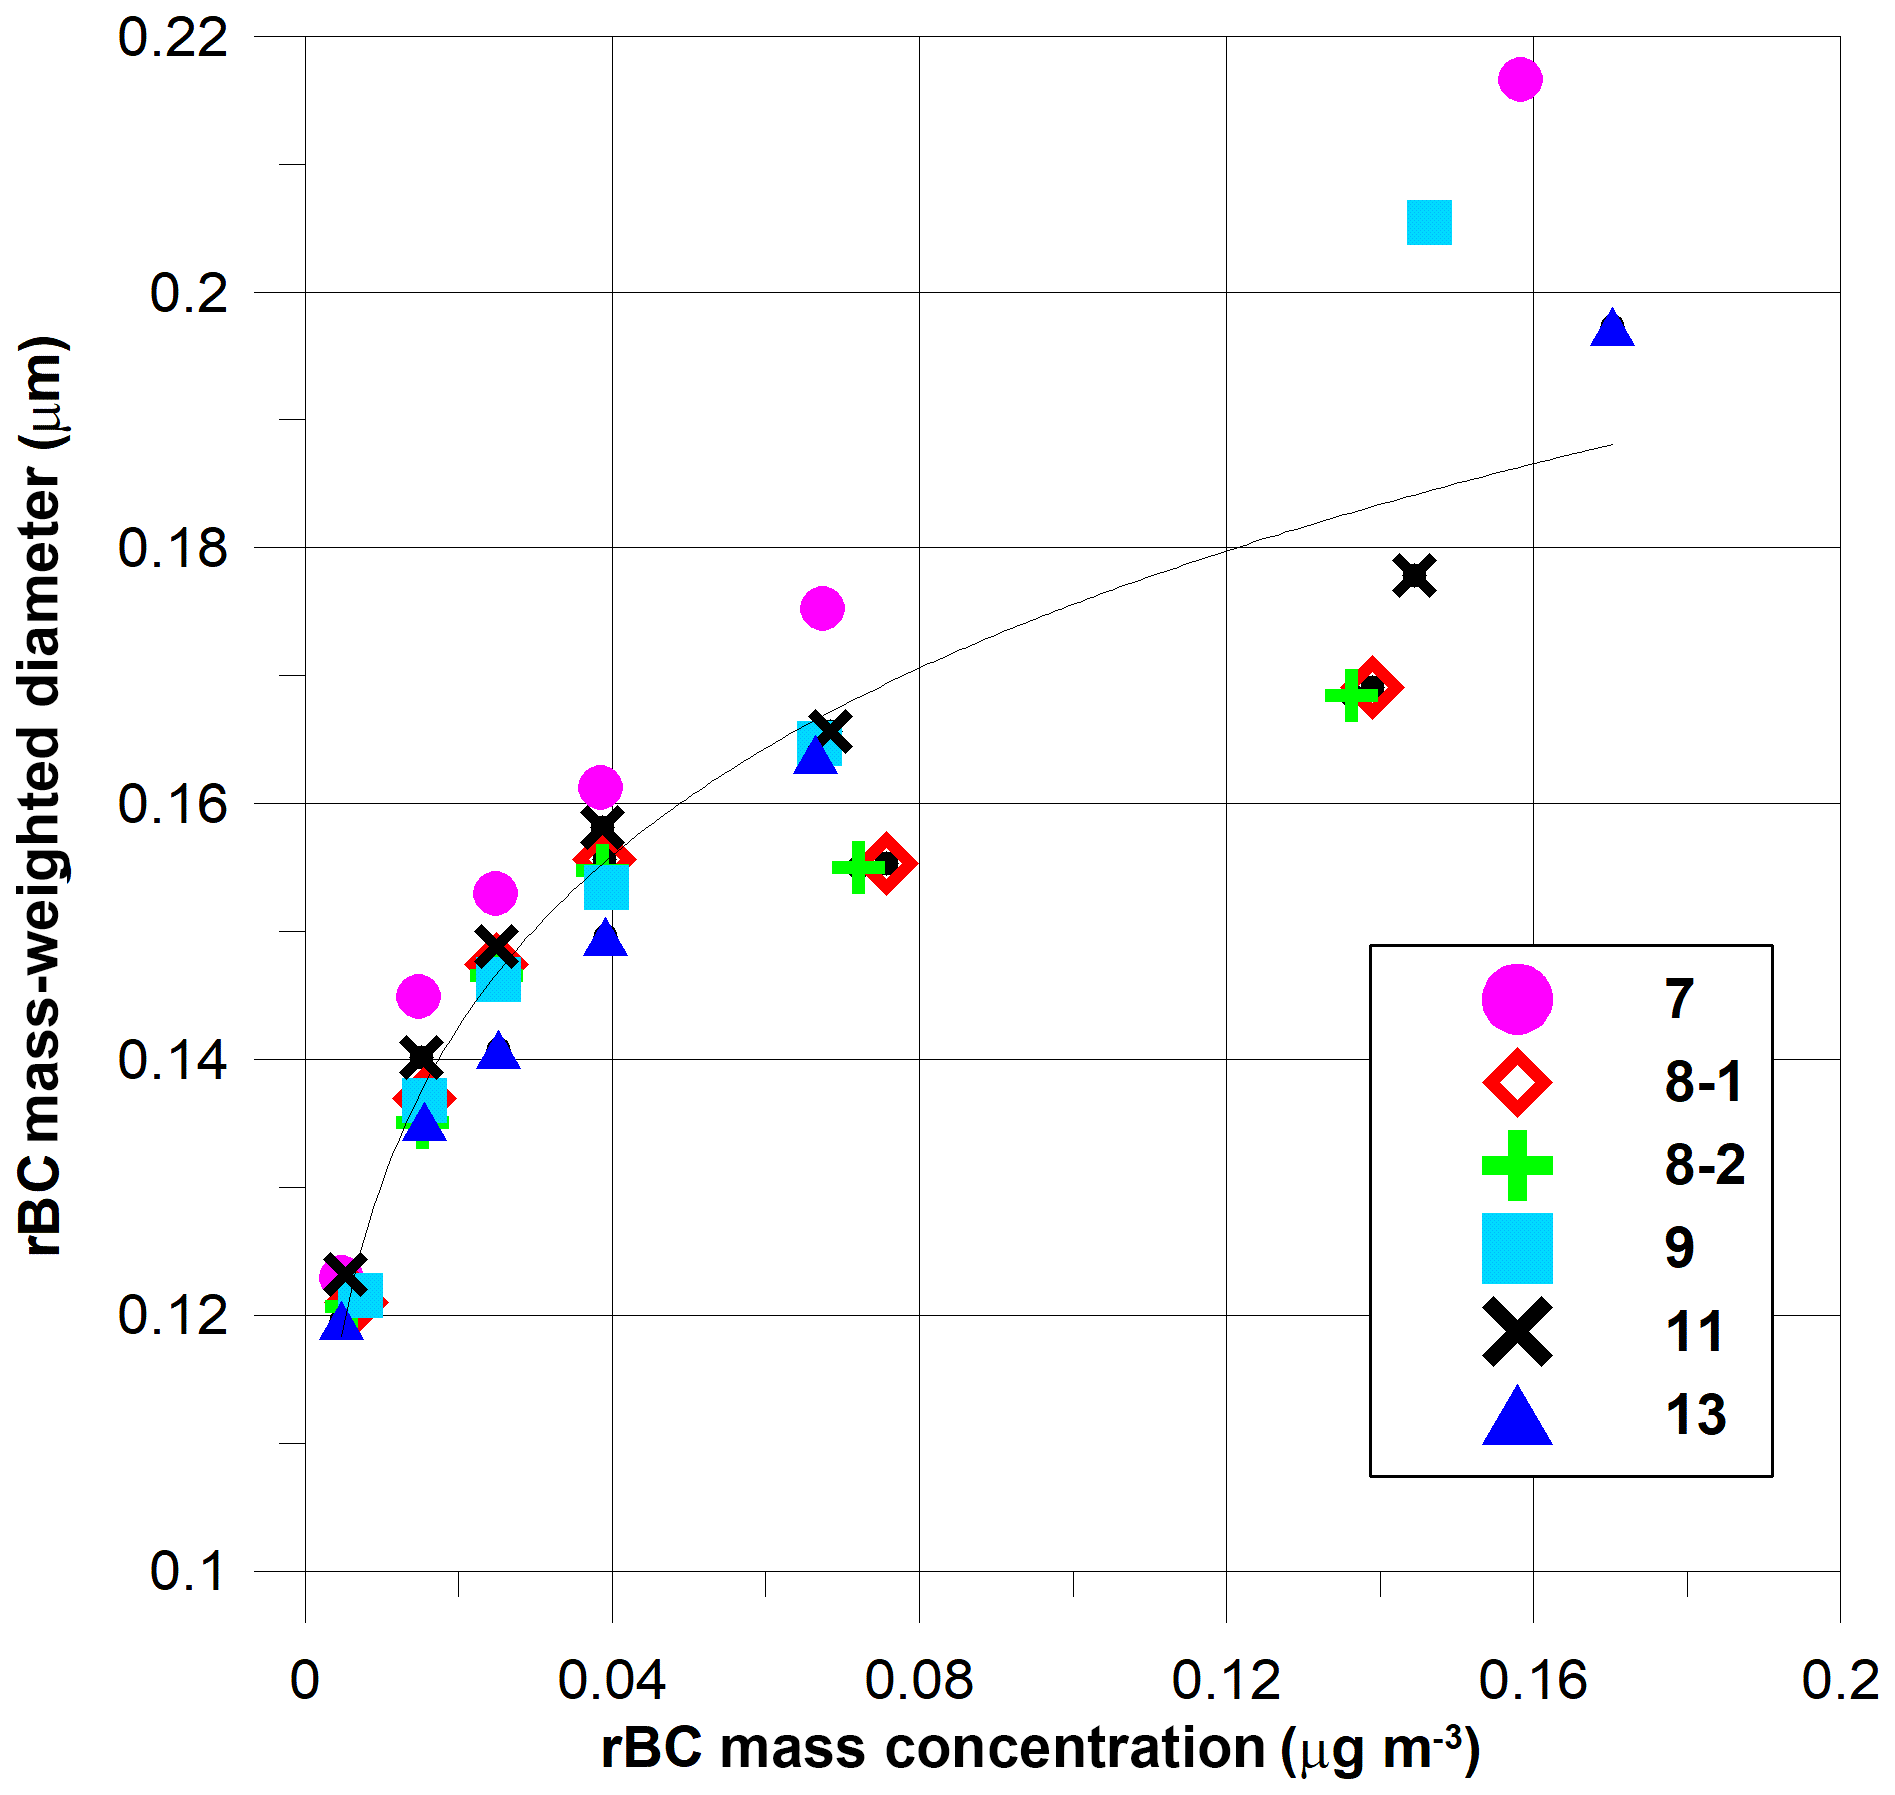
Figure 9Mean mass-weighted diameters of rBC measurements vs. rBC mass concentrations, assuming spherical rBC components. Points are averages for mass concentration intervals of 0–0.01, 0.01–0.02, 0.02–0.03, 0.03–0.05, 0.05–0.1 and 0.1 to the maximum observed. The power law fit (y=0.237[x0.129]) is through all points, with an R2 of 0.89 and confidence level of better than 99 %. The power law is appropriate based on the relationship between the diameter and mass of a sphere, which includes the diameter going to zero as the mass goes to zero.
At higher BC concentrations, the MAC versus BC curves in Fig. 8 approach the MAC values determined from Fig. 5 for the observations (18.4 m2 g−1) and from Fig. 6 for the model (8.8 to 14.0 m2 g−1). Reasons for the higher observation-based MACs, based on the regression in Fig. 5, are unclear. There is no indication from the blue vs. green slopes (Fig. 2) to suggest that brown carbon is a significant factor for the Alert and Eureka data. Based on Figs. 5–8, we estimate that dust may have contributed to the absorption by roughly 0.15 Mm−1. This estimate is significant, but not nearly sufficient, to explain the differences in observed and modelled MACs. We consider the following three additional possibilities for the higher MAC:
-
The higher MAC is reasonable. This is suggested by the recent observations in smoke plumes and in background particles over continental USA (Mason et al., 2018) and by Wu et al. (2016), whose modelling of soot aggregates shows that absorption by heavily coated soot can be about 60 % higher than uncoated soot. Another factor suggesting that the higher MAC is reasonable is the close agreement between the present σap and SSA for Alert with the April summary of Schmeisser et al. (2018) for Alert; the σap are 0.50 and 0.45 Mm−1 for the present Alert analysis and for Schmeisser et al. (2018), respectively, and the SSAs are 0.95 and 0.95, respectively.
-
The higher observed MAC results from the overestimation of absorption by the filter-based measurements, as suggested by a number of observations. Lack et al. (2008) and Cappa et al. (2008a, b) found that σabs measured with a PSAP ranged from 1.3 to over 2 times higher than σabs measured with a photoacoustic technique for organic mass (OM) concentrations above 2.5 µg m−3, and the ratio of OM to the light-absorbing component of the carbonaceous components exceeded about 15. To explain the absence of a similar effect on their results by ammonium sulfate particles, they suggested that the liquid nature of nonabsorbing OM enhanced multiple scattering across the filter, further increasing absorption by particles on the filter. For the present measurements of rBC and OM (see Figs. 10 and 15), the ratio of OM to rBC (the only significant absorbing carbon) is estimated to be between 15 and 20, consistent with a strong impact of OM on our results. However, Lack et al. (2008) and Cappa et al. (2008a, b) found that, for relatively low (OM), the PSAP-based σabs was only 12 % higher than the photoacoustic-based σabs. At 1 µg m−3 or less (Fig. 15), our flight OM concentrations fall well into the low OM concentration range of Cappa et al. (2008a, b) and Lack et al. (2008). Also, consistent with the lowest level OM in Fig. 12, 3 years of OM measurements at Alert found OM was always less than 0.5 µg m−3 (Leaitch et al., 2018), suggesting that the average impact of this factor on our σabs may be in the area of 12 %. Considering the ambient temperatures (−40 to −15 ∘C), it is also possible that our nonabsorbing OM was in solid forms (e.g. Zobrist et al., 2008), which might render its behaviour on the filter more similar to ammonium sulfate. Sinha et al. (2017) studied the effect of volatile material (removed at 300 ∘C) on absorption by particles at two Arctic sites. On average, and for particles less than 1 µm, they found that the absorption given by the PSAP was reduced by 22 % with the removal of volatile material, which suggests that the present correction based on σsp from the nephelometer may be insufficient.
-
The BC is underestimated here using rBC. Sharma et al. (2017) found that filter-based thermo-optical measurements of elemental carbon (EC) were an average of 1.9 times higher than rBC measured at Alert. This result will explain the high MAC value of 18.4 m2 g−1, but there are many uncertainties associated with the measurement of BC by the many techniques, and the rBC measurement has been recommended for use (Bond et al., 2013). Schulz et al. (2019) estimate the deficiency in the Polar 6 rBC mass concentrations due to sizing limitations at 7.5 %, but they did not consider potential bias with respect to particle size. Accounting for size limitations of the rBC measurement at Alert increased the BC estimate by 40 %–50 % during the spring measurement period (Sharma et al., 2017), although the resulting rBC was still a factor of 1.9 lower than the EC measurement.
If we assume that our observed σabs are overestimated by 22 % and our rBC are underestimated by 7.5 %, the MAC value is reduced from 18.4 m2 g−1 to about 13.4 m2 g−1, which is similar to the modelled MAC values based on the Allcore assumption but still about 50 % higher than the more commonly accepted value of approximately 9 m2 g−1 that is similar to the modelled value for the more realistic Rshell assumption. However, because there are a number of potential factors influencing the measurements of both σabs and BC, we cannot attribute one value with the necessary certainty. In the following, we consider the measured σabs, which give the MAC value of 18.4 m2 g−1, and values of σabs divided by a factor of 2 (i.e. σabs∕2) that give a MAC value of 9.2 m2 g−1, which is close to the more common MAC and the modelled MAC, based on the Rshell assumption.
3.3 BC, absorption, scattering and SSA vertical distributions
We expand our data set of σap values by employing the linear regression between σap and rBC, as shown in Fig. 5. This results in 956 σap points instead of 220, but because the linear relationship does not fully account for variations in individual points, we restrict the profiles of σap and SSAs to median values calculated over approximately equal 50 hPa pressure intervals. Based on the linear fit, the uncertainty in the median σap is 6 % at a 99 % confidence level, but that excludes possible biases in either the measurement of σap or BC (as represented by rBC) discussed in Sect. 3.2. The corresponding uncertainty in the median SSA is ± 0.01 or less for the range of SSAs discussed here, again excluding possible biases. As discussed in Sect. 2.1, the profile data, including σap and σap (SSA is dimensionless), have been adjusted to a standard temperature and pressure (20 ∘C and 1013.25 hPa) for the purposes of comparison. We note that in situ values of σap and σap are appropriate for calculating radiative effects.
Figure 10 shows vertical profiles of the rBC measurements of Schulz et al. (2018) and the modelled BC. Modelled BC for 1–14 April and rBC overlap well for pressures >900 hPa. In the pressure region of 600–900 hPa, the modelled BC is about a factor of 2 lower than the Polar 6 rBC. Median rBC is 0.043 µg m−3 and median modelled BC for 1–14 April is 0.022 µg m−3. Using version 10.01 of GEOS-Chem (without TOMAS) and its adjoint, Xu et al. (2017) found that BC corresponding to these observations was dominated by sources from eastern and southern Asia. Xi et al. (2017) also found better agreement of modelled BC with these observations; although the same version of GEOS-Chem is used here, all biomass burning emissions were injected only within the boundary layer, potentially accounting for some of the lower modelled BC relative to rBC. The relative increase in rBC in the 600–900 hPa region is consistent with the mean profiles of McNaughton et al. (2011), and the median-observed rBC concentration in the 600–900 hPa range is similar to the mode concentration of normally distributed values for “free tropospheric background haze” of 0.06 µg m−3 estimated by Brock et al. (2011). Also, the lower part of the profile concentration data (<1 km) is similar to the springtime low-level profile BC concentrations from Ny-Ålesund measured by Ferrero et al. (2016). The present result is considerably lower than the medians of 0.1–0.5 µg m−3 measured in the Arctic in 1983 (Hansen and Rosen, 1984), 1986 (Hansen and Novakov, 1989) and 1992 (Hansen et al., 1997). A decrease in BC at Alert, Nunavut, during the 1990s of more than 50 % was associated with a reduction in Eurasian emissions (e.g. Sharma et al., 2019), and the present lower rBC concentrations near the surface may be connected to that reduction. Since east Asian emissions increased during the same time (e.g. van Donkelaar et al., 2008), it is difficult to assess the reason for the present lower concentrations in the 600–900 hPa range. It appears that the present observations mostly represent particles that spent a considerable length of time in the Arctic atmosphere.
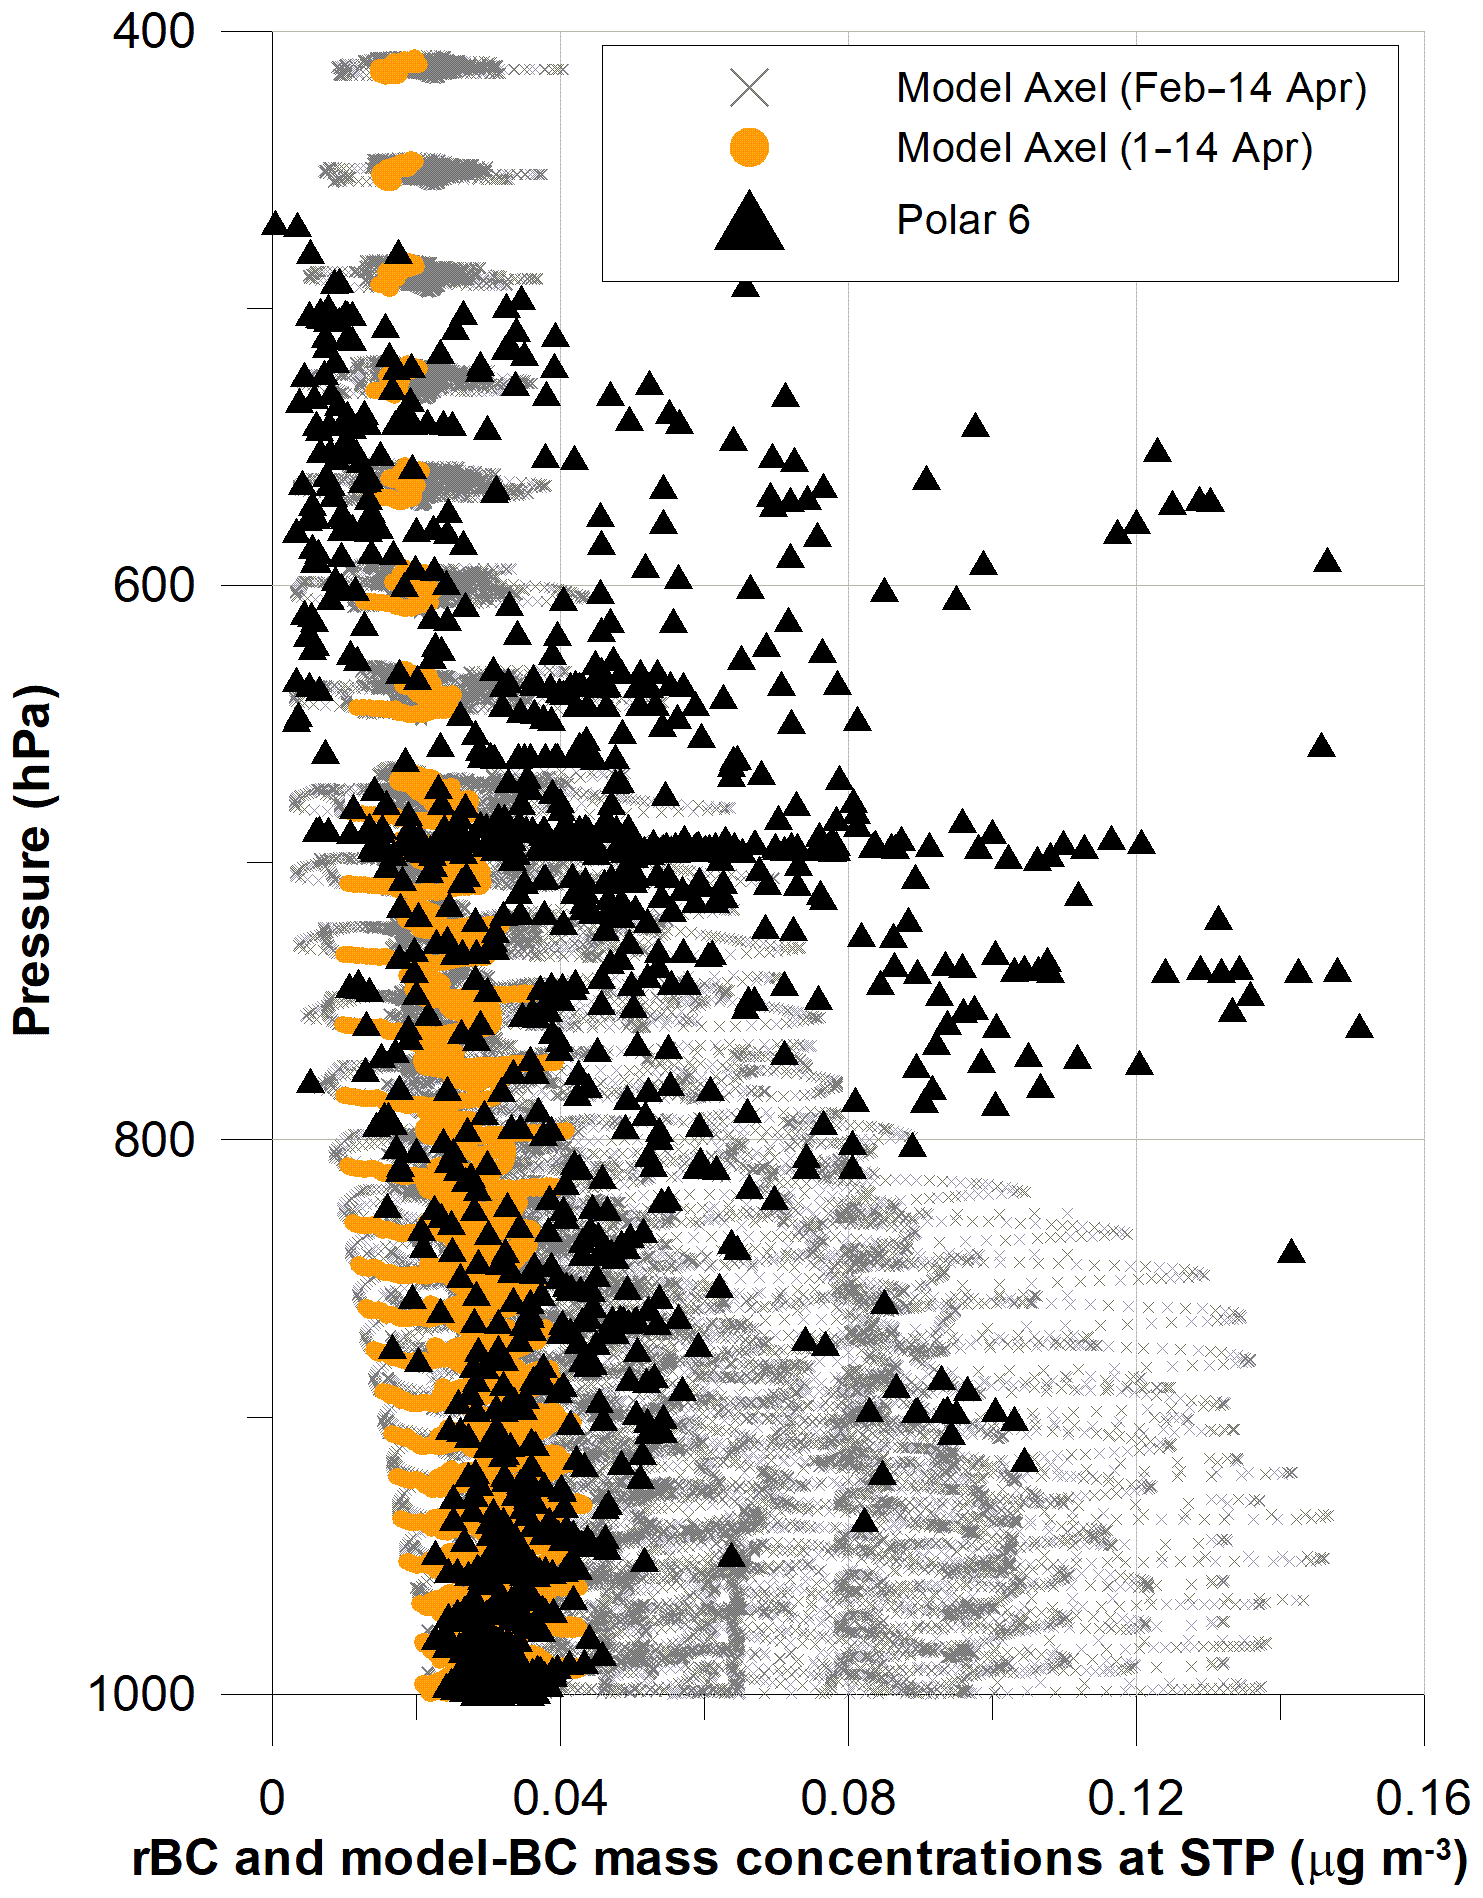
Figure 10Vertical profile plot of BC mass concentrations from the model for the Axel grid (black crosses for February–14 April, inclusive; orange dots for 1–14 April only), and rBC mass concentrations from the Polar 6 observations (black triangles) plotted with pressure.
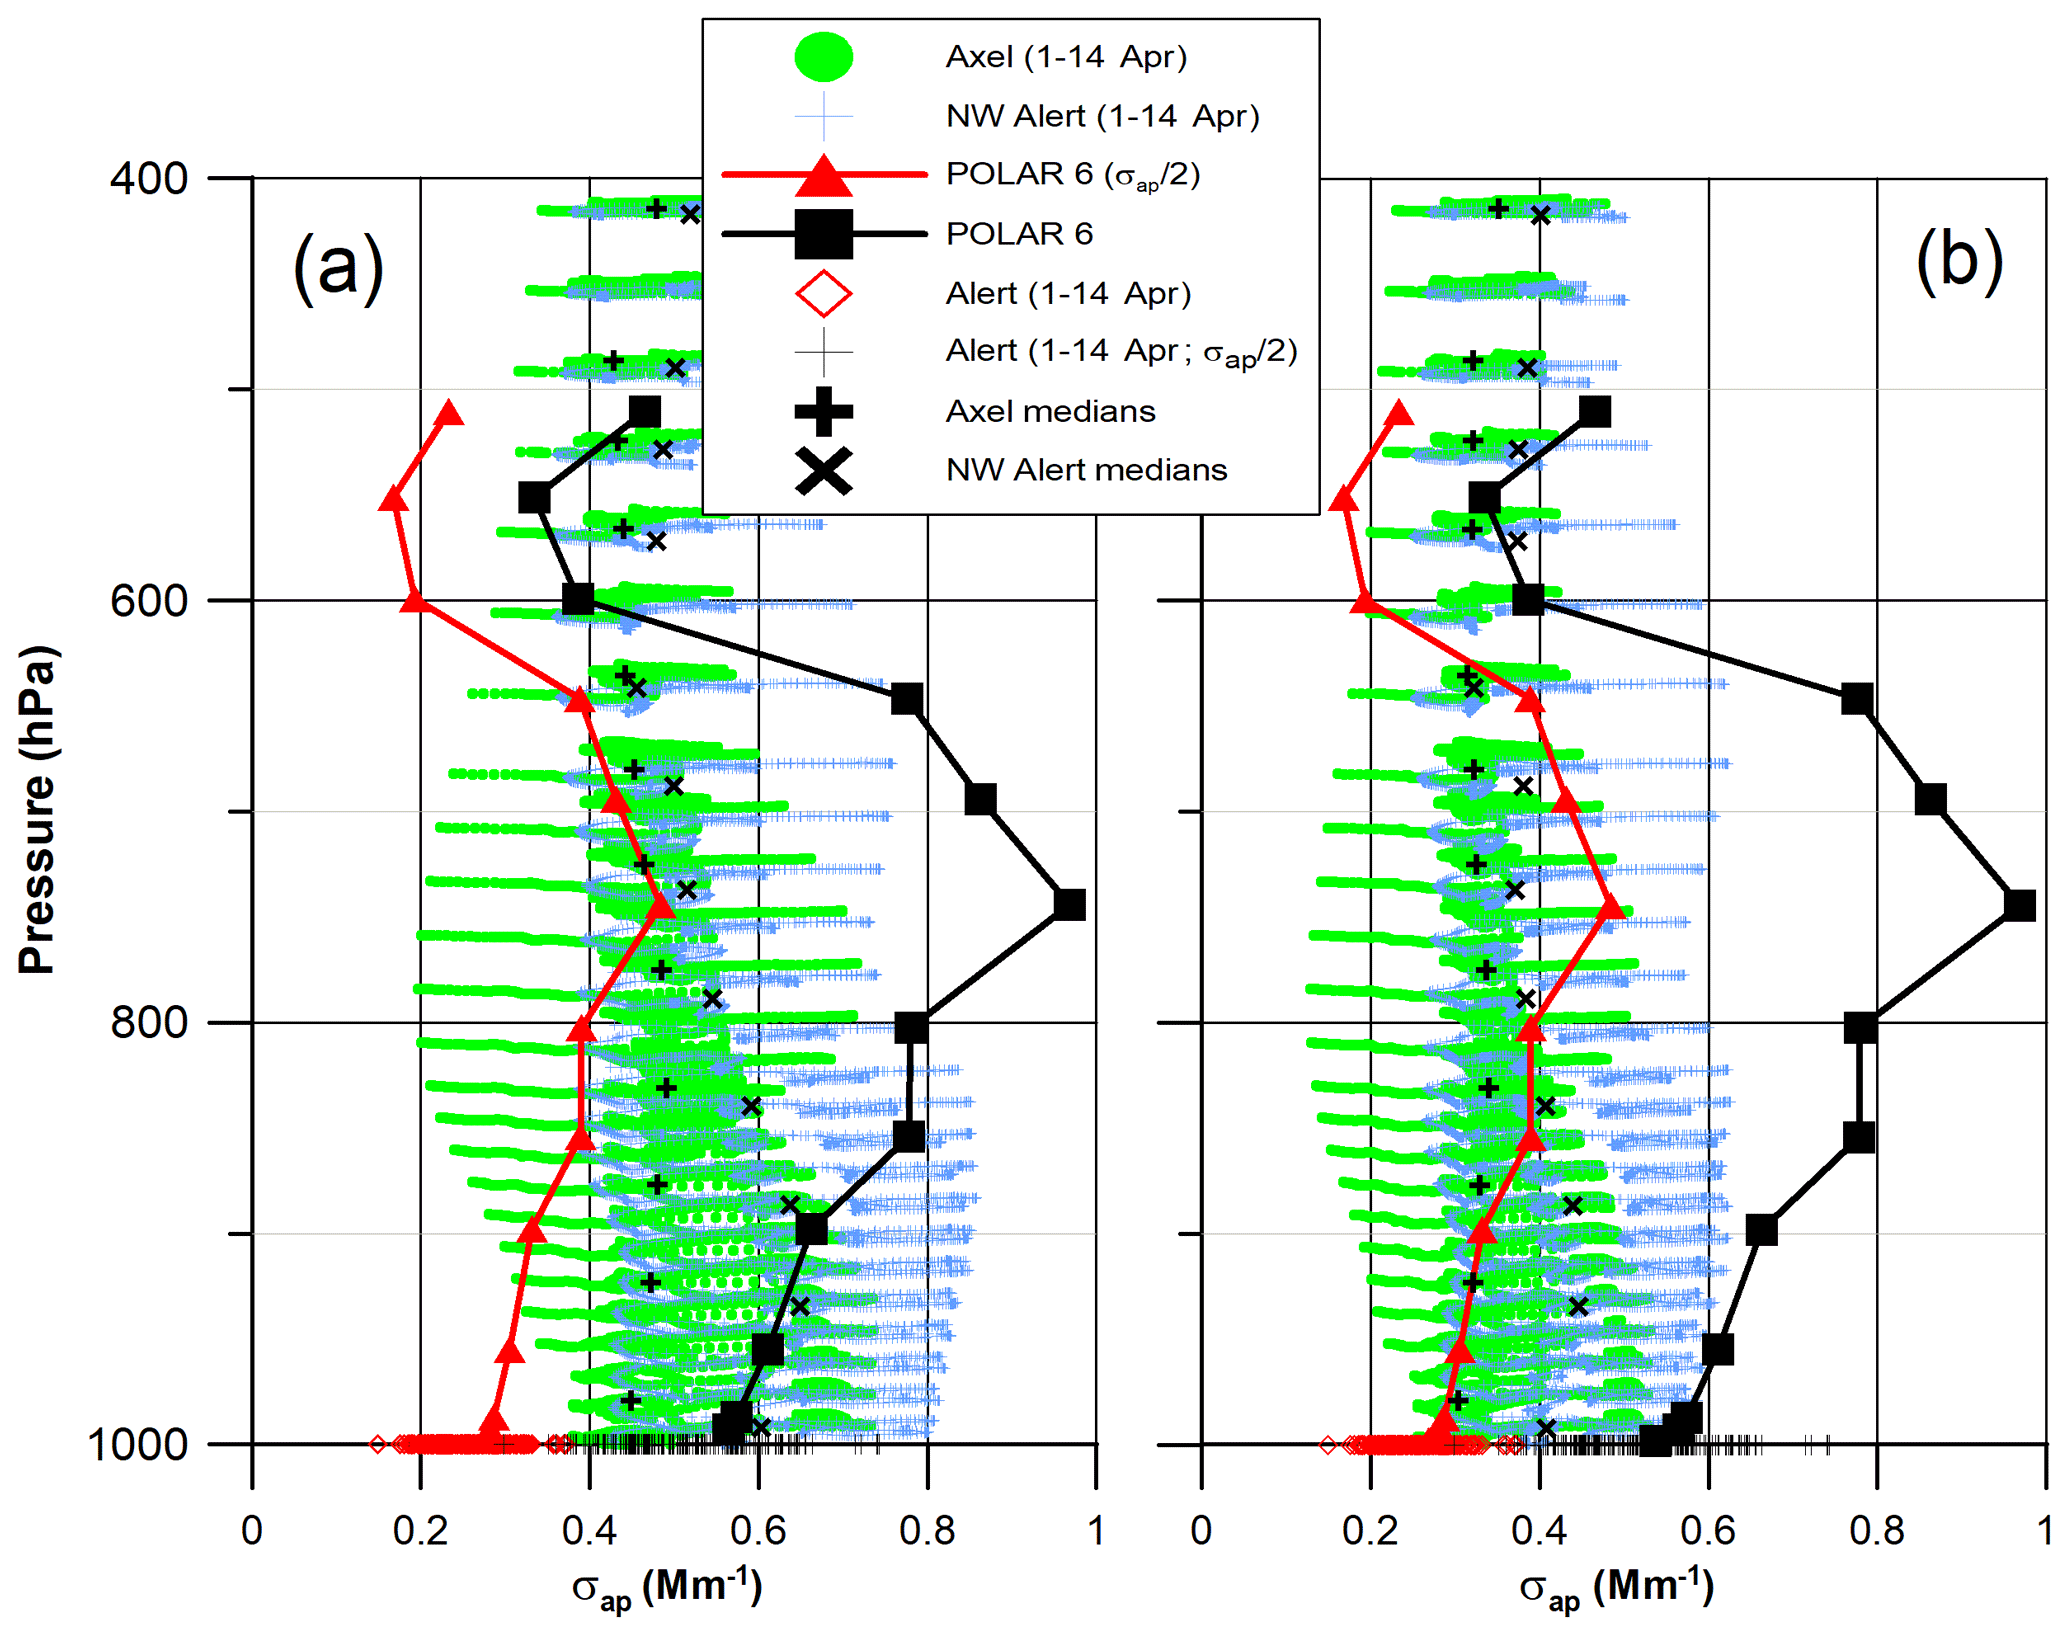
Figure 11Vertical profile plots of σap with atmospheric pressure showing median values based on Polar 6 observations (black points). Red points represent the Polar 6 σap∕2. Data from the Alert observatory for 1–14 April are shown for σap (black squares) and σap∕2 (red squares). The model results are for 1–14 April, with the green dots representing the Axel grid and blue crosses representing the NW Alert grid. (a) Model results for the Allcore assumption and (b) model results for the Rshell assumption.

Figure 12Vertical profile plot of SSAs with atmospheric pressure showing modelled results for February (a), March (b) and 1–14 April (c) based on the Allcore assumption. Results for February (d), March (e) and 1–14 April (f) based on the Rshell assumption. Median values of SSAs from the Polar 6 observations and the Alert observatory are based on the measured absorption (black points) and the assumption of σap∕2 (red points).
Modelled profiles of σap for 1–14 April and both the Axel and NW Alert grids are shown in Fig. 11a–b for the Allcore and Rshell assumptions, respectively; major dust influence is removed, as in Fig. 6. The median values of the Polar 6 rBC-based σap, covering the period of 7–13 April, inclusive, are also shown in Fig. 11, along with the hourly σap from Alert for 1–14 April. The black Polar 6 curves and Alert points are the measured values, and the red Polar 6 curves and Alert points indicate the results for the measured values divided by two or σap∕2. The median σap from the Polar 6 agree reasonably with the corresponding Alert values. As expected, the modelled σap based on the Allcore assumption are overall higher than those based on the Rshell assumption. The simulated and observed σap exhibit opposite tendencies with pressure, except for pressures less than 600 hPa, where the model and Polar 6 both suggest an increasing tendency of σap with decreasing pressure, consistent with Samset et al. (2013). Near the surface, the Allcore simulations are closer to the observed σap and the Rshell simulations are closer to the σap∕2. Between 800 and 600 hPa, the modelled σap, for both assumptions, overlap best with the observed σap∕2.
Vertical profiles of SSAs are shown in Fig. 12. The modelled results are for February, March and 1–14 April 2015, with the upper (a–c) and lower panels (d–f) representing the Allcore and Rshell assumptions, respectively. Median values of the Alert SSAs, calculated from the measured σsp and σap, are shown for the corresponding model time period. The Polar 6 SSAs overlap well with the corresponding Alert SSAs for 1–14 April. The 1–14 April Alert SSAs, based on the higher MACs, are the same as those reported by Schmeisser et al. (2017) for Alert in April. The Alert SSAs increase from February to April, which suggests a combination of the near-surface air cleansing itself of BC faster than the air in the lower troposphere during the high Arctic spring-to-summer transition and long-range transport aloft maintaining its influence longer than transport near the surface. Near the surface (>900 hPa), the modelled SSAs are lower than the Alert and Polar 6 results, in contrast to the modelled near-surface σap (Fig. 11). This difference is due to the modelled σsp being overall lower than the observed σsp, as discussed below in connection with Fig. 13. In Fig. 12, the modelled and observation-based SSAs have opposite tendencies from the surface to about 600 hPa. In the 700–800 hPa region, there is good agreement between the modelled SSAs for the Rshell mixing state and the observation-based SSAs for σap∕2. However, given that the modelled and measured σsp are in reasonable agreement in that region (Fig. 13), the SSA agreement seems inconsistent with the underestimation by the model of BC in that pressure region (Fig. 10). The Polar 6 near-surface (>950 hPa) and Alert SSAs for early April range between 0.94 and 0.98, roughly consistent with the boundary layer SSA estimates of 0.97(±0.02) by Brock et al. (2011) and 0.95–0.96 by McNaughton et al. (2011). In the region of 600–900 hPa, the Polar 6 SSAs, based on σap∕2, range between 0.94 and 0.96, which is also consistent with McNaughton et al. (2011) in this region and the free tropospheric background haze estimate of Brock et al. (2011). However, the Polar 6 SSAs, based on σap, range between 0.88 and 0.92 for the 600–900 hPa region, indicating substantially more absorption relative to scattering in this altitude range than found by Brock et al. (2011) and McNaughton et al. (2011). As mentioned above, the ejection of biomass burning particles only into the boundary layer at the source may contribute to the higher modelled SSAs in the 600–900 hPa layer.
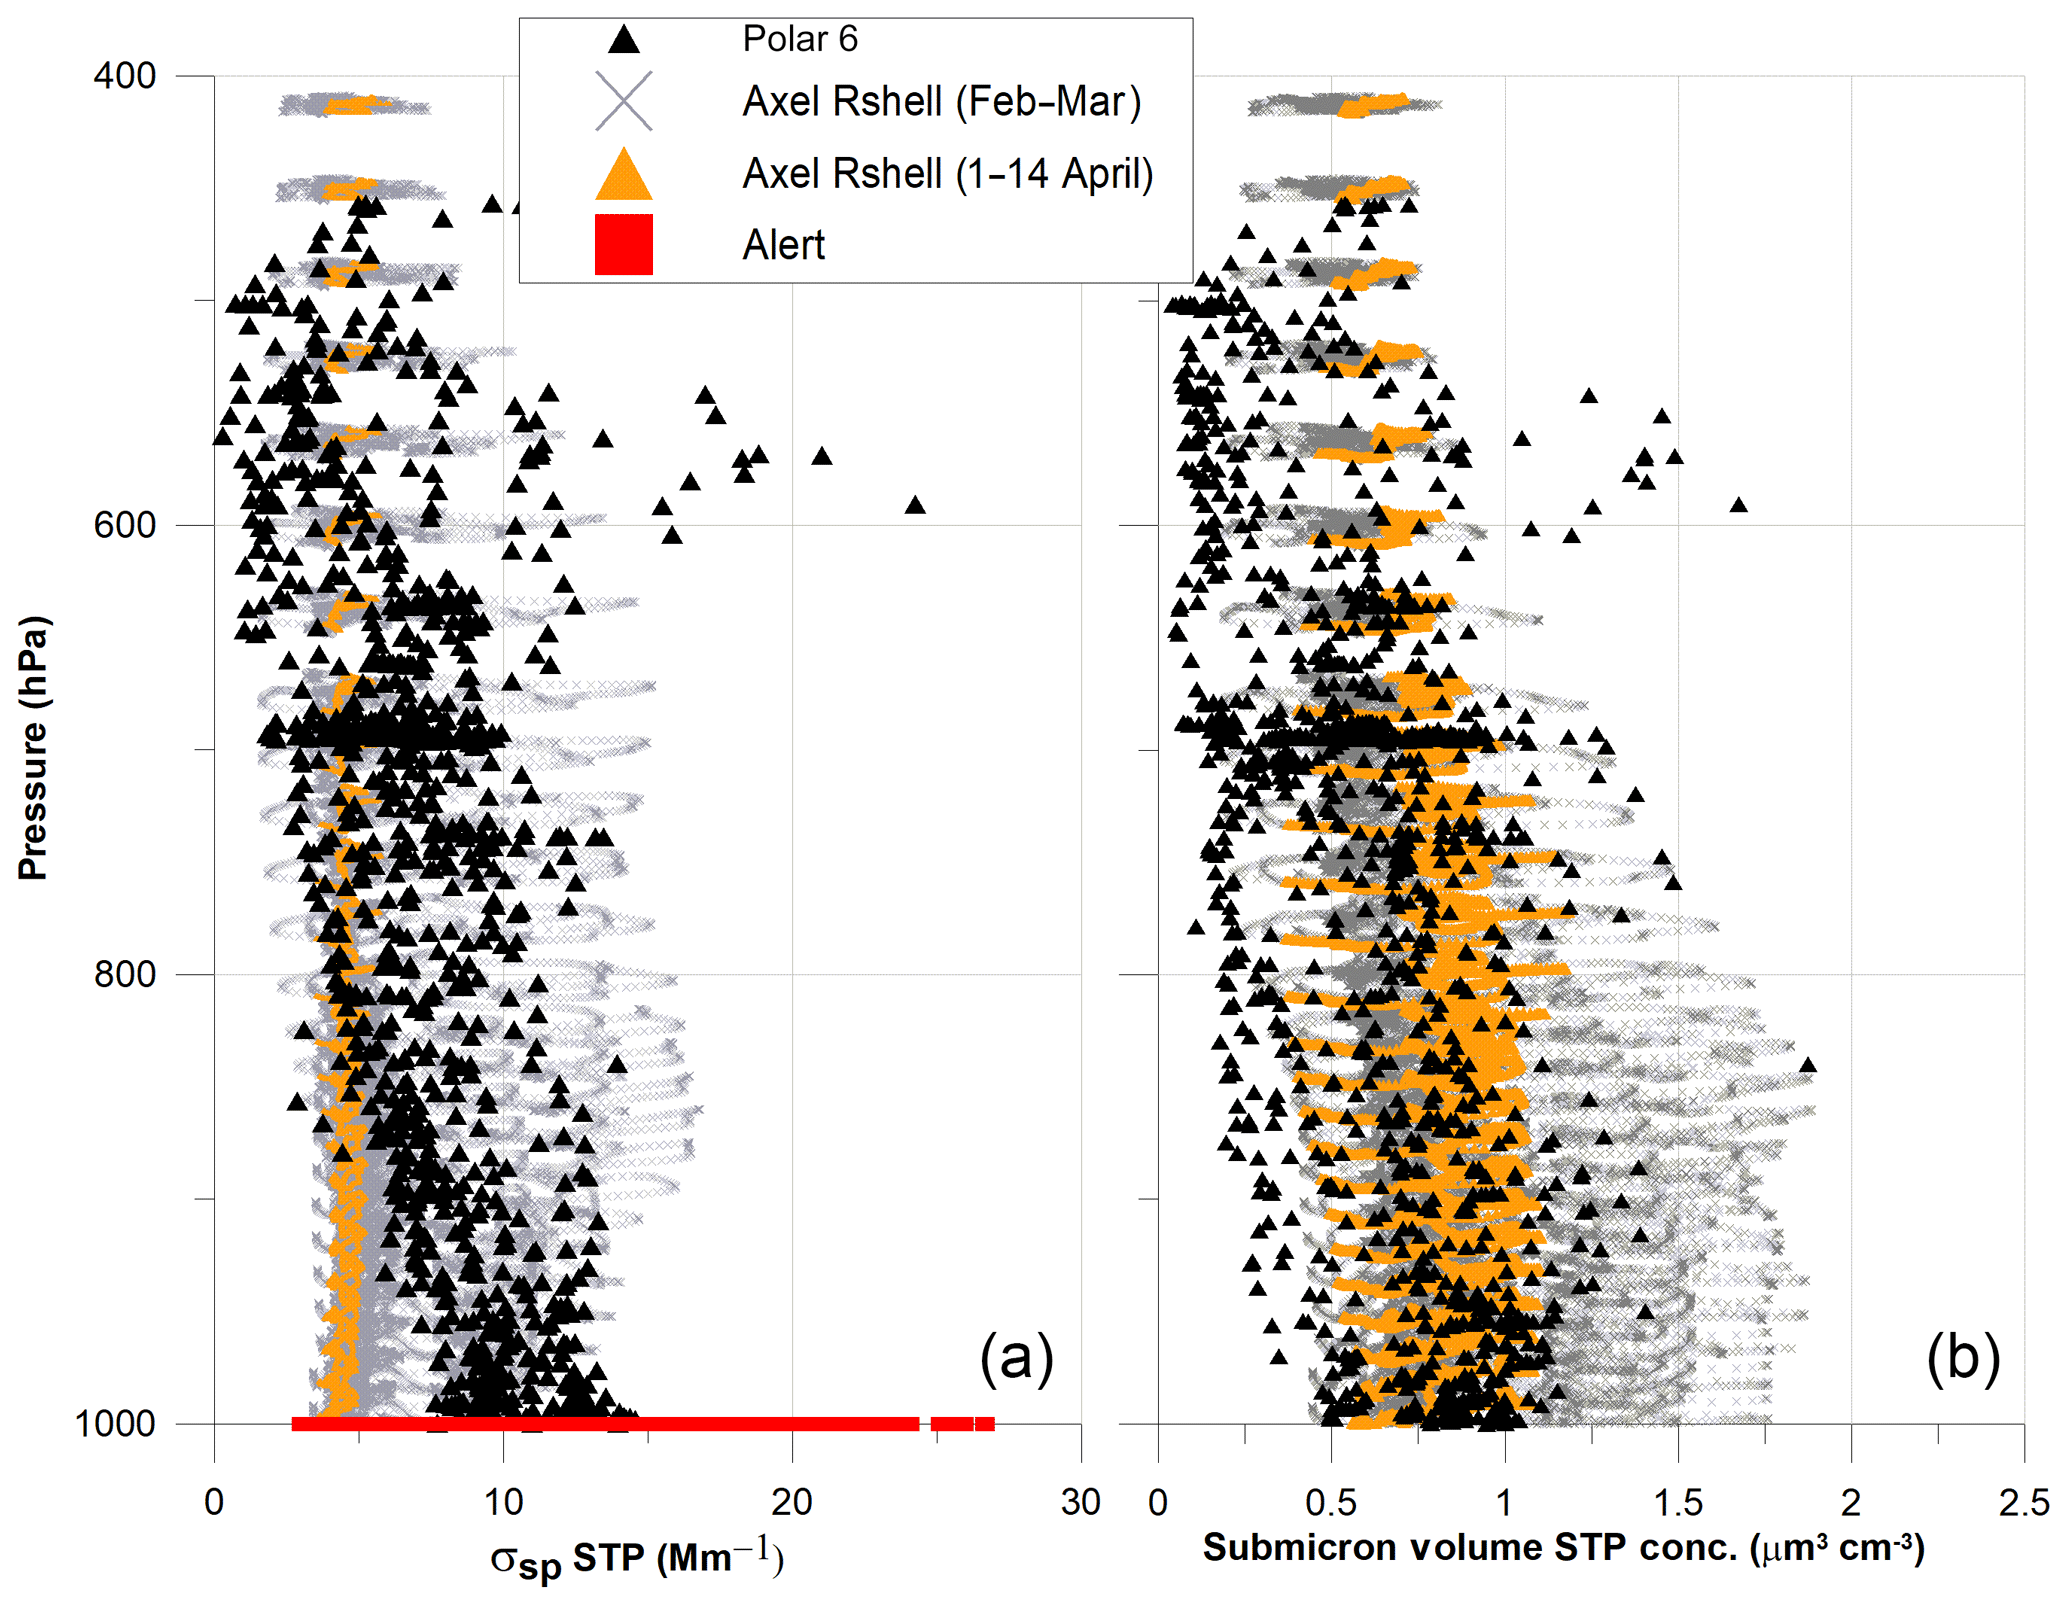
Figure 13(a) Vertical profile plot of σsp from the model for the Axel grid (black crosses for February–14 April, inclusive; orange triangles for 1–14 April only) and σsp from the Polar 6 observations plotted with pressure. Also shown are the Alert observatory σsp for 1–14 April. (b) As in (a) but for submicron volume concentrations from the model simulations and Polar 6 observations. Volume concentrations from the Alert observatory are not shown.
Modelled σsp for the 1–14 April period and observed σsp are shown in Fig. 13a; only the model results for the Axel grid and Rshell assumption are shown, as those for the NW Alert grid are similar. The modelled and observed σsp are most similar in the 600–900 hPa region, and therefore the differences between modelled and observation-based SSAs (Fig. 12) in this pressure region are primarily the result of the variations in σap (Fig. 11). Close to the surface (>900 hPa), the 1–14 April modelled σsp are lower than the Polar 6 σsp and at the low end of the Alert σsp, which contributes to the lower modelled SSAs relative to the observation-based SSAs in Fig. 10. Near the surface, the modelled σsp for February agree best with the observed σsp, in part due to the higher submicron particle volumes simulated for February (Fig. 13b). The observed submicron volume concentrations are based on the UHSAS, and the modelled submicron volumes are calculated from the modelled mass concentrations of sulfate, organics and BC (SO4 ∕ 1.8 + Org ∕ 1.2 + BC ∕ 1.8), where 1.8, 1.2 and 1.8 are the respective densities of these components. The modelled scattering efficiency (scattering coefficient divided by volume concentration) is significantly lower than the efficiency based on the observations. Near the surface (>900 hPa), the median of σsp∕Volume from the observations is 12.1 µm−1 (range of 7.2–26.3) compared with 7.3 µm−1 (range of 5.6–10.3) from the model. For the pressure interval of 600–900 hPa, the median of σsp∕Volume from the observations is 10.8 µm−1 (range of 6.2–36.4) vs. 7.3 µm−1 (range of 5.6–12.2) from the model. Model underestimation of submicron particle sizes may contribute to the lower modelled volume scattering efficiencies. In Fig. 14, the modelled particle size distributions for the Axel grid, for the 1–14 April period and averaged over the indicated pressure intervals are compared with measured distributions from the two flights (11 and 13 April) conducted in that grid. The modelled distributions for the 800–900 and 900–1019 hPa intervals are shifted to slightly lower sizes relative to the average of the observations. The modelled distributions for 600–800 hPa are a closer match to the measurements, and, for 400–600 hPa, the average of the modelled sizes is a reasonable match to the 11 April measurements but exceeds the 13 April observations. The overall pattern is generally consistent with the variation of the modelled σsp for the Axel grid and 1–14 April period, relative to the observed σsp, shown in Fig. 12a. In addition, the lower modelled volume scattering efficiencies may result from underestimation of the observed volumes that are based on the UHSAS.
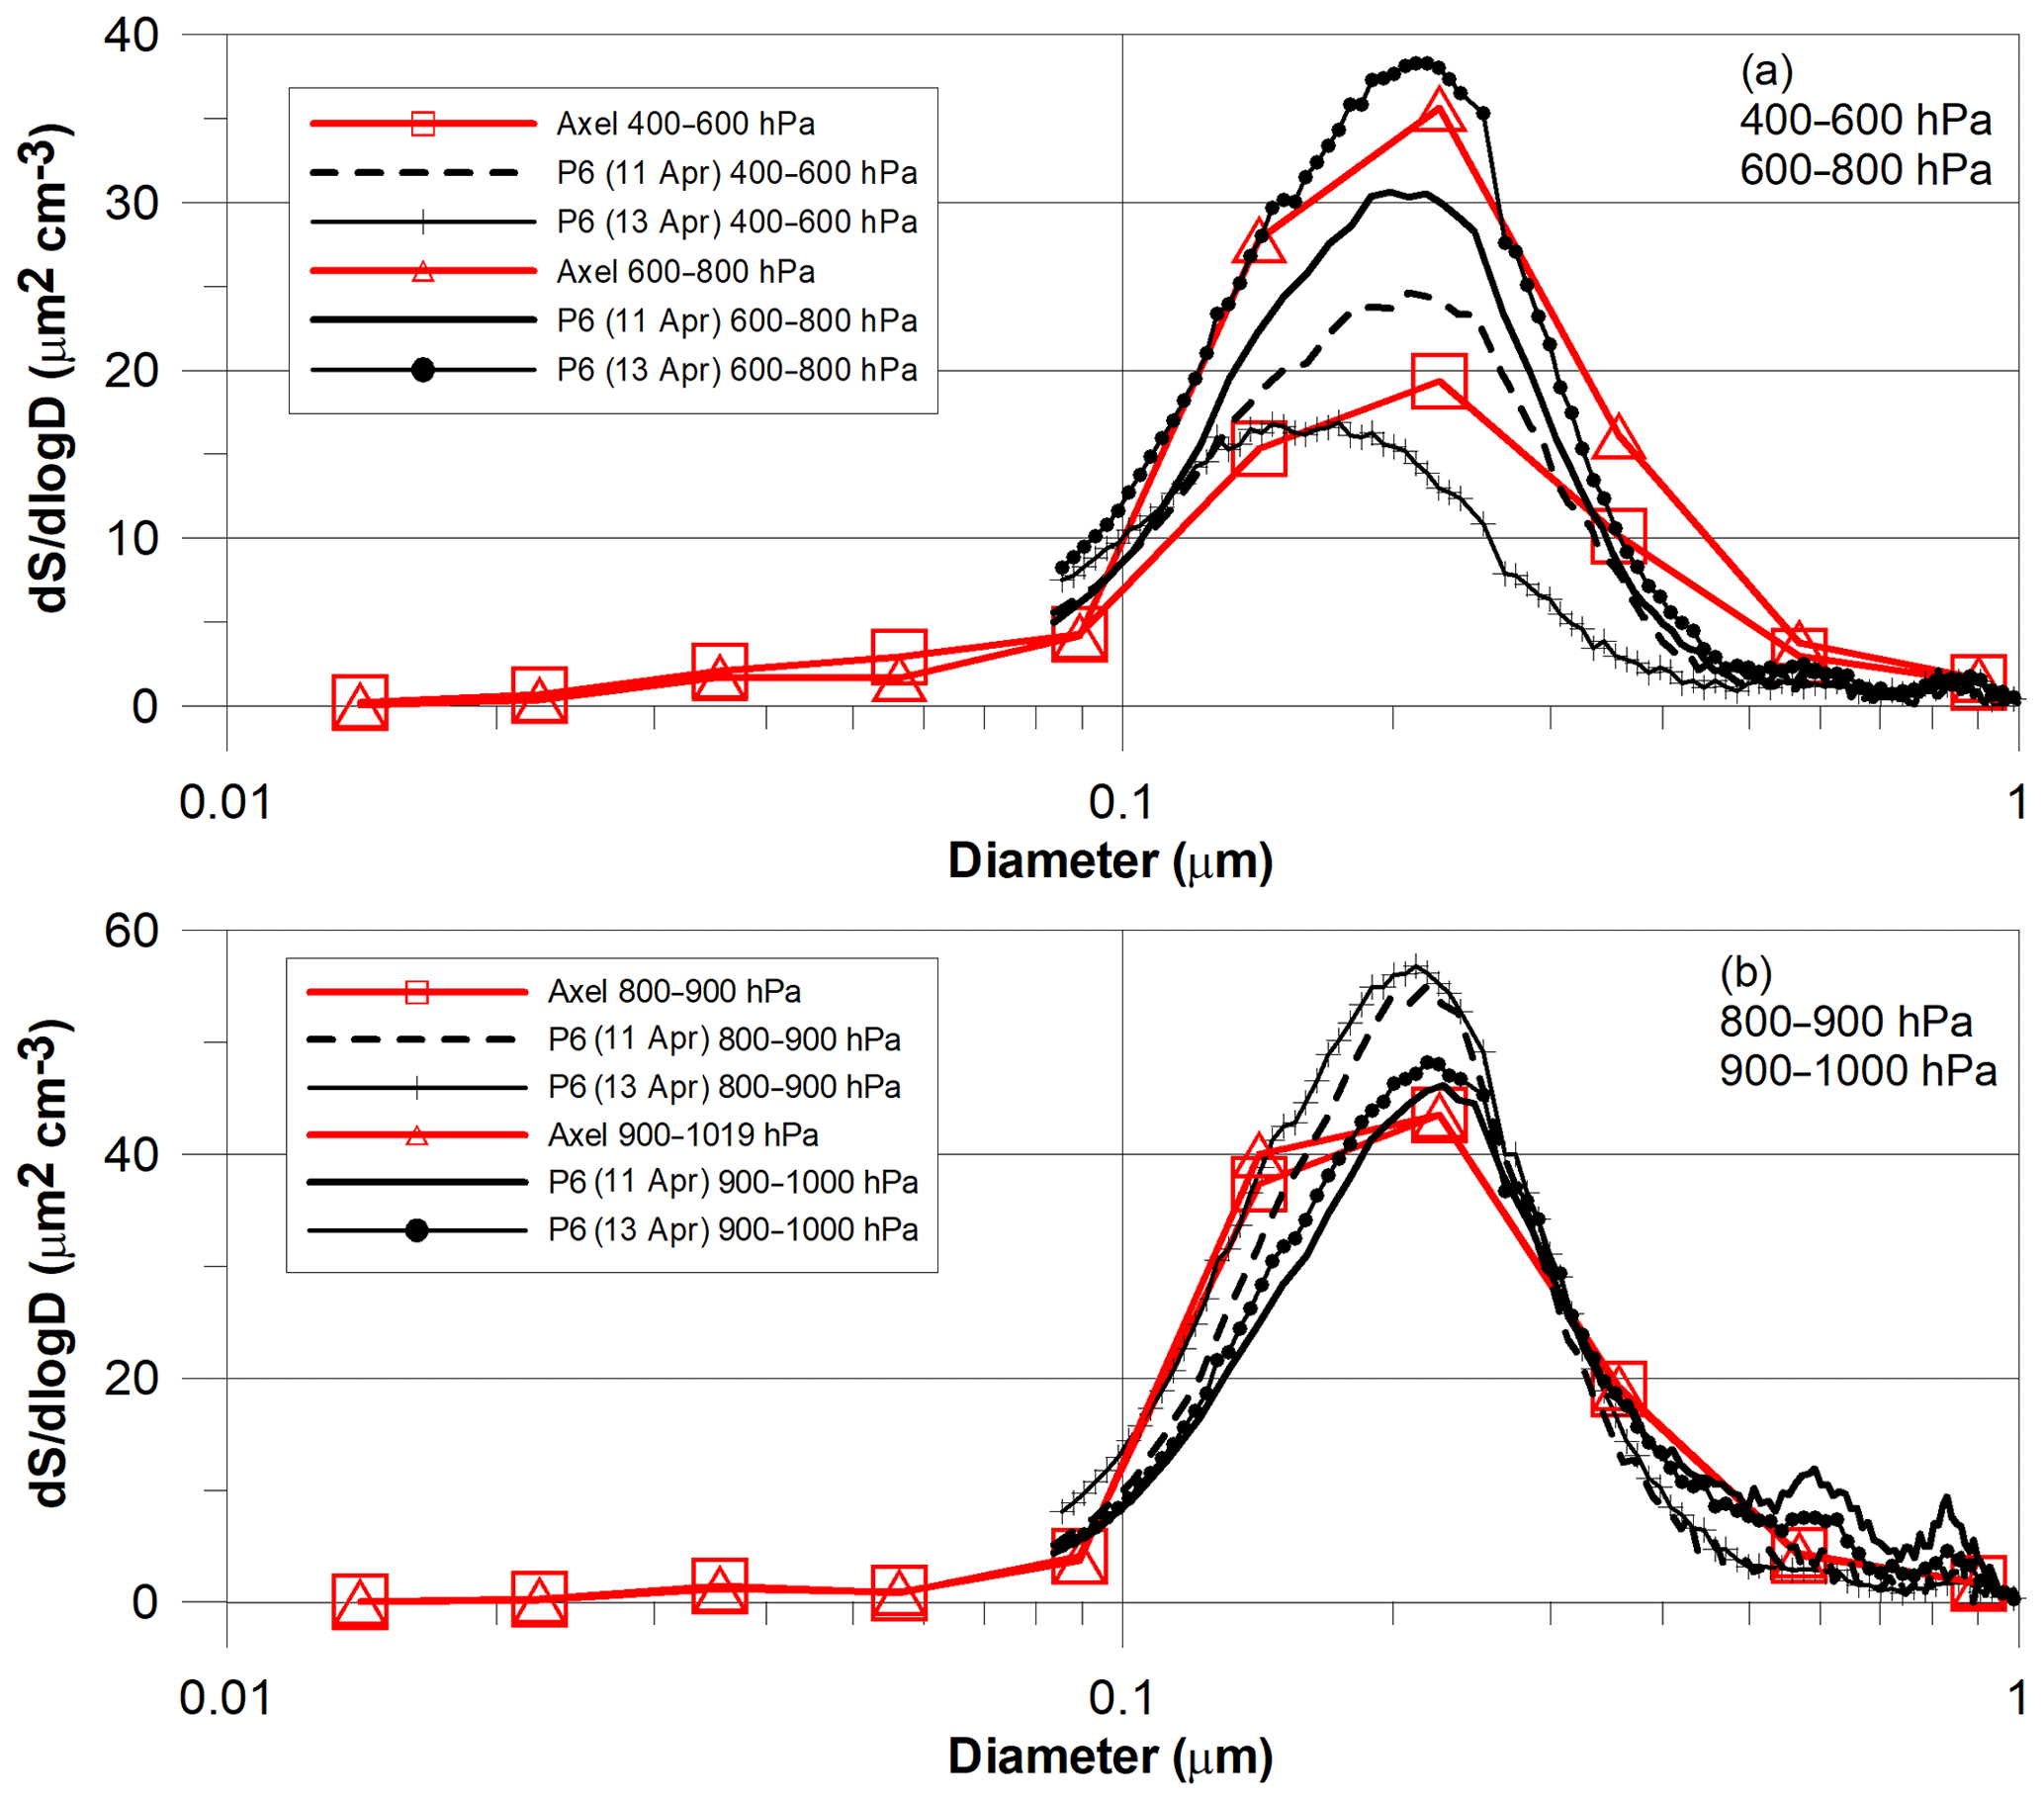
Figure 14Comparison of modelled size distributions for the Axel grid and period of 1–14 April with the measured distributions from the Polar 6 (P6) flights on 11 and 13 April. All distributions are averaged for the indicated pressure intervals. (a) Modelled and measured distributions for pressure intervals of 400–600 and 600–800 hPa. (b) Modelled and measured distributions for pressure intervals of 800–900 and 900–1000 hPa.
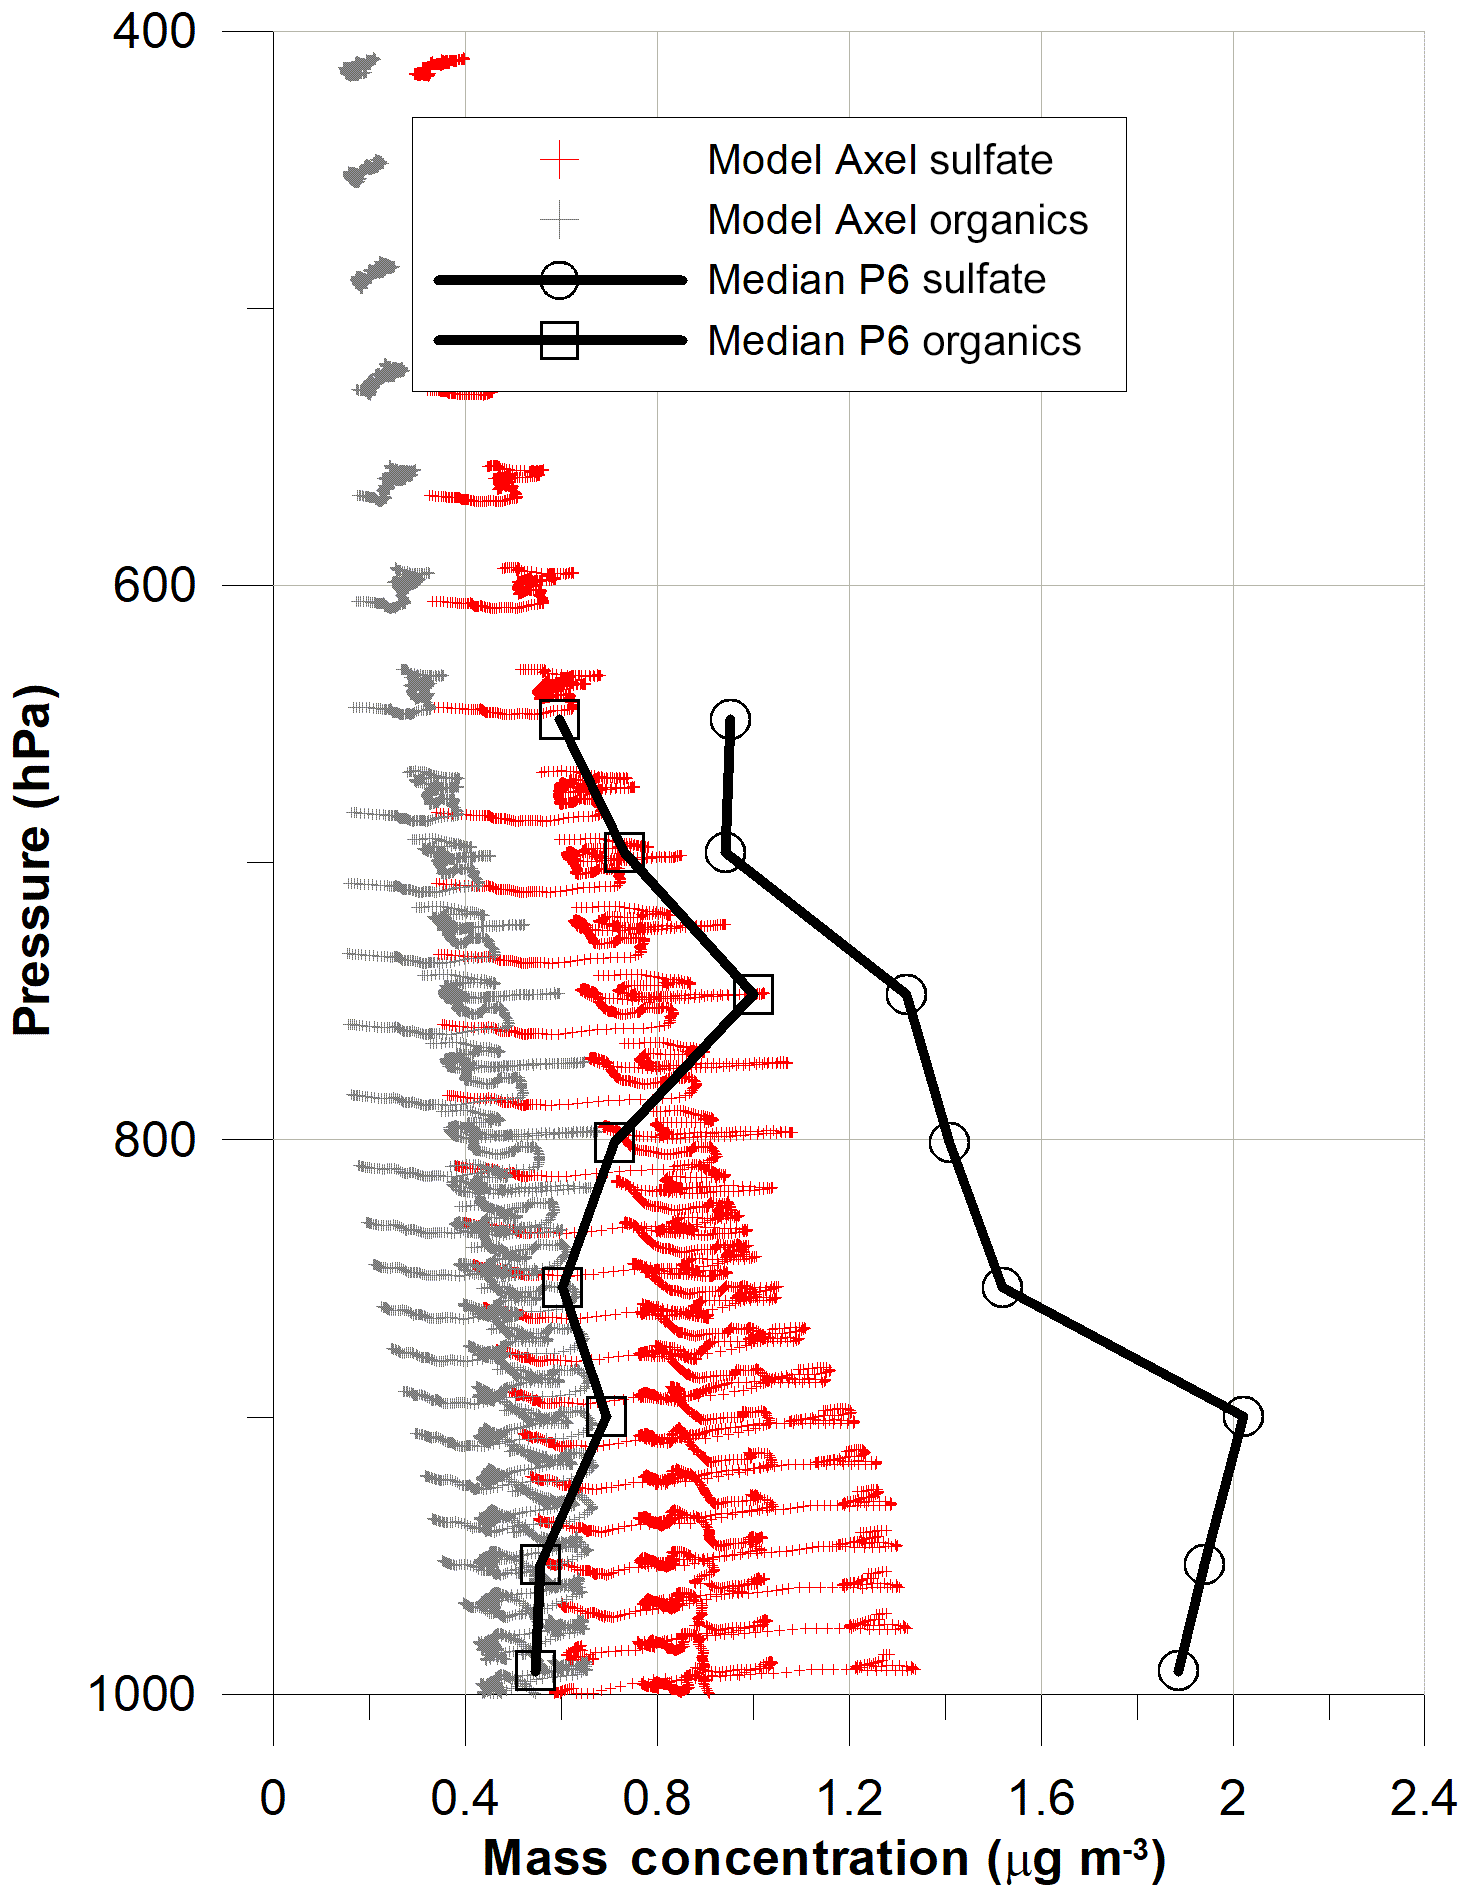
Figure 15Vertical profile plot of mass concentrations of sulfate and of organics with pressure from the model for the Axel grid for 1–14 April (red crosses are sulfate and grey crosses are organics) and median values of the Polar 6 sulfate (open circles) and organic (open squares) mass concentrations.
The vertical distribution of the median concentrations of organic mass (OM) and sulfate mass (from Willis et al., 2018) are shown in Fig. 15 along with modelled organic and sulfate mass concentrations for the Axel grid; results for the NW Alert grid are not appreciably different. The increase in rBC from the surface to about 650 hPa (Fig. 10) is paralleled by the increase in OM and its increase relative to sulfate. In Fig. 15, modelled OM near the surface (>900 hPa) is relatively close to the observed OM, but above that the observed OM is higher by as much as a factor of 2 near 750 hPa. Near the surface, sulfate is underestimated by the model, which contributes to the model's lower volume and σsp (Fig. 13) and, hence, SSAs near the surface (Fig. 12).
Models tend to underestimate Arctic BC (Bond et al., 2013; Eckhardt et al., 2015) and sulfate (Eckhardt et al., 2015). Emissions are an important aspect of such comparisons, and a recent study, using the European Centre Hamburg Model (ECHAM) model, showed that improved emissions inventories increase the annual BC burden over the Arctic by up to 30 % (Schacht et al., 2019). The vertical distributions in Figs. 10 and 15 suggest that the BC emissions are coupled with other carbonaceous emissions to produce OM. In this case, the tendency of rBC–OM is to increase with altitude, from approximately 5.8 % near the surface to 7.3 % at 650 hPa; 5.8 % is equivalent to the slope of the modelled result in Fig. 7d. Variations in source emissions and secondary organic aerosol formation will explain some of the increase in rBC–OM throughout this altitude range, but precipitation scavenging preferentially removing more organic material than BC is also a possibility. In the high Arctic, the number fractions of particles larger than 100 nm that contain detectable rBC are <30 % (e.g. Sharma et al., 2017; Kodros et al., 2018; references therein), which means there is significant potential for nucleation scavenging to separate OM (and sulfate) from BC as part of the precipitation process. As discussed by Targino et al. (2006) and Andrews et al. (2011), this may contribute to the general reduction in SSAs at lower σsp.
The microphysics of the rBC components also supports the importance of wet deposition to the present observations. Schulz et al. (2019) showed that the mass mean diameter of the rBC components decreases with decreasing pressure from the surface, with an increase in the number of rBC-containing particles explaining the higher rBC mass concentrations aloft. Wet deposition by convective clouds near the source regions will lead to smaller BC components of particles aloft, if the larger-sized BC components are scavenged, on average, more than smaller BC components nearer the emissions sources. The stronger emissions from more distant and southerly regions reaching higher altitudes (Stohl, 2006; Xu et al., 2017) could explain the general increase in rBC number concentrations with altitude. An important role for particle microphysics, and in particular in the representation of BC microphysics, in the modelling of BC transport to the Arctic is indicated. Despite the detailed microphysical model used here, the simulated BC vertical profiles suggest that the model transports more BC close to the surface. Excessive convective wet deposition that removes BC aloft (e.g. Mahmood et al., 2016), or redistributes it to the near-surface region, and the present modelled ejection of biomass burning particles only into the boundary layer are two potential reasons for the lower modelled BC in this case. These results are consistent with Matsui et al. (2018), who point out that for models to properly simulate BC and its radiative impact on the Arctic atmosphere, they must have good representations of the microphysics and scavenging aspects of BC and other components of the aerosol. The results of Targino et al. (2005) and Andrews et al. (2011), suggesting lower SSAs associated with lower σsp, and the present results are examples showing that wet scavenging may enhance the relative absorption by the Arctic aerosol. In addition, contributions from smaller amounts of dust at the lower BC in this case (Fig. 8) may also factor in the lower SSAs at lower σsp.
Many studies have shown that BC may be of great importance to Arctic warming (e.g. Bond et al., 2013), and models compare better with ground-based observations in the Arctic than aloft (e.g. Eckhardt et al., 2015; present results). As discussed by Matsui et al. (2018) and indicated from the present work, the representation of particle microphysics, including BC microphysics and scavenging of BC relative to all particles, is critical. There remains a need for focussed airborne studies conducting high-quality and comprehensive measurements of BC microphysics and optical properties in the Arctic. Also, more knowledge of the BC mass absorption coefficient across the particle size spectrum is necessary if BC and its effects on absorption are to be properly assessed.
Relationships among vertically distributed aerosol optical properties (σabs, σsp and SSAs), microphysics and particle chemistry were examined for a region of the Canadian archipelago between 79.9 and 83.4∘ N from near the surface to 500 hPa. The airborne data were collected during April 2015 and combined with ground-based observations from the observatory at Alert, Nunavut, and simulations from the GEOS-Chem–TOMAS model (Kodros et al., 2018) in an effort to increase our knowledge of the effects of BC on absorption. The results were constrained for σsp less than 15 Mm−1, which represent 98 % of the observed σsp, or the longer-lived Arctic haze, in this case.
Large uncertainties in estimating σap and SSAs are associated with this combined data set. Based on observations from the Polar 6 and Alert observatory, the average mass absorption coefficient (MAC) for BC of 18.4 m2g−1 was much higher than the averaged modelled values of 13.6 and 9.1 m2 g−1 (similar to some previous Arctic measurements), representing different internal mixing assumptions discussed by Kodros et al. (2018). The higher MAC value may be due to a number of factors, including underestimation of BC, the presence of small amounts of dust, morphological arrangements of BC components within particles that are inconsistent with the often used core–shell concept and an overestimation of σap by our observations. Due to the uncertainties, we compared σap and SSAs against the modelled results, using the values as measured and using values based on σap∕2, to provide a range consistent with the modelled MAC values.
Measured σabs, rBC and organic material in the particles all increased by close to a factor of 2, going from the surface to 750 hPa. Modelled BC, organics and σap did not reflect the higher measured values in the 600–900 hPa region. The main sources of the differences between modelled and observed optical properties are the differences between the simulated and observed vertical distributions of rBC, organics and sulfate. As discussed, this highlights not only the importance of improving model emissions, deposition and transport processes but also microphysical details.
Assuming absorption overestimation, the SSAs based on the Polar 6 measurements ranged between 0.94 and 0.98, consistent with the results of Brock et al. (2011) and McNaughton et al. (2011). Assuming the measured MAC is reasonable, the SSAs ranged between 0.88 and 0.94, consistent with Schmeisser et al. (2017). The lower σsp (<15 Mm−1) constraint has been shown to yield lower SSA values on average (Targino et al., 2005; Andrews et al., 2011; this work). The relatively high frequency of occurrence of σsp<15 Mm−1 in this region of the Arctic during April makes it important to understand the size distributions and morphology of BC in particles at these lower σsp, the impact of smaller dust concentrations, and to be able to simulate size-distributed wet scavenging of BC.
This work typifies the large uncertainty that exists in our knowledge of the contribution from BC to direct warming of the Arctic atmosphere. It suggests a lower level of confidence in assessing direct absorption by BC and the need for more detailed efforts if the impact of BC on Arctic climate is to be properly established. Those efforts include improved measurements of BC and absorption and more vertical profiles of aerosol chemistry, microphysics and optical properties.
The GEOS-Chem model is available for download at https://github.com/geoschem/geos-chem (GEOS-Chem, 2020).
NETCARE data presented in this publication are publicly available at http://crd-data-donnees-rdc.ec.gc.ca/CCCMA/products/NETCARE/ (Abbatt et al., 2019).
JPDA, WRL and AH conceived and designed the measurements. WRL, JKK and JRP analyzed the measurements and model simulations and wrote the paper with critical feedback from ES, JAO and KvS. MDW, HS, EA, HB, JB, PH, SH, FK, JAO, SS, MS, AKB, JPDA and WRL contributed to collection and quality control of the data. The paper was critically reviewed by all authors.
The authors declare that they have no conflict of interest.
We gratefully acknowledge Kenn Borek Air Ltd., in particular our pilots and crew Garry Murtsell, Neil Traverse and Doug Mackenzie, for their support of our measurements. Logistical and technical support before and during the campaign was provided by a number of contributors, in particular by Desiree Toom (ECCC), Andrew Elford (ECCC), Dan Veber (ECCC), Julia Binder (AWI), Lukas Kandora (AWI), Jens Herrmann (AWI) and Manuel Sellmann (AWI). Extensive logistical and technical support was also provided by Andrew Platt (ECCC), Mike Harwood (ECCC) and Martin Gerhmann (AWI). We are grateful to CFS Alert and Eureka Weather Station for supporting the measurements presented in this work. We thank the reviewers of this paper for their many helpful comments.
NETCARE was funded by the Natural Sciences and Engineering Research Council (NSERC) of Canada under its Climate Change and Atmospheric Research program, with additional financial and in-kind support from Environment and Climate Change Canada (ECCC), Fisheries and Oceans Canada, the Alfred Wegener Institute, the Major Research Project Management Fund at the University of Toronto, and the Deutsche Forschungsgemeinschaft (DFG – German Research Foundation; grant no. 268020496) TRR 172, within the Transregional Collaborative Research Center, “ArctiC Amplification: Climate Relevant Atmospheric and SurfaCe Processes, and Feedback Mechanisms (AC)3”. Colorado State University researchers were supported by the US Department of Energy's Atmospheric System Research (an Office of Science and Office of Biological and Environmental Research program; grant no. DE-SC0011780), the US National Science Foundation under the Atmospheric Chemistry program (grant no. AGS-1559607), and by the US National Oceanic and Atmospheric Administration (an Office of Science and Office of Atmospheric Chemistry, Carbon Cycle, and Climate program; grant no. NA17OAR430001).
This paper was edited by Lynn M. Russell and reviewed by three anonymous referees.
Abbatt, J. P. D., Leaitch, W. R., Aliabadi, A. A., Bertram, A. K., Blanchet, J.-P., Boivin-Rioux, A., Bozem, H., Burkart, J., Chang, R. Y. W., Charette, J., Chaubey, J. P., Christensen, R. J., Cirisan, A., Collins, D. B., Croft, B., Dionne, J., Evans, G. J., Fletcher, C. G., Galí, M., Ghahremaninezhad, R., Girard, E., Gong, W., Gosselin, M., Gourdal, M., Hanna, S. J., Hayashida, H., Herber, A. B., Hesaraki, S., Hoor, P., Huang, L., Hussherr, R., Irish, V. E., Keita, S. A., Kodros, J. K., Köllner, F., Kolonjari, F., Kunkel, D., Ladino, L. A., Law, K., Levasseur, M., Libois, Q., Liggio, J., Lizotte, M., Macdonald, K. M., Mahmood, R., Martin, R. V., Mason, R. H., Miller, L. A., Moravek, A., Mortenson, E., Mungall, E. L., Murphy, J. G., Namazi, M., Norman, A.-L., O'Neill, N. T., Pierce, J. R., Russell, L. M., Schneider, J., Schulz, H., Sharma, S., Si, M., Staebler, R. M., Steiner, N. S., Thomas, J. L., von Salzen, K., Wentzell, J. J. B., Willis, M. D., Wentworth, G. R., Xu, J.-W., and Yakobi-Hancock, J. D.: Overview paper: New insights into aerosol and climate in the Arctic, Atmos. Chem. Phys., 19, 2527–2560, https://doi.org/10.5194/acp-19-2527-2019, 2019 (data available at: http://crd-data-donnees-rdc.ec.gc.ca/CCCMA/products/NETCARE/, last access: 7 September 2020).
Adams, P. J. and Seinfeld, J. H.: Predicting global aerosol size distributions in general circulation models, J. Geophys. Res., 107, 4370, https://doi.org/10.1029/2001JD001010, 2002.
Alvarado, M. J., Lonsdale, C. R., Macintyre, H. L., Bian, H., Chin, M., Ridley, D. A., Heald, C. L., Thornhill, K. L., Anderson, B. E., Cubison, M. J., Jimenez, J. L., Kondo, Y., Sahu, L. K., Dibb, J. E., and Wang, C.: Evaluating model parameterizations of submicron aerosol scattering and absorption with in situ data from ARCTAS 2008, Atmos. Chem. Phys., 16, 9435–9455, https://doi.org/10.5194/acp-16-9435-2016, 2016.
Anderson, T. L. and Ogren, J. A.: Determining aerosol radiative properties using TSI 3563 integrating nephelometer, Aerosol Sci. Tech., 29, 57–69, 1998.
Andrews, E., Ogren, J. A., Bonasoni, P., Marinoni, A., Cuevas, E., Rodriguez, S., Sun, J. Y., Jaffe, D., Fischer, E., Baltensperger, U., Weingartner, E., Collaud Coen, M., Sharma, S., Macdonald, A., Leaitch, W. R., Lin, N.-H., Laj, P., Stamenov, J., Kalapov, I., Jefferson, A., Sheridan, P.: Climatology of aerosol radiative properties in the free troposphere, Atmos. Res., 102, 365-393, https://doi.org/10.1016/j.atmosres.2011.08.017, 2011.
Aryal, R. P., Voss, K. J., Terman, P. A., Keene, W. C., Moody, J. L., Welton, E. J., and Holben, B. N.: Comparison of surface and column measurements of aerosol scattering properties over the western North Atlantic Ocean at Bermuda, Atmos. Chem. Phys., 14, 7617–7629, https://doi.org/10.5194/acp-14-7617-2014, 2014.
Barrie, L. A.: Arctic air pollution: An overview of current knowledge, Atmos. Environ., 20, 643–663, https://doi.org/10.1016/0004-6981(86)90180-0, 1986.
Barrie, L. A. and Hoff, R. M.: Five years of air chemistry observations in the Canadian Arctic, Atmos. Environ., 19, 1995-2010, 1985.
Bigg, E. K.: Comparison of aerosol at four baseline monitoring stations, J. Appl. Meteorol., 19, 521–523, 1980.
Blanchet, J.-P. and List, R.: Estimation of optical properties of Arctic Haze using a numerical model, Atmos.-Ocean, 21, 444–464, 1987.
Bohren, C. F. and Huffman, D. R.: Absorption and scattering of light by small particles, Wiley Interscience, New York, USA, 1983.
Bond, T. C. and Bergstrom, R. W.: Light absorption by carbonaceous particles: an investigative review, Aerosol Sci. Tech., 40, 27–67, 2006.
Bond, T. C., Anderson, T. L., and Campbell, D.: Calibration and intercomparison of filter-based measurements of visible light absorption by aerosols, Aerosol Sci. Tech., 30, 582–600, 1999.
Bond, T. C., Doherty, S. J., Fahey, D. W., Forster, P. M., Berntsen, T., DeAngelo, B. J., Flanner, M. G., Ghan, S., Kärcher, B., Koch, D., Kinne, S., Kondo, Y., Quinn, P. K., Sarofim, M. C., Schultz, M. G., Schulz, M., Venkataraman, C., Zhang, H., Zhang, S., Bellouin, N., Guttikunda, S. K., Hopke, P. K., Jacobson, M. Z., Kaiser, J. W., Klimont, Z., Lohmann, U., Schwarz, J. P., Shindell, D., Storelvmo, T., Warren, S. G., and Zender, C. S.: Bounding the role of black carbon in the climate system: A scientific assessment, J. Geophys. Res.-Atmos., 118, 5380–5552, https://doi.org/10.1002/jgrd.50171, 2013.
Brock, C. A., Cozic, J., Bahreini, R., Froyd, K. D., Middlebrook, A. M., McComiskey, A., Brioude, J., Cooper, O. R., Stohl, A., Aikin, K. C., de Gouw, J. A., Fahey, D. W., Ferrare, R. A., Gao, R.-S., Gore, W., Holloway, J. S., Hübler, G., Jefferson, A., Lack, D. A., Lance, S., Moore, R. H., Murphy, D. M., Nenes, A., Novelli, P. C., Nowak, J. B., Ogren, J. A., Peischl, J., Pierce, R. B., Pilewskie, P., Quinn, P. K., Ryerson, T. B., Schmidt, K. S., Schwarz, J. P., Sodemann, H., Spackman, J. R., Stark, H., Thomson, D. S., Thornberry, T., Veres, P., Watts, L. A., Warneke, C., and Wollny, A. G.: Characteristics, sources, and transport of aerosols measured in spring 2008 during the aerosol, radiation, and cloud processes affecting Arctic Climate (ARCPAC) Project, Atmos. Chem. Phys., 11, 2423–2453, https://doi.org/10.5194/acp-11-2423-2011, 2011.
Clarke, A., McNaughton, C., Kapustin, V., Shinozuka, Y., Howell, S., Dibb, J., Zhou, J., Anderson, B., Brekhovskikh, V., Turner, H., and Pinkerton, M.: Biomass burning and pollution aerosol over North America: Organic components and their influence on spectral optical properties and humidification response, J. Geophys. Res., 112, D12S18, https://doi.org/10.1029/2006JD007777, 2007.
Croft, B., Pierce, J. R., Martin, R. V., Hoose, C., and Lohmann, U.: Uncertainty associated with convective wet removal of entrained aerosols in a global climate model, Atmos. Chem. Phys., 12, 10725–10748, https://doi.org/10.5194/acp-12-10725-2012, 2012.
Delene, D. and Ogren, J. A.: Variability of aerosol optical properties at Four North American Surface Monitoring Sites, J. Atmos. Sci., 59, 1135-1150, 2002.
Düsing, S., Wehner, B., Müller, T., Stöcker, A., and Wiedensohler, A.: The effect of rapid relative humidity changes on fast filter-based aerosol-particle light-absorption measurements: uncertainties and correction schemes, Atmos. Meas. Tech., 12, 5879–5895, https://doi.org/10.5194/amt-12-5879-2019, 2019.
Dymarska, M., Murray, B. J., Sun, L., Eastwood, M. L., Knopf, D. A., and Bertram, A. K.: Deposition ice nucleation on soot at temperatures relevant for the lower troposphere, J. Geophys. Res., 111, D04204, https://doi.org/10.1029/2005JD006627, 2006.
Eckhardt, S., Quennehen, B., Olivié, D. J. L., Berntsen, T. K., Cherian, R., Christensen, J. H., Collins, W., Crepinsek, S., Daskalakis, N., Flanner, M., Herber, A., Heyes, C., Hodnebrog, Ø., Huang, L., Kanakidou, M., Klimont, Z., Langner, J., Law, K. S., Lund, M. T., Mahmood, R., Massling, A., Myriokefalitakis, S., Nielsen, I. E., Nøjgaard, J. K., Quaas, J., Quinn, P. K., Raut, J.-C., Rumbold, S. T., Schulz, M., Sharma, S., Skeie, R. B., Skov, H., Uttal, T., von Salzen, K., and Stohl, A.: Current model capabilities for simulating black carbon and sulfate concentrations in the Arctic atmosphere: a multi-model evaluation using a comprehensive measurement data set, Atmos. Chem. Phys., 15, 9413–9433, https://doi.org/10.5194/acp-15-9413-2015, 2015.
Ferrero, L., Cappelletti, D., Busetto, M., Mazzola, M., Lupi, A., Lanconelli, C., Becagli, S., Traversi, R., Caiazzo, L., Giardi, F., Moroni, B., Crocchianti, S., Fierz, M., Močnik, G., Sangiorgi, G., Perrone, M. G., Maturilli, M., Vitale, V., Udisti, R., and Bolzacchini, E.: Vertical profiles of aerosol and black carbon in the Arctic: a seasonal phenomenology along 2 years (2011–2012) of field campaigns, Atmos. Chem. Phys., 16, 12601–12629, https://doi.org/10.5194/acp-16-12601-2016, 2016.
Fisher, J. A., Jacob, D. J., Wang, Q., Bahreini, R., Carouge, C. C., Cubison, M. J., Dibb, J. E., Diehl, T., Jimenez, J. L., Leibensperger, E. M., Lu, Z., Meinders, M. B. J., Pye, H. O. T., Quinn, P. K., Sharma, S., Streets, D. G., van Donkelaar, A., and Yantosca, R. M.: Sources, distribution, and acidity of sulfate-ammonium aerosol in the Arctic in winter-spring, Atmos. Environ., 45, 7301–7318, https://doi.org/10.1016/j.atmosenv.2011.08.030, 2011.
Flanner, M., Zender, C., Randerson, J., and Rasch, P.: Present-day climate forcing and response from black carbon in snow, J. Geophys. Res., 112, D11202, https://doi.org/10.1029/2006JD008003, 2007.
GEOS-Chem: GEOS-Chem model, available at: https://github.com/geoschem/geos-chem, last access: 1 September 2020.
Gysel, M., Laborde, M., Olfert, J. S., Subramanian, R., and Gröhn, A. J.: Effective density of Aquadag and fullerene soot black carbon reference materials used for SP2 calibration, Atmos. Meas. Tech., 4, 2851–2858, https://doi.org/10.5194/amt-4-2851-2011, 2011.
Hallar, A. G., Petersen, R., Andrews, E., Michalsky, J., McCubbin, I. B., and Ogren, J. A.: Contributions of dust and biomass burning to aerosols at a Colorado mountain-top site, Atmos. Chem. Phys., 15, 13665–13679, https://doi.org/10.5194/acp-15-13665-2015, 2015.
Hansen, J. and Nazarenko, L.: Soot climate forcing via snow and ice albedos, P. Natl. Acad. Sci. USA, 101, 423–428, https://doi.org/10.1073/pnas.2237157100, 2004.
Hansen, A. D. A. and Novakov, T.: Aerosol black carbon measurements in the Arctic haze during AGASP-II, J. Atmos. Chem., 9, 347–361, 1989.
Hansen, A. D. A. and Rosen, H.: Vertical distribution of particulate carbon, sulfur, and bromine in the Arctic haze and comparison with ground-level measurements at Barrow, Alaska, Geophys. Res. Lett., 11, 381–384, 1984.
Hansen, A. D. A. and Rosen, H.: Horizontal inhomogeneities in the particulate carbon component of the Arctic haze, Atmos. Environ., 19, 2175–2180, 1985.
Hansen, A. D. A., Polissar, A. V., Schnell, R. C.: Airborne aerosol and black carbon measurements over the East Siberian Sea, spring 1992, Atmos. Res., 44, 153–166, 1997.
Heidam, N. Z., Wåhlin, P., and Christensen, J. H.: Tropospheric gases and aerosols in northeast Greenland, J. Atmos. Sci., 56, 261–278, 1999.
Heintzenberg, J.: Particle size distribution and optical properties-of Arctic haze, Tellus, 32, 251–260, 1980.
Hess, M., Koepke, P., and Schult, I.: Optical Properties of Aerosols and Clouds: The software package OPAC, B. Am. Meteorol. Soc., 79, 831–844, https://doi.org/10.1175/1520-0477(1998)079<0831:OPOAAC>2.0.CO;2, 1998.
Hirdman, D., Burkhart, J. F., Sodemann, H., Eckhardt, S., Jefferson, A., Quinn, P. K., Sharma, S., Ström, J., and Stohl, A.: Long-term trends of black carbon and sulphate aerosol in the Arctic: changes in atmospheric transport and source region emissions, Atmos. Chem. Phys., 10, 9351–9368, https://doi.org/10.5194/acp-10-9351-2010, 2010.
Holmgren, B., Shaw G. E., and Weller, G.: Turbidity in the Arctic atmosphere, AIDJEX Bull., 27, 135–148, 1974.
Jaeglé, L., Quinn, P. K., Bates, T. S., Alexander, B., and Lin, J.-T.: Global distribution of sea salt aerosols: new constraints from in situ and remote sensing observations, Atmos. Chem. Phys., 11, 3137–3157, https://doi.org/10.5194/acp-11-3137-2011, 2011.
Janssens-Maenhout, G., Crippa, M., Guizzardi, D., Dentener, F., Muntean, M., Pouliot, G., Keating, T., Zhang, Q., Kurokawa, J., Wankmüller, R., Denier van der Gon, H., Kuenen, J. J. P., Klimont, Z., Frost, G., Darras, S., Koffi, B., and Li, M.: HTAP_v2.2: a mosaic of regional and global emission grid maps for 2008 and 2010 to study hemispheric transport of air pollution, Atmos. Chem. Phys., 15, 11411–11432, https://doi.org/10.5194/acp-15-11411-2015, 2015.
Kahnert, M.: On the discrepancy between modeled and measured Mass absorption cross sections of light Absorbing carbon Aerosols, Aerosol Sci. Tech., 44, 453–460, https://doi.org/10.1080/02786821003733834, 2010.
Kim, J., Bauer, H., Dobovičnik, T., Hitzenberger, R., Lottin, D., Ferry, D., and Petzold, A.: Assessing optical properties and refractive index of combustion aerosol particles through combined experimental and modeling Studies, Aerosol Sci. Tech., 49, 340–350, https://doi.org/10.1080/02786826.2015.1020996, 2015.
Klimont, Z., Kupiainen, K., Heyes, C., Purohit, P., Cofala, J., Rafaj, P., Borken-Kleefeld, J., and Schöpp, W.: Global anthropogenic emissions of particulate matter including black carbon, Atmos. Chem. Phys., 17, 8681–8723, https://doi.org/10.5194/acp-17-8681-2017, 2017.
Kodros, J. K., Hanna, S. J., Bertram, A. K., Leaitch, W. R., Schulz, H., Herber, A. B., Zanatta, M., Burkart, J., Willis, M. D., Abbatt, J. P. D., and Pierce, J. R.: Size-resolved mixing state of black carbon in the Canadian high Arctic and implications for simulated direct radiative effect, Atmos. Chem. Phys., 18, 11345–11361, https://doi.org/10.5194/acp-18-11345-2018, 2018.
Kopke, P., Hess, M., Schult, I., and Shettle, E. P.: Global aerosol data set, Max Planck Inst. für Meteorol., Hamburg, Germany, available at: http://hdl.handle.net/10068/256361 (last access: 31 August 2020), 1997.
Kopp, R. E. and Mauzerall, D. L.: Assessing the climatic benefits of black carbon mitigation, P. Natl. Acad. Sci. USA, 107, 11703–11708, https://doi.org/10.1073/pnas.0909605107, 2010.
Laborde, M., Mertes, P., Zieger, P., Dommen, J., Baltensperger, U., and Gysel, M.: Sensitivity of the Single Particle Soot Photometer to different black carbon types, Atmos. Meas. Tech., 5, 1031–1043, https://doi.org/10.5194/amt-5-1031-2012, 2012.
Lack, D. A., Cappa, C. D., Covert, D. S., Baynard, T., Massoli, P., Sierau, B., Bates, T. S., Quinn, P. K., Lovejoy, E. R., and Ravishankara, A. R.: Bias in filter-based aerosol light absorption measurements due to organic aerosol loading: Evidence from ambient measurements, Aerosol Sci. Tech., 42, 1033–1041, 2008.
Law, K. S. and Stohl, A.: Arctic air pollution: origins and impacts, Science, 315, 1537–1540, 2007.
Leaitch, W. R., Hoff, R. M., and MacPherson, J. I.: Airborne and lidar measurements of aerosol and cloud particles in the troposphere over Alert Canada in April 1986, J. Atmos. Chem., 9, 187–211, 1989.
Leaitch, W. R., Sharma, S., Huang, L., Macdonald, A. M., Toom-Sauntry, D., Chivulescu, A. , von Salzen, K., Pierce, J. R., Shantz, N. C., Bertram, A., Schroder, J. , Norman, A.-L., and Chang, R. Y.-W.: Dimethyl sulphide control of the clean summertime Arctic aerosol and cloud, Elementa, 1, 000017, https://doi.org/10.12952/journal.elementa.000017, 2013.
Leaitch, W. R., Russell, L. M., Liu, J., Kolonjari, F., Toom, D., Huang, L., Sharma, S., Chivulescu, A., Veber, D., and Zhang, W.: Organic functional groups in the submicron aerosol at 82.5∘ N, 62.5∘ W from 2012 to 2014, Atmos. Chem. Phys., 18, 3269–3287, https://doi.org/10.5194/acp-18-3269-2018, 2018.
Lee, Y. H. and Adams, P. J.: A fast and efficient version of the TwO-Moment Aerosol Sectional (TOMAS) global aerosol microphysics model, Aerosol Sci. Tech., 46, 678–689, https://doi.org/10.1080/02786826.2011.643259, 2012.
Lee, Y. H., Pierce, J. R., and Adams, P. J.: Representation of nucleation mode microphysics in a global aerosol model with sectional microphysics, Geosci. Model Dev., 6, 1221–1232, https://doi.org/10.5194/gmd-6-1221-2013, 2013.
Leighton, H.: Influence of the Arctic Haze on the solar radiation budget, Atmos. Environ., 17, 2065–2068, 1983.
Liu, F., Yon, J., Fuentes, A., Lobo, P., Smallwood, G. J., and Corbin, J. C.: Review of recent literature on the light absorption properties of black carbon: Refractive index, mass absorption cross section, and absorption function, Aerosol Sci. Tech., 54, 33–51, https://doi.org/10.1080/02786826.2019.1676878, 2020.
Mahmood, R., Salzen, K., Flanner, M., Sand, M., Langner, J., Wang, H., and Huang, L.: Seasonality of global and Arctic black carbon processes in the Arctic Monitoring and Assessment Programme models, J. Geophys. Res.-Atmos., 121, 7100–7116, 2016.
Markowicz, K. M., Ritter, C., Lisoka, J., Makuch, P., Stachlewska, S., Cappelletti, D., Mazzola, M., and Chilinski, M. T.: Vertical variability of aerosol single-scattering albedo and equivalent black carbon concentration based on in-situ and remote sensing techniques during the iAREA campaigns in Ny-Ålesund, Atmos. Environ., 164, 431–447, https://doi.org/10.1016/j.atmosenv.2017.06.014, 2017.
Mason, B., Wagner, N. L., Adler, G., Andrews, E., Brock, C. A., Gordon, T. D., Lack, D. A., Perring, A. E., Richardson, M. S., Schwarz, J. P., Shook, M. A., Thornhill, K. L., Ziembad, L. D., and Murphy, D. M.: An intercomparison of aerosol absorption measurements conducted during the SEAC4RS campaign, Aerosol Sci. Tech., 52, 1012–1027, https://doi.org/10.1080/02786826.2018.1500012, 2018.
Matsui, H., Hamilton, D. S., and Mahowald, N. M.: Black carbon radiative effects highly sensitive to emitted particle size when resolving mixing-state diversity, Nat. Commun., 9, 3446, https://doi.org/10.1038/s41467-018-05635-1, 2018.
McConnell, J. R., Edwards, E., Kok, G. L., Flanner, M. G., Zender, C. S., Saltzman, E. S., Banta, J. R., Pasteris, D. R., Carter, M. M., and Kahl, J. D.: 20th-century industrial black carbon emissions altered Arctic climate, Science, 317, 1381–1384, 2007.
McNaughton, C. S., Clarke, A. D., Freitag, S., Kapustin, V. N., Kondo, Y., Moteki, N., Sahu, L., Takegawa, N., Schwarz, J. P., Spackman, J. R., Watts, L., Diskin, G., Podolske, J., Holloway, J. S., Wisthaler, A., Mikoviny, T., de Gouw, J., Warneke, C., Jimenez, J., Cubison, M., Howell, S. G., Middlebrook, A., Bahreini, R., Anderson, B. E., Winstead, E., Thornhill, K. L., Lack, D., Cozic, J., and Brock, C. A.: Absorbing aerosol in the troposphere of the Western Arctic during the 2008 ARCTAS/ARCPAC airborne field campaigns, Atmos. Chem. Phys., 11, 7561–7582, https://doi.org/10.5194/acp-11-7561-2011, 2011.
Mitchell, M.: Visual range in the polar regions with particular reference to the Alaskan Arctic, J. Atmos. Terr. Phys., Special Supplement, 195–211, 1956.
Moteki, N. and Kondo, Y.: Effects of mixing state on black carbon measurements by laser-induced incandescence, Aerosol Sci. Tech., 41, 398–417, https://doi.org/10.1080/02786820701199728, 2007.
Moteki, N. and Kondo, Y.: Dependence of laser-induced incandescence on physical properties of black carbon aerosols: measurements and theoretical interpretation, Aerosol Sci. Tech., 44, 663–675, https://doi.org/10.1080/02786826.2010.484450, 2010.
Najafi, M. R., Zwiers, F. W., and Gillett, N. P.: Attribution of Arctic temperature change to greenhouse-gas and aerosol influences, Nat. Clim. Change, 5, 246–249, https://doi.org/10.1038/nclimate2524, 2015.
Navarro, J. C. A., Varma, V., Riipinen, I., Seland, Ø., Kirkevåg, A., Struthers, H., Iversen, T., Hansson, H.-C., and Ekman, A. M. L.: Amplification of Arctic warming by past air pollution reductions in Europe, Nat. Geosci., 9, 277–281, https://doi.org/10.1038/ngeo2673, 2016.
Ogren, J. A.: Comment on “Calibration and intercomparison of filter-based measurements of visible light absorption by aerosols”, Aerosol Sci. Tech., 44, 589–591, https://doi.org/10.1080/02786826.2010.482111, 2010.
Ogren, J. A., Wendell, J., Andrews, E., and Sheridan, P. J.: Continuous light absorption photometer for long-term studies, Atmos. Meas. Tech., 10, 4805–4818, https://doi.org/10.5194/amt-10-4805-2017, 2017.
Pluchino, A. B., Goldberg, S. S., Dowling, J. M., and Randall, C. M: Refractive index measurements of single micron-sized carbon particles, Appl. Optics, 19, 3370–3372, 1980.
Pueschel, R. F. and Kinne, S. A.: Physical and radiative properties of Arctic atmospheric aerosols, Sci. Total Environ., 161, 811–824, 1995.
Qi, L., Li, Q., Henze, D. K., Tseng, H.-L., and He, C.: Sources of springtime surface black carbon in the Arctic: an adjoint analysis for April 2008, Atmos. Chem. Phys., 17, 9697–9716, https://doi.org/10.5194/acp-17-9697-2017, 2017.
Quinn, P. K., Bates, T. S., Baum, E., Doubleday, N., Fiore, A. M., Flanner, M., Fridlind, A., Garrett, T. J., Koch, D., Menon, S., Shindell, D., Stohl, A., and Warren, S. G.: Short-lived pollutants in the Arctic: their climate impact and possible mitigation strategies, Atmos. Chem. Phys., 8, 1723–1735, https://doi.org/10.5194/acp-8-1723-2008, 2008.
Quinn, P. K., Bates, T. S., Schulz, K., and Shaw, G. E.: Decadal trends in aerosol chemical composition at Barrow, Alaska: 1976–2008, Atmos. Chem. Phys., 9, 8883–8888, https://doi.org/10.5194/acp-9-8883-2009, 2009.
Radke, L. F., Lyons, J. H., Hegg, D. A., Hobbs, P. V., and Bailey, I. H.: Airborne observations of Arctic aerosols-I. Characteristics of Arctic haze, Geophys. Res. Lett., 11, 393–396, 1984.
Rahn, K. A.: The Arctic air-sampling network in 1980, Atmos. Environ., 15, 1349–1352, 1981.
Rahn, K. A., Boyrs, R., and Shaw, G. E.: The Asian source of Arctic haze bands, Nature, 268, 713–715, 1977.
Russell, P. B., Bergstrom, R. W., Shinozuka, Y., Clarke, A. D., DeCarlo, P. F., Jimenez, J. L., Livingston, J. M., Redemann, J., Dubovik, O., and Strawa, A.: Absorption Angstrom Exponent in AERONET and related data as an indicator of aerosol composition, Atmos. Chem. Phys., 10, 1155–1169, https://doi.org/10.5194/acp-10-1155-2010, 2010.
Samset, B. H., Myhre, G., Schulz, M., Balkanski, Y., Bauer, S., Berntsen, T. K., Bian, H., Bellouin, N., Diehl, T., Easter, R. C., Ghan, S. J., Iversen, T., Kinne, S., Kirkevåg, A., Lamarque, J.-F., Lin, G., Liu, X., Penner, J. E., Seland, Ø., Skeie, R. B., Stier, P., Takemura, T., Tsigaridis, K., and Zhang, K.: Black carbon vertical profiles strongly affect its radiative forcing uncertainty, Atmos. Chem. Phys., 13, 2423–2434, https://doi.org/10.5194/acp-13-2423-2013, 2013.
Sand, M., Berntsen, T. K., von Salzen, K., Flanner, M. G., Langner, J., and Victor, D. G: Response of the Arctic temperature to changes in emissions of short-lived climate forcers, Nat. Clim. Chang., 6, 286–289, https://doi.org/10.1038/nclimate2880, 2016.
Schacht, J., Heinold, B., Quaas, J., Backman, J., Cherian, R., Ehrlich, A., Herber, A., Huang, W. T. K., Kondo, Y., Massling, A., Sinha, P. R., Weinzierl, B., Zanatta, M., and Tegen, I.: The importance of the representation of air pollution emissions for the modeled distribution and radiative effects of black carbon in the Arctic, Atmos. Chem. Phys., 19, 11159–11183, https://doi.org/10.5194/acp-19-11159-2019, 2019.
Schmeisser, L., Backman, J., Ogren, J. A., Andrews, E., Asmi, E., Starkweather, S., Uttal, T., Fiebig, M., Sharma, S., Eleftheriadis, K., Vratolis, S., Bergin, M., Tunved, P., and Jefferson, A.: Seasonality of aerosol optical properties in the Arctic, Atmos. Chem. Phys., 18, 11599–11622, https://doi.org/10.5194/acp-18-11599-2018, 2018.
Schnell, R. C. and Raatz, W. E.: Vertical and horizontal characteristics of Arctic hare during AGASP; Alaskan Arctic, Geophys. Res. Lett., 11, 369–376, 1984.
Schulz, H., Zanatta, M., Bozem, H., Leaitch, W. R., Herber, A. B., Burkart, J., Willis, M. D., Kunkel, D., Hoor, P. M., Abbatt, J. P. D., and Gerdes, R.: High Arctic aircraft measurements characterising black carbon vertical variability in spring and summer, Atmos. Chem. Phys., 19, 2361–2384, https://doi.org/10.5194/acp-19-2361-2019, 2019.
Schwarz, J. P., Spackman, J. R., Gao, R. S., Watts, L. A., Stier, P., Schulz, M., Davis, S. M., Wofsy, S. C., and Fahey, D. W.: Global-scale black carbon profiles observed in the remote atmosphere and compared to models, Geophys. Res. Lett., 37, L18812, https://doi.org/10.1029/2010GL044372, 2010.
Sirois, A. and Barrie, L. A.: Arctic lower tropospheric aerosol trends and composition at Alert, Canada: 1980–1995, J. Geophys. Res., 104, 11599–11618, https://doi.org/10.1029/1999JD900077, 1999.
Sharma, S., Lavoue, D., Cachier, H., Barrie, L. A., and Gong, S. L.: Long-term trends of the black carbon concentrations in the Canadian Arctic, J. Geophys. Res., 109, D15203, https://doi.org/10.1029/2003JD004331, 2004.
Sharma, S., Andrews, E., Barrie, L. A., Ogren, J. A., and Lavoué, D.: Variations and sources of the equivalent black carbon in the high Arctic revealed by long-term observations at Alert and Barrow: 1989–2003, J. Geophys. Res., 111, D14208, https://doi.org/10.1029/2005JD006581, 2006.
Sharma, S., Ishizawa, M., Chan, D., Lavoué, D., Andrews, E., Eleftheriadis, K., and Maksyutov, S.: 16-Year simulation of Arctic black carbon: Transport, source contribution, and sensitivity analysis on deposition, J. Geophys. Res., 118, 943–964, https://doi.org/10.1029/2012JD017774, 2013.
Sharma, S., Leaitch, W. R., Huang, L., Veber, D., Kolonjari, F., Zhang, W., Hanna, S. J., Bertram, A. K., and Ogren, J. A.: An evaluation of three methods for measuring black carbon in Alert, Canada, Atmos. Chem. Phys., 17, 15225–15243, https://doi.org/10.5194/acp-17-15225-2017, 2017.
Sharma, S., Barrie, L. A., Magnusson, E., Brattström, G., Leaitch, W. R., Steffen, A., and Landsberger, S.: A factor and trends analysis of multidecadal lower tropospheric observations of Arctic aerosol composition, black carbon, ozone, and mercury at Alert, Canada, J. Geophys. Res.-Atmos., 124, 14133–14161, https://doi.org/10.1029/2019JD030844, 2019.
Shaw, G. E.: Evidence for a central Eurasian source area of Arctic haze in Alaska, Nature, 299, 815–818, 1983.
Sherman, J. P., Sheridan, P. J., Ogren, J. A., Andrews, E., Hageman, D., Schmeisser, L., Jefferson, A., and Sharma, S.: A multi-year study of lower tropospheric aerosol variability and systematic relationships from four North American regions, Atmos. Chem. Phys., 15, 12487–12517, https://doi.org/10.5194/acp-15-12487-2015, 2015.
Shindell, D. and Faluvegi, G.: Climate response to regional radiative forcing in the twentieth century, Nat. Geosci., 2, 294–300, https://doi.org/10.1038/NGEO473, 2009.
Sinha, P. R., Kondo, Y., Koike, M., Ogren, J. A., Jefferson, A., Barrett, T. E., Sheesley, R. J., Ohata, S., Moteki, N., Coe, H., Liu, D., Irwin, M., Tunved, P., Quinn, P. K., and Zhao, Y.: Evaluation of ground-based black carbon measurements by filter-based photometers at two Arctic sites, J. Geophys. Res.-Atmos., 122, 3544–3572, https://doi.org/10.1002/2016JD025843, 2017.
Slowik, J. G., Cross, E. S., Han, J.-H., Davidovits, P., Onasch, T. B., Jayne, J. T., Williams, L. R., Canagaratna, M. R., Worsnop, D. R., Chakrabarty, R. K., Moosmüller, H., Arnott, W. P., Schwarz, J. P., Gao, R.-S., Fahey, D. W., Kok, G. L., and Petzold, A.: An inter-comparison of instruments measuring black carbon content of soot particles, Aerosol Sci. Tech., 41, 295–314, https://doi.org/10.1080/02786820701197078, 2007.
Sobhani, N., Kulkarni, S., and Carmichael, G. R.: Source sector and region contributions to black carbon and PM2.5 in the Arctic, Atmos. Chem. Phys., 18, 18123–18148, https://doi.org/10.5194/acp-18-18123-2018, 2018.
Spackman, J. R., Gao, R. S., Neff, W. D., Schwarz, J. P., Watts, L. A., Fahey, D. W., Holloway, J. S., Ryerson, T. B., Peischl, J., and Brock, C. A.: Aircraft observations of enhancement and depletion of black carbon mass in the springtime Arctic, Atmos. Chem. Phys., 10, 9667–9680, https://doi.org/10.5194/acp-10-9667-2010, 2010.
Staebler, R. M., den Hartog, G., Georgi, B., and Düsterdiek, T.: Aerosol size distributions in Arctic haze during the POLAR Sunrise Experiment 1992, J. Geophys. Res., 99, 25429–25437, 1994.
Stohl, A., Aamaas, B., Amann, M., Baker, L. H., Bellouin, N., Berntsen, T. K., Boucher, O., Cherian, R., Collins, W., Daskalakis, N., Dusinska, M., Eckhardt, S., Fuglestvedt, J. S., Harju, M., Heyes, C., Hodnebrog, Ø., Hao, J., Im, U., Kanakidou, M., Klimont, Z., Kupiainen, K., Law, K. S., Lund, M. T., Maas, R., MacIntosh, C. R., Myhre, G., Myriokefalitakis, S., Olivié, D., Quaas, J., Quennehen, B., Raut, J.-C., Rumbold, S. T., Samset, B. H., Schulz, M., Seland, Ø., Shine, K. P., Skeie, R. B., Wang, S., Yttri, K. E., and Zhu, T.: Evaluating the climate and air quality impacts of short-lived pollutants, Atmos. Chem. Phys., 15, 10529–10566, https://doi.org/10.5194/acp-15-10529-2015, 2015.
Targino, A. C., Noone, K. J., and Ostrom, E.: Airborne in-situ characterization of dry aerosol optical properties in a multisource influenced marine region, Tellus B, 57, 247–260, 2005.
Valero, F. P. J., Ackerman, T. P., and Gore, J. Y.: The absorption of solar radiation by the Arctic atmosphere during the haze season and its effects on the radiation balance, Geophys. Res. Lett., 11, 465–468, 1984.
Valero, F. P. J., Ackerman, T. P., and Gore, W. J. R.: The effects of the arctic haze as determined from airborne radiometric measurements during AGASP II, J. Atmos. Chem., 9, 225–244, 1989.
van Donkelaar, A., Martin, R. V., Leaitch, W. R., Macdonald, A. M., Walker, T. W., Streets, D. G., Zhang, Q., Dunlea, E. J., Jimenez, J. L., Dibb, J. E., Huey, L. G., Weber, R., and Andreae, M. O.: Analysis of aircraft and satellite measurements from the Intercontinental Chemical Transport Experiment (INTEX-B) to quantify long-range transport of East Asian sulfur to Canada, Atmos. Chem. Phys., 8, 2999–3014, https://doi.org/10.5194/acp-8-2999-2008, 2008.
Wiedinmyer, C., Akagi, S. K., Yokelson, R. J., Emmons, L. K., Al-Saadi, J. A., Orlando, J. J., and Soja, A. J.: The Fire INventory from NCAR (FINN): a high resolution global model to estimate the emissions from open burning, Geosci. Model Dev., 4, 625–641, https://doi.org/10.5194/gmd-4-625-2011, 2011.
Willis, M. D., Bozem, H., Kunkel, D., Lee, A. K. Y., Schulz, H., Burkart, J., Aliabadi, A. A., Herber, A. B., Leaitch, W. R., and Abbatt, J. P. D.: Aircraft-based measurements of High Arctic springtime aerosol show evidence for vertically varying sources, transport and composition, Atmos. Chem. Phys., 19, 57–76, https://doi.org/10.5194/acp-19-57-2019, 2019.
Wofsy, S. C.: The HIPPO science team and cooperating modellers and satellite teams: HIAPER Pole-to-Pole Observations (HIPPO): fine-grained, global-scale measurements of climatically important atmospheric gases and aerosols, Philos. T. R. Soc. A, 369, 2073–2086, https://doi.org/10.1098/rsta.2010.0313, 2011.
Xu, J.-W., Martin, R. V., Morrow, A., Sharma, S., Huang, L., Leaitch, W. R., Burkart, J., Schulz, H., Zanatta, M., Willis, M. D., Henze, D. K., Lee, C. J., Herber, A. B., and Abbatt, J. P. D.: Source attribution of Arctic black carbon constrained by aircraft and surface measurements, Atmos. Chem. Phys., 17, 11971–11989, https://doi.org/10.5194/acp-17-11971-2017, 2017.
Yu, H., Li, W., Zhang, Y., Tunved, P., Dall'Osto, M., Shen, X., Sun, J., Zhang, X., Zhang, J., and Shi, Z.: Organic coating on sulfate and soot particles during late summer in the Svalbard Archipelago, Atmos. Chem. Phys., 19, 10433–10446, https://doi.org/10.5194/acp-19-10433-2019, 2019.
Zanatta, M., Laj, P., Gysel, M., Baltensperger, U., Vratolis, S., Eleftheriadis, K., Kondo, Y., Dubuisson, P., Winiarek, V., Kazadzis, S., Tunved, P., and Jacobi, H.-W.: Effects of mixing state on optical and radiative properties of black carbon in the European Arctic, Atmos. Chem. Phys., 18, 14037–14057, https://doi.org/10.5194/acp-18-14037-2018, 2018.
Zender, C. S.: Mineral Dust Entrainment and Deposition (DEAD) model: Description and 1990s dust climatology, J. Geophys. Res., 108, 4416, https://doi.org/10.1029/2002JD002775, 2003.
Zobrist, B., Marcolli, C., Pedernera, D. A., and Koop, T.: Do atmospheric aerosols form glasses?, Atmos. Chem. Phys., 8, 5221–5244, https://doi.org/10.5194/acp-8-5221-2008, 2008.