the Creative Commons Attribution 4.0 License.
the Creative Commons Attribution 4.0 License.
 | 04 Sep 2020
Quantifying burning efficiency in megacities using the NO2∕CO ratio from the Tropospheric Monitoring Instrument (TROPOMI)
Srijana Lama
Sander Houweling
K. Folkert Boersma
Henk Eskes
Ilse Aben
Hugo A. C. Denier van der Gon
Maarten C. Krol
Han Dolman
Tobias Borsdorff
Alba Lorente
This study investigates the use of co-located nitrogen dioxide (NO2) and carbon monoxide (CO) retrievals from the TROPOMI satellite to improve the quantification of burning efficiency and emission factors (EFs) over the megacities of Tehran, Mexico City, Cairo, Riyadh, Lahore, and Los Angeles. Efficient combustion is characterized by high NOx (NO+NO2) and low CO emissions, making the NO2∕CO ratio a useful proxy for combustion efficiency (CE). The local enhancement of CO and NO2 above megacities is well captured by TROPOMI at short averaging times compared with previous satellite missions. In this study, the upwind background and plume rotation methods are used to investigate the accuracy of satellite-derived ΔNO2∕ΔCO ratios. The column enhancement ratios derived using these two methods vary by 5 % to 20 % across the selected megacities. TROPOMI-derived column enhancement ratios are compared with emission ratios from the EDGAR v4.3.2 (Emission Database for Global Atmospheric Research v4.3.2) and the MACCity (Monitoring Atmospheric Chemistry and Climate and CityZen) 2018 emission inventories. TROPOMI correlates strongly (r=0.85 and 0.7) with EDGAR and MACCity, showing the highest emission ratio for Riyadh and lowest emission ratio for Lahore. However, inventory-derived emission ratios are 60 % to 85 % higher than TROPOMI column enhancement ratios across the six megacities. The short lifetime of NO2 and the different vertical sensitivity of TROPOMI NO2 and CO explain most of this difference. We present a method to translate TROPOMI-retrieved column enhancement ratios into corresponding emission ratios, thereby accounting for these influences. Except for Los Angeles and Lahore, TROPOMI-derived emission ratios are close (within 10 % to 25 %) to MACCity values. For EDGAR, however, emission ratios are ∼65 % higher for Cairo and 35 % higher for Riyadh. For Los Angeles, EDGAR and MACCity are a factor of 2 and 3 higher than TROPOMI respectively. The air quality monitoring networks in Los Angeles and Mexico City are used to validate the use of TROPOMI. For Mexico City and Los Angeles, these measurements are consistent with TROPOMI-derived emission ratios, demonstrating the potential of TROPOMI with respect to monitoring burning efficiency.
- Article
(2262 KB) - Full-text XML
-
Supplement
(2202 KB) - BibTeX
- EndNote


Rapid urbanization and economic growth in developing countries has led to a strong increase in urban air pollution (Pommier et al., 2013; United Nations, 2018). In the South Asian cities of Kabul and Dhaka, for instance, nitrogen dioxide (NO2) increases in the order of 10 % yr−1 have been reported (Schneider et al., 2015). In New Delhi, emissions of carbon monoxide (CO) increased by 22.4 % from 2000 to 2008 (Jiang et al., 2017). In European countries, in contrast, the use of modern technology and other air pollution abatement measures decreased NO2 concentrations by 10 % to 50 % between 2004 and 2010 (Castellanos and Boersma, 2012) and decreased CO concentrations by 35 % between 2002 and 2011 (Guerreiro et al., 2014). Thus, to develop effective air pollution control strategies, accurate information on local emission sources and combustion processes is important (Borsdorff et al., 2018a; Ma and van Aardenne, 2004). However, developing countries and remote areas lack the local infrastructure needed to obtain detailed information about factors such as energy consumption, fuel type, and technology. Limited process information contributes greatly to the uncertainty in emission inventories (Silva and Arellano, 2017). For example, the range of uncertainty in the Chinese NOx and CO emissions between 2005 and 2008 has been estimated to range from −20 % to +45 % due to inadequate information about fuel consumption and uncertain emission factors (Zhao et al., 2011, 2012). In the global emission inventory EDGAR v4.3.2, uncertainties in regional emissions have been estimated to range from 17 % to 69 % for NOx and from 25 % to 64 % for CO (Crippa et al., 2016). In this study, we investigate the use of satellite remote sensing to improve the emission quantification for these important air pollutants.
In global emission inventories, combustion-related emissions are computed as the product of the amount of fuel burned (activity data) and the composition of the emissions as represented by the emission factor (EF; Vallero, 2007). EFs depend strongly on the burning conditions (Sinha et al., 2003; Ward et al., 1996; Yokelson et al., 2003), in particular on the combustion efficiency (CE). The CE is defined as the fraction of reduced carbon in the fuel that is directly converted into CO2 (Yokelson et al., 1996). Usually, EFs are measured in laboratories under controlled burning conditions. However, in the ambient environment, combustion conditions are highly variable (Andreae and Merlet, 2001; Korontzi et al., 2003) and, therefore, introduce large uncertainties into global emission inventories through the impact of the CE on the EF. A case study (Frey and Zheng, 2002) on NOx emission estimates from coal-fired power plants with dry-bottom wall-fired boilers using low NOx burners showed that the EF for NOx can vary by a factor of 4 or more within a same technology. Thus, the application of mean EFs introduces uncertainties in the range of −29 % to +35 % with respect to mean emission estimates (Frey and Zheng, 2002). Fuel type, fuel composition, combustion practices, and technology are the main factors influencing the CE in the ambient environment (Silva and Arellano, 2017; Tang et al., 2019). To improve the accuracy of global inventories, a better quantification of the CE and EFs is needed.
In recent years, the availability of atmospheric composition measurements from Earth-orbiting satellites has strongly improved. Sensors such as the Scanning Imaging Absorption spectroMeter for Atmospheric Chartography (SCIAMACHY; Bovensmann et al., 1999) and the Tropospheric Monitoring Instrument (TROPOMI; Veefkind et al., 2012) deliver global datasets of multiple species. The satellite observations from SCIAMACHY have been used in combination with inverse modelling techniques to test and improve emission inventories (Konovalov et al., 2014; Mijling and van der A, 2012; Reuter et al., 2014; Silva et al., 2013). By combining observations of different species (e.g. CO, CO2, and NO2), information about common sources and, potentially, information about emission ratios is obtained (Hakkarainen et al., 2015; Miyazaki et al., 2017; Reuter et al., 2019; Silva and Arellano, 2017).
In this study, measurements from TROPOMI are used to investigate the burning efficiency in megacities. TROPOMI is a push-broom grating spectrometer on board Sentinel-5 Precursor (S5P), which was launched by ESA on 13 October 2017 (Veefkind et al., 2012). We use the ratio of the TROPOMI-retrieved tropospheric column of NO2 and the total column of CO, which is formally not equivalent to the CE but can nevertheless serve as a useful proxy of the burning conditions (Silva and Arellano, 2017; Tang and Arellano, 2017). The reason for this is that the NOx emission increases with combustion temperature, which is high during efficient combustion. In contrast, CO is a product of incomplete combustion and is produced when the CE is low (Flagan and Seinfeld, 1988). The combination of these effects makes the NO2∕CO ratio highly sensitive to the CE. To correct for differences in the NO2 and CO background concentrations, the enhancement ratio ΔNO2∕ΔCO is used. Here ΔNO2 and ΔCO represent concentration increases compared with their respective backgrounds.
The ΔNO2∕ΔCO ratio is insensitive to atmospheric transport, as NO2 and CO emissions are dispersed in a similar manner by the wind. Therefore, the impact of transport cancels out in the ratio. Consequently, TROPOMI-observed ratios close to emissions sources can be directly related to emission ratios. The aim of this study is to investigate the local relation between TROPOMI-retrieved ΔNO2∕ΔCO ratios and emission ratios in a quantitative manner, focusing on megacities that show significant concentration enhancements in the TROPOMI data. In past studies, NO2 from the Ozone Monitoring Instrument (OMI) and CO from the Measurement of Pollution in the Troposphere (MOPITT) instrument have been used to derive CO∕NO2 ratios (Silva and Arellano, 2017; Tang and Arellano, 2017). MOPITT also has a short-wave infrared (SWIR) channel (or near IR), and the multispectral (thermal infrared/near-infrared, TIR/NIR) product, with near-surface sensitivity over some land regions, was used in both Silva and Arellano (2017) and Tang and Arellano (2017). TROPOMI provides a unique opportunity to measure CO and NO2 using the same instrument at an unprecedented high spatial resolution (7×7 km2 at nadir) and daily global coverage (Borsdorff et al., 2018b; van Geffen et al., 2019), making this instrument ideally suited for the investigation of NO2∕CO ratios from space. Additionally, TROPOMI CO retrievals make use of the SWIR, improving the sensitivity to surface emissions of CO compared with the TIR sounders, MOPITT and the Infrared Atmospheric Sounding Interferometer (IASI). However, TROPOMI NO2 retrievals are less sensitive to the lower troposphere, causing ΔNO2∕ΔCO to be influenced by vertical sensitivity (Eskes and Boersma, 2003). We derived a correction factor to take this influence into account, as will be explained in detail in Sect. 2.5.
This paper is organized as follows: Sect. 2 provides detailed information about the TROPOMI CO and NO2 retrieval, the approach used to quantify the ΔNO2∕ΔCO column enhancement ratio over megacities, and how to relate it to the corresponding emission ratio. Results comparing satellite-derived and emission inventory-derived ratios are presented in Sect. 3. Finally, Sect. 4 summarizes our findings and presents the main conclusions.
2.1 TROPOMI CO retrievals
For this study, we use the TROPOMI CO scientific beta data product provided by the SRON Netherlands Institute for Space Research (ftp://ftp.sron.nl/open-access-data-2/TROPOMI/tropomi/co/7_7/, last access: 18 November 2018). The output is identical to that of operational data product provided by the European Space Agency (ESA), but it also provides the TM5 a priori profiles (http://tm5.sourceforge.net/, last access: 18 November 2018) that are used in the retrieval. The SRON CO product also supplies more data for the early months of the mission which are not included in the operational product. Total column densities of CO (molec. cm−2) are retrieved from spectral radiance measurements from the TROPOMI SWIR module at 2.3 µm using the SICOR algorithm (Landgraf et al., 2018). In this profile scaling algorithm, the TROPOMI-observed spectra are fitted by scaling a reference vertical profile of CO using the Tikhonov regularization technique (Borsdorff et al., 2014). The reference a priori CO profile is derived from the TM5 transport model (Krol et al., 2005), as described in Landgraf et al. (2016). The averaging kernel (A) is an essential component of the CO retrieval and quantifies the sensitivity of the retrieved CO column to a change in the true vertical profile (ρtrue) following Borsdorff et al. (2018c):
where ϵCO is the error in the retrieved CO columns.
2.2 TROPOMI NO2 retrievals
The UV–Vis module of TROPOMI is used to retrieve NO2 in the 405–465 nm spectral range. NO2 slant column densities are processed using the TROPOMI NO2 DOAS software developed at the Royal Netherlands Meteorological Institute (KNMI; van Geffen et al., 2019). The retrieval algorithm is based on the NO2 DOMINO algorithm (Boersma et al., 2011) which has been improved further in the QA4ECV4 project (Boersma et al., 2018). The algorithm subtracts the stratospheric contribution to the slant column densities and then converts the residual tropospheric slant column density into the tropospheric vertical density via the air mass factor (AMF). The AMF is computed using co-sampled, daily NO2 a priori vertical profiles from output of the TM5-MP chemistry transport model at a 1∘ × 1∘ resolution (Williams et al., 2017). The AMF depends on the surface albedo, terrain height, cloud height, and cloud fraction (Eskes et al., 2019; Lorente et al., 2017). We used the offline Level 2 NO2 data (mol m−2) that are available at https://s5phub.copernicus.eu and http://www.tropomi.eu (last access: 18 November 2018). The TROPOMI NO2 product has been successfully used in various other studies (Griffin et al., 2019; Reuter et al., 2019); however, there are indications that NO2 is biased low by approximately 30 % in the tropospheric columns due to issues with the cloud pressure and the a priori NO2 profile used in the AMF calculation (Boersma et al., 2004; Lorente et al., 2017).
2.3 Data selection
We used TROPOMI CO and NO2 retrievals from June to August 2018 due to the large number of clear-sky days during this period over the megacities of interest. Megacities are strong sources of air pollution and can readily be observed in TROPOMI data (Borsdorff et al., 2018c). Since CO and NO2 are retrieved from different instrument channels using different algorithms, the filtering criteria and spatial resolutions are also different. To facilitate data filtering, both algorithms provide a quality assurance value (qa value). The qa value for both products ranges from 0 (no data) to 1 (high-quality data)
For our data analysis, we selected NO2 retrievals with qa values equal to or larger than 0.75, indicating clear-sky conditions (Eskes and Eichmann, 2019), and CO retrievals with qa values equal to or larger than 0.7, representing measurements under clear-sky conditions or the presence of low-level clouds (Apituley et al., 2018). The application of the SICOR algorithm to SCIAMACHY CO retrievals with low-level clouds increases the number of measurement, with a limited impact in the ability to detect CO sources (Borsdorff et al., 2018a). CO retrievals are filtered for stripes, as described in Borsdorff et al. (2018c). The CO retrieval has a spatial resolution that is a factor of 2 coarser than the NO2 retrieval (7 × 7 km2 versus 3.5 × 7 km2). To co-locate NO2 and CO retrievals, we combine the NO2 pixels with centres that fall within a CO pixel, selecting only those pixels for which both the NO2 and CO retrievals pass the filtering criteria. The total CO column and tropospheric NO2 columns are converted into the dry column mixing ratio XCO (ppb) and XNO2 (ppb) using the dry-air column density calculated using the co-located surface pressure data included in the CO data files, as described in Borsdorff et al. (2018c).
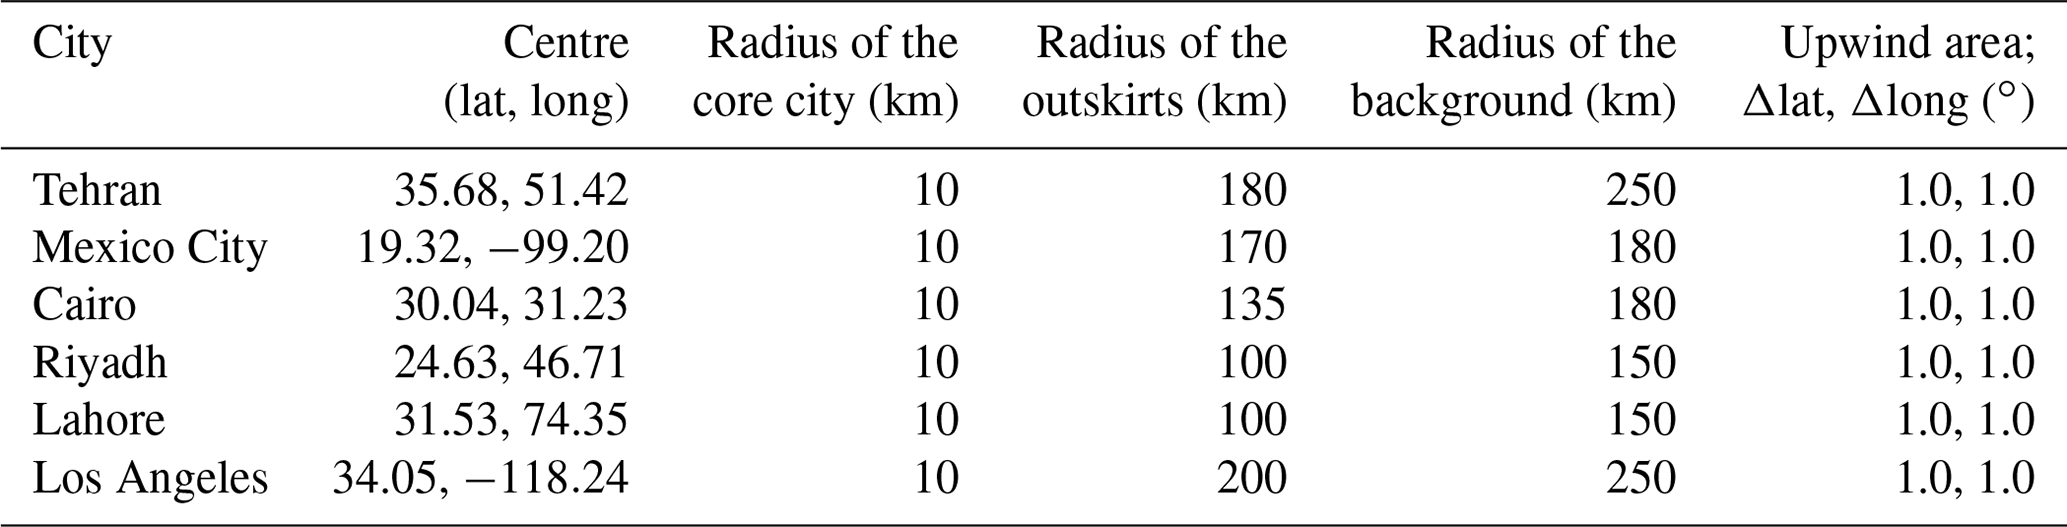
Table 1Selected megacities and specifications used for emission ratio quantification.
2.4 Calculation of NO2∕CO
This study focuses on the following megacities (with populations exceeding 5 million): Mexico City, Tehran, Riyadh, Cairo, Lahore, and Los Angeles. These six megacities are well isolated from surrounding sources and frequently experience cloud-free conditions, allowing for the retrieval of a large number of XCO and XNO2 data from TROPOMI. Los Angeles and Mexico City have automated air quality monitoring networks that measure CO and NO2 at different locations in the city. These measurements are used in Sect. 3.3 to validate the results obtained using TROPOMI. In addition, these megacities are expected to span a sizable range of burning efficiencies, as they include urban centres in developed (Los Angeles, USA) and developing countries (Mexico City, Mexico; Cairo, Egypt; Riyadh, Saudi Arabia; and Lahore, Pakistan).
The concentration gradient between the background and the city centre is used to determine the ΔXNO2∕ΔXCO enhancement ratio. To determine this ratio, we divide each city into a core city area and a background area. Every city has a different size and different neighbouring CO and NO2 emission sources; therefore, the appropriate choice of radii for the background and outskirts varies between cities (see Sect. S1 in the Supplement for details). Since the same regional definition is used for NO2 and CO, the enhancement ratio is not sensitive to the details of the selection of the region. Thus, capturing the local enhancement in CO and NO2 to its full extent is most important for the choice of radii in order to optimize the signal over noise and, in turn, the detection limit for urban emissions. To maximize the size of the city enhancement, we exclude the diffuse outskirts between the city centre and the background. For the location of the city centre, we use the weighted average emission centre of NO2 derived from the EDGAR emission database (Dekker et al., 2017). The derived centre coordinates as well as the radii of the city core and background area are listed in Table 1. We test the robustness of the satellite-derived emission ratio using two different methods, which are explained in detail below.
2.4.1 Upwind background
To determine the upwind background (UB) column mixing ratio, we select a section of the background region that is upwind from the city centre using the average wind direction over the core city area (see Figs. 1 and S7 for further details). Generally, more than 75 % of all pollutants are emitted between the surface and an altitude of 200 m (Bieser et al., 2011). Therefore, the average wind speed and direction from the surface to an altitude of 200 m are derived from the ERA-Interim reanalysis data, which are provided at a 0.75∘ × 0.75∘ spatial and 3-hourly temporal resolution. The wind vector components of ERA-Interim are spatially and temporally interpolated to the central coordinate of TROPOMI pixels. Using this information, daily enhancement ratios are calculated as follows:
The background area might contain free tropospheric NO2 from lightning and convectively lofted surface NO2 from elsewhere. However, these contributions vary on scales that are usually large compared with the scale of a city. Therefore, the calculated ΔXNO2 and ΔXCO enhancements are predominantly caused by emissions from the city.
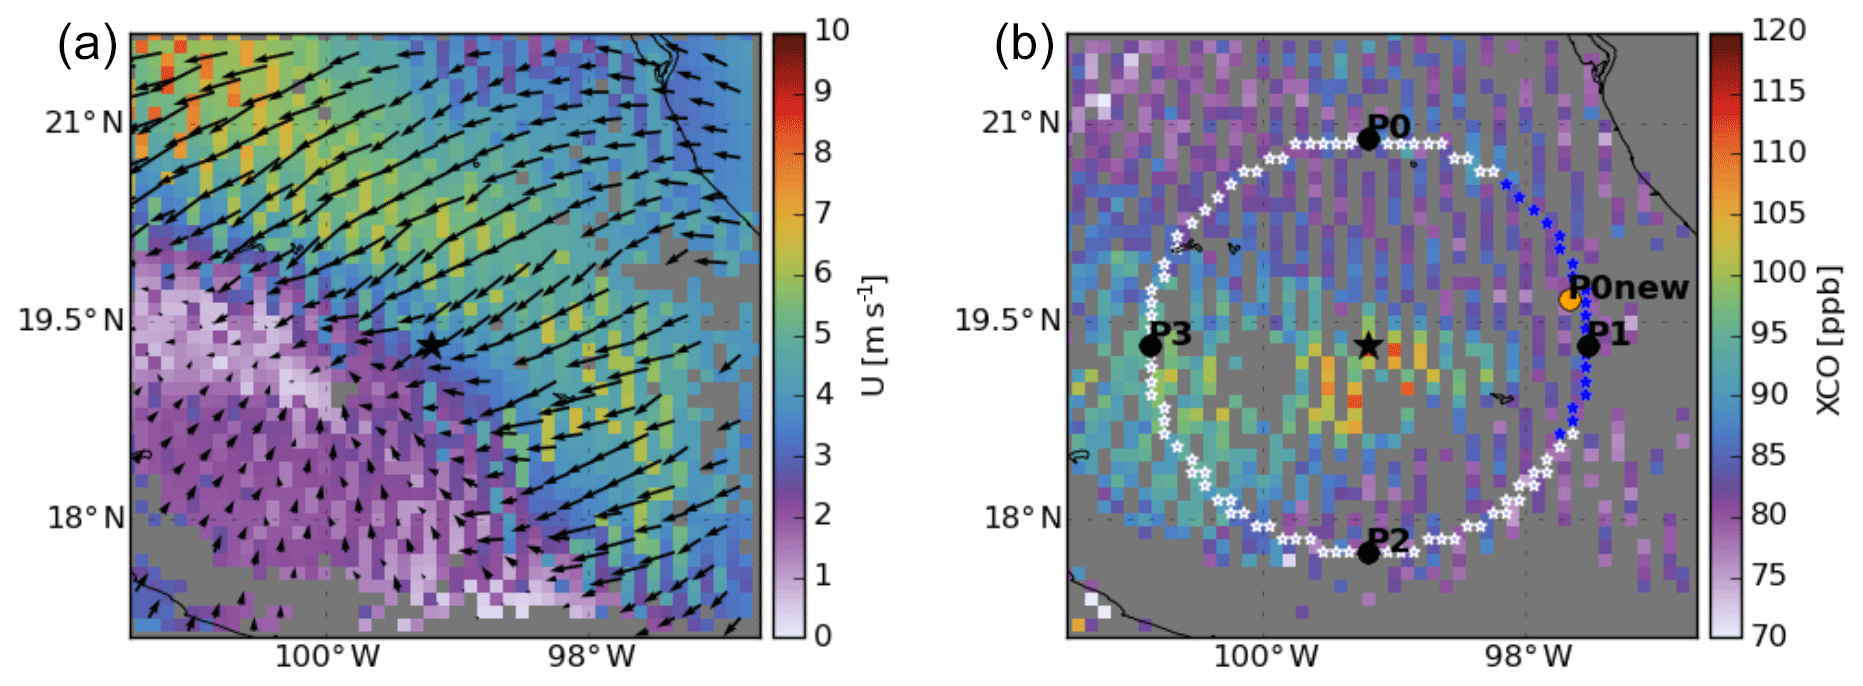
Figure 1Average wind speed and direction from the surface to 200 m from ERA-Interim at the TROPOMI overpass time (a), and the TROPOMI-derived total column CO over Mexico City (b) for 4 June 2018. The black star represents the centre of the city. In the right panel, the white circle is the background area for Mexico City, and the blue section represents the upwind background area that we selected depending upon the wind direction (θ) in the core city area. P0, P1, P2, and P3 are the points where the northern, eastern, western, and southern wind directions intersect with the background area. P0new is the new point generated by rotating P0 with θ in reference to the city centre.
2.4.2 Plume rotation
The daily TROPOMI-observed city images are rotated in the direction of the wind using the city centre as the rotation point to align each CO and NO2 plume in the upwind–downwind direction (Pommier et al., 2013). Rotated images for June to August 2018 are averaged together (see Fig. S8). ΔXNO2 and ΔXCO are determined by subtracting the average of the first quartile XNO2, XCO values in a 100 km × 20 km region upwind from the city centre from the average of the fourth quartile XNO2, XCO values in a 100 km × 20 km region downwind from the city centre. Finally, the enhancement of XNO2 and XCO is calculated as described in Eq. (5), and the enhancement ratio is derived using Eq. (4).
where ndownwind refers to the number of observations ≥75th percentile, and nupwind refers to the number of observations ≤25th percentile
2.5 NO2∕CO emission ratio
Local TROPOMI-derived ratios in column abundance are compared with emission ratios derived from the Emission Database for Global Atmospheric Research (EDGAR v4.3.2) at a 0.1∘ × 0.1∘ spatial resolution for the most recent year of 2012 and the database provided by Monitoring Atmospheric Chemistry and Climate and CityZen (MACCity) for 2018 that is available at a 0.5∘ × 0.5∘ resolution (Granier et al., 2011). MACCity has been re-gridded to a spatial resolution of 0.1∘ × 0.1∘, assuming a uniform distribution of the emissions within each 0.5∘ × 0.5∘ grid box. Both emission inventories contain total emissions of NOx and CO. NOx emissions are converted into NO2 by dividing NOx by the conversion factor of 1.32. This conversion factor is based on Seinfeld and Pandis (2006) and represents urban plumes at 13:30 local time (LT). The emission ratios of NO2 and CO () are calculated from total emissions (the sum of all processes) within the core city area for the EDGAR and MACCity emission inventories.
To compare TROPOMI to inventory-derived ratios, the NO2 tropospheric column has to be corrected for its limited atmospheric residence time. The CO lifetime is long enough compared with the transport time out of the city domain to be neglected. In addition, we need to account for differences in the vertical sensitivity of TROPOMI to NO2 and CO, as quantified by their respective averaging kernels (A) shown in Fig. 2. To compare TROPOMI to EDGAR and MACCity, we formulate a relationship between the emission ratio () and the column enhancement ratio (ΔXNO2∕ΔXCO) taking the combined effect of atmospheric transport, chemical loss, and the averaging kernel into account. This relationship is as follows (see Appendix A for its derivation):
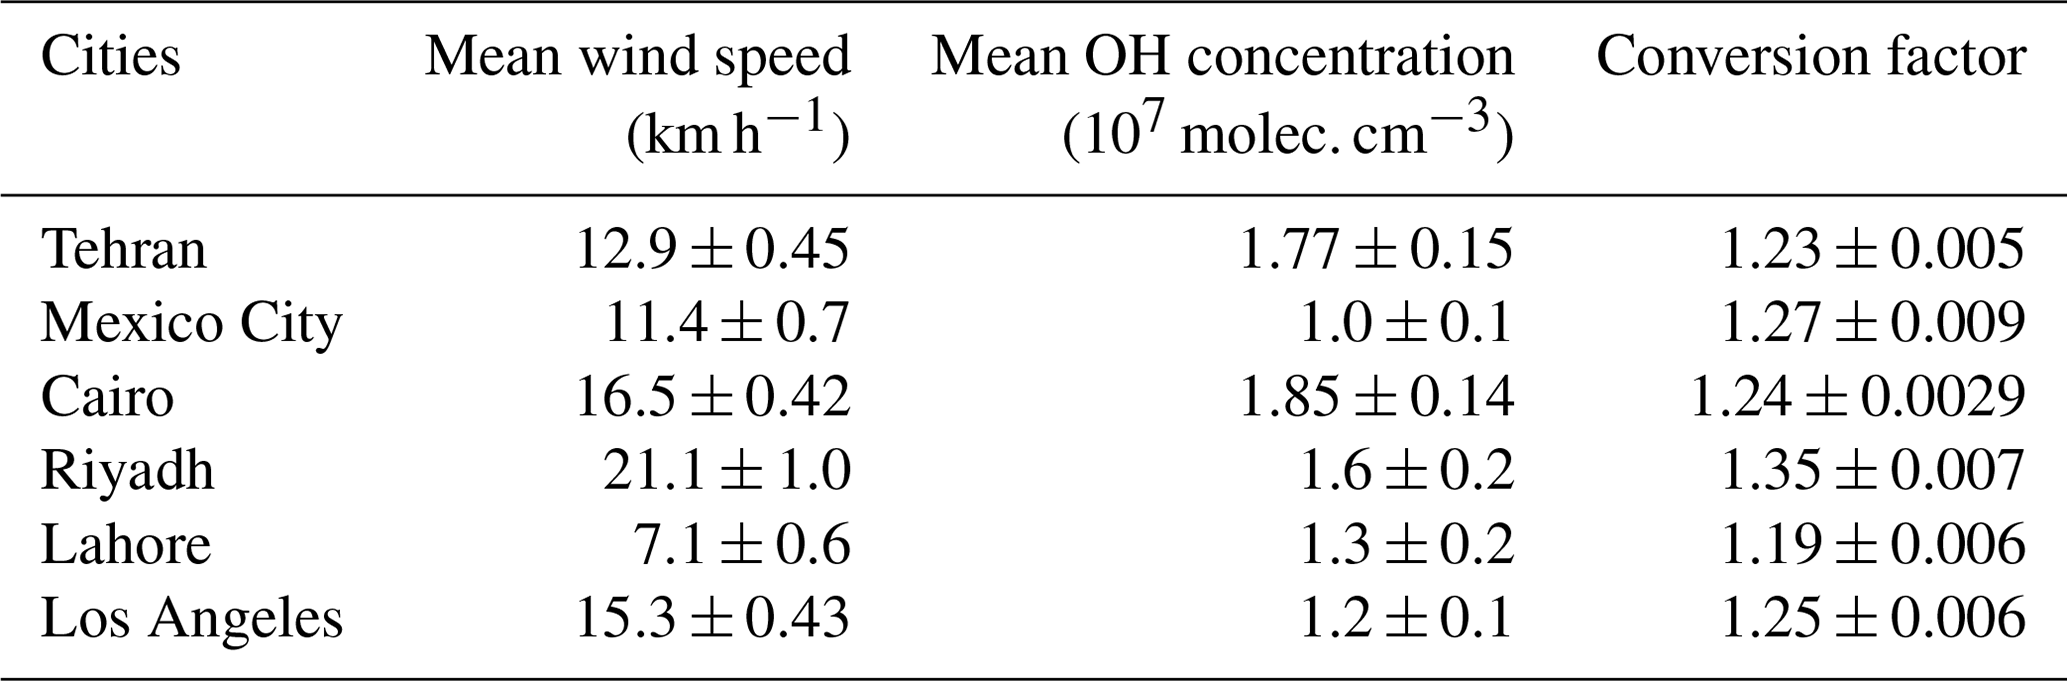
where U is the is the 200 m wind speed (m s−1), lx is the diameter of the city centre (m), and K is the rate constant of the reaction of NO2 with OH of cm3 molec.−1 s−1 (Burkholder et al., 2015). T (K) and OH (molec. cm−3) are the boundary layer average temperature and OH concentration respectively, and Ainfluence is the influence of the averaging kernel on ΔXNO2∕ΔXCO (see Sect. 3.2).
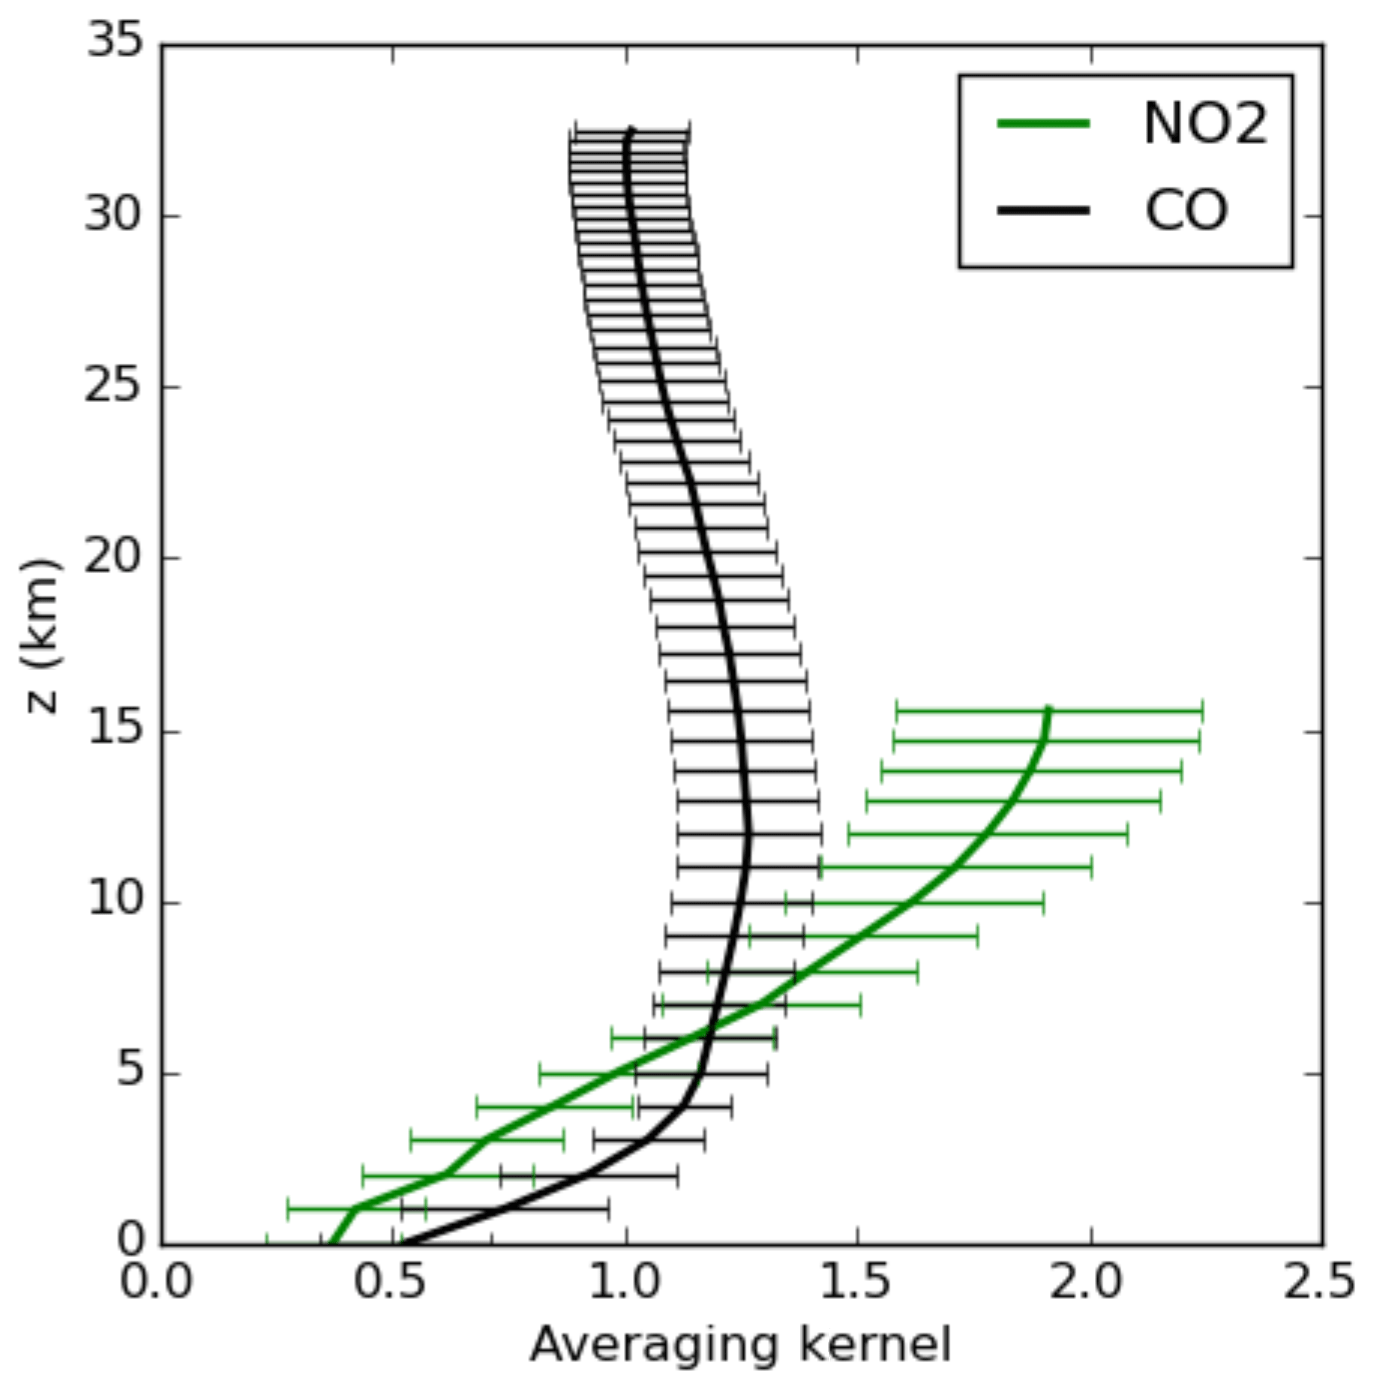
Figure 2TROPOMI averaging kernels (A) for CO total column and tropospheric NO2 over Mexico City on 1 June 2018. The error bars represent the standard deviation of the mean A at each vertical level.
Copernicus Atmospheric Monitoring Service (CAMS) real-time OH, CO, and NO2 fields are used to account for the impacts of chemical loss and the averaging kernel. The CAMS data, at a 0.1∘ × 0.1∘ and 3-hourly resolution, are spatially and temporally interpolated to the TROPOMI footprints. The CAMS CO and NO2 vertical mixing ratio profiles are converted into vertical column densities using the ERA-Interim reanalysis surface pressure. For CO, the TROPOMI data provide column A values from the surface to the top of atmosphere. For NO2, tropospheric A is derived using the AMF for the troposphere as fraction of the total column (Boersma et al., 2016). For further details, see Appendix B.
2.6 Uncertainty
To quantify the uncertainty in TROPOMI-derived ΔXNO2∕ΔXCO ratios for the plume rotation method, we use the error propagation method of Pommier et al. (2013) and bootstrap for the upwind background, as explained further in the following.
2.6.1 Bootstrapping
The bootstrapping method is a statistical resampling method that is used here to calculate the uncertainty in the daily enhancement ratio of . The first step is to generate a new set of samples by drawing a random subset with replacement from the full dataset of N daily ratios. The subset has the same number of samples as the full dataset, from which a mean ratio is calculated. This procedure is repeated 1000 times for each city. Finally, the standard deviation of the resulting ratios is taken and used to represent the uncertainty in the daily .
2.6.2 Error propagation
To calculate the uncertainty in by error propagation, we first determine the uncertainty in the enhancements ΔXNO2 and ΔXCO, which are derived from the uncertainty in the mixing ratios upwind and downwind of the source as follows:
where X is XNO2 or XCO.
Here, we assume that the upwind and downwind uncertainties are independent. The uncertainty for the column enhancement is
3.1 Detection of NO2 and CO pollution over megacities
The co-located TROPOMI XNO2 and XCO data have been averaged for June to August 2018 for domains of 500 × 500 km2 centred around the selected megacities, as described in Sect. 2. The results for Mexico City and Cairo are shown in Fig. 3. The enhancements of XCO and XNO2 over Mexico City and Cairo are clearly separated from the surrounding background areas and are prominent in several overpasses of TROPOMI (Fig. S9). This demonstrates that a relatively short data averaging period is sufficient for TROPOMI to detect hotspots of CO pollution at the scale of large cities, compared with instruments such as IASI and MOPITT. The orography surrounding Mexico City causes pollutants to become trapped, thereby facilitating detection by TROPOMI. The longer lifetime of CO compared with NO2 causes the urban influence of CO to be propagated further in the westward direction. As can be seen in Fig. 3, the retrieved XCO and XNO2 signals of emissions from Mexico City and Cairo correlate quite well with each other, confirming that it should be possible to obtain useful information about burning efficiency by studying . An industrial area is located to the east of Cairo (29.797351∘ N, 32.148266∘ E), showing a clear enhancement in XNO2 but not in XCO (Fig. 3c, d). It demonstrates that variations in the column enhancement ratio can already be seen by eye when comparing TROPOMI-retrieved XCO and XNO2 images.

Figure 3Co-located TROPOMI-retrieved XNO2 (a, c) and XCO (b, d) data over Mexico (a, b) and Cairo (c, d) averaged for June to August 2018. De-striping is applied to CO total columns (Borsdorff et al., 2018b), and CO and NO2 retrievals have been re-gridded to 0.1∘ × 0.1∘. The white stars represent the centres of Mexico City and Cairo respectively. The red circle in (c) and (d) points to an industrial area east of Cairo.
3.2 Comparison of TROPOMI- and inventory-derived ratios
Here, we attempt to compare TROPOMI-derived NO2∕CO column enhancement ratios to emission ratios from EDGAR and MACCity for the six selected megacities (see Fig. 4). As explained in Sect. 2, column enhancement ratios from TROPOMI are obtained using the upwind background (UB) and plume rotation (PR) methods. These estimates differ by 5 % to 20 % across the six cities, providing an initial estimate of the accuracy with which the column enhancement ratio can be derived (see Table S1 in the Supplement for details). The EDGAR and MACCity inventories show a substantial variation in emission ratios between cities, with relatively high emission ratios for Riyadh and the lowest emission ratios for Lahore. TROPOMI-derived ΔXNO2∕ΔXCO column enhancement ratios for the UB and PR methods show similar patterns to EDGAR and MACCity, with Pearson correlation coefficients of 0.85 and 0.7 respectively (Fig. S10 in the Supplement). However, inventory-derived emission ratios are clearly 60 % to 85 % larger than TROPOMI-derived column enhancement ratios, which is largely explained by the impact of the limited NO2 lifetime and the averaging kernel, as will be discussed further after an explanation of the differences between EDGAR and MACCity. Emission ratios from MACCity are 10 % to 75 % lower than those from EDGAR. To understand the differences in emission ratios between MACCity and EDGAR, we selected two cities, Cairo and Mexico City, which present the largest and smallest differences in the emission ratio. The CO and NO2 emissions are categorized into seven sectors: agriculture, residential, energy, industrial, transportation, shipping, and waste treatment. Sectors that contribute most to the total emission are compared. In the case of Cairo and Mexico City, these are the transportation, industrial, energy, and residential sectors (Fig. S11a, b). For Cairo, the total CO emission is a factor of 2 lower in EDGAR than in MACCity, whereas the total NO2 emission is 10 % higher in EDGAR. This results in an emission ratio that is a factor of 3 higher. The largest discrepancy between EDGAR and MACCity CO emission is due to the residential sector, followed by energy. For NO2, the energy, transportation, and residential sectors explain most of the difference between EDGAR and MACCity. In Mexico City, EDGAR total CO and NO2 emissions are both a factor of 2 higher than MACCity values; thus, the total emission values cancel out in the ratio, leading to the best agreement of all selected megacities. However, it is complicated to identify the main factors explaining the differences between EDGAR and MACCity at the sector level due to the combined influence of differences in activity data, EFs, and the methods used to disaggregate country totals. To understand the disaggregation of emission in EDGAR and MACCity, we compared the country total CO and NO2 of Mexico City (Mexico) and Cairo (Egypt). The comparison shows that the EDGAR and MACCity country CO total and the NO2 total for Mexico show a small difference (∼12 %), whereas the difference is about factor of 2 in Mexico City (Fig. S11c). For Egypt, the EDGAR and MACCity CO total shows a similar difference to Cairo, whereas the EDGAR NO2 country total emission value is a factor of 2 lower (Fig. S11d). This shows that EDGAR attributes CO and NO2 emissions to the city, whereas MACCity smears them out over the country.
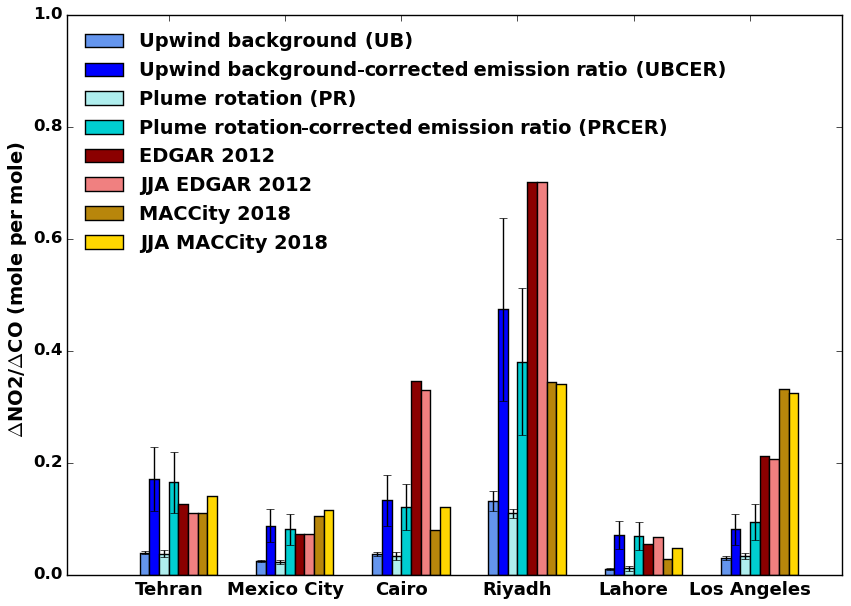
Figure 4Comparison of TROPOMI-derived ΔNO2∕ΔCO enhancement ratios, calculated using the different methods shown in shades of blue, with the corresponding emission ratios from the EDGAR (shown using shades of red) and MACCity (shown using shades yellow) emission inventories for six megacities. Dark solid shades for emission inventories represent the annual average inventory-derived ratio, whereas the lighter shades represent the June to August averaged inventory-derived ratios. The upwind background-corrected emission ratio (UBCER) and the plume rotation-corrected emission ratio (PRCER) account for the impact of photochemical NO2 removal and the averaging kernel. Error bars for the TROPOMI-derived ΔNO2∕ΔCO enhancement ratios represent 1σ uncertainties calculated using bootstrapping (upwind background) and error propagation (plume rotation method). The error bars for UBCER and PRCER account for the uncertainty in the methodology and TROPOMI data (for details, see Table S3).
The difference between satellite-derived column enhancement ratios and inventory-based emission ratios can be explained in part by the relatively short lifetime of NO2 that reduces columnar NO2∕CO ratios compared with the emissions. In addition, the sensitivity to the planetary boundary layer is lower for NO2 than for CO TROPOMI measurements, further reducing the satellite-observed column enhancement ratio. Taking these influences into account using Eq. (6) leads to the upwind background-corrected emission ratio (UBCER) and the plume rotation-corrected emission ratio (PRCER) in Fig. 4, which have been calculated on a daily basis before averaging over the full period. Due to the short lifetime of OH, its concentration depends strongly on the local photochemical conditions (de Gouw et al., 2019). Therefore, to account for the local lifetime of NO2, we need an estimate of the OH that is representative for the photochemical conditions inside cities. Figure 5 shows the boundary layer OH concentration at the TROPOMI overpass time from CAMS for Mexico City, averaged over June–August 2018. Figure 5 shows a clear enhancement of OH in the city centre, confirming that the spatial resolution of CAMS is sufficient to resolve the urban influences on OH in megacities. The UB and PR column enhancement ratios increase by 60 % to 85 % when accounting for the NO2 lifetime (see Table S1). The boundary layer OH concentrations and mean wind speeds for the six cities are listed in Table 2.
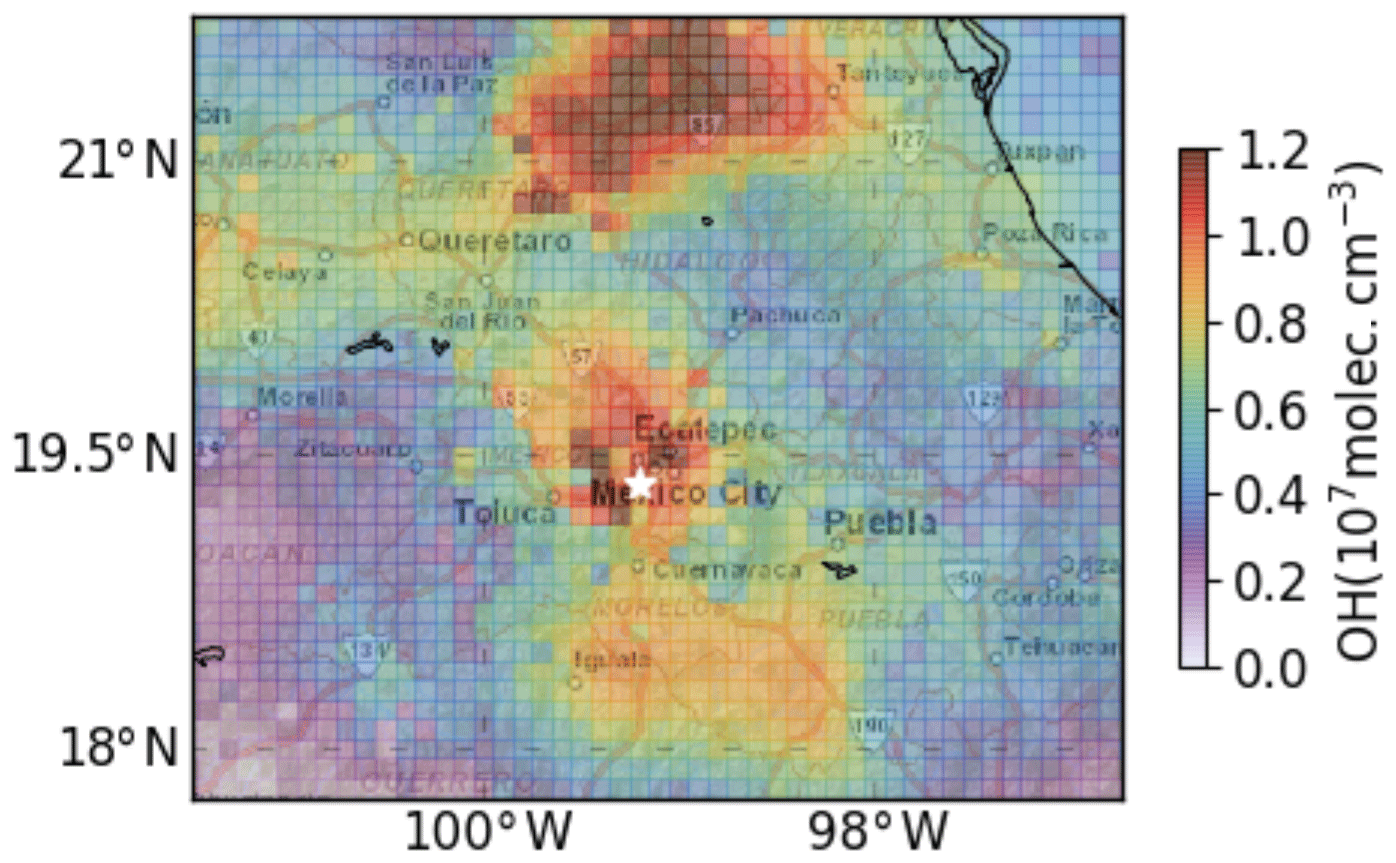
Figure 5The boundary layer average OH concentration at the TROPOMI overpass time during June to August 2018 over Mexico City. The white star represents the centre of Mexico City.
The impact of differences between the XNO2 and XCO averaging kernels is calculated using vertical profiles of NO2 and CO taken from CAMS. These profiles were used to calculate XNO2 and XCO using either the TROPOMI A values or A values replaced by identity matrices. The relative difference % quantifies the impact of differences between the averaging kernels (see Appendix C for the derivation). The CAMS-simulated city enhancements for CO from June to August 2018 did not compare well with TROPOMI for Tehran, Cairo, Riyadh, and Lahore, which was possibly due to the coarse resolution of CAMS (see Figs. S14, S15, S16, and S17). Therefore, Ainfluence has been determined for Mexico City and Los Angeles to calculate the averaging kernel impact (Figs. S12, S13). To test the accuracy of Ainfluence, a few days were selected for Tehran, Cairo, Riyadh, and Lahore when CAMS CO and NO2 enhancements compared relatively well with TROPOMI. For the six megacities, TROPOMI-derived ΔNO2∕ΔCO ratios are 10 % to 15 % lower than the “ideal” ΔNO2∕ΔCO ratio that would be measured if both retrievals had uniform vertical sensitivities, i.e. every molecule in the column received equal weight. Details about the selected days and the corrections calculated for each city are listed in Table S2.
After correction, UBCER and PRCER for Tehran and Mexico City are close to EDGAR and MACCity (10 % to 25 %). This confirms that the EFs for these cities are well represented in the EDGAR and MACCity emission inventories. The difference between corrected and uncorrected ratios in Fig. 4 highlights the importance of the correction, in particular the influence of OH, for assessing emission ratios using TROPOMI. For Cairo the correction also reduces the difference between TROPOMI and the emission inventories, although the EDGAR ratios remain about 65 % higher for Cairo than UBCER and PRCER. For MACCity, the emission ratios are close to the TROPOMI-derived UBCER and PRCER for Cairo (within 20 %), pointing to a more accurate representation of emission ratios in MACCity than in EDGAR. For Riyadh, UBCER and PRCER are close to MACCity (∼10 % to 20 %), whereas EDGAR is 35 % higher. However, for Lahore, PRCER is close to the EDGAR ratio, whereas MACCity is a factor of 2.5 lower. For Los Angeles, the ratios from EDGAR and MACCity are 55 % and 70 % higher than UBCER and PRCER after correction respectively, suggesting poorer burning conditions than represented by the emission inventories. To further investigate this discrepancy for Los Angeles, we included the Hemispheric Transport of Air pollution version 2 (HTAP-v2) emission inventories for 2010 in the comparison. HTAP-v2 has a resolution of 0.1∘ × 0.1∘ and makes use of emission estimates from the Environmental Protection Agency (EPA) for the USA (Janssens-Maenhout et al., 2015). The HTAP-v2-derived emission ratio over Los Angeles is 0.074, which is close to UBCER and PRCER (within 20 %). This result provides further confidence in the TROPOMI-derived emission ratio. However, different sources of uncertainty play a role, as discussed further below.
Seasonal variations in EFs may influence our comparison between the seasonal averaged TROPOMI data and annual average EDGAR emissions. To account for the influence of seasonally varying EFs, we compute a seasonal correction factor based on EDGAR v4.3.2 2010, as monthly data are not available for EDGAR 2012 (see Fig. 4). Except for Lahore, the June to August (JJA) EDGAR ratio is 5 % to 12.5 % lower than the annual average EDGAR ratio. The MACCity ratio for JJA, however, is 10 % to 71 % higher than the annual average, indicating that EDGAR and MACCity disagree on the seasonality of the NO2∕CO emission ratio. For MACCity, the agreement with TROPOMI improves the most when seasonality is taken into account (see Fig. 4).
Table 2Average wind speed and boundary layer CAMS OH concentration for June–August 2018 that was used to correct for the limited lifetime of NO2. The errors presented represent the 1σ uncertainty calculated by the bootstrapping method.
The ozone concentration and the photolysis rate impact the partitioning of NO and NO2 (Jacob, 1999), thereby influencing the applied conversion factor of 1.32. To further investigate the uncertainty introduced by this factor, we analysed CAMS surface NO and NO2 at the TROPOMI overpass time (see Table 2). The CAMS-derived conversion factor varies by less than 10 % compared with the standard value of 1.32, introducing an uncertainty of less than 10 % in the inventory-derived emission ratio. However, given the uncertainty in the CAMS-simulated urban NO, NO2, and OH concentrations (Huijnen et al., 2019), the actual uncertainty is probably higher. Additionally, TROPOMI underestimates the NO2 column by 7 % to 29.7 % relative to MAX-DOAS ground-based measurement in European cities (Lambert, et al., 2019). However, as we currently do not know how representative this estimate is for the cities studied, the impact of this bias has been accounted for as an additional source of uncertainty of 30 % in the TROPOMI-inferred NO2∕CO ratio (see Table S3). Compared with this number, other sources of uncertainty, such as the wind direction and speed (Figs. S18, S19), the boundary layer OH concentration (Table 2), the Ainfluence correction (Table S2), and the predefined background setting (Fig. S20), only make small contributions to the TROPOMI-derived emission ratio. The total uncertainty in the TROPOMI-derived emission ratio is calculated using error propagation (see Table S3) and ranges between 33 % and 35.6 %.
We also acknowledge that our treatment of the photochemical removal of NO2 is simplified. In reality, NO2 is influenced by several other factors including meteorological parameters, such as temperature, wind speed, and radiation (Lang et al., 2015; Romer et al., 2018), causing the formation and loss of NO2 to vary spatially and temporally. In the corrected ratio, we only consider the first-order loss of NO2 by OH forming HNO3. Several studies show that the loss of NO2 via the formation of alkyl and multifunctional nitrates (RONO2) can play a more important role than nitric acid production in cities surrounded by forested areas (Browne et al., 2013; Farmer et al., 2011; Romer Present et al., 2020; Sobanski et al., 2017). In addition, the secondary production of CO from volatile organic compound (VOC) oxidation may play a role. However, this only affects our ratios if it changes the CO gradient between the city and the background. Hence, to further improve the accuracy of the TROPOMI-supported evaluation of emission ratios, a more sophisticated treatment of urban photochemistry is required.
3.3 Validation using ground-based measurements
To further evaluate TROPOMI's ability to quantify burning efficiencies, TROPOMI-derived ΔXNO2∕ΔXCO ratios have been compared with ground-based measurements from Mexico City and Los Angeles. For this purpose, 20 ground-based stations in Mexico City with hourly measurements of CO and NO2 have been selected from the AIRE CDMX network (http://www.aire.cdmx.gob.mx/, last access: 17 July 2019). Similarly, 12 ground-based stations from the South Coast Air Quality Management District (AQMD) monitoring network (http://www.aqmd.gov/, last access: 20 July 2019) have been selected for Los Angeles. For details (names and locations) on these sites, see Table S4. For Mexico City, data were only available for June 2018. For Los Angeles, data for the June to August 2018 period were used, but the periods from 25 July to 11 August and from 17 to 26 August were excluded to avoid the influence of wild fires on the observed urban pollution level.
The validation results are presented in Fig. 6 for spatially averaged, hourly CO and NO2 measurements for Mexico City and Los Angeles collected during the noon hours (12:00 to 14:00 LT). To determine the enhancement in CO and NO2 due to local emissions for each ground-based station, the fifth percentile of hourly CO and NO2 measurements is used as background. ΔCO and ΔNO2 enhancements for individual monitoring stations are calculated as . For comparison with TROPOMI, all measurement sites are spatially averaged.
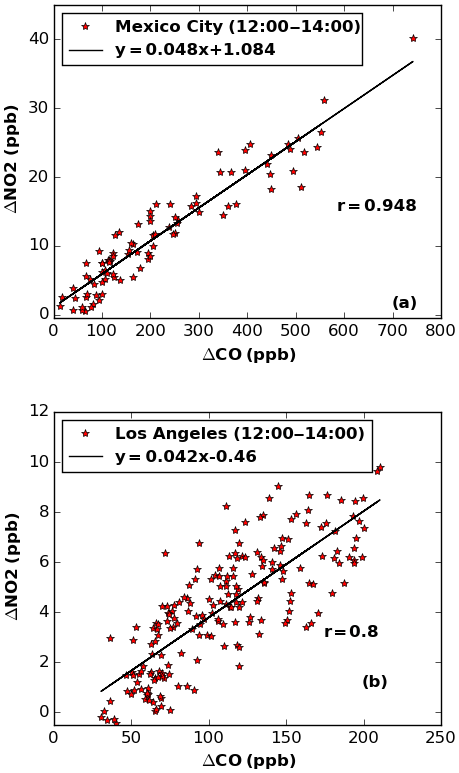
Figure 6The relation between ΔNO2 and ΔCO in surface measurements from Mexico (a) and Los Angeles (b). The red dots represent spatially averaged hourly measurements collected during the day (12:00 to 14:00 LT).
Ground-based ΔCO and ΔNO2 at Mexico City and Los Angeles are strongly correlated, with a Pearson correlation coefficient of r=0.95 and 0.80 respectively, confirming that the observed signals reflect NO2 and CO emissions from common sources. The slope of the regression line for Mexico City is 0.048, which is 45 % higher than the TROPOMI-derived column enhancement ratios using the UB and PR methods. The ΔNO2∕ΔCO ratio that is observed at ground level is likely less influenced by the photochemical removal of NO2 than the TROPOMI-retrieved columns and is, therefore, closer to the inventory-derived ratio, which is consistent with our results. This comparison suggests that the removal of NO2 reduces the ratio for ground-based measurements by 35 % compared with EDGAR and MACCity. Overall, the emission ratios in EDGAR and MACCity for Mexico City are consistent with both the ground-based measurements and TROPOMI, i.e. within the uncertainty introduced by the chemical removal of NO2.
For Los Angeles, the regression slope is 0.042, which is 10 % to 20 % larger than the TROPOMI-derived column enhancement ratios using the UB and PR methods. However, the EDGAR and MACCity ratios are a factor of 5 higher than the ΔNO2∕ΔCO ratio observed at ground level. The ground-based measurements point to similar ratios for Mexico City and Los Angeles, confirming the HTAP-v2-supported TROPOMI finding that the emission ratios in EDGAR and MACCity are too high for Los Angeles. Therefore, the ground-based measurements for Los Angeles provide independent support for the TROPOMI-derived ratios, pointing to poorer burning conditions in Los Angeles than indicated by the emission inventories, and confirm the value of TROPOMI with respect to monitoring the burning efficiency of megacities.
In this study, we investigate the use of TROPOMI XCO and XNO2 retrievals for monitoring the burning efficiency of fossil fuel use in megacities. To improve the accuracy of the global emission inventories, the burning efficiency and the EF are quantified using co-located XCO and XNO2 enhancements over the megacities of Tehran, Mexico City, Cairo, Riyadh, Lahore, and Los Angeles. TROPOMI is very capable of detecting XCO and XNO2 enhancements over these megacities with a relatively short averaging time and shows the expected spatial correlation.
TROPOMI-derived column enhancement ratios have been compared with emission ratios from EDGAR and MACCity. The TROPOMI-derived column enhancement ratios are strongly correlated with the EDGAR and MACCity inventory-derived emission ratios (r=0.85 and 0.7 respectively), showing the highest emission ratio for Riyadh and the lowest emission ratio for Lahore. This shows that Lahore has the poorest burning efficiency, whereas fossil fuel burning is the most efficient over Riyadh (of all megacities that were analysed). The impact of the short NO2 lifetime and differences in the vertical sensitivity of the TROPOMI XCO and XNO2 retrieval on the ΔNO2∕ΔCO enhancement ratio has been quantified. Correcting for these factors significantly improves the agreement between ratios derived from TROPOMI and emission inventories. The comparison indicates that the emission ratios in MACCity and EDGAR are well represented for Mexico City and Tehran. For Lahore, the EDGAR emission ratio agrees better with TROPOMI, whereas the MACCity emission ratios are closest to the TROPOMI-derived emission ratios for Cairo and Riyadh. Emission ratios in EDGAR and MACCity are significantly higher (by 55 % to 70 %) than TROPOMI for Los Angeles. The total uncertainty on TROPOMI-derived emission ratios ranges from 33 % to 35.6 %. The bias in S5P TROPOMI NO2 retrievals has the most important contribution to the uncertainty in the TROPOMI-derived emission ratio.
TROPOMI-derived ΔXNO2∕ΔXCO column enhancement ratios for Mexico City and Los Angeles have been validated using ground-based measurement from local air quality monitoring networks. For Mexico City, the enhancement ratio derived from ground-based measurements is consistent with EDGAR, MACCity, and the TROPOMI-derived emission ratio. For Los Angeles, TROPOMI-derived enhancement ratios are consistent with the ground-based measurements as well as the HTAP-v2 inventory based on EPA statistics, whereas EDGAR- and MACCity-derived emission ratios appear to be overestimated by a factor of 5 compared with ground-based measurements. This demonstrates the potential of TROPOMI data for monitoring burning efficiency and evaluating emission inventories.
A1 Derivation of Eq. (6) for CO
The mass balance equation for CO is as follows:
In the steady state, is zero.
where ΔXCO is the enhancement of CO in the city (in ppb), U is the wind speed (in m s−1), and lx is the diameter of the city (in m).
A2 Derivation of Eq. (6) for NO2
The mass balance equation for NO2 is as follows:
In the steady state, is zero and τ is , K is the rate constant reaction of NO2 with OH of cm3 molec.−1 s−1 (Burkholder et al., 2015), T (K) and OH (molec. cm−3) are the boundary layer average temperature and OH concentration respectively.
where ΔXNO2 is the enhancement of NO2 in the city (in ppb), U is the wind speed (in m s−1), and lx is the diameter of the city (in m).
A3 Derivation of ratio in Eq. (6)
The influence of averaging kernel is calculated as follows:
where Ainfluence is the influence of the averaging kernel on ΔXNO2∕ΔXCO.
The derivation of the tropospheric averaging kernel (A) for NO2, as described by Eskes et al. (2019), is as follows:
where M is the total mass factor, Mtrop is the AMF for the troposphere, and is the TM5 tropopause layer index.
Here, and COCAMS are the CAMS column densities derived for NO2 and CO respectively, whereas and ΔCOCAMS are the city enhancement of NO2 and CO respectively. and ACO TROPOMI are the TROPOMI averaging kernel for NO2 and CO respectively.
TROPOMI NO2 and CO data were used for this paper. These data can be downloaded from https://s5phub.copernicus.eu, http://www.tropomi.eu (ESA and Copernicus, 2018), and ftp://ftp.sron.nl/open-access-data-2/TROPOMI/tropomi/co/7_7/ (last access: 26 August 2020). Ground-based network data for Mexico and Los Angeles can be downloaded from http://www.aire.cdmx.gob.mx/ (AIRE, 2019) and http://www.aqmd.gov/ (South Coast Air Quality Management District, 2019) respectively. EDGAR v4.3.2, MACCity, and HTAP-v2 data are available at https://eccad3.sedoo.fr/ (ECCAD, 2018). CAMS data can be downloaded from https://apps.ecmwf.int/datasets/data/cams-nrealtime/levtype=ml/ (ECMWF, 2019).
The supplement related to this article is available online at: https://doi.org/10.5194/acp-20-10295-2020-supplement.
SL performed the data analysis, data interpretation, and wrote the paper. SH supervised the study. SH, FKB, HE, IA, MK, HACDG, and AJHD discussed the results. TB and AL provided modified Copernicus Sentinel data CO data for 2018. All co-authors commented on the paper and improved it.
The authors declare that they have no conflict of interest.
This article is part of the special issue “TROPOMI on Sentinel-5 Precursor: first year in operation (AMT/ACP inter-journal SI)”. It is not associated with a conference.
We would like to thank the team that realized the TROPOMI instrument, consisting of the partnership between Airbus Defence and Space Netherlands, KNMI, SRON, and TNO, commissioned by NSO and ESA. Sentinel-5 Precursor is part of the EU Copernicus programme, and Copernicus Sentinel data for 2018 were used in this study. This research is funded by the NWO GO programme (grant no. 2017.036). We thank Tobias Borsdorff and Alba Lorente for providing the modified Copernicus Sentinel data 2018 CO data. Tobias Borsdorff and Alba Lorente are funded by the TROPOMI national programme through NSO. We are grateful to SURFSara for making the Cartesius HPC platform available for computations via computing grant no. 17235. We would also like to thank the South Coast Air Quality Management District (AQMD) monitoring network and Calidad del aire for the free use of air quality data.
This research has been supported by the NWO GO programme (grant no. 2017.036).
This paper was edited by Ben Veihelmann and reviewed by three anonymous referees.
AIRE: CDMX network, available at: http://www.aire.cdmx.gob.mx/, last access: 17 July 2019.
Andreae, M. O. and Merlet, P.: Emission of trace gases and aerosols from biomass burning, Global Biogeochem. Cy., 15, 955–966, https://doi.org/10.1029/2000GB001382, 2001.
Apituley, A., Pedergnana, M., Sneep, M., Pepijn, J., Loyola, D., Landgraf, J., and Borsdorff, T.: Sentinel-5 precursor/TROPOMI Level 2 Product User Manual Carbon Monoxide document number?: SRON-S5P-LEV2-MA-002, available at: https://sentinels.copernicus.eu/documents/247904/2474726/Sentinel-5P-Level-2-Product-User-Manual-Carbon-Monoxide, last access: 10 October 2018.
Bieser, J., Aulinger, A., Matthias, V., Quante, M., and Denier Van Der Gon, H. A. C.: Vertical emission profiles for Europe based on plume rise calculations, Environ. Pollut., 159, 2935–2946, https://doi.org/10.1016/j.envpol.2011.04.030, 2011.
Boersma, K. F., Eskes, H. J., and Brinksma, E. J.: Error analysis for tropospheric NO2 retrieval from space, J. Geophys. Res.-Atmos., 109, D04311, https://doi.org/10.1029/2003jd003962, 2004.
Boersma, K. F., Eskes, H. J., Dirksen, R. J., van der A, R. J., Veefkind, J. P., Stammes, P., Huijnen, V., Kleipool, Q. L., Sneep, M., Claas, J., Leitão, J., Richter, A., Zhou, Y., and Brunner, D.: An improved tropospheric NO2 column retrieval algorithm for the Ozone Monitoring Instrument, Atmos. Meas. Tech., 4, 1905–1928, https://doi.org/10.5194/amt-4-1905-2011, 2011.
Boersma, K. F., Vinken, G. C. M., and Eskes, H. J.: Representativeness errors in comparing chemistry transport and chemistry climate models with satellite UV–Vis tropospheric column retrievals, Geosci. Model Dev., 9, 875–898, https://doi.org/10.5194/gmd-9-875-2016, 2016.
Boersma, K. F., Eskes, H. J., Richter, A., De Smedt, I., Lorente, A., Beirle, S., van Geffen, J. H. G. M., Zara, M., Peters, E., Van Roozendael, M., Wagner, T., Maasakkers, J. D., van der A, R. J., Nightingale, J., De Rudder, A., Irie, H., Pinardi, G., Lambert, J.-C., and Compernolle, S. C.: Improving algorithms and uncertainty estimates for satellite NO2 retrievals: results from the quality assurance for the essential climate variables (QA4ECV) project, Atmos. Meas. Tech., 11, 6651–6678, https://doi.org/10.5194/amt-11-6651-2018, 2018.
Borsdorff, T., Hasekamp, O. P., Wassmann, A., and Landgraf, J.: Insights into Tikhonov regularization: application to trace gas column retrieval and the efficient calculation of total column averaging kernels, Atmos. Meas. Tech., 7, 523–535, https://doi.org/10.5194/amt-7-523-2014, 2014.
Borsdorff, T., Andrasec, J., aan de Brugh, J., Hu, H., Aben, I., and Landgraf, J.: Detection of carbon monoxide pollution from cities and wildfires on regional and urban scales: the benefit of CO column retrievals from SCIAMACHY 2.3 µm measurements under cloudy conditions, Atmos. Meas. Tech., 11, 2553–2565, https://doi.org/10.5194/amt-11-2553-2018, 2018a.
Borsdorff, T., Aan de Brugh, J., Hu, H., Aben, I., Hasekamp, O., and Landgraf, J.: Measuring Carbon Monoxide With TROPOMI: First Results and a Comparison With ECMWF-IFS Analysis Data, Geophys. Res. Lett., 45, 2826–2832, https://doi.org/10.1002/2018GL077045, 2018b.
Borsdorff, T., aan de Brugh, J., Hu, H., Hasekamp, O., Sussmann, R., Rettinger, M., Hase, F., Gross, J., Schneider, M., Garcia, O., Stremme, W., Grutter, M., Feist, D. G., Arnold, S. G., De Mazière, M., Kumar Sha, M., Pollard, D. F., Kiel, M., Roehl, C., Wennberg, P. O., Toon, G. C., and Landgraf, J.: Mapping carbon monoxide pollution from space down to city scales with daily global coverage, Atmos. Meas. Tech., 11, 5507–5518, https://doi.org/10.5194/amt-11-5507-2018, 2018c.
Bovensmann, H., Burrows, J. P., Buchwitz, M., Frerick, J., Noël, S., Rozanov, V. V., Chance, K. V., and Goede, A. P. H.: SCIAMACHY: Mission objectives and measurement modes, J. Atmos. Sci., 56, 127–150, https://doi.org/10.1175/1520-0469(1999)056<0127:SMOAMM>2.0.CO;2, 1999.
Browne, E. C., Min, K.-E., Wooldridge, P. J., Apel, E., Blake, D. R., Brune, W. H., Cantrell, C. A., Cubison, M. J., Diskin, G. S., Jimenez, J. L., Weinheimer, A. J., Wennberg, P. O., Wisthaler, A., and Cohen, R. C.: Observations of total RONO2 over the boreal forest: NOx sinks and HNO3 sources, Atmos. Chem. Phys., 13, 4543–4562, https://doi.org/10.5194/acp-13-4543-2013, 2013.
Burkholder, J. B., Sander, S. P., Abbatt, J. P. D., Barker, J. R., Huie, R. E., Kolb, C. E., Kurylo, M. J., Orkin, V. L., Wilmouth, D. M., and Wine, P. H.: JPL Publication 15-10 Chemical Kinetics and Photochemical Data for Use in Atmospheric Studies, 18, NASA Jet Propulsion Laboratory, available at: https://jpldataeval.jpl.nasa.gov/ (last access: 20 April 2019), 2015.
Castellanos, P. and Boersma, K. F.: Reductions in nitrogen oxides over Europe driven by environmental policy and economic recession, Sci. Rep.-UK, 2, 1–7, https://doi.org/10.1038/srep00265, 2012.
Crippa, M., Janssens-Maenhout, G., Dentener, F., Guizzardi, D., Sindelarova, K., Muntean, M., Van Dingenen, R., and Granier, C.: Forty years of improvements in European air quality: regional policy-industry interactions with global impacts, Atmos. Chem. Phys., 16, 3825–3841, https://doi.org/10.5194/acp-16-3825-2016, 2016.
de Gouw, J. A., Parrish, D. D., Brown, S. S., Edwards, P., Gilman, J. B., Graus, M., Hanisco, T. F., Kaiser, J., Keutsch, F. N., Kim, S.-W., Lerner, B. M., Neuman, J. A., Nowak, J. B., Pollack, I. B., Roberts, J. M., Ryerson, T. B., Veres, P. R., Warneke, C., and Wolfe, G. M.: Hydrocarbon Removal in Power Plant Plumes Shows Nitrogen Oxide Dependence of Hydroxyl Radicals, Geophys. Res. Lett., 46, 7752–7760, https://doi.org/10.1029/2019GL083044, 2019.
Dekker, I. N., Houweling, S., Aben, I., Röckmann, T., Krol, M., Martínez-Alonso, S., Deeter, M. N., and Worden, H. M.: Quantification of CO emissions from the city of Madrid using MOPITT satellite retrievals and WRF simulations, Atmos. Chem. Phys., 17, 14675–14694, https://doi.org/10.5194/acp-17-14675-2017, 2017.
ECCAD: Emissions of atmospheric Compounds and Compilation of Ancillary data, available at: https://eccad3.sedoo.fr/, last access: 18 October 2018.
ECMWF: CAMS Near-real-time, available at: https://apps.ecmwf.int/datasets/data/cams-nrealtime/levtype=10 ml/, last access: 15 April 2019.
ESA and Copernicus: Sentinel-5P Pre-Operations Data Hub, available at: https://s5phub.copernicus.eu, http://www.tropomi.eu, last access: 8 November 2018.
Eskes, H. J. and Boersma, K. F.: Averaging kernels for DOAS total-column satellite retrievals, Atmos. Chem. Phys., 3, 1285–1291, https://doi.org/10.5194/acp-3-1285-2003, 2003.
Eskes, H. J. and Eichmann, K.-U.: S5P Mission Performance Centre Nitrogen Dioxide [L2___NO2___] Readme, Esa, available at: https://sentinel.esa.int/documents/247904/3541451/Sentinel-5P-Nitrogen-Dioxide-Level-2-Product-Readme-File, last access: 15 November 2019.
Eskes, H. J., van Geffen, J., Boersma, K. F., Eichmann, K.-U., Apituley, A., Pedergnana, M., Sneep, M., Pepijn, J., and Loyola, D.: Level 2 Product User Manual Henk Eskes, S5P-KNMI-L2-0021-MA, issue 3.0.0, available at: https://earth.esa.int/documents/247904/2474726/Sentinel-5P-Level-2-Product-User-Manual-Nitrogen-Dioxide, last access: 27 March 2019.
Farmer, D. K., Perring, A. E., Wooldridge, P. J., Blake, D. R., Baker, A., Meinardi, S., Huey, L. G., Tanner, D., Vargas, O., and Cohen, R. C.: Impact of organic nitrates on urban ozone production, Atmos. Chem. Phys., 11, 4085–4094, https://doi.org/10.5194/acp-11-4085-2011, 2011.
Flagan, R. C. and Seinfeld, J. H.: Fundamentals of Air Pollution Engineering., Prentice-Hall, Inc., Englewood CLiffs, NJ, ISBN 0-13-332537-7, available at: http://resolver.caltech.edu/CaltechBOOK:1988.001 (last access: 23 January 2019), 1988.
Frey, H. C. and Zheng, J.: Quantification of variability and uncertainty in air pollutant emission inventories: Method and case study for utility NOx emissions, J. Air Waste Manage., 52, 1083–1095, https://doi.org/10.1080/10473289.2002.10470837, 2002.
Granier, C., Bessagnet, B., Bond, T., D'Angiola, A., van der Gon, H. D., Frost, G. J., Heil, A., Kaiser, J. W., Kinne, S., Klimont, Z., Kloster, S., Lamarque, J. F., Liousse, C., Masui, T., Meleux, F., Mieville, A., Ohara, T., Raut, J. C., Riahi, K., Schultz, M. G., Smith, S. J., Thompson, A., van Aardenne, J., van der Werf, G. R., and van Vuuren, D. P.: Evolution of anthropogenic and biomass burning emissions of air pollutants at global and regional scales during the 1980–2010 period, Climatic Change, 109, 163–190, https://doi.org/10.1007/s10584-011-0154-1, 2011.
Griffin, D., Zhao, X., McLinden, C. A., Boersma, F., Bourassa, A., Dammers, E., Degenstein, D., Eskes, H., Fehr, L., Fioletov, V., Hayden, K., Kharol, S. K., Li, S. M., Makar, P., Martin, R. V., Mihele, C., Mittermeier, R. L., Krotkov, N., Sneep, M., Lamsal, L. N., ter Linden, M., van Geffen, J., Veefkind, P., and Wolde, M.: High-Resolution Mapping of Nitrogen Dioxide With TROPOMI: First Results and Validation Over the Canadian Oil Sands, Geophys. Res. Lett., 46, 1049–1060, https://doi.org/10.1029/2018GL081095, 2019.
Guerreiro, C. B. B., Foltescu, V., and de Leeuw, F.: Air quality status and trends in Europe, Atmos. Environ., 98, 376–384, https://doi.org/10.1016/j.atmosenv.2014.09.017, 2014.
Hakkarainen, J., Ialongo, I., and Tamminen, J.: Direct space-based observations of anthropogenic CO2 emission areas from OCO-2, Geophys. Res. Lett., 43, 11400–11406, https://doi.org/10.1002/2016GL070885, 2015.
Huijnen, V., Pozzer, A., Arteta, J., Brasseur, G., Bouarar, I., Chabrillat, S., Christophe, Y., Doumbia, T., Flemming, J., Guth, J., Josse, B., Karydis, V. A., Marécal, V., and Pelletier, S.: Quantifying uncertainties due to chemistry modelling – evaluation of tropospheric composition simulations in the CAMS model (cycle 43R1), Geosci. Model Dev., 12, 1725–1752, https://doi.org/10.5194/gmd-12-1725-2019, 2019.
Jacob, D. J.: Introduction to Atmospheric Chemistry: Daniel J. Jacob; Princeton University Press, Princeton, NJ, 1999, 266pp., ISBN 0-691-00185-5, Atmos. Environ., 35, 1715, https://doi.org/10.1016/s1352-2310(00)00432-5, 1999.
Janssens-Maenhout, G., Crippa, M., Guizzardi, D., Dentener, F., Muntean, M., Pouliot, G., Keating, T., Zhang, Q., Kurokawa, J., Wankmüller, R., Denier van der Gon, H., Kuenen, J. J. P., Klimont, Z., Frost, G., Darras, S., Koffi, B., and Li, M.: HTAP_v2.2: a mosaic of regional and global emission grid maps for 2008 and 2010 to study hemispheric transport of air pollution, Atmos. Chem. Phys., 15, 11411–11432, https://doi.org/10.5194/acp-15-11411-2015, 2015.
Jiang, Z., Worden, J. R., Worden, H., Deeter, M., Jones, D. B. A., Arellano, A. F., and Henze, D. K.: A 15-year record of CO emissions constrained by MOPITT CO observations, Atmos. Chem. Phys., 17, 4565–4583, https://doi.org/10.5194/acp-17-4565-2017, 2017.
Konovalov, I. B., Berezin, E. V., Ciais, P., Broquet, G., Beekmann, M., Hadji-Lazaro, J., Clerbaux, C., Andreae, M. O., Kaiser, J. W., and Schulze, E.-D.: Constraining CO2 emissions from open biomass burning by satellite observations of co-emitted species: a method and its application to wildfires in Siberia, Atmos. Chem. Phys., 14, 10383–10410, https://doi.org/10.5194/acp-14-10383-2014, 2014.
Korontzi, S., Ward, D. E., Susott, R. A., Yokelson, R. J., Justice, C. O., Hobbs, P. V., Smithwick, E. A. H., and Hao, W. M.: Seasonal variation and ecosystem dependence of emission factors for selected trace gases and PM2.5 for southern African savanna fires, J. Geophys. Res.-Atmos., 108, 4758, https://doi.org/10.1029/2003jd003730, 2003.
Krol, M., Houweling, S., Bregman, B., van den Broek, M., Segers, A., van Velthoven, P., Peters, W., Dentener, F., and Bergamaschi, P.: The two-way nested global chemistry-transport zoom model TM5: algorithm and applications, Atmos. Chem. Phys., 5, 417–432, https://doi.org/10.5194/acp-5-417-2005, 2005.
Lambert, J.-C., Keppens, A., Hubert, D., Langerock, B., Eichmann, K.-U., Kleipool, Q., Sneep, M., Verhoelst, T., Wagner, T., Weber, M., Ahn, C., Argyrouli, A., Balis, D., Chan, K. L., Compernolle, S., De Smedt, I., Eskes, H., Fjæraa, A. M., Garane, K., Gleason, J. F., Goutail, F., Granville, J., Hedelt, P., Heue, K.-P., Jaross, G., Koukouli, M. L., Landgraf, J., Lutz, R., Niemejer, S., Pazmiño, A., Pinardi, G., Pommereau, J.-P., Richter, A., Rozemeijer, N., Sha, M. K., Stein Zweers, D., Theys, N., Tilstra, G., Torres, O., Valks, P., Vigouroux, C., and Wang, P.: S5P MPC Routine Operations Consolidated Validation Report series, Issue #03, Version 03.0.1, 125 pp., available at: https://www.tropomi.eu/sites/default/files/files/publicS5P-MPC-IASB-ROCVR-03.0.1-20190621_FINAL.pdf, last access: 18 August 2019.
Landgraf, J., aan de Brugh, J., Scheepmaker, R., Borsdorff, T., Hu, H., Houweling, S., Butz, A., Aben, I., and Hasekamp, O.: Carbon monoxide total column retrievals from TROPOMI shortwave infrared measurements, Atmos. Meas. Tech., 9, 4955–4975, https://doi.org/10.5194/amt-9-4955-2016, 2016.
Landgraf, J., Brugh, J. De, Scheepmaker, R. A., Borsdorff, T., Houweling, S., and Hasekamp, O. P.: Algorithm TheoreticalBaseline Document for Sentinel-5 Precursor in: Carbon Monoxide Total Column Retrieval, issue 1.10, available at: https://www.tropomi.eu/sites/default/files/files/SRON_S5P_LEV2_RP_002_issue1.10_CO_signed.pdf, last access: 10 October 2018.
Lang, M. N., Gohm, A., and Wagner, J. S.: The impact of embedded valleys on daytime pollution transport over a mountain range, Atmos. Chem. Phys., 15, 11981–11998, https://doi.org/10.5194/acp-15-11981-2015, 2015.
Lorente, A., Folkert Boersma, K., Yu, H., Dörner, S., Hilboll, A., Richter, A., Liu, M., Lamsal, L. N., Barkley, M., De Smedt, I., Van Roozendael, M., Wang, Y., Wagner, T., Beirle, S., Lin, J.-T., Krotkov, N., Stammes, P., Wang, P., Eskes, H. J., and Krol, M.: Structural uncertainty in air mass factor calculation for NO2 and HCHO satellite retrievals, Atmos. Meas. Tech., 10, 759–782, https://doi.org/10.5194/amt-10-759-2017, 2017.
Ma, J. and van Aardenne, J. A.: Impact of different emission inventories on simulated tropospheric ozone over China: a regional chemical transport model evaluation, Atmos. Chem. Phys., 4, 877–887, https://doi.org/10.5194/acp-4-877-2004, 2004.
Mijling, B. and Van Der A, R. J.: Using daily satellite observations to estimate emissions of short-lived air pollutants on a mesoscopic scale, J. Geophys. Res.-Atmos., 117, 1–20, https://doi.org/10.1029/2012JD017817, 2012.
Miyazaki, K., Eskes, H., Sudo, K., Boersma, K. F., Bowman, K., and Kanaya, Y.: Decadal changes in global surface NOx emissions from multi-constituent satellite data assimilation, Atmos. Chem. Phys., 17, 807–837, https://doi.org/10.5194/acp-17-807-2017, 2017.
Pommier, M., McLinden, C. A., and Deeter, M.: Relative changes in CO emissions over megacities based on observations from space, Geophys. Res. Lett., 40, 3766–3771, https://doi.org/10.1002/grl.50704, 2013.
Reuter, M., Buchwitz, M., Hilboll, A., Richter, A., Schneising, O., Hilker, M., Heymann, J., Bovensmann, H., and Burrows, J. P.: Decreasing emissions of NOx relative to CO2 in East Asia inferred from satellite observations, Nat. Geosci., 7, 792–795, https://doi.org/10.1038/ngeo2257, 2014.
Reuter, M., Buchwitz, M., Schneising, O., Krautwurst, S., O'Dell, C. W., Richter, A., Bovensmann, H., and Burrows, J. P.: Towards monitoring localized CO2 emissions from space: co-located regional CO2 and NO2 enhancements observed by the OCO-2 and S5P satellites, Atmos. Chem. Phys., 19, 9371–9383, https://doi.org/10.5194/acp-19-9371-2019, 2019.
Romer, P. S., Duffey, K. C., Wooldridge, P. J., Edgerton, E., Baumann, K., Feiner, P. A., Miller, D. O., Brune, W. H., Koss, A. R., de Gouw, J. A., Misztal, P. K., Goldstein, A. H., and Cohen, R. C.: Effects of temperature-dependent NOx emissions on continental ozone production, Atmos. Chem. Phys., 18, 2601–2614, https://doi.org/10.5194/acp-18-2601-2018, 2018.
Romer Present, P. S., Zare, A., and Cohen, R. C.: The changing role of organic nitrates in the removal and transport of NOx, Atmos. Chem. Phys., 20, 267–279, https://doi.org/10.5194/acp-20-267-2020, 2020.
Schneider, P., Lahoz, W. A., and van der A, R.: Recent satellite-based trends of tropospheric nitrogen dioxide over large urban agglomerations worldwide, Atmos. Chem. Phys., 15, 1205–1220, https://doi.org/10.5194/acp-15-1205-2015, 2015.
Seinfeld, J. H. and Pandis, S. N.: Atmospheric Chemistry and Physics: From Air Pollution to Climate Change, 2nd Edn., John Wiley and Sons Inc., 2006.
Silva, S. and Arellano, A.: Characterizing Regional-Scale Combustion Using Satellite Retrievals of CO, NO2 and CO2, Remote Sens., 9, 744, https://doi.org/10.3390/rs9070744, 2017.
Silva, S. J., Arellano, A. F., and Worden, H. M.: Toward anthropogenic combustion emission constraints from space-based analysis of urban CO2∕CO sensitivity, Geophys. Res. Lett., 40, 4971–4976, https://doi.org/10.1002/grl.50954, 2013.
Sinha, P., Hobbs, P. V., Yokelson, R. J., Bertschi, I. T., Blake, D. R., Simpson, I. J., Gao, S., Kirchstetter, T. W., and Novakov, T.: Emissions of trace gases and particles from savanna fires in southern Africa, J. Geophys. Res.-Atmos., 108, 8487, https://doi.org/10.1029/2002JD002325, 2003.
Sobanski, N., Thieser, J., Schuladen, J., Sauvage, C., Song, W., Williams, J., Lelieveld, J., and Crowley, J. N.: Day and night-time formation of organic nitrates at a forested mountain site in south-west Germany, Atmos. Chem. Phys., 17, 4115–4130, https://doi.org/10.5194/acp-17-4115-2017, 2017.
South Coast Air Quality Management District (AQMD): Monitoring network, available at: http://www.aqmd.gov/, last access: 20 July 2019.
Tang, W. and Arellano, A. F.: Investigating dominant characteristics of fires across the Amazon during 2005–2014 through satellite data synthesis of combustion signatures, J. Geophys. Res.-Atmos., 122, 1224–1245, https://doi.org/10.1002/2016jd025216, 2017.
Tang, W., Arellano, A. F., Gaubert, B., Miyazaki, K., and Worden, H. M.: Satellite data reveal a common combustion emission pathway for major cities in China, Atmos. Chem. Phys., 19, 4269–4288, https://doi.org/10.5194/acp-19-4269-2019, 2019.
United Nations: World Urbanization Prospects: an alternative to the UN model of projection compatible with the mobility transition theory, Demogr. Res., 12, 197–236, https://doi.org/10.4054/demres.2005.12.9, 2018.
Vallero, D. A.: Fundamentals of Air Pollution, in: Fundamentals of Air Pollution, Elsevier Inc., https://doi.org/10.1016/B978-0-12-373615-4.X5000-6, 2007.
van Geffen, J. H. G. M., Eskes, H. J., Boersma, K. F., Maasakkers, J. D., and Veefkind, J. P.: TROPOMI ATBD of the total and tropospheric NO2 data products, S5P-KNMI-L2-0005-RP, S5P-Knmi-L2-0005-Rp (1.4.0), 1–76, available at: https://sentinel.esa.int/documents/247904/2476257/Sentinel-5P-TROPOMI-ATBD-NO2-data-products, last access: 6 Feburary 2019.
Veefkind, J. P., Aben, I., McMullan, K., Förster, H., de Vries, J., Otter, G., Claas, J., Eskes, H. J., de Haan, J. F., Kleipool, Q., van Weele, M., Hasekamp, O., Hoogeveen, R., Landgraf, J., Snel, R., Tol, P., Ingmann, P., Voors, R., Kruizinga, B., Vink, R., Visser, H., and Levelt, P. F.: TROPOMI on the ESA Sentinel-5 Precursor: A GMES mission for global observations of the atmospheric composition for climate, air quality and ozone layer applications, Remote Sens. Environ., 120, 70–83, https://doi.org/10.1016/j.rse.2011.09.027, 2012.
Ward, D. E., Hao, W. M., Susott, R. A., Babbitt, R. E., Shea, R. W., Kauffman, J. B., and Justice, C. O.: Effect of fuel composition on combustion efficiency and emission factors for African savanna ecosystems, J. Geophys. Res.-Atmos., 101, 23569–23576, https://doi.org/10.1029/95jd02595, 1996.
Williams, J. E., Boersma, K. F., Le Sager, P., and Verstraeten, W. W.: The high-resolution version of TM5-MP for optimized satellite retrievals: description and validation, Geosci. Model Dev., 10, 721–750, https://doi.org/10.5194/gmd-10-721-2017, 2017.
Yokelson, R. J., Griffith, D. W. T., and Ward, D. E.: Open-path Fourier transform infrared studies of large-scale laboratory biomass fires, J. Geophys. Res.-Atmos., 101, 21067–21080. https://doi.org/10.1029/96jd01800, 1996.
Yokelson, R. J., Bertschi, I. T., Christian, T. J., Hobbs, P. V., Ward, D. E., and Hao, W. M.: Trace gas measurements in nascent, aged, and cloud-processed smoke from African savanna fires by airborne Fourier transform infrared spectroscopy (AFTIR), J. Geophys. Res.-Atmos., 108, 8478, https://doi.org/10.1029/2002jd002322, 2003.
Zhao, Y., Nielsen, C. P., Lei, Y., McElroy, M. B., and Hao, J.: Quantifying the uncertainties of a bottom-up emission inventory of anthropogenic atmospheric pollutants in China, Atmos. Chem. Phys., 11, 2295–2308, https://doi.org/10.5194/acp-11-2295-2011, 2011.
Zhao, Y., Nielsen, C. P., McElroy, M. B., Zhang, L., and Zhang, J.: CO emissions in China: Uncertainties and implications of improved energy efficiency and emission control, Atmos. Environ., 49, 103–113, https://doi.org/10.1016/j.atmosenv.2011.12.015, 2012.