the Creative Commons Attribution 4.0 License.
the Creative Commons Attribution 4.0 License.
 | 17 Jul 2019
Mechanisms for a remote response to Asian anthropogenic aerosol in boreal winter
Nick Dunstone
Anna Lewinschal
Massimo Bollasina
Annica M. L. Ekman
Eleanor J. Highwood
Asian emissions of anthropogenic aerosols and their precursors have increased rapidly since 1980, with half of the increase since the pre-industrial era occurring in this period. Transient experiments with the HadGEM3-GC2 coupled model were designed to isolate the impact of Asian anthropogenic aerosols on global climate in boreal winter. It is found that this increase has resulted in local circulation changes, which in turn have driven decreases in precipitation over China, alongside an intensification of the offshore monsoon flow. No large temperature changes are seen over China. Over India, the opposite response is found, with decreasing temperatures and increasing precipitation. The dominant feature of the local circulation changes is an increase in low-level convergence, ascent, and precipitation over the Maritime Continent, which forms part of a tropical Pacific-wide La Niña-like response.
HadGEM3-GC2 also simulates pronounced far-field responses. A decreased meridional temperature gradient in the North Pacific leads to a positive Pacific–North American circulation pattern, with associated temperature anomalies over the North Pacific and North America. Anomalous northeasterly flow over northeast Europe drives advection of cold air into central and western Europe, causing cooling in this region. An anomalous anticyclonic circulation over the North Atlantic causes drying over western Europe. Using a steady-state primitive equation model, LUMA, we demonstrate that these far-field midlatitude responses arise primarily as a result of Rossby waves generated over China, rather than in the equatorial Pacific.
- Article
(13728 KB) - Full-text XML
- BibTeX
- EndNote


Anthropogenic aerosols account for the largest uncertainty in the radiative forcing of climate (Boucher et al., 2013). Aerosols can affect climate by modulating shortwave and, to some extent, longwave radiation (aerosol radiation interactions), and through their interactions with clouds (aerosol–cloud interactions). They can act as cloud condensation nuclei which, for constant water availability, results in a reduction in the size of cloud droplets and an increase in cloud albedo (Twomey et al., 1984). Furthermore, smaller droplets reduce the efficiency of precipitation formation, which can lead to increases in cloud lifetime and depth (Albrecht, 1989). Absorbing aerosols introduced to a cloud layer can also cause a reduction in cloud amount by inducing local heating in the layer and cloud evaporation (semi-direct effect). Overall, increases in aerosol emissions act to cool the climate, with a 1750–2011 radiative forcing of −0.9 (−1.9 to −0.1) W m−2 compared to 2.83 (2.54 to 3.12) W m−2 from greenhouse gases (Myhre et al., 2013).
Due to numerous chemical and physical removal processes, anthropogenic aerosols only have a short residence time in the atmosphere (of the order of a few days to a couple of weeks), which causes their distribution, and the associated climate forcing, to be spatially heterogeneous. As such, aerosols can induce substantial changes in atmospheric circulation and extend an influence over long distances (Rotstayn and Lohmann, 2002; Ramanathan et al., 2005; Allen et al., 2015). Indeed, the influence of remote forcing can outweigh that of local forcing (Shindell et al., 2012; Lewinschal et al., 2013). This adds additional complexity and complications in identifying the climate imprint of aerosols due to the large uncertainty in the atmospheric circulation response, especially at sub-continental scales, yet this is key to understanding drivers and projections of regional climate change.
The preferential cooling of the Northern Hemisphere, where most emissions of aerosols and their precursors are made, has been linked to a southward shift in the inter-tropical convergence zone (Hwang et al., 2013; Allen et al., 2015; Ridley et al., 2015; Allen and Ajoku, 2016; Navarro et al., 2017; Voigt et al., 2017) and a weakening of the global monsoon (Polson et al., 2014). Increases in anthropogenic aerosol have also been associated with an equatorward shift of the Northern Hemisphere storm tracks (Kristjánsson et al., 2005; Ming and Ramaswamy, 2009), decreases in Sahel rainfall (Biasutti and Giannini, 2006; Rotstayn and Lohmann, 2002), and a weakening of the south Asian monsoon (Bollasina et al., 2011).
Some studies have shown that the spatial patterns of temperature and precipitation responses to aerosol and precursor emission changes are similar, regardless of the emission location, as they project onto modes of climate variability (Dong et al., 2014, 2016; Kang et al., 2017; Kasoar et al., 2018; Westervelt et al., 2018). Such findings are not unanimous, with other work suggesting that the spatial pattern of the aerosol-induced climate response is dependent on the emissions location (Wang, 2015; Aamaas et al., 2016). Similarly, there is still debate about whether the climate response to increases in anthropogenic aerosols is a simple mirror of the response to increasing greenhouse gases (e.g. Feichter et al., 2004; Xie et al., 2013; Gillett et al., 2013).
In cases where similar patterns of climate change are found in response to aerosol from different regions, the patterns may still arise via different mechanisms depending on the emission region (Dong et al., 2014, 2016). Similarly, in cases where the circulation response to increases in aerosols and greenhouse gases appear to mirror each other, the underlying mechanisms for the change can differ. For example, Ming et al. (2011) showed that aerosols increase baroclinic instability and cause an equatorward shift in the midlatitude jet by enhancing wind shear, while greenhouse gases decrease baroclinic instability and cause a poleward shift in the jet by stabilizing the troposphere. Such mechanistic differences demonstrate that the climate response to aerosols is unlikely to be a simple mirror of the response to greenhouse gases. As aerosols have been found to cause greater changes in precipitation (e.g. Richardson et al., 2016; Hodnebrog et al., 2016) and extreme events (Samset et al., 2018) per degree of surface temperature change than greenhouse gases, it is important to understand the mechanisms by which regional climate responses to anthropogenic aerosol arise.
Rapid growth in manufacturing and urbanization, and a reliance on coal for power generation, has resulted in a substantial increase in the emissions of anthropogenic aerosols and their precursors in Asia since the 1950s (Lin et al., 2016). As a result, local air pollution has increased (Tao et al., 2016). It has also been suggested that transported Asian aerosols may account for around a third of background sulfate in the United States (Park et al., 2004). European anthropogenic aerosol (e.g. Aamaas et al., 2016; Liu et al., 2018) and midlatitude forcing in general (Byrne and Schneider, 2018) have been shown to be more effective at changing climate per unit emission tropical forcing. However, they have been reducing since the 1970s so that Asian aerosols will most likely dominate global trends in coming decades as air quality concerns have the potential to result in large emissions reductions there (van Vuuren et al., 2011; Riahi et al., 2017).
Only a limited number of studies have focused on the boreal winter (December to February; DJF) response to Asian anthropogenic aerosol. The majority have focused on boreal summer (June to August; JJA), in order to examine the aerosol impact on the summer monsoon (Bollasina et al., 2011; Bartlett et al., 2018) or annual means (e.g. Richardson et al., 2016; Kasoar et al., 2016, 2018; Liu et al., 2018; Grandey et al., 2016), which can make circulation responses difficult to interpret. Liu et al. (2018) and Menon et al. (2002) both identify remote responses to Asian aerosols in JJA. In addition, Chung and Seinfeld (2005), Allen and Sherwood (2011), and Lewinschal et al. (2013) all identify far-field responses to global aerosol emissions in DJF, particularly at high latitudes in the Northern Hemisphere.
A widespread response to Asian aerosol and precursor emissions is typically found in the tropics, where the small Coriolis parameter allows the influence of a regional forcing to spread throughout the tropics (Sobel et al., 2001; Ming and Ramaswamy, 2011). Circulation responses in the Pacific basin that arise as a result of changes in heating near the Equator are likely to be well explained by the models of Matsuno (1966) and Gill (1980). For a heating anomaly on the Equator, such a response will involve low pressure centres on either side of the Equator, with low-level eastward winds along the Equator to the west and westward winds to the east. Bjerknes (1966) and Bjerknes (1969) present a mechanism for the midlatitude response to a tropical Pacific anomaly, with a heating anomaly leading to a strengthening of the Aleutian low. Extension of the response into the Atlantic basin typically arises via tropically generated Rossby waves (Hoskins and Karoly, 1981; Ting et al., 1996; Held et al., 2002; Scaife et al., 2017). Stratospheric pathways for teleconnections between the tropical Pacific and the North Atlantic have also been proposed (Bell et al., 2009; Allen and Sherwood, 2011; Domeisen et al., 2015).
In this study, we focus on the large-scale temperature and precipitation response to increases in Asian emissions of aerosol and their precursors, “Asian anthropogenic aerosol” (specifically sulfur dioxide, the precursor of sulfate aerosols, black carbon and organic carbon) since 1980. Asian anthropogenic aerosol has increased rapidly since 1980 and is currently the largest anthropogenic aerosol source region worldwide (Klimont et al., 2013). Our analysis focuses on DJF, as this is the season when atmospheric teleconnections between the Asia-Pacific region and the midlatitudes are strongest (Diaz et al., 2001; Thomson and Vallis, 2019). In Sect. 3 we examine the response in a fully coupled general circulation model (GCM), before using a reduced-complexity model to help us identify the main drivers of the teleconnection with Europe and North America, which will be discussed in Sect. 4.
We use two models of different complexity to identify the far-field response to increases in Asian anthropogenic aerosol between 1980 and 2012: a fully coupled atmosphere–ocean general circulation model, HadGEM3-GC2, and a steady-state primitive equation model, Linear University Model of the Atmosphere (LUMA). LUMA only accounts for the direct, stationary response of the atmosphere to a prescribed forcing (heating perturbation). Used alongside HadGEM3-GC2, it provides additional insight into the origins and pathways of the large-scale atmospheric response to Asian anthropogenic aerosols. Such an approach has been successfully used by Teng et al. (2012) and Ming et al. (2011) to demonstrate the potential of Asian emissions of black carbon to influence temperatures in the United States and Northern Hemisphere extratropics respectively and by Lewinschal et al. (2013) to explain the Northern Hemisphere response to changes in global aerosol emissions.
2.1 HadGEM3-GC2
The Met Office Unified Model (Global Coupled configuration 2) HadGEM3-GC2 (Williams et al., 2015) was run with a horizontal resolution of N216 (∼60 km) in the atmosphere and 1∕4∘ in the ocean. A total of 85 vertical levels are used in the atmosphere. HadGEM3-GC2 uses the same CLASSIC aerosol scheme (Bellouin et al., 2007), as its CMIP5 predecessor, HadGEM2-ES (Collins et al., 2011). Changes in cloud droplet effective radius, for aerosol indirect effects, are a prognostic function of cloud droplet number concentration and cloud liquid water content (Bellouin et al., 2007). HadGEM3-GC2 includes ENDGame (Even Newer Dynamics for Global Atmospheric Modelling of the Environment, Wood et al., 2014), which is a substantial revision of the atmosphere dynamical core relative to the HadGEM2 family of models and overall shows significant improvements in mean bias and variability compared to previous model configurations (Senior et al., 2016).
The main mean-state biases in HadGEM3-GC2 are described in detail by Williams et al. (2015). Of particular relevance to our study, Williams et al. (2015) find that the excess equatorial easterly wind stress common in earlier versions of the Met Office climate models is improved in HadGEM3-GC2, primarily through a change to the gravity wave drag scheme, which results in El Niño–Southern Oscillation (ENSO) and its teleconnections being well simulated.
We compare simulations with time-varying anthropogenic aerosol and precursor emissions against simulations where Asian emissions of anthropogenic aerosols and their precursors (specifically sulfur dioxide, biomass burning aerosol, soot, and fossil fuel organic carbon) were fixed (Fig. 1). In the fixed aerosol case, all emissions of anthropogenic aerosol and their precursors are fixed at their 1971–1980 mean values over Asia (5.0 to 47.5∘ N, 67.5 to 145∘ E; illustrated in Fig. 2a). The experiments are driven by CMIP5 historical forcings up to and including the year 2005 (Lamarque et al., 2010) and are driven by RCP4.5 thereafter (van Vuuren et al., 2011; Meinshausen et al., 2011).
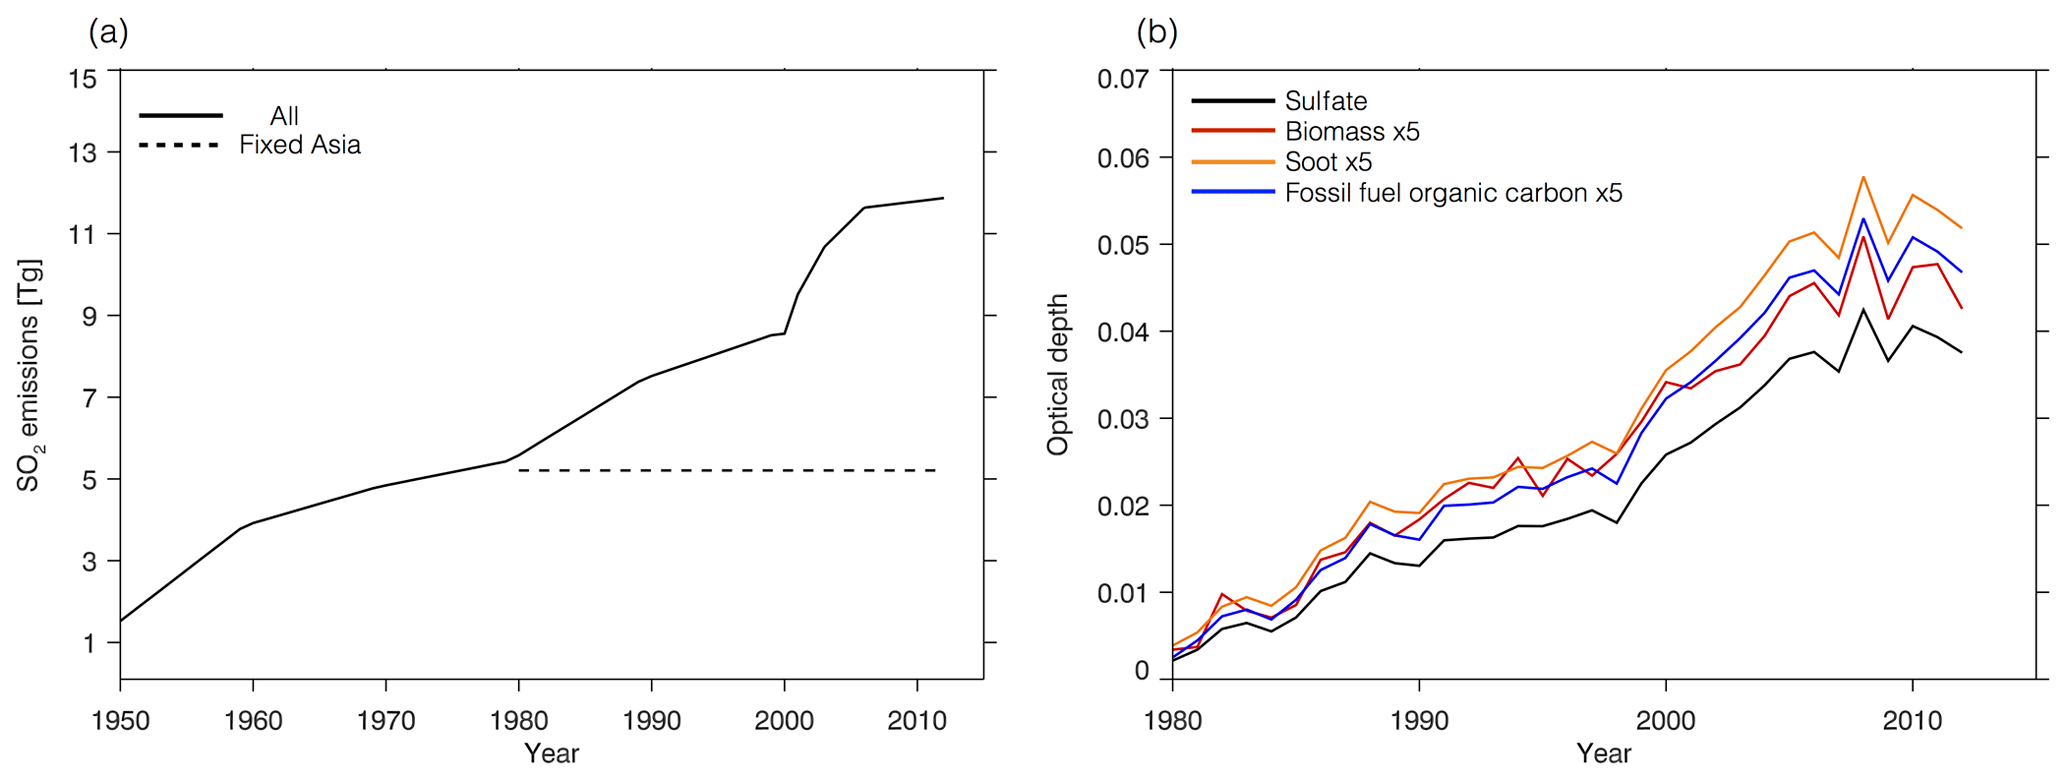
Figure 1(a) Total emissions of sulfur dioxide over Asia from 1950 to 2012 in the historical experiment (solid line). The dashed line indicates 1971–1980 mean values, as used in the fixed Asia experiment. (b) Ensemble mean optical depth of anthropogenic aerosol species in response to Asian aerosol and precursor emissions (historical – fixed Asia), averaged over Asia.
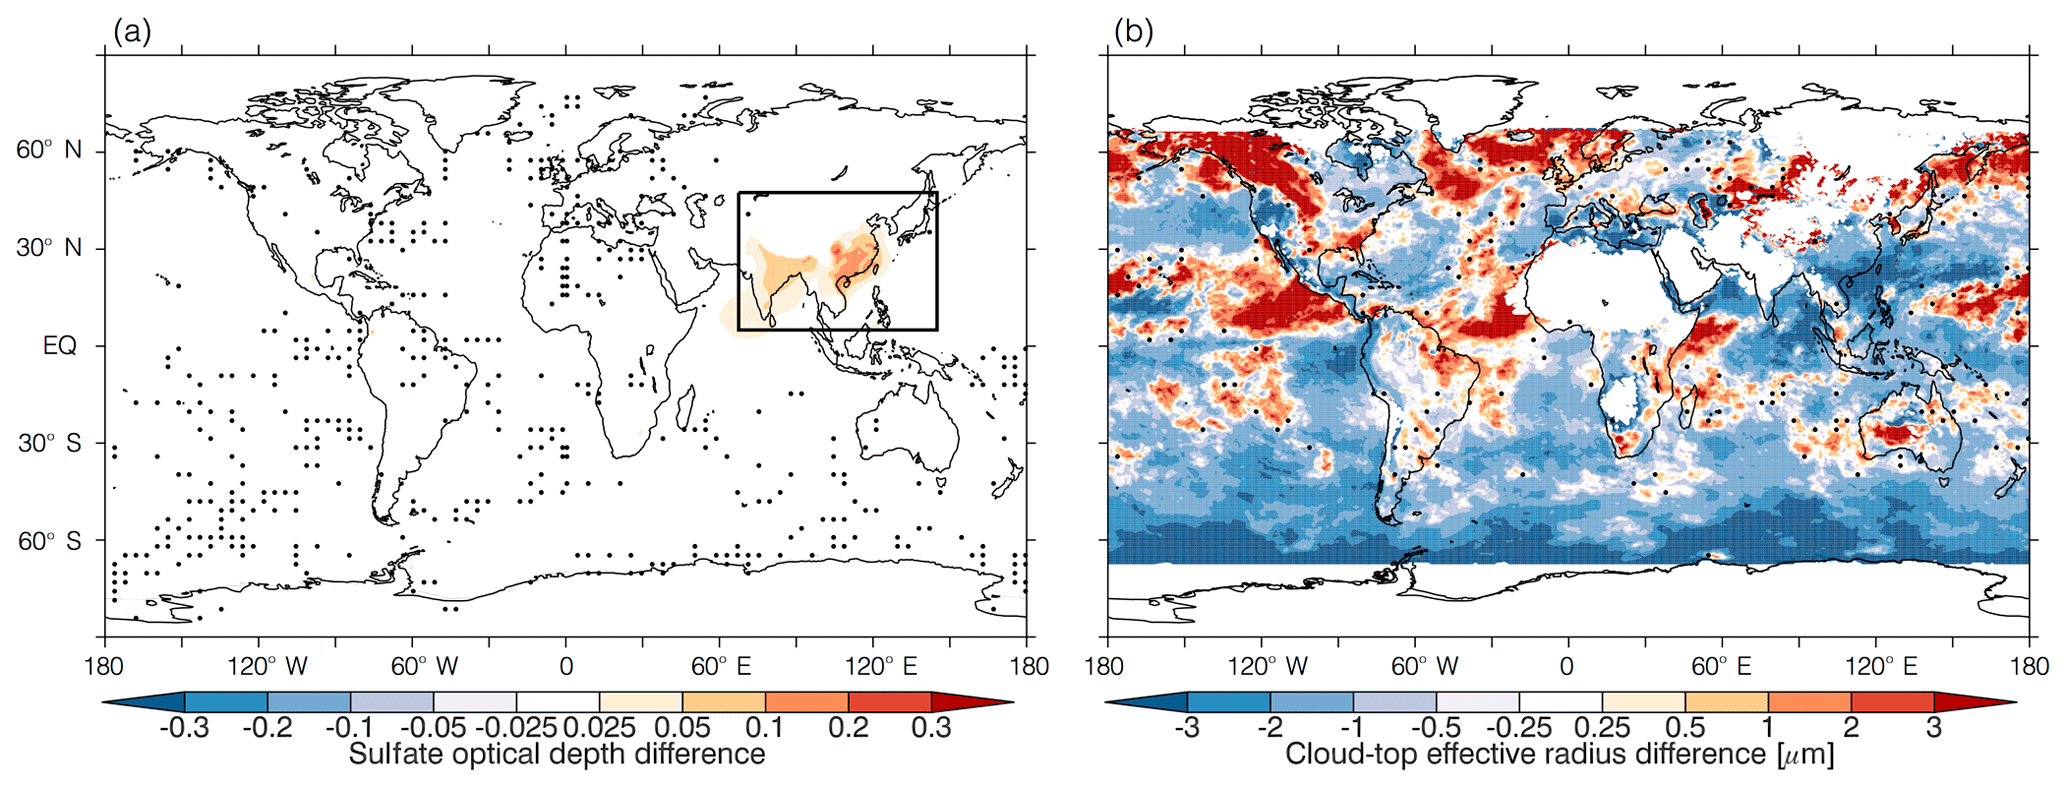
Figure 2Ensemble mean, (1998–2012) vs. (1979–1993), difference in (a) sulfate optical depth (with the black box indicating the emission region), and (b) cloud-top effective radius. Dots indicate where the response is not significant at the 10 % level, as calculated using a two-tailed Student's t test. Figure 6c shows the agreement of individual ensemble members on the sign of the anomaly in cloud-top effective radius shown in panel (b).
A historical experiment, with all forcings transient from 1959 to 2012, was performed. This experiment consists of four ensemble members, each initialized from different atmosphere and ocean states. In November 1970, four parallel runs with fixed anthropogenic aerosol and precursor emissions (Fig. 1a) were branched. We conduct our analysis from 1979 to allow for a residual response from the sudden change in aerosol in 1970. We assume that the response to Asian anthropogenic aerosol alone is given by the difference of these two experiments (historical – fixed Asia). Throughout the paper, we define the response to the increase in Asian anthropogenic aerosol as the ensemble mean of the difference between these two experiments across two periods: 1998–2012 to 1979–1993. The perturbation in aerosol emissions and precursors in this period accounts for half of the Asian increase since 1900. By the 2000s, Asia accounts for 40 % of global aerosol and precursor emissions.
2.2 LUMA
LUMA is a linearized version of the Portable University Model of the Atmosphere (PUMA) (Fraedrich et al., 1998), which solves the steady-state primitive equations. The equations are linearized around a zonally symmetric basic state, and include tendencies for surface pressure, temperature, divergence, and vorticity (Liakka et al., 2012; Lewinschal et al., 2013). LUMA has a horizontal resolution of T21 and 10 levels in the vertical.
The basic state in LUMA is specified from the 1980–2005-mean zonal-mean zonal, meridional, and vertical wind, temperature, and sea level pressure from HadGEM3-GC2. Lewinschal et al. (2013) showed that the anthropogenic aerosol-induced precipitation changes, and the associated diabatic heating, are the primary sources of Rossby waves in response to global aerosol emissions, and that the hemispheric-scale temperature pattern is the result of a wave response. Here, we will examine the role of precipitation anomalies in response to Asian anthropogenic aerosol in driving far-field responses. Precipitation anomalies from HadGEM3-GC2 are multiplied by the latent heat of evaporation to yield a heating rate, which is implemented in LUMA as a forcing term. The vertical distribution of heating in response to a precipitation anomaly is represented by a Gaussian function that integrates to 1, with a maximum at 550 hPa.
LUMA's linear framework assumes that the full wave response is a linear sum of regionally forced constituents. By forcing LUMA with regional components of the HadGEM3-GC2 response to Asian aerosol emissions, we will identify the main drivers of the full response.
The increase in Asian anthropogenic aerosol since 1980 results in an increase in aerosol optical depth over Asia (Fig. 1b). The ensemble mean increase in sulfate optical depth for (1998–2012) vs. (1979–1993) is shown in Fig. 2a. It is primarily located in the main emission regions in northern India and eastern China, with some transport over the Indian Ocean due to advection by the winter monsoon circulation. This increase in aerosol optical depth is associated with a distinct local decrease in cloud-top effective radius, which extends into cloudy regions in the west Pacific and the Bay of Bengal (Fig. 2b). Consistent with other models, aerosol cloud interactions play an important role in the local response to Asian anthropogenic aerosol in HadGEM3-GC2 (e.g. Wang, 2015; Chung and Soden, 2017; Dong et al., 2019).
Changes in cloud-top effective radius can also be seen further afield. While these changes are significant according to a Student's t test, many of them are not robust across all ensemble members (Fig. 6c). Robust changes outside the Asian region are associated with changes in cloud related to circulation changes that arise as a result of Asian anthropogenic aerosol, rather than via direct modification of the clouds by the aerosols themselves. For example, increased cloud-top effective radius in the North Pacific is due to a decrease in high cloud (Fig. 3b) associated with induced circulation changes in the North Pacific, and the changes in cloud-top effective radius over the Southern Ocean are associated with a shift in the Southern Hemisphere jet (Fig. 5d). Such a response has been noted in previous studies, but Southern Hemisphere circulation changes in response to anthropogenic aerosol are generally not robust (Rotstayn, 2013; Steptoe et al., 2016; Choi et al., 2018).
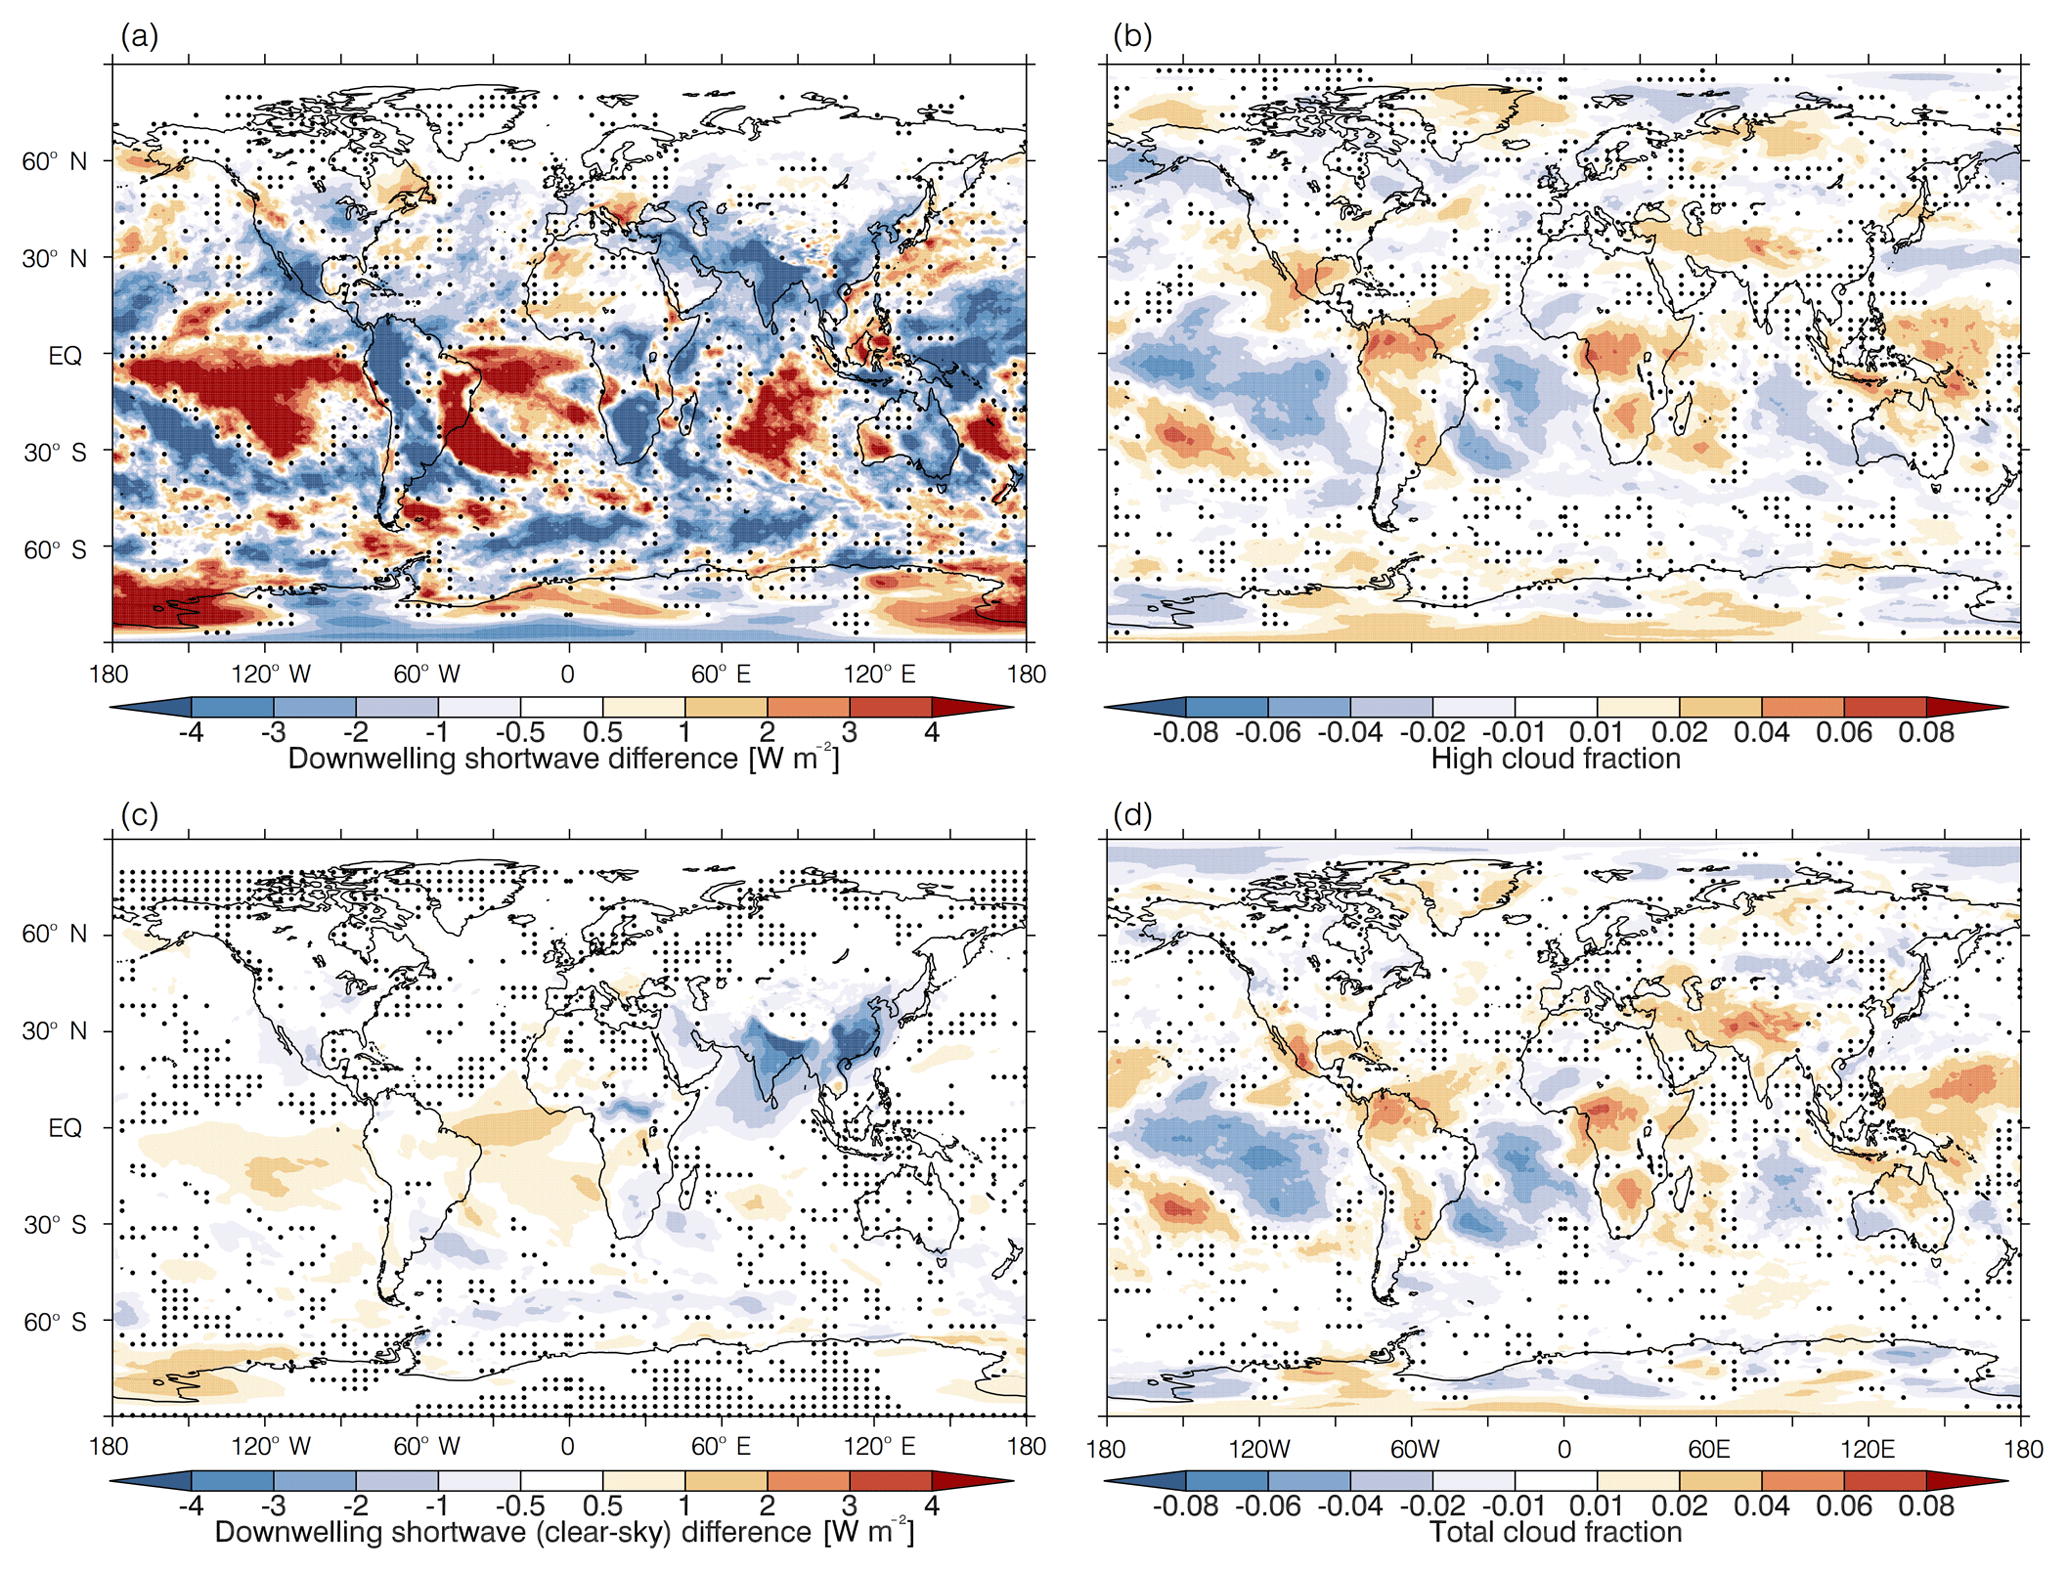
Figure 3Ensemble mean, (1998–2012) vs. (1979–1993), difference in (a) downwelling short wave at the surface, (b) high cloud fraction, (c) downwelling short wave at the surface (clear sky), and (d) total cloud fraction. Dots indicate where the response is not significant at the 10 % level, as calculated using a two-tailed Student's t test.
The increase in Asian aerosol optical depth, and local increase in cloud albedo via the Twomey effect, is associated with a decrease in downwelling shortwave radiation over both India and eastern China (co-located with the change in aerosol optical depth), and over the tropical west Pacific (Fig. 3a). The decrease in downwelling shortwave radiation due to the Twomey effect over the west Pacific is enhanced by an increase in the total cloud fraction in the same region (Fig. 3d). Over the East China Sea there is an increase in downwelling shortwave at the surface, which could be related to a decrease in local cloud fraction (Fig. 3a, d). Changes in cloud cover also affect shortwave radiation in areas outside the regions directly affected by aerosol emissions, such as over the southeast Pacific and south Atlantic (Fig. 3a, b, d). There is a decrease in downwelling longwave radiation (not shown) over the Maritime Continent due to moisture convergence (Fig. 5d) and associated cloudiness (Fig. 3d).
Over China there is no widespread reduction in near-surface temperature (Fig. 4a), despite the large change in aerosol optical depth there. This is a result of local competition between the direct and indirect effects of the aerosol changes (Wang, 2015; Dong et al., 2019). In fact, there is an increase in temperature east of China (Fig. 4a), which is related to a decrease in cloud fraction and increase in downwelling shortwave radiation there (Fig. 3a, d). Such a reduction may be associated with the semi-direct effect.

Figure 4Ensemble mean, (1998–2012) vs. (1979–1993), difference in (a) near-surface temperature, and (b) precipitation. Dots indicate where the response is not significant at the 10 % level, as calculated using a two-tailed Student's t test. Figure 6a and b show the agreement of individual ensemble members on the sign of the temperature and precipitation anomalies respectively.
In contrast to China, the decrease in downwelling shortwave radiation over India results in a widespread decrease in temperature (Figs 3a and 4a), and a local increase in sea level pressure (Fig. 5a). This causes a southwestward shift in precipitation (Fig. 4b), from the Bay of Bengal into the western equatorial Indian Ocean and draws air from the Maritime Continent and west Pacific into the Indian Ocean sector (Fig. 5d). Related to these changes is a region of descent over India and the Bay of Bengal (Fig. 5c) and a negative upper-tropospheric geopotential height anomaly over India (Fig. 5b).
The decrease in downwelling shortwave radiation over the west Pacific causes cooling (Fig. 4a) and a local increase in sea level pressure (Fig. 5a). This leads to a strengthening of the westerly monsoon flow over eastern China and southern Japan (Fig. 5d). The increase in sea level pressure is also related to low level convergence and ascent over the Maritime Continent (Figs. 5d and 7), which leads to an increase in cloud fraction (Fig. 3d). Ascent over the Maritime Continent is part of a meridional overturning anomaly, which has its descending branch over eastern China and the western tropical North Pacific (Fig. 7). This descent results in a reduction in precipitation in the region (Fig. 4b). The change in meridional overturning circulation in the west Pacific, and the associated cross-equatorial energy flux, acts to moderate some of the interhemispheric top of atmosphere radiation imbalance that results from increases in Asian anthropogenic aerosol.
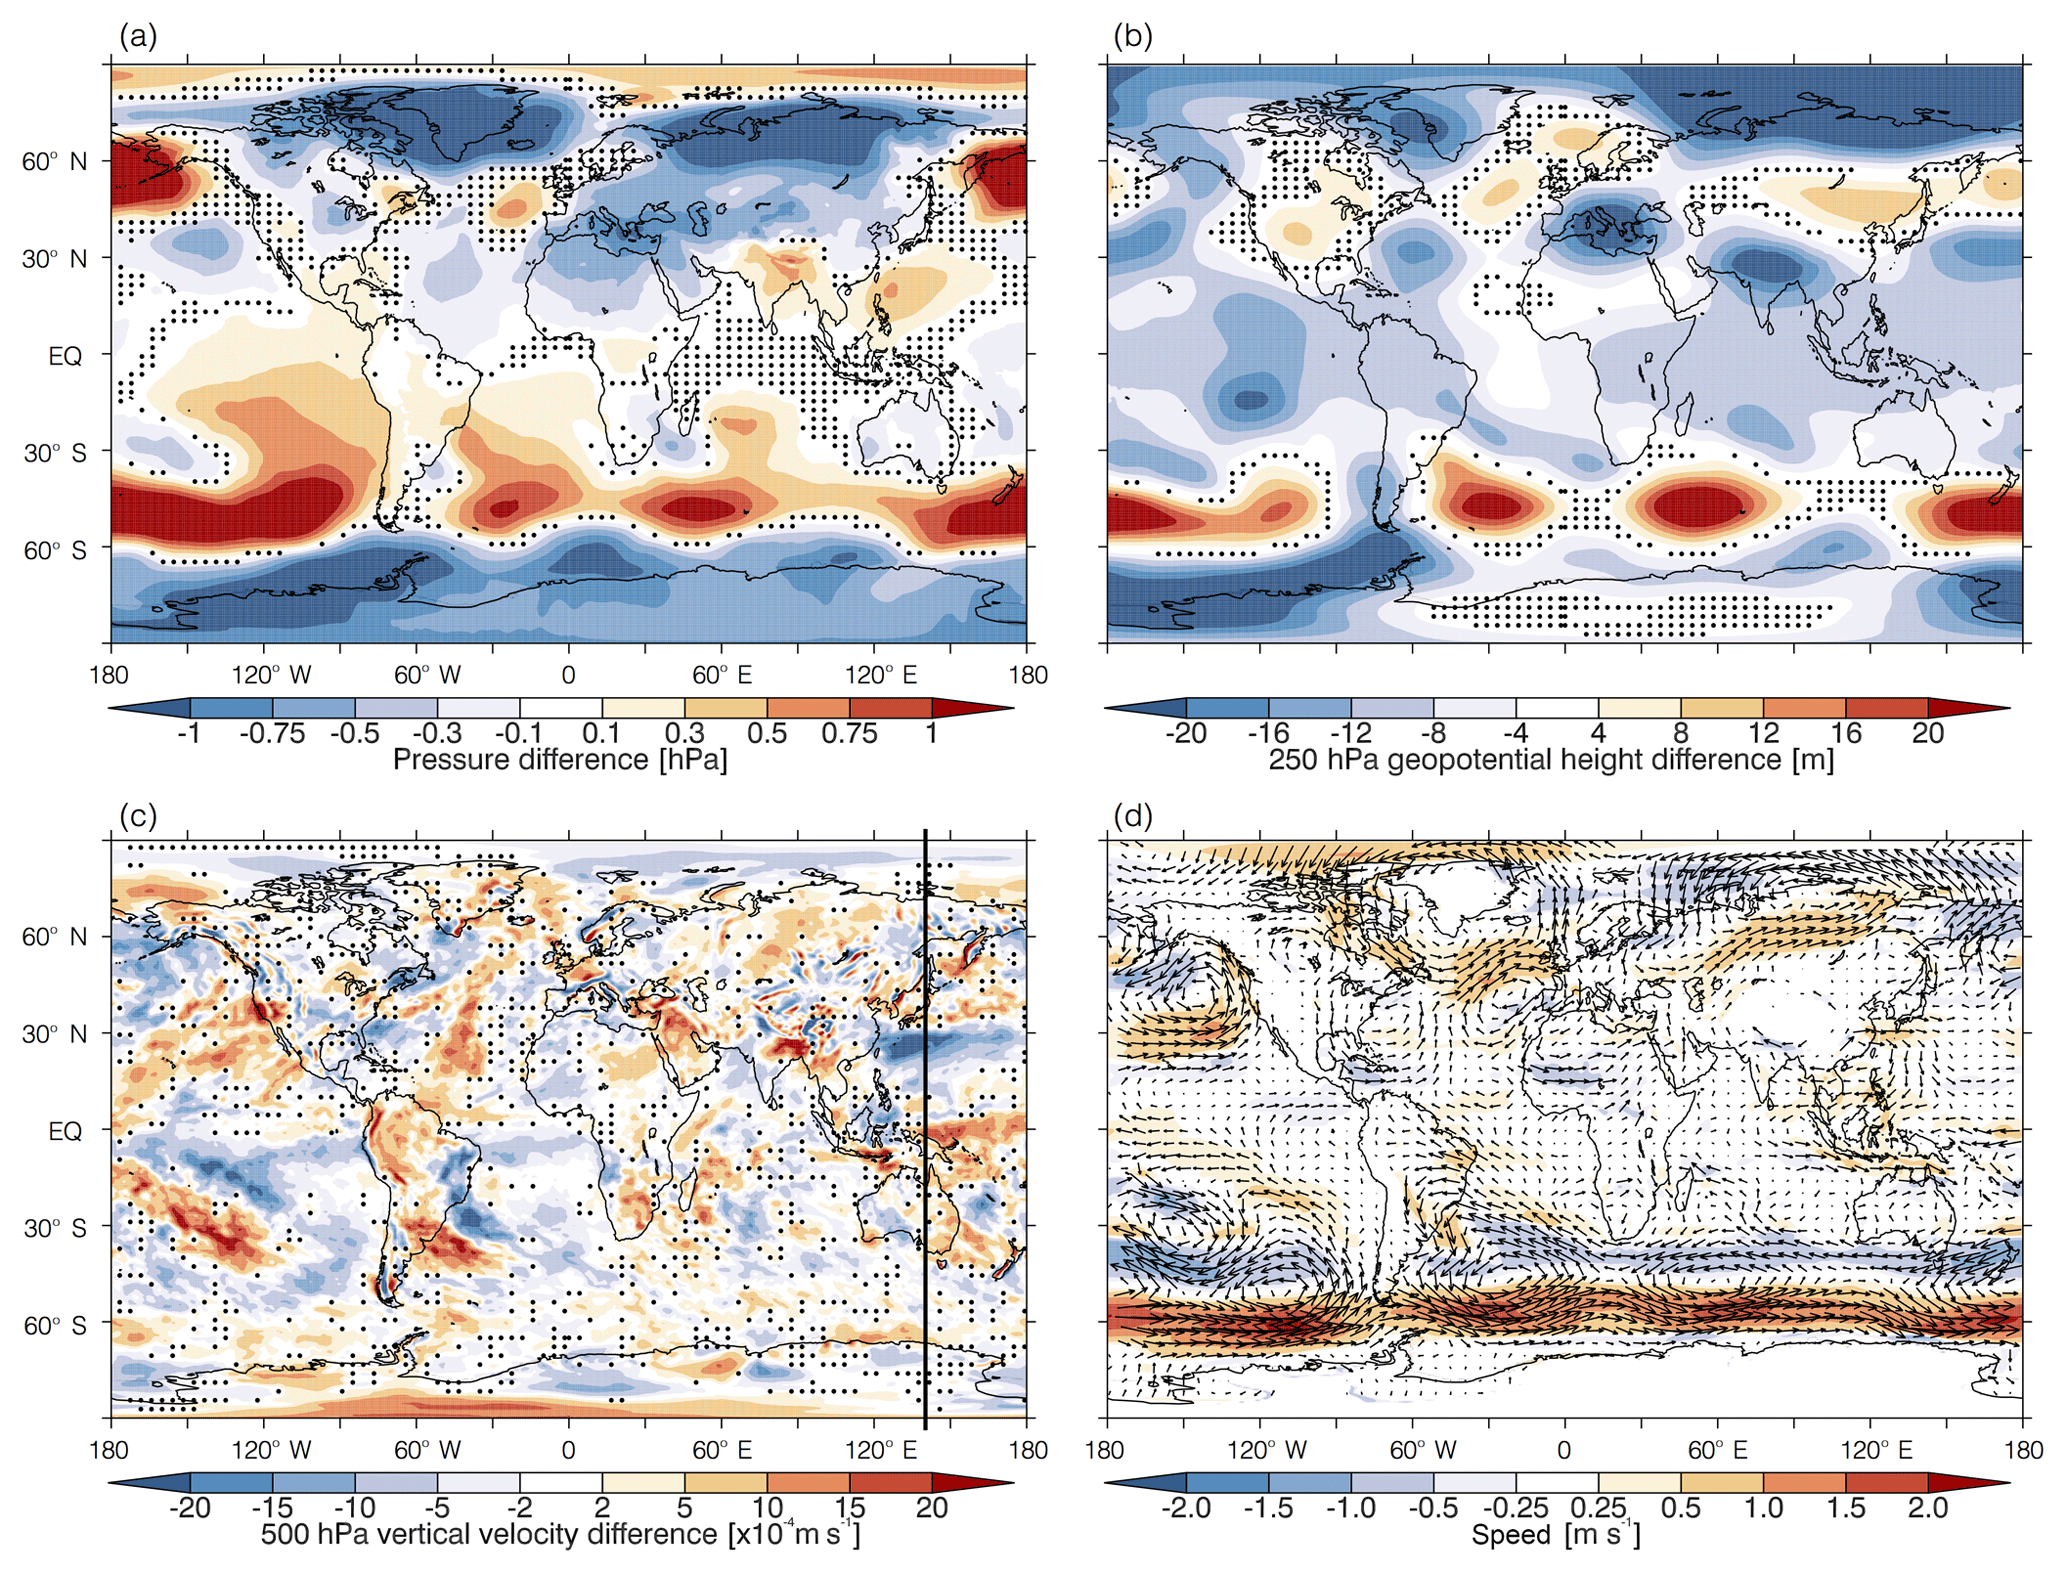
Figure 5Ensemble mean, (1998–2012) vs. (1979–1993), difference in (a) sea level pressure, (b) 250 hPa geopotential height, (c) 500 hPa vertical velocity, and (d) 850 hPa wind. Dots indicate where the response is not significant at the 10 % level, as calculated using a two-tailed Student's t test (note that there is no indication of significance in panel d). Figure 6a and b show the agreement of individual ensemble members on the sign of the geopotential height anomaly shown in panel (b). The black line in panel (c) is at 140∘ E and indicates the location of the transect shown in Fig. 7.
Negative sea level pressure anomalies and negative 250 hPa geopotential height anomalies are located east of Japan and are associated with the region of anomalous descent to the east of China (Fig. 5c). Here, the local circulation changes associated with the increases in Asian emissions interact with the midlatitude jet, initiating a barotropic Rossby wave train that extends around the Northern Hemisphere midlatitudes to Europe, where an anomalous circulation advects cold air from the north-east and causes a cold anomaly in Europe (Figs. 4a and 5a, d). An anticyclonic anomaly in the North Atlantic also causes western Europe to be anomalously dry relative to 1979–1993, while the Mediterranean is anomalously wet (Fig. 4b). This positive North Atlantic Oscillation-like response is consistent with the responses seen by Allen and Sherwood (2011) and Westervelt et al. (2018) in response to increases in global aerosols. Note, however, that Westervelt et al. (2018) identified a degree of model-sensitivity in the North Atlantic response to global aerosols and identified an increase in Mediterranean precipitation that we do not see here.
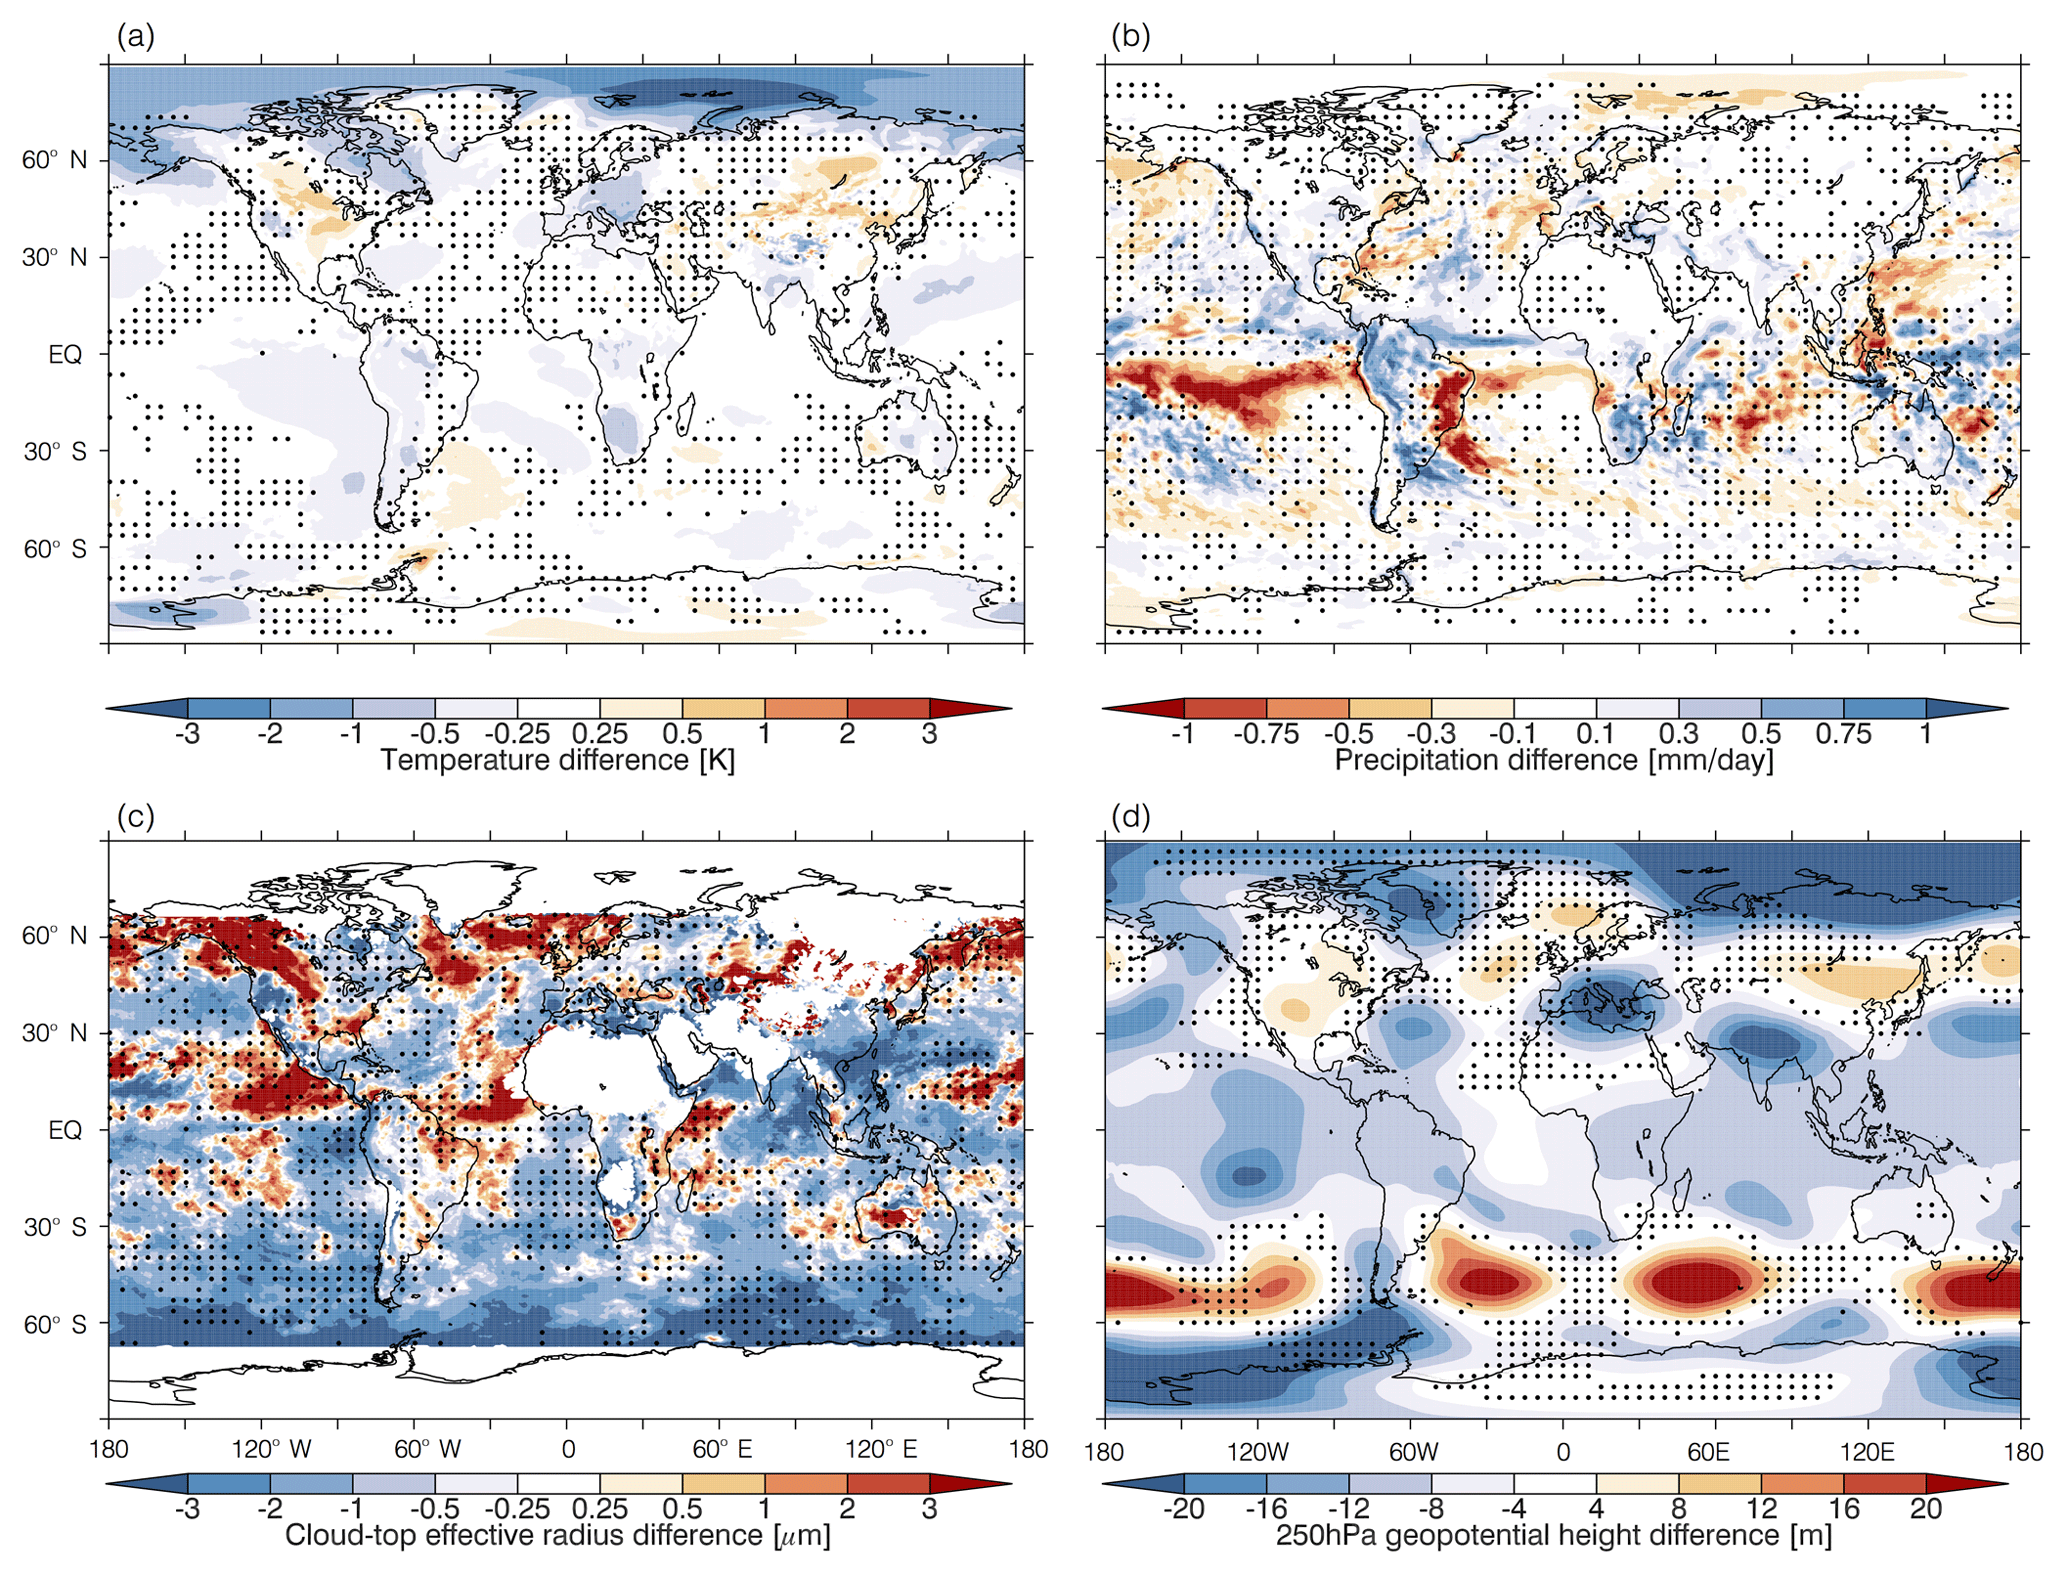
Figure 6Ensemble mean, (1998–2012) vs. (1979–1993), difference in (a) near-surface temperature, (b) precipitation, (c) cloud-top effective radius, and (d) 250 hPa geopotential height. In regions without stippling, the anomaly has the same sign in three or more ensemble members.
The extratropical waves seen in Fig. 5a and b have an equivalent barotropic structure. The wave pattern is matched by the pattern of the temperature anomalies, suggesting that the temperature anomalies over the North Atlantic (cool in the subtropics, warm in midlatitudes) and Europe (cool) are the result of adiabatic heating.
In the North Pacific there is a clear weakening of the Aleutian low (Fig. 5a) with an associated equatorward shift in the storm track (Fig. 5d) and southeastward shift in precipitation (Fig. 4b). This circulation shift is the result of the weakening of the meridional temperature gradient (Fig. 4a) and is a characteristic of the Pacific response to anthropogenic aerosol forcing (e.g. Ming and Ramaswamy, 2011; Smith et al., 2016).
In the equatorial Pacific, the HadGEM3 response to increased Asian anthropogenic aerosol has a La Niña-like pattern, with increased precipitation in the equatorial west Pacific and decreased precipitation and anomalous high pressure in the east (Fig. 4b). Changes further afield, such as the decreased precipitation over western Europe also resemble characteristic La Niña teleconnections (e.g. increased precipitation in northern South America, southern Africa, and eastern Australia, and a warm anomaly in the southern United States, with a cold anomaly over Alaska). However, other changes, such as the positive Pacific–North American-like (PNA) pattern (Fig. 5a), with positive geopotential height anomalies over the western United States, and negative anomalies to the east, are more typically associated with El Niño. It is an El Niño-like stationary wave response, arising primarily as a result of diabatic heating anomalies in the East Pacific, that was identified by Ming and Ramaswamy (2011) in response to global aerosol emissions.
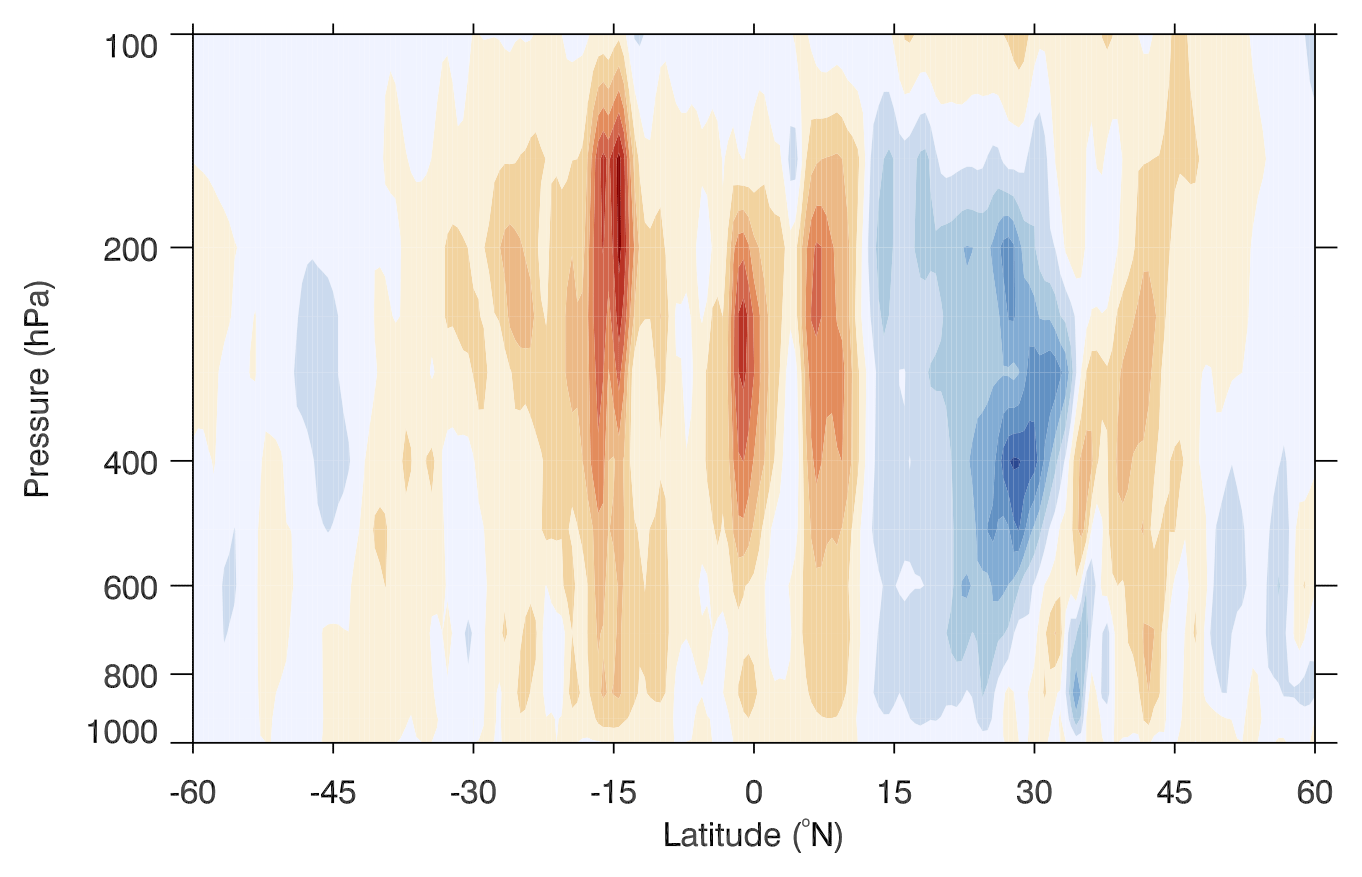
Figure 7Vertical velocity (m s−1) averaged over the 5∘ of longitude centred on 140∘ E. Positive values indicate ascent.
The ensemble mean anomalies discussed in this section are significant at the 10 % level. Figure 6 shows that they are also robust across ensemble members, with three out of four members simulating responses of the same sign in the same region. In the following section, we use LUMA to confirm the causality suggested by HadGEM3-GC2 and identify the main source of the teleconnection between Asia and Europe.
3.1 LUMA response to Pacific precipitation anomalies
When initialized with the HadGEM3-GC2 climatology (1980 to 2005 mean), and forced with the global DJF precipitation anomaly field simulated by HadGEM3-GC2 in response to the increase in Asian anthropogenic aerosol, LUMA is able qualitatively to reproduce the general features stationary wave pattern seen in the HadGEM3-GC2 simulation (Fig. 8). Note that we do not expect LUMA to reproduce the HadGEM2-GC wave amplitude as this is directly proportional to the magnitude of the forcing in such a linear model (Lewinschal et al., 2013). LUMA captures the negative anomalies east of Japan, over the central North Pacific, and over western Europe. It also captures the positive anomalies over the contiguous United States and the North Atlantic. It simulates a positive anomaly over central Eurasia, although this is displaced to the west relative to HadGEM3-GC2. The wave pattern in LUMA is slightly too zonal compared to HadGEM3-GC2, which is to be expected given the prescription of a zonally symmetric base state. There are also notable differences between the two models in the northern high latitudes. The Southern Hemisphere wave pattern simulated by LUMA is also considerably different to the pattern seen in HadGEM3-GC2. This is the result of a higher degree of nonlinearity in the Southern Hemisphere flow. Since we do not expect LUMA to produce an adequate representation of waves in such conditions (Lewinschal et al., 2013), we focus only on the Northern Hemisphere response to Asian anthropogenic aerosol.
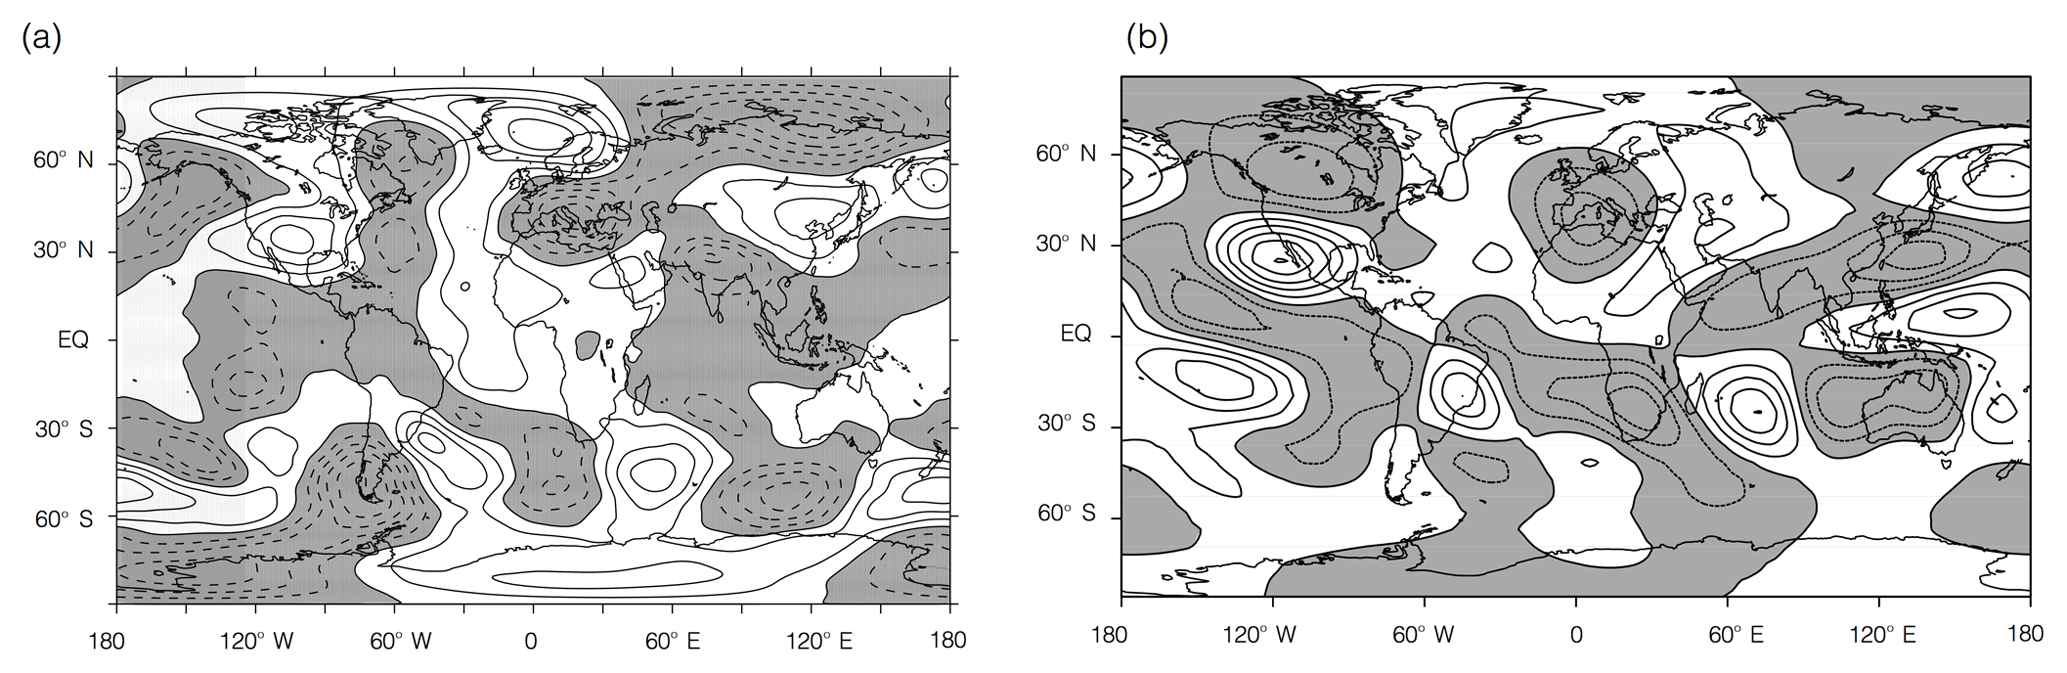
Figure 8(a) The (1998–2012) vs. 1979–1993) difference in 250 hPa stationary waves in HadGEM3-GC2. (b) The 250 hPa stationary wave pattern from LUMA when driven by the global HadGEM3-GC2 precipitation anomaly. In both panels, grey shading and dashed contours indicate negative anomalies, white shading and solid contours indicate positive anomalies.
In order to determine the main source of the Rossby wave train that leads to large changes in European and North American climate in response to Asian anthropogenic aerosol, we split the Pacific precipitation anomalies into three main components from which a forcing term is calculated: the La Niña-like anomaly over the equatorial east Pacific, the dipole anomaly between China and Indonesia, and the dipole anomaly in the northern North Pacific (indicated in Fig. 9a, b, and d). As LUMA is a linear model, the sum of the response to these anomalies should account for most of the wave pattern that arises in response to the full global precipitation anomaly field.
The equatorial Pacific precipitation anomaly drives a Matsuno–Gill-type quadrupole response (e.g. Jin and Hoskins, 1995; Kacimi and Khouider, 2018). The response is predominantly confined to the Pacific basin, and the wider tropics, with little impact on Europe or North America (Fig. 9a).
The dipole precipitation anomaly downstream of the emission region (Fig. 4b) between China and Indonesia results in a large dipole atmospheric flow anomaly immediately above the heating region, with a weak wave propagating into the European sector (Fig. 9b). If we consider only the northern third of this precipitation anomaly (Fig. 9c), we see that the response shown in Fig. 9b is most likely a combination of a propagating wave generated to the east of China and south of Japan, and a Matsuno–Gill response generated over the Maritime Continent.
While the waves generated immediately downstream of the emission region extend to Europe, this source region alone does not explain the full magnitude or pattern of the total response, particularly over the US and North Atlantic. Most of the amplitude of the waves in these regions is instead a response to the precipitation anomaly in the North Pacific (Fig. 9d). Figure 9e shows that most of the US and North Atlantic stationary wave response induced by changes in Asian anthropogenic aerosol is explained by a combination of the responses to precipitation anomalies between China and Indonesia and over the northern North Pacific. Over the Pacific itself, the Matsuno–Gill response to the equatorial forcing is necessary to produce the negative anomaly located over the central North Pacific (Fig. 9a vs. 9f).

Figure 9The 250 hPa stationary wave anomaly from LUMA when forced with the HadGEM3-GC2, (1998–2012) vs. (1979–1993), precipitation anomaly (a) from the equatorial Pacific (15∘ S to 10∘ N, 120∘ E to 75∘ W); (b) downstream of China and Indonesia (15∘ S to 30∘ N, 100 to 160∘ E); (c) downstream of China (15∘ S to 30∘ N, 110 to 160∘ E); (d) the northern North Pacific (15 to 60∘ N, 160 to 240∘ E); (e) the sum of regions (c) and (d); (f) the whole globe; (g) the North Atlantic (15 to 60∘ N, 0 to 90∘ W), and (h) the tropical North Atlantic (0 to 15∘ N, 0 to 90∘ W). Grey shading and dashed contours indicate negative anomalies, white shading and solid contours indicate positive anomalies. Red boxes indicate the location of the precipitation anomaly.
However, a comparison of the response to global anomalies (Fig. 9f) and the sum of the response to the heating dipoles downstream of China and Indonesia and in the northern North Pacific (Fig. 9e) shows that these regions alone cannot fully account for the global response. The positive anomaly in the eastern tropical North Atlantic includes a response to anomalies in the equatorial Pacific (Fig. 9a), and the magnitude and structure of the wave anomaly over western Europe and Scandinavia are not explained by any of the regions shown in Fig. 9e. Additional simulations exploring the response to Atlantic precipitation anomalies confirm that the structure of the North Atlantic circulation anomalies, and the propagation into western Europe and Scandinavia, is the result of positive feedbacks (Fig. 9g): precipitation anomalies generated as part of the wave train from the Pacific cause heating in the Atlantic sector, which leads to the wave pattern seen in response to global precipitation anomalies. Figure 9h confirms that it is primarily feedbacks from extratropical precipitation, rather than in the tropical Atlantic, that drive the response.
The pattern of the atmospheric circulation response to increases in Asian anthropogenic aerosols in HadGEM3-GC2 is characteristic of a positive PNA pattern over the midlatitude North Pacific and North America (Figs. 4a and 5a). Positive PNA patterns are typically associated with El Niño (Lau, 1997; Ming and Ramaswamy, 2011). However, in HadGEM3-GC2, we see such a pattern alongside La Niña-like temperature and precipitation patterns in the tropical Pacific. This is consistent with our findings that the North American and European responses to Asian anthropogenic aerosol arise primarily in the extratropics. Such a PNA pattern in response to Asian anthropogenic aerosol was also found by Teng et al. (2012), which they also concluded were not tropically excited (note that they considered an increase in Asian black carbon alone, so the response is opposite in sign). Straus and Shukla (2002) found that, although there are superficial similarities between the midlatitude response to ENSO and the PNA, ENSO does not drive the PNA.
Our conclusion that the large-scale circulation response to Asian anthropogenic aerosol is primarily an extratropical-driven phenomenon, either through Rossby wave trains excited in the extratropics, or through extratropical meridional temperature gradients, differs from the conclusion of Ming et al. (2011). Using an idealized model, they found that the upper tropospheric circulation response to global aerosols was largest in the Pacific basin, with a south-eastward shift of the Aleutian low. They linked this shift to stationary Rossby waves excited by anomalous diabatic heating over the tropical east Pacific. HadGEM3-GC2 simulates a very different pattern of equatorial Pacific precipitation changes in response to Asian anthropogenic aerosol compared to the response to global emissions shown by Ming and Ramaswamy (2011). We find a response that is opposite in sign and with greater zonal asymmetry. Therefore, the differences between our conclusions are likely to be due to differences in the local response to emissions, rather than differences in the mechanism for the wider midlatitude response to Asian anthropogenic aerosol.
HadGEM3-GC2 has a large bias in meridional wind over the northeast Pacific (Lee et al., 2018), which may affect the propagation of waves into the North American and Atlantic sectors. We tested how this bias in the underlying wind field may influence the stationary wave response by prescribing a NorESM1-M (Iversen et al., 2013) background state in LUMA. NorESM1-M has a different wind climatology and does not have the North Pacific biases seen in HadGEM3-GC2. The LUMA result is broadly insensitive to the choice of background state (not shown). However, a zonal-mean background wind field is prescribed in LUMA, and thus such a reduced sensitivity to biases in one basin is to be expected. The ability of LUMA to reproduce the HadGEM3-GC2 wave pattern in this sector, despite the prescription of a zonally symmetric base state, also suggests that the strong teleconnections between the Pacific, North America, and Europe seen in HadGEM3-GC2 are not strongly dependent on the features of the background wind field in the model. This insensitivity to changes of the basic state further points towards the distribution of the thermal forcing as governing the wave propagation.
Heating anomalies prescribed in LUMA are centred at 550 hPa, which is appropriate for tropical heating, but it is likely to result in too much heating in the free troposphere in the midlatitudes. Repeating the LUMA analysis with the northern North Pacific heating prescribed at lower levels showed that the LUMA result is largely insensitive to the vertical position of the anomaly (not shown). Teng et al. (2012) also found that remote impacts were not very sensitive to the structure of the heating profile.
HadGEM3-GC2 has a historical aerosol radiative forcing of −2.19 W m−2, which is large relative to the CMIP5 ensemble mean of −1.17 W m−2 (Zelinka et al., 2014). However, the model is able to skilfully reproduce the observed evolution of global mean temperature (Senior et al., 2016). In addition to a large sensitivity to aerosol emissions, the model also slightly underestimates the amplitude of interannual variability in near-surface temperature. This means that our results are likely to represent an upper bound of the magnitude of the remote climate response to recent increases in Asian emissions. However, this does not affect our conclusions regarding the mechanism for the response.
Increases in Asian emissions of anthropogenic aerosols and their precursors since 1980 have been found to have a global impact in HadGEM3-GC2. Using experiments with a linear baroclinic model, LUMA, in support of the HadGEM3-GC2 results, we show that the radiative effects of Asian anthropogenic aerosol modify the extratropical stationary-wave pattern, leading to Northern Hemisphere-wide precipitation and surface temperature changes.
Asian aerosols cause a warming east of China in winter (DJF) via a decrease in cloud fraction and increase in downwelling shortwave radiation. Changes in temperature and sea level pressure lead to an increase in eastern Maritime Continent precipitation via an increase in convergence and ascent. Intensification of the offshore monsoon flow causes a reduction in precipitation east of China. Aerosol increases cause local cooling over India, which is largely a direct effect of the aerosol increase. This cooling causes an increase in sea level pressure and a south-westward precipitation shift.
Remote responses to Asian anthropogenic aerosol increases are associated with a Rossby wave train from the western North Pacific to Europe. Aerosol-induced heating perturbations in both the western and northern North Pacific are important for the structure and amplitude of this wave train, with the response to northern North Pacific forcing being key to the extension of the wave train into Europe. Positive feedbacks with induced precipitation changes over the North Atlantic help to extend the wave train into Scandinavia. Although the increases in Asian anthropogenic aerosol produce a strong La Niña-like response in the equatorial Pacific, the dynamical response to this is confined to the tropics, and to the Pacific basin.
Aggressive mitigation of aerosol and precursor emissions may result in them being reduced to their 1950 levels by 2030 (e.g. Scannell et al., 2019), which is roughly double the magnitude of the perturbation applied here, but opposite in sign. This may result in around half a degree of warming in addition to that from future increases in greenhouse gas emissions (Hienola et al., 2018). If the teleconnection identified in HadGEM3-GC2 is present in the future, Europe, western Canada, Alaska, and the Arctic may be particularly sensitive to any rapid climate changes that occur in the near future in response to a reduction of Asian emissions.
All model data are archived on JASMIN and can be accessed via request to Laura Wilcox.
LJW, EJH, AL, and AE designed the study. ND ran HadGEM3-GC2. AL ran LUMA. LJW performed the analysis. All authors contributed to writing the paper.
The authors declare that they have no conflict of interest.
This work and its contributors, Laura Wilcox, Eleanor Highwood, and Massimo Bollasina, were supported by the UK-China Research & Innovation Partnership Fund through the Met Office Climate Science for Service Partnership (CSSP) China as part of the Newton Fund. Laura Wilcox received additional support from the National Centre for Atmospheric Science (NCAS) and International Meteorological Institute (IMI) visiting scientist programmes.
The LUMA simulations were performed on resources provided by the Swedish National Infrastructure for Computing (SNIC) at the National Supercomputer Centre (NSC). The analysis in this work was performed on the JASMIN super-data-cluster (Lawrence et al., 2012). JASMIN is managed and delivered by the UK Science and Technology Facilities Council (STFC) Centre for Environmental Data Archival (CEDA).
This research was supported by the Newton Fund (CSSP-China).
This paper was edited by Nikos Hatzianastassiou and reviewed by three anonymous referees.
Aamaas, B., Berntsen, T. K., Fuglestvedt, J. S., Shine, K. P., and Bellouin, N.: Regional emission metrics for short-lived climate forcers from multiple models, Atmos. Chem. Phys., 16, 7451–7468, https://doi.org/10.5194/acp-16-7451-2016, 2016. a, b
Albrecht, B. A.: Aerosols, cloud microphysics, and fractional cloudiness, Science, 245, 1227–1230, https://doi.org/10.1126/science.245.4923.1227, 1989. a
Allen, R. J. and Ajoku, O.: Future aerosol reductions and widening of the northern tropical belt, J. Geophys. Res.-Atmos., 121, 6765–6786, https://doi.org/10.1002/2016JD024803, 2016. a
Allen, R. J. and Sherwood, S. C.: The impact of natural versus anthropogenic aerosols on atmospheric circulation in the Community Atmosphere Model, Clim. Dynam., 36, 1959–1978, https://doi.org/10.1007/s00382-010-0898-8, 2011. a, b, c
Allen, R. J., Evan, A. T., Booth, B. B. B., Allen, R. J., Evan, A. T., and Booth, B. B. B.: Interhemispheric Aerosol Radiative Forcing and Tropical Precipitation Shifts during the Late Twentieth Century, J. Climate, 28, 8219–8246, https://doi.org/10.1175/JCLI-D-15-0148.1, 2015. a, b
Bartlett, R. E., Bollasina, M. A., Booth, B. B. B., Dunstone, N. J., Marenco, F., Messori, G., and Bernie, D. J.: Do differences in future sulfate emission pathways matter for near-term climate? A case study for the Asian monsoon, Clim. Dynam., 50, 1863–1880, https://doi.org/10.1007/s00382-017-3726-6, 2018. a
Bell, C. J., Gray, L. J., Charlton-Perez, A. J., Joshi, M. M., Scaife, A. A., Bell, C. J., Gray, L. J., Charlton-Perez, A. J., Joshi, M. M., and Scaife, A. A.: Stratospheric Communication of El Niño Teleconnections to European Winter, J. Climate, 22, 4083–4096, https://doi.org/10.1175/2009JCLI2717.1, 2009. a
Bellouin, N., Boucher, O., Haywood, J., Johnson, C., Jones, A., Rae, J., and Woodward, S.: Improved representation of aerosols for HadGEM2, Hadley Centre Technical Note, 73, 2007. a, b
Biasutti, M. and Giannini, A.: Robust Sahel drying in response to late 20th century forcings, Geophys. Res. Lett., 33, L11706, https://doi.org/10.1029/2006GL026067, 2006. a
Bjerknes, J.: A possible response of the atmospheric Hadley circulation to equatorial anomalies of ocean temperature, Tellus, 18, 820–829, https://doi.org/10.1111/j.2153-3490.1966.tb00303.x, 1966. a
Bjerknes, J.: Atmospheric Teleconnections from the Equatorial Pacific, Mon. Weather Rev., 97, 163–172, https://doi.org/10.1175/1520-0493(1969)097<0163:ATFTEP>2.3.CO;2, 1969. a
Bollasina, M. A., Ming, Y., and Ramaswamy, V.: Anthropogenic aerosols and the weakening of the South Asian summer monsoon, Science, 334, 502–505, https://doi.org/10.1126/science.1204994, 2011. a, b
Boucher, O., Randall, D., Artaxo, P., Bretherton, C., Feingold, G., Forster, P., Kerminen, V.-M., Kondo, Y., Liao, H., Lohmann, U., Rasch, P., Satheesh, S., Sherwood, S., Stevens, B., and Zhang, X.: Clouds and Aerosols, in: Climate Change 2013: The Physical Science Basis, Contribution of Working Group I to the Fifth Assessment Report of the Intergovernmental Panel on Climate Change, chap. Clouds and, Cambridge University Press, Cambridge, United Kingdom and New York, NY, USA, 2013. a
Byrne, M. P. and Schneider, T.: Atmospheric Dynamics Feedback: Concept, Simulations, and Climate Implications, J. Climate, 31, 3249–3264, https://doi.org/10.1175/JCLI-D-17-0470.1, 2018. a
Choi, J., Son, S.-W., and Park, R. J.: Aerosol versus greenhouse gas impacts on Southern Hemisphere general circulation changes, Clim. Dynam., 52, 4127–4142, https://doi.org/10.1007/s00382-018-4370-5, 2018. a
Chung, E.-S. and Soden, B. J.: Hemispheric climate shifts driven by anthropogenic aerosol–cloud interactions, Nat. Geosci., 10, 566–571, https://doi.org/10.1038/ngeo2988, 2017. a
Chung, S. H. and Seinfeld, J. H.: Climate response of direct radiative forcing of anthropogenic black carbon, J. Geophys. Res., 110, D11102, https://doi.org/10.1029/2004JD005441, 2005. a
Collins, W. J., Bellouin, N., Doutriaux-Boucher, M., Gedney, N., Halloran, P., Hinton, T., Hughes, J., Jones, C. D., Joshi, M., Liddicoat, S., Martin, G., O'Connor, F., Rae, J., Senior, C., Sitch, S., Totterdell, I., Wiltshire, A., and Woodward, S.: Development and evaluation of an Earth-System model – HadGEM2, Geosci. Model Dev., 4, 1051–1075, https://doi.org/10.5194/gmd-4-1051-2011, 2011. a
Diaz, H. F., Hoerling, M. P., and Eischeid, J. K.: ENSO variability, teleconnections and climate change, Int. J. Climatol., 21, 1845–1862, https://doi.org/10.1002/joc.631, 2001. a
Domeisen, D. I. V., Butler, A. H., Fröhlich, K., Bittner, M., Müller, W. A., Baehr, J., Domeisen, D. I. V., Butler, A. H., Fröhlich, K., Bittner, M., Müller, W. A., and Baehr, J.: Seasonal Predictability over Europe Arising from El Niño and Stratospheric Variability in the MPI-ESM Seasonal Prediction System, J. Climate, 28, 256–271, https://doi.org/10.1175/JCLI-D-14-00207.1, 2015. a
Dong, B., Sutton, R. T., Highwood, E., and Wilcox, L.: The Impacts of European and Asian Anthropogenic Sulfur Dioxide Emissions on Sahel Rainfall, J. Climate, 27, 7000–7017, https://doi.org/10.1175/JCLI-D-13-00769.1, 2014. a, b
Dong, B., Sutton, R., Highwood, E., and Wilcox, L.: Preferred response of the East Asian summer monsoon to local and non-local anthropogenic sulphur dioxide emissions, Clim. Dynam., 46, 1733–1751, https://doi.org/10.1007/s00382-015-2671-5, 2016. a, b
Dong, B., Wilcox, L. J., Highwood, E. J., and Sutton, R. T.: Impacts of recent decadal changes in Asian aerosols on the East Asian summer monsoon: Roles of aerosol-radiation and aerosol-cloud interactions, Clim. Dynam., https://doi.org/10.1007/S00382-019-04698-0, 2019. a, b
Feichter, J., Roeckner, E., Lohmann, U., Liepert, B., Feichter, J., Roeckner, E., Lohmann, U., and Liepert, B.: Nonlinear Aspects of the Climate Response to Greenhouse Gas and Aerosol Forcing, J. Climate, 17, 2384–2398, https://doi.org/10.1175/1520-0442(2004)017<2384:NAOTCR>2.0.CO;2, 2004. a
Fraedrich, K., Lunkeit, F., and Kirk, E.: PUMA: portable university model of the atmosphere, Tech. rep., DKRZ-Hamburg, 1998. a
Gill, A. E.: Some simple solutions for heat-induced tropical circulation, Q. J. Roy. Meteorol. Soc., 106, 447–462, 1980. a
Gillett, N. P., Fyfe, J. C., and Parker, D. E.: Attribution of observed sea level pressure trends to greenhouse gas, aerosol, and ozone changes, Geophys. Res. Lett., 40, 2302–2306, https://doi.org/10.1002/grl.50500, 2013. a
Grandey, B. S., Cheng, H., and Wang, C.: Transient Climate Impacts for Scenarios of Aerosol Emissions from Asia: A Story of Coal versus Gas, J. Climate, 29, 2849–2867, https://doi.org/10.1175/JCLI-D-15-0555.1, 2016. a
Held, I. M., Ting, M., and Wang, H.: Northern Winter Stationary Waves: Theory and Modeling, J. Climate, 15, 2125–2144, https://doi.org/10.1175/1520-0442(2002)015<2125:NWSWTA>2.0.CO;2, 2002. a
Hienola, A., Partanen, A.-I., Pietikäinen, J.-P., O'Donnell, D., Korhonen, H., Matthews, H. D., and Laaksonen, A.: The impact of aerosol emissions on the 1.5 C pathways, Environ. Res. Lett., 13, 044011, https://doi.org/10.1088/1748-9326/aab162, 2018. a
Hodnebrog, Ø., Myhre, G., Forster, P. M., Sillmann, J., and Samset, B. H.: Local biomass burning is a dominant cause of the observed precipitation reduction in southern Africa, Nat. Commun., 7, 11236, https://doi.org/10.1038/ncomms11236, 2016. a
Hoskins, B. J. and Karoly, D. J.: The Steady Linear Response of a Spherical Atmosphere to Thermal and Orographic Forcing, J. Atmos. Sci., 38, 1179–1196, https://doi.org/10.1175/1520-0469(1981)038<1179:TSLROA>2.0.CO;2, 1981. a
Hwang, Y.-T., Frierson, D. M. W., and Kang, S. M.: Anthropogenic sulfate aerosol and the southward shift of tropical precipitation in the late 20th century, Geophys. Res. Lett., 40, 2845–2850, https://doi.org/10.1002/grl.50502, 2013. a
Iversen, T., Bentsen, M., Bethke, I., Debernard, J. B., Kirkevåg, A., Seland, Ø., Drange, H., Kristjansson, J. E., Medhaug, I., Sand, M., and Seierstad, I. A.: The Norwegian Earth System Model, NorESM1-M – Part 2: Climate response and scenario projections, Geosci. Model Dev., 6, 389–415, https://doi.org/10.5194/gmd-6-389-2013, 2013. a
Jin, F. and Hoskins, B. J.: The Direct Response to Tropical Heating in a Baroclinic Atmosphere, J. Atmos. Sci., 52, 307–319, https://doi.org/10.1175/1520-0469(1995)052<0307:TDRTTH>2.0.CO;2, 1995. a
Kacimi, A. and Khouider, B.: The transient response to an equatorial heat source and its convergence to steady state: implications for MJO theory, Clim. Dynam., 50, 3315–3330, https://doi.org/10.1007/s00382-017-3807-6, 2018. a
Kang, S. M., Park, K., Jin, F.-F., and Stuecker, M. F.: Common Warming Pattern Emerges Irrespective of Forcing Location, J. Adv. Model. Earth Sy., 9, 2413–2424, https://doi.org/10.1002/2017MS001083, 2017. a
Kasoar, M., Voulgarakis, A., Lamarque, J.-F., Shindell, D. T., Bellouin, N., Collins, W. J., Faluvegi, G., and Tsigaridis, K.: Regional and global temperature response to anthropogenic SO2 emissions from China in three climate models, Atmos. Chem. Phys., 16, 9785–9804, https://doi.org/10.5194/acp-16-9785-2016, 2016. a
Kasoar, M., Shawki, D., and Voulgarakis, A.: Similar spatial patterns of global climate response to aerosols from different regions, NPJ Climate Atmos. Sci., https://doi.org/10.1038/s41612-018-0022-z, 2018. a, b
Klimont, Z., Smith, S. J., and Cofala, J.: The last decade of global anthropogenic sulfur dioxide: 2000–2011 emissions, Environ. Res. Lett., 8, 14003, https://doi.org/10.1088/1748-9326/8/1/014003, 2013. a
Kristjánsson, J. E., Iversen, T., Kirkevåg, A., Seland, Ø., and Debernard, J.: Response of the climate system to aerosol direct and indirect forcing: Role of cloud feedbacks, J. Geophys. Res., 110, D24206, https://doi.org/10.1029/2005JD006299, 2005. a
Lamarque, J.-F., Bond, T. C., Eyring, V., Granier, C., Heil, A., Klimont, Z., Lee, D., Liousse, C., Mieville, A., Owen, B., Schultz, M. G., Shindell, D., Smith, S. J., Stehfest, E., Van Aardenne, J., Cooper, O. R., Kainuma, M., Mahowald, N., McConnell, J. R., Naik, V., Riahi, K., and van Vuuren, D. P.: Historical (1850–2000) gridded anthropogenic and biomass burning emissions of reactive gases and aerosols: methodology and application, Atmos. Chem. Phys., 10, 7017–7039, https://doi.org/10.5194/acp-10-7017-2010, 2010. a
Lau, N.-C.: Interactions between Global SST Anomalies and the Midlatitude Atmospheric Circulation, B. Am. Meteor. Soc., 78, 21–33, https://doi.org/10.1175/1520-0477(1997)078<0021:IBGSAA>2.0.CO;2, 1997. a
Lawrence, B. N., Bennett, V., Churchill, J., Juckes, M., Kershaw, P., Oliver, P., Pritchard, M., and Stephens, A.: The JASMIN super-data-cluster, arXiv preprint arXiv:1204.3553, 2012. a
Lee, R. W., Woollings, T. J., Hoskins, B. J., Williams, K. D., O'Reilly, C. H., and Masato, G.: Impact of Gulf Stream SST biases on the global atmospheric circulation, Clim. Dynam., 51, 3369–3387, https://doi.org/10.1007/s00382-018-4083-9, 2018. a
Lewinschal, A., Ekman, A. M. L., and Körnich, H.: The role of precipitation in aerosol-induced changes in northern hemisphere wintertime stationary waves, Clim. Dynam., 41, 647–661, https://doi.org/10.1007/s00382-012-1622-7, 2013. a, b, c, d, e, f, g
Liakka, J., Nilsson, J., and Löfverström, M.: Interactions between stationary waves and ice sheets: linear versus nonlinear atmospheric response, Clim. Dynam., 38, 1249–1262, https://doi.org/10.1007/s00382-011-1004-6, 2012. a
Lin, J., Tong, D., Davis, S., Ni, R., Tan, X., Pan, D., Zhao, H., Lu, Z., Streets, D., Feng, T., Zhang, Q., Yan, Y., Hu, Y., Li, J., Liu, Z., Jiang, X., Geng, G., He, K., Huang, Y., and Guan, D.: Global climate forcing of aerosols embodied in international trade, Nat. Geosci., 9, 790–794, https://doi.org/10.1038/ngeo2798, 2016. a
Liu, L., Shawki, D., Voulgarakis, A., Kasoar, M., Samset, B. H., Myhre, G., Forster, P. M., Hodnebrog, Ø., Sillmann, J., Aalbergsjø, S. G., Boucher, O., Faluvegi, G., Iversen, T., Kirkevåg, A., Lamarque, J.-F., Olivié, D., Richardson, T., Shindell, D., Takemura, T., Liu, L., Shawki, D., Voulgarakis, A., Kasoar, M., Samset, B. H., Myhre, G., Forster, P. M., Hodnebrog, Ø., Sillmann, J., Aalbergsjø, S. G., Boucher, O., Faluvegi, G., Iversen, T., Kirkevåg, A., Lamarque, J.-F., Olivié, D., Richardson, T., Shindell, D., and Takemura, T.: A PDRMIP Multimodel Study on the Impacts of Regional Aerosol Forcings on Global and Regional Precipitation, J. Climate, 31, 4429–4447, https://doi.org/10.1175/JCLI-D-17-0439.1, 2018. a, b, c
Matsuno, T.: Quasi-Geostrophic Motions in the Equatorial Area, J. Meteorol. Soc. Jpn., 44, 25–43, 1966. a
Meinshausen, M., Smith, S. J., Calvin, K., Daniel, J. S., Kainuma, M. L. T., Lamarque, J.-F., Matsumoto, K., Montzka, S. A., Raper, S. C. B., Riahi, K., Thomson, A., Velders, G. J. M., and van Vuuren, D. P. P.: The RCP greenhouse gas concentrations and their extensions from 1765 to 2300, Clim. Change, 109, 213, https://doi.org/10.1007/s10584-011-0156-z, 2011. a
Menon, S., Hansen, J., Nazarenko, L., and Luo, Y.: Climate effects of black carbon aerosols in China and India, Science, 297, 2250–2253, https://doi.org/10.1126/science.1075159, 2002. a
Ming, Y. and Ramaswamy, V.: Nonlinear Climate and Hydrological Responses to Aerosol Effects, J. Climate, 22, 1329–1339, https://doi.org/10.1175/2008JCLI2362.1, 2009. a
Ming, Y. and Ramaswamy, V.: A Model Investigation of Aerosol-Induced Changes in Tropical Circulation, J. Climate, 24, 5125–5133, https://doi.org/10.1175/2011JCLI4108.1, 2011. a, b, c, d, e
Ming, Y., Ramaswamy, V., and Chen, G.: A Model Investigation of Aerosol-Induced Changes in Boreal Winter Extratropical Circulation, J. Climate, 24, 6077–6091, https://doi.org/10.1175/2011JCLI4111.1, 2011. a, b, c
Myhre, G., Shindell, D., Bréon, F.-M., Collins, W., Fuglestvedt, J., Huang, J., Koch, D., Lamarque, J.-F., Lee, D., Mendoza, B., Nakajima, T., Robock, A., Stephens, G., Takemura, T., and Zhang, H.: Climate change 2013: the physical science basis, in: Contribution of Working Group I to the Fifth Assessment Report of the Intergovernmental Panel on Climate Change, edited by: K., Tignor, M., Allen, S.K., Boschung, J., Nauels, A., Xia, Y., Bex, V., and Midgley, P.M., Cambridge University Press Cambridge, United Kingdom and New York, NY, USA, 2013. a
Navarro, J. C. A., Ekman, A. M. L., Pausata, F. S. R., Lewinschal, A., Varma, V., Seland, Ø., Gauss, M., Iversen, T., Kirkevåg, A., Riipinen, I., and Hansson, H. C.: Future Response of Temperature and Precipitation to Reduced Aerosol Emissions as Compared with Increased Greenhouse Gas Concentrations, J. Climate, 30, 939–954, https://doi.org/10.1175/JCLI-D-16-0466.1, 2017. a
Park, R. J., Jacob, D. J., Field, B. D., Yantosca, R. M., and Chin, M.: Natural and transboundary pollution influences on sulfate-nitrate-ammonium aerosols in the United States: Implications for policy, J. Geophys. Res.-Atmos., 109, D15204, https://doi.org/10.1029/2003JD004473, 2004. a
Polson, D., Bollasina, M., Hegerl, G. C., and Wilcox, L. J.: Decreased monsoon precipitation in the Northern Hemisphere due to anthropogenic aerosols, Geophys. Res. Lett., 41, 6023–6029, https://doi.org/10.1002/2014GL060811, 2014. a
Ramanathan, V., Chung, C., Kim, D., Bettge, T., Buja, L., Kiehl, J. T., Washington, W. M., Fu, Q., Sikka, D. R., and Wild, M.: Atmospheric brown clouds: impacts on South Asian climate and hydrological cycle, P. Natl. Acad. Sci. USA, 102, 5326–5333, https://doi.org/10.1073/pnas.0500656102, 2005. a
Riahi, K., van Vuuren, D. P., Kriegler, E., Edmonds, J., O'Neill, B. C., Fujimori, S., Bauer, N., Calvin, K., Dellink, R., Fricko, O., Lutz, W., Popp, A., Cuaresma, J. C., KC, S., Leimbach, M., Jiang, L., Kram, T., Rao, S., Emmerling, J., Ebi, K., Hasegawa, T., Havlik, P., Humpenöder, F., Da Silva, L. A., Smith, S., Stehfest, E., Bosetti, V., Eom, J., Gernaat, D., Masui, T., Rogelj, J., Strefler, J., Drouet, L., Krey, V., Luderer, G., Harmsen, M., Takahashi, K., Baumstark, L., Doelman, J. C., Kainuma, M., Klimont, Z., Marangoni, G., Lotze-Campen, H., Obersteiner, M., Tabeau, A., and Tavoni, M.: The Shared Socioeconomic Pathways and their energy, land use, and greenhouse gas emissions implications: An overview, Global Environ. Chang., 42, 153–168, https://doi.org/10.1016/J.GLOENVCHA.2016.05.009, 2017. a
Richardson, T. B., Forster, P. M., Andrews, T., and Parker, D. J.: Understanding the Rapid Precipitation Response to CO2 and Aerosol Forcing on a Regional Scale*, J. Climate, 29, 583–594, https://doi.org/10.1175/JCLI-D-15-0174.1, 2016. a, b
Ridley, H. E., Asmerom, Y., Baldini, J. U. L., Breitenbach, S. F. M., Aquino, V. V., Prufer, K. M., Culleton, B. J., Polyak, V., Lechleitner, F. A., Kennett, D. J., Zhang, M., Marwan, N., Macpherson, C. G., Baldini, L. M., Xiao, T., Peterkin, J. L., Awe, J., and Haug, G. H.: Aerosol forcing of the position of the intertropical convergence zone since ad 1550, Nat. Geosci., 8, 195–200, https://doi.org/10.1038/ngeo2353, 2015. a
Rotstayn, L. D.: Projected effects of declining anthropogenic aerosols on the southern annular mode, Environ. Res. Lett., 8, 044028, https://doi.org/10.1088/1748-9326/8/4/044028, 2013. a
Rotstayn, L. D. and Lohmann, U.: Tropical Rainfall Trends and the Indirect Aerosol Effect, J. Climate, 15, 2103–2116, https://doi.org/10.1175/1520-0442(2002)015<2103:TRTATI>2.0.CO;2, 2002. a, b
Samset, B. H., Myhre, G., Forster, P. M., Hodnebrog, Ø., Andrews, T., Boucher, O., Faluvegi, G., Fläschner, D., Kasoar, M., Kharin, V., Kirkevåg, A., Lamarque, J.-F., Olivié, D., Richardson, T. B., Shindell, D., Takemura, T., and Voulgarakis, A.: Weak hydrological sensitivity to temperature change over land, independent of climate forcing, NPJ Clim. Atmos. Sci., 1, 20173, https://doi.org/10.1038/s41612-017-0005-5, 2018. a
Scaife, A. A., Comer, R. E., Dunstone, N. J., Knight, J. R., Smith, D. M., MacLachlan, C., Martin, N., Peterson, K. A., Rowlands, D., Carroll, E. B., Belcher, S., and Slingo, J.: Tropical rainfall, Rossby waves and regional winter climate predictions, Q. J. Roy. Meteorol. Soc., 143, 1–11, https://doi.org/10.1002/qj.2910, 2017. a
Scannell, C., Booth, B. B. B., Dunstone, N. J., Rowell, D. P., Bernie, D. J., Kasoar, M., Voulgarakis, A., Wilcox, L. J., Navarro, J. C. A., Seland, Ø., and Paynter, D. J.: The Influence of remote anthropogenic aerosols on future East and West African rainfall, J. Climate, submitted, 2019. a
Senior, C. A., Andrews, T., Burton, C., Chadwick, R., Copsey, D., Graham, T., Hyder, P., Jackson, L., McDonald, R., Ridley, J., Ringer, M., and Tsushima, Y.: Idealized climate change simulations with a high-resolution physical model: HadGEM3-GC2, J. Adv. Model. Earth Sy., 8, 813–830, https://doi.org/10.1002/2015MS000614, 2016. a
Shindell, D. T., Voulgarakis, A., Faluvegi, G., and Milly, G.: Precipitation response to regional radiative forcing, Atmos. Chem. Phys., 12, 6969–6982, https://doi.org/10.5194/acp-12-6969-2012, 2012. a
Smith, D. M., Booth, B. B. B., Dunstone, N. J., Eade, R., Hermanson, L., Jones, G. S., Scaife, A. A., Sheen, K. L., and Thompson, V.: Role of volcanic and anthropogenic aerosols in the recent global surface warming slowdown, Nat. Clim. Change, 6, 936–940, https://doi.org/10.1038/nclimate3058, 2016. a
Sobel, A. H., Nilsson, J., Polvani, L. M., Sobel, A. H., Nilsson, J., and Polvani, L. M.: The Weak Temperature Gradient Approximation and Balanced Tropical Moisture Waves*, J. Atmos. Sci., 58, 3650–3665, https://doi.org/10.1175/1520-0469(2001)058<3650:TWTGAA>2.0.CO;2, 2001. a
Steptoe, H., Wilcox, L. J., and Highwood, E. J.: Is there a robust effect of anthropogenic aerosols on the Southern Annular Mode?, J. Geophys. Res.-Atmos., 121, 10029–10042, https://doi.org/10.1002/2015JD024218, 2016. a
Straus, D. M. and Shukla, J.: Does ENSO Force the PNA?, J. Climate, 15, 2340–2358, https://doi.org/10.1175/1520-0442(2002)015<2340:DEFTP>2.0.CO;2, 2002. a
Tao, M., Chen, L., Wang, Z., Wang, J., Tao, J., and Wang, X.: Did the widespread haze pollution over China increase during the last decade? A satellite view from space, Environ. Res. Lett., 11, 54019, https://doi.org/10.1088/1748-9326/11/5/054019, 2016. a
Teng, H., Washington, W. M., Branstator, G., Meehl, G. A., and Lamarque, J.-F.: Potential impacts of Asian carbon aerosols on future US warming, Geophys. Res. Lett., 39, L11703, https://doi.org/10.1029/2012GL051723, 2012. a, b, c
Thomson, S. I. and Vallis, G. K.: Atmospheric Response to SST anomalies, Part 1: Background-state dependence, teleconnections and local effects in winter, J. Atmos. Sci., submitted, 2019. a
Ting, M., Hoerling, M. P., Xu, T., and Kumar, A.: Northern Hemisphere Teleconnection Patterns during Extreme Phases of the Zonal-Mean Circulation, J. Climate, 9, 2614–2633, https://doi.org/10.1175/1520-0442(1996)009<2614:NHTPDE>2.0.CO;2, 1996. a
Twomey, S. A., Piepgrass, M., and Wolfe, T. L.: An assessment of the impact of pollution on global cloud albedo, Tellus B, 36, 356–366, https://doi.org/10.1111/j.1600-0889.1984.tb00254.x, 1984. a
van Vuuren, D. P., Edmonds, J., Kainuma, M., Riahi, K., Thomson, A., Hibbard, K., Hurtt, G. C., Kram, T., Krey, V., Lamarque, J. F., Masui, T., Meinshausen, M., Nakicenovic, N., Smith, S. J., and Rose, S. K.: The representative concentration pathways: An overview, Clim. Change, 109, 5–31, 2011. a, b
Voigt, A., Pincus, R., Stevens, B., Bony, S., Boucher, O., Bellouin, N., Lewinschal, A., Medeiros, B., Wang, Z., and Zhang, H.: Fast and slow shifts of the zonal-mean intertropical convergence zone in response to an idealized anthropogenic aerosol, J. Adv. Model. Earth Sy., 9, 870–892, https://doi.org/10.1002/2016MS000902, 2017. a
Wang, C.: Anthropogenic aerosols and the distribution of past large-scale precipitation change, Geophys. Res. Lett., 42, 10876–10884, https://doi.org/10.1002/2015GL066416, 2015. a, b, c
Westervelt, D. M., Conley, A. J., Fiore, A. M., Lamarque, J.-F., Shindell, D. T., Previdi, M., Mascioli, N. R., Faluvegi, G., Correa, G., and Horowitz, L. W.: Connecting regional aerosol emissions reductions to local and remote precipitation responses, Atmos. Chem. Phys., 18, 12461–12475, https://doi.org/10.5194/acp-18-12461-2018, 2018. a, b, c
Wood, N., A. Stainforth, A. White, T. Allen, M. Diamantakis, M. Gross, T. Melvin, C. Smith, S. Vosper, M. Zerroukat, and J. Thuburn: An inherently mass-conserving semi-implicit semi-Lagrangian discretization of the deep-atmosphere global non-hydrostatic equations, Q. J. Roy. Meteor. Soc., 140, 1505–1520, https://doi.org/10.1002/qj.2235, 2014.
Williams, K. D., Harris, C. M., Bodas-Salcedo, A., Camp, J., Comer, R. E., Copsey, D., Fereday, D., Graham, T., Hill, R., Hinton, T., Hyder, P., Ineson, S., Masato, G., Milton, S. F., Roberts, M. J., Rowell, D. P., Sanchez, C., Shelly, A., Sinha, B., Walters, D. N., West, A., Woollings, T., and Xavier, P. K.: The Met Office Global Coupled model 2.0 (GC2) configuration, Geosci. Model Dev., 8, 1509–1524, https://doi.org/10.5194/gmd-8-1509-2015, 2015. a
Xie, S.-P., Lu, B., and Xiang, B.: Similar spatial patterns of climate responses to aerosol and greenhouse gas changes, Nat. Geosci., 6, 828–832, https://doi.org/10.1038/ngeo1931, 2013. a
Zelinka, M. D., Andrews, T., Forster, P. M., and Taylor, K. E.: Quantifying Components of Aerosol-Cloud-Radiation Interactions in Climate Models, J. Geophys. Res.-Atmos., 119, 7599–7615, https://doi.org/10.1002/2014JD021710, 2014. a