the Creative Commons Attribution 4.0 License.
the Creative Commons Attribution 4.0 License.
Measurement and model analyses of the ozone variation during 2006 to 2015 and its response to emission change in megacity Shanghai, China
Jianming Xu
Xuexi Tie
Wei Gao
Yanfen Lin
Qingyan Fu
The fine particles (PM2.5) in China have decreased significantly in recent years as a result of the implementation of Chinese Clean Air Action Plan since 2013, while the O3 pollution is getting worse, especially in megacities such as Beijing and Shanghai. Better understanding of the elevated O3 pollution in Chinese megacities and its response to emission change is important for developing an effective emission control strategy in the future. In this study, we analyze the significant increasing trend of daily maximum O3 concentration from 2006 to 2015 in the megacity Shanghai with the variability of 0.8–1.3 ppbv yr−1. It could likely be attributed to the notable reduction in NOx concentrations with the decreasing rate of 1.86–2.15 ppbv yr−1 accompanied by the small change in VOCs during the same period by excluding the weak trends of meteorological impacts on local dispersion (wind speed), regional transport (wind direction), and O3 photolysis (solar radiation). It is further illustrated by using a state-of-the-art regional chemical and dynamical model (WRF-Chem) to explore the O3 variation response to the reduction in NOx emissions in Shanghai. The control experiment conducted for September of 2009 shows excellent performance for O3 and NOx simulations, including both the spatial distribution pattern and the day-by-day variation through comparison with six in situ measurements from the MIRAGE-Shanghai field campaign. Sensitivity experiments with 30 % reduction in NOx emissions from 2009 to 2015 in Shanghai estimated by Shanghai Environmental Monitoring Center shows that the calculated O3 concentrations exhibit obvious enhancement by 4–7 ppbv in urban zones with increasing variability of 0.96–1.06 ppbv yr−1, which is consistent with the observed O3 trend as a result of the strong VOC-limited condition for O3 production. The large reduction in NOx combined with less change in VOCs in the past 10 years promotes the O3 production in Shanghai to move towards an NOx-limited regime. Further analysis of the WRF-Chem experiments and O3 isopleth diagram suggests that the O3 production downtown is still under a VOC-limited regime after 2015 despite the remarkable NOx reduction, while it moves to the transition regime between NOx-limited and VOC-limited in sub-urban zones. Supposing the insignificant VOC variation persists, the O3 concentration downtown would keep increasing until 2020 with the further 20 % reduction in NOx emission after 2015 estimated by Shanghai Clean Air Action Plan. The O3 production in Shanghai will switch from a VOC-limited to an NOx-limited regime after 2020 except for downtown area, which is likely close to the transition regime. As a result the O3 concentration will decrease by 2–3 ppbv in sub-urban zones and by more than 4 ppbv in rural areas as a response to a 20 % reduction in NOx emission after 2020, whereas it is not sensitive to both NOx and VOC changes downtown. This result reveals that the control strategy of O3 pollution is a very complex process and needs to be carefully studied.
- Article
(8611 KB) - Full-text XML
- BibTeX
- EndNote
Ozone (O3) in the troposphere plays an important role in the oxidation of chemically and climatically relevant trace gases, hence regulating their lifetime in the atmosphere (Monks et al., 2015). In the lower troposphere, O3 is produced from photochemical reactions involving volatile organic compounds (VOCs, broadly including CO) and nitrogen oxides () in the presence of sunlight (Brasseur et al., 1999). As a strong oxidant, O3 at ground level is detrimental to human health and vegetation (Tai et al., 2014) and has received continuous attention from both the scientific and regulatory communities in the past three decades.
Shanghai has emerged as one of the largest megacities in the world over the last two decades. The city has a fleet of over 3.6 million vehicles and a population of over 2400 million permanent residents, which results in high emissions of NOx, VOCs, and primary particulate matter (PM) to the atmosphere from industrial and commercial activities, leading to photochemical smog formation. A persistent high level of surface O3 and PM was observed in Shanghai during the past 10 years (Geng et al., 2007; Ran et al., 2009; Tie et al., 2009a; Xu et al., 2015). In order to mitigate the adverse impacts from severe air pollution, the Clean Air Action Plan was issued at the end of 2013 to implement the emission reduction program in Shanghai and its neighboring area. As a result, the annual mean PM2.5 (particles with diameter 2.5 µm) mass concentration has decreased from 50 µg m−3 in 2013 to 39 µg m−3 in 2017. However O3 pollution has been continuously worsening, with the nonattainment days (daily maximum O3 concentration exceeding 200 µg m−3, or daily maximum 8 h O3 concentration exceeding 100 µg m−3) increased from 99 d in 2014 to 129 d in 2016. As a result, O3 has became the primary air pollutant affecting the ambient air quality instead of PM2.5 in Shanghai. A similar issue has also occurred in other cities in the eastern China (Lu et al., 2018). For example, the mean PM2.5 mass concentration over the 74 major cites decreased by 40 % from 2013 to 2017, whereas the maximum daily 8 h average O3 concentration in summer exceeds the Chinese National Ambient Air Quality Stand (GB3095-2012) over most of eastern China (Li et al., 2019). Thus better understanding the causes of elevated O3 in China is important for developing effective O3 control strategies, especially in megacities such as Shanghai.
A prerequisite to an effective emission-based O3 control strategy is to understand the temporal and spatial relationship between O3 and its precursors, and the response of O3 concentrations to the changes in emissions of O3 precursors (such as NOx and VOCs; Lin et al., 1988). The relationship of O3 and O3-precursors can be clarified as NOx-limited or VOC-limited chemistry of O3 formation, which is usually defined based on the relative impact of a given percent reduction in NOx relative to VOCs in the context of urban chemistry (Sillman, 1999).
Some observational and modeling works on O3 chemical formation and transformation have been carried out in Shanghai since 2007. The O3 production in Shanghai city is clearly under a VOC-limited regime (Geng et al., 2007), in which the aromatics and alkenes play the dominant roles (Geng et al., 2008a). The aircraft measurements in the Yangtze River Delta (YRD) region show the strong anti-correlation between NOx and O3 during noontime, indicating the similar VOC-limited regime for O3 production in the area neighboring Shanghai (Geng et al., 2008b). Thus either NOx reduction or VOC growth is favorable for O3 enhancement in Shanghai. Gao et al. (2017) reported that O3 concentration in downtown Shanghai increased by 67 % from 2006 to 2015, whereas NOx concentration decreased by about 38 %. This is also consistent with the results of Lin et al. (2017) in that the median of the maximum daily 8 h average O3 concentration in Shanghai increased notably from 2006 to 2016, with a rate of 1.4 ppbv yr−1, while the NO2 decreased from 66.7 to 42.1 µg m−3 with about 20 % reduction. These previous studies provide useful information regarding the O3 chemical formation and transformation in Shanghai. However, such O3 variation in response to emission change has not been clearly investigated. Considering that O3 formation is a complicated process including chemistry, transport, emission, deposition, and their interactions, the chemical transport model is a powerful tool to gain an understanding of these interacting processes. For example, Lei et al. (2007), Ying et al. (2009) and Song et al. (2010) investigated the O3 production rate and its sensitivity to emission changes in O3 precursors by the CAMx model in the Mexico City Metropolitan Area (MCMA). Tie et al. (2013) analyzed the comprehensive data of the MIRAGE-Shanghai field campaign by the Weather Research and Forecasting Chemical (WRF-Chem) model and quantified the threshold value by the emission ratio of NOx∕VOCs for switching from a VOC-limited to an NOx-limited regime in Shanghai. Recently Li et al. (2019) suggested an important cause of the increasing O3 in the North China Plain (NCP) during 2013 to 2017 to be the significant decrease in PM2.5 slowing down the sink of hydroperoxy radicals and thus speeding up the O3 production by GOES-CHEM model. However, such an implication for O3 trend is not pervasive in YRD and other regions. Moreover, the 5-year O3 records seem rather short to examine the interannual variability of O3 concentration. The GOES-CHEM experiment with 50 km resolution is maybe suitable for the O3 simulation at regional scale but is too coarse to resolve the local O3 budget at urban scale, such as in Beijing or Shanghai. To our knowledge, there are no peer-reviewed modeling studies focusing on the past long-term O3 variation response to emission changes conducted in Shanghai. Thus this paper extends the study of Tie et al. (2013) and Gao et al. (2017) to not only further examine the interannual O3 variations from a larger scale with more comprehensive measurements, but also explore the O3 enhancement response to NOx reduction in Shanghai and predict the future O3 variations by models. The effects of emission changes on long-term O3 variability are evaluated by the WRF-Chem model with high resolution and compared with measurements. The shift in O3 photochemical regime relative to the variations in NOx and VOC concentrations in the past 10 years is discussed by O3 isopleth diagram combined with WRF-Chem model to provide more insights into the O3 control strategy. Moreover, the future O3 levels and possible chemical regime in Shanghai are also discussed according to the Shanghai Clean Air Action Plan.
The paper is constructed as follows. The measurements and models used for this study are described in Sect. 2. The analysis of the long-term in situ measurements of O3 and its precursors, as well as the model sensitivity experiments, are presented and discussed in Sects. 3–6. The conclusion is summarized in Sect. 7.
2.1 Measurements
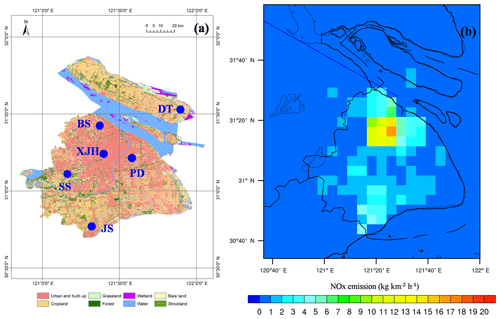
The measurements of O3 and NOx are collected from six sites (XJH, PD, JS, BS, SS, DT) over Shanghai (Fig. 1a) under different influences of air pollutant emissions. The XJH site is located in the downtown area of Shanghai, which is strongly influenced by transportation emissions. The PD site is located in the sub-urban area near a big park, which is influenced by the mixed emissions of transportation and residential areas. The JS site is located in the south of Shanghai with several large chemical industries. The BS site is located in the north of Shanghai with some big steel and power plants. The SS site is located at the top of a hill (100 m a.g.l.) in Shanghai, which has minor effects from local emissions and is influenced by regional transport. The DT site is located at a remote island without anthropogenic activities. These O3 and NOx measurements are used for the evaluation of WRF-Chem performance. In addition, the VOCs are sampled at the downtown site XJH and the sub-urban site PD, and are analyzed at a chemistry laboratory. The study of the O3 chemical production in this paper is limited at XJH and PD by the intensive measurements of O3 and its precursors (VOCs and NOx) from 2006 to 2015. The meteorological measurements including wind speed and direction, solar radiation, and temperature are collected at the BS site, which is the only climatology observatory in Shanghai. The meteorological measurements at BS are used for international exchange of meteorological data representing Shanghai, sponsored by the World Meteorological Organization (WMO).
2.2 Instruments
O3 is measured using an EC 9810 Ozone Analyzer, together with a UV photometer, which accurately and reliably measures O3 concentrations in ambient air. The oxides of a nitrogen analyzer (EC9841B/ECOTECH) have a heated molybdenum NO2-to-NO converter. The resulting NO concentration is quantified using the chemiluminescence technique. This instrument is automated to set to be zero and includes an optional external valve manifold and external calibration sources. Quality control checks are performed every 3 d, including inspection of the shelter and instruments as well as zero, precision, and span checks. The filter is replaced once every 2 weeks and calibration is made every month. The O3 concentrations are recorded every 1 min.
VOC concentrations are sampled for 24 h every day with a 6 L silonite canister with a silonite-coated valve (model 29-10622). The internal silonite coating improves long-term VOC storage. The instrument has a large volume to detect volatile chemicals down to a low pptv range. Absorption is eliminated by using nupropackless valves and by eliminating Teflon tape in the valve stem. These canisters are recognized to meet or exceed the technical specifications required for EP methods TO14-A and TO15. Gas samples are preprocessed using a Model 7100 VOC preconcentrator. Samples are analyzed for VOCs using a gas chromatography system (Agilent GC6890) coupled with mass-selective detection (Agilent MSD5975 N) with a length of 60 m, diameter of 0.32 mm, and film thickness of 1.0 µm. This measurement system can detect VOC concentrations down to a low pptv range.
These instruments to measure O3, NOx, and VOC concentrations are calibrated carefully. Detailed information for the instruments and the procedures to perform data quality control are described by Geng et al. (2007), Ran et al. (2009), Tie et al. (2013), and Gao et al. (2017). These data have been widely used to investigate the diurnal, seasonal, and interannual variations in O3 in Shanghai (Geng et al., 2007, 2015; Tang et al., 2008; Ran et al., 2009; Gao et al., 2017) and its chemical mechanism (Geng et al., 2008a, b; Tie et al., 2009a, 2013).
2.3 WRF-Chem model
The regional chemical transport model WRF-Chem (Grell et al., 2005) is used to investigate the O3 variation response to emission changes in Shanghai. This version of the model was improved mainly by Tie et al. (2007) and Li et al. (2010, 2011). The chemical mechanism chosen in WRF-Chem is the RADM2 (Regional Acid Deposition Model, version 2) gas-phase chemical mechanism (Stockwell et al., 1990), which includes 158 reactions among 36 species. The fast radiation transfer module (FTUV) is developed and used to calculate photolysis rates (Tie et al., 2003), considering the impacts of aerosols and clouds on the photochemistry (Li et al., 2011). The aerosol modules are developed by EPA CMAQ (version 4.6) (Binkowski and Roselle, 2003). The wet deposition of chemical species is calculated by using the method in the CMAQ module and the dry deposition parameterization follows Wesely (1989). The ISORROPIA version 1.7 is used to calculate the inorganic aerosols (Nenes et al., 1998). The secondary organic aerosol (SOA) is predicted using a nontraditional SOA module, including the volatility basis set (VBS) modeling approach in which primary organic components are assumed to be semivolatile and photochemically reactive and are distributed in logarithmically spaced volatility bins. The partitioning of semivolatile organic species is calculated assuming the bulk gas and particle phases are in equilibrium and all condensable organics form a pseudoideal solution. Nine surrogate species with saturation concentrations from 10−2 to 106 µg m−3 at room temperature are used for the primary organic aerosol (POA) components. The SOA contributions from glyoxal and methylglyoxal are also included. The major physical processes employed in WRF are summarized as the Lin microphysics scheme (Lin et al., 1983), the Yonsei University (YSU) PBL scheme (Hong and Lim, 2006), the Noah Land surface model (Chen and Dudhia, 2001), and the long-wave radiation parameterization (Dudhia, 1989).
The domain is set up to cover a region (centered at 32.5∘ N, 118∘ E) of 356×345 grids with a horizontal resolution of 6 km (Zhou et al., 2017). The initial and lateral boundary conditions of the meteorology are extracted from the NCEP FNL reanalysis data. The lateral meteorological boundary is updated every 6 h. The chemical lateral boundary conditions are constrained by the global chemical transport model (MOART: Model for Ozone and Related chemical Tracers) with aerosol formation modules (Tie et al., 2001; Emmons et al., 2010). Both the chemical and dynamical integration steps are set to be 60 s. The Multi-resolution Emission Inventory for China (MEIC) developed by Zhang et al. (2009) is used in WRF-Chem for all domains except Shanghai with 0.25∘ resolution. The anthropogenic emissions (including CO, NOx, SO2, and VOCs) for Shanghai are developed by Tie et al. (2013) with 0.16∘ resolution based on the MIRAGE-Shanghai field campaign. NOx and SO2 emissions in YRD region are adjusted by Zhou et al. (2017) according to the evaluation of WRF-Chem prediction for about 195 cities during 2014–2015. The distribution of NOx emission in 2009 in Shanghai is depicted in Fig. 1b. The biogenic emissions are calculated online using the MEGAN (Model of Emissions of Gases and Aerosol from Nature) model developed by Guenther et al. (2006).
2.4 OZIPR model
The ozone isopleth diagram for Shanghai is plotted by the OZIPR (Ozone Isopleth Plotting Package Research) model (Gery and Crouse, 2002). The OZIPR model employs a trajectory-based air quality simulation model in conjunction with the empirical kinetics modeling approach (EKMA) to relate O3 concentration levels of organic and nitrogen oxide emissions. OZIPR simulates complex chemical and physical processes of the lower atmosphere through a trajectory model. The physical representation is a well-mixed column of air extending from the ground to the top of the mixed layer. Emissions from the surface are included as the air column passes over different emission sources, and air from above the column is mixed in as the inversion rises during the day. O3 precursor concentrations and ambient information such as temperature, relative humidity, and boundary layer height from measurements in Shanghai are specified for each single run. Therefore a series of simulations are performed to calculate peak O3 concentration as a function of initial precursor concentrations (Tang et al., 2008; Geng et al., 2008b).
3.1 Variation in O3 concentration
Figure 2a and b show the annual variation in daily maximum O3 concentration at downtown site XJH and sub-urban site PD respectively from 2006 to 2015. The daily maximum O3 concentrations increase notably during the past 10 years with the increasing rate of 0.808 ppbv yr−1 at XJH and 1.374 ppbv yr−1 at PD respectively. In similar the daily maximum 8 h O3 concentration also increased at the rate of 1.06 and 1.4 ppbv yr−1 at XJH and PD respectively. It is consistent with the reported O3 increasing trend ranging from 1 to 2 ppbv yr−1 at background and urban sites in eastern China during 2001 to 2015 (Tang et al., 2009; Ma et al., 2016; Sun et al., 2016). In 2006, the mean daily maximum O3 concentrations at XJH and PD are 25.2 and 32.7 ppbv respectively, while in 2017, the mean daily maximum O3 concentrations at the two sites increase to 41.3 and 51.8 ppbv respectively, with 64 % and 58 % enhancement compared with that in 2006. The mean daily maximum O3 concentration at downtown site XJH during 2006 to 2015 is 39.2 ppbv, which is significantly lower than that at sub-urban site PD of 50.7 ppbv, suggesting the O3 is depressed in the downtown area. Geng et al. (2007) suggested that the O3 production in the city of Shanghai was under a VOC-limited regime, thus higher NOx downtown resulted in lower O3 concentration. Considering the inhomogeneous spatial distribution of the precursors of O3 in Shanghai (Geng et al., 2008a), we extend the analysis of interannual O3 variations to a broader scope by using the O3 measurements from 31 sites provided by the Shanghai Environmental Monitoring Center, covering the entire Shanghai area. It is shown in Fig. 2c that the median of the 8 h O3 concentration also increases significantly from 2006 to 2015, with the increasing rate of 1.571 ppbv yr−1, indicating that the significant increasing trend of O3 concentration not only occurs in the city of Shanghai, but is also expanded to a larger area nearby Shanghai. Li et al. (2019) also reported a regional O3 increasing phenomena in summer during 2013 to 2017 from Shanghai to Beijing in eastern China.
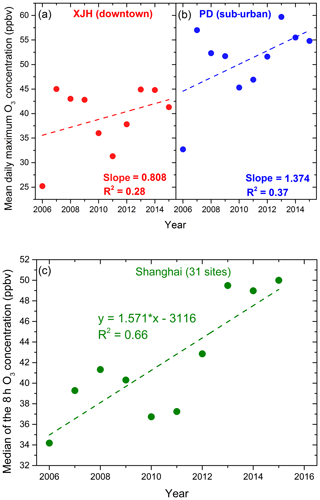
Figure 2The annual variation in daily maximum O3 concentration (ppbv) from 2006 to 2015 at (a) the downtown site XJH and (b) the sub-urban site PD, both presenting significant increasing trends with 0.808 ppbv yr−1 at XJH and 1.374 ppbv yr−1 at PD respectively. The variation in the median 8 h O3 concentration (ppbv) from 2006 to 2015 averaged for 31 sites over Shanghai (c) also shows the increasing variability of 1.571 ppbv yr−1.
In order to analyze the individual contribution to the long-term O3 trend, the variations in O3 precursors and meteorological parameters are measured and shown in the following sections.
3.2 Variations in the precursors (NOx and VOCs)
It is well known that the tropospheric O3 formation is a complicated photochemical process and is strongly related to the precursors of O3 (VOCs and NOx). According to previous studies (Geng et al., 2007; Ran et al., 2009), the chemical formation of O3 in Shanghai is revealed to be VOC-limited. Thus both enhancement of VOCs and reduction in NOx would result in the growth of O3 concentration. In order to better understand the factors possibly driving the O3 increasing trend depicted in Fig. 2, the variations in NOx and VOC concentrations at XJH and PD in the same period are presented in Fig. 3. The NOx concentrations present significant decreasing trends from 2006 to 2015 at both XJH and PD sites, which is opposite to the increasing trend of O3 variations in Fig. 2. At XJH, the decreasing rate of NOx is 2.15 ppbv yr−1, which is more remarkable than that at the PD site of 1.86 ppbv yr−1. According to the studies by Lin et al. (2017), the reduction in NOx concentration in Shanghai could likely be attributed to the implementation of a stringent emission control strategy for transportation, including improvement of gas quality, popular usage of electricity cars, and limitation of heavy cars in the urban zones. These regulations significantly decrease the emissions of NOx into the atmosphere, resulting in lower NOx concentrations. Zheng et al. (2018) also reported a 30 % reduction in NOx emission in the past 5 years in YRD region. In comparison, the VOC concentrations at XJH and PD decrease very slightly during 2006 to 2015. At XJH, the mean VOC concentration during 2013 to 2015 is about 20 ppbv, which is somewhat lower than that during 2009 to 2012 (23 ppbv). At PD, the VOC concentration shows strong interannual variations, ranging from 16 to 22 ppbv. Generally the VOC concentration at the downtown site XJH is higher than that at the sub-urban site PD by 14 %. It is consistent with the studies of Cai et al. (2010), suggesting that about 25 % of VOCs is attributed to the vehicles in Shanghai urban zones.
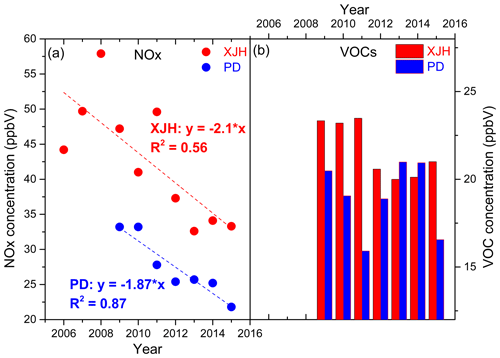
Figure 3The mean annual concentrations (ppbv) of (a) NOx (dots) and (b) VOCs (bars) from 2006 to 2015 at the downtown site XJH and the sub-urban site PD. The NOx concentrations at XJH and PD both present obvious decreasing trends with 2.1 and 1.87 ppbv yr−1, while the VOC concentrations at both sites present no clear interannual trends.
3.3 Meteorological impacts on O3 photolysis, dispersion and transport
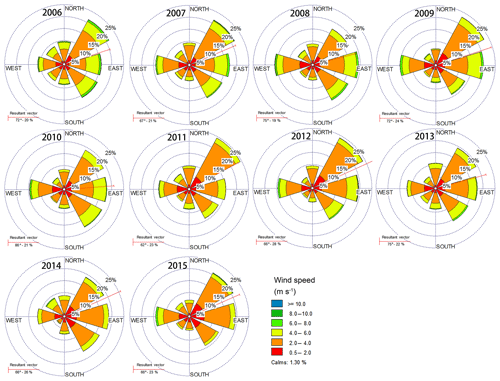
In addition to the precursors, meteorological factors such as solar radiation and wind speed and direction also play important roles in O3 concentration through photochemical and physical processes. Figure 4 shows the annual variation in wind speed and total solar radiation from 2006 to 2015. The solar radiation presents weak annual variations ranging from 140 to 150 W m−2, exhibiting a large variability but without a significant trend. As a result, the variation in solar radiation cannot explain the significant change in O3 concentration in terms of photolysis. The wind speed is usually regarded as the indicator for the dispersion capacity for air pollutants. Several studies reported that the wind speed in winter in eastern China presented decreasing variability during the past 40 years due to the decadal variation in winter monsoon affecting the haze occurrence (Wang and Chen, 2016; Zhao et al., 2016; Xu et al., 2017). While high O3 events usually occur in the summer season for middle-latitude cities such as Shanghai (Wang et al., 2017). The mean summer wind speed in Fig. 4a fluctuates between 3.3 and 3.9 m s−1 during 2006 to 2015 except the minimum value in 2014 (2.9 m s−1) due to fewer typhoons in the period. Without 2014, the variability of summer wind speed is insignificant, with a trend of −0.02 m s−1 yr−1, which could not be regarded as the dominant factor to interpret the increasing O3 trend. Local O3 concentration would be affected by transport of upstream plumes usually determined by wind direction. Geng et al. (2011) suggested that O3 concentration was higher in the west wind compared with other wind sectors in Shanghai, indicating the possible O3 transport from the western area out of Shanghai. Figure 5 presents the annual wind rose at Baoshan site from 2006 to 2015, presenting the very similar pattern of wind direction in each year. The mean wind direction concentrates in the sector between 60 and 80∘, suggesting the dominant wind in Shanghai is easterly, accounting for 50 %. The east wind in Shanghai usually carries with it the clean air mass from the sea to improve the local air quality (Xu et al., 2015). The frequency of west wind changes little during 2006 and 2015 ranging from 10 % to 15 %, suggesting that the regional transport is not a major factor driving the O3 increase. Based on the above analysis, it is speculated that the rapid O3 increase during 2006–2015 in Shanghai could likely be attributed to the reduction in NOx concentration as a result of the VOC-limited condition for O3 production.
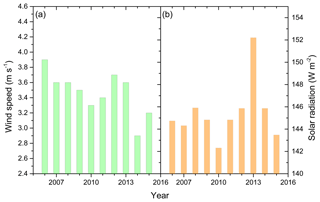
Figure 4The annual variation in (a) summer wind speed (m s−1) and (b) total solar radiation (W m−2) from 2006 to 2015 in Shanghai. Both wind speed and the solar radiation present weak interannual variations but without significant trends.
3.4 Different O3 variability at nighttime and daytime
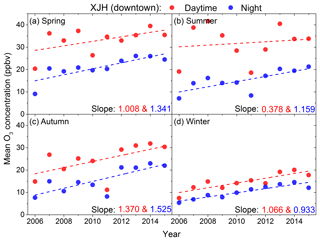
The mean diurnal variations in O3 concentrations between 2006 and 2015 are compared in Fig. 6a at XJH and PD sites respectively. The maximum and minimum O3 concentrations occur in the afternoon (14:00–15:00 LST) and early morning (06:00–07:00 LST) respectively at both sites. In addition, the diurnal O3 concentrations at XJH and PD sites all increase significantly from 2006 to 2015. For example, the peak O3 concentration at XJH increases from 21 to 37 ppbv; meanwhile the minimum O3 concentration rises from 5 to 14 ppbv, exhibiting a higher increasing rate. Similar diurnal O3 enhancement is also observed at the PD site during the same period. The O3 chemical mechanism in the daytime includes both production and loss processes. In contrast, at nighttime, the photochemical production ceases, and there mainly exists loss processes for O3. In addition both dry deposition and nighttime turbulence also have an influence on the nighttime O3 concentration, as suggested by Hu et al. (2013). Figure 6b shows the annual change rate of the diurnal O3 concentration from 2006 to 2015 at the XJH and PD sites respectively. The O3 concentrations present increasing trends both in daytime (08:00–18:00 LST) and nighttime (19:00–07:00 LST) at the XJH and PD sites, which is consistent with the results in Fig. 2. The nighttime O3 concentrations increase more significantly than daytime O3 at XJH, with the increasing rates of 1.239 and 0.956 ppbv yr−1 respectively, while at the PD site the O3 concentrations increase by 1.338 ppbv yr−1 in daytime, which is higher than that at nighttime of 1.028 ppbv yr−1. In comparison, the nighttime O3 concentrations exhibit a higher increasing rate at the downtown site XJH than that at the sub-urban site PD due to more NO emissions or more intensified urbanization (Hu et al., 2013). These results suggest that the reduction in NOx concentration from 2006 to 2015 has different effects on daytime and nighttime O3 variations. The O3 concentration at nighttime is more sensitive to NOx reduction in the downtown area, resulting in less O3 lost compared with that in daytime. The results in Fig. 6b also show that the increasing rate of nighttime O3 at the downtown site XJH is higher than that at the sub-urban site PD due to the greater reduction in NOx concentration in the downtown area. Furthermore, the seasonal variability of daytime and nighttime O3 concentrations at XJH site are illustrated in Fig. 7. Both daytime and night O3 concentrations present increasing trends in all seasons. In comparison, the larger increasing rates of nighttime O3 concentration are observed in spring, summer, and autumn than that in daytime. For example, the nighttime O3 concentrations increase by 1.341, 1.159, and 1.525 ppbv yr−1 in spring, summer, and autumn respectively, which are more significant than that of 1.008, 0.378, and 1.370 ppbv yr−1 in daytime. The variability of winter O3 concentrations in daytime and nighttime are generally close, perhaps due to the lower O3 photochemical productions. Hu et al. (2016) suggested that the nighttime boundary layer tended to be less stable as a result of the enhanced sensible heat flux in urban area, thus leading to more active nighttime turbulence. The sounding measurements at 20:00 LST in Shanghai are used to calculate the vertical temperature gradient between 1000 and 925 hPa and indicate the intensity of nighttime turbulence, while presenting no significant trend from 2010 to 2015. Furthermore the PBL height retrieved from lidar measurements at 20:00 LST presents the similar results to the soundings. Based on the above measurements, the variation in turbulence at night may have provided only a minor contribution to the nighttime O3 increase in Shanghai. However the effect of dry deposition could not be excluded due to a lack of measurements, which need further investigation.
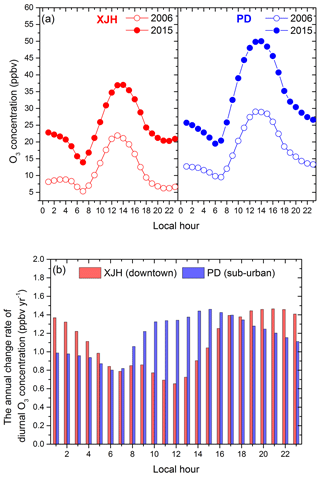
Figure 6(a) The mean diurnal variation in O3 concentration (ppbv) compared between 2006 and 2015 in XJH (red dots) and PD (blue dots). (b) The annual change rate of diurnal O3 concentration (ppbv yr−1) from 2006 to 2015 at the downtown site XJH (red bars) and sub-urban site PD (blue bars).
4.1 Design of the model experiments scheme
To better understand the role of NOx emission reduction in O3 variation, the WRF-Chem model is utilized to calculate the changes in O3 concentrations. Lin et al. (2017) suggested that the NOx emission was reduced in Shanghai in recent years as a result of the implementation of the Shanghai Clean Air Action Plan. The NOx emission in 2015 is estimated at 33.4×10⁴ t in Shanghai, reduced significantly by 30 % compared with that in 2009 of 44.9×10⁴ t. Thus it provided the good opportunity to examine the O3 variation response to the reduction in NOx emissions in Shanghai. The NOx emissions in 2009 and 2015 are put into the WRF-Chem model to calculate the O3 concentration. The other emissions (including gas and particulate matter) and meteorology used in WRF-Chem are set to be same. As a result, the difference of O3 concentrations calculated by WRF-Chem is solely attributed to the change in NOx emissions between 2009 and 2015, which is also compared with the measurements.
The MIRAGE-Shanghai field campaign was conducted in September of 2009 to explore the O3 chemical formation and transformation in Shanghai (Tie et al., 2013). The mean temperature, mean wind speed, and total precipitation in this month are 25 ∘C, 2.85 m s−1, and 89.5 mm respectively, which is very close to the climatological conditions during the past 10 years from 2006 to 2015, with 24.7 ∘C for mean temperature, 2.81 m s−1 for mean wind speed, and 126 mm for total precipitation. In addition, Shanghai is located in a typical subtropical area. The meteorology in September is characterized by low cloud cover and rain occurrence, slight wind speed and humidity, and the moderate solar radiation intensity. As suggested by Tie et al. (2013), the chemical age of the O3 plume in the Shanghai urban area in September of 2009 was very young, indicating that the O3 production was more dependent on the local emissions under such kinds of meteorological conditions, hence providing more insights into the O3 chemical mechanism response to the local emission changes. We chose the meteorology in September of 2009 as the atmospheric background for all the sensitivity experiments by WRF-Chem.
Tie et al. (2009a, 2013) highlighted that the WRF-Chem model was capable of studying the chemical and physical processes of O3 in September of 2009 during the MIRAGE-Shanghai campaign. The O3, NOx, VOCs, and aerosols calculated by WRF-Chem in clean and polluted episodes were in fairly good agreement with the measurements, except for HONO, suggesting that the emission inventory in 2009 used in the model is reasonable for the Shanghai region. Moreover the VOC emissions in Shanghai are greatly improved according to the measurements from the MIRAGE-Shanghai field campaign by Tie et al. (2013). The emissions from Tie et al. (2013), representing 2009 scenario, are used in this study to conduct the control experiment (T1) as the baseline to simulate the O3 and NOx concentrations in September of 2009. The T1 experiment is composed of 30 model runs for each day in September of 2009. Each model run is initiated at 20:00 LST and performed for 52 h integrations. The first 28 h integration is regarded as the model spin-up period; the results from the later 24 h integration is captured hourly and averaged for mean daily concentration of O3 and NOx. The aim of the T1 experiment is to further evaluate the reliability of the emission inventory in 2009 used in WRF-Chem by fully comparing the calculated O3 and NOx concentrations with in situ measurements of six sites over Shanghai.
4.2 The NOx emission in 2009 used for the base experiment
The distribution of NOx emissions in the 2009 scenario (Tie et al., 2013) in Shanghai, used in the WRF-Chem model, is shown in Fig. 1b. The NOx emission is mostly distributed in the urban zones, suggesting that transportation is an important source. The NOx is largely exported downtown and to two neighboring sub-urban zones in the east and north respectively. The maximum NOx emission is estimated at 16 kg h−1 km−2 downtown, compared with 2–6 kg h−1 km−2 in the sub-urban area. In addition, there is a small town located in the south of Shanghai with a similar intensity of NOx emissions to the sub-urban zones. The total NOx emission of 2009 scenario in Shanghai (Fig. 1b) is estimated at 41.4×10⁴ t in the model, which is close to the 47.8×10⁴ t suggested by Lin et al. (2017) according to the Shanghai Environmental Year Book.
4.3 Performance evaluation on the base experiment
The mean daytime and nighttime O3 concentrations in September 2009 are calculated by WRF-Chem and compared with measurements over six sites in Shanghai, which are presented in Fig. 8a and b respectively. Both modeled and measured O3 concentrations in daytime are higher than that at nighttime. The calculated daytime O3 concentration is about 10–18 ppbv higher than that at nighttime in urban regions, which is consistent with the measured difference of 12–14 ppbv at the XJH and PD sites. The observed daytime and nighttime O3 concentrations at the remote site DT show the minimum difference of 5 ppbv which is also captured by WRF-Chem model due to the lower impact of anthropogenic emissions. In Fig. 8a, there exists a large O3 plume with a high concentration of 40–48 ppbv in the daytime in the west of Shanghai and its neighboring area from WRF-Chem simulations. It is also illustrated by the daytime O3 measurements at the SS site with 40 ppbv. However, such a daytime O3 plume dissipates at night (Fig. 8b) leading to the significant difference in O3 concentration between day and night. Tie et al. (2013) suggested the enhancement of O3 concentration downwind of Shanghai due to the considerable O3 formation in the aged city plume transported westerly in September, resulting from the dominant east winds. According to the study of Tie et al. (2013), the O3 concentrations were at a minimum within 20 km of the city and enhanced 100–150 km west of the city in daytime, which was consistent with the results in Fig. 8a. In addition, both model simulations and in situ measurements in daytime and nighttime highlight the lower O3 concentration in urban zones than that in the rural area. The simulated daytime and nighttime O3 concentrations downtown are 28–32 and 12–14 ppbv respectively, significantly lower than that in the sub-urban (36–38 and 26–28 ppbv respectively) and rural areas (40–42 and 36–38 ppbv respectively). Similarly, the measured daytime O3 concentration at the downtown site XJH is 28 ppbv, lower than that at the sub-urban site PD and remote site DT by 12 and 21 ppbv respectively. Geng et al. (2007) suggested that under a VOC-limited regime, the lower O3 concentration downtown resulted from the higher NOx emissions, which depressed the O3 production process. Under high NOx conditions, the OH radicals are lost by the reaction of (Sillman, 1995). As a result, a higher NOx concentration in the urban area leads to a lower OH concentration, which results in less O3 production. Tang et al. (2008) also suggested that the O3 concentration in downtown Shanghai was higher on weekends than that on weekdays due to the reduced NOx concentration. However, the discrepancy is also evident between model results and measurements. For example, the modeled nighttime O3 concentrations at XJH and PD are about 2–6 ppbv lower than the measurements, perhaps due to the uncertainty of NOx emissions in urban areas, suggested by Tie et al. (2009a). In addition, the calculated daytime O3 concentrations in the remote site DT and chemical site JS are lower than measurements by 10 and 6 ppbv respectively. The former is a result of the overestimation of the wind speed by the WRF-Chem model leading to excessive O3 transport for underestimation (Zhou et al., 2017), while the latter is mainly due to the prominent underestimation of the VOC emission in the chemical zones suggested by Tie et al. (2009a).
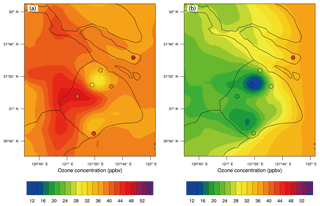
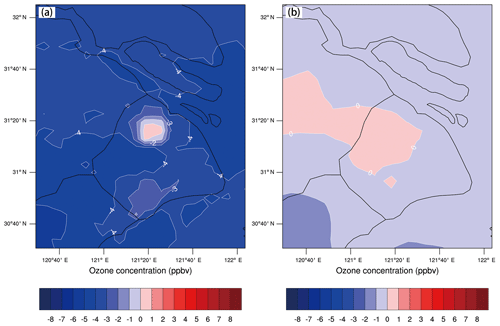
Figure 8The calculated distribution of (a) daytime and (b) nighttime O3 concentration by WRF-Chem (shade) in September of 2009 compared with measurements (circles) of six sites over Shanghai. The minimum O3 concentrations in daytime and nighttime both occur in the urban center.
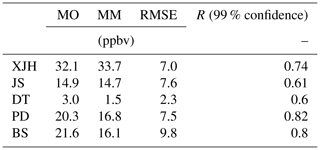
Figure 9a and b show the daily variations in O3 and NOx concentrations compared between WRF-Chem simulations and the in situ measurements over five sites. The statistical analysis of model performance for O3 and NOx is listed in Tables 1 and 2 respectively. The calculated magnitude and daily variation in O3 concentrations agree well with the measurements, suggesting that both meteorology and photochemistry are well reproduced by the WRF-Chem model. For example, the root mean square errors (RMSEs) calculated between modeled and measured O3 concentration are 7.4, 10.5, 12, 8.6, and 9.2 ppbv for XJH, JS, DT, PD, and BS respectively, and the difference between the simulation results and in situ measurement is below 10 %, which is very satisfactory compared with similar works by Geng et al. (2007) and Tie et al. (2013). The correlated coefficients (R) for the mean daily O3 concentration range from 0.6 to 0.8 above 99 % confidence over five sites, indicating good consistency of day-by-day variations between the model results and measurements. Comparably the O3 concentration is best simulated by WRF-Chem at the downtown site XJH and sub-urban site PD, with lower RMSE and better R. However, the discrepancy of daily O3 concentration between the model and measurements is also evident. For example, a rapid change in O3 concentration from 16 to 19 September was observed over all sites, indicating it is a regional event instead of a local phenomenon. The O3 concentration first increased significantly during 16–19 September (episode 1) then sharply decreased during the following 4 d (episode 2). The similar rapid O3 change in Shanghai was also reported by Tie et al. (2009a), and their explanation is that this episode was mainly related to the intensity of the subtropical high-pressure system on the Pacific Ocean in summer. The model captures the O3 variations and magnitudes during both the risen and fallen episodes very well at the downtown site XJH but substantially underestimates the increasing variability of O3 concentration during episode 1 at sub-urban and rural sites by 10–15 ppbv. Geng et al. (2008a) suggested the “chemical transport of O3” from the Shanghai downtown area to a distance of 18–36 km away, which increased the O3 concentration at sub-urban and rural sites. The WRF-Chem model cannot easily reflect this “chemical transport of O3” due to the current inventory being too coarse to accurately reflect the detailed distribution and variation in NOx emissions, e.g., the NOx emissions from mobile sources in the city. In addition, the underestimation of the O3 concentration in a rural area of Shanghai in summer could possibly be attributed to the model bias of sea breeze simulations. Under the condition of weak subtropical pressure, the sea breeze develops at noontime to yield a cycling wind pattern in Shanghai, leading to the rapid accumulation of high O3 concentrations. The WRF-Chem usually underestimates the sea surface temperature, which tends to accelerate the sea breeze development and weaken the O3 trapping in the city (Tie et al., 2009a). The calculated daily NOx concentrations by WRF-Chem compared with measurements are shown in Fig. 9b. Both the modeled and measured NOx concentrations at the remote site DT are very low, with averages of 1.4 and 2.9 ppbv respectively due to rare anthropogenic emissions there. The calculated NOx concentrations at XJH and PD are generally consistent with the measurements with excellent R values of 0.8 and 0.82 and small RMSEs of 6.9 and 7.5 ppbv respectively. However, the NOx concentration is underestimated by WRF-Chem at the sub-urban site BS in the steel zone. The calculated NOx concentration at BS is 16.1 ppbv, which is lower than the measurements by 5 ppbv. The difference of NOx concentrations between the model and observations is generally above 10 %, suggesting the performance of NOx simulation is somewhat lower than that of O3. This was also reported by Tie et al. (2007, 2009b, 2013), during the evaluation of the NOx calculations by WRF-Chem in the MIRAGE-Shanghai and MIRAGE-mex campaign studies. The lifetime of NOx at the surface is about 1–2 d, shorter than O3. Thus the NOx concentration is determined by the detailed emissions and dynamical factors, which need to develop the advanced inventory with higher resolution to reproduce both the spatial distributions and temporal variations in NOx emissions.
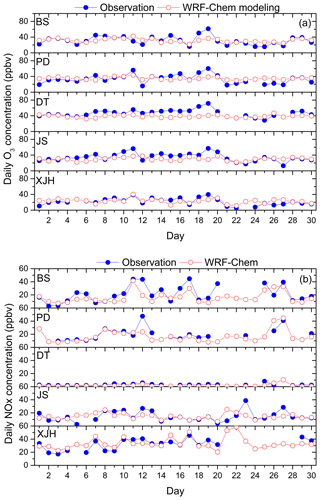
Figure 9The calculated mean daily concentrations (ppbv) of (a) O3 and (b) NOx at five sites in September of 2009 by WRF-Chem (red circles) and compared with measurements (blue circles).
Table 1Statistical analysis of O3 simulation in September of 2009 by WRF-Chem model compared with measurements of five sites (XJH, JS, DT, PD, BS) over Shanghai. MO and MM represent the mean value (unit: ppbv) of observed and modeled O3 concentration respectively. RMSE and R are the root mean square error and correlated coefficient, respectively, calculated between modeled and measured O3 concentrations.
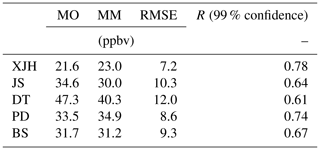
Table 2Statistical analysis of NOx simulation in September of 2009 by WRF-Chem model compared with measurements of five sites (XJH, JS, DT, PD, BS) over Shanghai. MO and MM represent the mean value (unit: ppbv) of observed and modeled NOx concentration respectively. RMSE and R are the root mean square error and correlated coefficient respectively calculated between modeled and measured NOx concentrations.
4.4 Sensitivity study on the O3 variability response to the emission change
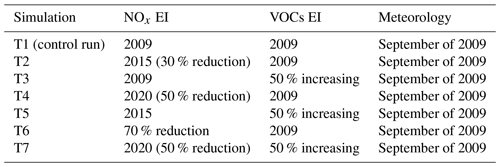
The T1 experiment shows the excellent performance for O3 and NOx simulations, including the spatial distribution pattern, and the day-by-day variation and magnitude. It is indicated that the emissions in the 2009 scenario used in WRF-Chem are reasonable, and the model is efficient at conducting the sensitivity studies on O3 variation response to the emission change. In order to better understand the measured long-term trend of O3 concentration during the past 10 years in Shanghai and its relationship to the emission reduction, several sensitivity studies are conducted in this study (Table 3). The control study of T1 is conducted based on the NOx emission in the 2009 scenario in Shanghai. According to the study of Lin et al. (2017), the NOx emission in 2015 in Shanghai is reduced by 30 % compared with that in 2009. Thus we conduct the sensitivity experiment T2 by WRF-Chem, cutting the NOx emission by 30 % compared with T1, while keeping the other emissions and meteorology same as in T1. As a result, the calculated O3 difference between T1 and T2 could likely be attributed to the NOx emission reduction between 2015 and 2009.
Figure 10a shows the distribution of the difference of O3 concentration simulated by T1 and T2 (T2–T1). The reduction in NOx emissions has the obvious effect on the magnitude and distribution of O3 concentration. The O3 concentration increases notably in urban areas, corresponding to the higher NOx emissions in Fig. 1, ranging from 2 to 7 ppbv. The enhancement of O3 concentration is most significant downtown and neighboring sub-urban zones, as well as the southern town, generally more than 4 ppbv. For example, the maximum increase in O3 concentration is 6.4 ppbv and occurred at the downtown site XJH, followed by 4–5 ppbv at the sub-urban site PD. The increasing rates of O3 trends at XJH and PD are estimated at 1.06 and 0.96 ppbv yr−1 from 2009 to 2015 by WRF-Chem, which is consistent with the observed O3 growth variability of 1–1.3 ppbv yr−1. The response of O3 concentration to the NOx reduction is not evident in the rural area, including the eastern part of Shanghai and the island with low NOx emissions. The comparison of T1 and T2 further illustrates the speculation that the significant increasing trend of O3 concentration during the past 10 years in Shanghai is mostly attributed to the reduction in NOx emission as a result of the implementation of the Shanghai Clean Air Action Plan.
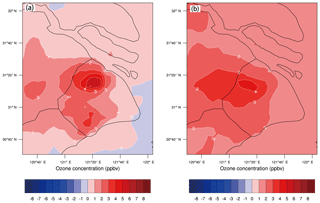
Figure 10The difference of O3 concentration (ppbv) between (a) T2 and T1 (T2–T1) and between (b) T3 and T1 (T3–T1), conducted by the WRF-Chem model. The difference between T2 and T1 lies in the NOx emissions set in T2 (2015 scenario), which is 30 % lower than that in T1 (2009 scenario), estimated by Lin et al. (2017) according to the Shanghai Environment Yearbook. The difference between T3 and T1 is dependent on the VOC emissions in T3 being 50 % higher than those in T1.
The O3 chemical formation is strongly related to NOx and VOC concentrations. As discussed by Geng et al. (2008a) the O3 chemical formation is clearly under a VOC-limited regime in Shanghai and its neighboring area. Under high NOx conditions, NO tends to react with O3 instead of NO2, flowing by , causing the decrease in the reactivity and ensuing O3 concentrations. Thus reduced NOx emissions would result in an increase in O3 concentrations, which is shown in Fig. 10a.
Despite minor changes in VOCs in the last 10 years, it is worth investigating the effect of the VOC changes on O3 concentrations in Shanghai. For this purpose, we conduct a sensitivity study (T3), with a 50 % increase in VOC emissions compared with T1, while keeping NOx and other emissions as well as the meteorology the same as in T1. For the RADM2 gas mechanism used in WRF-Chem, the VOCs are surrogated into 14 species, such as alkane, alkene, aromatic, formaldehyde, etc. All the species of VOCs are increased by 50 % at every model grid over Shanghai and at every hour. The difference of O3 concentration between T3 and T1 (T3–T1) is shown in Fig. 10b. As we expected, the O3 concentration in Shanghai is sensitive to the enhancement of VOC emissions, increasing by 3–4 ppbv in the urban area due to more NO being converted to NO2 by reaction with RO2 and HO2. Furthermore, a significant amount of the abundant O3 plumes produced in the urban zones are transported to the downwind areas about 100–200 km away, resulting in an increase in O3 concentrations in western Shanghai by about 2 ppbv. According to Tie et al. (2013), the O3 plume released in the Shanghai urban area can be transported to downwind of the city by about 100–150 km away in the MIRAGE-Shanghai field campaign. The model studies of T1, T2, and T3 highlight that under the emissions of the 2009 scenario, the O3 chemical production is clearly under a VOC-limited regime, and either decreasing NOx concentrations or increasing VOC concentrations would result in the O3 enhancement. The analysis of in situ measurements and model experiments jointly suggests that the significant O3 increasing trend during the past 10 years in Shanghai can be mainly attributed to the large reduction in NOx emissions.
4.5 The variation in O3 production regime response to emission change
The O3 chemical mechanism in Shanghai was explored by several studies based on the in situ measurements around 2008 and 2009. Geng et al. (2008a, b), Ran et al. (2009), and Tie et al. (2009a) all revealed that the O3 production around 2008 and 2009 in Shanghai was clearly under a VOC-limited regime, which is further illustrated by the above model studies. As indicated in Fig. 3, the significant decrease in NOx concentration is observed from 2009 to 2015 in Shanghai, while the VOC concentration changed little during the same period. As we know, the O3 chemical formation is strongly nonlinearly related to NOx and VOC concentrations. Thus the different variability of NOx and VOC concentration from 2009 to 2015 inevitably has a large effect on the O3 production regime, which needs to be investigated deeply.
The complex relationship among NOx, VOCs, and O3 concentrations is usually depicted by O3 isopleth diagrams. The O3 isopleth plot (Fig. 11) in Shanghai used in this study is constructed by the OZIPR model based on the in situ measurements of O3, NOx, VOCs, and meteorology. Under high VOCs and low NOx conditions (low NOx∕VOCs ratio), the O3 production is not sensitive to VOCs, while it is positively correlated to the NOx concentration, which is viewed as an NOx-limited regime. By contrast, under low VOCs and high NOx conditions (high NOx∕VOCs ratio), the O3 production tends to increase with the VOC growth or NOx reduction, which is regarded as a VOC-limited regime. The NOx-limited and VOC-limited regime is divided by a ridge line (the dotted–dashed line in Fig. 11) in the O3 isopleth plot. The O3 production is not sensitive to either NOx concentration or VOC concentration when near the ridge line, which is regarded as the transition regime.
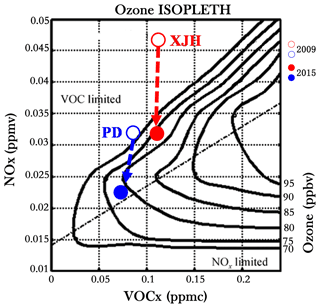
Figure 11The O3 chemical production at the downtown site XJH and the sub-urban site PD in 2009 and 2015 depicted by an O3 isopleth diagram. The hollow and solid red circles denote O3 production regime at XJH in 2005 and 2019. The hollow and solid blue circles denote O3 production regime at PD in 2005 and 2019.
The O3 chemical production regimes at XJH and PD in 2009 and 2015 are positioned in Fig. 11. In 2009 the O3 production at both XJH and PD sites (marked as red and blue hollow circle respectively) are clearly under VOC-limited regime. Thus a decrease in NOx concentration leads to the O3 enhancement, which is highlighted by the previous in situ measurements and model experiments. Since then the O3 production regime tends to move toward the dotted–dashed line due to the significant reduction in NOx concentrations accompanied by a relatively smaller change in VOCs at the two sites. In 2015 the O3 production at XJH (marked as a red solid circle) is still under VOC-limited regime, but for PD (marked as a blue solid circle), it is close to the dotted–dashed line, approaching the transition regime between VOC-limited and NOx-limited. This result suggests that if the NOx emissions continue to reduce after 2015 assuming the VOC concentration keeps constant, the O3 concentration will continue to increase at XJH, while at PD the O3 concentration is supposed to be insensitive to the NOx change. According to the O3 chemical regime depicted in Fig. 11, if the NOx concentration decreases by 5 ppbv after 2015, the peak O3 concentration at XJH will further increase by 3 ppbv, whereas at PD it seems to change very slightly. To better understand this further change, more sensitivity studies of WRF-Chem are conducted in the following sections.
5.1 The O3 level in 2020
According to the Shanghai Clean Air Action Plan, the NOx emissions in Shanghai will be further reduced by 20 % in 2020 compared with those in 2015. According to the above analysis based on the O3 isopleth plot (Fig. 11), the O3 concentrations in downtown and sub-urban areas seem to have distinctly different responses to further NOx reduction after 2015. In order to better understand the future O3 variation, the sensitivity experiment T4 is conducted by WRF-Chem with 20 % reduction in NOx emission compared with T2. The NOx emissions set in T2 and T4 represent 2015 and 2020 scenarios respectively. The other emissions and meteorology are set to be the same as in T1. The difference of O3 concentration between T2 and T4 (T4–T2) is presented in Fig. 12a. The O3 concentration keeps increasing in a downtown area such as XJH site, ranging from 2 to 4 ppbv. However, for the sub-urban zones such as the PD site, the O3 concentration changes very little response to the further NOx reduction, ranging from 0 to 1 ppbv. As discussed in Fig. 11, in 2015 the O3 production at PD is possibly under the transition regime from VOC-limited to NOx-limited near the ridge line. As a result, the O3 concentration is not sensitive to the variation in NOx concentration. However the O3 concentration in the rural zones generally decreases by 1 ppbv, indicating that with the further NOx reduction after 2015 the O3 chemical production transfers from VOCs-limited to NOx-limited regime in the rural of Shanghai.
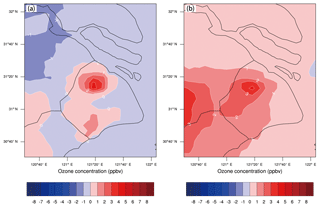
Figure 12The difference of O3 concentration (ppbv) between (a) T4 and T2 (T4–T2) and between (b) T5 and T2 (T5–T2), conducted by the WRF-Chem model. The difference between T4 and T2 is that the NOx emissions set in T4 (2020 scenario) is 20 % lower than that in T2 (2015 scenario), which is estimated according to the Shanghai Clean Air Action Plan. The difference between T5 and T2 lies in that the VOC emissions in T5 are 50 % higher than those in T2.
It is suggested in Fig. 11 that the O3 production at the downtown site XJH in 2015 is still under a VOC-limited regime despite the significant NOx reduction. The O3 concentration would also be sensitive to the variation in VOC concentration. Thus the sensitivity experiment T5 is conducted by the WRF-Chem model with 50 % enhancement of VOC emissions compared with T2 (representing the emission in 2015 scenario). It is presented in Fig. 12b that the O3 concentration increases by 2–3 ppbv in the downtown area due to the enhancement of VOCs, suggesting that the O3 production downtown in 2015 is still under a VOC-limited regime, which is consistent with the results in Fig. 11. Moreover the O3 plumes produced in the urban area are transported to the downwind area to increase the high O3 concentration in the western area to Shanghai by 2 ppbv. While at sub-urban site PD, the O3 concentration changes less than 1 ppbv in response to the increase in VOC emissions, which is similar to the very weak O3 variations relative to the NOx reduction in Fig. 12a. Overall, the model studies of T4 and T5 jointly suggest that the O3 concentration at the sub-urban site PD in 2015 is not sensitive to either NOx or VOC variations due to the O3 production are under the transition regime depicted in the O3 isopleth plot.
5.2 The O3 chemical production after 2020
The above study shows that the O3 production at the sub-urban site PD in 2020 will likely transfer from a VOC-limited regime to an NOx-limited regime without the consideration of possible VOC changes. To better understand the O3 pollution control strategy, it is worth estimating the O3 level response to emission changes after 2020 in Shanghai. It is also essential to know how many NOx emissions need to be cut after 2020 to cease the O3 enhancement in the downtown area. Thus the sensitivity experiment T6 is conducted with a further 20 % reduction in NOx emissions from the 2020 scenario (T4). The difference of O3 concentration between T6 and T4 (T6–T4) is shown in Fig. 13a. It is clear that the O3 concentration downtown stays nearly constant regardless of the further reduction in NOx emissions after 2020. That is to say the increasing trend of O3 downtown with the NOx reduction ceases after 2020, indicating that the O3 production likely approaches the transition regime. In addition, the O3 concentration decreases significantly outside of the downtown area, ranging from 2 to 3 ppbv in sub-urban zones, and more than 4 ppbv in rural zones, indicating that the O3 production in Shanghai transfers to an NOx-limited regime after 2020, except for the downtown area where the O3 production is likely near the transition zone. On the other hand, if the NOx emissions are kept constant after 2020 as in T4, while the VOC emissions is increased by 50 % from T4 (T7 experiment), the O3 concentration (Fig. 13b) changes little in both urban and suburban areas in Shanghai, which is different from the previous model study of T5 the T3 when O3 production was under VOC-limited conditions. It is suggested that the O3 concentration after 2020 is not sensitive to the variation in VOC concentration because the continuous reduction in NOx emissions influences the O3 production to cause a change to an NOx-limited regime. Thus further reduction in NOx tends to decrease the O3 concentration in Shanghai.
O3 pollution is a serious issue in China. Better understanding of the elevated O3 and its response to emission change is important for Chinese megacities. In this study, we analyze the increasing trend of O3 concentrations by long-term measurements of O3 and its precursors as well as meteorology in Shanghai combined with the WRF-Chem model. The O3 production regime response to the emission change in Shanghai during the past 10 years is also explored by an O3 isopleth plot. In addition, the future O3 variation and its chemical production in Shanghai are evaluated by the WRF-Chem model. The main conclusions are summarized as follows:
-
The daily maximum O3 concentration measured in Shanghai increased significantly from 2006 to 2015 with the rate of 0.808 ppbv yr−1 at the downtown site XJH and 1.374 ppbv yr−1 at the sub-urban site PD. The observed increasing trend of O3 is not limited in the urban zones but expanded to the larger scale covering the total Shanghai city. The NOx and VOC concentrations presented different variability from O3 during the same period, in which NOx concentration decreases significantly at both the XJH and PD sites, whereas the VOCs changes very little without evident trends.
-
Because there are minor trends in measured O3 photolysis, local dispersion, and regional transport resulting from meteorology, it is speculated that the significant increasing O3 trend during 2006 to 2015 in Shanghai could likely be attributed to the reduction in NOx concentrations as a result of the strong VOC-limited regime for O3 production. The nighttime O3 is more sensitive to NOx reduction than that in daytime in downtown areas, because less O3 is depressed by NO at nighttime. As a result, the observed nighttime O3 concentration at XJH increases more rapidly than that in the daytime response to the NOx reduction.
-
The WRF-Chem model is utilized to calculate the long-term O3 variation response to emission change. The sensitivity experiments illustrate that either reduction in NOx emission or growth of VOC emissions conducted by WRF-Chem lead to the significant enhancement in O3 concentration in urban zones in 2009 as the baseline, indicating the O3 production is clearly under a VOC-limited regime. The calculated O3 concentration increases by 1–7 ppbv in urban zones from 2009 to 2015 as a result of a 30 % reduction in NOx emissions estimated by Shanghai Environmental Monitoring Center. The enhancement of O3 concentration is significant in urban zones, generally more than 4 ppbv, with the maximum elevation of 6–7 ppbv occurring in the downtown area, which is consistent with the measurements. The increasing rates of O3 at the downtown site XJH and sub-urban site PD are estimated at 1.06 and 0.96 ppbv yr−1 from 2009 to 2015 by WRF-Chem, which is close to the observed O3 growth variability of 1–1.3 ppbv yr−1. This result suggests that the observed increasing trend of O3 concentration during the past 10 years in Shanghai could likely be attributed to the reduction in NOx emission under the VOC-limited condition for O3 production.
-
The model sensitivity study suggests that a significant decrease in NOx concentration combined with the obscure VOC variation from 2006 to 2015 gradually promotes the O3 chemical production in Shanghai from VOC-limited to NOx-limited, which is consistent with the O3 isopleth diagram. The O3 isopleth plot shows that O3 production is in a VOC-limited regime in both the downtown site XJH and sub-urban site PD in 2009. With the 30 % reduction in NOx emissions from 2009 to 2015 estimated by the Shanghai Environmental Monitoring Center, the O3 production in XJH is still under a VOC-limited regime, while the O3 production moves to the transition regime in PD, suggesting that the O3 concentration in sub-urban zones is not sensitive to the variation in either NOx or VOC concentrations.
-
In order to better understand the O3 control strategy in Shanghai, the future O3 production is estimated by WRF-Chem. The O3 concentration in Shanghai downtown would keep increasing until 2020 with a 20 % reduction in NOx emissions after 2015 estimated by Shanghai Clean Air Action Plan. If the NOx emission is further decreased by 20 % after 2020, The O3 concentration will decrease by 2–3 ppbv in sub-urban zones, and more than 4 ppbv in rural areas. While the O3 concentration downtown is not sensitive to either NOx reduction or VOC enhancement after 2020, indicating the O3 production in Shanghai will transfer to NOx-limited regimes, except downtown where the O3 production is likely close to the transition regime. Further reduction in NOx emissions after 2020 tend to mitigate the O3 pollution in Shanghai.
-
There are some uncertainties and limitations in the study. First, the inhomogeneity of the NOx reduction is not considered in the sensitivity experiments due to the lack of a high-resolution emission inventory (e.g., 1 km resolution). Second, the variation in VOC emissions is not taken into account in the model experiments due to the greater number of uncertainties in the current VOC emission inventory, while O3 production in Shanghai is very sensitive to some VOC species, especially aromatics. Thus the accurate emission inventory of VOCs need to be developed and included in future studies. Third, the same meteorology is used for all WRF-Chem simulations. However, the O3 photolysis, advection, and vertical diffusion are all strongly affected by meteorology. The change in meteorology would be considered and evaluated in future studies for more deep investigation.
The data used in this paper can be provided upon request from Jianming Xu (metxujm@163.com).
XT came up with the original idea of investigating the impact of emission change on long-term O3 variations. XT and JX designed the analysis method. JX conducted the analysis. WG, YL, and QF provided the observational data and helped in its discussion.
The authors declare that they have no conflict of interest.
This study was supported by the National Key R&D Program of China (grant no. 2018YFC0213800) and the National Natural Science Foundation of China (grant nos. 91644223, 41430424, 41730108 and 41801367).
This paper was edited by Aijun Ding and reviewed by two anonymous referees.
Binkowski, F. S. and Roselle, S. J.: Models-3 community multi scale air quality (CMAQ) model aerosol component – 1. Model description, J. Geophys. Res., 108, 4183, https://doi.org/10.1029/2001jd001409, 2003.
Brasseur, G. P., Orlando, J. J., and Tyndall, G. S.: Atmospheric chemistry and global change, Oxford University Press, Cambridge, USA, 654 pp., 1999.
Cai, C. J., Geng, F. H., Tie, X. X., Yu, Q., and An J. L.: Characteristics and source apportionment of VOCs measured in Shanghai, China, Atmos. Environ., 44, 5005–5014, 2010.
Chen, F. and Dudhia, J.: Coupling an advanced land surface hydrology model with the Penn State-NCAR MM5 modeling system, Part I: Model implementation and sensitivity, Mon. Weather Rev., 129, 569–585, 2001.
Dudhia, J.: Numerical study of convection observed during the winter monsoon experiment using a mesoscale two-dimensional model, J. Atmos. Sci., 46, 3077–3107, 1989.
Emmons, L. K., Walters, S., Hess, P. G., Lamarque, J.-F., Pfister, G. G., Fillmore, D., Granier, C., Guenther, A., Kinnison, D., Laepple, T., Orlando, J., Tie, X., Tyndall, G., Wiedinmyer, C., Baughcum, S. L., and Kloster, S.: Description and evaluation of the Model for Ozone and Related chemical Tracers, version 4 (MOZART-4), Geosci. Model Dev., 3, 43–67, https://doi.org/10.5194/gmd-3-43-2010, 2010.
Gao, W., Tie, X. X., Xu, J. M., Huang, R. J., Mao, X. Q., Zhou, G. Q., and Chang, L. Y.: Long-term trend of O3 in a mega City (Shanghai), China: Characteristics, causes, and interactions with precursors, Sci. Total Environ., 603–604, 425–433, 2017.
Geng, F. H., Zhao, C. S., Tang, X., Lu, G. L., and Tie, X. X.: Analysis of ozone and VOCs measured in Shanghai: a case study, Atmos. Environ., 41, 989–1001, 2007.
Geng, F. H., Tie, X., Xu, J., Zhou, G., Peng, L., Gao, W., Tang, X., and Zhao, C.: Characterizations of ozone, NOx, and VOCs measured in Shanghai, China, Atmos. Environ., 42, 6873–6883, 2008a.
Geng, F. H., Zhang, Q., Tie, X., Huang, M., Ma, X., Deng, Z., Quan, J., and Zhao, C.: Aircraft measurements of O3, NOx, CO, VOCs, and SO2 in the Yangtze River Delta region, Atmos. Environ., 43, 584–593, 2008b.
Geng, F. H., Tie, X., Guenther, A., Li, G., Cao, J., and Harley, P.: Effect of isoprene emissions from major forests on ozone formation in the city of Shanghai, China, Atmos. Chem. Phys., 11, 10449–10459, https://doi.org/10.5194/acp-11-10449-2011, 2011.
Geng, F. H., Mao, X. Q., Zhou, M. Y., Zhong, S. Y., and Lenschow, D.: Multi-year ozone concentration and its spectra in Shanghai, China, Sci. Total Environ., 521–522, 135–143, 2015.
Gery, M. W. and Crouse, R. R.: User's Guide for Executing OZIPR, Atmospheric Research and Exposure Assessment Lab., Office of Research and Development, U.S. EPA, Research Triangle Park, N.C., available at: http://www.epa.gov/scram001/models/other/oziprdme.txt (last access: February 2005), 2002.
Grell, G. A., Peckham, S. E., Schmitz, R., McKeen, S. A., Frost, G., Skamarock, W. C., and Eder, B.: Fully coupled “online” chemistry within the WRF model, Atmos. Environ., 39, 6957–6975,2005.
Guenther, A., Karl, T., Harley, P., Wiedinmyer, C., Palmer, P. I., and Geron, C.: Estimates of global terrestrial isoprene emissions using MEGAN (Model of Emissions of Gases and Aerosols from Nature), Atmos. Chem. Phys., 6, 3181–3210, https://doi.org/10.5194/acp-6-3181-2006, 2006.
Hong, S. Y. and Lim, J. O. J.: The WRF Single-Moment 6-Class Microphysics Scheme (WSM6), J. Korean Meteor. Soc., 42, 129–151, 2006.
Hu, X. M., Klein, P. M., and Xue, M.: Evaluation of the updated YSU planetary boundary layer scheme within WRF for wind resource and air quality assessments, J. Geophys. Res.-Atmos., 118, 10490–10505, 2013.
Hu, X. M., Xue, M., Klein, P. M., Illston, B. G., and Chen, S.: Analysis of Urban Effects in Oklahoma City using a Dense Surface Observing Network, J. Appl. Meteorol. Clim., 55, 723-741, 2016.
Lei, W., de Foy, B., Zavala, M., Volkamer, R., and Molina, L. T.: Characterizing ozone production in the Mexico City Metropolitan Area: a case study using a chemical transport model, Atmos. Chem. Phys., 7, 1347–1366, https://doi.org/10.5194/acp-7-1347-2007, 2007.
Li, G., Lei, W., Zavala, M., Volkamer, R., Dusanter, S., Stevens, P., and Molina, L. T.: Impacts of HONO sources on the photochemistry in Mexico City during the MCMA-2006/MILAGO Campaign, Atmos. Chem. Phys., 10, 6551–6567, https://doi.org/10.5194/acp-10-6551-2010, 2010.
Li, G., Bei, N., Tie, X., and Molina, L. T.: Aerosol effects on the photochemistry in Mexico City during MCMA-2006/MILAGRO campaign, Atmos. Chem. Phys., 11, 5169–5182, https://doi.org/10.5194/acp-11-5169-2011, 2011.
Li, K., Jacob, D. J., Liao, H., Shen, L., Zhang, Q., and Bates, K. H.: Anthropogenic drivers of 2013–2017 trends in summer surface ozone in China, P. Natl. Acad. Sci. USA, 116, 422–427, 2019.
Lin, X., Trainer, M., and Liu, S. C.: On the nonlinearity of the tropospheric ozone production, J. Geophys. Res.-Atmos., 93, 15879–15888, 1988.
Lin, Y. F., Wang, Q., Fu, Q. Y., Duan, Y. S., Xu, J. M., Liu, Q. Z., Li, F., and Huang, K.: Temporal-spatial characteristics and impact factors of ozone pollution in Shanghai, Environmental Monitoring in China, 33, 60–67, 2017 (in Chinese).
Lin, Y. L., Farley, R. D., and Orville, H. D.: Bulk parameterization of the snowfield in a cloud model, J. Clim. Appl. Meteorol., 22, 1065–1092, 1983.
Lu, X., Hong, J., Zhang, L., Cooper, O., Schultz, M., Xu, X., Wang, T., Gao, M., Zhao, Y., and Zhang, Y.: Severe surface ozone pollution in China: A global perspective, Environ. Sci. Technol. Lett., 5, 487–494, 2018.
Ma, Z., Xu, J., Quan, W., Zhang, Z., Lin, W., and Xu, X.: Significant increase of surface ozone at a rural site, north of eastern China, Atmos. Chem. Phys., 16, 3969–3977, https://doi.org/10.5194/acp-16-3969-2016, 2016.
Monks, P. S., Archibald, A. T., Colette, A., Cooper, O., Coyle, M., Derwent, R., Fowler, D., Granier, C., Law, K. S., Mills, G. E., Stevenson, D. S., Tarasova, O., Thouret, V., von Schneidemesser, E., Sommariva, R., Wild, O., and Williams, M. L.: Tropospheric ozone and its precursors from the urban to the global scale from air quality to short-lived climate forcer, Atmos. Chem. Phys., 15, 8889–8973, https://doi.org/10.5194/acp-15-8889-2015, 2015.
Nenes, A., Pandis, S. N., and Pilinis, C.: ISORROPIA: A new thermodynamic equilibrium model for multiphase multicomponent inorganic aerosols, Aquat. Geochem., 4, 123–152, 1998.
Ran, L., Zhao, C., Geng, F., Tie, X., Tang, X., Peng, L., Zhou, G., Yu, Q., Xu, J., and Guenther, A.: Ozone photochemical production in urban Shanghai, China: analysis based on ground level observations, J. Geophys. Res.-Atmos., 114, D15301, https://doi.org/10.1029/2008JD010752, 2009.
Sillman, S.: The use of NOy, H2O2, and HNO3 as indicators for ozone-NOx-hydrocarbon sensitivity in urban locations, J. Geophys. Res.-Atmos., 100, 14175–14188, 1995.
Sillman, S.: The relation between ozone, NOx and hydrocarbons in urban and polluted rural environments, Atmos. Environ., 33, 1821–1845, 1999.
Song, J., Lei, W., Bei, N., Zavala, M., de Foy, B., Volkamer, R., Cardenas, B., Zheng, J., Zhang, R., and Molina, L. T.: Ozone response to emission changes: a modeling study during the MCMA-2006/MILAGRO Campaign, Atmos. Chem. Phys., 10, 3827–3846, https://doi.org/10.5194/acp-10-3827-2010, 2010.
Stockwell, W. R., Middleton, P., Chang, J. S., and Tang, X.: The second generation regional acid deposition model chemical mechanism for regional air quality modeling, J. Geophys. Res.-Atmos., 95, 16343–16367, 1990.
Sun, L., Xue, L., Wang, T., Gao, J., Ding, A., Cooper, O. R., Lin, M., Xu, P., Wang, Z., Wang, X., Wen, L., Zhu, Y., Chen, T., Yang, L., Wang, Y., Chen, J., and Wang, W.: Significant increase of summertime ozone at Mount Tai in Central Eastern China, Atmos. Chem. Phys., 16, 10637–10650, https://doi.org/10.5194/acp-16-10637-2016, 2016.
Tai, A. P. K., Martin, M. V., and Heald, C. L.: Threat to future global food security from climate change and ozone air pollution, Nat. Clim. Change, 4, 817–821, 2014.
Tang, G., Li, X., Wang, Y., Xin, J., and Ren, X.: Surface ozone trend details and interpretations in Beijing, 2001–2006, Atmos. Chem. Phys., 9, 8813–8823, https://doi.org/10.5194/acp-9-8813-2009, 2009.
Tang, W. Y., Zhao, C. S., Geng, F. H., Peng, L., Zhou, G. Q., Gao, W., Xu, J. M., and Tie, X. X.: Study of ozone “weekend effect” in Shanghai, Sci. China Ser. D, 51, 1354–1360, 2008.
Tie, X., Brasseur, G., Emmons, L., Horowitz, I., and Kinnison, D.: Effects of aerosols on tropospheric oxidants: a global model study, J. Geophys. Res.-Atmos., 106, 22931–22964, 2001.
Tie, X., Madronich, S., Walters, S., Zhang, R. Y., Rasch, P., and Collins, W.: Effect of clouds on photolysis and oxidants in the troposphere, J. Geophys. Res.-Atmos., 108, 4642, https://doi.org/10.1029/2003jd003659, 2003.
Tie, X., Madronich, S., Li, G., Ying, Z., Zhang, R., Garcia, A., Taylor, J., and Liu, Y.: Characterizations of chemical oxidants in Mexico City: A regional chemical dynamical model (WRF-Chem) study, Atmos. Environ., 41, 1989–2008, 2007.
Tie, X., Geng, F. H., Peng, L., Gao, W., and Zhao, C. S.: Measurement and modeling of O3 variability in Shanghai, China: application of the WRF-Chem model, Atmos. Environ., 43, 4289–4302, 2009a.
Tie, X., Madronich, S., Li, G., Ying, Z., Weinheimer, A., Apel, E., and Campos, T.: Simulation of Mexico City plumes during the MIRAGE-Mex field campaign using the WRF-Chem model, Atmos. Chem. Phys., 9, 4621–4638, https://doi.org/10.5194/acp-9-4621-2009, 2009b.
Tie, X., Geng, F., Guenther, A., Cao, J., Greenberg, J., Zhang, R., Apel, E., Li, G., Weinheimer, A., Chen, J., and Cai, C.: Megacity impacts on regional ozone formation: observations and WRF-Chem modeling for the MIRAGE-Shanghai field campaign, Atmos. Chem. Phys., 13, 5655–5669, https://doi.org/10.5194/acp-13-5655-2013, 2013.
Wang, H.-J. and Chen, H.-P.: Understanding the recent trend of haze pollution in eastern China: roles of climate change, Atmos. Chem. Phys., 16, 4205–4211, https://doi.org/10.5194/acp-16-4205-2016, 2016.
Wang, T., Xue, L., Brimblecombe, P., Lam Y. F., Li, L., and Zhang, L.: Ozone pollution in China: A review of concentrations, meteorological influences, chemical precursors, and effects, Sci. Total Environ., 575, 1582–1596, 2017.
Wesely, M. L.: Parameterization of surface resistances to gaseous dry deposition in regional-scale numerical models, Atmos. Environ., 23, 1293–1304, 1989.
Xu, J. M., Yan, F. X., Xie, Y., Wang, F. Y., Wu, J. B., and Fu, Q. Y.: Impact of meteorological conditions on a nine-day particulate matter pollution event observed in December 2013, Shanghai, China, Particuology, 20, 69–79, 2015.
Xu, J. M., Chang, L. Y., Yan, F. X., and He, J. H.: Role of climate anomalies on decadal variation in the occurrence of wintertime haze in the Yangtze River Delta, China, Sci. Total Environ., 599–600, 918–925, 2017.
Ying, Z. M., Tie, X., and Li, G. H.: Sensitivity of ozone concentrations to diurnal variations of surface emissions in Mexico City: A WRF/Chem modeling study, Atmos. Environ., 43, 851–859, 2009.
Zhang, Q., Streets, D. G., Carmichael, G. R., He, K. B., Huo, H., Kannari, A., Klimont, Z., Park, I. S., Reddy, S., Fu, J. S., Chen, D., Duan, L., Lei, Y., Wang, L. T., and Yao, Z. L.: Asian emissions in 2006 for the NASA INTEX-B mission, Atmos. Chem. Phys., 9, 5131–5153, https://doi.org/10.5194/acp-9-5131-2009, 2009.
Zhao, S., Li, J. P., and Sun, C.: Decadal variability in the occurrence of wintertime haze in central eastern China tied to the Pacific decadal oscillation, Sci. Rep., 6, 27424, https://doi.org/10.1038/srep27424, 2016.
Zheng, B., Tong, D., Li, M., Liu, F., Hong, C., Geng, G., Li, H., Li, X., Peng, L., Qi, J., Yan, L., Zhang, Y., Zhao, H., Zheng, Y., He, K., and Zhang, Q.: Trends in China's anthropogenic emissions since 2010 as the consequence of clean air actions, Atmos. Chem. Phys., 18, 14095–14111, https://doi.org/10.5194/acp-18-14095-2018, 2018.
Zhou, G. Q., Xu, J. M., Xie, Y., Chang, L. Y., and Gao, W.: Numerical air quality forecasting over eastern China: An operational application of WRF-Chem, Atmos. Environ., 153, 94–108, 2017.
- Abstract
- Introduction
- Measurements and models
- Variability of O3 and its precursors measured in Shanghai
- WRF-Chem study on the O3 variation response to emission change
- The future O3 evaluation
- Conclusions
- Data availability
- Author contributions
- Competing interests
- Financial support
- Review statement
- References


