the Creative Commons Attribution 4.0 License.
the Creative Commons Attribution 4.0 License.
 | 11 Jul 2019
High-resolution mapping of vehicle emissions of atmospheric pollutants based on large-scale, real-world traffic datasets
Daoyuan Yang
Shaojun Zhang
Tianlin Niu
Yunjie Wang
Honglei Xu
K. Max Zhang
On-road vehicle emissions are a major contributor to elevated air pollution levels in populous metropolitan areas. We developed a link-level emissions inventory of vehicular pollutants, called EMBEV-Link (Link-level Emission factor Model for the BEijing Vehicle fleet), based on multiple datasets extracted from the extensive road traffic monitoring network that covers the entire municipality of Beijing, China (16 400 km2). We employed the EMBEV-Link model under various traffic scenarios to capture the significant variability in vehicle emissions, temporally and spatially, due to the real-world traffic dynamics and the traffic restrictions implemented by the local government. The results revealed high carbon monoxide (CO) and total hydrocarbon (THC) emissions in the urban area (i.e., within the Fifth Ring Road) and during rush hours, both associated with the passenger vehicle traffic. By contrast, considerable fractions of nitrogen oxides (NOx), fine particulate matter (PM2.5) and black carbon (BC) emissions were present beyond the urban area, as heavy-duty trucks (HDTs) were not allowed to drive through the urban area during daytime. The EMBEV-Link model indicates that nonlocal HDTs could account for 29 % and 38 % of estimated total on-road emissions of NOx and PM2.5, which were ignored in previous conventional emission inventories. We further combined the EMBEV-Link emission inventory and a computationally efficient dispersion model, RapidAir®, to simulate vehicular NOx concentrations at fine resolutions (10 m × 10 m in the entire municipality and 1 m × 1 m in the hotspots). The simulated results indicated a close agreement with ground observations and captured sharp concentration gradients from line sources to ambient areas. During the nighttime when the HDT traffic restrictions are lifted, HDTs could be responsible for approximately 10 µg m−3 of NOx in the urban area. The uncertainties of conventional top-down allocation methods, which were widely used to enhance the spatial resolution of vehicle emissions, are also discussed by comparison with the EMBEV-Link emission inventory.
- Article
(2515 KB) - Full-text XML
-
Supplement
(2576 KB) - BibTeX
- EndNote


The rapid growth in vehicle use associated with socioeconomic development has triggered serious atmospheric pollution and adverse health impacts (Anenberg et al., 2017; Guo et al., 2014; Huang et al., 2014). Serious air pollution problems, which are seen as high ambient concentration levels of major air pollutants, have attracted substantial public attention in populous metropolitan areas. Beijing demonstrates two profound aspects in one single city: an obvious achievement in city development accompanied by substantial pressure to mitigate air pollution episodes (UNEP, 2016). Many other megacities are facing similar environmental challenges after decades of rapid economic development. Beijing's annual concentration of fine particulate matter (PM2.5) in 2017 was 58 µg m−3. Although this value was reduced by 35 % as opposed to that in 2013, it still significantly exceeded the limit of China's national ambient air quality standard (35 µg m−3) by 66 % (Beijing MEEB, 2018a). Recent official source apportionment results indicated that vehicle emissions remained one of the most important pollution contributors, responsible for an average of 45 % of total PM2.5 concentrations from local sources (Beijing MEEB, 2018b). The exceedance of ambient nitrogen dioxide (NO2) concentrations represents another air quality problem in Beijing (UNEP, 2016; Beijing MEEB, 2018a), where nitrate aerosols have become one of the most important PM2.5 components, with an average mass fraction of up to 40 % (Beijing MEEB, 2018b; Li et al., 2018). Therefore, controlling vehicle emissions is one of the prioritized tasks remaining for local environmental protection authorities.
Beijing has been playing the role of a pioneer in controlling vehicle emissions within China over the past two decades (Zhang et al., 2014b). So far, emission standards for new vehicles in Beijing have been tightened to the fifth generation (China 5/V standards), and ultra-low sulfur gasoline and diesel fuels have been fully delivered upon. In addition, after witnessing the effectiveness of driving restrictions (i.e., the “odd–even” policy) to control vehicle emissions during the 2008 Olympic Games, transportation management has been substantially implemented for environmental purposes, notably through license control and driving restriction policies. Currently, traffic measures are increasingly important in the “vehicle–fuel–road” integrated emission mitigation strategies (Wu et al., 2017). For example, the Beijing municipal government has finalized an emergency plan for extreme air pollution in Beijing, which requires issuance of a red alert when a severe pollution episode (e.g., 24 h average concentration of PM2.5 above 250 µg m−3) lasting over 3 d is reported. During the red alert periods, private vehicles are prohibited from roads every other day based on the last digit of the license plate, namely, according to the odd–even policy.
Although previous testing results could convincingly support the decreasing trend in fleet-average emission factors for local vehicles (Zhang et al., 2014b; Wu et al., 2012), some major limitations have not yet been adequately addressed. First, a major aspect of previous assessment tools, known as emission inventories (Lang et al., 2012; Zhang et al., 2014b), was developed based on vehicle registration data lacking temporal and spatial associations with real-world traffic patterns. Only a few studies have attempted to establish cell-gridded or link-based emission inventories that limited their study domains to the urban area (e.g., within the Fifth or Sixth Ring Road) and/or limited vehicle categories (e.g., light-duty passenger vehicles) (Huo et al., 2009; Wang et al., 2009; Jing et al., 2016). Nevertheless, the total municipal area of Beijing is approximately 16 400 km2, and vehicular emissions in the outskirts should be evaluated. As a regional transportation hub, it is known that a considerable number of freight trucks registered in other regions operate within the city boundaries of Beijing. All previous studies have not quantified on-road emissions from nonlocal trucks. On-road measurement studies using a plume chasing method indicated that nonlocal trucks were highly likely to be gross emitters of primary PM2.5 and black carbon (BC) (Wang et al., 2012), since their original registration regions usually were less strict with respect to environmental oversights (e.g., type-approval conformity check, in-use compliance inspection) than Beijing (Zheng et al., 2015).
Driven by the rapid development of intelligent transportation systems (ITSs) in many cities during recent decades, we are able to collect real-world traffic data using multiple ITS approaches (Barth et al., 2003; Gately et al., 2017; Zhang et al., 2018). These ITS-informed datasets are capable of capturing the dynamic traffic conditions in congested urban areas as well as actual driving patterns of diesel trucks, which could contribute large fractions of NOx and PM2.5 despite small vehicle numbers (Dallmann et al., 2013; Gately et al., 2017). In this study, we established a high-resolution emission inventory of on-road vehicles (EMBEV-Link, Link-level Emission factor Model for the BEijing Vehicle fleet) based on large-scale, real-world traffic datasets (e.g., traffic count, hourly speed, fleet configuration), which covered the entire road network of the municipality of Beijing. This tool enabled us to elucidate the temporal and spatial emission patterns and to detail the emission burden from nonlocal trucks. This paper presents an example to conduct fine-grained emission modeling at the megacity scale and can directly support local emission mitigation strategies.
2.1 Research domain and emission calculation
The entire municipality of Beijing, with a total area of 16 400 km2, comprises 16 urban, suburban and rural districts. The present city progressively spreads outwards in concentric ring expressways (i.e., Second to Sixth Ring Road). The urban area is typically referred to as the region within the Fifth Ring Road, wherein the municipal government has intensively implemented driving restrictions since 2008. Emissions of primary vehicular pollutants (carbon monoxide, CO; total hydrocarbon, THC; nitrogen oxide, NOx; PM2.5; and black carbon, BC) were calculated with a high-resolution method in a temporal and spatial framework, namely, the Link-level Emission factor Model for the BEijing Vehicle fleet (EMBEV-Link). Figure 1 is a flow diagram to illustrate the overall modeling methodology for the EMBEV-Link system. The traffic data acquisition and further modeling to the entire road network will be introduced and detailed in Sect. 2.2. For each road link, hourly emissions are the product of traffic volume, link length and speed-dependent emission factors (see Eq. 1) (Zhang et al., 2016).
where is the total emission of pollutant j on road link l at hour h, in units of grams per hour (g h−1); EFc,j(v) is the average emission factor of pollutant j for vehicle category c at speed v, in units of grams per kilometer (g km−1); TV is the traffic volume of vehicle category c on road link l at hour h, in units of vehicles per hour (veh h−1); Ll is the length of road link l, in units of kilometers (km). Eight vehicle categories were defined, namely, light-duty passenger vehicles (LDPVs), medium-duty passenger vehicle (MDPVs), heavy-duty passenger vehicles (HDPVs), light-duty truck (LDTs), heavy-duty truck (HDTs), public buses, taxis and motorcycles (MCs) (see Table S1 in the Supplement). For HDTs, we further classified into local HDTs and nonlocal HDTs according to the registration location. Significantly higher BC emission factors were identified from nonlocal HDTs than from local HDTs because Beijing has more stringent conformity enforcement requirements (Wang et al., 2012).

The speed-dependent emission factors for each vehicle category were developed based on the official Emission factor Model for the BEijing Vehicle fleet version 2.0 (EMBEV 2.0). The EMBEV model was developed based on thousands of in-lab dynamometer tests and hundreds of on-road tests (Zhang et al., 2014b). The EMBEV methodology and key parameters have been described in China's National Emission Inventory Guidebook (Wu et al., 2016, 2017). Figure S1 in the Supplement presents speed-dependent emission factors of CO, NOx and BC for LDPV and HDT categories, representing average environmental conditions, fleet configurations (e.g., fuel type, emission standard and vehicle size) and fuel quality (e.g., sulfur content). To match the traffic data, we utilized 2013–2014 as the calendar year to estimate emission factors. The original EMBEV model included evaporative THC emissions for gasoline vehicles (Zhang et al., 2014b). Later on, we revised the diurnal and hot soak emission rates based on local SHED tests (Liu et al., 2015) and estimated that the evaporative THC emissions could be responsible for approximately 30 % of total THC emissions in Beijing. In the current EMBEV-Link work, evaporative THC emissions were not included because we are limited to spatially specifying the evaporative off-network emissions. Furthermore, air quality simulations often require non-methane volatile organic compounds (NMVOCs) as emission input to simulate secondary pollutant formation (e.g., ozone and secondary organic aerosol). Based on local dynamometer measurements, NMVOCs could approximately account for 90 % of tailpipe THC emissions. The detailed species-resolved measurement profiles are more sensitive to vehicle technologies, fuel properties and environmental conditions, which should be developed based on advanced measurements.
2.2 Generating dynamic traffic profiles based on real-time congestion information
High-resolution congestion mapping was developed based on densely distributed taxis (more than 60 000 vehicles) in Beijing, known as “floating” cars (Cai and Xu, 2013). The municipal traffic commission used numerous trajectory data of GPS-instrumented taxis to estimate color-coded congestion levels (red: serious congestion; orange: moderate congestion; grey: not congested; see Fig. S2 for example). The congestion level was defined by real-time speed and was updated every 5 min. Nevertheless, although dynamic traffic conditions were visualized by congestion maps, most required data such as link-level speeds were not available. From the official website (http://www.bjtrc.org.cn/, last access: 30 June 2019), the only open-access data in addition to real-time congestion maps were hourly speeds and congestion indexes for ring-expressway-defined traffic regions. To improve the spatial resolution, we developed an image recognition program to parameterize the congestion level based on available congestion maps (141 available days annually in this study). Furthermore, link-level hourly speeds were calculated based on the relationship between congestion index and average speed. The calculation method is documented in the Supplement, Sect. S2. On the aggregate level, the biases of rush hour speeds between estimated results and reported data were within ±5 % for all districts. It is noted that link-level speeds for public buses were corrected due to their frequent stops for discharging and picking up passengers (Zhang et al., 2014a).
We further used congestion-map-informed road speeds to improve the temporal resolution of traffic volumes, which were originally investigated on an annual basis (BJTU and Beijing EPB, 2014). Traffic density modeling was used to express the relationship between total volume and speed in this study. The Underwood-style traffic density models (see Eq. 2) were used for expressways and arterial roads, which better fit the local traffic profiles than Greenshield's model (Hooper et al., 2013; Wang et al., 2013).
where q is the lane-specific traffic volume at speed u, in units of vehicles per hour (veh h−1); u is the hourly average traffic speed, in units of kilometers per hour (km h−1); and km is the best fitting traffic density, in units of vehicles per kilometer (veh km−1). The model coefficients, km and uf, are determined through linear least squares fitting based on annual-average hourly volume and speed profiles for urban major roads (see the Supplement, Sect. S2). We applied the Underwood model to estimate the relative change of hourly traffic volume in response to the speed variation.
Traffic video records were collected at more than 30 major urban roads to develop traffic mixes by hour, road type and district (see Fig. S3). In particular, we manually counted the number of nonlocal HDTs at the representative road sites and distinguished volume allocation for local and nonlocal traffic during different hours during the night (Zhang et al., 2017). The suburban and rural areas outside of the Fifth Ring Road were scarcely covered by municipal floating cars and traffic investigations. The Ministry of Transport has established a nationwide networking to monitor intercity traffic conditions (Zhang et al., 2018). Twenty-four-hour diurnal traffic profiles including volume, speed and fleet mix were obtained from 70 highway sites in Beijing, leading to an improved understanding of traffic patterns in the outlying districts beyond the Fifth Ring Road. Taking G-101 as an in-depth example (see Fig. S4), apparent morning and evening peaks were observed at one site (Site A) close to the North Sixth Ring Road, representing urban passenger travel demand. By contrast, HDTs were responsible for nearly half of the total volume at one remote site approaching the municipal border (Site B) and peaked around noon. Section S2 in the Supplement also includes the technical details regarding estimating traffic profiles for nonmonitored roads (e.g., residential roads).
2.3 Traffic scenarios under various transportation management schemes
In this study, four scenarios were generated as inputs for the EMBEV-Link to observe the impacts from major transportation management schemes. Table S2 details the traffic management schemes enforced for major vehicle categories during various traffic scenarios. The weekday scenario (S1) estimated annual-average traffic patterns during weekdays (Monday to Friday) with regular driving restriction rules on personal car use. The weekend scenario (S2) estimated average traffic patterns during weekends (Saturday and Sunday) without regular driving restrictions, when urban residents tend to reduce commutes but increase casual trips. The congestion scenario (S3) reflected the most congested conditions that occasionally existed during the weekends prior to some statutory holidays (e.g., Workers' Day on 1 May and National Day on 1 October). During these special weekends, the scheduling program was adjusted according to normal weekdays, but the driving restrictions were not implemented. The APEC scenario (S4) estimated the traffic patterns during the Asia-Pacific Economic Cooperation summit, with much stricter traffic limitations than normal situations. Half of all personal vehicles were restricted from roads by the odd–even policy, and nonlocal trucks were also strictly prohibited from journeying into the city.
2.4 Dispersion mapping for vehicular pollutants
The RapidAir® model developed by Ricardo Energy & Environment was combined with EMBEV-Link to simulate vehicular concentrations of NOx for the entire domain and typical hotspot areas. RapidAir® combines the EPA's Gaussian plume dispersion model (AERMOD) and open-source computing algorithms by using a kernel convolution that creates millions of overlapping plumes from emission sources and sums distance-weighted concentrations at each receptor cell (Masey et al., 2018). Using unified emissions and meteorological inputs, RapidAir® can produce concentration results in strong agreement with other Gaussian dispersion models (e.g., AERMOD, ADMS) while greatly improving computational efficiency (e.g., 5 min for each hotspot). This study selected NOx as the simulated pollutant category due to the high contribution from traffic emissions. For the entire municipality, hourly NOx concentrations contributed by vehicle emissions were simulated at a spatial resolution of 10 m × 10 m, which used the annual-average hourly meteorological data (e.g., temperature, wind speed, wind direction) as modeling inputs. Two typical hotspots in the central business district (Guomao) and along a major suburban freeway (Xisanqi) were selected for more fine-grained simulations. The receptor cells in the hotspot areas were meshed into 1 m × 1 m in order to visualize the NOx concentration gradients from road, to curbside and thus throughout the ambient urban zone. Detailed data sources and key parameters of meteorological and terrain input profiles are described in the Supplement, Sect. S3.
3.1 Traffic and emission patterns under various scenarios
The daily traffic activities during weekdays (S1, 258 million veh km) and weekends (S2, 259 million veh km) are estimated to be close to each other, representing comparable effects from the increased commute travel demand during weekdays and the absence of regular driving restrictions during weekends (see Fig. S5). However, the diurnal fluctuations of average speeds depict different travel characteristics between weekdays and weekends. The two most congested periods with lowest traffic speeds (below 23 km h−1) clearly occurred during the mornings (08:00 and 09:00 GMT+8; note that 08:00 hereafter represents the entire hour from 08:00 to 08:59 GMT+8) and evenings (18:00 and 19:00 GMT+8) of weekdays. By contrast, we could not observe similar morning traffic peaks during weekends, but traffic conditions deteriorated throughout the afternoon (15:00 to 18:00 GMT+8), reflecting frequent casual travel. Combined with the daily traffic activity of S1 and S2, we could calculate the annual vehicle kilometers traveled (VKT) in Beijing. For all vehicle categories except HDPVs, EMBEV-Link indicated that VKT data showed good agreement (i.e., relative bias within ±6 %) with the results derived from the official vehicle inspection database (see Fig. S6). The remaining excess of estimated annual VKT of the HDPVs is probably contributed by nonlocal HDPVs, whose emissions are not estimated in a separate vehicle category.
Two certain scenarios (S3 and S4) indicate the substantial impacts from municipal transportation management on traffic activities in Beijing. Without strict driving restrictions, the 24 h average speed within the Fifth Ring Road decreased to merely 23 km h−1 under S3 (see Fig. S7), indicating that the daily level of congestion was almost comparable to the rush hours of normal weekdays. The daily traffic activity then increased by 8 % versus that of normal weekdays. By contrast, the odd–even policy was implemented during the APEC summit week and played an effective role in reducing traffic demand and alleviating road congestion. The daily traffic activity under S4 was lowered by 12 %, while the average speed rose to 35 km h−1. It is noted that additional controls were simultaneously enforced upon heavy-duty trucks during the APEC period, which did not significantly change overall traffic patterns compared with the strictly controlled LDPV fleet but greatly contributed to emission reductions (see next section).
Total daily emissions estimated by the EMBEV-Link model are 823 t for CO, 84.4 t for THC, 326 t for NOx, 10.6 t for PM2.5 and 5.5 t for BC during weekdays (S1; see Fig. 2). During weekends (S2), total vehicle emissions decreased by small percentages (e.g., 3 % for CO and THC and 5 % to 7 % for NOx, PM2.5 and BC). Greater traffic demand and more serious congestion under S3 combined to trigger increased vehicle emissions, e.g., 12 % for CO and THC and 6 % for NOx, PM2.5 and BC in the entire municipality. The CO and THC emission enhancements were more significant in the urban areas, increased by 17 % compared with S1, representing the effect from the increasing number of on-road LDPVs during the more congested period. The recent traffic monitoring data indicate the overall congestion in the urban area has not changed significantly, which is owing to the stringent restrictions on the registration of new vehicles in Beijing (BTI, 2018). On the other hand, average emission factors have decreased significantly due to the implementation of newer emission standards and the subsidized scrappage of older vehicles. As a result, we estimated that the total daily emissions would be 523 t for CO, 62.5 t for THC, 256 t for NOx, 8.33 t for PM2.5 and 4.18 t for BC in 2017. The significant reductions are primarily attributed to the improvements in average vehicle emission factors.
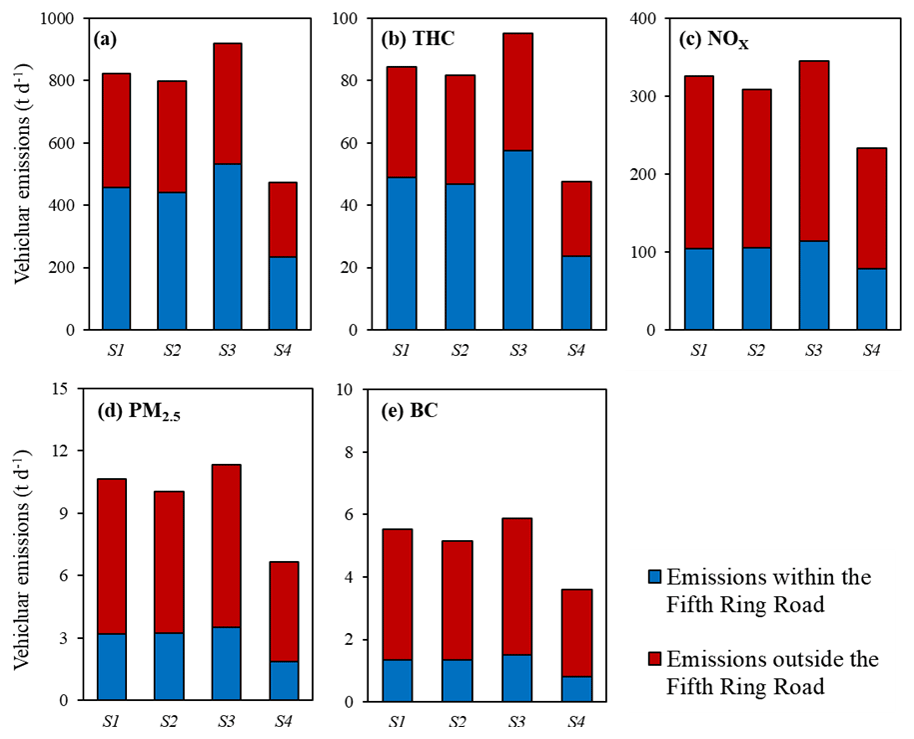
Figure 2Estimated total emissions under various traffic scenarios, S1 to S4: (a) CO, (b) THC, (c) NOx, (d) PM2.5 and (e) BC.
Comprehensive traffic controls are estimated to greatly reduce total vehicle emissions by 43 % for CO, 44 % for THC, 28 % for NOx, 37 % for PM2.5 and 35 % for BC under S4 relative to S1. The greater reductions in CO and THC resulted from the greatly increased average speeds of urban LDPVs and taxis, resulting in lower emission factors. However, diesel freight trucks were responsible for a major part of NOx, PM2.5 and BC emissions. More than 80 % of total traffic activities of HDTs were distributed beyond the Fifth Ring Road, where traffic congestion was less serious and emission factors were less sensitive. However, the Beijing municipal government dispatched more public buses for transportation services during the APEC period (Beijing Municipal Government, 2014), which would increase NOx emissions as opposed to the normal bus fleet. Overall, the average concentration of NO2 during the APEC period was 46 µg m−3, representing a reduction of 31 % compared with the same period of the prior year (Beijing EPB, 2014). The air quality benefit with respect to ambient NO2 concentrations was in line with the comparative results between S1 and S4.
3.2 Temporal and spatial characteristics of vehicle emissions
The major temporal difference in emission patterns between S1 and S2 is higher emissions during weekday rush hours. We thus refer to the weekday scenario (S1) to elucidate temporal and spatial emission patterns (see Figs. 3 and 4). For CO and THC, their emission peaks during morning (07:00 to 09:00 GMT+8) and evening (17:00 to 19:00 GMT+8) rush hours seem to be associated with diurnal fluctuations in passenger travel demand. For example, the highest hourly emissions of CO and THC were estimated during the morning rush hour (07:00 GMT+8), higher than the 24 h averages by approximately 90 %. As Fig. 4a and b illustrate, CO emission intensity in the urban area is significantly higher than that in the outlying area during both peak and nighttime periods. Table 1 summarizes the emission allocation by vehicle categories and regions according to EMBEV-Link. The emission allocation shows a high resemblance between CO and THC: 55 %–60 % of city-total emissions are estimated to exist within the urban area, where LDPVs and taxis dominate the contributions. CO and THC emissions also exhibit heterogeneously diurnal fluctuations in various traffic regions (see Fig. 3) because they are both primarily contributed by LDPVs which show typical two-peak patterns on the whole.
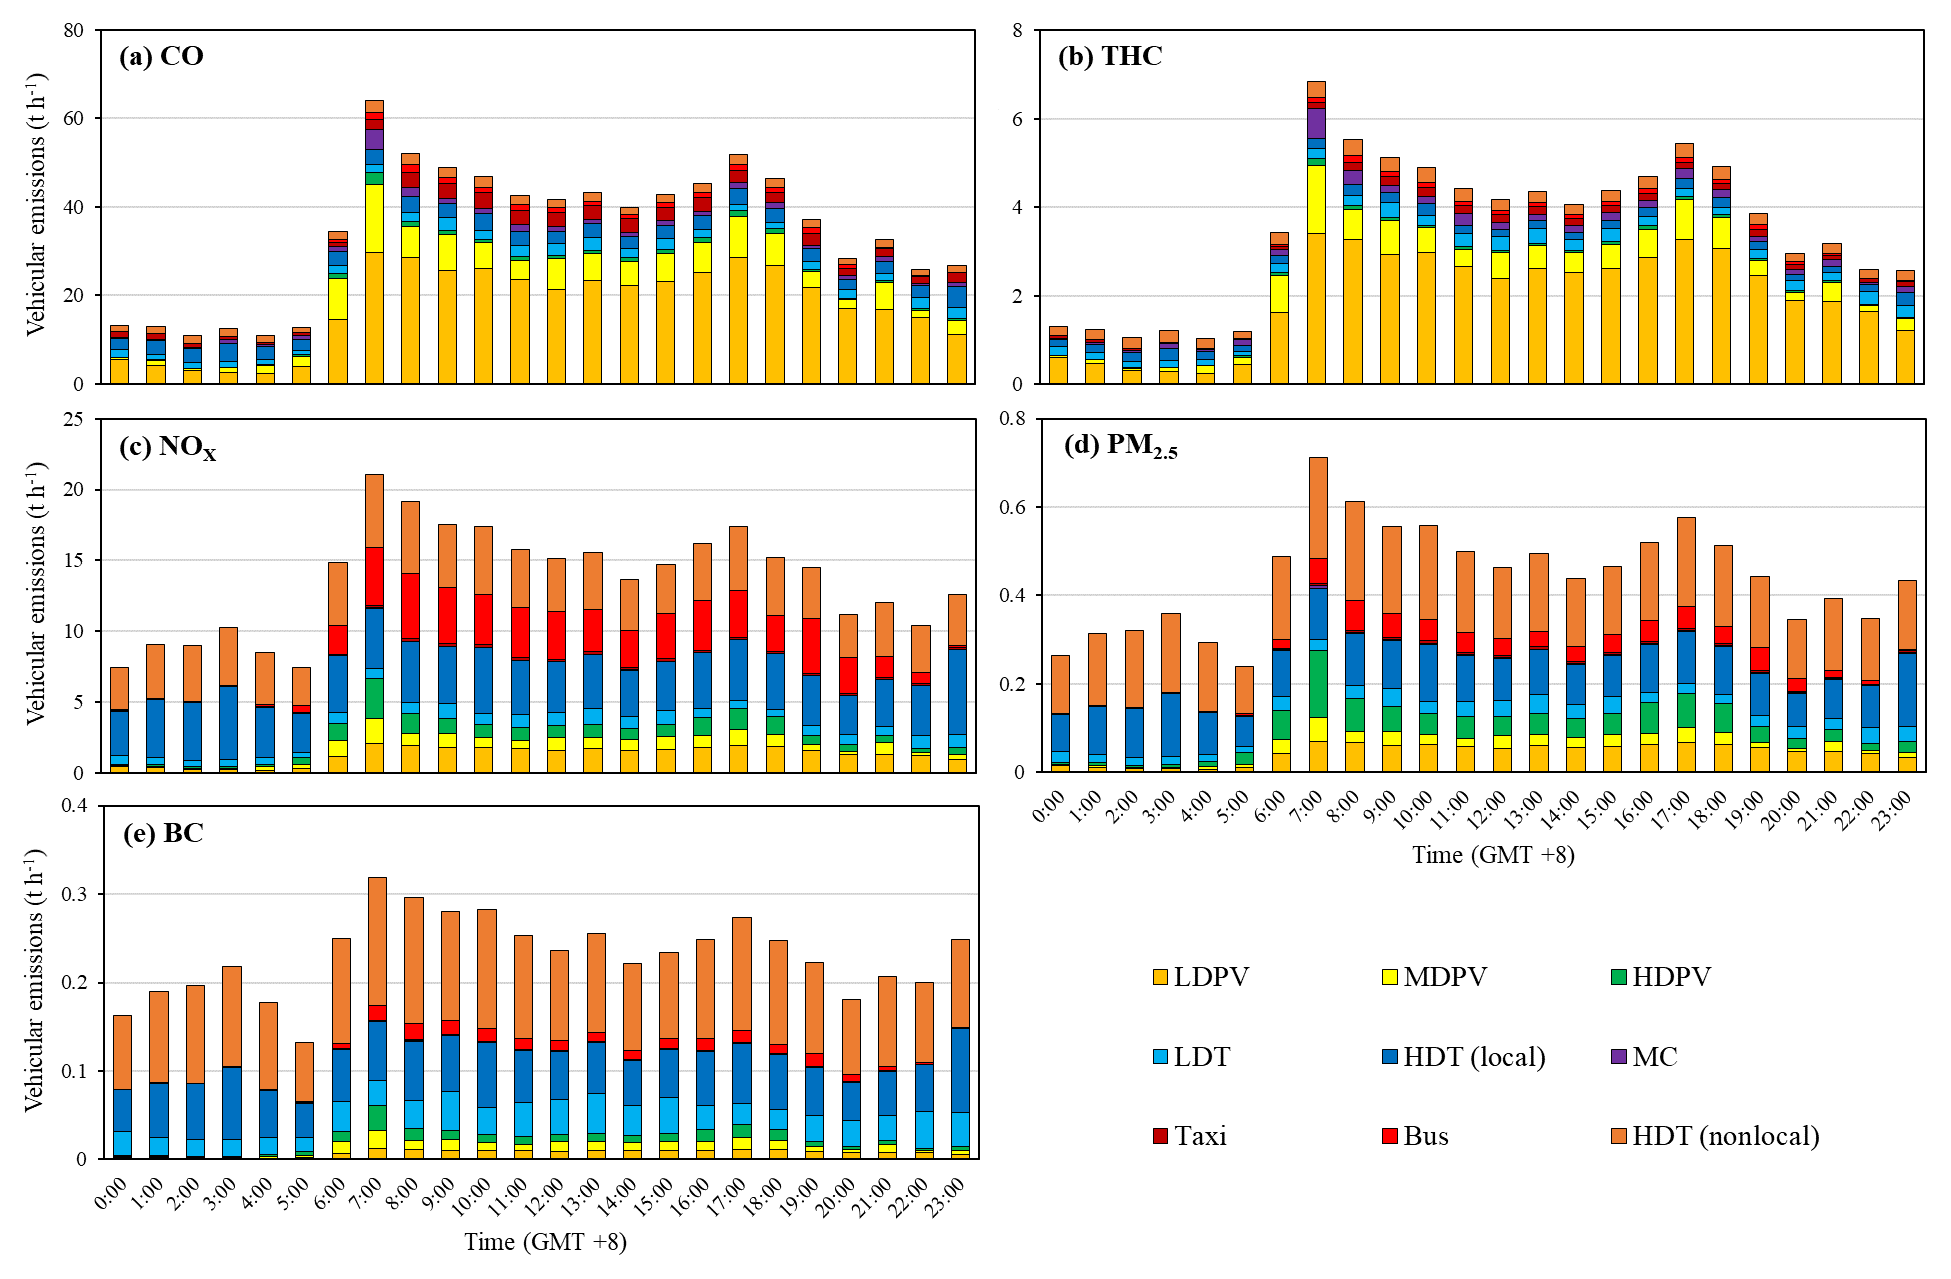
Figure 3Estimated hourly emissions by vehicle category under S1: (a) CO, (b) THC, (c) NOx, (d) PM2.5 and (e) BC.
Table 1Daily emission allocation by vehicle category and region under the weekday traffic scenario (S1).
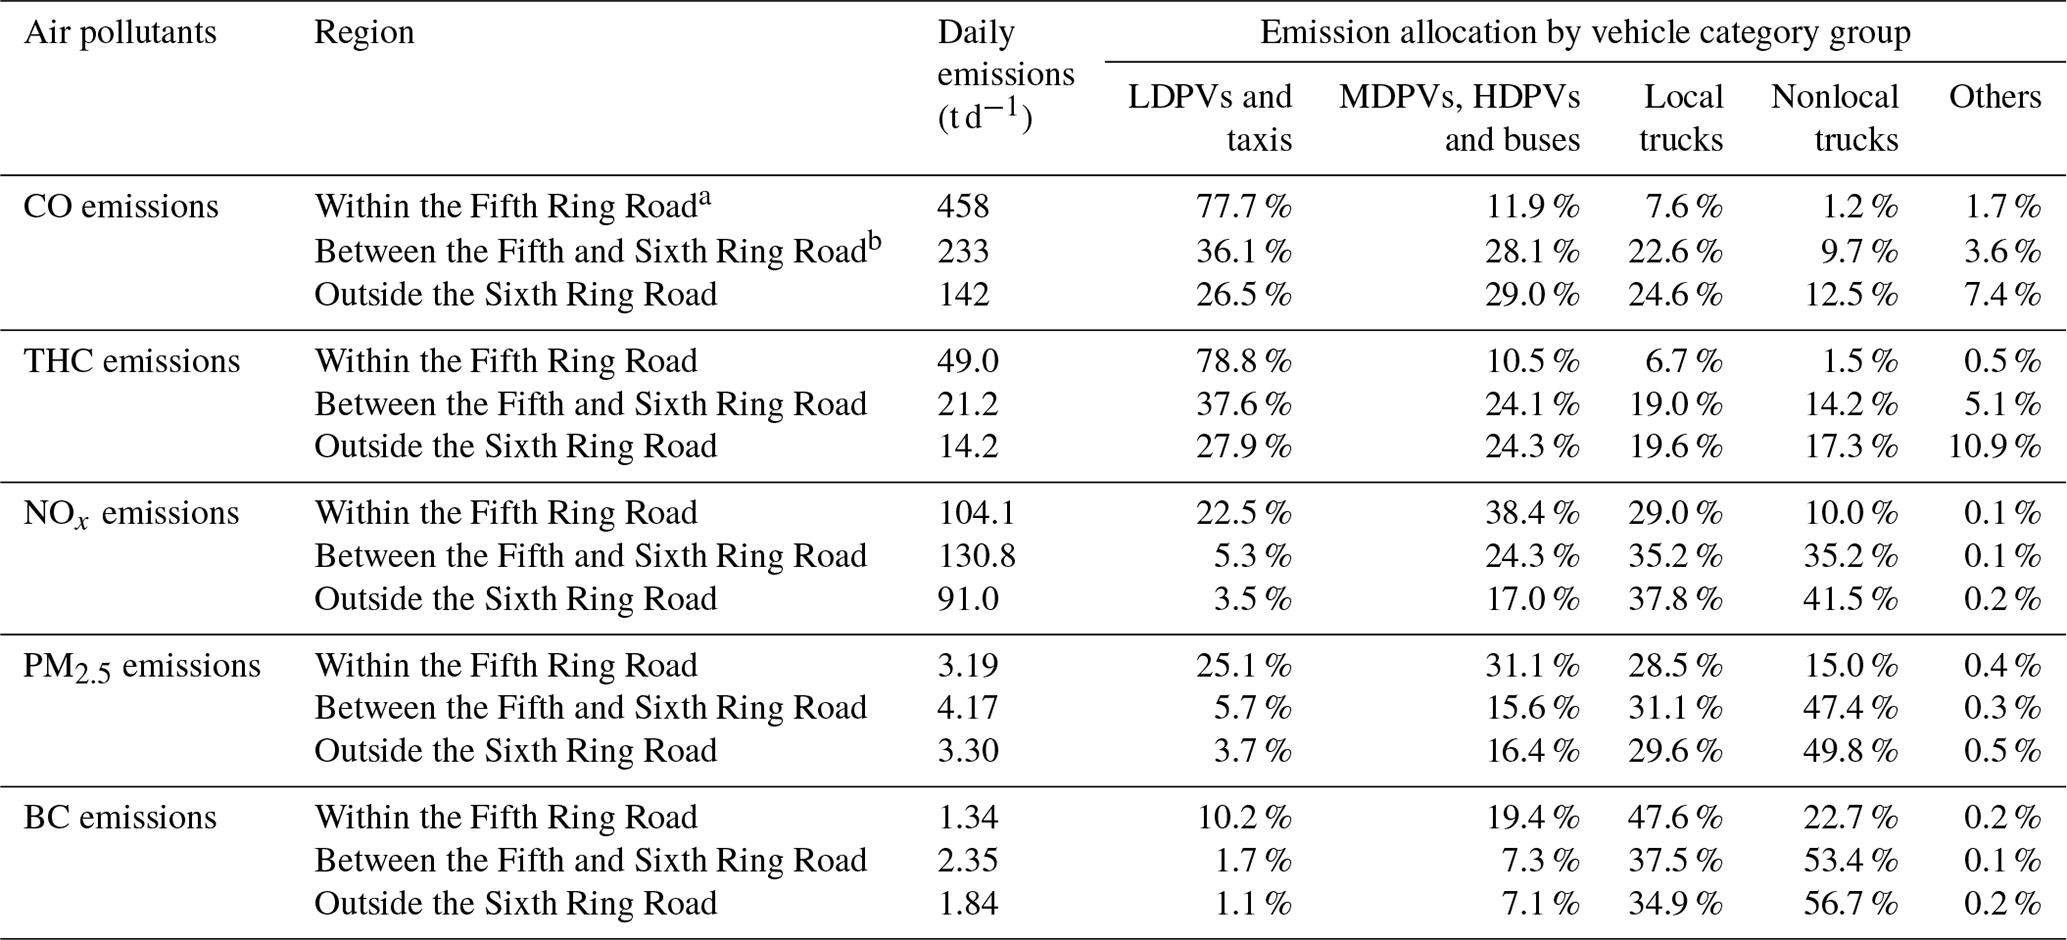
a Including the emissions on the Fifth Ring Road. b Including the emissions on the Sixth Ring Road but excluding the emissions on the Fifth Ring Road.
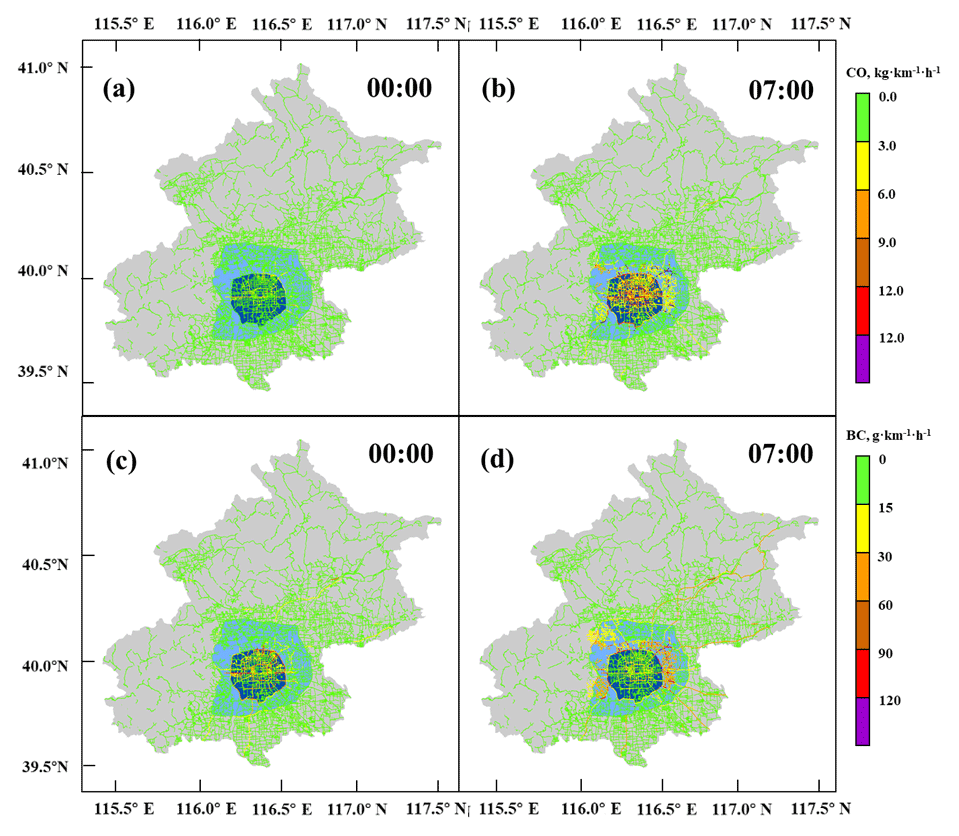
Figure 4Link-based emission intensity of CO (a, b) and BC (c, d) during the midnight hour (00:00 GMT+8) and the morning rush hour (07:00 GMT+8). Note that dark blue indicates the area within the Fifth Ring Road, while light blue indicates the area between the Fifth and Sixth Ring Road.
Diesel fleets (e.g., HDTs, HDPVs, buses) are responsible for much greater shares of the vehicle emissions of NOx, PM2.5 and BC compared with their contributions to CO and THC. Consequently, distinctive traffic behaviors of these diesel fleets would result in disparate temporal and spatial emission patterns than those for CO and THC, which are more significantly influenced by gasoline fleets. First, we could additionally observe elevated total emissions of NOx, PM2.5 and BC after 23:00 and during the nighttime period (02:00 to 04:00 GMT+8; Fig. 3), which are not discerned from CO and THC emission patterns. These elevated emissions are caused by the local traffic restrictions on HDTs during the daytime, which result in the HDT traffic during nighttime hours (after 23:00 GMT+8). Second, nearly 70 % of NOx, PM2.5 and BC emissions occur outside the urban area (see Fig. 2), and the emission contributions of local HDTs and nonlocal HDTs account for the largest proportion (approximately 70 % to 80 %; see Table 1). By contrast, the public buses contribute 16 % of the total NOx emissions and 7 % of the total PM2.5 emissions in the entire city; in the urban area, buses contribute 30 % of NOx emissions (see Table 1). The EMBEV-Link emission maps indicate that many HDTs would likely flood into the urban area during the midnight period, leading to higher emissions on major urban roads (e.g., urban ring expressways) (Fig. 4c); however, these HDTs would travel between the Fifth and Sixth Ring Road or on other outlying expressways during the daytime period (Fig. 4d). In Sect. 3.5, we further explore the environmental impacts contributed by these diesel trucks.
Intra-day variability of traffic conditions during the same hour has been observed based on available traffic monitoring data, which can further impact traffic emissions. Using two urban roads as examples (West Third Ring Rd. and Zizhuqiao Rd.), we developed the distributions of inter-day hourly speeds during a typical morning rush duration (08:00 GMT+8) (see Fig. S8). Although the speed distributions for the expressway (West Third Ring Rd.) and sub-arterial (Zizhuqiao Rd.) representatives show various patterns, the input data applied in S1 are close to the mean values of speed distributions. Furthermore, despite inter-day variabilities (within ±15 % for 95 % variation intervals), the estimated emission factors and emission intensities in S1 also approximate to the mean values of the results during various workdays (bias less than 4 %).
3.3 High-resolution simulation of vehicular NOx concentrations
Figure 5a illustrates the spatial distribution of annual-average NOx concentrations for each cell (meshed into 10 m × 10 m) contributed by vehicle emissions. Clearly, the spatial variations in the simulated concentrations highly resemble the emission patterns. The cell-average NOx concentrations within the Sixth Ring Road are simulated as 46.1 µg m−3, significantly higher than the level of outlying areas. Beyond the Sixth Ring Road, moderate impacts could also be observed in proximity to several intercity expressways with considerable traffic fractions of HDTs. Two hotspots in close proximity to busy roads, Guomao (Fig. 5b) and Xisanqi (Fig. 5c), each have average NOx concentrations above 100 µg m−3. The RapidAir® model is capable of visualizing the NOx decline gradients from the road to near-road ambient zone at the two hotspots, as well as the areas surrounded by densely packed buildings influenced by street canyon effects. Extremely high NOx concentrations are observed in the road environments, which would substantially influence up to 50 m across the expressways (over 200 µg m−3) and up to 20 m for the arterial roads (over 100 µg m−3) (see the Supplement, Sect. S3).
In China, the environmental protection authorities only report the NO2 concentrations measured at the official air quality monitoring sites, which do not include NO concentrations. We referred to the approximate photostationary state (i.e., chemical equilibrium between the NO2 photolysis and the O3 depletion) to estimate total NO concentrations for the official sites (Yang et al., 2018). In this study, we only used the tropospheric NOx chemistry to estimate NO concentrations during the daytime (approximately 06:00 to 18:00 GMT+8 as the annual average) and derived the total NOx as the sum of observed NO2 and estimated NO (see the Supplement, Sect. S3). In Fig. S9, we compared the simulated NOx concentrations contributed only by vehicle emissions and the total NOx concentrations for 17 official air quality sites (12 urban sites and 5 traffic sites) (see the Supplement, Sect. S3). First, the significantly strong correlation (R2=0.89) between vehicular NOx and total NOx indicates that the EMBEV-Link inventory has reasonably captured the spatial distribution of vehicular NOx emissions. Furthermore, the average ratios of vehicular NOx within total NOx suggest substantial contributions from on-road vehicles: 76 % for urban sites and 87 % for traffic sites (i.e., daytime annual average). The remaining portion of NOx concentrations could be attributed to regional background and other local sources, which account for a minor part compared with traffic emissions. We acknowledge that the daytime concentration of other reactive oxides of nitrogen (i.e., NOz, including HNO3 and HONO) could be approximately 10 % of concurrent NOx concentrations by analyzing the air quality simulation outputs of Zheng et al. (2019). Further studies would be needed to couple dispersion and advanced atmospheric chemistry to better resolve urban pollution.
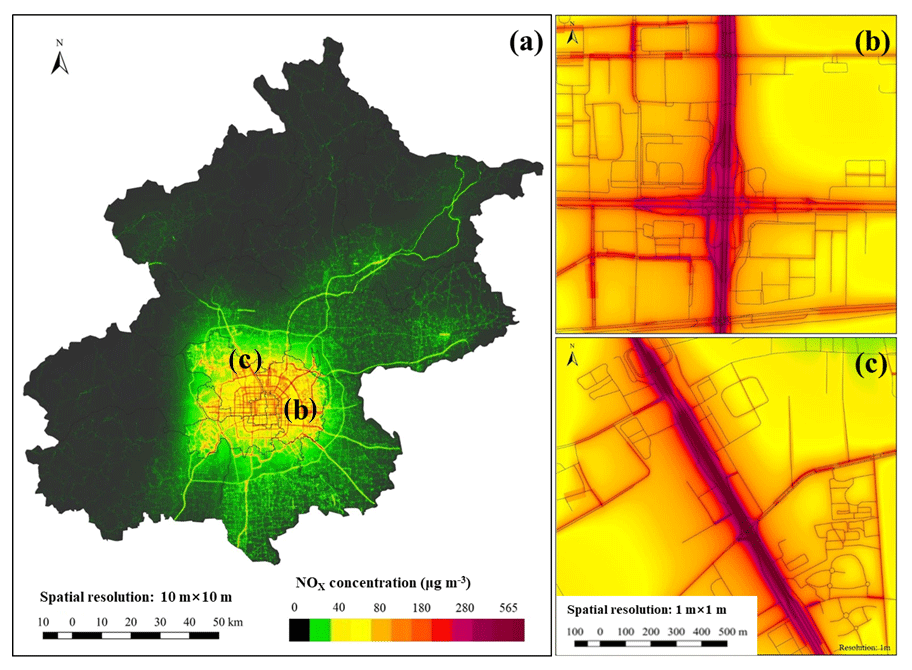
Figure 5High-resolution simulation of annual-average vehicular NOx concentrations for (a) the entire municipality, (b) Guomao and (c) Xisanqi.
In this study, we estimated the NOx emissions and concentrations, both based on annual-average environmental conditions. In addition to seasonal changes of dispersion conditions (e.g., wind speed, wind direction), NOx emissions could probably be affected by ambient temperature conditions. Of note, by analyzing more than hundreds of thousands European vehicles by using remote sensing measurements, a strong temperature dependence for NOx emissions of diesel cars has been identified (Grange et al., 2019; Borken-Kleefled and Dallmann, 2018). NOx emission factors from diesel cars significantly increase during wintertime, which has not been sophisticatedly characterized by many emission models. NOx emissions from heavy-duty diesel vehicles in Beijing during wintertime could probably be elevated because of similar temperature impacts, which should be carefully characterized by analyzing local measurement data in the future.
3.4 The environmental impacts from heavy-duty trucks (HDTs)
Conventional emission inventories were developed based on the registered vehicle population to support on-road emission management in Beijing (Zhang et al., 2014b). However, the significant nonlocal truck traffic was not reflected by the static registration data. The EMBEV-Link shows that nonlocal HDTs emitted 2.46 t of NOx, 1.07 t of PM2.5 and 0.68 t of BC annually, which were responsible for 29 %, 38 % and 47 % of estimated total emissions in 2013. The greatest discrepancy of BC further represents higher BC emission factors of nonlocal HDTs than those for local HDTs. In other words, the previous conventional emission inventory (Zhang et al., 2014b) underestimated the emissions of NOx and PM2.5 by 45.2 % and 45.1 %, respectively, which was primarily due to the missing contributions from nonlocal HDTs.
Stringent transportation management of HDTs in Beijing caused their travel behaviors and air pollutant emissions to sharply vary from other vehicle categories, both temporally and spatially. During the daytime with urban restrictions (before 23:00 GMT+8), we could scarcely observe on-road HDTs other than certain municipal vehicles within the Fifth Ring Road. Consequently, the total HDT emissions (local and nonlocal combined) predominantly appeared beyond the Fifth Ring Road (68 % of NOx, 70 % of PM2.5 and 76 % of BC), including a considerable fraction in the area between the Fifth Ring Road and Sixth Ring Road (40 % of NOx, 39 % of PM2.5, and 42 % of BC). By contrast, many HDTs drove into the urban area during the nighttime without such restrictions. Therefore, we could clearly observe a significant elevation of HDT emissions within the Fifth Ring Road beginning at precisely 23:00 (GMT+8). The RapidAir® model is applied to visualize NOx concentrations contributed by HDTs exclusively. During the daytime (06:00 to 22:00 GMT+8), HDTs primarily contributed to high concentration spots scattered near major expressways between the Fifth Ring Road and Sixth Ring Road (see Fig. S10). Nevertheless, the nighttime impact (23:00 to 05:00 GMT+8) was more significant due to the concentrated urban truck activity and more unfavorable dispersion conditions (e.g., lower stable boundary layer). Total HDTs could contribute 9.8±1.6 µg m−3 of NOx during the night period, including 6.3±1.0 µg m−3 from nonlocal HDTs. This study has quantified results regarding the air quality impacts from nonlocal trucks, which is an important issue of air quality management which has been neglected in previous studies (Li et al., 2015). Future studies utilizing this improved emission inventory could include the characterization of secondary air pollutants contributed by nonlocal traffic. Managing road freight transportation in Beijing is a regional task, which is controlled even beyond the Jing–Jin–Ji region and is highly relevant to other coal-rich provincial areas (e.g., Shanxi, Inner Mongolia). We suggest that the research domain be enlarged to include these surrounding provincial areas as more traffic data become available in the future.
3.5 A comparative discussion on various methods to construct link-based emission inventories
Traffic data availability is a significant challenge in characterizing real-world spatial and temporal distributions of on-road vehicle emissions. As high-resolution emissions are essentially required by air quality simulations, other accessible spatial surrogates are used to artificially allocate total vehicle emissions to fine spatial cells. Population density and/or road length density are two typical varieties of spatial indicators to allocate vehicle emissions by assuming linear relationships between vehicle emissions and spatial surrogates (Zheng et al., 2009, 2014). However, such top-down allocation is often questioned with respect to the accurate representation of real-world traffic activity. We compare three methods of developing emission inventories with spatial resolutions of 1 km × 1 km. M1 denotes this study (EMBEV-Link) using link-level traffic data and reflects real-world emission patterns. M2 and M3 denote two top-down allocation methods based on population density and road length density, respectively (see the Supplement, Sect. S4). To observe only the effect from using spatial surrogates, estimated total emissions of M1 are also used by M2 and M3 allocation. For M2 allocation, the GIS-based population density is obtained from the LandScan 2012 population database (ORNL, 2012). Standard road length (Zheng et al., 2009), one proxy parameter to further take account of traffic flow distinctions between urban and rural areas, is applied in M3 allocation instead of actual road length. CO and BC are discussed, as they represent gasoline and diesel featured emissions, respectively.
As Fig. 6 illustrates, M2 generates many scattered emission hotspots in accordance with highly populous communities in both urban and suburb/rural areas but weakly represents the topology of road networks. Compared with M1, M2 tends to underestimate CO emissions in the urban area but overestimates for the outlying areas because the static population distribution differs significantly from actual travel activities. Many people reside outside the Fifth Ring Road, where housing costs are relatively lower, but they must travel into the urban area for employment or casual purposes. However, M2 artificially estimates a number of urban hotspots regarding BC emissions (72 % of the cells within the Fifth Ring Road are overestimated) while substantially underestimating the emission density between the Fifth and Sixth Ring Road (68 % of the cells in that region are underestimated). Such distortion is caused by the simple assumption of a proportional relationship between BC emissions and population density, as well as the absent accounting of HDT driving restrictions within M2.
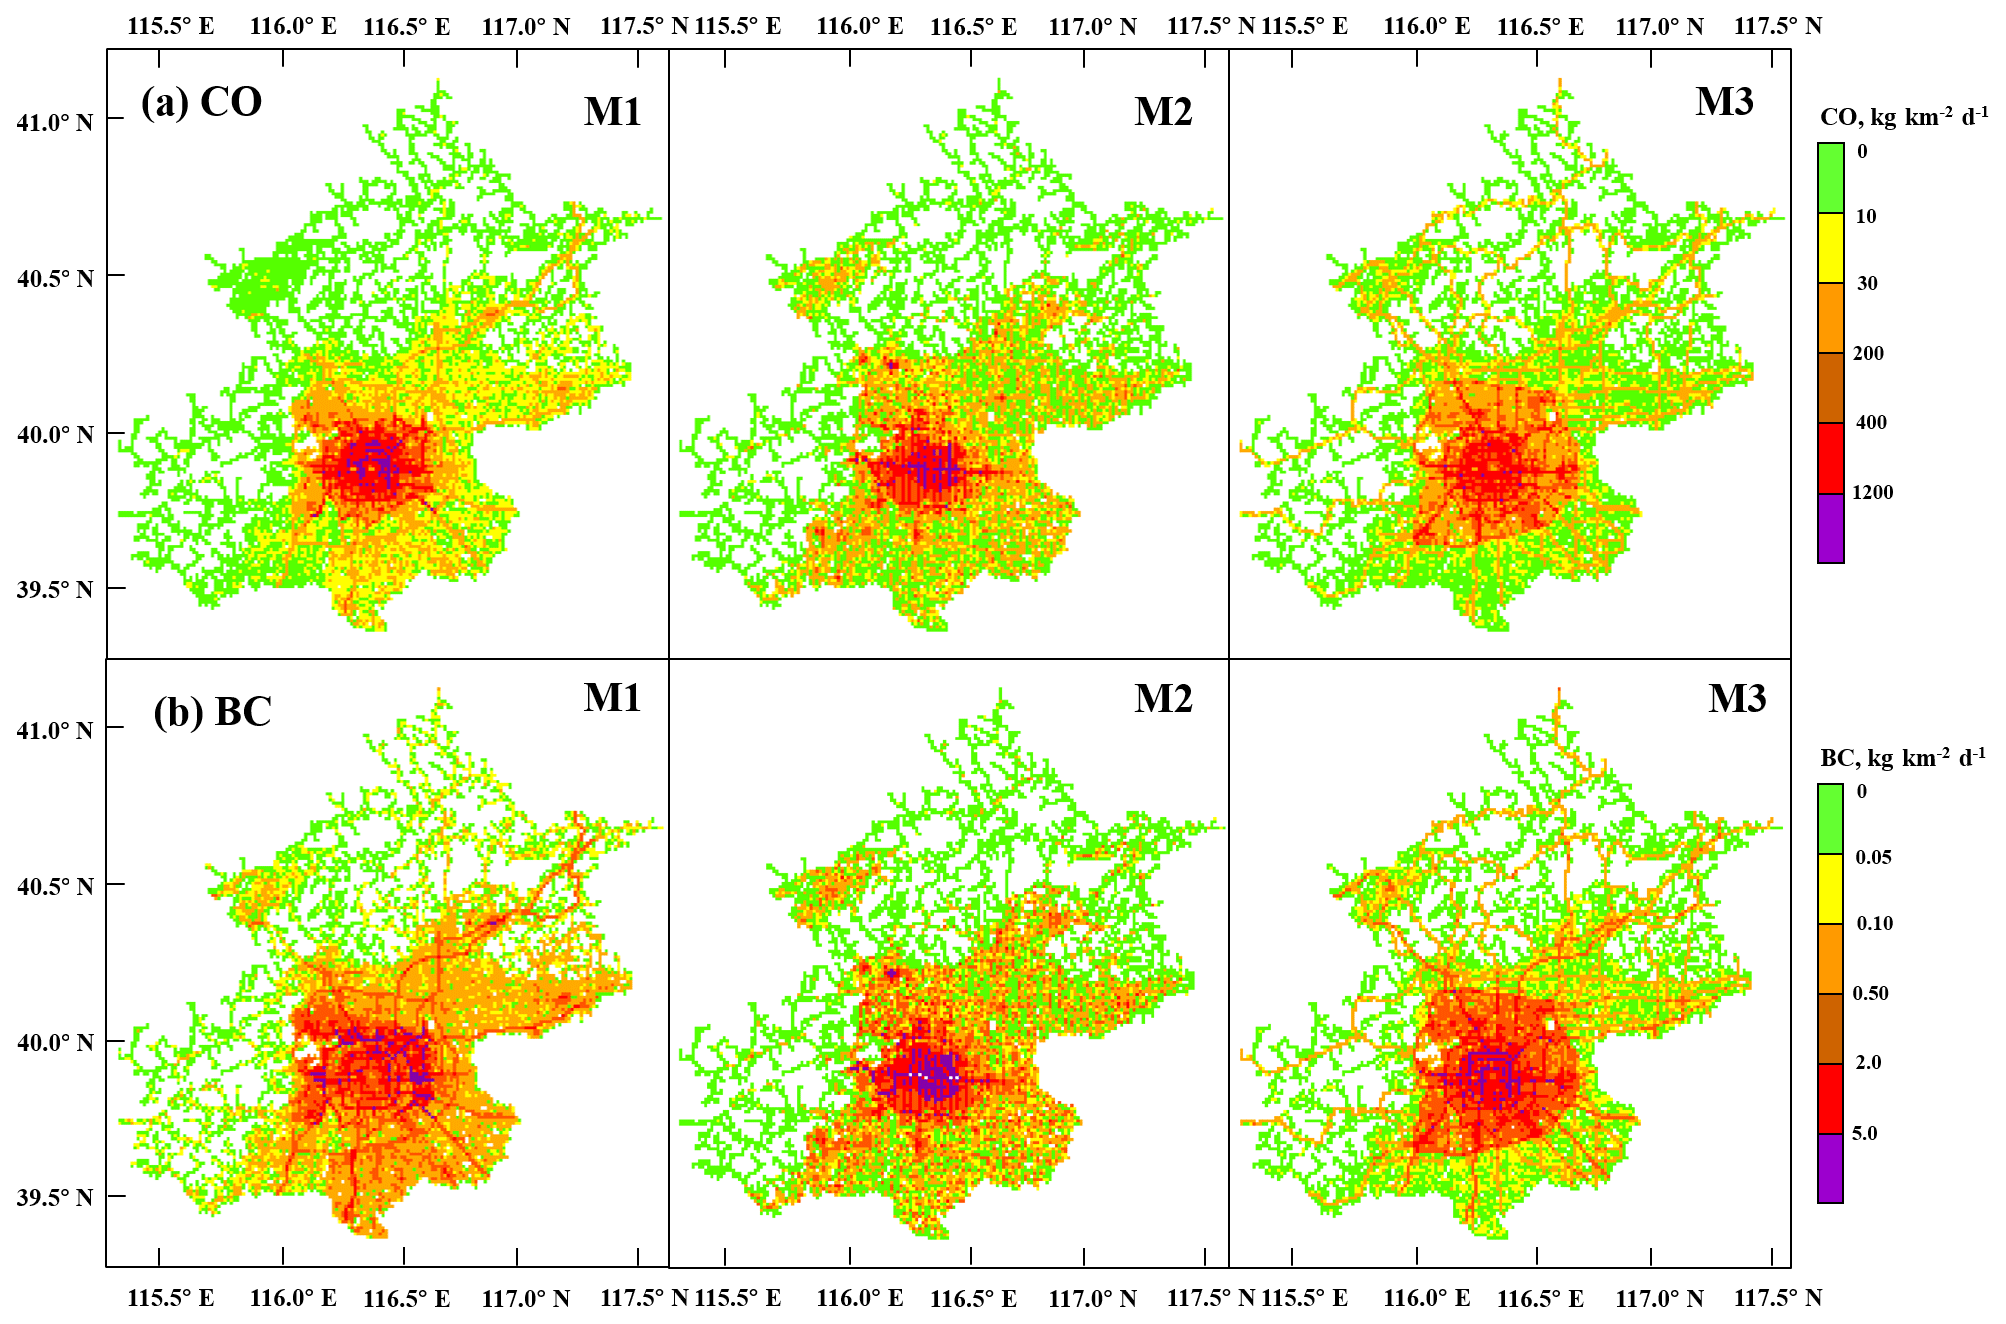
Figure 6Comparison of link-level emission intensity of (a) CO and (b) BC developed by various methods.
M3 reflects the topology of traffic emission as line sources to some extent but underestimates CO emissions within the Fifth Ring Road compared with M1 by 28 %. This is because although M3 considers the traffic volume characteristics according to region and road type, increased emission factors due to traffic congestion are not accounted for. CO emission density between the Fifth and Sixth Ring Road is overestimated by M3 because the same coefficients as for the urban area are applied to calculate standard road lengths. In contrast, M3 overestimates BC emissions in the urban area but underestimates emissions between the Fifth and Sixth Ring Road, due to the absent consideration of local traffic restrictions on HDTs. In addition, we also observe that M3 tends to overestimate both CO and BC emissions in the northern areas with intercity expressways; however, underestimations in M3 are identified in the southern areas. This is because M3 considers unified traffic volume weights for all of the intercity highways outside the Sixth Ring Road. In reality, the traffic monitoring data reveal that outlying expressways in the southern areas have greater traffic volumes than the northern expressways, which connect to hilly and less populous regions.
Currently, secondary aerosols (e.g., nitrate and secondary organic aerosols) are the leading chemical components of PM2.5 concentrations in Beijing. Air quality management in this megacity requires fine-grained air quality simulations by improving emission patterns and including chemical transport simulations. As discussed above, the EMBEV-Link model enables us to characterize the spatial heterogeneity in real-world traffic emissions to support small-scale simulations (e.g., down to 1 km scale), which are typically completed at approximately 3 to 4 km scales in current studies (e.g., Zheng et al., 2019). To better fulfill this function, the seasonal variability and species-resolved NMVOC profiles are also required to be improved in the EMBEV-Link model.
This study presents the development of a high-resolution emission inventory of vehicle emissions in Beijing (EMBEV-Link) by using multiple large-scale traffic monitoring datasets. Real-time traffic congestion index maps, intercity highway monitoring and manual traffic investigations were applied to estimate link-level and hourly profiles for traffic volume, fleet composition and road speed. We applied the EMBEV-Link model to four typical traffic scenarios in order to elucidate spatial and temporal patterns of vehicle emissions in association with different transportation management schemes in Beijing. The vehicular NOx concentrations were simulated by using the RapidAir® model at high spatial resolutions, meshed into 10 m × 10 m cells in the entire municipality and further 1 m × 1 m cells in the hotspots.
The EMBEV-Link results indicate significant impacts on temporal and spatial patterns of vehicle emissions caused by the traffic restrictions in Beijing. Total vehicle emissions were estimated as 823 t for CO, 84.4 t for THC, 326 t for NOx, 10.6 t for PM2.5 and 5.5 t for BC during an average weekday (S1) of 2013. CO and THC emissions are featured as pollutants contributed by gasoline vehicles, whose peaks were identified in the urban area and during traffic rush hours. By contrast, NOx, PM2.5 and BC were considerably contributed by diesel fleets, whose emissions peaked between the Fifth and Sixth Ring Road during the daytime and then flooded within the Fifth Ring Road when truck restrictions were not implemented. The overall emissions during weekends (S2) were close to the weekday levels because the urban traffic restrictions on LDPVs were not enforced during weekends. The absence of regular restrictions on LDPVs would trigger serious congestion and lead to 12 % increases of CO and THC emissions in the entire municipality (S3), in comparison with the normal weekday levels. On the other hand, the stringent traffic controls implemented during the APEC summit period (S4) could reduce vehicle emissions by approximately 30 % to 40 %, varying by pollutant category.
We further demonstrated a few major improvements by EMBEV-Link compared with previous emission inventory methods. First, the EMBEV estimated that nonlocal HDTs contributed 2.46 t of NOx, 1.07 t of PM2.5 and 0.68 t of BC annually, which were responsible for 29 %, 38 % and 47 % of estimated total emissions in 2013. Nevertheless, these emissions from nonlocal HDTs were missing from the registration-based emission estimates. A considerable fraction of truck traffic floods into the urban area after 23:00 GMT+8, resulting in approximately 10 µg m−3 of nighttime NOx concentrations there. Second, combined with the RapidAir® model, the link-level emissions could represent a valuable asset to map high-resolution concentrations of vehicular pollutants over a large geographical area. The case study of NOx dispersion indicated a large contribution from traffic emissions, with strong agreement with observation data in the urban area and sharp elevation gradients from ambient areas to roads in the hotspots. Finally, we also revealed that the conventional top-down allocation methods according to population or road density could cause significant uncertainties in the spatial distributions of vehicle emissions because these allocation methods were limited to considering both the real traffic patterns and the effects of local traffic restrictions.
The data that support the findings of this study are available from the corresponding author upon reasonable request.
The supplement related to this article is available online at: https://doi.org/10.5194/acp-19-8831-2019-supplement.
DY and SZ contributed equally to this research. SZ and YeW conceived the research idea; DY, SZ and HX prepared the traffic dataset; DY contributed to the new emission inventory model; TN conducted the dispersion simulation; DY, SZ, YuW, KMZ and YeW analyzed the data; DY and TN drew the figures; and SZ, DY and YeW wrote the paper with contributions from all the authors.
The authors declare that they have no conflict of interest.
This study was supported by the National Natural Science Foundation of China (91544222) and the National Key Research and Development Program of China (2017YFC0212100). Shaojun Zhang is supported by Cornell University's David R Atkinson Center for a Sustainable Future (ACSF Postdoctoral Fellowship). K. Max Zhang acknowledges support from the National Science Foundation (NSF) through grant no. 1605407. The contents of this paper are solely the responsibility of the authors and do not necessarily represent official views of the sponsors or companies.
This research has been supported by the National Natural Science Foundation of China (grant no. 91544222), the National Key Research and Development Program of China (grant no. 2017YFC0212100) and the National Science Foundation (grant no. 1605407).
This paper was edited by Chul Han Song and reviewed by three anonymous referees.
Anenberg, S. C., Miller, J., Minjares, R., Du, L., Henze, D. K., Lacey, F., Malley, C. S., Emberson, L., Franco, V., Klimont, Z., and Heyes, C.: Impacts and mitigation of excess diesel-related NOx emissions in 11 major vehicle markets, Nature, 545, 467–471, https://doi.org/10.1038/nature22086, 2017.
Barth, M. J., Todd, M., and Shaheen, S: Intelligent Transportation Technology Elements and Operational Methodologies for Shared-Use Vehicle Systems, J. Transport. Res. Board, 1841, 99–108, 2003.
Beijing EPB (Beijing Environmental Protection Bureau): The daily average PM2.5 concentrations decreased by 30 % during the APEC Summit, available at: http://politics.people.com.cn/n/2014/1114/c1001-26019842.html (last access: 30 June 2019), 2014 (in Chinese).
Beijing MEEB (Beijing Municipal Ecological Environment Bureau): Beijing Environmental Statement 2017, Beijing Municipal Ecological Environment Bureau, Beijing, P. R. China, available at: http://www.bjepb.gov.cn/bjhrb/xxgk/ywdt/hjzlzk/hjzkgb65/index.html (last access: 30 June 2019), 2018a (in Chinese).
Beijing MEEB (Beijing Municipal Ecological Environment Bureau): Beijing has released the newest source apportionment results of ambient PM2.5 concentrations, available at: http://www.xinhuanet.com/politics/2018-05/15/c_1122832062.htm (last access: 30 June 2019), 2018b (in Chinese).
Beijing Municipal Government: Beijing Municipal Government dispatched more public buses for transportation services during the APEC period, available at: http://travel.163.com/14/1112/09/AARD2B9J00063JSA.html (last access: 30 June 2019), 2014 (in Chinese).
BJTU and Beijing EPB (Beijing Jiaotong University and Beijing Environmental Protection Bureau): Research on the improvement on the decision system of vehicle emission control: research and application of the simulation method of Estimating traffic activities for nonmonitored roads, Beijing EPB, Beijing, P. R. China, 2014 (in Chinese).
Borken-Kleefeld, J. and Dallmann, T.: Remote sensing of motor vehicle exhaust emissions. White Paper, International Council on Clean Transportation, Washington, DC, available at: https://www.theicct.org/sites/default/files/publications/Remote-sensing-emissions_ICCT-White-Paper_01022018_vF_rev.pdf (last access: 30 June 2019), 2018.
BTI (Beijing Transport Institution): Beijing Transportation Annual Report, available at: http://www.bjtrc.org.cn/List/index/cid/7.html (last access: 30 June 2019), 2018 (in Chinese).
Cai, H. and Xu, M.: Greenhouse gas implications of fleet electrification based on big data-informed individual travel patterns, Environ. Sci. Technol., 47, 9035–9043, https://doi.org/10.1021/es401008f, 2013.
Dallmann, T. R., Kirchstetter, T. W., DeMartini, S. J., and Harley, R. A.: Quantifying on-road emissions from gasoline-powered motor vehicles: accounting for the presence of medium- and heavy-duty diesel trucks, Environ. Sci. Technol., 47, 13873–13881, https://doi.org/10.1021/es402875u, 2013.
Gately, C. K., Hutyra, L. R., Peterson, S., and Wing, I. S.: Urban emissions hotspots: Quantifying vehicle congestion and air pollution using mobile phone GPS data, Environ. Pollut., 229, 496–504, https://doi.org/10.1016/j.envpol.2017.05.091, 2017.
Grange, S. K., Farren, N. J., Vaughan, A. R., Rose, R. A., and Carslaw, D. C.: Strong Temperature Dependence for Light-Duty Diesel Vehicle NOx Emissions, Environ. Sci. Technol., 53, 6587–6596, https://doi.org/10.1021/acs.est.9b01024, 2019.
Guo, S., Hu, M., Zamora, M. L., Peng, J. F., Shang, D. J., Zheng, J., Du, Z. F., Wu, Z., Shao, M., Zeng, L. M., Molina, M. J., and Zhang, R. Y.: Elucidating severe urban haze formation in China, P. Natl. Acad. Sci. USA, 111, 17373–17378, https://doi.org/10.1073/pnas.1419604111, 2014.
Hooper, E., Chapman, L., and Quinn, A.: The impact of precipitation on speed–flow relationships along a UK motorway corridor, Theor. Appl. Climatol., 117, 303–316, https://doi.org/10.1007/s00704-013-0999-5, 2013.
Huang, R.-J., Zhang, Y., Bozzetti, C., Ho, K.-F., Cao, J.-J., Han, Y., Daellenbach, K. R., Slowik, J. G., Platt, S. M., Canonaco, F., Zotter, P., Wolf, R., Pieber, S. M., Bruns, E. A., Crippa, M., Ciarelli, G., Piazzalunga, A., Schwikowski, M., Abbaszade, G., Schnelle-Kreis, J., Zimmermann, R., An, Z., Szidat, S., Baltensperger, U., Haddad, I. E., and Prévôt, A. S. H.: High secondary aerosol contribution to particulate pollution during haze events in China, Nature, 514, 218–222, https://doi.org/10.1038/nature13774, 2014.
Huo, H., Zhang, Q., He, K. B., Wang, Q. D., Yao, Z. L., and Streets, D. G.: High-Resolution Vehicular Emission Inventory Using a Link-Based Method: A Case Study of Light-Duty Vehicles in Beijing, Environ. Sci. Technol., 43, 2394–2399, https://doi.org/10.1021/es802757a, 2009.
Jing, B., Wu, L., Mao, H., Gong, S., He, J., Zou, C., Song, G., Li, X., and Wu, Z.: Development of a vehicle emission inventory with high temporal–spatial resolution based on NRT traffic data and its impact on air pollution in Beijing – Part 1: Development and evaluation of vehicle emission inventory, Atmos. Chem. Phys., 16, 3161–3170, https://doi.org/10.5194/acp-16-3161-2016, 2016.
Lang, J. L., Cheng, S. Y., Wei, W., Zhou, Y., Wei, X., and Chen, D. S.: A study on the trends of vehicular emissions in the Beijing-Tianjin-Hebei (BTH) region, China, Atmos. Environ., 62, 605–614, https://doi.org/10.1016/j.atmosenv.2012.09.006, 2012.
Li, H., Zhang, Q., Zheng, B., Chen, C., Wu, N., Guo, H., Zhang, Y., Zheng, Y., Li, X., and He, K.: Nitrate-driven urban haze pollution during summertime over the North China Plain, Atmos. Chem. Phys., 18, 5293–5306, https://doi.org/10.5194/acp-18-5293-2018, 2018.
Li, X., Zhang, Q., Zhang, Y., Zheng, B., Wang, K., Chen, Y., Wallington, T. J., Han, W. J., Shen, W., Zhang, X. Y., and He, K. B.: Source contributions of urban PM2.5 in the Beijing-Tianjin-Hebei region: Changes between 2006 and 2013 and relative impacts of emissions and meteorology, Atmos. Environ., 123, 229–239, https://doi.org/10.1016/j.atmosenv.2015.10.048, 2015.
Liu, H., Man, H., Tschantz, M., Wu, Y., He, K., and Hao, J.: VOC from Vehicular Evaporation Emissions: Status and Control Strategy, Environ. Sci. Technol., 49, 14424–14431, 2015.
Masey, N., Hamilton, S., and Beverland, I. J.: Development and evaluation of the RapidAir((R)) dispersion model, including the use of geospatial surrogates to represent street canyon effects, Environ. Modell. Softw., 108, 253–263, https://doi.org/10.1016/j.envsoft.2018.05.014, 2018.
ORNL (Oak Ridge National Laboratory): LandScan Global Population Database, Oak Ridge National Laboratory, Oak Ridge, Tennessee, USA, 2012.
UNEP: A Review of Air Pollution Control in Beijing: 1998–2013, United Nations Environment Programme (UNEP), Nairobe, Kenya, available at: https://www.researchgate.net/publication/284177759_A_Review_of_Air_Pollution_Control_in_Beijing_1998-2013 (last access: 30 June 2019), 2016.
Wang, H., Fu, L., Lin, X., Zhou, Y., and Chen, J.: A bottom-up methodology to estimate vehicle emissions for the Beijing urban area, Sci. Total Environ., 407, 1947–1953, https://doi.org/10.1016/j.scitotenv.2008.11.008, 2009.
Wang, H., Ni, D., Chen, Q.-Y., and Li, J.: Stochastic modeling of the equilibrium speed-density relationship, J. Adv. Transport., 47, 126–150, https://doi.org/10.1002/atr.172, 2013.
Wang, X., Westerdahl, D., Hu, J., Wu, Y., Yin, H., Pan, X., and Zhang, K. M.: On-road diesel vehicle emission factors for nitrogen oxides and black carbon in two Chinese cities, Atmos. Environ., 46, 45–55, https://doi.org/10.1016/j.atmosenv.2011.10.033, 2012.
Wu, X., Wu, Y., Zhang, S., Liu, H., Fu, L., and Hao, J.: Assessment of vehicle emission programs in China during 1998–2013: Achievement, challenges and implications, Environ. Pollut., 214, 556–567, https://doi.org/10.1016/j.envpol.2016.04.042, 2016.
Wu, Y., Zhang, S. J., Li, M. L., Ge, Y. S., Shu, J. W., Zhou, Y., Xu, Y. Y., Hu, J. N., Liu, H., Fu, L. X., He, K. B., and Hao, J. M.: The challenge to NOx emission control for heavy-duty diesel vehicles in China, Atmos. Chem. Phys., 12, 9365–9379, https://doi.org/10.5194/acp-12-9365-2012, 2012.
Wu, Y., Zhang, S., Hao, J., Liu, H., Wu, X., Hu, J., Walsh, M. P., Wallington, T. J., Zhang, K. M., and Stevanovic, S.: On-road vehicle emissions and their control in China: A review and outlook, Sci. Total. Environ., 574, 332–349, https://doi.org/10.1016/j.scitotenv.2016.09.040, 2017.
Yang, B., Zhang, K. M., Xu, W. D., Zhang, S., Batterman, S., Baldauf, R. W., Deshmukh, P., Snow, R., Wu, Y., Zhang, Q., Li, Z., and Wu, X.: On-Road Chemical Transformation as an Important Mechanism of NO2 Formation, Environ. Sci. Technol., 52, 4574–4582, https://doi.org/10.1021/acs.est.7b05648, 2018.
Zhang, S., Wu, Y., Liu, H., Huang, R., Yang, L., Li, Z., Fu, L., and Hao, J.: Real-world fuel consumption and CO2 emissions of urban public buses in Beijing, Appl. Energ., 113, 1645–1655, https://doi.org/10.1016/j.apenergy.2013.09.017, 2014a.
Zhang, S., Wu, Y., Wu, X., Li, M., Ge, Y., Liang, B., Xu, Y., Zhou, Y., Liu, H., Fu, L., and Hao, J.: Historic and future trends of vehicle emissions in Beijing, 1998–2020: A policy assessment for the most stringent vehicle emission control program in China, Atmos. Environ., 89, 216–229, https://doi.org/10.1016/j.atmosenv.2013.12.002, 2014b.
Zhang, S., Wu, Y., Huang, R., Wang, J., Yan, H., Zheng, Y., and Hao, J.: High-resolution simulation of link-level vehicle emissions and concentrations for air pollutants in a traffic-populated eastern Asian city, Atmos. Chem. Phys., 16, 9965–9981, https://doi.org/10.5194/acp-16-9965-2016, 2016.
Zhang, S., Wu, Y., Yan, H., Du, X., Max Zhang, K., Zheng, X., Fu, L., and Hao, J.: Black carbon pollution for a major road in Beijing: Implications for policy interventions of the heavy-duty truck fleet, Transport. Res. D-Tr. E., 68, 110–121, https://doi.org/10.1016/j.trd.2017.07.013, 2017.
Zhang, S. J., Niu, T. L., Wu, Y., Zhang, K. M., Wallington, T. J., Xie, Q. Y., Wu, X. M., and Xu, H. L.: Fine-grained vehicle emission management using intelligent transportation system data, Environ. Pollut., 241, 1027–1037, https://doi.org/10.1016/j.envpol.2018.06.016, 2018.
Zheng, B., Huo, H., Zhang, Q., Yao, Z. L., Wang, X. T., Yang, X. F., Liu, H., and He, K. B.: High-resolution mapping of vehicle emissions in China in 2008, Atmos. Chem. Phys., 14, 9787–9805, https://doi.org/10.5194/acp-14-9787-2014, 2014.
Zheng, H., Cai, S., Wang, S., Zhao, B., Chang, X., and Hao, J.: Development of a unit-based industrial emission inventory in the Beijing–Tianjin–Hebei region and resulting improvement in air quality modeling, Atmos. Chem. Phys., 19, 3447–3462, https://doi.org/10.5194/acp-19-3447-2019, 2019.
Zheng, J., Che, W., Wang, X., Louie, P., and Zhong, L.: Road-Network-Based Spatial Allocation of On-Road Mobile Source Emissions in the Pearl River Delta Region, China, and Comparisons with Population-Based Approach, J. Air Waste Manage., 59, 1405–1416, https://doi.org/10.3155/1047-3289.59.12.1405, 2009.
Zheng, X., Wu, Y., Jiang, J., Zhang, S., Liu, H., Song, S., Li, Z., Fan, X., Fu, L., and Hao, J.: Characteristics of On-road Diesel Vehicles: Black Carbon Emissions in Chinese Cities Based on Portable Emissions Measurement, Environ. Sci. Technol., 49, 13492–13500, https://doi.org/10.1021/acs.est.5b04129, 2015.