the Creative Commons Attribution 4.0 License.
the Creative Commons Attribution 4.0 License.
Contributions of different anthropogenic volatile organic compound sources to ozone formation at a receptor site in the Pearl River Delta region and its policy implications
Zhuoran He
Xuemei Wang
Zhenhao Ling
Min Shao
Volatile organic compounds (VOCs) are key precursors of photochemical smog. Quantitatively evaluating the contributions of VOC sources to ozone (O3) formation could provide valuable information for emissions control and photochemical pollution abatement. This study analyzed continuous measurements of VOCs during the photochemical season in 2014 at a receptor site (Heshan site, HS) in the Pearl River Delta (PRD) region, where photochemical pollution has been a long-standing issue. The averaged mixing ratio of measured VOCs was 34±3 ppbv, with the largest contribution from alkanes (17±2 ppbv, 49 %), followed by aromatics, alkenes and acetylene. The positive matrix factorization (PMF) model was applied to resolve the anthropogenic sources of VOCs, coupled with a photochemical-age-based parameterization that better considers the photochemical processing effects. Four anthropogenic emission sources were identified and quantified, with gasoline vehicular emission as the most significant contributor to the observed VOCs, followed by diesel vehicular emissions, biomass burning and solvent usage. The O3 photochemical formation regime at the HS was identified as VOC-limited by a photochemical box model with the master chemical mechanism (PBM-MCM). The PBM-MCM model results also suggested that vehicular emission was the most important source to the O3 formation, followed by biomass burning and solvent usage. Sensitivity analysis indicated that combined VOC and NOx emission controls would effectively reduce incremental O3 formation when the ratios of VOC-to-NOx emission reductions were > 3.8 for diesel vehicular emission, > 4.6 for solvent usage, > 4.6 for biomass burning and 3.3 for gasoline vehicular emission. Based on the above results, a brief review of the policies regarding the control of vehicular emissions and biomass burning in the PRD region from a regional perspective were also provided in this study. It reveals that different policies have been, and continue to be, implemented and formulated and could help to alleviate the photochemical pollution in the PRD region. Nevertheless, evaluation of the cost-benefit of each policy is still needed to improve air quality.
- Article
(7851 KB) - Full-text XML
-
Supplement
(425 KB) - BibTeX
- EndNote
Atmospheric volatile organic compounds (VOCs) significantly impact air quality. Due to their high chemical activity, VOCs are key precursors of ozone (O3) and secondary organic aerosols. In addition, some VOCs and their oxidation products are harmful to human health and thus further deteriorate air quality (Seinfeld and Pandis, 2006; ATSDR, 2007; Huang et al., 2014). There are a variety of natural and anthropogenic sources of VOCs, including biogenic emissions and emissions from human activities (i.e., fuel and biomass combustion, fuel evaporation, solvent usage, industrial processes, etc.). It is relatively well known that the two key O3 precursors (VOCs and NOx) synergize complex and nonlinear effects on O3 formation. For a given region, depending on which precursor is the limiting factor controlling O3 formation, the O3 isopleth diagram (i.e., the mixing ratios of VOCs and NOx as two coordinates) can be classified into VOC- and NOx-limited regimes. In VOC-limited regimes, the effective measure for reducing O3 production is to minimize VOC emissions and vice versa for NOx-limited regimes (Jenkin and Clemitshaw, 2000).
In recent years, with rapid urbanization and industrialization, high O3 mixing ratios have frequently been observed in the Pearl River Delta (PRD) region (e.g., Zheng et al., 2010b; Li et al., 2014; Wang et al., 2017). Previous studies have shown that photochemical O3 formation is generally VOC-limited in the PRD region and suggested that reductions of VOC emissions could effectively alleviate photochemical O3 formation (e.g., Guo et al., 2017; Cheng et al., 2010). Therefore, source identification and quantification of VOCs are prerequisites for formulating and implementing the most effective control measures for photochemical pollution in the PRD region. Indeed, many efforts have been made to perform the source apportionments of VOCs in this region by using different methods, including tunnel measurements, receptor models, emission-based measurements and emission inventories. Ho et al. (2009) quantified the emission factors of 92 VOCs from gasoline, diesel and LPG vehicles from a tunnel study in Hong Kong. Guo et al. (2011b) and Zheng et al. (2013) characterized the source profiles of VOCs emitted from industrial and vehicular sectors through samples collected directly from the plumes of gasoline, diesel and LPG vehicles. These emission-based measurements provided clear attributions of VOCs from different sources and emission factors for the emission inventory to estimate the total amount of VOCs emitted from those sources. In particular, Zheng et al. (2009) and Ou et al. (2015b) established a specific VOC emission inventory to estimate VOC abundance and provide input data for different air quality models. This inventory was applied to quantify the strength of vehicular emissions, solvent usage and biogenic emissions in the PRD region.
In contrast to the emission inventory (which estimates the emission strength based on emission factors and emission activity), receptor models are useful for source apportionment of VOCs without any prior knowledge of the emissions. As a widely used receptor model, positive matrix factorization (PMF) has been employed in the source apportionment of VOCs in the PRD region (Guo et al., 2011a; Ling et al., 2011; Lau et al., 2010; Ou et al., 2015a). For example, Ling et al. (2011) identified 10 sources of VOCs at a receptor site in the PRD region and concluded that solvent usage and vehicular exhaust were the most significant sources, with mean contributions of 51 % and 37 % of the total VOC mass, respectively. Results from source apportionment using the PMF model demonstrated the important roles of vehicular emissions in ambient VOCs in urban and suburban environments of Hong Kong, accounting for 48 %–54 % and 31 %–40 % of the concentrations of VOCs, respectively (Lau et al., 2010; Guo et al., 2011a). However, uncertainties existed in the PMF analysis due to the assumption of mass conservation during the transport of pollutants from emissions to the receptor site (Yuan et al., 2012b). To investigate the influence of photochemical processes on the factorization of VOCs by the PMF model, Yuan et al. (2012b) applied a photochemical-age-based parameterization method to analyze the measured VOC data at an urban site in Beijing. They found that the PMF-resolved factors were influenced by VOCs from a common source at different stages of photochemical processing; thus, the independent source could not be clearly identified. The results further suggested that when using the PMF model for VOC source apportionments, it is necessary to assess if photochemical processing could influence the source signatures of VOCs at the receptor site. Although many previous studies reported source apportionment of VOCs in the PRD region using the PMF model, they did not account for the influence of photochemical processing, which may have led to uncertainties in identifying and quantifying VOC sources.
In this study, the PMF model coupled with a photochemical-age-based parameterization method was applied to the continuous real-time VOC data from an intensive field campaign at a receptor site in the PRD region. The model provides a more detailed and accurate description of the source characteristics of VOCs in the PRD region. Furthermore, the contribution of different sources of VOCs to photochemical O3 formation and the sensitivity of ozone and its precursors were evaluated through a photochemical box model coupled with the master chemical mechanism.
2.1 Measurements
Field measurements were conducted at the Heshan Atmospheric Supersite (22.728∘ N, 112.929∘ E, at an altitude of 60 m) (HS) in the western PRD region from 22 October to 20 November 2014. Figure 1 shows the surrounding environment at the sampling site; a detailed description of the HS can be found in previous studies (Zhou et al., 2013, 2014). Briefly, the site is located in a rural area of the PRD region, about 50–80 km southwest of the urban central cities (i.e., Guangzhou and Foshan). In addition to local emissions, the abundance of air pollutants at the HS during the autumn and winter seasons is frequently affected by the outflow of air masses from the central cities; thus, this site can be used as a representative of regional emissions in the PRD region (Zhou et al., 2014).
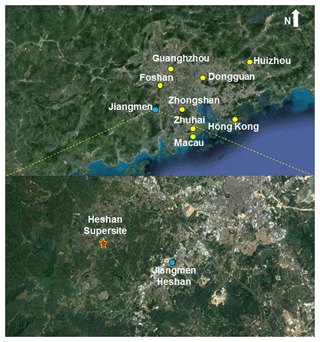
Figure 1The sampling site and its surrounding environment in the Pearl River Delta region (top panel: overview of the site location; bottom panel: zoomed-in view, red star denotes the site location). The base map was from © Google Maps.
An automated online gas chromatography–flame ionization detector (GC-FID) system measured hourly concentrations of 58 VOC species. Detailed descriptions of the configuration of the GC-FID system, detection limits and the precision of VOCs are provided elsewhere (Wang et al., 2008; Zhang et al., 2008a; Ling et al., 2017). Air-quality-related trace gases (including O3, NO-NO2-NOx, CO and SO2), together with meteorological data (i.e., temperature, solar radiation, precipitation, relative humidity, wind speed and wind direction) were continuously measured by the Guangdong Environmental Monitoring Center. The results and meta data can be found in Ling and He (2019).
2.2 Positive matrix factorization (PMF) model
The positive matrix factorization (PMF) (US Environmental Protection Agency, USEPA, version 5.0) model was applied to the collected data for source apportionments of the VOCs. The PMF model is a multivariate factor analysis tool that decomposes a matrix of speciated sample data into two matrices (i.e., factor contributions and factor profiles), which can be interpreted to explore the source types and contributions, based on the measured data at the receptor site (Paatero and Tapper, 1994; Paatero, 1997). It can be simplified as follows:
where xij is the jth species concentration measured in the ith sample, gik is the species contribution of the kth source to the ith sample, fkj is the jth species fraction from the kth source, eij is the residual for each species and p is the total number of independent sources (Paatero, 1997). The model could provide the number of emission sources (p) and the distributed profiles (f) of each species in the individual source after simulation.
A detailed description of the model input is provided elsewhere (Guo et al., 2011a; Ling and Guo, 2014). Briefly, the selection of species for the PMF model followed the following principles: (1) the chosen species had relatively high concentrations and/or were typical tracers for specific emissions, e.g., methyl tert-butyl ether (MTBE) as the tracer of gasoline vehicular exhaust (Song et al., 2006; Ho et al., 2009) and acetonitrile (ACN) as the tracer of biomass burning (Holzinger et al., 1999; Yuan et al., 2010); (2) species with low abundance and/or high uncertainties were excluded, i.e., cis-2-pentene, diphenyl methane, and 1,3-diethylbenzene, etc., because more than a quarter of the samples for those species were below detection limits; and (3) species related to biogenic emissions (i.e., isoprene) were excluded as this study focused on the source characteristics of anthropogenic emissions in the PRD region (Fuentes et al., 1996; Sanadze, 2004; Zheng et al., 2010a; Zhang et al., 2012).
A total of 49 species (including 47 non-methane hydrocarbons, NMHCs, MTBE and ACN) were selected for the input data, which accounted for ∼99 % of the total concentration of all measured anthropogenic VOCs. This was different from our previous study (Ling et al., 2019), where only species that are typical tracers of different emissions, including 18 NMHCs (i.e., isoprene, C6–C8 aromatics, C2–C4 alkenes), acetonitrile (ACN), methyl chloride (CH3Cl), methyl tert-butyl ether (MTBE) and peroxy acetyl nitrate (PAN) were input into the PMF model for the contributions of primary emissions and secondary formation to ambient methacrolein (MACR) and methyl vinyl ketone (MVK) based on the same data set collected at the HS.
For the PMF modeling, detailed information of the data processes and evaluation of the model performance has been provided in previous studies (Lau et al., 2010; Ling et al., 2019). Briefly, the uncertainty for each species was determined to be the sum of 10 % of the VOC concentration and twice the detection limit of the species (Paatero, 2000a; Lau et al., 2010). Concentrations below the detection limit were replaced with half of the detection limit and their uncertainties were set as five-sixths of the detection limit. Missing concentrations were replaced by the geometric means of measured values, and their corresponding uncertainties were set to be 4 times the geometric mean values (Paatero, 2000b). In this study, the source apportionments of a 4-factor solution from the PMF model was selected, which were able to sufficiently and completely explain the levels and variations in observed VOCs (Lau et al., 2010) (Sect. 3.2.2). Compared with those of the 4-factor solution, the solution with 3 factors coerced two profiles that would otherwise be attributed to solvent usage and biomass burning, while certain amounts of aromatics and heptane were added into the profile of gasoline vehicular emissions. On the other hand, when the factor number was 5, an additional factor split from the biomass burning with the presence of C6–C9 alkanes, together with about 10 %–25 % of aromatics (including toluene and xylenes) found in the 5-factor solution.
To evaluate the performance of the 4-factor solution, various tests and verifications were conducted. Firstly, different start seeds were tested for the model run, and it was found that there were no multiple solutions during the simulation. Furthermore, the scaled residuals of all the selected species ranged between −3 and 3 for the 4-factor solution, while the ratio of Q(robust) ∕ Q(true) in this solution was close to 1 (Paatero, 2000a). In the 4-factor solution, strong correlations were found between the concentrations extracted from the model and the observed concentrations of each species, with correlation coefficients ranging from 0.71–0.95, indicating that the 4-factor solution reproduced the observed variations in VOCs well (Lau et al., 2010). In the bootstrapped simulation for the 4-factor solution, all the factors were mapped to a basic factor in all runs, indicating that the solution was stable. Finally, in the F-peak model results of the simulation, the G-space plot with no oblique edges suggested that the solution underwent little rotation (Paatero, 2000a; USEPA, 2008). Overall, the above features proved that the 4-factor solution from PMF could reliably attribute the sources of VOCs in this study.
2.3 PBM-MCM model
The photochemical box model coupled with the master chemical mechanism (PBM-MCM) was applied to quantify the contributions of VOC emission sources to in situ O3 formation. The PBM-MCM model uses the concentrations of VOCs and trace gases and the meteorological data as input to simulate the total amount of photochemical O3 formation at the site, based on the master chemical mechanism (version 3.2), which consists of 5900 chemical species and 16 500 reactions. Note that the physical processes, including horizontal and vertical transport, were not considered in the model. Details of the model setup and configuration can be found in previous studies (Saunders et al., 2003; Lam et al., 2013).
In addition, the PBM-MCM model can be used to assess the sensitivity of O3 photochemical production to the changes in the concentrations of its precursors by calculating the relative incremental reactivity (RIR) without detailed or accurate knowledge of these emissions (Carter and Atkinson, 1989; Cardelino and Chameides, 1995). The RIR is defined as the percent change in O3 production divided by per percent change in the precursors. The RIR of a specific precursor X at site S is given by the following equation:
where S(X) represents the measured concentration of precursor X, including the amounts emitted at the site and those transported to the site, and ΔX is the change in the concentration of precursor X caused by a hypothetical change ΔS(X) (10 % S(X) in this study). Here, represents the O3 formation potential, which is the net O3 production plus NO consumed during the evaluation period and can be calculated by the output from the PBM-MCM model. A large positive RIR value of a specific precursor suggests that the O3 production could be decreased significantly if the emissions of this precursor were controlled. In addition, the mean RIR function of precursor X can be calculated from the following equation:
where N means the number of days simulated. In addition, considering both the reactivity and abundance of VOC species in different sources, the relative contributions of the precursor X can be calculated by the following equation (Ling et al. 2011; and Ling and Guo 2014):
where conc(X) was obtained from the measurement and PMF resolutions.
In this study, the hourly data of VOCs, including both anthropogenic and biogenic species, five trace gases (i.e., O3, NO, NO2, CO and SO2) and two meteorological parameters (i.e., temperature and relative humidity) measured during the campaign were used as the model input. Similar to Lyu et al. (2016), the PBM-MCM model was applied to the observed data collected on each individual day for the RIR calculation during the whole sampling period, while the hourly data during the whole sampling period were averaged across sampling days to provide mean diurnal variation as a base case input for the PBM-MCM model to generate the O3 isopleths.
3.1 General statistics
Figure 2 shows the time series of O3 and total VOCs (TVOCs), as well as meteorological parameters (i.e., temperature, relative humidity) observed at the HS from 22 October to 20 November. It was found that two major episodes of high O3 mixing ratios (maximum hourly averaged mixing ratio > 100 ppbv, China II Emission Standard) occurred during 24 October–1 November and 13–19 November. Consistent with higher O3 levels, the mixing ratios of TVOCs in O3 episode days were higher, with the mean values of 38±3 and 30±2 ppbv (mean ±95 % intervals) observed during O3 episode and non-episode days, respectively, indicating that O3 formation at the HS was probably VOC-limited.
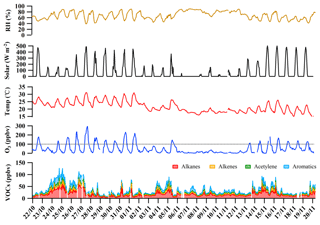
Figure 2Time series of O3, volatile organic compounds (VOCs) and meteorological parameters observed at the Heshan site.
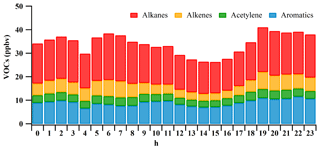
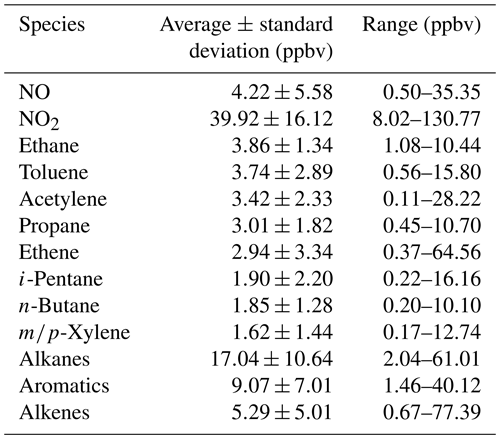
The measured 58 VOC species included 30 alkanes, 10 alkenes, 17 aromatics and acetylene. Table 1 summarizes the average mixing ratios of NOx (i.e., NO and NO2) and the major VOC groups measured at the site from 22 October to 20 November 2014. The mean mixing ratios of NO and NO2 were 4.2±0.4 and 39.9±1.2 ppbv, respectively, at the HS during the measurement, and the relatively low ratio of NO∕NOx indicated that the site was distant from the source area (Qin and Zhao, 2003; Melkonyan and Kuttler, 2012; Hagenbjörk et al., 2017). The mean mixing ratio of total VOCs was 34±3 ppbv, with the highest contributions from alkanes (17±2 ppbv, 49 %), followed by aromatics (9±1 ppbv, 26 %), alkenes (5±1 ppbv, 15 %) and acetylene (3±1 ppbv, 10 %). This is consistent with previous measurements in this region (Guo et al., 2011a; Yuan et al., 2012a; Zou et al., 2015). The VOC mixing ratio at the HS was similar to those in urban Shanghai and Beijing, with ranges of 30.3–38.7 ppbv (Geng et al., 2009; Cai et al., 2010) and 29.4–43.4 ppbv (Song et al., 2007; Duan et al., 2008; Shao et al., 2009; Li et al., 2015), respectively. However, it was much higher than those in background areas of the North China Plain region, Yangtze River Delta region and PRD (< 20 ppbv) (Tang et al., 2009; Yuan et al., 2012b; Zhu et al., 2016). The most abundant VOC species was ethane (3.86±0.10 ppbv), followed by toluene (3.74±0.22 ppbv), acetylene (3.42±0.17 ppbv), propane (3.01±0.14 ppbv) and ethene (2.94±0.25 ppbv). As ethane, acetylene, ethene and propane had been suggested to be the tracers of incomplete combustion from vehicle exhaust, biomass or coal (Liu et al., 2008a; Lau et al., 2010; Guo et al., 2011b; Yuan et al., 2012a), the characteristic of abundant species at the HS indicated that incomplete combustion was likely the dominant source of VOCs during the measurement period. Indeed, the mean diurnal variations in VOCs (Fig. 3) presented higher mixing ratios during the early morning and from the evening to midnight, which may be related to elevated traffic emissions and the constrained mixing height (Yuan et al., 2009). Conversely, the mixing ratios of VOCs started to decrease at 09:00 LT (local time) and presented a broad trough during daytime hours (09:00–19:00 LT), which was likely due to strong photochemical reactions, increased mixing height and/or less VOC emissions (Yuan et al., 2009; Lau et al., 2010).
Table 1Average, range and standard deviation of concentrations for NOx (i.e., NO and NO2) and the eight most abundant volatile organic compounds (VOCs) measured at the Heshan site, together with a sum of the mixing ratios for each hydrocarbon category (i.e., alkanes, aromatics and alkenes).
3.2 Sources of VOCs
3.2.1 The influences of photochemical processing on VOC concentrations
To investigate the source attributions of VOCs, the PMF model was applied to the observed concentrations of VOCs at the HS. As mentioned above, to more accurately identify and quantify the source contributions, it is necessary to evaluate whether the photochemical processing could influence the source signatures of VOCs.
To further evaluate the influence of photochemical processing on the observed levels, a photochemical-age-based parameterization method was used to estimate the initial concentrations of VOCs after emissions (Eq. 5). This method was first introduced by de Gouw et al. (2005) and has been applied to VOC-measured data in different environments (Liu et al., 2009; Shao et al., 2009; Yuan et al., 2012b).
Through the photochemical-age-based parameterization method, photochemical age (representing the photochemical processing time) could be calculated by the ratio between the concentrations of two VOCs with relatively strong correlation and different OH reaction rates, i.e., the ratio of ethylbenzene and m∕p-xylene. In this study, high correlation was found between ethylbenzene and m∕p-xylene (R2=0.96, p < 0.01). Furthermore, the OH reaction rate constants for the above species were (ethylbenzene), (m∕p-xylene, obtained from the mean OH reaction rate constants of m- and p-xylene) cm3 molecule−1 s−1, respectively (Atkinson et al., 2006). It has been demonstrated that ratios of these species could be used to estimate the effect of photochemical processing on VOC variations (Shiu et al., 2007; Shao et al., 2009; Chang et al., 2010). The OH exposure ([OH]Δt) is calculated and used to represent photochemical age, as [OH] and Δt always appear together in the parameterization equation (Jimenez et al., 2009). The OH exposure is calculated from the ratio of VOCs concentrations by the following equation:
The [OH] term represents the concentration of the OH radical and its reaction time Δt for VOCs between the emission sources and the observation site. The parameters kE and kX are the reaction rate constants of ethylbenzene and m∕p-xylene, respectively. The term is the mean measured concentration ratio of ethylbenzene to m∕p-xylene, and is the initial concentration ratio of ethylbenzene to m∕p-xylene.
In the present study, the initial concentration ratio of ethylbenzene to m∕p-xylene was calculated as 0.62 using the methods suggested by Yuan et al. (2012b) and Shao et al. (2009) and is consistent with those calculated at other urban and rural environments (Shao et al., 2009). The OH exposure ([OH]Δt) calculated by Eq. (5) was 6.47×10⁹ molecule cm−3 s. With the hourly concentrations of OH during the measurement period simulated by PBM-MCM, the air mass age Δt was calculated as about 3 h, while the air masses were mainly from the center cities of PRD via the backward trajectory analysis (details were provided in Fig. S2 in the Supplement).
For VOCs, the initial concentration can be described by the following equation:
Here, [VOC]initial and [VOC]measured are the initial and measured concentration of particular VOC, respectively. The term kVOC is the reaction rate constant of the specific VOC (Supplement Table S1).
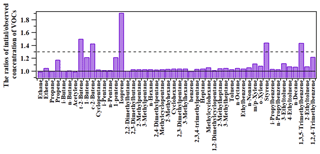
Figure 4 shows the comparison between the observed levels and the initial concentrations of VOCs at the HS. In general, the variations between the observed levels and the initial concentrations were small for most VOC species, with the OH reaction rate constant cm3 molecule−1 s−1 and the ratio of initial and observed concentrations ranging from 1.00 to 1.23. However, for species with relatively high photochemical reactivity (i.e., with the OH reaction rate constant ranging from cm3 molecule−1 s−1), the initial concentrations were 1.44–1.51 times the observed levels. It should be noted that these reactive species only accounted for a small fraction of the concentrations and the ozone formation potential (OFP) of all the observed VOCs, due to their relatively lower abundance (data not shown).
Therefore, to consider the influence of photochemical processing on source apportionment results, the concentrations for the species with relatively high reactivity (i.e., the ratio of initial to observed concentrations > 1.3, i.e., trans-2-butene, cis-2-butene, styrene and 1,3,5-trimethylbenzene) were adjusted by the difference between observed levels and initial concentrations. They were further used as input to the PMF model, together with the observed concentrations of the rest species to investigate the source attributions of VOCs at the HS. In addition, it was compared with the PMF results without adjustment in the following section.
3.2.2 Source apportionments of VOCs
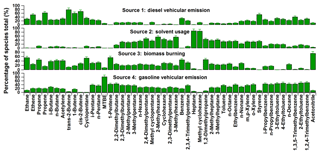
In this study, the data matrix for the PMF model was composed of 682 samples from the measurements in autumn at the HS and 47 NMHCs, together with ACN and MTBE. With the adjustments of species concentrations, the solution of 4 factors was obtained. Figure 5 presents the source profiles (in percentages of species total) extracted from the PMF model, while Fig. 6 presents the relative contributions of different sources to ambient VOCs in autumn at the HS. It was found that factor 1 and 4 were both associated with high percentages of aromatics. In addition to the solvent usage, aromatics were mainly related to vehicle emissions in the PRD region (Zhang et al., 2013; Ou et al., 2014). The relatively high loadings of C2–C4 alkenes in factor 1 suggest that this source was mainly related to diesel vehicular emission (Guo et al., 2011a; Ou et al., 2014), which accounts for about 25±3 % (mean ±95 % intervals) of the total observed VOCs. Factor 4 was characterized by high levels of n∕i-pentane and MTBE, the typical tracers for gasoline vehicular emissions (Song et al., 2006; Ho et al., 2009; Ou et al., 2014). As such, factor 4 was assigned to gasoline vehicular emission and its contribution to the observed VOCs was 33±5 %. Factor 2 was characterized by high percentages of C6–C7 alkanes and certain amounts of aromatics, while the contributions of other combustion tracers were insignificant in this factor, suggesting that this factor was related to solvent usage. This is consistent with previous studies that show that aromatics and C6–C7 alkanes could be used as solvents in the printing and paint industry (He et al., 2002; Chan et al., 2006; Liu et al., 2008a, b); 18±2 % of the observed VOCs were identified to be associated with solvent use. Factor 3 was represented by high percentages of ethane (∼65 %), acetylene (∼51 %), benzene (∼52 %) and ethene (∼31 %), together with some C3–C5 alkanes and alkenes, which are typically tracers of incomplete combustion such as vehicular exhaust and biomass burning (Nelson et al., 1984; Wadden et al., 1986; Blake et al., 1994; Rudolph, 1995; Guo et al., 2011a, b). The high percentage of ACN in factor 3 suggests that this factor was associated with biomass burning (Holzinger et al., 1999; Yuan et al., 2010), which was responsible for 24±3 % of the observed VOCs.
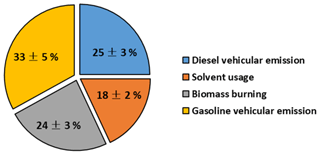
Figure 6Contributions of different sources to ambient volatile organic compounds (VOCs) extracted from positive matrix factorization (PMF) in the scenario with adjustment.
Furthermore, in order to investigate the influence of photochemical processing on the source apportionment of VOCs, a comparison of PMF results with and without the adjustment of VOC concentration due to photochemical losses was conducted. Similar source profiles and the same four anthropogenic sources (i.e., diesel vehicular emission, solvent usage, biomass burning and gasoline vehicular emission) were identified; however, the sources made different contributions to VOC abundance compared to those with the adjustment of VOC concentrations (more details were provided in the Supplement). For example, higher contributions of solvent usage and biomass burning and lower contributions of diesel vehicular emission were found in the scenario without adjustments than that with adjustments, which were related to the relatively high photochemical reactivity of main species in diesel vehicular emission than those in solvent usage and biomass burning.
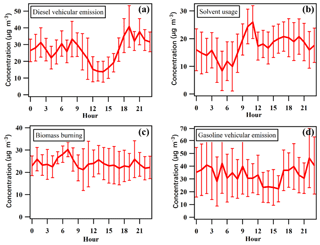
Figure 7 shows the diurnal variations in VOCs emitted from different sources extracted from PMF. Different diurnal patterns were found for different sources, which may be related to the variations in emission strength, the concentrations of species in different source profiles, as well as the influence of mixing height. For example, relatively high levels were found for the diesel and gasoline vehicular emissions in the early morning and in the evening, corresponding well with traffic emissions during peak times, while a broad valley during daytime hours may be related to the increased mixing height and photochemical loss and decreased emission strength (Zheng et al., 2010b; Yuan et al., 2009). Different from vehicular emissions, the concentrations of solvent usage started to increase in the early morning and reached maximum value at noon, then decreased gradually and presented a broad peak until midnight. The increased levels of solvent usage from early morning to midday were associated with the increased emissions from human production activities and the increased temperature, which would accelerate evaporation of VOCs during solvent use. The diurnal variations in biomass burning were much weaker than other sources, with peak values occurring in the early morning, which was consistent with the diurnal patterns of plumes of biomass burning at the HS (Yuan et al., 2010).
3.3 The contributions of VOC sources to ozone photochemical formation
To evaluate the roles of the different VOCs emissions for O3 formation, we applied the PBM-MCM model to the PMF-extracted VOC concentrations. To quantitatively evaluate the performance of the O3 simulation, the index of agreement (IOA), which was widely used for evaluation of the PBM-MCM model (Wang et al., 2015, 2017; Liu et al., 2019), was introduced. The IOA was calculated by the following equation (Huang et al., 2005):
where Oi and Si represent observed and simulated concentration of O3, respectively; represents the mean of observed concentrations of O3; and n is the number of samples. The IOA value ranged from 0 to 1, and a higher value meant better agreement between observation and simulation. In this study, the IOA of O3 was ∼0.9, suggesting the abundance and variation in O3 were reasonably reproduced and could be used for further calculation.
Figure 8a–b showed the mean RIR values of different VOC sources and NO, together with the contributions of different VOC sources to photochemical O3 formation. The mean RIR values of various VOC sources were positive, while that of NO was negative, suggesting that O3 formation at the HS was in the VOC-limited regime. Among the four main anthropogenic sources of VOCs, relatively high mean RIR values of vehicular emissions and biomass burning than that of solvent usage were found, with the mean RIR value of gasoline vehicular emission higher than that of diesel vehicular emission. Furthermore, considering both the reactivity and abundance of VOCs in different sources, the results showed that the gasoline vehicular emission was the most important contributor to photochemical O3 production (Fig. 8b), with a mean percentage of 42 %, followed by diesel vehicular emission (23 %), biomass burning (20 %) and solvent usage (15 %), suggesting that controlling vehicular emissions (especially gasoline vehicular emission) and biomass burning could be a more effective way of reducing O3 pollution in the region.
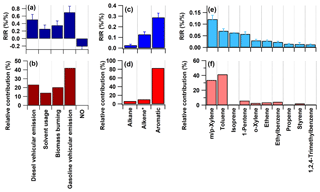
Figure 8The mean RIR values of different sources (a) and their contributions to photochemical O3 formation (b). The mean RIR values of different VOC groups (c) and their contributions to photochemical O3 formation (d). The mean RIR values of top 10 VOCs (e) and their contributions to photochemical O3 formation (f). The error bars represent the standard error of the mean RIR values. Alkene includes both acetylene and alkenes except isoprene.
Furthermore, Fig. 8c–f also showed the mean RIR values and the contributions to photochemical O3 formation for the top 10 VOC species and groups at the HS. Aromatics had the highest RIR value, with an average contribution of ∼82 % to the sum RIR of all VOCs, followed by alkenes (∼11 %) and alkanes (∼7 %). Among the individual VOC species, toluene and m∕p-xylene made the most significant contribution (with a relative contribution of ∼40 % and ∼34 %, respectively) to O3 formation at the site, when both the reactivity and abundance of VOC species were considered. The PMF results suggest that aromatics (including toluene, xylenes and ethylbenzene) were mainly from gasoline vehicular emission and solvent usage, while alkenes were mainly related to diesel vehicular emission. The results suggested that gasoline vehicular emission was the dominant contributor to O3 formation at the HS and that greater effort should be devoted to toluene, xylenes, ethylbenzene, ethene and 1-pentene for effectively controlling photochemical pollution.
3.4 Improvement for the reduction of VOCs and NOx to photochemical O3 formation
3.4.1 Sensitivity analysis of O3 formation
Changes in VOCs and NOx concentrations will affect O3 formation, leading to considerable variation in the O3 concentration, which can be illustrated from the O3 isopleth plot. The PBM-MCM model was employed based on the average hourly observed data across days to provide a single base case input for the box model's generation of O3 isopleths. A total of 520 reduction scenarios (26 NOx ×20 VOCs) were simulated and the maximum O3 value in each scenario was selected. Figure 9 shows the O3 isopleth based on the observed levels of VOCs and NOx at the HS.
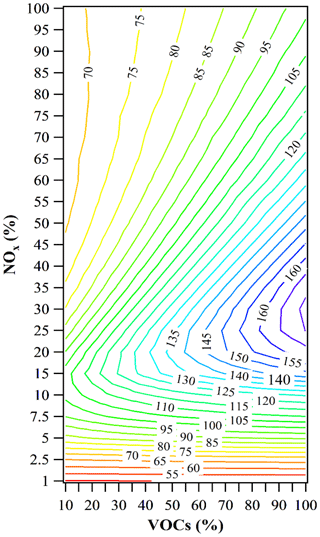
Figure 9The O3 isopleth in term of percentage changes of volatile organic compounds (VOCs) and NOx: the percentage change of NOx from 0 % to 99 % and the percentage change of VOCs from 0 % to 90 %. The O3 mixing ratios are in ppbv. The horizontal and vertical axes correspond to the percentage of the measured average mixing ratios of VOCs and NOx, respectively.
The O3 isopleths (Fig. 9) show distinct characteristics of O3 variations. For a 0 %–60 % reduction of NOx (i.e., corresponding to 40 %–100 % of original NOx), the O3 mixing ratio decreases considerably with VOCs for a certain NOx condition but increases slightly with decreasing NOx for a fixed mixing ratio of VOCs. This clearly indicates a VOC-limited regime for O3 formation in this region, which is consistent with previous results found in urban, suburban and some rural environments, as well as the downwind site of the PRD region (Zhang et al., 2008b; Cheng et al., 2010; Ling et al., 2011; Zheng et al., 2013; Ling and Guo, 2014). However, it is different from the results found in the northern rural areas of the PRD region based on the measured ratios of O3∕NOx (Zheng et al., 2010b). Here, we introduced the absolute value of RIR (|RIR|) to evaluate the sensitivity of the O3 formation to VOCs and NOx. It is evident that the |RIR| decreases with VOCs for a fixed NOx, whereas with decreasing NOx for a fixed VOCs the |RIR| initially fluctuates and then increases. This implies that the efficiency of O3 reduction by limiting VOC emissions alone would decrease gradually (data not shown) and attention should be given to the counter effects caused by decreasing NOx. For NOx reduction to 0 %–40 % of the original level, a clear ridge can be seen, dividing the isopleth into two parts: VOC-limited (up) and NOx-limited (down). In the VOC-limited regime, the effects of both VOCs and NOx on O3 formation are linear, and the O3 concentration is apparently proportional to the amounts of VOCs (and NOx): the higher the VOCs mixing ratio (or the lower the NOx), the higher the O3 concentration. On the other side of the ridge, for the reduced NOx to 7.5 %–15 % of original mixing ratio, O3 concentration decreases with NOx concentration, but decreased VOCs would lead to minimal O3 variation. Ideally, the NOx reduction to 1 %–7.5 % would result in a “pure” NOx-limited regime, where O3 formation is solely controlled by NOx concentrations and insensitive to the change of VOCs. The reduction of NOx emissions, in this case, will be the most effective measure for mitigating O3 production.
3.4.2 Development of the most optimum control measures on both VOCs and NOx
It was found that O3 formation was in the VOC-limited regime at the HS (with 100 % of NOx and VOCs as input); however, it was unclear how many VOCs should be controlled for the most efficient O3 reduction, especially in a society where VOCs and NOx are frequently controlled simultaneously. To achieve this and provide detailed information about the necessary reductions in VOCs and NOx, we simulated the net O3 increment (i.e., the total increase in average O3 concentrations when both VOCs and NOx were reduced) with the reduction of both VOCs and NOx (Fig. 10). The horizontal and vertical axis corresponded, respectively, to the reduction percentages of NOx (e.g., 10 % meant that the mixing ratios of NOx were reduced by 10 %) and the net increments of O3 (positive and negative values represented the increase and decrease in O3 compared to the base case with no reductions of VOCs and NOx, respectively). The different curves corresponded to scenarios with different reduction percentages of VOCs. It showed that the net O3 increments increased as the reduction percentages of NOx increased from 0 % to 70 %, regardless of the reduction of VOCs, while the net O3 increment decreased gradually when NOx was reduced by > 70 %.
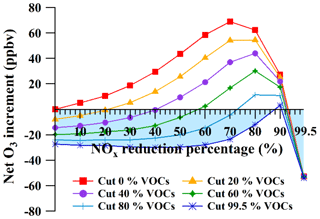
Figure 10Net O3 increment as a function of the reduction percentages of NOx and volatile organic compounds (VOCs). The highlighted area represents zero O3 increment.
However, an optimum control measure for VOCs and NOx would result in the O3 mixing ratios being reduced, or at least not increasing (i.e., the value of the net O3 increment was less than or equal to zero, the highlighted area in Fig. 10). It was found that when the mixing ratios of VOCs were reduced from 0 % to 99.5 %, the appropriate reduction percentages of NOx should be between 0 % and 88 % or between 90 % and 99.5 % for the zero O3 increment. Interestingly, when the reduction percentages of NOx ranged from 90 % to 99.5 %, O3 formation was reduced with the reduction of NOx, regardless of any reduction of VOCs. However, reducing NOx by 90 %–99.5 % may not be feasible. Therefore, this section focused on the range of 0 %–88 % of NOx reduction for devising optimum controlling measures of VOCs and NOx. It was determined that when the reduction percentages of NOx ranged from 0 % to 88 %, the minimum abatement ratio of VOCs∕NOx for zero O3 increment changed from ∼1 to 1.1 (i.e., the cutting ratios of VOCs∕NOx at the intersections of the curves and the horizontal axis). This suggested that the abatement ratio of VOCs∕NOx should be higher than 1.1 to prevent the increase in the O3 levels at the HS.
To determine the appropriate cutting ratios of the individual sources of VOCs vs. NOx when both VOCs and NOx were reduced, NOx-sensitivity analysis of O3 VOC sources was conducted. The net O3 increments as a function of the reduction percentages of NOx for individual VOC sources were shown in Fig. 11. For different VOC sources, the patterns of the net O3 increment as a function of different NOx reductions were similar, with O3 increments increasing when the mixing ratios of NOx were reduced by 0 %–80 % and decreasing with reduction percentages of NOx from 80 % to 99.5 %. When the cutting percentages of VOCs increased from 0 % to 99.5 %, the appropriate reduction percentages of NOx for zero O3 increment were in the ranges of 0 %–30 % and 90 %–99.5 %. Interestingly, when the reduction percentages of NOx ranged from 90 % to 99.5 %, O3 formation was reduced with the reduction of NOx, regardless of the reduction of VOCs. Therefore, focusing on the range of 0 %–30 % of NOx reduction provided appropriate reduction ratios for devising optimum controlling measures of VOCs and NOx.
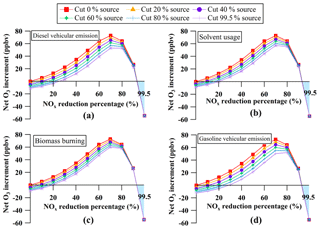
Figure 11Net O3 increment as a function of the reduction percentages of NOx for individual sources of volatile organic compounds (VOCs); (a) diesel vehicular emission, (b) solvent usage, (c) biomass burning and (d) gasoline vehicular emission. The highlighted area represents zero O3 increment.
It was found that the specific appropriate reduction percentages of NOx for zero O3 increment were 0 %–27 % for diesel vehicular emission, 0 %–22 % for solvent usage and biomass burning and 0 %–30 % for gasoline vehicular emission. The abatement ratio of individual sources of VOCs vs. NOx should be > 3.8 for diesel vehicular emission, > 4.6 for solvent usage and biomass burning, and > 3.3 for gasoline vehicular emission. For example, if the mixing ratios of NOx were reduced by 10 %, more than 38 % of diesel vehicular emission, 46 % of solvent usage or biomass burning, or 33 % of gasoline vehicular emission needed to be prevented to mitigate increases in O3 levels at the HS. Furthermore, the above ratios demonstrated that reducing VOCs from gasoline vehicular emission (followed by diesel vehicular emission, biomass burning and solvent usage) was the most efficient means of reducing both VOCs and NOx without increasing O3 levels.
The PRD region has long been facing severe photochemical air pollution, and VOCs have been the limiting factor of O3 formation in this region. To better understand the contribution of different anthropogenic VOCs to O3 formation in this region, we performed in-depth analyses of data obtained from intensive measurement of VOCs and related species conducted at a downwind rural site (Heshan site, HS) in the PRD region during October–November 2014. Four anthropogenic sources were identified by the PMF model with the consideration of the influence of photochemical processing. The O3 formation at the HS was generally VOC-limited, with the vehicular emission (especially gasoline vehicular emission) as the most important anthropogenic VOC source contributing to O3 formation, followed by biomass burning. It indicated that priority should be given to controlling vehicular emission and biomass burning. Furthermore, with the current industries operating in the PRD region, particular attention should be given to toluene, xylenes, ethylbenzene, ethene and 1-pentene in efforts to control photochemical pollution.
Indeed, many additional policies regarding VOCs have been, and continue to be, implemented and formulated in the PRD region. A series of policies regarding the control of vehicular emission has been conducted in the PRD region, the purposes of which can be mainly divided into two categories: (1) to improve the environmental standards of the main air pollutants and standards of emissions and (2) to improve the quality of the fuel used in vehicles. Policies regarding the control of biomass burning, however, are relatively limited. Nevertheless, some policies have been effective, and levels of NOx (another important O3 precursor) have decreased in the PRD region in recent years. On the other hand, for VOCs, most relevant policies only control the total mass and/or the total emissions of VOCs, and the level of O3 continues to increase in this region. To prevent net O3 increment, the VOCs and NOx should be controlled in an appropriate ratio since VOCs and NOx were frequently controlled simultaneously. Furthermore, long-term monitoring is still needed to evaluate the benefits and disbenefits of the control measures on vehicular emissions and/or photochemical pollution in the PRD region.
Overall, the results of this study will be valuable for enabling local and regional policymakers to propose appropriate strategies and effective control measures of VOCs and photochemical pollution in other regions of China, especially where O3 formation is VOC-limited. However, it is noteworthy that the above results were obtained based only on measurements taken over 1 month and in a specific season (i.e., autumn), which may only represent the characteristics of photochemical pollution in autumn at a receptor site in the PRD region.
The results and meta data can be accessed through https://pan.baidu.com/s/1RhshAuMELInobRWSzLIdDQ (Ling and He, 2019; access code: gq8q).
The supplement related to this article is available online at: https://doi.org/10.5194/acp-19-8801-2019-supplement.
In this study, the analysis methods were developed and the whole structure for the paper was designed by ZL, ZW and JZ. ZH conducted the data processing and wrote the paper. XW and MS provided the data and revised the paper. Furthermore, the simulation of the PBM-MCM model was conducted by ZL and HG. Finally, the paper was finalized by ZL and ZW.
The authors declare that they have no conflict of interest.
The authors thank the three anonymous referees for their constructive and valuable comments.
This research has been supported by the National Key Research and Development Program of China (grant nos. 2017YFC0210106 and 2016YFC0203305), the State Key Program of National Natural Science Foundation of China (grant no. 91644215), the National Natural Science Foundation of China (grant nos. 41775114 and 41505103) and the Hong Kong Research Grants Council (grant nos. 25221215 and 15265516). This work was also partly supported by the Pearl River Science and Technology Nova Program of Guangzhou (grant no. 201806010146).
This paper was edited by Jianzhong Ma and reviewed by three anonymous referees.
Atkinson, R., Baulch, D. L., Cox, R. A., Crowley, J. N., Hampson, R. F., Hynes, R. G., Jenkin, M. E., Rossi, M. J., Troe, J., and IUPAC Subcommittee: Evaluated kinetic and photochemical data for atmospheric chemistry: Volume II – gas phase reactions of organic species, Atmos. Chem. Phys., 6, 3625–4055, https://doi.org/10.5194/acp-6-3625-2006, 2006.
ATSDR (Agency for Toxic Substances and Diseases Registry): available at: http://www.atsdr.cdc.gov/toxfaqs/index.asp (last access: 31 October 2018), 2007.
Blake, D. R., Smith Jr., T., Chen, T. Y., Whipple, W., and Rowland, F. S: Effects of biomass burning on summertime nonmethane hydrocarbon concentrations in the Canadian wetlands. J. Geophys. Res.-Atmos., 99, 1699–1719, https://doi.org/10.1029/93JD02598, 1994.
Cai, C. J., Geng, F. H., Tie, X. X., Yu, Q., and An, J. L.: Characteristics and source apportionment of VOC measured in Shanghai, China, Atmos. Environ., 44, 5005–5014, https://doi.org/10.1016/j.atmosenv.2010.07.059, 2010.
Cardelino, C. A. and Chameides, W. L: An observation-based model for analyzing ozone precursor relationships in the urban atmosphere, J. Air Waste Manage., 45, 161–180, https://doi.org/10.1080/10473289.1995.10467356, 1995.
Carter, W. L. and Atkinson, R.: Computer modeling study of incremental hydrocarbon reactivity, Environ. Sci. Technol., 23, 864–880, https://doi.org/10.1021/es00065a017, 1989.
Chan, L. Y., Chu, K. W., Zou, S. C., Chan, C. Y., Wang, X. M., Barletta, B., Blake, D. R., Guo, H., and Tsai, W. Y.: Characteristics of nonmethane hydrocarbons (NMHCs) in industrial, industrial-urban, and industrial-suburban atmospheres of the Pearl River Delta (PRD) region of south China, J. Geophys. Res.-Atmos., 111, D11304, https://doi.org/10.1029/2005JD006481, 2006.
Chang, C., Wang, J. L., Liu, S., Shao, M. Z., Zhang, Y., Zhu, T. J., Shiu, C., and Lai, C.: Photochemically consumed hydrocarbons and their relationship with ozone formation in two megacities of China, Agu Fall Meeting, AGU Fall Meeting Abstracts, 2010.
Cheng, H. R., Guo, H., Wang, X. M., Saunders, S. M., Lam, S. H. M., Jiang, F., Wang, T. J., Ding, A. J., Lee, S. C., and Ho, K. F.: On the relationship between ozone and its precursors in the Pearl River Delta: application of an observation-based model (OBM), Environ. Sci. Pollut. R., 17, 547–560, https://doi.org/10.1007/s11356-009-0247-9, 2010.
de Gouw, J. A., Middlebrook, A. M., Warneke, C., Goldan, P. D., Kuster ,W. C., Roberts, J. M., Fehsenfeld, F. C., Worsnop, D. R., Canagaratna, M. R., Pszenny, A. A. P., Keene, W. C., Marchewka, M., Bertman, S., and Bates, T. S.: Budget of organic carbon in a polluted atmosphere: Results from the New England Air Quality Study in 2002, J. Geophys. Res.-Atmos., 110, D16305, https://doi.org/10.1029/2004JD005623, 2005.
Duan, J. C., Tan, J. H., Yang, L.,Wu, S., and Hao, J. M.: Concentration, sources and ozone formation potential of volatile organic compounds (VOCs) during ozone episode in Beijing, Atmos. Res., 88, 25–35, https://doi.org/10.1016/j.atmosres.2007.09.004, 2008.
Fuentes, J. D., Wang, D., Neumann, H. H., Gillespie, T. J., Hartog, G. D., and Dann, T. F.: Ambient biogenic hydrocarbons and isoprene emissions from a mixed deciduous forest, J. Atmos. Chem., 25, 67–95, https://doi.org/10.1007/BF00053286, 1996.
Geng, F., Cai, C., Tie, X., Yu, Q., An, J., Peng, L., and Xu, J.: Analysis of VOC emissions using PCA/APCS receptor model at city of Shanghai, China, J. Atmos. Chem., 62, 229–247, https://doi.org/10.1007/s10874-010-9150-5,2009.
Guo, H., Cheng, H. R., Ling, Z. H., Louie, P. K. K., and Ayoko, G. A.: Which emission sources are responsible for the volatile organic compounds in the atmosphere of Pearl River Delta?, J. Hazard. Mater., 188, 116–124, https://doi.org/10.1016/j.jhazmat.2011.01.081, 2011a.
Guo, H., Zou, S. C., Tsai, W. Y., Chan, L. Y., and Blake, D. R.: Emission characteristics of non-methane hydrocarbons from private cars and taxis at different driving speeds in Hong Kong, Atmos. Environ., 45, 2711–2721, https://doi.org/10.1016/j.atmosenv.2011.02.053, 2011b.
Guo, H., Ling, Z. H., Cheng, H. R., Simpson, I. J., Lyu, X. P., Wang, X. M., Shao, M., Lu, H. X., Ayoko, G., Zhang, Y. L., Saunders, S. M., Lam, S. H. M., Wang, J. L., and Blake, D. R.: Tropospheric volatile organic compounds in China, Sci. Total Environ., 574, 1021–1043, https://doi.org/10.1016/j.scitotenv.2016.09.116, 2017.
Guven, B. B. and Olaguer, E. P.: Ambient formaldehyde source attribution in Houston during TexAQS II and TRAMP, Atmos. Environ., 45, 4272–4280, https://doi.org/10.1016/j.atmosenv.2011.04.079, 2011.
Hagenbjörk, A., Malmqvist, E., Mattisson, K., Sommar, N. J., and Modig, L.: The spatial variation of O3, NO, NO2 and NOx and the relation between them in two Swedish cities, Environ. Monit. Assess., 189, 161, https://doi.org/10.1007/s10661-017-5872-z, 2017.
He, J., Chen, H. X., Liu, X. X., Hu, J. H., Li, Q. L., and He, F. Q.: The analysis of various volatile solvents used in different industries in Zhongshan, South China Journal of Preventive Medicine, 28, 26–27, https://doi.org/10.3969/j.issn.1671-5039.2002.06.009, 2002 (in Chinese).
Ho, K. F., Lee, S. C., Ho, W. K., Blake, D. R., Cheng, Y., Li, Y. S., Ho, S. S. H., Fung, K., Louie, P. K. K., and Park, D.: Vehicular emission of volatile organic compounds (VOCs) from a tunnel study in Hong Kong, Atmos. Chem. Phys., 9, 7491–7504, https://doi.org/10.5194/acp-9-7491-2009, 2009.
Holzinger, R., Warneke, C., Hansel, A., Jordan, A., and Lindinger, W.: Biomass burning as a source of formaldehyde, acetaldehyde, methanol, acetone, acetonitrile, and hydrogen cyanide, Geophys. Res. Lett., 26, 1161–1164, https://doi.org/10.1029/1999GL900156, 1999.
Huang, J. P., Fung, J. C. H., Lau, A. K. H., and Qin, Y.: Numerical simulation and process analysis of typhoon-related ozone episodes in Hong Kong, J. Geophys. Res.-Atmos., 110, D05301, https://doi.org/10.1029/2004JD004914, 2005.
Huang, R. L., Zhang, Y. L., Bozzetti, C., Ho, K. F., Cao, J. J., Han, Y. M., Daellenbach, K. R., Slowik, J. G., Platt, S. M., Canonaco, F., Zotter, P., Wolf, R., Pieber, S. M., Bruns, E. A., Crippa, M., Ciarelli, G., Piazzalunga, A., Schwikowski, M., Abbaszade, G., Schnelle-Kreis, J., Zimmermann, R., An, Z. S., Szidat, S., Baltensperger, U., Haddad, I. E., and Prévôt, A. S. H.: High secondary aerosol contribution to particulate pollution during haze events in China, Nature, 514, 218–222, https://doi.org/10.1038/nature13774, 2014.
Jenkin, M. E. and Clemitshaw, K. C.: Ozone and other secondary photochemical pollutants: chemical processes governing their formation in the planetary boundary layer, Atmos. Environ., 34, 2499–2527, https://doi.org/10.1016/S1352-2310(99)00478-1, 2000.
Jimenez, J. L., Canagaratna, M. R., Donahue, N. M., Prévôt, A. S. H., Zhang, Q., Kroll, J. H., DeCarlo, P. F., Allan, J. D., Coe, H., Ng, N. L., Aiken, A. C., Docherty, K. S., Ulbrich, I. M., Grieshop, A. P., Robinson, A. L., Duplissy, J., Smith, J. D., Wilson, K. R., Lanz, V. A., Hueglin, C., Sun, Y. L., Tian, J., Laaksonen, A., Raatikainen, T., Rautianinen, J., Vaattovaara, P., Ehn, M., Kulmala, M., Tomlinson, J. M., Collins, D. R., Cubison, M. J., Dunlea, E. J., Huffman, J. A., Onasch, T. B., Alfarra, M. R., Williams, P. I., Bower, K., Kondo, Y., Schneider, J., Drewnick, F., Borrmann, S., Weimer, S., Demerjian, K., Salcedo, D., Cottrell, L., Griffin, R., Takami, A., Miyoshi, T., Hatakeyama, S., Shimono, A., Sun, J. Y., Zhang, Y. M., Dzepina, K., Kimmel, J. R., Sueper, D., Jayne, J. T., Herndon, S. C., Trimborn, A. M., Williams, L. R., Wood, E. C., Middlebrook, A. M., Kolb, C. E., Baltensperger, U., and Worsnop, D. R.: Evolution of organic aerosols in the atmosphere, Science, 326, 1525–1529, https://doi.org/10.1126/science.1180353, 2009.
Lam, S. H. M., Saunders, S. M., Guo, H., Ling, Z. H., Jiang, F., Wang, X. M., and Wang, T. J.: Modelling VOC source impacts on high ozone episode days observed at a mountain summit in Hong Kong under the influence of mountain-valley breezes, Atmos. Environ., 81, 166–176, https://doi.org/10.1016/j.atmosenv.2013.08.060, 2013.
Lau, A. K. H., Yuan, Z., Yu, J. Z., and Louie, P. K.: Source apportionment of ambient volatile organic compounds in Hong Kong, Sci. Total Environ., 408, 4138–4149, https://doi.org/10.1016/j.scitotenv.2010.05.025, 2010.
Li, J. F., Lu, K. D., Lv, W., Li, J., Zhong, L. J., Ou, Y. B., Chen, D. H., Huang, X., and Zhang, Y. H.: Fast increasing of surface ozone concentrations in Pearl River Delta characterized by a regional air quality monitoring network during 2006–2011, J. Environ. Sci., 26, 23–36, https://doi.org/10.1016/S1001-0742(13)60377-0, 2014.
Li, L. Y., Xie, S. D., Zeng, L. M., Wu, R. R., and Li, J.: Characteristics of volatile organic compounds and their role in ground-level ozone formation in the Beijing-Tianjin-Hebei region, China, Atmos. Environ., 113, 247–254, https://doi.org/10.1016/j.atmosenv.2015.05.021, 2015.
Ling, Z. and He, Z.: Heshan data upload.xls, available at: https://pan.baidu.com/s/1RhshAuMELInobRWSzLIdDQ, last access: 30 October 2019.
Ling, Z. H. and Guo, H.: Contribution of VOC sources to photochemical ozone formation and its control policy implication in Hong Kong, Environ. Sci. Pollut. R., 38, 180–191, https://doi.org/10.1016/j.envsci.2013.12.004, 2014.
Ling, Z. H., Guo, H., Cheng, H. R., and Yu, Y. F.: Sources of ambient volatile organic compounds and their contributions to photochemical ozone formation at a site in the Pearl River Delta, southern China, Environ. Pollut., 159, 2310–2319, https://doi.org/10.1016/j.envpol.2011.05.001, 2011.
Ling, Z. H., Zhao, J., Fan, S. J., and Wang, X. M.: Sources of formaldehyde and their contributions to photochemical O3 formation at an urban site in the Pearl River Delta, southern China, Chemosphere, 168, 1293–1301, https://doi.org/10.1016/j.chemosphere.2016.11.140, 2017.
Ling, Z. H., He, Z. R., Wang, Z., Shao, M., and Wang, X. M.: Sources of MACR and MVK and their contributions to methylglyoxal and formaldehyde at a receptor site in Pearl River Delta, J. Environ. Sci., 79, 1–10, 2019.
Liu, X., Lyu, X., Wang, Y., Jiang, F., and Guo, H.: Intercomparison of O3 formation and radical chemistry in the past decade at a suburban site in Hong Kong, Atmos. Chem. Phys., 19, 5127–5145, https://doi.org/10.5194/acp-19-5127-2019, 2019.
Liu, Y., Shao, M., Fu, L., Lu, S., Zeng, L., and Tang, D.: Source profiles of volatile organic compounds (VOCs) measured in China: part I, Atmos. Environ., 42, 6247–6260, https://doi.org/10.1016/j.atmosenv.2008.01.070, 2008a.
Liu, Y., Shao, M., Lu, S. H., Chang, C. C., Wang, J. L., and Fu, L. L.: Source apportionment of ambient volatile organic compounds in the Pearl River Delta, China: Part II, Atmos. Environ., 42, 6261–6274, https://doi.org/10.1016/j.atmosenv.2008.02.027, 2008b.
Liu, Y., Shao, M., Kuster, W. C., Goldan, P. D., Li, X. H., Lu, S. H., and de Gouw, J. A.: Source identification of reactive hydrocarbons and oxygenated VOCs in the summertime in Beijing, Environ. Sci. Technol., 43, 75–81, https://doi.org/10.1021/es801716n, 2009.
Lyu, X., Guo, H., Simpson, I. J., Meinardi, S., Louie, P. K. K., Ling, Z., Wang, Y., Liu, M., Luk, C. W. Y., Wang, N., and Blake, D. R.: Effectiveness of replacing catalytic converters in LPG-fueled vehicles in Hong Kong, Atmos. Chem. Phys., 16, 6609–6626, https://doi.org/10.5194/acp-16-6609-2016, 2016.
Melkonyan, A. and Kuttler, W.: Long-term analysis of NO, NO2 and O3 concentrations in North Rhine-Westphalia, Germany, Atmos. Environ., 60, 316–326, https://doi.org/10.1016/j.atmosenv.2012.06.048, 2012.
Nelson, P. F. and Quigley, S. M.: The hydrocarbon composition of exhaust emitted from gasoline fueled vehicles, Atmos. Environ., 18, 79–87, https://doi.org/10.1016/0004-6981(84)90230-0, 1984.
Ou, J. M., Feng, X. Q., Liu, Y. C., Gao, Z. Z., Yang, Y., Zhou, Z., Wang, X. M., and Zheng J. Y.: Source characteristics of VOCs emissions from vehicular exhaust in the Pearl River Delta region, Acta Scientiae Circumstantiae, 34, 826–834, https://doi.org/10.13671/j.hjkxxb.2014.0614, 2014.
Ou, J. M., Guo, H., Zheng, J. Y., Cheung, K. L., Louie, P. K. K., Ling, Z. H., and Wang, D. W.: Concentrations and sources of non-methane hydrocarbons (VOCs) from 2005 to 2013 in Hong Kong: a multi-year real-time analysis, Atmos. Environ., 103, 196–206, https://doi.org/10.1016/j.atmosenv.2014.12.048, 2015a.
Ou, J. M., Zheng, J. Y., Li, R. R., Huang, X. B., Zhong, Z. M., Zhong, L. J., and Lin, H.: Speciated OVOC and VOC emission inventories and their implications for reactivity-based ozone control strategy in the Pearl River Delta region, China, Sci. Total Environ., 530–531, 393–402, https://doi.org/10.1016/j.scitotenv.2015.05.062, 2015b.
Paatero, P.: Least squares formulation of robust non-negative factor analysis, Chemometr. Intell. Lab., 37, 23–35, https://doi.org/10.1016/S0169-7439(96)00044-5, 1997.
Paatero, P.: User's guide for positive matrix factorization programs PMF2 and PMF3, part 1: tutorial, University of Helsinki, Finland, 2000a.
Paatero, P.: User's guide for positive matrix factorization programs PMF2 and PMF3, part 2: Reference, University of University of Helsinki, Finland, 2000b.
Paatero, P. and Tapper, U.: Positive matrix factorization: a non-negative factor model with optimal utilization of error estimates of data values, Environment, 5, 111–126, https://doi.org/10.1002/env.3170050203, 1994.
Qin, Y. and Zhao, C. S.: Fundamentals of Atmospheric Chemistry, China Meteorological Press, Beijing, 2003.
Rudolph, J.: The tropospheric distribution and budget of ethane, J. Geophys. Res., 100, 11369–11381, https://doi.org/10.1029/95JD00693, 1995.
Sanadze, G. A.: Biogenic Isoprene (A Review), Russ. J. Plant Physl., 51, 729–741, 2004.
Saunders, S. M., Jenkin, M. E., Derwent, R. G., and Pilling, M. J.: Protocol for the development of the Master Chemical Mechanism, MCM v3 (Part A): tropospheric degradation of non-aromatic volatile organic compounds, Atmos. Chem. Phys., 3, 161–180, https://doi.org/10.5194/acp-3-161-2003, 2003.
Seinfeld, J. H. and Pandis, S. N.: Atmospheric Chemistry and Physics: from air pollution to climate change, John Wiley, New York, NY, 2006.
Shao, M., Lu, S. H., Liu, Y., Xie, X., Chang, C. C., Huang, S., and Chen, Z. M.: Volatile organic compounds measured in summer in Beijing and their role in ground-level ozone formation, J. Geophys. Res., 114, D00G06, https://doi.org/10.1029/2008JD010863, 2009.
Shiu, C. J., Liu, S. C., Chang, C. C., Chen, J. P., Chou, C. K., Lin, C. Y., and Young, C. Y.: Photochemical production of ozone and control strategy for southern Taiwan, Atmos. Environ., 41, 9324–9340, https://doi.org/10.1016/j.atmosenv.2007.09.014, 2007.
Song, C. L., Zhang, W. M., Pei, Y. Q., Fan, G. L., and Xu, G. P.: Comparative effects of MTBE and ethanol additions into gasoline on exhaust emissions, Atmos. Environ., 40, 1957–1970, https://doi.org/10.1016/j.atmosenv.2005.11.028, 2006.
Song, Y., Shao, M., Liu, Y., Lu, S., Kuster,W., Goldan, P., and Xie, S.: Source apportionment of ambient volatile organic compounds in Beijing, Environ. Sci. Technol., 41, 4348–4353, https://doi.org/10.1021/es0625982, 2007.
Tang, J. H., Chan, L. Y., Chang, C. C., Liu, S., and Li, Y. S.: Characteristics and sources of nonmethane hydrocarbons in background atmospheres of eastern, southwestern, and southern China, J. Geophys. Res.-Atmos., 114, D03304, https://doi.org/10.1029/2008JD010333, 2009.
USEPA (U.S. Environmental Protection Agency): EPA Positive Matrix Factorization (PMF) 3.0 Fundamental and User Guide, 2008.
Wadden, R. A., Uno, I., and Wakamatsu, S.: Source discrimination of short-term hydrocarbon samples measured aloft, Environ. Sci. Technol., 20, 473–483, https://doi.org/10.1021/es00147a006, 1986.
Wang, J. L., Wang, C. H., Lai, C. H., Chang, C. C., Liu, Y., Zhang, Y., Liu, S., and Shao, M.: Characterization of ozone precursors in the Pearl River Delta by time series observation of non-methane hydrocarbons, Atmos. Environ., 42, 6233–6246, https://doi.org/10.1016/j.atmosenv.2008.01.050, 2008.
Wang, N., Guo, H., Jiang, F., Ling, Z. H., and Wang, T.: Simulation of ozone formation at different elevations in mountainous area of Hong Kong using WRF-CMAQ model, Sci. Total Environ., 505, 939–951, https://doi.org/10.1016/j.scitotenv.2014.10.070, 2015.
Wang, Y., Wang, H., Guo, H., Lyu, X., Cheng, H., Ling, Z., Louie, P. K. K., Simpson, I. J., Meinardi, S., and Blake, D. R.: Long-term O3–precursor relationships in Hong Kong: field observation and model simulation, Atmos. Chem. Phys., 17, 10919–10935, https://doi.org/10.5194/acp-17-10919-2017, 2017.
Yuan, B., Liu, Y., Shao, M., Lu, S., and Streets, D. G.: Biomass Burning Contributions to Ambient VOCs Species at a Receptor Site in the Pearl River Delta (PRD), China, Environ. Sci. Technol., 44, 4577, https://doi.org/10.1021/es1003389, 2010.
Yuan, B., Chen, W. T., Shao, M., Wang, M., Lu, S. H., Wang, B., Liu, Y., Chang, C. C., and Wang, B. G.: Measurements of ambient hydrocarbons and carbonyls in the Pearl River Delta (PRD), China, Atmos. Res., 116, 93–104, https://doi.org/10.1016/j.atmosres.2012.03.006, 2012a.
Yuan, B., Shao, M., de Gouw, J., Parrish, D. D., Lu, S. H., Wang, M., Zeng, L. M., Zhang, Q., Song, Y., Zhang, J. B., and Hu, M.: Volatile organic compounds (VOCs) in urban air: How chemistry affects the interpretation of positive matrix factorization (PMF) analysis, J. Geophys. Res., 117, D24302, https://doi.org/10.1029/2012JD018236, 2012b.
Yuan, Z. B., Lau, A. K. H., Shao, M., Louie, P. K. K., Liu, S. C., and Zhu, T.: Source analysis of volatile organic compounds by positive matrix factorization in urban and rural environments in Beijing. J. Geophys. Res., 114, D00G15, https://doi.org/10.1029/2008JD011190, 2009.
Zhang, Y. H., Hu, M., Zhong, L. J., Wiedensohler, A., Liu, S. C., Andreae, M. O., Wang, W., and Fan, S. J.: Regional integrated experiments on air quality over Pearl River Delta 2004 (PRIDE-PRD2004): Overview, Atmos. Environ., 42, 6157–6173, https://doi.org/10.1016/j.atmosenv.2008.03.025, 2008a.
Zhang, Y. H., Su, H., Zhong, L. J., Cheng, Y. F., Zeng, L. M., Wang, X. S., Xiang, Y. R., Wang, J. L., Gao, D. F., Shao, M., Fan, S. J., and Liu, S. C.: Regional ozone pollution and observation-based approach for analyzing ozone-precursor relationship during the PRIDE-PRD2004 campaign, Atmos. Environ., 42, 6203–6218, https://doi.org/10.1016/j.atmosenv.2008.05.002, 2008b.
Zhang, Y. L., Wang, X. M., Blake, D. R., Li, L. F. Zhang, Z., Wang, S. Y., Guo, H., Lee, F. S. C., Gao, B., Chan, L. Y., Wu, D., and Rowland, F. S.: Aromatic hydrocarbons as ozone precursors before and after outbreak of the 2008 financial crisis in the Pearl River Delta region, south China, J. Geophys. Res., 117, D15306, https://doi.org/10.1029/2011JD017356, 2012.
Zhang, Y. L., Wang, X. M., Barletta, B., Simpson, I. J., Blake, D. R., Fu, X. X., Zhang, Z., He, Q. F., Liu, T. Y., Zhao, X. Y., and Ding, X.: Source attributions of hazardous aromatic hydrocarbons in urban, suburban and rural areas in the Pearl River Delta (PRD) region, J. Hazard. Mater., 250–251, 403–411, https://doi.org/10.1016/j.jhazmat.2013.02.023, 2013.
Zheng, J. Y., Zhang, L. J., Che, W. W., Zheng, Z. Y., and Yin, S. S.: A highly resolved temporal and spatial air pollutant emission inventory for the Pearl River Delta, China and its uncertainty assessment, Atmos. Environ., 43, 5112–5122, https://doi.org/10.1016/j.atmosenv.2009.04.060, 2009.
Zheng, J. Y., Zheng, Z. Y., Yu, Y. F., and Zhong, L. J.: Temporal, spatial characteristics and uncertainty of biogenic VOC emissions in the Pearl River Delta region, China, Atmos. Environ., 44, 1960–1969, 2010a.
Zheng, J. Y., Zhong, L. J., Wang, T., Louie, P. K. K., and Li, Z. C.: Ground-level ozone in the Pearl River Delta region: analysis of data from a recently established regional air quality monitoring network, Atmos. Environ., 44, 814–823, https://doi.org/10.1016/j.atmosenv.2009.11.032, 2010b.
Zheng, J. Y., Yu, Y. F., Mo, Z. W., Zhang, Z., Wang, X. M., Yin, S. S., Peng, K., Yang, Y., Feng, X. Q., and Cai, H. H.: Industrial sector-based volatile organic compound (VOC) source profiles measured in manufacturing facilities in the Pearl River Delta, China, Sci. Total Environ., 456–457, 127–136, https://doi.org/10.1016/j.scitotenv.2013.03.055, 2013.
Zhou, Y., Yue, D. L., Zhong, L. J., and Zeng, L. M.: Properties of atmospheric PAN pollution in Heshan during summer time, The Administration and Technique of Environmental Monitoring, 4, 24–27, 2013.
Zhou, Y., Zhong, L. J., Yue, D. L., Zeng, L. M., and Zhang, T.: Potential Ozone Formation and Emission Sources of Atmospheric VOCs in Heshan during Typical Pollution Episode, Environmental Monitoring and Forewarning, 6, 1–16, https://doi.org/10.3969/j.issn.1674-6732.2014.04.001, 2014 (in Chinese).
Zhu, Y. H., Yang, L. X., Chen, J. M., Wang, X. F., Xue, L. K., Sui, X., Wen, L., Xu, C. H., Yao, L., Zhang, J. M., Shao, M., Lu, S. H., and Wang, W. X.: Characteristics of ambient volatile organic compounds and the influence of biomass burning at a rural site in Northern China during summer 2013, Atmos. Environ., 124, 156–165, https://doi.org/10.1016/j.atmosenv.2015.08.097, 2016.
Zou, Y., Deng, X. J., Zhu, D., Gong, D. C., Wang, H., Li, F., Tan, H. B., Deng, T., Mai, B. R., Liu, X. T., and Wang, B. G.: Characteristics of 1 year of observational data of VOCs, NOx and O3 at a suburban site in Guangzhou, China, Atmos. Chem. Phys., 15, 6625–6636, https://doi.org/10.5194/acp-15-6625-2015, 2015.


