Comment on “Insignificant effect of climate change on winter haze pollution in Beijing” by Shen et al. (2018)
The recent paper by Shen et al. (2018; referred to hereafter as SHEN) made a sweeping statement on the winter haze pollution in Beijing by claiming an “Insignificant effect of climate change on winter haze in Beijing”. We argue that the paper contains three serious flaws. Any one of the three flaws can nullify the claim of SHEN.
SHEN made a sweeping statement on the winter haze pollution in Beijing by claiming an “Insignificant effect of climate change on winter haze in Beijing”. While failing to acknowledge the large differences in the dataset used, analysis methodology, winter month selected, geographic region chosen, and period and timescale of study from the others, SHEN attempted to invalidate a number of previous studies, including Wang et al. (2015), Cai et al. (2017), Zou et al. (2017), and Li et al. (2018), which have suggested that climate change will worsen haze pollution in Beijing. In this context, our recent study (Mao et al., 2018) also suggested that global warming and other climate changes such as the El Niño–Southern Oscillation (ENSO) and Pacific Decadal Oscillation (PDO) contributed significantly to the trend as well as interannual variabilities in winter haze days in eastern China.
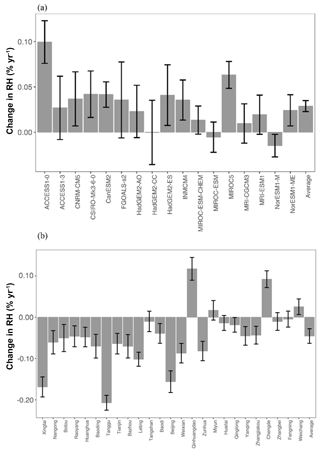
Figure 1(a) Linear trends of annual average RH (in % yr−1) in Beijing–Tianjin–Hebei (BTH), calculated for 1960–2017 historical simulations by an ensemble of 17 CMIP5 climate models; (b) same as (a) except derived from 25 China Meteorological Administration (CMA) meteorological stations in BTH region.
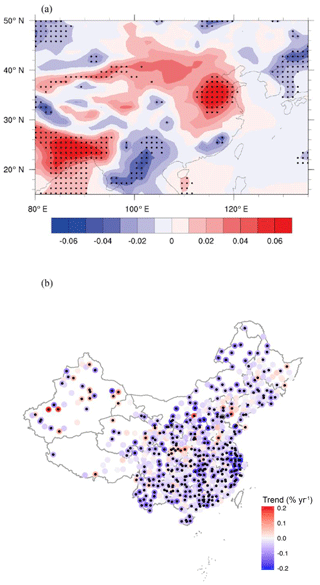
Figure 2(a) Spatial distribution of linear trends of annual average RH (in % yr−1) in China calculated for 1960–2017 historical simulations by an ensemble of 17 CMIP5 climate models; (b) same as (a) except derived from China Meteorological Administration (CMA) meteorological stations. Small black dots denote those trends significant at 95 % confidence level.
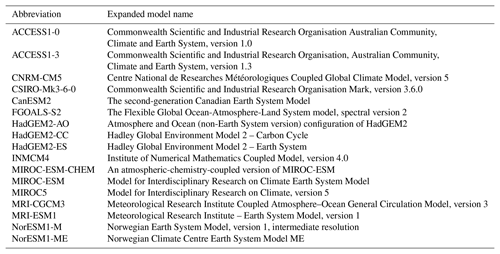
We have found three critical flaws in SHEN. First, SHEN did not conduct any evaluation of the accuracies or uncertainties of the projected changes in surface relative humidity (RH) and meridional wind velocity at 850 hPa (V850) in the RCP8.5 scenarios calculated by an ensemble of 32 Coupled Model Intercomparison Project Phase 5 (CMIP5) climate models for the 21st century (2080–2099 vs. 2000–2019). Here we evaluate the accuracies and uncertainties of the projected changes in RH of CMIP5 climate models by comparing changes in RH from historical simulations (1960–2017) of these climate models to observed values. Figure 1a shows the values of linear trends of annual average RH in Beijing–Tianjin–Hebei (BTH) calculated for 1960–2017 historical simulations by an ensemble of 17 CMIP5 climate models (Table 1). A few models show significant positive trends, but the average trend is only about 0.3 % per decade. This small trend is consistent with the projected insignificant trends in 21st century (2080–2099 vs. 2000–2019) of RH in the RCP8.5 scenarios from an ensemble of 32 CMIP5 climate models as shown in Fig. 5c of SHEN. In contrast, the small positive trend is in stark disagreement with the average trend of about −0.5 % per decade observed at 25 meteorological stations in BTH between 1960 and 2017 (Fig. 1b).
The disagreement is further illustrated in Fig. 2a and b, where the spatial distribution of trends of annual average RH in China calculated for 1960–2017 historical simulations by an ensemble of 17 CMIP5 climate models is compared to observed trends. The model trends are positive in the north and negative in southern China, while observed trends are uniformly negative and greater in value. These disagreements raise serious doubt on the validity of projected changes in RH in Beijing for the RCP8.5 scenarios by an ensemble of 32 CMIP5 climate models. This result is not surprising because it is well known that climate models have large uncertainties and biases in local and regional projections of trends of meteorological parameters. In fact, the evaluation of climate models during the Intergovernmental Panel on Climate Change (IPCC) Fifth Assessment Report (AR5) assessed median-and-above model performance only for the projected global average temperature trends (Flato et al., 2013).
Second, Fig. 1d of SHEN showed time series of monthly average PM2.5 and three meteorological parameters, i.e., RH, V850, and PC1. The correlations among PM2.5, RH, V850, and PC1 are very good as reported in SHEN. However, most of the good correlations are contributed by the large monthly variations. Will the good correlations hold true for yearly variations, and more importantly, will they hold for the timescale of climate change, which is the timescale of concern for SHEN? In addition, will the ratios between PM2.5 and the three meteorological parameters of longer timescales remain the same as those derived from monthly data? SHEN did not address these questions. Here we reproduce Fig. 1d of SHEN in Fig. 3a. Correlation coefficients of PM2.5 with PC1, V850, and RH derived from Fig. 3a are 0.90, 0.81, and 0.79 respectively, consistent with SHEN. In comparison, Fig. 3b shows yearly average values of PM2.5, PC1, V850, and RH; their corresponding correlation coefficients are 0.80, 0.66, and 0.46 respectively. These yearly values are significantly smaller than the monthly values, casting serious doubt on the applicability of results of monthly correlation to longer timescales. A further issue is that SHEN did not document which parameters were used in the principal component analysis and how PC1 was derived.
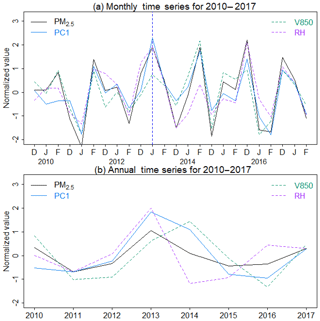
Figure 3(a) Monthly mean time series for 2010–2017 of normalized PC1, PM2.5, V850, and RH. The normalization is relative to the 2010–2017 means; (b) same as (a) except for yearly means.
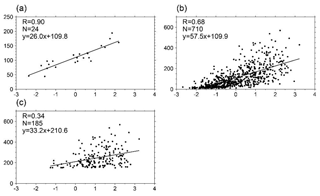
Figure 4Correlations between PC1 (defined by V850 and RH in SHEN; horizontal axis) with observed wintertime PM2.5 concentrations in Beijing (µg m−3; vertical axis) for (a) monthly PM2.5 concentrations and PC1, (b) daily PM2.5 concentrations and PC1, and (c) daily PM2.5 concentrations and PC1 for severe haze days (daily mean PM2.5 ≥ 150 µg m−3). In each panel, N is the number of samples in the studied time period of 2010–2017 as in SHEN, and R is the correlation coefficient.
Third, a more fundamental question is that a parameter such as PC1 should not be considered to be a sole, exclusive, or sufficient proxy of PM2.5 just because PC1 has a good correlation with PM2.5. Even a perfect correlation coefficient (1.0) does not imply any causal relationship, let alone an exclusive or sufficient relationship. In other words, PC1, V850, or RH should not be used to exclude other proxies such as those suggested by Wang et al. (2015), Cai et al. (2017), Zou et al. (2017), and Li et al. (2018). The exclusiveness (or sufficient condition) of an index can only be established if a mechanistic model that uses the index as a sole proxy can successfully reproduce the concentrations and trend of PM2.5 quantitatively. SHEN did not develop such a model. For example, the variation in severe haze is associated with the daily variation in weather condition, as shown in Cai et al. (2017), instead of the monthly PC1 given by SHEN. By using the same data as in SHEN, the correlation coefficient of PC1 with PM2.5 on a daily basis is 0.68 (Fig. 4b), which is significantly lower than the monthly value of 0.90 in Fig. 4a, demonstrating that different correlation coefficients are found at different timescales again. Furthermore, the correlation coefficient of PC1 with PM2.5 for severe haze days (days with daily mean PM2.5 concentration ≥ 150 µg m−3, as defined in Cai et al., 2017) is a small value of 0.34 (Fig. 4c). Therefore, it is inappropriate to use the monthly PC1 to predict future severe winter haze pollution in Beijing as in SHEN. Compared to the large uncertainties in regional RH from the climate models in SHEN, the haze weather index (HWI) in Cai et al. (2017) is defined by anomalies in large-scale circulation with a three-dimensional dynamical concept, which can be captured by climate models for the past and future (see Cai et al., 2017, for the justification).


