the Creative Commons Attribution 4.0 License.
the Creative Commons Attribution 4.0 License.
 | 04 Jul 2019
Impact of particle number and mass size distributions of major chemical components on particle mass scattering efficiency in urban Guangzhou in southern China
Zhisheng Zhang
Yunfei Wu
Zhijun Wu
Peng Cheng
Mei Li
Laiguo Chen
Renjian Zhang
Junji Cao
To grasp the key factors affecting particle mass scattering efficiency (MSE), particle mass and number size distribution, PM2.5 and PM10 and their major chemical compositions, and the particle scattering coefficient (bsp) under dry conditions were measured at an urban site in Guangzhou, southern China, during 2015–2016. On an annual average, 10±2 %, 48±7 % and 42±8 % of PM10 mass were in the condensation, droplet and coarse modes, respectively, with mass mean aerodynamic diameters (MMADs) of 0.78±0.07 in the droplet mode and 4.57±0.42 µm in the coarse mode. The identified chemical species mass concentrations can explain 79±3 %, 82±6 % and 57±6 % of the total particle mass in the condensation, droplet and coarse mode, respectively. Organic matter (OM) and elemental carbon (EC) in the condensation mode, OM, (NH4)2SO4, NH4NO3, and crustal element oxides in the droplet mode, and crustal element oxides, OM, and CaSO4 in the coarse mode, were the dominant chemical species in their respective modes. The measured bsp can be reconstructed to the level of 91±10 % using Mie theory with input of the estimated chemically resolved number concentrations of NaCl, NaNO3, Na2SO4, NH4NO3, (NH4)2SO4, K2SO4, CaSO4, Ca(NO3)2, OM, EC, crustal element oxides and unidentified fraction. MSEs of particle and individual chemical species were underestimated by less than 13 % in any season based on the estimated bsp and chemical species mass concentrations. Seasonal average MSEs varied in the range of 3.5±0.1 to 3.9±0.2 m2 g−1 for fine particles (aerodynamic diameter smaller than 2.1 µm), which was mainly caused by seasonal variations in the mass fractions and MSEs of the dominant chemical species (OM, NH4NO3, (NH4)2SO4) in the droplet mode. MSEs of the dominant chemical species were determined by their lognormal size-distribution parameters, including MMADs and standard deviation (σ) in the droplet mode.
- Article
(1556 KB) - Full-text XML
-
Supplement
(343 KB) - BibTeX
- EndNote


Light extinction coefficients (bext) of atmospheric particles, which are the sum of their scattering (bsp) and absorption (bap) coefficients, is a key index of haze weather (Hand and Malm, 2007). In most cases, bsp accounted for more than 90 % of bext (Takemura et al., 2002; Tao et al., 2017a). Numerous studies have demonstrated that haze is mainly caused by high concentrations of fine particles (PM2.5, with aerodynamic diameter smaller than 2.5 µm) (Hand and Malm, 2007; Huang et al., 2012; Malm et al., 1994, 2000, 2003; Malm and Hand, 2007; Sisler and Latimer, 1993; Sisler et al., 1996; Sisler and Malm, 2000; Wang et al., 2014; Zhao et al., 2013). Knowledge of the dominant chemical species in PM2.5 (e.g., (NH4)2SO4, NH4NO3 and OM) and their contributions to bsp is crucial for making feasible policies for alleviating haze (Watson, 2002).
Generally, bsp can be estimated with reasonable accuracy using Mie theory when size distributions of the dominant chemical species are known (Cheng et al., 2008, 2009; Gao et al., 2015; Malm et al., 2003; Watson et al., 2008). However, routinely monitoring the size distributions of all the dominant chemical components is impractical. To evaluate haze in the national parks in the US under the Regional Haze Rule, the original and revised empirical formulas from the Interagency Monitoring of Protected Visual Environments (IMPROVE) network were developed for reconstructing bsp based on the chemical species in PM2.5 and coarse particle mass concentrations monitored in the IMPROVE network (Pitchford et al., 2007; Watson, 2002). MSEs of the chemical species are important parameters not only for building the relationships between chemical species and bsp (Hand and Malm, 2007) but also for relating particle mass to its optical properties (Lin et al., 2015; Titos et al., 2012). The recommended MSEs of (NH4)2SO4, NH4NO3, OM and fine soil (estimated from crustal elements) in PM2.5 were 3.0, 3.0, 4.0 and 1.0 m2 g−1, respectively, in the original IMPROVE formula based on the assumed size distributions. However, MSE of any particle species varies with its mass concentration and size distribution (Lowenthal and Kumar, 2004; Malm et al., 2003; Malm and Hand, 2007; Malm and Pitchford, 1997). Subsequently, MSEs and mass concentrations of (NH4)2SO4, NH4NO3 and OM in PM2.5 were separated into small and large modes in the revised IMPROVE formula (Hand and Malm, 2007).
China has been suffering from severe PM2.5 pollution and haze weather (Li et al., 2016; Ming et al., 2017; Wang et al., 2017; Zhang et al., 2013). To investigate the formation of haze, the original and revised IMPROVE formulas have been directly applied in many cities in China (Hua et al., 2015; Shen et al., 2014; Tao et al., 2009; Zhang et al., 2012a; Zou et al., 2018). The IMPROVE formulas have been proven to overestimate or underestimate bsp in urban cities in China (Cao et al., 2012; Cheng et al., 2015; Han et al., 2014; Jung et al., 2009a, b; Tao et al., 2012, 2014), which was likely due to the significantly different size distributions of the major chemical components and related mass fractions in PM2.5 between different countries or even individual cities (Bian et al., 2014; Cabada et al., 2004; Chen et al., 2017; Guo et al., 2010; Lan et al., 2011; Tian et al., 2014; Yao et al., 2003; Yu et al., 2010; Zhang et al., 2008; Zhuang et al., 1999b). To reduce the uncertainties in the estimated bsp using the original and revised IMPROVE formulas, the average MSEs of the dominant chemical species were typically estimated by the multiple linear regression method (Hand and Malm, 2007). Although the bsp estimated by the multiple linear regression model may be close to the measured bsp, the rationality of the estimated MSEs of chemical species were unknown.
Variations in size distributions of the chemical components (e.g., MMADs and mass fractions) are important factors for hindering the application of the IMPROVE formulas and multiple linear regression models. Although many studies have focused on size distributions and chemical compositions of fine particles in China, few studies have explored the relationship between the size distribution of major chemical species and their MSEs (Cheng et al., 2008; Cheng et al., 2009; Gao et al., 2015). To fill this knowledge gap, size-segregated particle mass, PM10, PM2.5 and its major chemical components, inline data including size distribution of particle number, bsp under dry conditions, and water-soluble inorganic ions were synchronously measured at an urban site in Guangzhou covering four seasons in 2015–2016. Size distributions of dominant chemical components were first characterized in Sect. 3.1, followed by discussions on the closures of particle mass and number concentration and bsp in Sect. 3.2. Key factors controlling the variations in chemical species and their MSEs were then discussed in Sect. 3.3. Knowledge gained from the present study will improve the assessments of air quality and climate impact caused by atmospheric particles, especially in urban areas.
2.1 Site description
The observational site in urban Guangzhou is situated inside the South China Institute of Environmental Science (SCIES) (23∘07′ N, 113∘21′ E; Fig. 1) with no obvious surrounding industrial activities. The instruments used in this study were installed on the roof of a building 50 m above ground (Tao et al., 2018). The working conditions of all the instruments were controlled at under 26∘C and 40 % in relative humidity (RH) by three air conditioners.
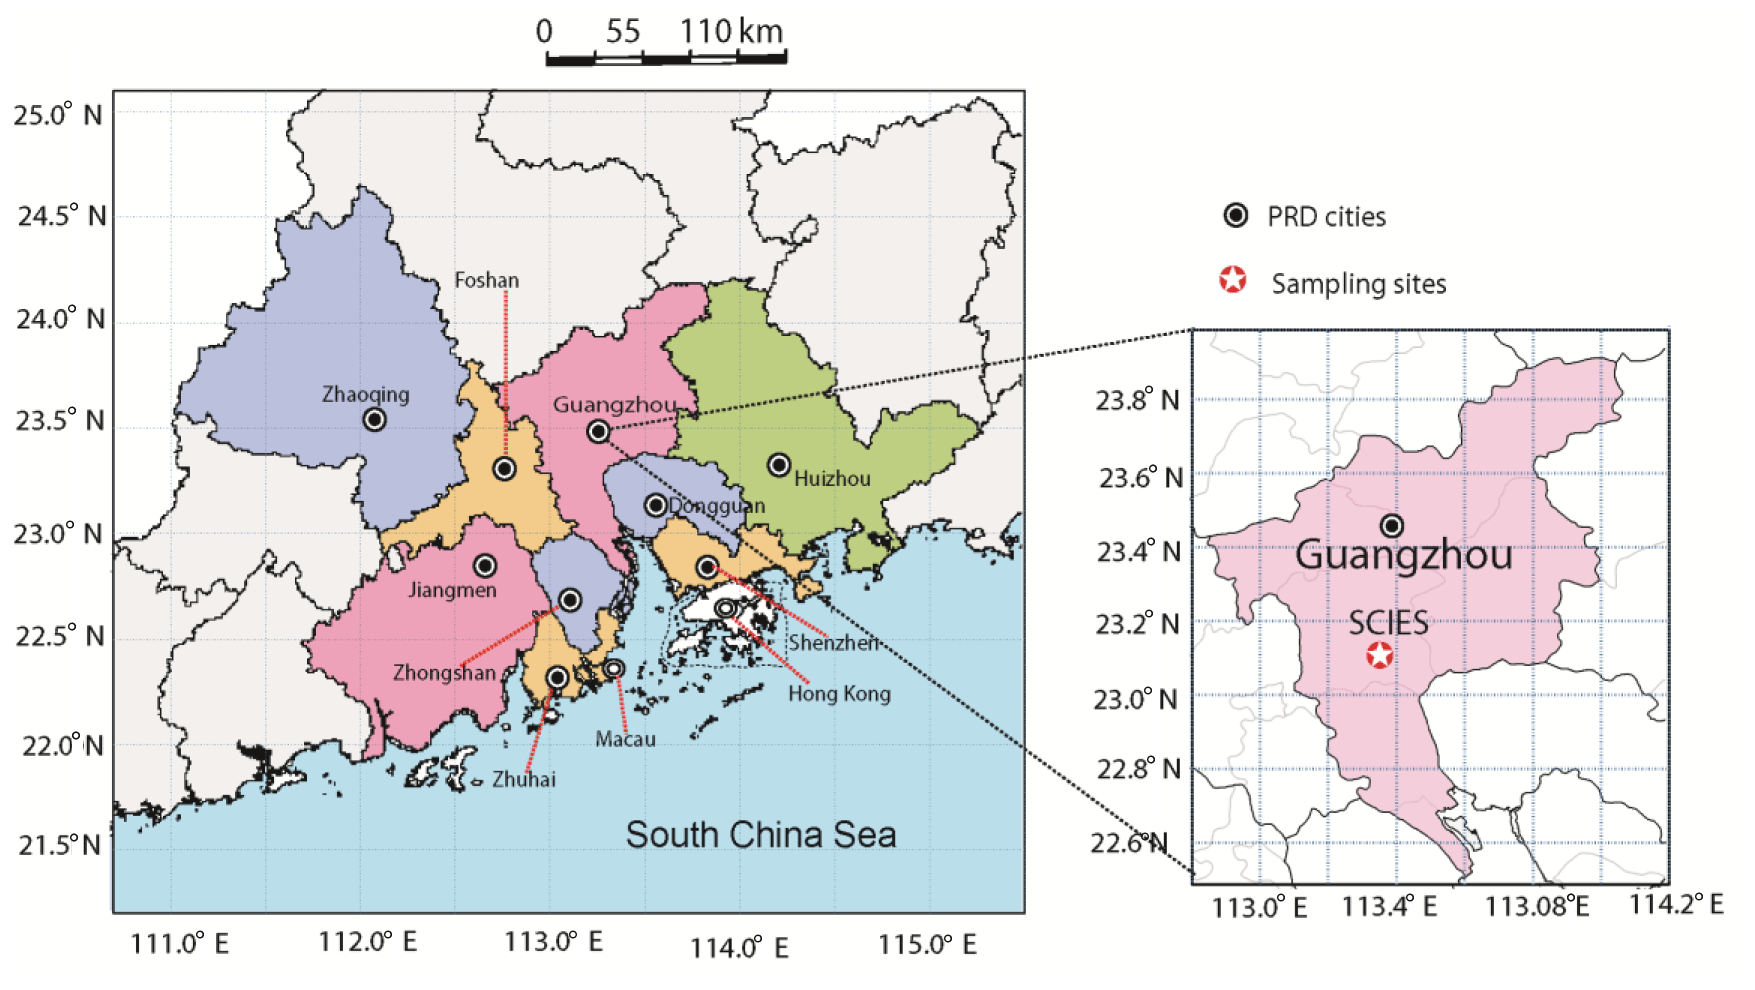
Figure 1The sampling location in urban Guangzhou in the Pearl River Delta (PRD) region of China.
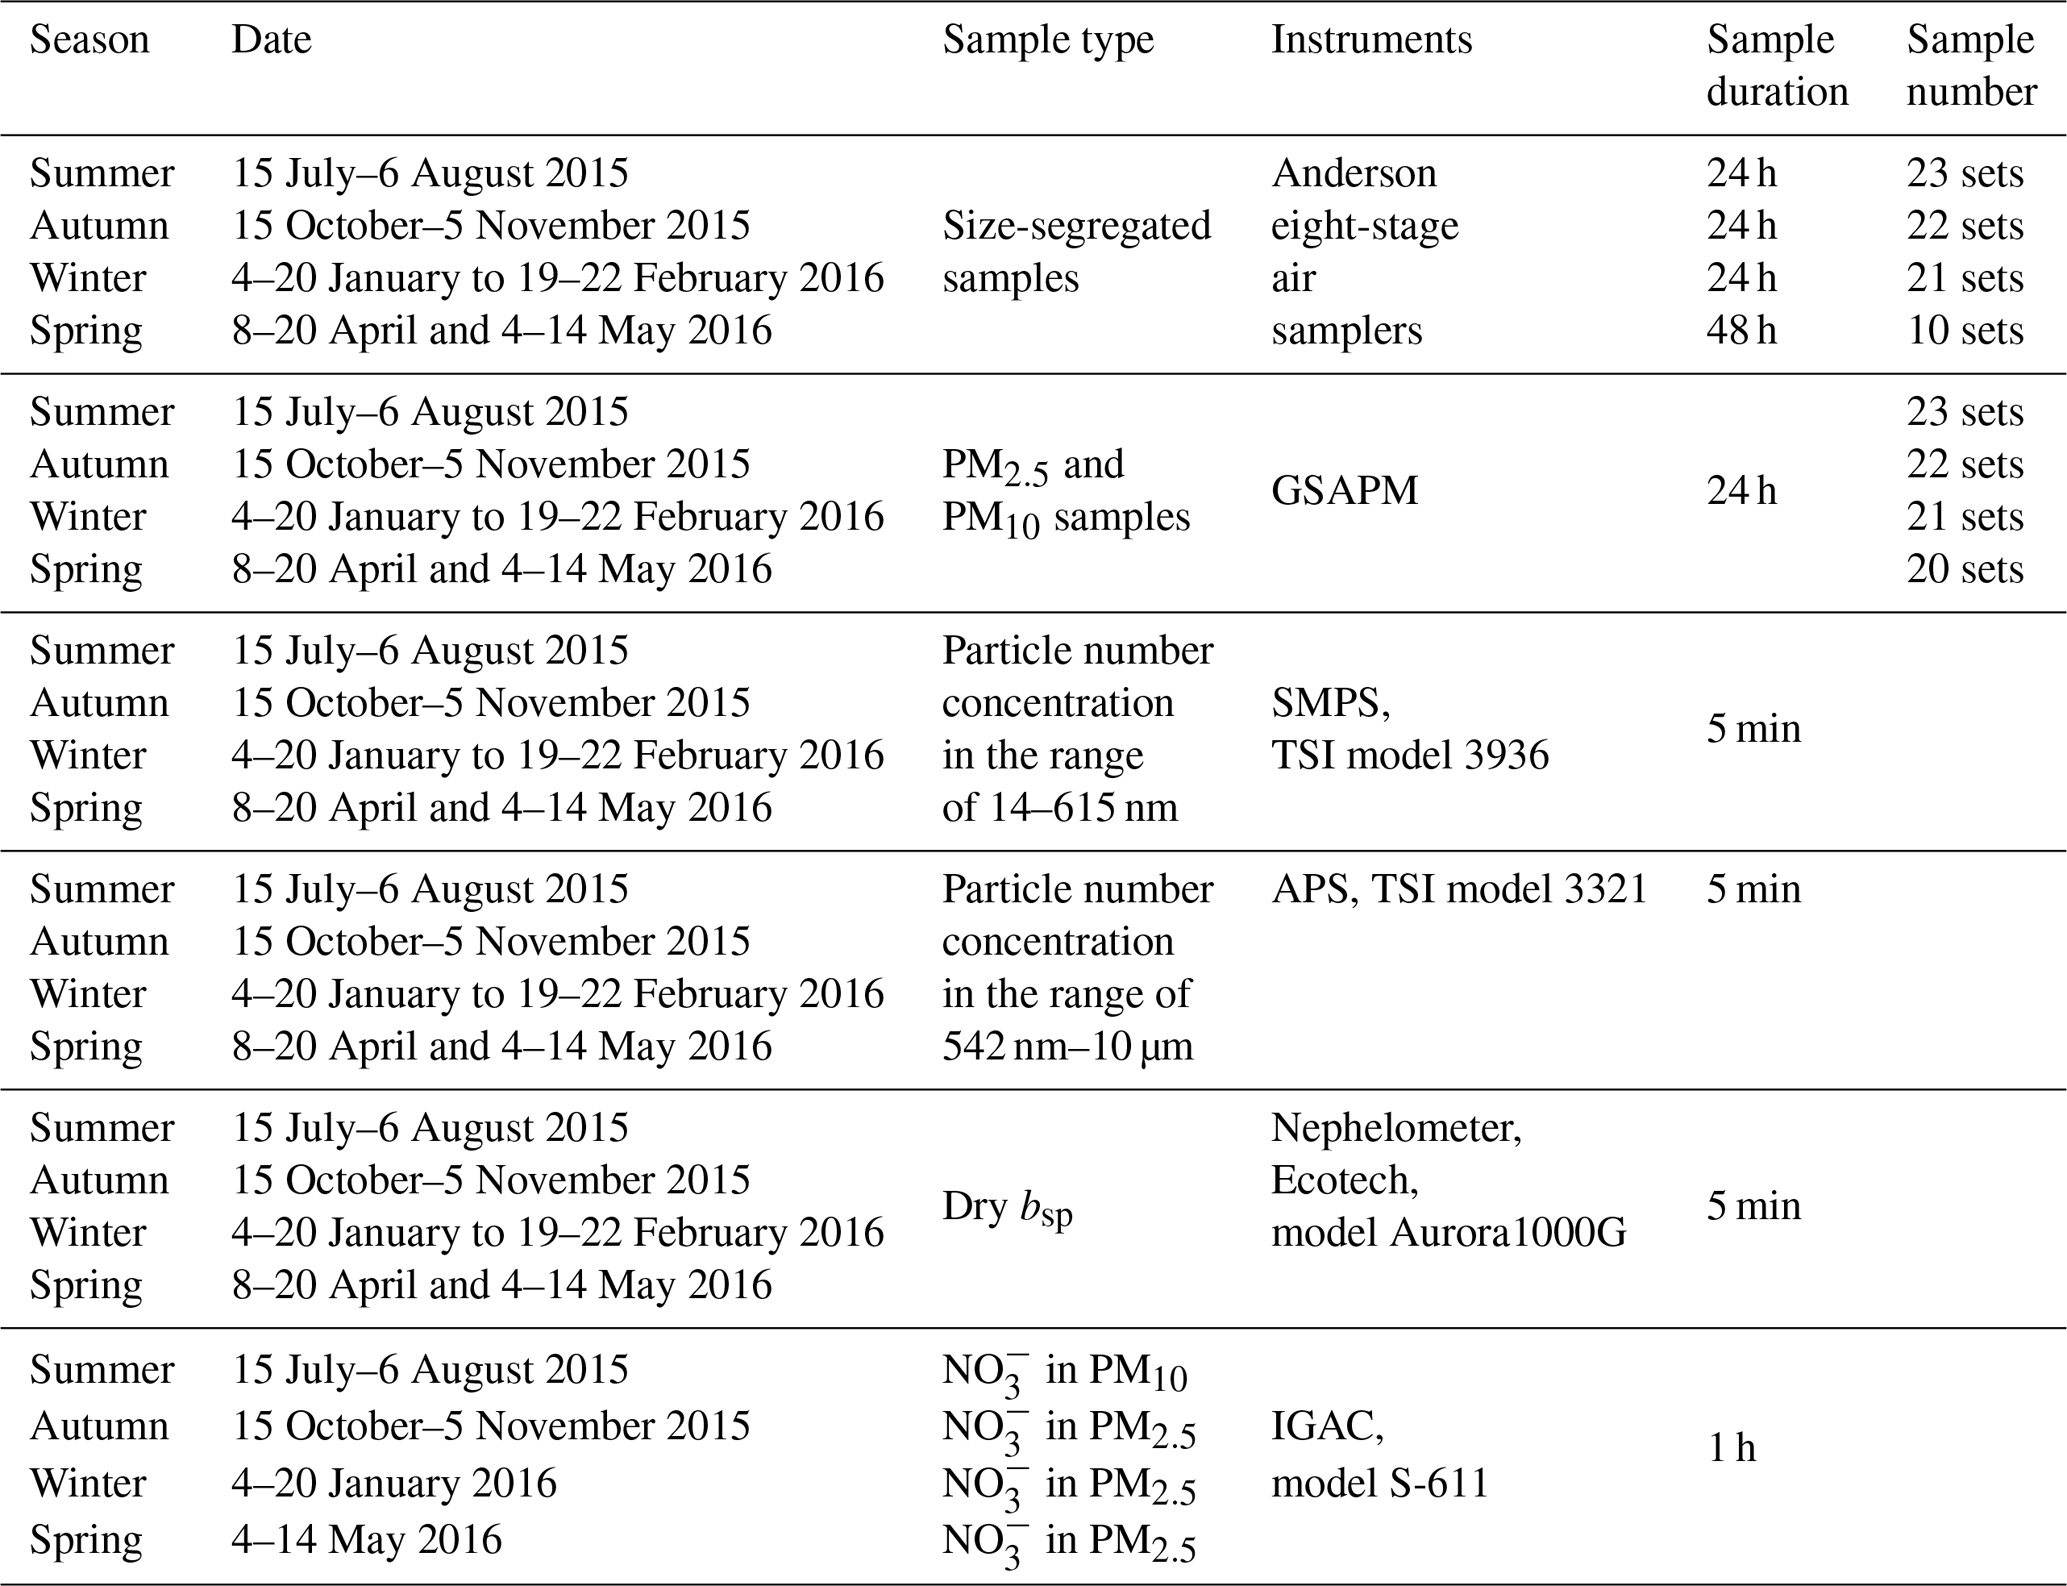
2.2 Field sampling
Size-segregated particle samples were collected using Anderson eight-stage air samplers with the cutoff points of 0.43, 0.65, 1.1, 2.1, 3.3, 4.7, 5.8 and 9.0 µm (Thermo Electron, US). Two sets of samplers were used alternatively, due to the need for daily clearance of the instruments. The samplers were operated at an airflow rate of 28.3 L min−1. The sampling flow rate was controlled by a flowmeter (Aalborg Inc., US). Samples were collected on 81 mm quartz-fiber filters (Whatman QM-A). Samples were collected during different seasons: 15 July–6 August 2015 (summer), 15 October–5 November 2015 (autumn), 4–20 January 2016 and 19–22 February 2016 (winter), and 8–20 April 2016 and 4–14 May 2016 (spring). Sampling duration was 48 h in spring and 24 h in the other seasons, with all sampling starting at 10:00 LT.
Bulk PM2.5 and PM10 samples were collected using two Gravisol Sequential Ambient Particulate Monitor (GSAPM) samplers (APM Inc., Korea) at a flow rate of 16.7 L min−1. Samples were collected on 47 mm quartz-fiber filter (Whatman QM-A). Sampling durations were the same as those for collecting size-segregated samples in every season. The sampling information is summarized in Table 1. Moreover, eight sets of blank samples were also collected for each of the size-segregated particles of PM2.5 and PM10 samples during the whole sampling period. Two sets of blank filters in each category were put in the samplers without flow for 24 h when the seasonal field campaigns finished. The aerosol-loaded filter samples were stored in a freezer at −18 ∘C before analysis to prevent volatilization of particles.
The blank water-soluble inorganic ions (WSII) (e.g., Na+, Ca2+) of quartz-fiber filter were slightly high in general. Thus, 47 and 81 mm quartz-fiber filters were first baked at 500 ∘C for 3 h to remove adsorbed organic vapors; they were then soaked in distilled–deionized water for 3 h for several times to remove WSII, until the background values were less than 0.01 mg L−1. Finally, the quartz-fiber filters were dried through baking at 200 ∘C. All blank quartz-fiber filters were stored in desiccators.
Particle number concentration for particles in the range of 14–615 nm in mobility diameter (Dp) was measured using a scanning mobility particle sizer (SMPS; TSI model 3936, TSI, Inc., St. Paul, MN) combined with a long differential mobility analyzer (DMA; TSI model 3080) and a condensation particle counter (CPC; TSI model 3010), and for particles in the range of 542 nm–10 µm aerodynamic diameter (Da) an Aerodynamics Particle Sizer (APS; TSI model 3321) was used, both at 5 min resolution. APS was calibrated using five sizes of solid spheres (polystyrene latex monodisperse). Dry bsp was measured using a single-wavelength-integrating nephelometer (Ecotech Pty Ltd, Australia, model Aurora1000G) at the wavelength of 520 nm at 5 min resolution. Zero calibration was performed every day with zero air, and a span check was done every 3 d using HFC-R134a gas.
To exclude the impact of particle hygroscopic growth on the measured size distribution and bsp, ambient air is forced to pass through three total suspended particulate (TSP) cyclones, and though stainless steel tubes and the Nafion driers prior to being sampled by the SMPS, APS and nephelometer. According to the method described in Kulkarni et al. (2011), particle losses in different sizes from the tube are plotted in Fig. S1 in the Supplement. Generally, particle losses in the condensation (0.1–0.4 µm), droplet (0.4–2.1 µm) and coarse modes (2.1–10 µm) were less than 1.3 %, 0.3 % and 0.1 %, respectively, suggesting that the particle losses from the tube were minimal. Ambient RH and temperature were measured by an automatic meteorological station (Vaisala Company, Helsinki, Finland, model MAWS201) at the SCIES site, and the seasonal average of these two meteorological parameters was 53 %–75 % and 15–29 ∘C, respectively. RH of aerosol samples was controlled to be lower than 30 % by sweeping dry air from a compressed air pump. was measured using an in situ instrument of gas and aerosol composition (IGAC, model S-611, Machine Shop, Fortelice International Co., Ltd., Taiwan) at a resolution of 1 h (Tao et al., 2018).
2.3 Lab chemical analysis and data quality assurance and control
Both 47 and 81 mm quartz-fiber filters were measured gravimetrically for particle mass concentration using a Sartorius ME 5-F electronic microbalance with a sensitivity of ±1 µg (Sartorius, Göttingen, Germany) after 24 h equilibration at a temperature of 23±1 ∘C and RH of 40±5 %. Microbalance was calibrated by 5, 200 and 5000 mg weights before weighting. Each filter was weighed at least three times before and after sampling. Differences among replicate weights were mostly less than 20 µg for each sample. Net mass was obtained by subtracting pre-weight from post-weight.
Three pieces of 0.526 cm2 punches from each 47 mm quartz filter samples and one-fourth of each 81 mm quartz filter samples were used to determine water-soluble inorganic ions. The extraction of water-soluble species from each filter was put into a separate 4 mL bottle, followed by 4 mL distilled–deionized water (with a resistivity of >18 MΩ) and then subjected to ultrasonic agitation for 1 h for complete extraction of the ionic compounds. The extract solutions were filtered (0.25 µm, PTFE, Whatman, US) and stored at 4 ∘C in pre-cleaned tubes until analysis. Cation (Na+, , K+, Mg2+ and Ca2+) concentration were determined by ion chromatography (Dionex ICS-1600) using a CS12A column with 20 mM methanesulfonic acid eluent. Anions (, , Cl− and F−) were separated on an AS19 column in ion chromatography (Dionex ICS-2100) using 20 mM KOH as the eluent. A calibration was performed for each analytical sequence. Procedural blank values were subtracted from sample concentrations. Method detection limits (MDLs) of ions were within the range of 0.001 to 0.002 mg L−1.
OC and EC were analyzed using a DRI model 2001 carbon analyzer (Atmoslytic, Inc., Calabasas, CA, US). An area of 0.526 cm2 punched from each 47 mm quartz filter and 1–4 dots punched from each 81 mm quartz filter were analyzed for four OC fractions (OC1, OC2, OC3 and OC4 at 140, 280, 480 and 580 ∘C, respectively, in a helium [He] atmosphere); OP (a pyrolyzed carbon fraction determined when transmitted laser light attained its original intensity after oxygen [O2] was added to the analyzed atmosphere); and three EC fractions (EC1, EC2 and EC3 at 580, 740 and 840 ∘C, respectively, in a 2 % O2∕98 % He atmosphere). Here, OC is operationally defined as OC1 + OC2 + OC3 + OC4 + OP and EC is defined as EC1 + EC2 + EC3 – OP for 47 mm samples. However, OC is operationally defined as OC1 + OC2 + OC3 + OC4 and EC is defined as EC1 + EC2 + EC3 for 81 mm samples due to extremely low OP level. Average field blanks were subtracted from each sample filter. MDLs of OC and EC were 0.41±0.2 and 0.03±0.2 µgC cm−2, respectively.
To obtain high-quality data of the size distributions of major chemical components, bulk PM2.5 and PM10 samples were synchronously collected and the same chemical components were analyzed. Generally, good correlations (R2>0.90) were found in the mass concentrations of the total particle and major chemical components (including total carbon, TC, and ) between the size-segregated samples (PM10 and PM2.1) and the GSAPM samplers (PM10 and PM2.5). The regression slopes were in the range of 0.91–1.05, suggesting good and acceptable data quality for the size distributions of the major chemical components (Fig. S2).
2.3.1 Data analysis methods
The ISORROPIA II model was run at the reserved mode (Fountoukis and Nenes, 2007) with input data of K+, Ca2+, Mg2+, , Na+, , , Cl−, RH (40 %) and temperature (25 ∘C) to estimate the size-resolved mass concentrations of NaCl, NaNO3, Na2SO4, NaHSO4, NH4Cl, NH4NO3, (NH4)2SO4, NH4HSO4, K2SO4, KHSO4, KNO3, KCl, MgSO4, Mg(NO3)2, MgCl2, CaSO4, Ca(NO3)2, CaCl2 and H2O. Several of these chemical species had extremely low mass concentrations and were thus excluded from the calculation of bsp. Generally, only NaCl, NaNO3, Na2SO4, NH4NO3, (NH4)2SO4, K2SO4, Ca(NO3)2, CaSO4 and H2O were used to estimate bsp in this study.
In this work, the cutoff point of 2.1 µm was chosen to separate the fine and coarse mode particles for investigating the impact of aerosol size distribution on their respective MSEs. Moreover, the cutoff sizes of <0.43 and 0.43–2.1 µm were used to separate the condensation mode and droplet mode, respectively. Particle MSE was estimated by the sum of bsp from individual chemical species divided by the sum of particle mass concentration according to the following equation:
where i is chemical species, j is chemical species size, Di,j is the chemical species diameter and C is chemical species mass concentration.
bsp was estimated by the Mie model as follows:
where Qsp is the single-particle scattering efficiency of chemical species (Fig. S3), mi,j is refractive index of chemical species (Table S1 in the Supplement), λ is 550 nm and Ni,j is number concentration of chemical species calculated by Eq. (3).
where N is chemical species number concentration, C is chemical species mass concentration, ρ is density of chemical species (Table S1) and D is geometric diameter (Dg) of chemical species.
The particle number concentration in aerodynamic diameter (Da) was converted to the particle number concentration in Dg (similar to Dp) according to the following equations:
where ρ represents the daily average density of particle, i is chemical species, mi is chemical species mass concentration in a bin and ρi is chemical species density. The seasonal average densities of particles are shown in Fig. S4.
Continuous size-distribution profiles of major chemical species are needed in order to accurately calculate bsp using Mie theory. To improve the resolution of bsp, 401 bins were used for chemical species ranging from 10 nm to 100 µm, with a constant ratio between the adjacent size bins, defined as . Further increasing the number of size bins does not have any significant impact on the results; e.g., the changes in bsp are smaller than 1 % even if the above ratio of 0.01 is replaced with 0.001. Continuous size-distribution profiles of major chemical species are obtained from the inversion of the measured mass concentration distribution in the size bins of the Anderson eight-stage air samplers, using the technique described in Dong et al. (2004). The key formulas for calculating the normal distribution of the density function were summarized as follows:
where D is log (Da) and μ and σ are the mean and standard deviation, respectively, of the log (Da) in the different modes. x is the inverse function value of the cumulative probability of a standard normal distribution in each bin, y is logarithm of Da lower limit (e.g., 0.43, 0.65, 1.1, 2.1, 3.3, 4.7, 5.8 and 9.0 µm) in each bin. An example of the calculation process was demonstrated in the Supplement.
However, this approach is not applicable for the condensation mode because there is only one size bin in this mode. To obtain the number concentrations of all the concerned chemical species in the condensation mode, MMADs (=10μ) of this mode are calculated according to the following equation:
where Da1 and Da2 represent the lower (0.10 µm, limits of detection of Anderson eight-stage air sampler) and upper (0.43 µm) boundaries of this size bin, respectively.
3.1 Size distributions of total particle mass and major chemical components
3.1.1 Total particle mass
Generally, any particle size distribution can be fitted into a combination of condensation, droplet and coarse modes (John et al., 1990). Continuous lognormal size distributions of particle mass including the condensation, droplet and coarse modes were calculated using the method described in Sect. 2.4 and are summarized in Table 2. On an annual average, 10±2 %, 48±7 % and 42±8 % of total mass in the size-segregated samples were in the condensation, droplet and coarse modes, respectively, with the average MMADs being 0.78±0.07 µm in the droplet mode and 4.57±0.42 µm in the coarse mode. These values were comparable to those observed by the Micro-Orifice Uniform Deposit Impactor (MOUDI) in the other cities (e.g., Shenzhen and Hong Kong) of the Pearl River Delta (PRD) region (Bian et al., 2014; Lan et al., 2011; Yu et al., 2010).
Table 2Summary of concentrations of chemical compositions in the different size modes.

a PM is particulate matter. b MMAD is mass mean aerodynamic diameter.
The estimated annual PM2.5 concentration based on the continuous lognormal size distribution was 36.4±13.2 µg m−3, which was close to the synchronously measured PM2.5 (36.8±15.3 µg m−3), although slightly higher than the sum of the mass concentrations (34.9±13.8 µg m−3) in the condensation and droplet modes. Thus, the fine (sum of condensation and droplet) mode particles can reasonably represent PM2.5. Seasonal average particle mass concentrations were evidently lower in summer than in the other seasons for the condensation and droplet modes and were similar during spring, autumn and winter for all the three modes. These results agree with the seasonal variations in PM2.5 observed at the same site in 2009–2010 (Tao et al., 2014).
3.1.2 Water-soluble inorganic ions
Generally, , and are the dominant WSIIs, especially in the condensation and droplet modes. They are mainly formed through aqueous-phase reactions in moisture conditions in the PRD region (Lan et al., 2011; Yu et al., 2010). As expected, 77±6 % , 46±16 % and 89±7 % of mass concentrations were in the droplet mode of the annual average due to their aqueous-phase formations (Table 2). Much lower fractions for than and in the droplet mode were mostly due to the high volatility of NH4NO3 (Zhang et al., 2008). The MMADs of the three ions in the droplet mode were in the range of 0.70–0.94 µm, comparable with MOUDI measurements (0.78–1.03 µm) conducted in the PRD region (Bian et al., 2014; Lan et al., 2011; Yu et al., 2010).
Small fractions of , and masses were distributed in the condensation mode, e.g., 12±4 %, 10±4 % and 6±5 %, respectively, on an annual average. The mass fractions of in the condensation mode shown above were much lower than those (24–29 %) observed in urban Guangzhou in 2006–2007 (Yu et al., 2010), suggesting gas-phase chemical reactions of SO2 have become less important in the formation of , likely due to the dramatic reduction of SO2 emissions in urban or suburban Guangzhou in the recent decade (Zheng et al., 2009, 2018).
Levels of 11±5 % , 44±18 % and 5±4 % of mass concentrations were distributed in the coarse mode. In general, mainly exists in the form of NH4NO3 in the condensation and droplet modes and associates with base cations in the coarse mode (e.g., Ca(NO3)2 and NaNO3) (Zhang et al., 2015a). More than 50 % mass concentrations were distributed in the coarse mode in summer and autumn when ambient temperatures were high. The MMADs of in the coarse mode were 4.15±0.52 and 4.36±0.31 µm in summer and autumn, respectively, slightly lower than those of Ca2+ (4.10±0.42 and 4.72±0.47 µm in the same seasons) but evidently higher than those of Na+ (3.60±0.19 and 3.64±0.27 µm) (Table 2). This suggests that NH4NO3 was prone to dissociate to HNO3(g) in summer and autumn due to the high ambient temperatures, with released HNO3(g) further reacting with mineral dust and to a lesser extent with sea salt particles. In comparison, the MMADs of in the coarse mode were in between of those of Ca2+ and Na+, likely due to uptake of H2SO4(g) by both mineral dust and sea salt particles (Zhang et al., 2015a). In contrast, the MMAD of in the coarse mode was 3.25±0.69 µm, much smaller than those of and , suggesting that in the coarse mode was likely from hygroscopic growth of in the droplet mode (Tian et al., 2014).
It is also worth mentioning that most of Cl− was distributed in the coarse mode and its MMAD (3.77±0.35 µm) was very close to that of Na+ (3.75±0.38 µm), especially in summer when air masses originated from the South China Sea (Tao et al., 2017b; Xia et al., 2017). The mole ratios of were less than 1.0 in all the seasons except spring due to the reactions between sea salt and acid gasses (HNO3(g) and H2SO4(g)) (Zhuang et al., 1999a). The excess Cl− in the coarse mode in spring was likely due to the aged biomass burning particles from southeastern Asia (Zhang et al., 2015c). In fact, the concentration of the typical biomass burning tracer K+ in the coarse mode was higher in spring than in the other seasons (Fig. S5). In any case, sea salt was mainly distributed in the coarse mode rather than the droplet mode in urban Guangzhou.
3.1.3 OC and EC
OC and EC in fine particles can be produced from both primary emissions of vehicle exhaust, coal combustion, biomass burning and secondary formation (Chow et al., 2011; Gentner et al., 2012, 2017; Hallquist et al., 2009; Zheng et al., 2006). In general, fresh OC and EC particles emitted from vehicle exhaust, coal combustion and biomass burning should be distributed in the condensation mode (Schwarz et al., 2008; Zhang et al., 2012b). Only 13±4 % of OC and 31±7 % of EC mass concentrations were distributed in the condensation mode in the present study (Table 2). OC∕EC ratios were in the range of 0.9–1.6 in the condensation mode, suggesting that vehicle exhaust was the dominant source of OC and EC in this particle size range (Huang et al., 2006a; Schwarz et al., 2008; Shiraiwa et al., 2007; Watson et al., 2001; Wu et al., 2017). Totals of 62±9 % of OC and 55±7 % of EC mass concentrations were distributed in the droplet mode (Table 2), similar to that of . These numbers were similar to those observed in the other cities of the PRD region and were previously identified to be mainly caused by in-cloud aerosol processing (Huang et al., 2006b). Cloud processing indeed plays an important role in forming droplet mode aerosols in urban Guangzhou (Tao et al., 2018). OC∕EC ratios were in the range of 2.2–3.2 in the droplet mode, much higher than those in the condensation mode, suggesting that OC in the droplet mode was mainly aged or secondary particles (Day et al., 2015; Huang et al., 2006a; Wu and Yu, 2016).
The MMADs of OC and EC in the droplet mode were 0.76±0.07 µm and 0.66±0.08 µm, respectively, which were slightly lower than those (0.7–1.0 µm for OC and 0.8–1.0 µm for EC) found in earlier studies in the PRD region (e.g., Guangzhou, Hong Kong and Shenzhen) (Lan et al., 2011; Yu et al., 2010). Noticeably, the MMADs of OC and EC in the droplet mode were very close to those (0.73 µm for OC and 0.77 µm for EC) measured in summer at a suburban site in Hong Kong, where the loadings of the dominant chemical components (e.g., OC, EC and ) were low (Yu et al., 2010).
Road dust and biogenic aerosols were generally considered the major sources of OC and EC in the coarse mode (Ho et al., 2003; Zhang et al., 2015b). Significant fractions of OC (25±8 %) and EC (14±7 %) mass concentrations were distributed in the coarse mode. These numbers were comparable with those (13 %–38 % for OC and 4 %–16 % for EC) measured at suburban sites of Guangzhou, Shenzhen and Hong Kong (Lan et al., 2011; Yu et al., 2010) but were lower than those (51 %–57 % for OC and 17 %–21 % for EC) measured in urban Guangzhou in 2006-2007. The MMADs of OC (3.73±0.58 µm) and EC (3.69±0.65 µm) in the coarse mode were close to those (3.8–4.3 µm for OC and 3.7–4.1 µm for EC) measured in suburban Hong Kong, although smaller than those (4.8–5.2 µm for OC and 5.0–5.2 µm for EC) measured in suburban Shenzhen and urban Guangzhou (Lan et al., 2011; Yu et al., 2010). These results suggested that the MMADs of OC and EC might decrease with their decreasing coarse mode mass fractions. Annual average PM10 concentrations (46 µg m−3) in 2015–2016 in the PRD region were about 40 % lower than those (76 µg m−3) in 2006–2007, which further supports the above hypothesis.
3.2 Closure of particle mass, number concentration and bsp
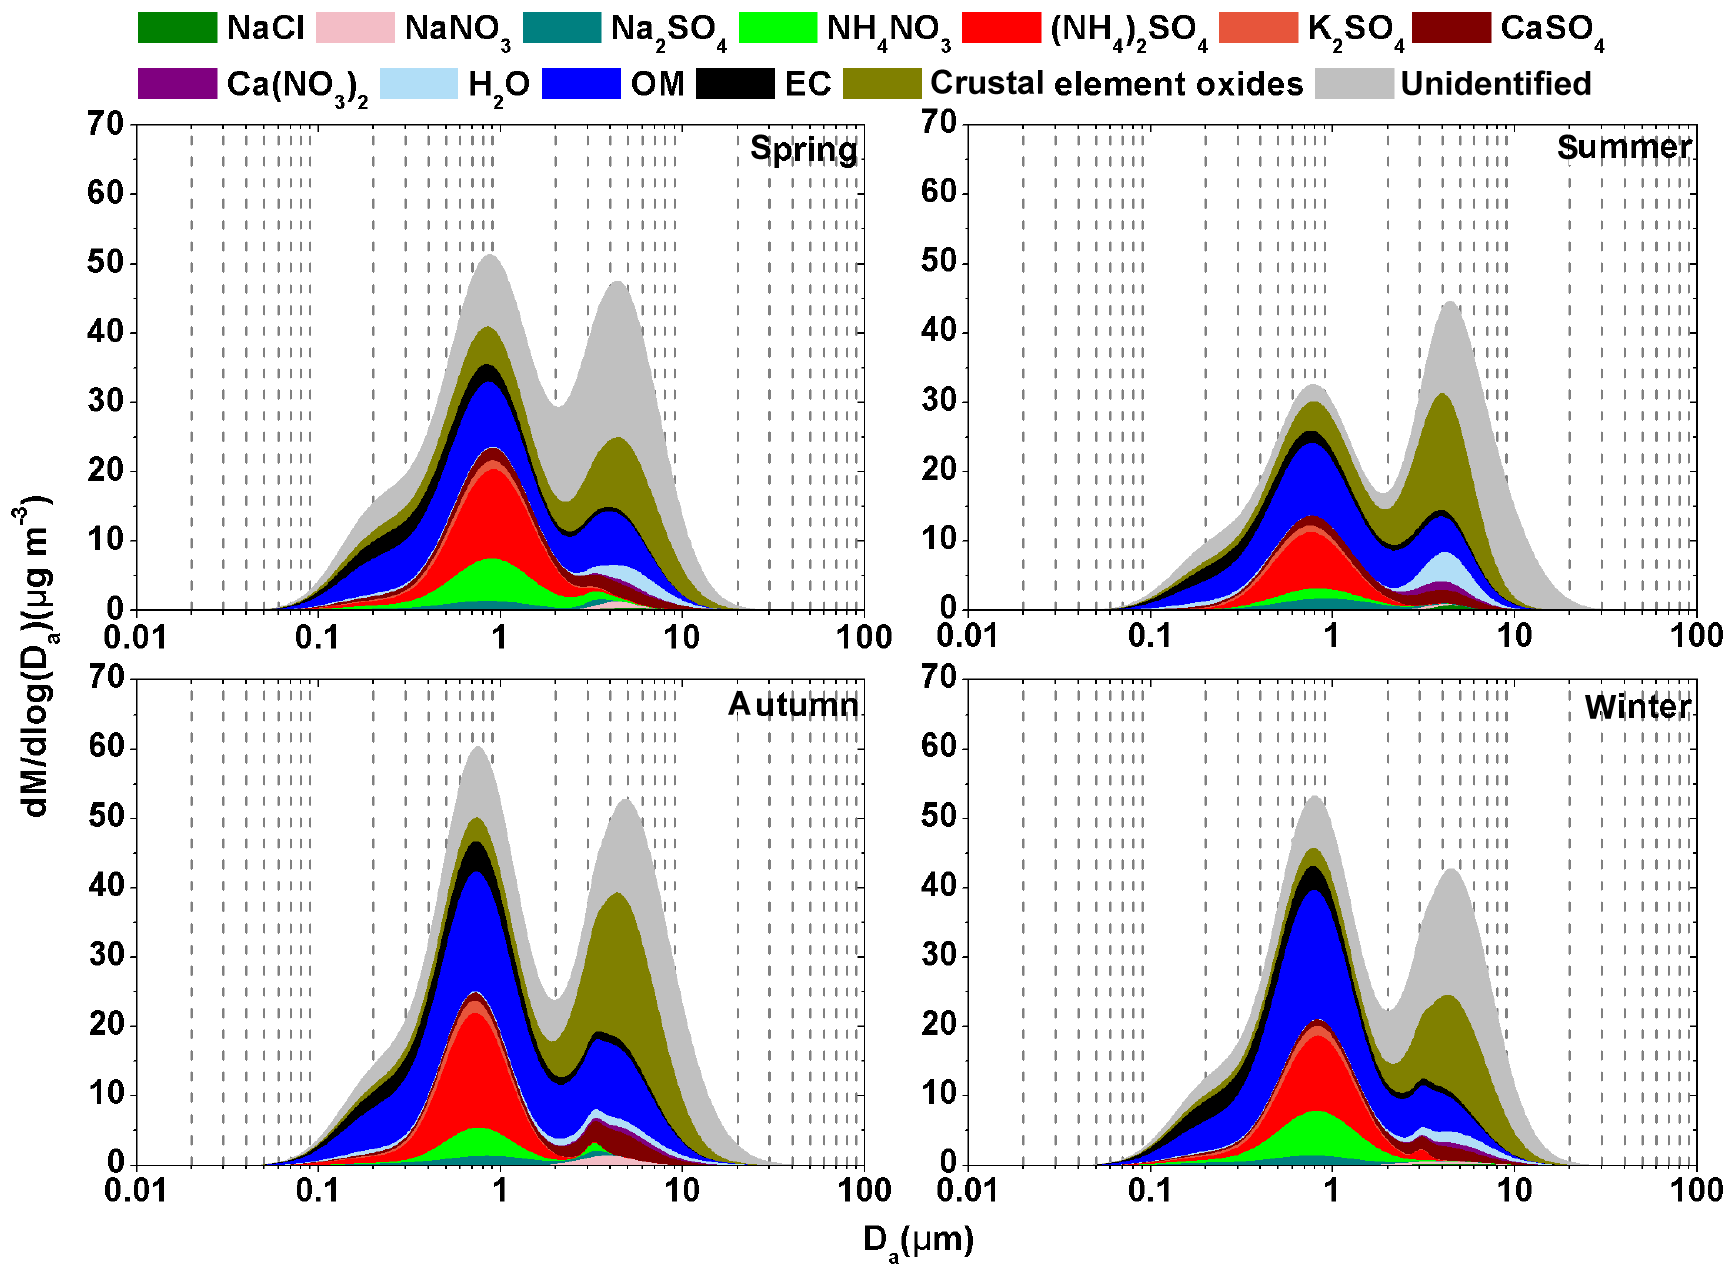
Figure 2Continuous lognormal size distributions of chemical species mass concentrations over four seasons (dlogDa=0.01 µm).
3.2.1 Closure of particle mass concentration
To investigate the impact of chemical species in different size modes on bsp, particle mass concentrations in the different modes were first reconstructed based on mass concentrations of individual known chemical components. The dominant water-soluble inorganic species including NaCl, NaNO3, Na2SO4, NH4NO3, (NH4)2SO4, K2SO4, CaSO4 and Ca(NO3)2 were determined using the ISORROPIA II thermodynamic equilibrium model as mentioned in Sect. 2.4. A ratio of OM to OC of 1.4, 1.6 and 1.6 would be appropriate for the condensation, droplet and coarse mode, respectively, which was based on the findings of a previous study that suggested an average OM∕OC ratio of 1.57 and a range of 1.4–1.8 in an urban environment of the PRD region (He et al., 2011). In our previous study (Tao et al., 2017b), mass concentration of crustal element oxides in PM2.5 was estimated from the measurements of five crustal elements (Al, Si, Ca, Fe and Ti) in urban Guangzhou. This approach cannot be used in the present study due to the lack of crustal elements measurements. Alternatively, crustal element oxides mass concentration was estimated from Ca2+ mass concentration because of their good correlations (slope =0.053, R2=0.79) as was found in a previous study (Fig. S6) (Tao et al., 2017b). It was suggested that Ca2+ accounted for 5.3 % of crustal element oxides in PM2.5 in urban Guangzhou, a value that is close to the content of Ca2+ (5.0 %) in soil dust source profiles (representing crustal element oxides) in PM2.5 in cities of southern China (Sun et al., 2019). Because CaSO4 and Ca(NO3)2 were mainly from the reactions between calcium oxide and acids (e.g., H2SO4 and HNO3), the estimated mass concentration of crustal element oxides needs to deduct those of CaSO4 and Ca(NO3)2. On an annual average, the estimated crustal element oxides accounted for 8±2 %, 10±4 % and 29±5 % of the total particle mass concentrations in the condensation, droplet and coarse mode, respectively. The reconstructed mass concentrations accounted for 79±3 %, 82±6 % and 57±6 % of the total in the condensation, droplet and coarse mode, respectively.
As shown in Fig. 2, OM, EC, (NH4)2SO4, NH4NO3 and crustal element oxides dominated in different modes over four seasons. For example, OM and EC accounted for 31 %–39 % and 14 %–19 %, respectively, of particle mass in the condensation mode, OM, (NH4)2SO4, crustal element oxides and NH4NO3 accounted for 19 %–34 %, 18 %–22 %, 6 %–15 % and 4 %–11 %, respectively, in the droplet mode, and crustal element oxides, OM and CaSO4 accounted for 22 %–34 %, 12 %–17 % and 4 %–5 %, respectively, in the coarse mode. In addition, the total of the other identified chemical species accounted for less than 10 % of the total particle mass in every mode. For example, Na2SO4 and K2SO4 were mainly distributed in the droplet mode and together they accounted for only 2 %–5 % of the particle mass in this mode. NaCl, NaNO3 and Ca(NO3)2 were mainly distributed in the coarse mode and each of these species accounted for less than 2 % of the total particle mass in this mode.
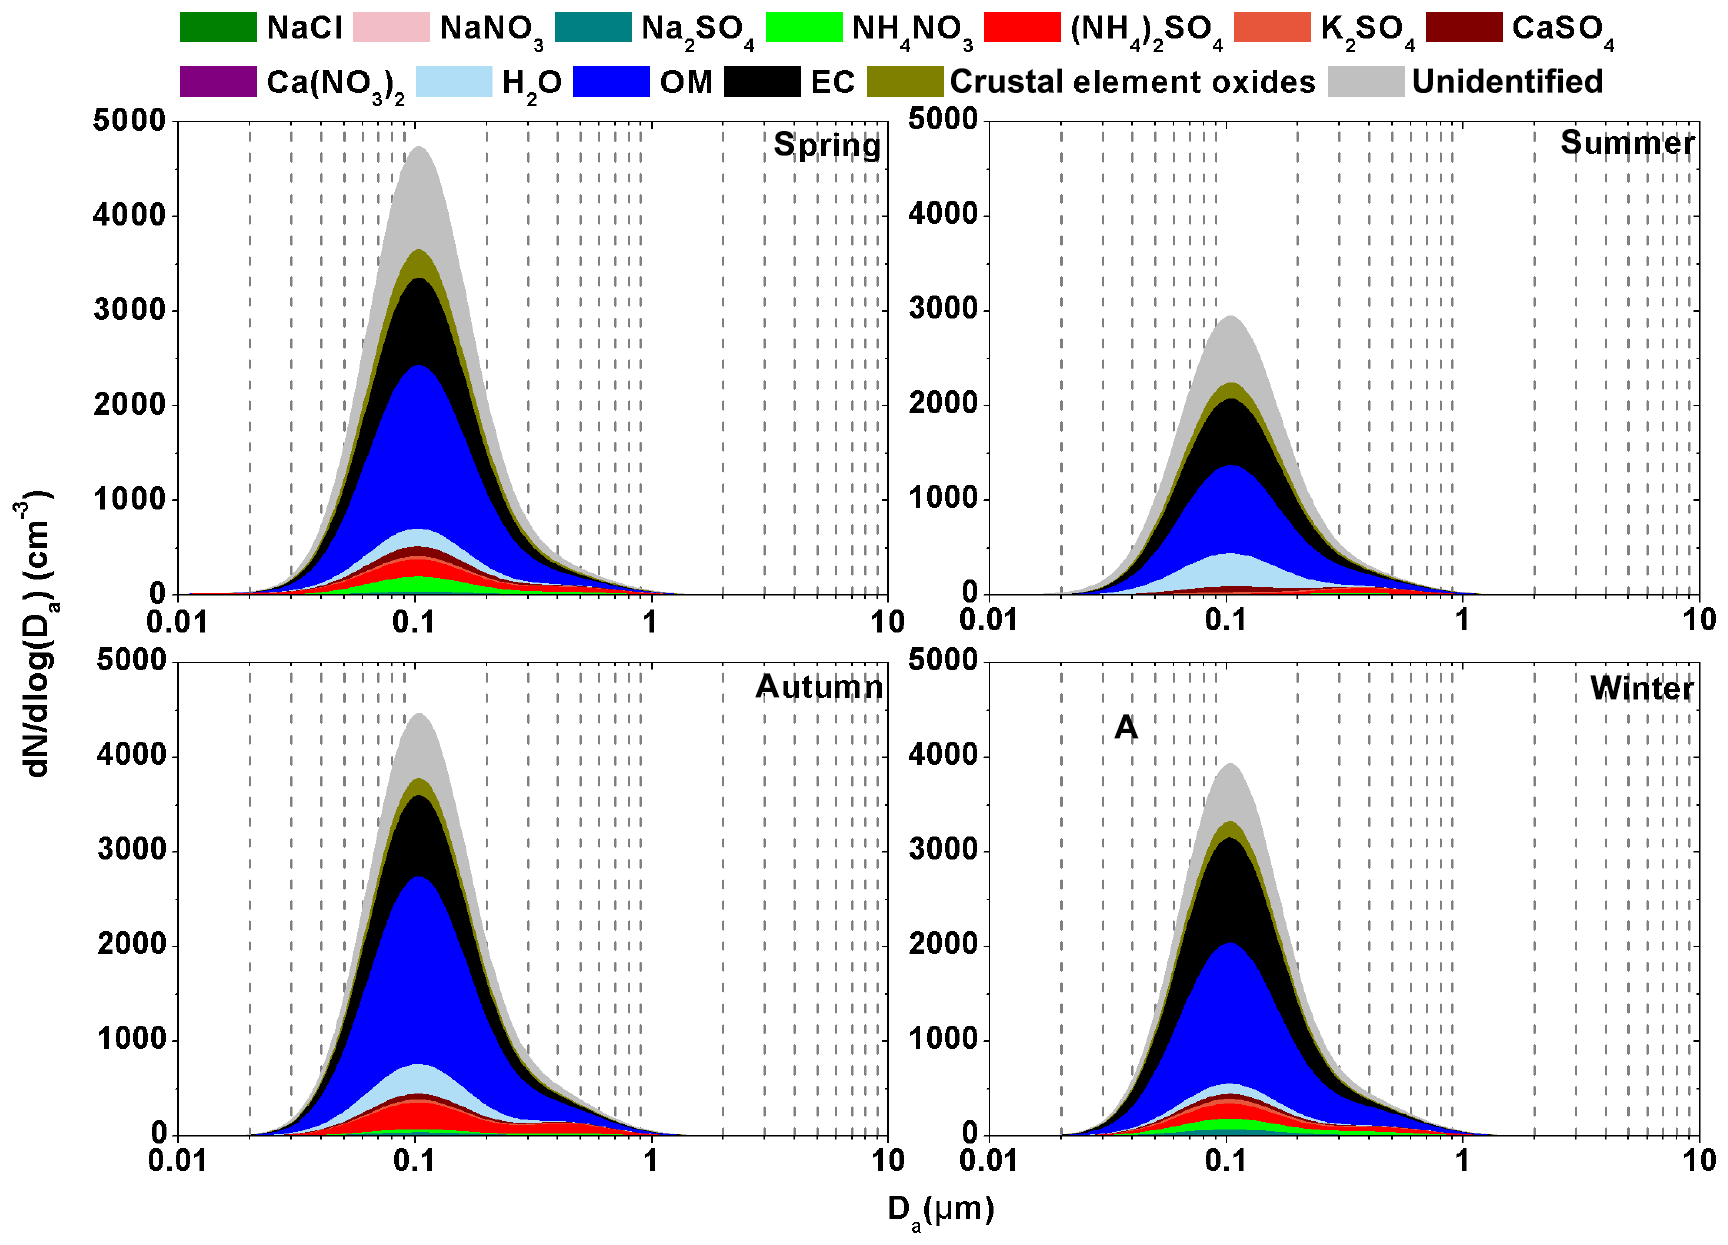
Figure 3Continuous lognormal size distributions of the estimated chemical species number concentrations over four seasons (dlogDa=0.01 µm).
3.2.2 Closure of particle number concentration
To estimate the contribution of individual chemical species to bsp using Mie theory, number size distributions of the dominant chemical species were needed and were calculated according to the method described in Sect. 2.4. As shown in Fig. 3, most chemical species (except (NH4)2SO4 in summer) had much higher number concentrations in the condensation mode than the droplet or coarse mode. The estimated number of mean aerodynamic diameters (NMADs) of number concentrations of individual chemical species are mainly distributed in the range of 100–120 nm. The estimated NMADs of particle number concentrations (sum of individual chemical species number concentrations in the same size bin) were close to about 100 nm in the four seasons, which was larger than the NMADs (30–70 nm) of the simultaneously measured particle number concentrations by the SMPS and APS (Fig. 4). This was because SMPS and APS collected dried particles while the size-segregated sampler collected ambient particles. Dp of particles measured by SMPS can be converted to Da using the average particle density calculated from the synchronously measured size-segregated individual chemical species mass concentrations and densities, according to the method described in Sect. 2.4. In any case, the NMADs of particle number concentrations were less than 100 nm, regardless of whether they used SMPS and APS measurements or the estimated size-segregated chemical species mass concentrations.
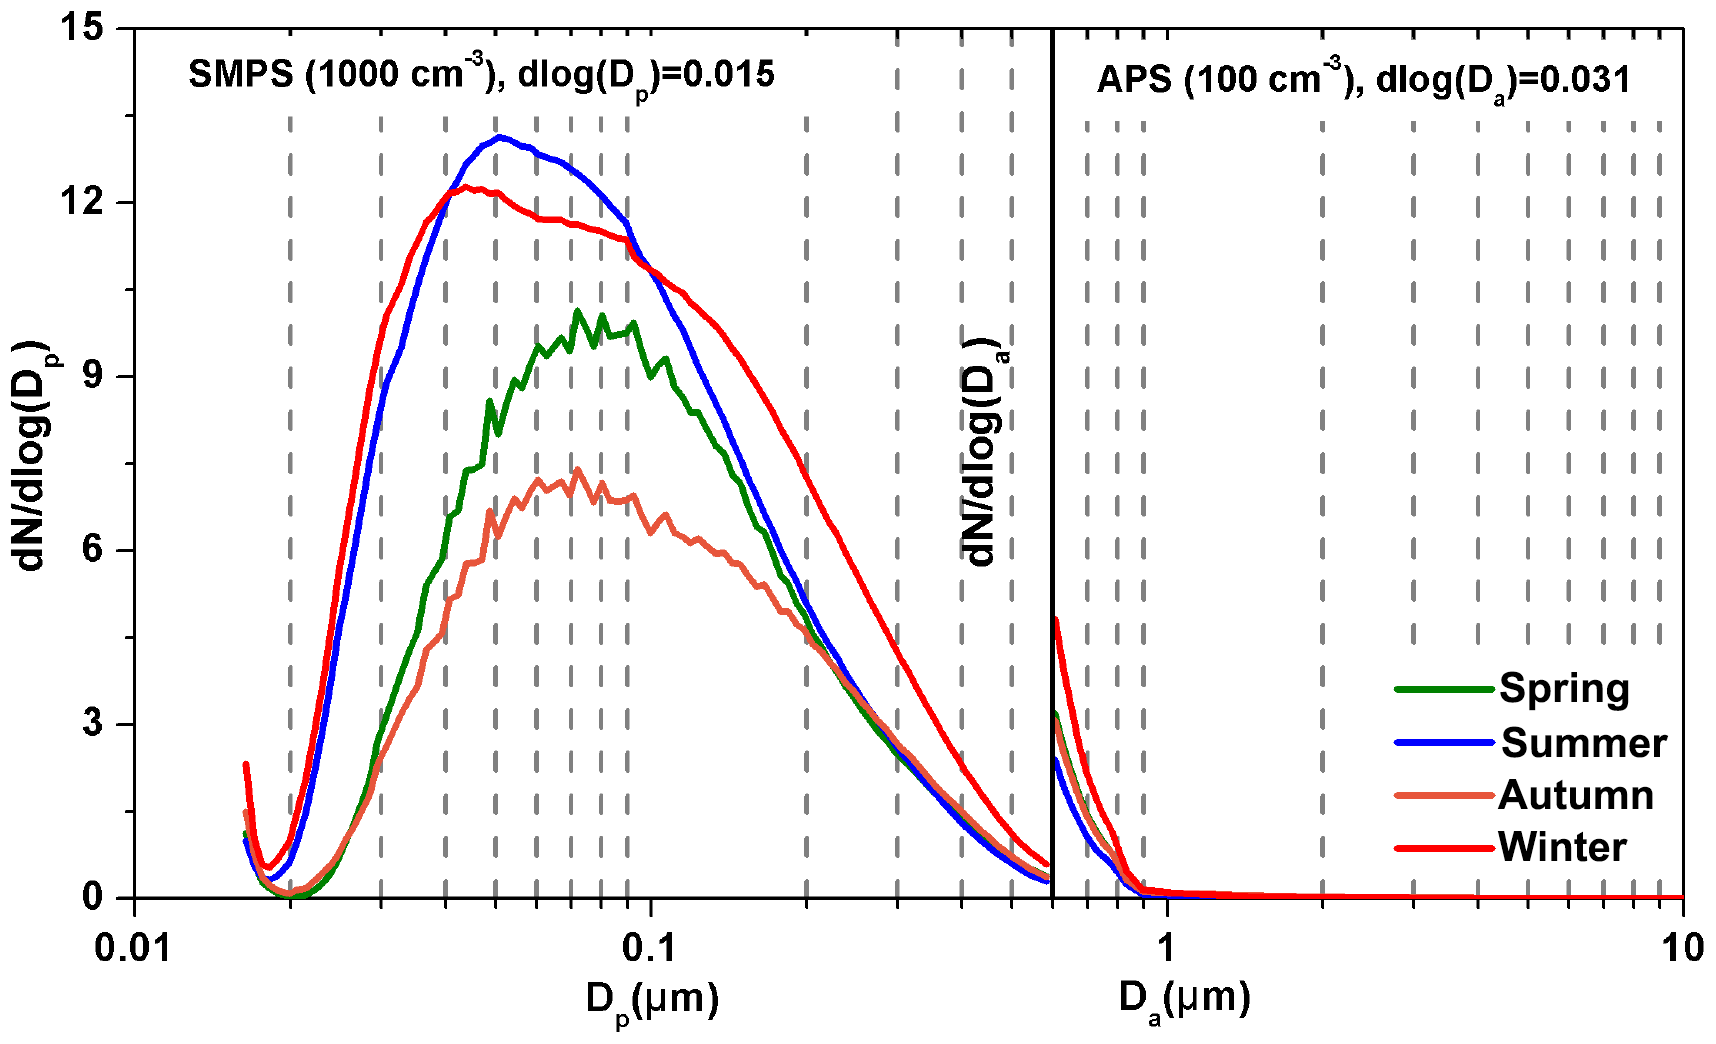
Figure 4Continuous lognormal size distributions of the measured particle number concentrations over four seasons.
As shown in Figs. 3 and 4, most of particle numbers were in the range of 10–400 nm and either observed by the SMPS or estimated from the size-segregated chemical species mass concentrations. Total particle number concentration in the range of 10 nm–10 µm measured by the SMPS and APS were 7038±2250, 9774±1471, 5694±1942 and 10801±2986 cm−3 in spring, summer, autumn and winter, respectively, which were 1.09±0.24, 2.66±0.48, 1.05±0.20 and 2.33±0.67 times those estimated by the size-segregated chemical species mass concentrations.
NMADs estimated from the size-segregated chemical species mass concentrations were close to those measured by the SMPS and APS in spring and autumn, resulting in the close estimation of particle number concentrations to the measured ones. In contrast, the estimated particle number concentrations from the size-segregated chemical species mass concentrations were evidently lower than those measured by the SMPS and APS in summer and winter, due to the much higher NMADs (100 nm) estimated from the size-segregated chemical species mass concentrations than those (about 30 or 40 nm) measured by the SMPS and APS.
To exclude the large uncertainties in the estimated particle number concentration caused by condensation mode particles (which were due to the design flaws of size-segregated sampler), particles smaller than 430 nm were not included in the calculation below. On an annual average, the estimated particle number concentrations in the range of 430 nm–10 µm, based on the size-segregated chemical species mass concentrations, were 33±42 % higher than those measured by the SMPS and APS. This was likely because particles in the droplet mode may shift to the smaller sizes (<430 nm) during the drying process in the Nafion tube. Correlation coefficients between the estimated and measured particle number concentrations in the range of 430 nm–10 µm were significantly improved when the intercepts in the linear regression equations were retained. To some extent, the intercepts represent the measurement errors of SMPS and APS and estimation errors of the inversion technique and ISORROPIA II models. In any case, good correlations (R2>0.81) between the estimated daily particle number concentrations and the measured ones were found and the slopes ranged from 0.79 to 1.03 in the four seasons (Fig. 5). These results suggested that the estimated particle number concentrations were acceptable in the range of 430 nm–10 µm, noting that particles in this size range dominate particle scattering efficiency.
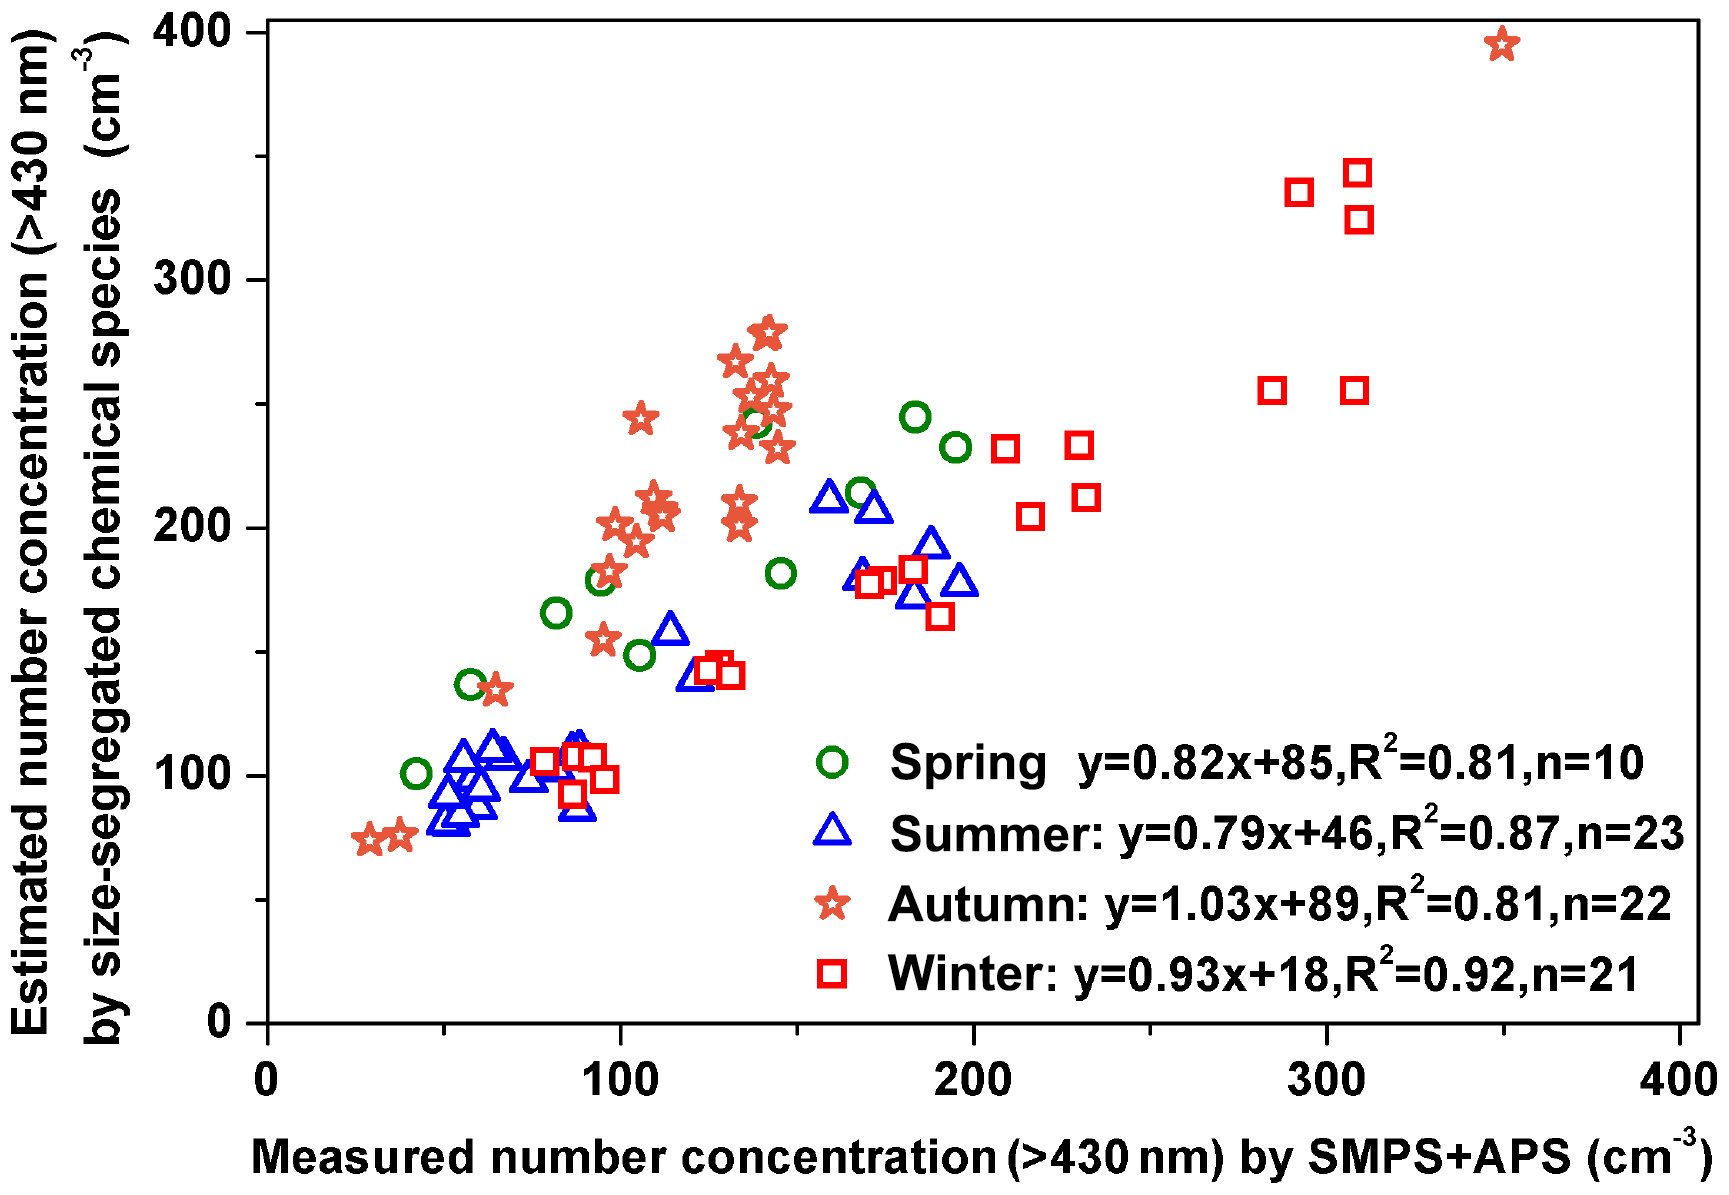
Figure 5Correlations between the estimated and SMPS-measured and APS-measured particle number concentrations (430 nm–10 µm) over four seasons.
3.2.3 Closure between the measured and estimated bsp
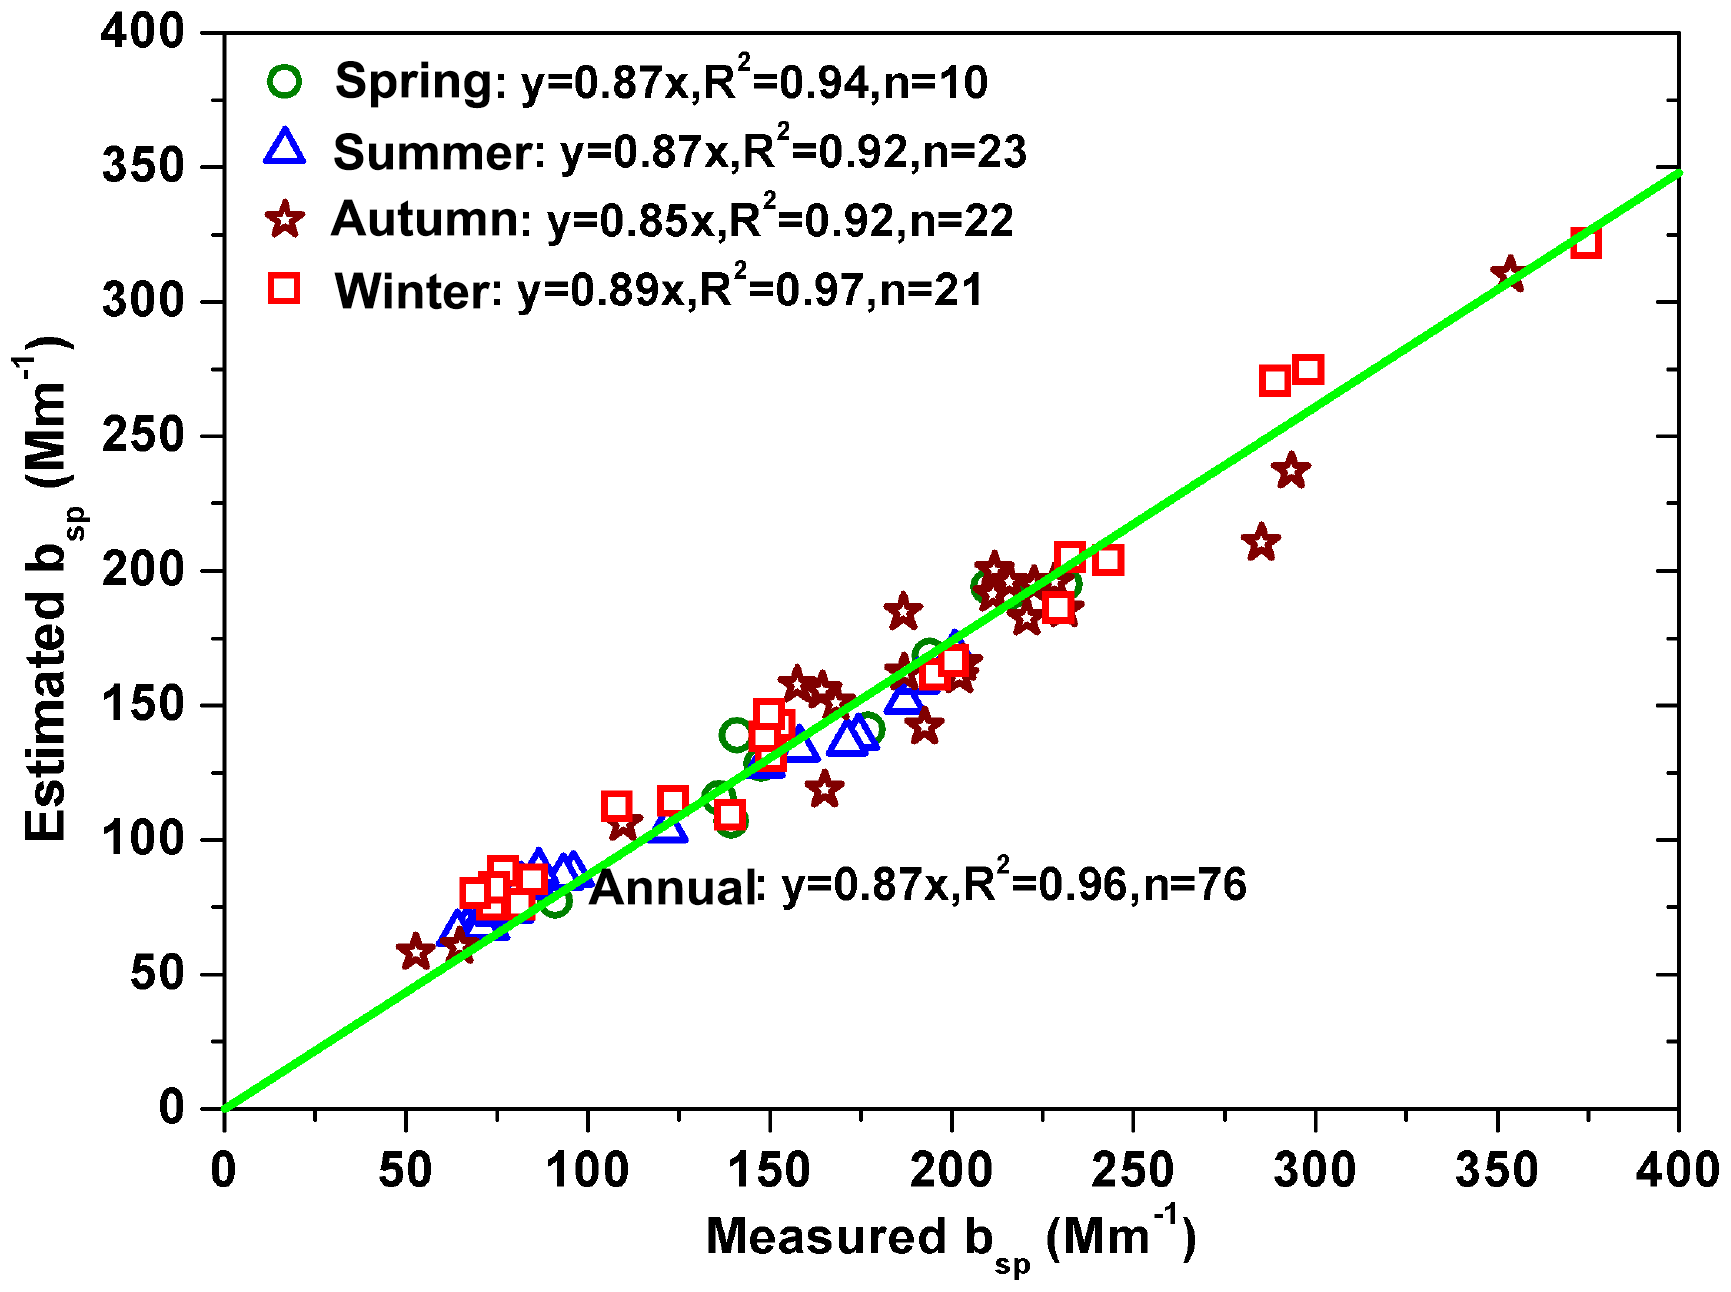
Daily bsp was estimated using a Mie model (in Sect. 2.4) with input parameters including refractive indices, densities and number concentrations in 401 bins of chemical species (NaCl, NaNO3, Na2SO4, (NH4)2SO4, NH4NO3, K2SO4, CaSO4, Ca(NO3)2, H2O, OM, EC, crustal element oxides and unidentified fraction). The refractive indices and densities of the above chemical species are summarized in Table S1. Although the number concentrations in the condensation mode were underestimated, good correlations (R2>0.92) were found between the measured and estimated bsp with the slopes being 0.87, 0.87, 0.85 and 0.89 in spring, summer, autumn and winter, respectively (Fig. 6). On an annual arithmetic average, the estimated bsp can explain 91±10 % of the measured bsp. The residual fractions were likely related to the chosen convert factor between OM and OC, measurements and sampling errors of chemical species (especially ), errors from the models (ISORROPIA II model, Mie model and the inversion technique method), and measurement errors caused by the size-segregated sampler (Vaughan, 1989). Magnitudes of the uncertainties caused by these sources are discussed below.
Although the conversion factor of 1.6 between OM and OC was reasonable in urban environment, a value of as high as 1.8 was found in literature (He et al., 2011). In addition, OC mass concentrations were likely underestimated due to the OC∕EC protocol for size-segregated samples. Nevertheless, the estimated bsp can only be increased by less than 3 % if increasing the convert factor to 1.8 in the droplet mode. Note that a previous study at the Fresno Supersite increased the estimated bsp by about 10 % when increasing the convert factor from 1.4 to 1.8, likely due to the high mass fraction of OC in fine particle at this site (Watson et al., 2008).
Different from the other chemical species, NH4NO3 can dissociate into HNO3(g) and NH3(g) during the filter gravimetric weighing process under dry conditions. To evaluate the evaporative loss of NH4NO3, synchronous inline data of were also measured by an in situ gas and aerosol composition monitoring system at hourly temporal resolution (Fig. S7). Seasonal average concentrations were 42 % (PM2.5), 39 % (PM10), 42 % (PM2.5) and 19 % (PM2.5) less from filter measurements than inline measurements in spring, summer, autumn and winter, respectively. Adjusting the filter data using the above ratios can increase the estimated bsp by 7 %, 2 %, 4 % and 2 % in the respective season.
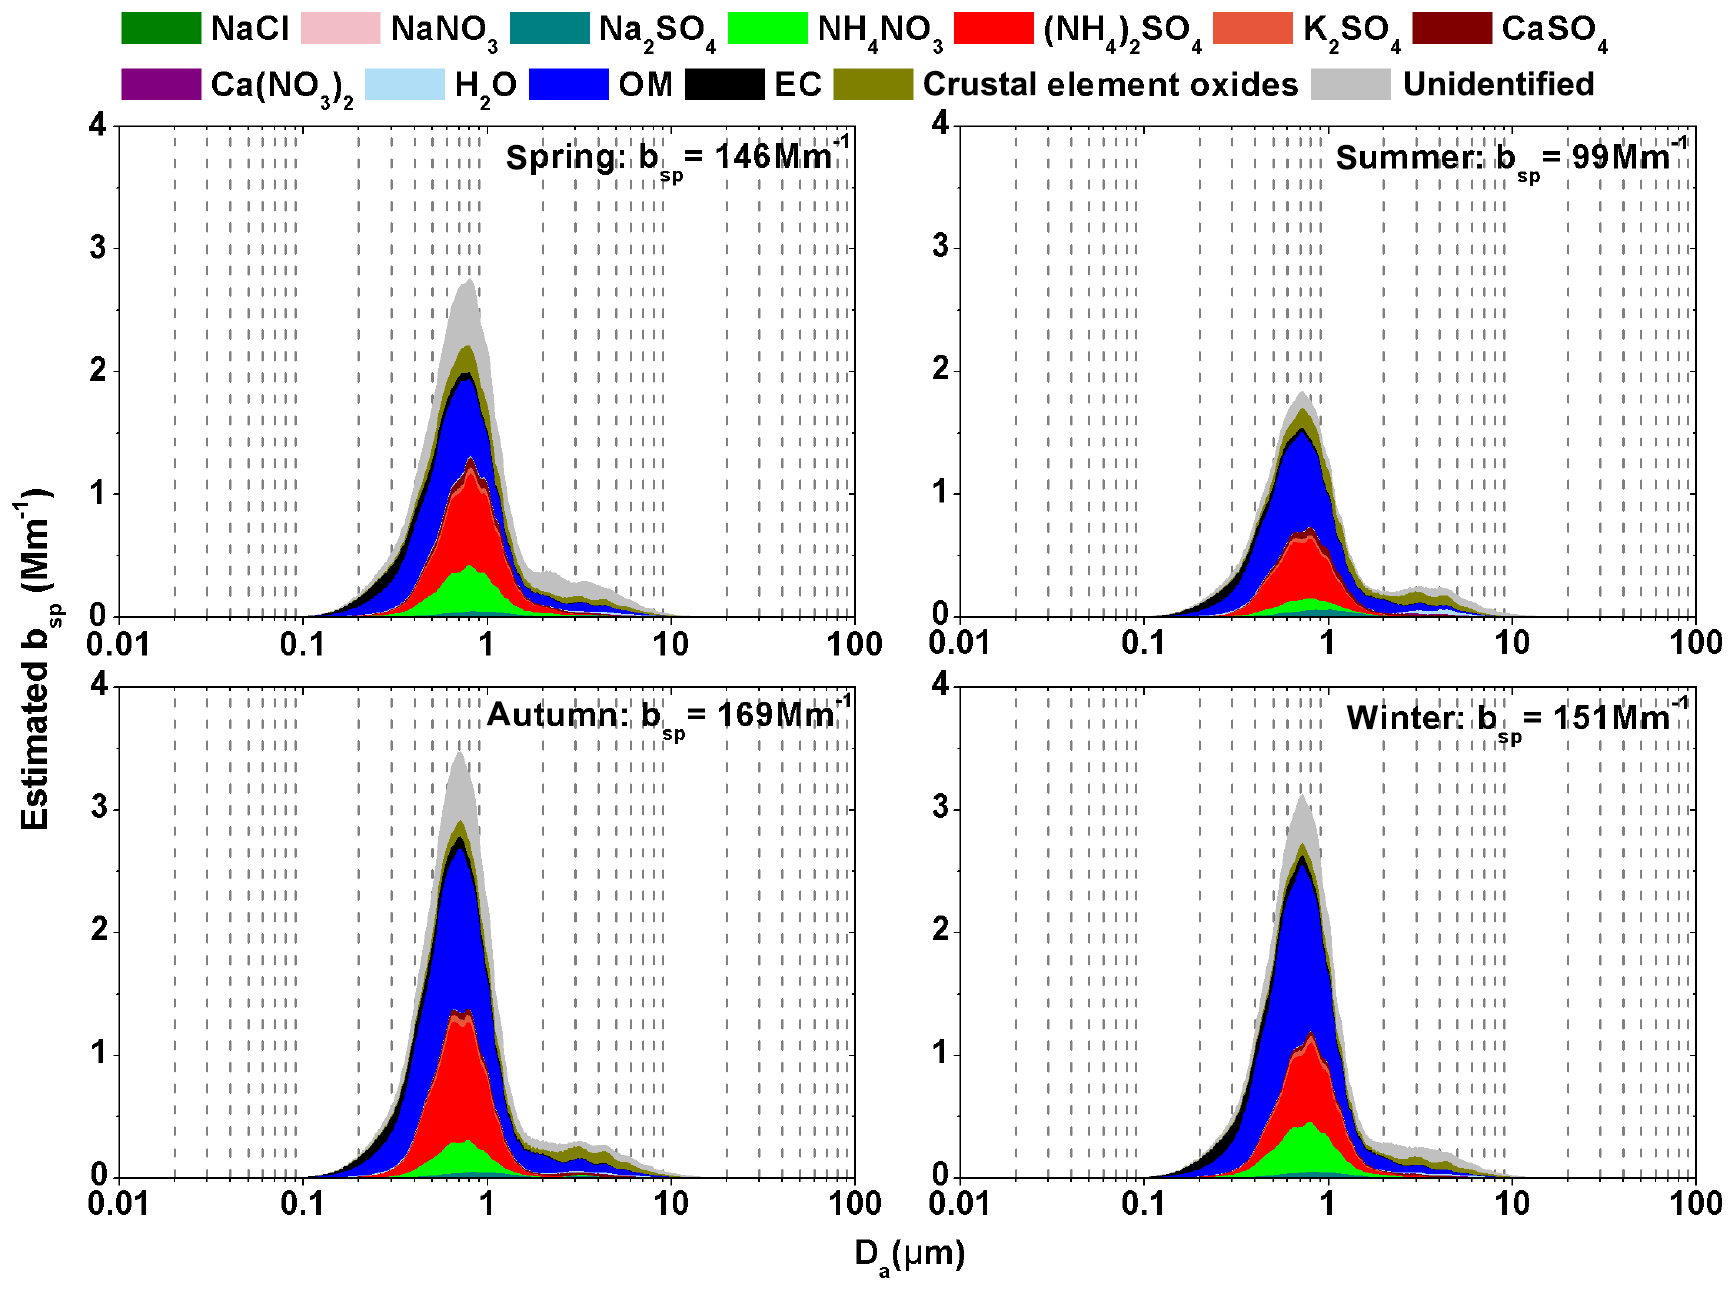
Figure 7The contributions of continuous lognormal size distributions of chemical species on the estimated bsp over four seasons (dlogDa=0.01 µm).
Meanwhile, the measured bsp could also be underestimated due to the dissociation of NH4NO3 during the dry processes of ambient particles through the Nafion dryer. A previous study indicated the measured bsp being decreased by less than 10 % due to the dissociation of NH4NO3 in a heated nephelometer (Bergin et al., 1997). In the present study, the chamber temperatures of nephelometer were less than 300 K, and the particle residence time in both the Nafion dryer and the nephelometer chamber was about 7 s. Thus, the bias in the measured bsp should be less than 2 % in any season according to the relationship among the loss of bsp, residence time and the temperature in chamber in a previous study (Bergin et al., 1997). Combining all of the above-mentioned factors, the adjusted estimated bsp would increase to the level of 92 %, 87 %, 87 % and 89 % of the measured bsp in spring, summer, autumn and winter, respectively. This means the above methods for estimating bsp were reasonable with the adjusted estimated values explaining 87 %–92 % of the measured values after the filter-based concentrations were adjusted based on the inline data. Thus, the errors from the models and size-segregated samplers may account for the remaining 8 %–13 % of the measured bsp. Moreover, the size distributions would be different under dry and ambient conditions due to the particle hygroscopic properties. In fact, the NMADs of particles measured by SMPS and APS under dry conditions were lower than those measured by the size-segregated sampler under ambient conditions, according to Sect. 3.2.2. Thus, the estimated bsp based on size distributions of chemical species would be, to some extent, systematically higher than the measured bsp under dry conditions.
Generally, the estimated seasonal average bsp were 146±40, 99±33, 169±54 and 151±71 Mm−1 in spring, summer, autumn and winter, respectively (Fig. 7). The particles in the condensation, droplet and coarse modes contributed 6 %–7 %, 81 %–86 % and 8 %–12 %, respectively, to the estimated bsp. OM and EC were the dominant contributors, accounting for 32 %–41 % and 30 %–37 %, respectively, of the estimated bsp in the condensation mode. OM and secondary inorganic aerosols (sum of (NH4)2SO4 and NH4NO3) were the dominant contributors, accounting for 27 %–44 % and 27 %–34 %, respectively, of the estimated bsp in the droplet mode. Unidentified fraction, crustal element oxides and OM were the dominant contributors, accounting for 26 %–47 %, 16 %–29 % and 19 %–27 %, respectively, of the estimated bsp in the coarse mode. The sum of the dominant contributors, including OM, EC, secondary inorganic aerosols and crustal element oxides, accounted for 70 %–79 % of the estimated bsp in the four seasons. In contrast, the sum of the other chemical species (including NaCl, NaNO3, Na2SO4, K2SO4, CaSO4, Ca(NO3)2, H2O) accounted for 5 %–10 % and the unidentified fraction accounted for 12 %–23 % of the estimated bsp. In conclusion, visibility degradation was determined by the dominant chemical species (e.g., OM, EC, secondary inorganic aerosols and crustal element oxides) in the fine mode (both condensation and droplet), which agreed with the results of the original and revised IMPROVE formulas (Pitchford et al., 2007).
Table 3Summary of the estimated MSEs of particle and the dominant chemical composition at the wavelength of 550 nm under dry conditions (relative humidity =40 %).
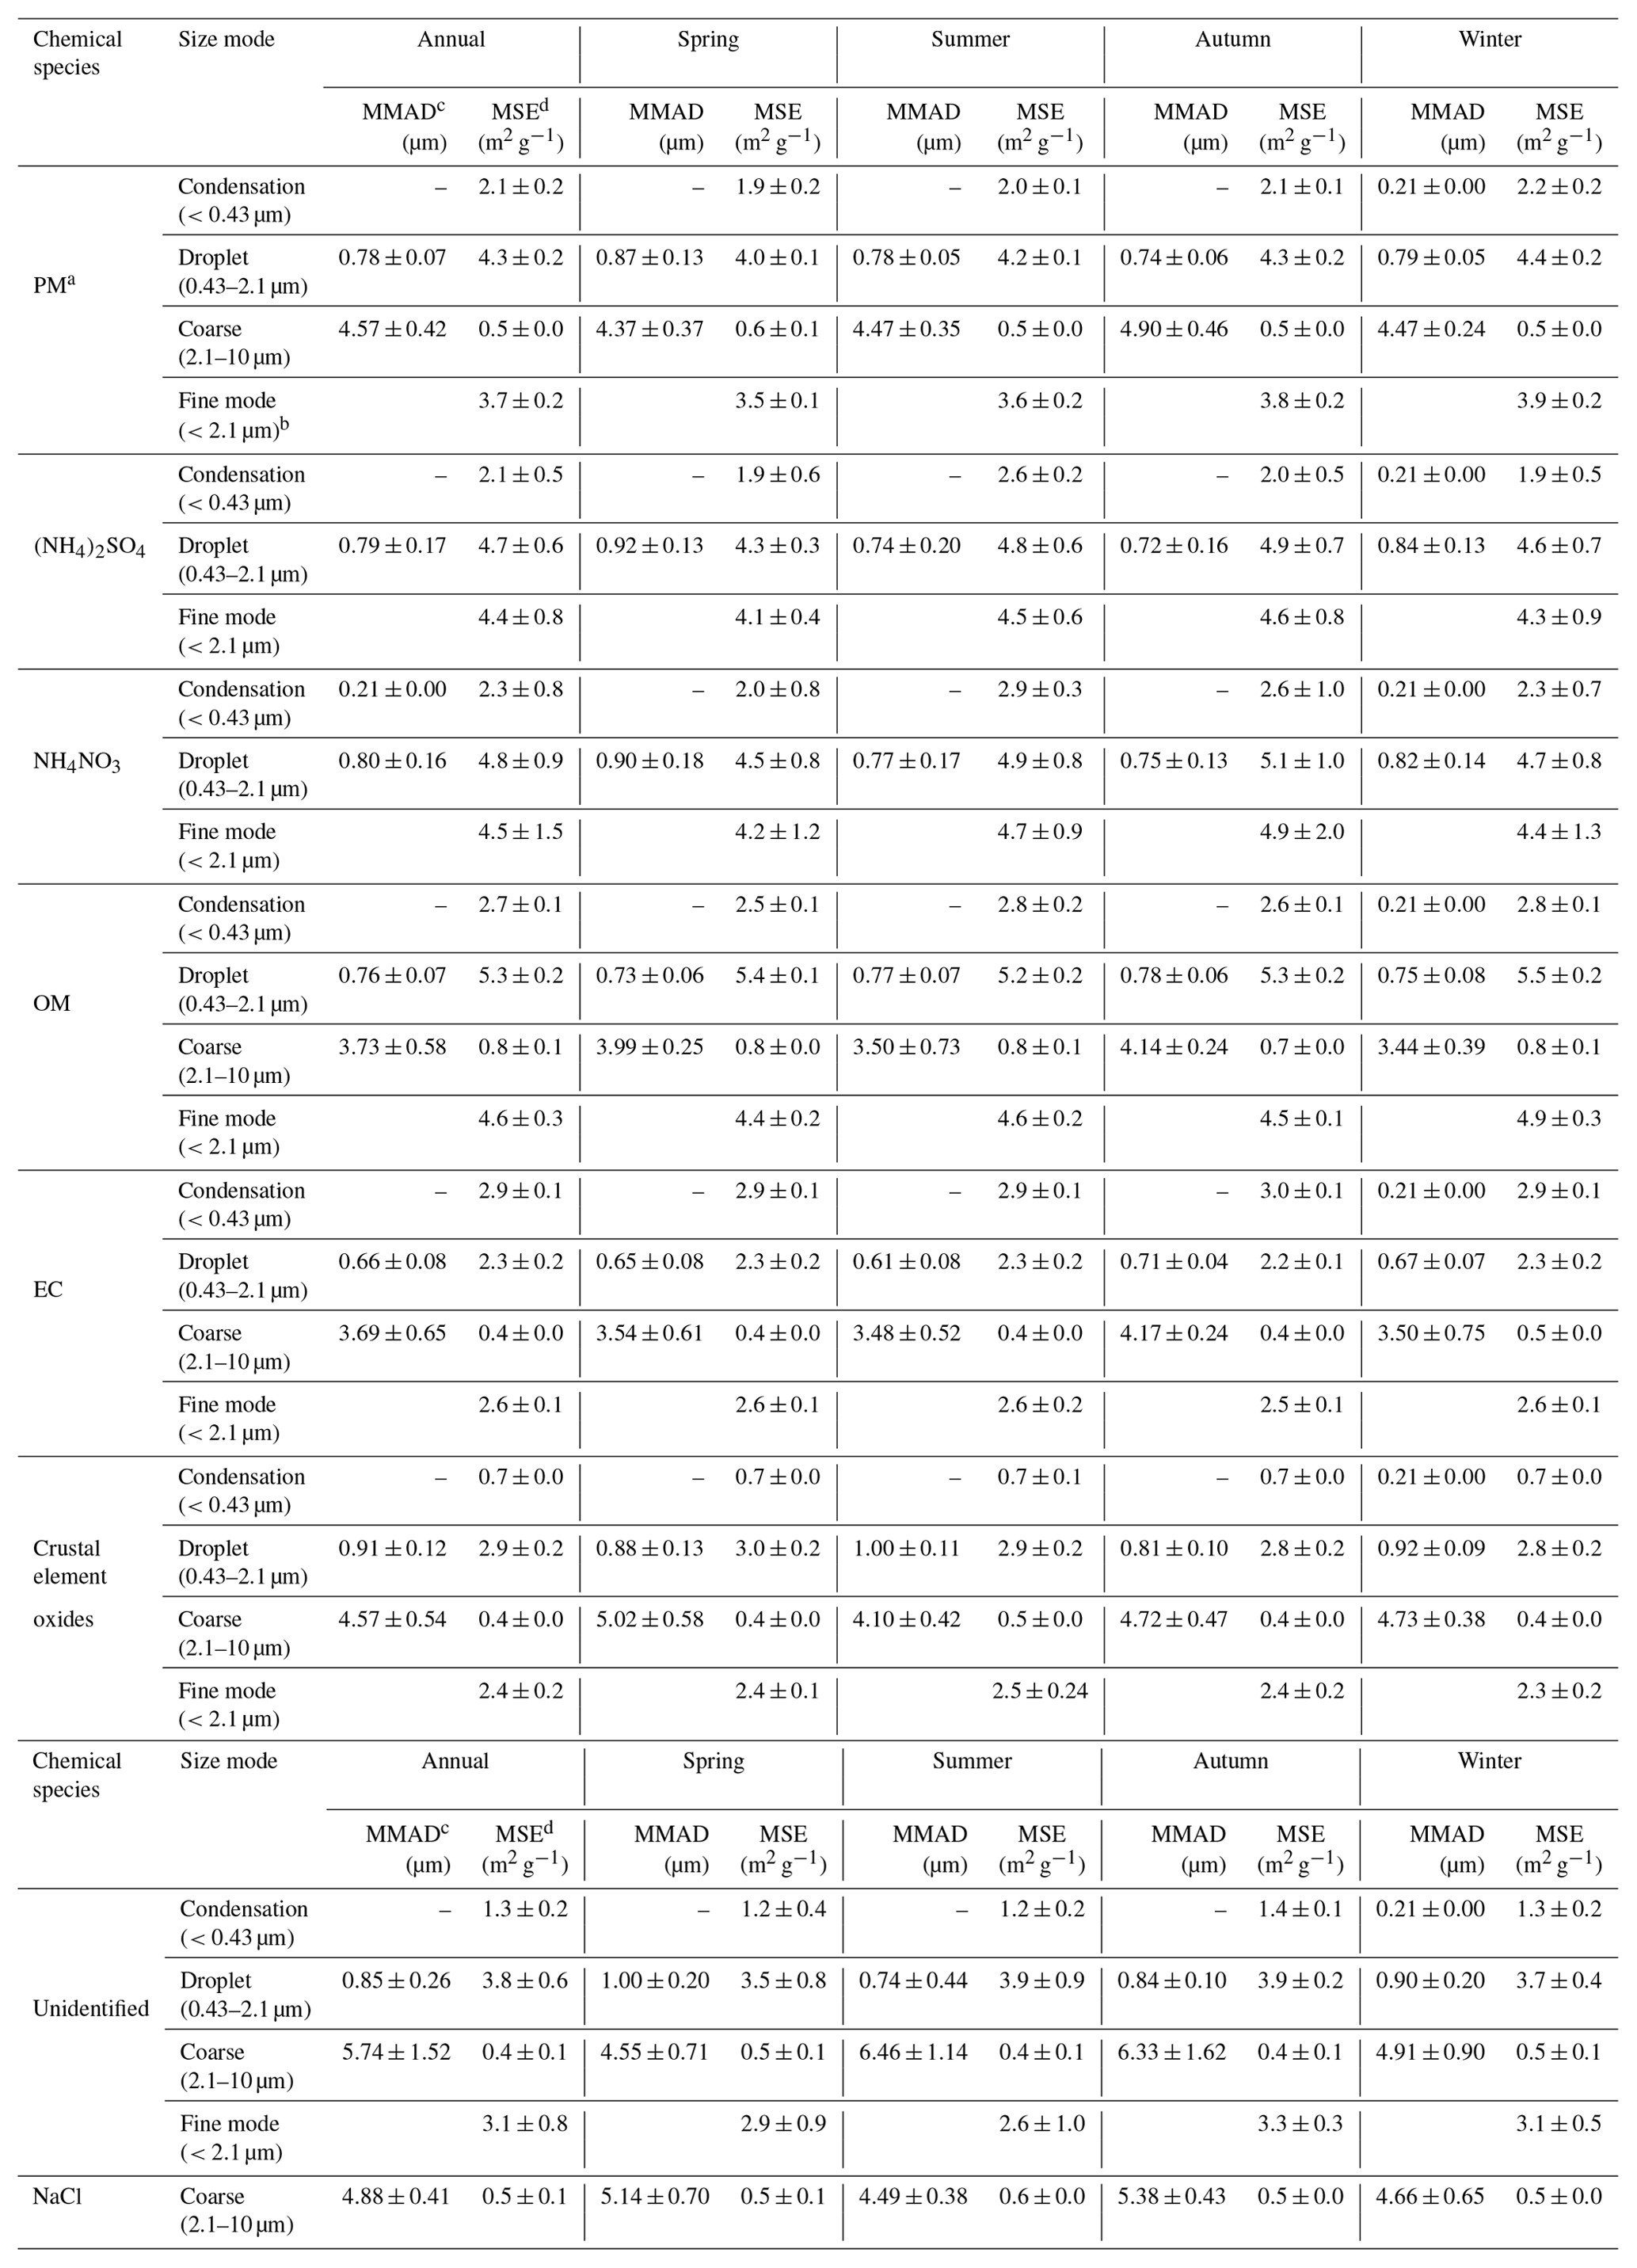
a PM is particulate matter. b Fine mode is the sum of the condensation and droplet modes. c MMAD is mass mean aerodynamic diameter. d MSE is mass scattering efficiency.
3.3 Key factors for variations in particle and chemical species MSEs
3.3.1 The estimated MSEs of particle and chemical species
To conveniently explore the control factors of particle MSE, the dominant chemical species' MSEs were estimated by their mass concentrations and the estimated bsp, according to the measured chemical species mass concentrations in Sect. 3.1 and the estimated bsp in Sect. 3.2. Here, only the MSEs of (NH4)2SO4, NH4NO3, OM, EC, crustal element oxides and unidentified fraction in the condensation, droplet, fine (sum of condensation and droplet) and coarse modes were estimated (Table 3), considering these chemical species accounted for more than 90 % of the estimated bsp. However, particle MSEs in the condensation, droplet, fine and coarse modes were estimated by the sum of bsp from individual chemical species divided by the sum of particle mass concentration according to Eq. (9). Moreover, an external mixing of individual chemical species was assumed in the estimation. Generally, good correlations (R2>0.79) were found between the measured and estimated bsp using the average MSEs of chemical species in Table 3 with the slopes being 0.85, 0.84, 0.76 and 0.84 in spring, summer, autumn and winter, respectively (Fig. S8). Thus, the estimated MSEs of chemical species in Table 3 were underestimated.
Undoubtedly, the particle MSE will be also underestimated because the estimated bsp was 11 %–15 % less than the measured bsp over four seasons, as discussed in Sect. 3.2. The measured bsp would be biased low by about 3 % due to the evaporation of NH4NO3, while the mass concentrations based the filter measurements were biased low by 5 %, 3 %, 9 % and 6 % in spring, summer, autumn and winter, respectively. Thus, the MSEs of would be underestimated by 9 %, 13 %, 6 % and 5 % in the respective season in the real world. In conclusion, the MSEs of particle and chemical species were underestimated by less than 13 %.
On an annual average, the estimated particle MSEs in the condensation, droplet and coarse modes were 2.1±0.2, 4.3±0.2 and 0.5±0.0 m2 g−1, respectively. The estimated particle MSE in the fine (sum of condensation and droplet mode, similar to PM2.5) was 3.7±0.2 m2 g−1, which was slightly higher than the value of 3.5 m2 g−1 estimated in 2009–2010 in urban Guangzhou (Tao et al., 2014). Seasonal variations in the estimated MSEs in the fine mode followed the sequence of winter (3.9±0.2 m2 g−1) > autumn (3.8±0.2 m2 g−1) > summer (3.6±0.2 m2 g−1) > spring (3.5±0.1 m2 g−1). Evidently, the estimated MSEs in the fine mode were slightly higher in autumn and winter than spring and summer, which also agreed with the previous studies in urban Guangzhou (Andreae et al., 2008; Jung et al., 2009a).
On an annual average, the estimated MSEs of (NH4)2SO4, NH4NO3, OM and crustal element oxides (equal to fine soil in the IMPROVE formulas) in the fine mode were 4.4±0.8, 4.5±1.5, 4.6±0.3 and 2.6±0.1 m2 g−1, respectively, which were higher than those (3.0, 3.0, 4.0 and 1.0 m2 g−1, respectively) from using the original IMPROVE formula (Hand and Malm, 2007; Malm and Hand, 2007; Pitchford et al., 2007). As shown in Table 3, the MSEs of (NH4)2SO4, NH4NO3, OM and crustal element oxides in the fine mode depended on their mass fractions in the droplet mode with high MSEs. In the original IMPROVE formula, MSEs of these chemical species were estimated using the multiple linear regression model according to the chemical components in PM2.5 and bsp from the IMPROVE network, noting that significant mass fractions of particles were in the condensation mode at the regional sites of the IMPROVE network and an urban site in the US (Cabada et al., 2004; Hand et al., 2002; Malm et al., 2003). In contrast, in the present study most mass fractions of the dominant chemical species (e.g., (NH4)2SO4, NH4NO3 and OM) in the fine mode were distributed in the droplet rather than condensation mode. These results suggested the higher MSEs of (NH4)2SO4, NH4NO3 and OM in the fine mode in this study were likely due to their significant mass fractions in the droplet mode. In fact, the MSE of fine soil in the IMPROVE formulas would represent the MSE of the bulk mode rather than the fine mode (Hand and Malm, 2007). The average MSEs of the bulk mode were 1.0±0.2 m2 g−1 in this study, which were similar to those in the IMPROVE formulas.
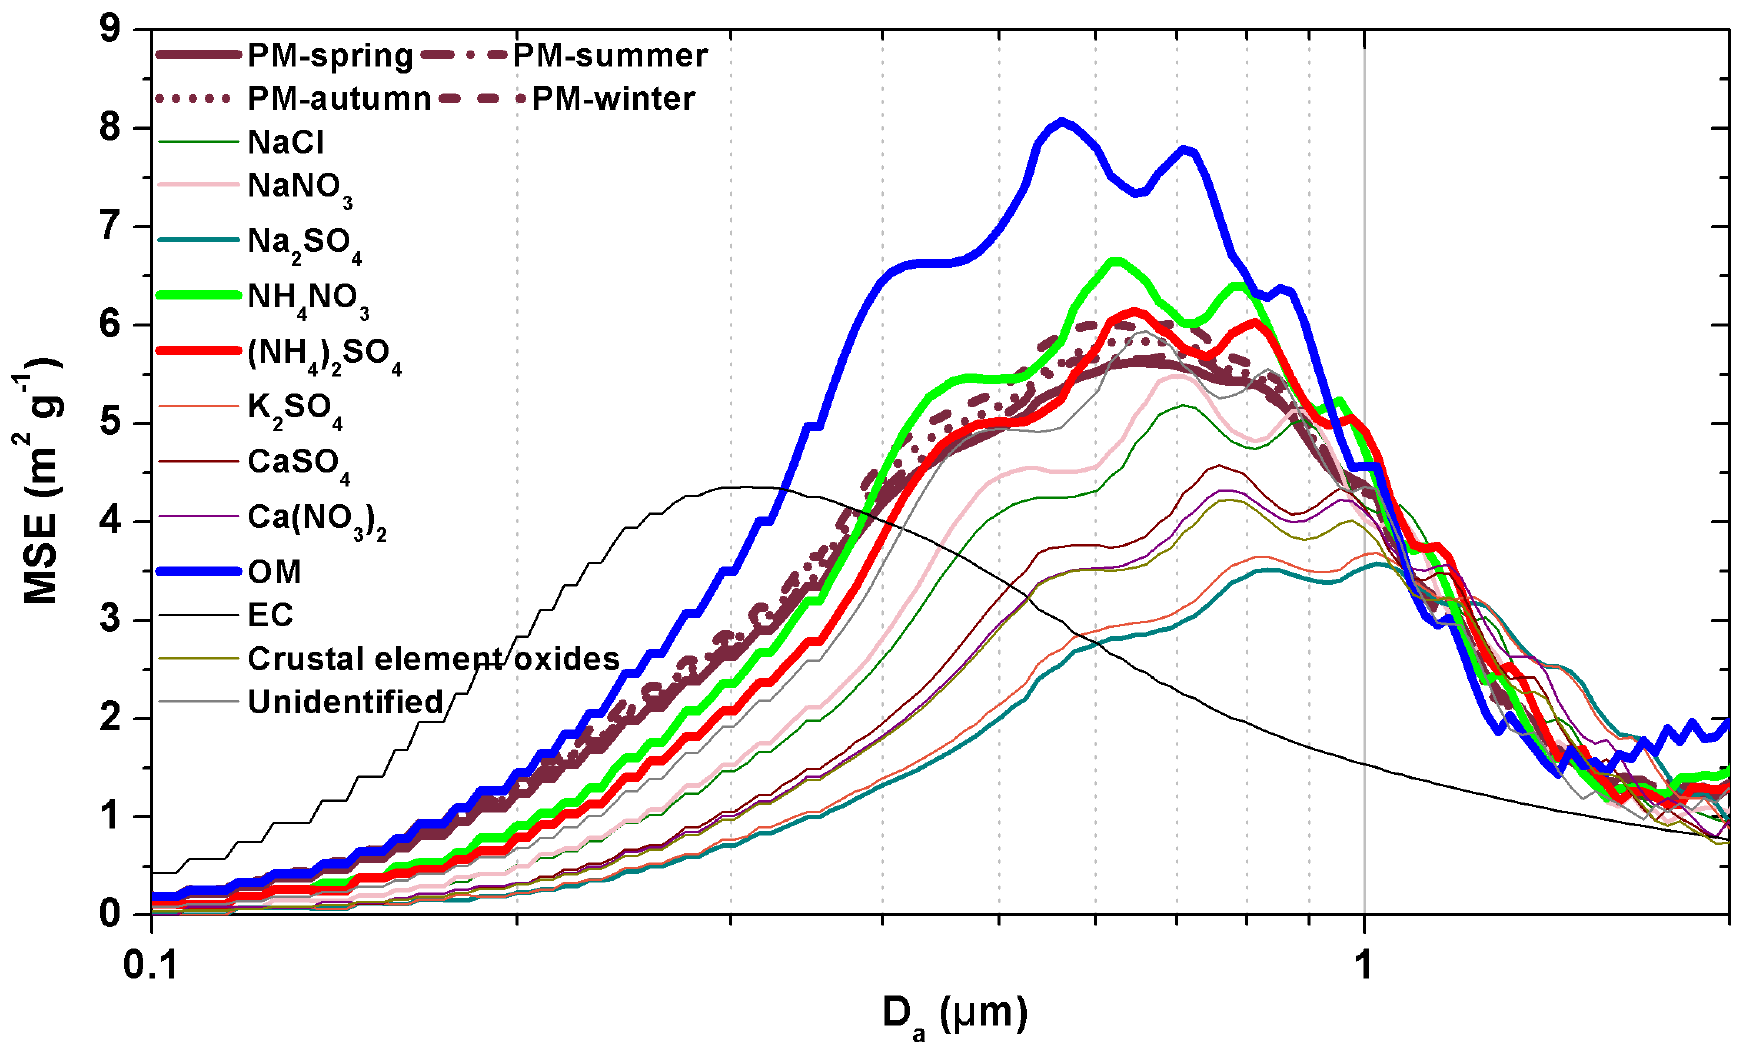
Figure 8Continuous lognormal size distributions of fine particle (<2.1 µm) MSEs over four seasons and the MSEs of chemical species at a wavelength of 520 nm under dry conditions (relative humidity =40 %) in urban Guangzhou.
On an annual average, the estimated MSEs of (NH4)2SO4, NH4NO3 and OM were 4.7±0.6, 4.8±0.9, and 5.3±0.2 m2 g−1 in the droplet mode and 2.1±0.5, 2.3±0.8, and 2.7±0.1 m2 g−1 in the condensation mode, respectively, which is lower than those in the large mode (similar to droplet mode) and slightly lower than those in the small mode (similar to condensation mode) in the revised IMPROVE formula (Pitchford et al., 2007). Theoretically, the highest MSEs of (NH4)2SO4, NH4NO3 and OM would be found at about 0.55 µm in geometric mass mean diameter (GMMD) at the wavelength 550 nm according to Mie theory. However, the MMADs of (NH4)2SO4, NH4NO3 and OM were 0.76–0.80 µm (equal to about 0.60–0.64 µm in GMMD) in the droplet mode and 0.21 µm (equal to about 0.16–0.18 µm in GMMD) in the condensation mode in this study, which were larger than 0.50 µm in GMMD in the large mode and were lower than 0.20 µm in GMMD in the small mode in the revised IMPROVE formula. Thus, the higher GMMDs in the droplet mode and the lower GMMDs of (NH4)2SO4, NH4NO3 and OM in the condensation mode in this study likely resulted in their lower MSEs compared with those in the revised IMPROVE formula. In addition, the underestimated bsp would also result in underestimating their MSEs in the condensation and droplet modes in this study.
Although the contribution of EC to bsp was not considered in the IMPROVE formulas, its mass extinction efficiency (10 m2 g−1) considered both scattering and absorption abilities (Hand and Malm, 2007). In fact, the theoretical average mass absorption efficiency (MAE) of EC in fine particle was 7.5 m2 g−1 at the wavelength 550 nm (Wu et al., 2016). Thus, mass extinction efficiency of EC was also about 10 m2 g−1 in this study, suggesting the estimated EC MSEs were comparable with the IMPROVE formulas. The estimated MSEs of coarse particles were 0.5±0.0 m2 g−1, which was also comparable with the value of 0.6 m2 g−1 in the IMPROVE formulas. Noticeably, sea salt was mainly distributed in the coarse mode rather than droplet mode in this study. In addition, the unidentified fraction with large mass fraction and the high MSE in the fine mode was not considered in the IMPROVE formulas, although it accounted for a significant contribution of the estimated bsp in this study (Fig. 7). In conclusion, EC and unidentified fraction, rather than sea salt, should be considered in estimating bsp, especially when EC and unidentified fraction accounted for significant mass fractions of fine particles.
3.3.2 Impact of size distribution on particle and chemical species MSE
As discussed in Sect. 3.3.1, seasonal average MSEs in the coarse mode fluctuated in a small range of 0.4–0.5 m2 g−1, while those in the fine mode were in a slightly larger range of 3.5–3.9 m2 g−1, but the percentage changes are in similar magnitudes (10 %–20 %). Only variations in fine particle MSE were discussed below as an example. It is worth to mention that fine particle MSE increased with its mass concentrations in IMPROVE network (Lowenthal and Kumar, 2004), but such a phenomenon was not found in the present study. As shown in Fig. 8, the seasonal variations in fine particle MSE were mainly caused by particle fractions in the size range of 0.4–0.9 µm, which belong to the droplet mode. In this mode, the MSEs of (NH4)2SO4 and NH4NO3 and OM were higher while those of the other chemical species were lower than the overall particle MSE. Note that the overall particle MSE depends on the mass concentrations and MSEs of individual chemical components. Thus, the seasonal average MSEs of fine particles was dominated by the seasonal average mass fractions and associated MSEs of (NH4)2SO4 and NH4NO3 and OM in the droplet mode.
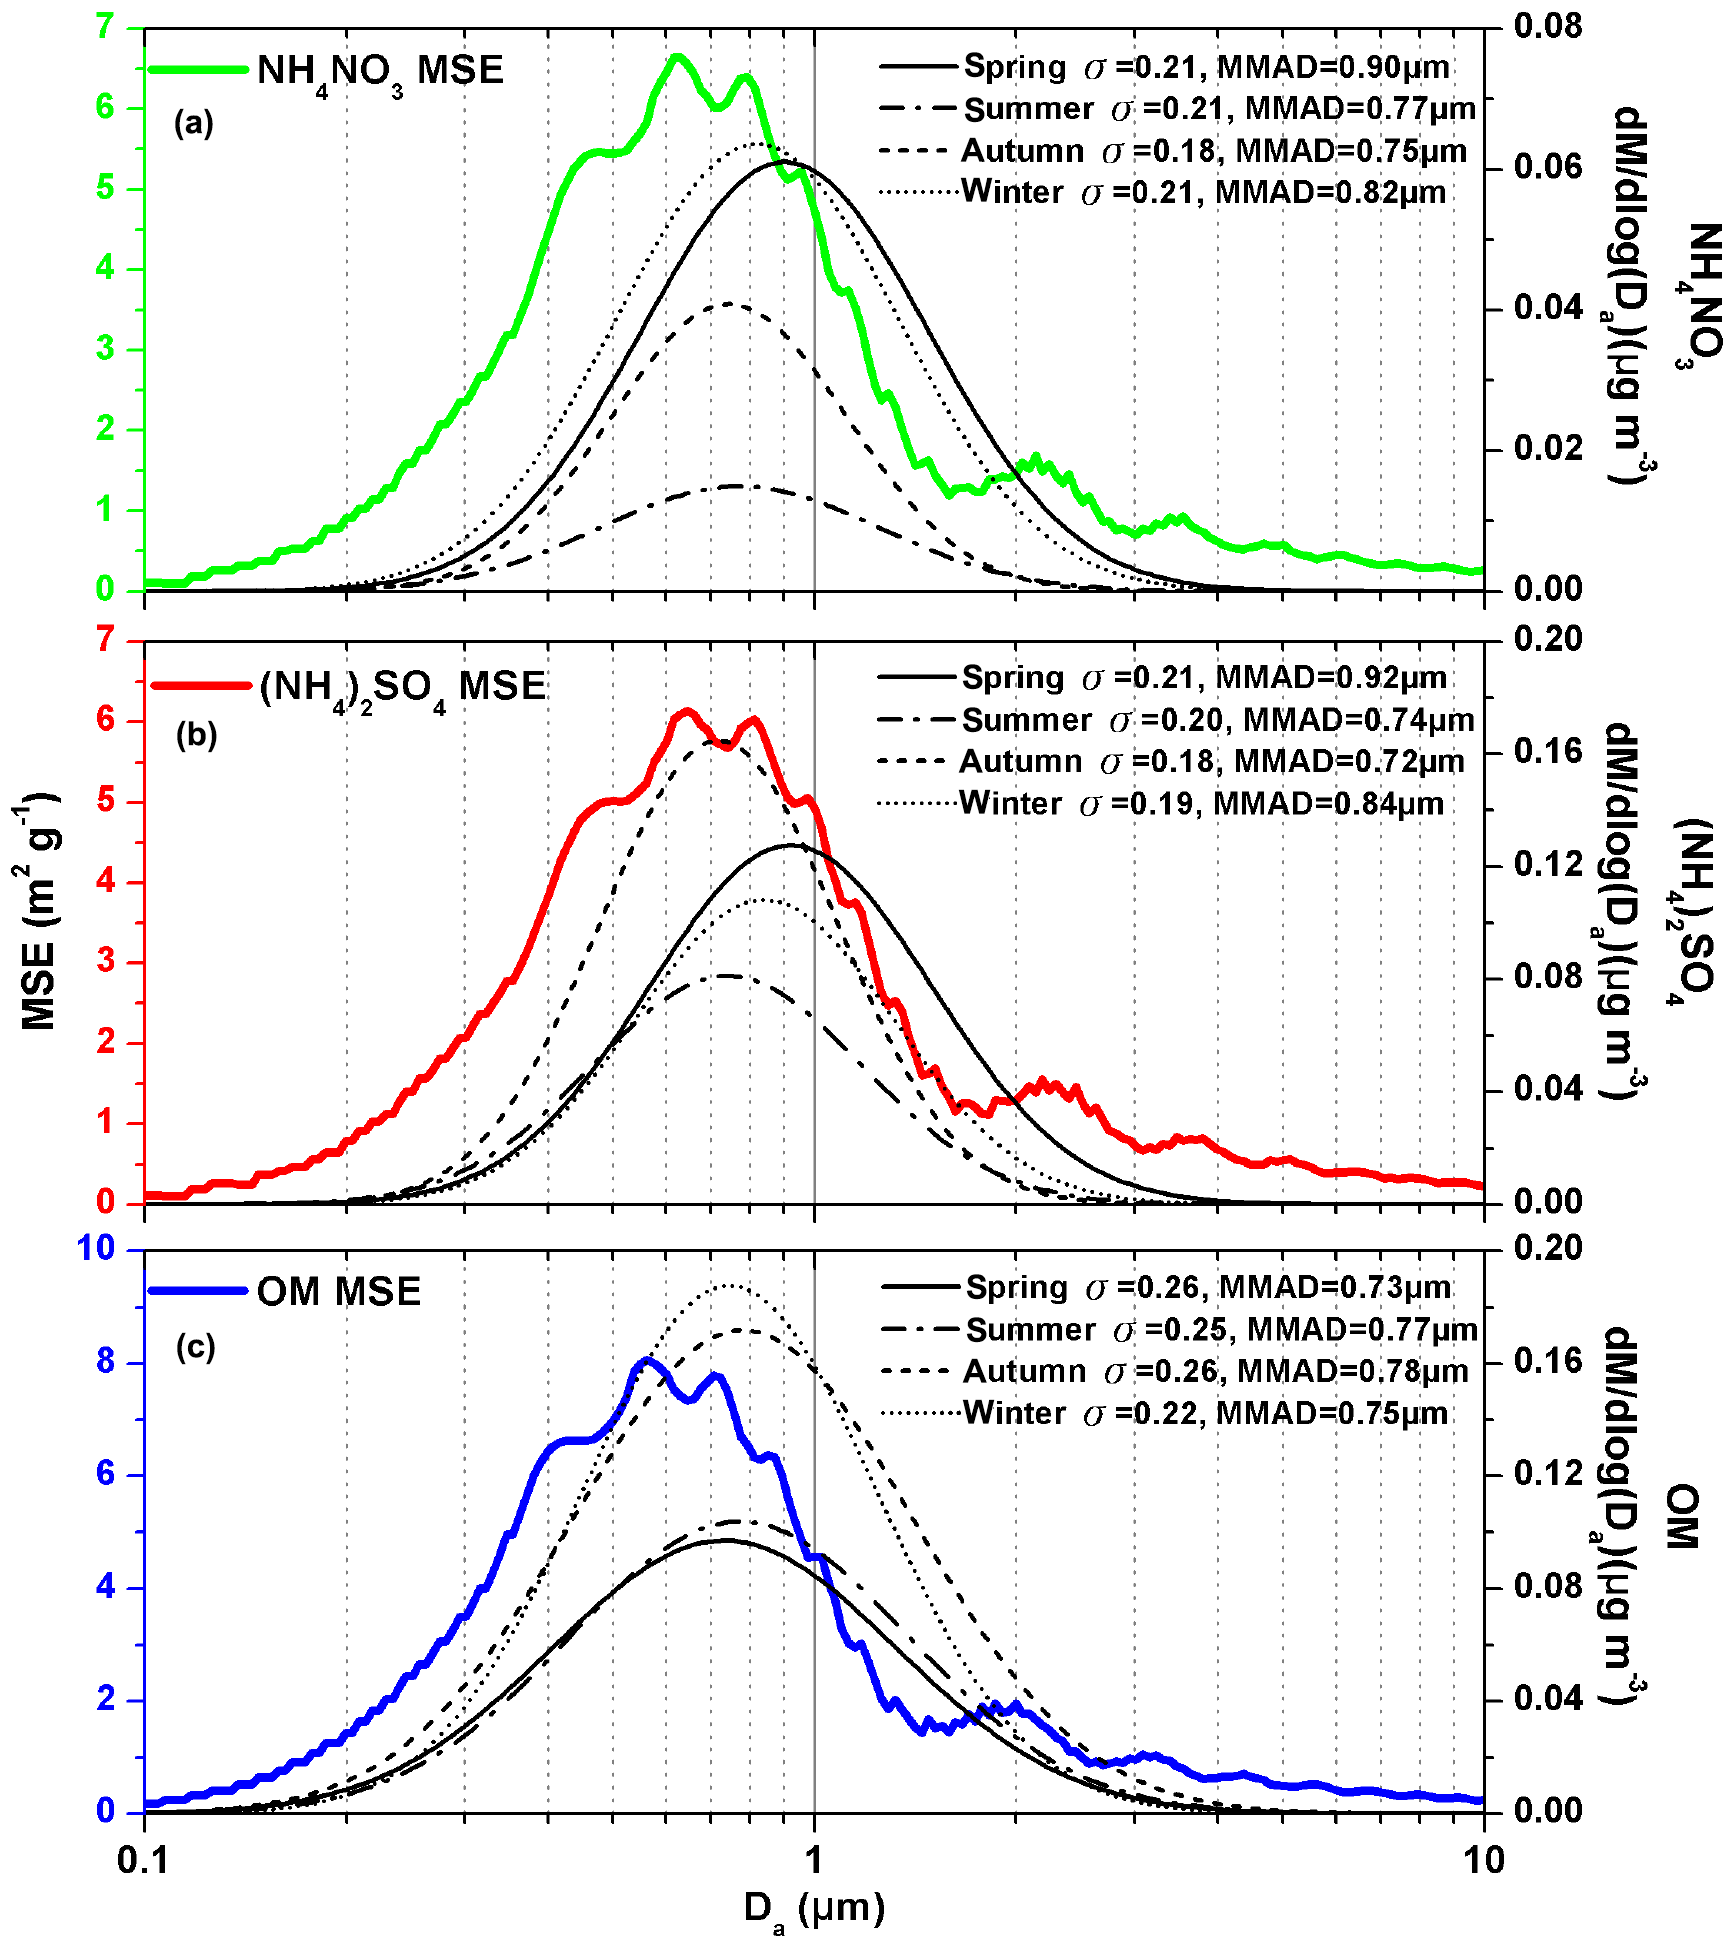
Figure 9Continuous lognormal size distributions of (NH4)2SO4 (a), NH4NO3 (b) and OM (c) mass concentrations and their σ values and MMADs in the droplet mode at wavelength of 520 nm under dry conditions (relative humidity =40 %).
The sum of the products of seasonal average mass concentration and MSEs of the above three chemical species in the droplet mode was 1.8, 2.1, 2.3 and 2.5 m2 g−1 in spring, summer, autumn and winter, respectively. As expected, the seasonal variations in fine particle MSE followed the sequence of winter (3.9±0.2 m2 g−1) > autumn (3.8±0.2 m2 g−1) > summer (3.6±0.2 m2 g−1) > spring (3.5±0.1 m2 g−1). Noticeably, fine particle MSE was determined by the average MSEs of the dominant chemical species, rather than their mass fractions which were much smaller than 1.0.
Different from the approach used for fine particle MSE, the MSEs of (NH4)2SO4, NH4NO3 and OM in the droplet mode were determined using measurement-based methods their mass size distributions prescribed as lognormal size distributions. In theory (Sect. 2.4), the lognormal size distribution of chemical species is determined by three parameters including mass concentration (in the range of 0.43–2.1 µm), MMAD and standard deviation (σ), which control the area, mode and scale of the lognormal size distribution, respectively. Thus, the MSEs of (NH4)2SO4, NH4NO3 and OM should depend on their MMADs and σ values. Seasonal average σ values of (NH4)2SO4, NH4NO3 and OM were in the range of 0.18–0.21, 0.18–0.21 and 0.22–0.26, respectively, while the corresponding MMADs were in the range of 0.72–0.92, 0.75–0.90 and 0.73–0.78 µm, respectively (Fig. 9). Generally, the seasonal average MSEs of (NH4)2SO4, NH4NO3 and OM in the droplet mode were higher with the lower σ values (or MMADs) when MMADs (σ values) were close. However, the MSE of OM in summer was 5.2 m2 g−1, which was lower than 5.3 m2 g−1 in autumn, although σ values and MMADs in summer were lower than those in autumn. This was mainly related to the evident fluctuation the MSE of OM in the range of 0.6–0.7 µm.
In conclusion, the fine particle MSE was determined by the sum of the products of average mass fractions and MSEs of (NH4)2SO4 and NH4NO3 and OM in the droplet mode. The MSEs of the above three chemical species in the droplet mode depended on both their σ value and MMADs. Generally, fine particle MSE was mainly related to OM due to its high mass and MSE in the droplet mode in urban Guangzhou.
Size-resolved and chemically resolved particle number and mass concentration were measured in urban Guangzhou in different seasons during 2015–2016 and the data were used to estimate particle MSE. and were mainly distributed in the droplet mode; EC was distributed in both condensation and droplet modes; and particle mass, , OC, Na+, Ca2+, and Cl− were distributed in both droplet and coarse modes. The estimated bsp can represent 85 %–89 % of the measured bsp based on the size-segregated chemical compositions, according to the ISORROPIA II thermodynamic equilibrium model and Mie theory model. The largest contributors to bsp were the chemical species in the droplet mode with the highest MSEs.
MSEs of the dominant chemical species were noticeably different in this study than those in the original and revised IMPROVE formulas. The MSEs of (NH4)2SO4, NH4NO3 and OM in the fine mode were higher than those in the original IMPROVE formula and in the droplet mode were lower than those in the revised IMPROVE formula. In any case, bsp would be underestimated in urban Guangzhou using the original or revised IMPROVE formulas because the unidentified chemical species (and associated mass fractions) in the droplet mode accounted for a large fraction of bsp and this portion was not included in these formulas. Moreover, MSEs of chemical species would be overestimated in the original and revised IMPROVE formulas using the multiple linear regression model when the unidentified species was ignored. In addition, sea salt was found in the coarse mode in this study, differing from the setup in the IMPROVE formulas, which is in the droplet mode. It can be concluded that the estimated bsp in Guangzhou based on the revised IMPROVE formula would have large biases, even though good correlations between estimated and measured bsp were found.
MSEs of fine particles are controlled by the relative mass fractions of the dominant chemical components (e.g., (NH4)2SO4, NH4NO3 and OM) and associated size distributions (e.g., σ and MMAD). Localized bsp formulas are thus needed for better estimating particle MSE because particle size distributions of individual chemical species vary significantly in space and time.
Data used in this study are available from Jun Tao (taojun@scies.org).
The supplement related to this article is available online at: https://doi.org/10.5194/acp-19-8471-2019-supplement.
JT designed and led the study, analyzed the data, and drafted the paper. ZZ collected the field data and contributed to data analysis; YW and ZW conducted model simulations; PC, ML, LC, and RZ contributed to data analysis; JC analyzed aerosol sample data for chemical composition; and LZ contributed to study design and finalized the paper. All coauthors provided comments on the paper.
The authors declare that they have no conflict of interest.
This research has been supported by the National Natural Science Foundation of China (grant nos. 41475119, 41875160 and 41603119).
This paper was edited by Aijun Ding and reviewed by two anonymous referees.
Andreae, M. O., Schmid, O., Yang, H., Chand, D., Zhen Yu, J., Zeng, L. M., and Zhang, Y. H.: Optical properties and chemical composition of the atmospheric aerosol in urban Guangzhou, China, Atmos. Environ., 42, 6335–6350, 2008.
Bergin, M. H., Ogren, J. A., Schwartz, S. E., and McInnes, L. M.: Evaporation of Ammonium Nitrate Aerosol in a Heated Nephelometer: Implications for Field Measurements, Environ. Sci. Technol., 31, 2878–2883, https://doi.org/10.1021/es970089h, 1997.
Bian, Q., Huang, X. H. H., and Yu, J. Z.: One-year observations of size distribution characteristics of major aerosol constituents at a coastal receptor site in Hong Kong – Part 1: Inorganic ions and oxalate, Atmos. Chem. Phys., 14, 9013–9027, https://doi.org/10.5194/acp-14-9013-2014, 2014.
Cabada, J. C., Rees, S., Takahama, S., Khlystov, A., Pandis, S. N., Davidson, C. I., and Robinson, A. L.: Mass size distributions and size resolved chemical composition of fine particulate matter at the Pittsburgh supersite, Atmos. Environ., 38, 3127–3141, 2004.
Cao, J., Wang, Q., Chow, J. C., Watson, J. G., Tie, X., Shen, Z., Wang, P., and An, Z.: Impacts of aerosol compositions on visibility impairment in Xi'an, China, Atmos. Environ., 59, 559–566, 2012.
Chen, P., Wang, T., Lu, X., Yu, Y., Kasoar, M., Xie, M., and Zhuang, B.: Source apportionment of size-fractionated particles during the 2013 Asian Youth Games and the 2014 Youth Olympic Games in Nanjing, China, Sci. Total Environ., 579, 860–870, 2017.
Cheng, Y., Wiedensohler, A., Eichler, H., Su, H., Gnauk, T., Brüggemann, E., Herrmann, H., Heintzenberg, J., Slanina, J., and Tuch, T.: Aerosol optical properties and related chemical apportionment at Xinken in Pearl River Delta of China, Atmos. Environ., 42, 6351–6372, 2008.
Cheng, Y. F., Berghof, M., Garland, R. M., Wiedensohler, A., Wehner, B., Muller, T. J., Su, H., Zhang, Y. H., Achtert, P., and Nowak, A.: Influence of soot mixing state on aerosol light absorption and single scattering albedo during air mass aging at a polluted regional site in northeastern China, J. Geophys. Res., 114, D00G10, https://doi.org/10.1029/2008JD010883, 2009.
Cheng, Z., Jiang, J. S., Chen, C., Gao, J., Wang, S., Watson, J. G., Wang, H., Deng, J., Wang, B., and Zhou, M.: Estimation of aerosol mass scattering efficiencies under high mass loading: case study for the megacity of Shanghai, China, Environ. Sci. Technol., 49, 831–838, 2015.
Chow, J. C., Watson, J. G., Lowenthal, D. H., Chen, L. W. A., and Motallebi, N.: PM2.5 source profiles for black and organic carbon emission inventories, Atmos. Environ., 45, 5407–5414, 2011.
Day, M. C., Zhang, M., and Pandis, S. N.: Evaluation of the ability of the EC tracer method to estimate secondary organic carbon, Atmos. Environ., 112, 317–325, 2015.
Dong, Y., Hays, M. D., Smith, N. D., and Kinsey, J. S.: Inverting cascade impactor data for size-resolved characterization of fine particulate source emissions, J. Aerosol Sci., 35, 1497–1512, 2004.
Fountoukis, C. and Nenes, A.: ISORROPIA II: a computationally efficient thermodynamic equilibrium model for K+-Ca2+-Mg2+--Na+---Cl−-H2O aerosols, Atmos. Chem. Phys., 7, 4639–4659, https://doi.org/10.5194/acp-7-4639-2007, 2007.
Gao, Y., Lai, S., Lee, S. C., Yau, P. S., Huang, Y., Cheng, Y., Wang, T., Xu, Z., Yuan, C., and Zhang, Y.: Optical properties of size-resolved particles at a Hong Kong urban site during winter, Atmos. Res., 155, 1–12, 2015.
Gentner, D. R., Isaacman, G., Worton, D. R., Chan, A. W. H., Dallmann, T. R., Davis, L. E., Liu, S., Day, D. A., Russell, L. M., and Wilson, K. R.: Elucidating secondary organic aerosol from diesel and gasoline vehicles through detailed characterization of organic carbon emissions, P. Natl. Acad. Sci. USA, 109, 18318–18323, 2012.
Gentner, D. R., Jathar, S. H., Gordon, T. D., Bahreini, R., Day, D. A., Haddad, I. E., Hayes, P. L., Pieber, S. M., Platt, S. M., and De Gouw, J. A.: Review of Urban Secondary Organic Aerosol Formation from Gasoline and Diesel Motor Vehicle Emissions, Environ. Sci. Technol., 51, 1074–1093, 2017.
Guo, S., Hu, M., Wang, Z. B., Slanina, J., and Zhao, Y. L.: Size-resolved aerosol water-soluble ionic compositions in the summer of Beijing: implication of regional secondary formation, Atmos. Chem. Phys., 10, 947–959, https://doi.org/10.5194/acp-10-947-2010, 2010.
Hallquist, M., Wenger, J. C., Baltensperger, U., Rudich, Y., Simpson, D., Claeys, M., Dommen, J., Donahue, N. M., George, C., Goldstein, A. H., Hamilton, J. F., Herrmann, H., Hoffmann, T., Iinuma, Y., Jang, M., Jenkin, M. E., Jimenez, J. L., Kiendler-Scharr, A., Maenhaut, W., McFiggans, G., Mentel, Th. F., Monod, A., Prévôt, A. S. H., Seinfeld, J. H., Surratt, J. D., Szmigielski, R., and Wildt, J.: The formation, properties and impact of secondary organic aerosol: current and emerging issues, Atmos. Chem. Phys., 9, 5155–5236, https://doi.org/10.5194/acp-9-5155-2009, 2009.
Han, T., Liu, X., Zhang, Y., Qu, Y., Gu, J., Ma, Q., Lu, K., Tian, H., Chen, J., and Zeng, L.: Characteristics of aerosol optical properties and their chemical apportionments during CAREBeijing 2006, Aerosol Air Qual. Res., 14, 1431–1442, 2014.
Hand, J., Kreidenweis, S., Sherman, D. E., Collett, J., Hering, S., Day, D., and Malm, W.: Aerosol size distributions and visibility estimates during the Big Bend regional aerosol and visibility observational (BRAVO) study, Atmos. Environ., 36, 5043–5055, 2002.
Hand, J. L. and Malm, W. C.: Review of the IMPROVE equation for estimating ambient light extinction coefficients, CIRA, Colorado State University, 2007.
He, L.Y., Huang, X.F., Xue, L., Hu, M., Lin, Y., Zheng, J., Zhang, R., and Zhang, Y. H.: Submicron aerosol analysis and organic source apportionment in an urban atmosphere in Pearl River Delta of China using high-resolution aerosol mass spectrometry, J. Geophys. Res., 116, D12304, https://doi.org/10.1029/2010JD014566, 2011.
Ho, K., Lee, S., Chow, J. C., and Watson, J. G.: Characterization of PM10 and PM2.5 source profiles for fugitive dust in Hong Kong, Atmos. Environ., 37, 1023–1032, 2003.
Hua, Y., Cheng, Z., Wang, S., Jiang, J., Chen, D., Cai, S., Fu, X., Fu, Q., Chen, C., Xu, B., and Yu, J.: Characteristics and source apportionment of PM2.5 during a fall heavy haze episode in the Yangtze River Delta of China, Atmos. Environ., 123, 380–391, https://doi.org/10.1016/j.atmosenv.2015.03.046, 2015.
Huang, K., Zhuang, G., Lin, Y., Fu, J. S., Wang, Q., Liu, T., Zhang, R., Jiang, Y., Deng, C., Fu, Q., Hsu, N. C., and Cao, B.: Typical types and formation mechanisms of haze in an Eastern Asia megacity, Shanghai, Atmos. Chem. Phys., 12, 105–124,https://doi.org/10.5194/acp-12-105-2012, 2012.
Huang, X., Yu, J. Z., He, L. Y., and Hu, M.: Size Distribution Characteristics of Elemental Carbon Emitted from Chinese Vehicles: Results of a Tunnel Study and Atmospheric Implications, Environ. Sci. Technol., 40, 5355–5360, 2006a.
Huang, X. F., Yu, J. Z., He, L. Y., and Yuan, Z.: Water-soluble organic carbon and oxalate in aerosols at a coastal urban site in China: Size distribution characteristics, sources, and formation mechanisms, J. Geophys. Res., 111, D22212, https://doi.org/10.1029/2006JD007408, 2006b.
John, W., Wall, S. M., Ondo, J. L., and Winklmayr, W.: Modes in the size distributions of atmospheric inorganic aerosol, Atmos. Environ., 24, 2349–2359, 1990.
Jung, J., Lee, H., Kim, Y. J., Liu, X., Zhang, Y., Gu, J., and Fan, S.: Aerosol chemistry and the effect of aerosol water content on visibility impairment and radiative forcing in Guangzhou during the 2006 Pearl River Delta campaign, J. Environ. Manage., 90, 3231–3244, 2009a.
Jung, J., Lee, H., Kim, Y. J., Liu, X., Zhang, Y., Hu, M., and Sugimoto, N.: Optical properties of atmospheric aerosols obtained by in situ and remote measurements during 2006 Campaign of Air Quality Research in Beijing (CAREBeijing-2006), J. Geophys. Res., 114, D00G02, https://doi.org/10.1029/2008JD010337, 2009b.
Kulkarni, P., Baron, P. A., and Willeke, K.: Aerosol measurement: principles, techniques, and applications, John Wiley & Sons, Hoboken, New Jersey, 2011.
Lan, Z., Chen, D., Li, X., Huang, X., He, L., Deng, Y., Feng, N., and Hu, M.: Modal characteristics of carbonaceous aerosol size distribution in an urban atmosphere of South China, Atmos. Res., 100, 51–60, 2011.
Li, H., Wang, Q. G., Yang, M., Li, F., Wang, J., Sun, Y., Wang, C., Wu, H., and Qian, X.: Chemical characterization and source apportionment of PM2.5 aerosols in a megacity of Southeast China, Atmos. Res., 181, 288–299, https://doi.org/10.1016/j.atmosres.2016.07.005, 2016.
Lin, C., Li, Y., Yuan, Z., Lau, A. K. H., Li, C., and Fung, J. C. H.: Using satellite remote sensing data to estimate the high-resolution distribution of ground-level PM2.5, Remote Sens. Environ., 156, 117–128, https://doi.org/10.1016/j.rse.2014.09.015, 2015.
Lowenthal, D. H. and Kumar, N.: Variation of Mass Scattering Efficiencies in IMPROVE, J. Air Waste Manage., 54, 926–934, 2004.
Malm, W., Sisler, J., Pitchford, M., Scruggs, M., Ames, R., Copeland, S., Gebhart, K., and Day, D.: IMPROVE (interagency monitoring of protected visual environments): spatial and seasonal patterns and temporal variability of haze and its constituents in the United States: Report III, CIRA Report ISSN, 0737-5352, 2000.
Malm, W. C., Sisler, J. F., Huffman, D., Eldred, R. A., and Cahill, T. A.: Spatial and seasonal trends in particle concentration and optical extinction in the United States, J. Geophys. Res., 99, 1347–1370, 1994.
Malm, W. C., and Pitchford, M.: Comparison of calculated sulfate scattering efficiencies as estimated from size-resolved particle measurements at three national locations, Atmos. Environ., 31, 1315–1325, 1997.
Malm, W. C., Day, D. E., Kreidenweis, S. M., Collett, J. L., and Lee, T.: Humidity-dependent optical properties of fine particles during the Big Bend Regional Aerosol and Visibility Observational Study, J. Geophys. Res., 108, 4279, https://doi.org/10.1029/2002JD002998, 2003.
Malm, W. C. and Hand, J. L.: An examination of the physical and optical properties of aerosols collected in the IMPROVE program, Atmos. Environ., 41, 3407–3427, 2007.
Ming, L., Jin, L., Li, J., Fu, P., Yang, W., Liu, D., Zhang, G., Wang, Z., and Li, X.: PM2.5 in the Yangtze River Delta, China: Chemical compositions, seasonal variations, and regional pollution events, Environ. Pollut., 223, 200–212, https://doi.org/10.1016/j.envpol.2017.01.013, 2017.
Pitchford, M., Malm, W., Schichtel, B., Kumar, N., Lowenthal, D., and Hand, J.: Revised algorithm for estimating light extinction from IMPROVE particle speciation data, J. Air Waste Manage., 57, 1326–1336, 2007.
Schwarz, J., Gao, R., Spackman, J., Watts, L., Thomson, D., Fahey, D., Ryerson, T., Peischl, J., Holloway, J., and Trainer, M.: Measurement of the mixing state, mass, and optical size of individual black carbon particles in urban and biomass burning emissions, Geophys. Res. Lett., 35, L13810, https://doi.org/10.1029/2008GL033968, 2008.
Shen, G., Xue, M., Yuan, S., Zhang, J., Zhao, Q., Li, B., Wu, H., and Ding, A.: Chemical compositions and reconstructed light extinction coefficients of particulate matter in a mega-city in the western Yangtze River Delta, China, Atmos. Environ., 83, 14–20, https://doi.org/10.1016/j.atmosenv.2013.10.055, 2014.
Shiraiwa, M., Kondo, Y., Moteki, N., Takegawa, N., Miyazaki, Y., and Blake, D. R.: Evolution of mixing state of black carbon in polluted air from Tokyo, Geophys. Res. Lett., 34, L16803, https://doi.org/10.1029/2007GL029819, 2007.
Sisler, J. F. and Latimer, D. A.: Spatial and temporal patterns and the chemical composition of the haze in the United States: An analysis of data from the IMPROVE network, 1988–1991, Cooperative Institute for Research in the Atmosphere, Colorado State University, 1993.
Sisler, J. F., Malm, W., Gebhart, K., and Pitchford, M. L.: Spatial and Seasonal Patterns and Long Term Variability of the composition of the Haze in the United States, Report ISSN, 0737-5352, 1996.
Sisler, J. F. and Malm, W. C.: Interpretation of Trends of PM25 and Reconstructed Visibility from the IMPROVE Network, J. Air Waste Manage., 50, 775–789, 2000.
Sun, J., Shen, Z., Zhang, L., Lei, Y., Gong, X., Zhang, Q., Zhang, T., Xu, H., Cui, S., Wang, Q., Cao, J., Tao, J., Zhang, N., and Zhang, R.: Chemical source profiles of urban fugitive dust PM2.5 samples from 21 cities across China, Sci. Total Environ., 649, 1045–1053, https://doi.org/10.1016/j.scitotenv.2018.08.374, 2019.
Takemura, T., Nakajima, T., Dubovik, O., Holben, B. N., and Kinne, S.: Single-Scattering Albedo and Radiative Forcing of Various Aerosol Species with a Global Three-Dimensional Model, J. Climate, 15, 333–352, 2002.
Tao, J., Ho, K., Chen, L., Zhu, L., Han, J., and Xu, Z.: Effect of chemical composition of PM2.5 on visibility in Guangzhou, China, 2007 spring, Particuology, 7, 68–75, 2009.
Tao, J., Cao, J. J., Zhang, R. J., Zhu, L., Zhang, T., Shi, S., and Chan, C. Y.: Reconstructed light extinction coefficients using chemical compositions of PM2.5 in winter in Urban Guangzhou, China, Adv. Atmos. Sci., 29, 359–368, 2012.
Tao, J., Zhang, L., Ho, K., Zhang, R., Lin, Z., Zhang, Z., Lin, M., Cao, J., Liu, S., and Wang, G.: Impact of PM2.5 chemical compositions on aerosol light scattering in Guangzhou – the largest megacity in South China, Atmos. Res., 135–136, 48–58, https://doi.org/10.1016/j.atmosres.2013.08.015, 2014.
Tao, J., Zhang, L., Cao, J., and Zhang, R.: A review of current knowledge concerning PM2.5 chemical composition, aerosol optical properties and their relationships across China, Atmos. Chem. Phys., 17, 9485–9518, https://doi.org/10.5194/acp-17-9485-2017, 2017a.
Tao, J., Zhang, L., Cao, J., Zhong, L., Chen, D., Yang, Y., Chen, D., Chen, L., Zhang, Z., Wu, Y., Xia, Y., Ye, S., and Zhang, R.: Source apportionment of PM2.5 at urban and suburban areas of the Pearl River Delta region, south China – With emphasis on ship emissions, Sci. Total Environ., 574, 1559–1570, https://doi.org/10.1016/j.scitotenv.2016.08.175, 2017b.
Tao, J., Zhang, Z., Tan, H., Zhang, L., Wu, Y., Sun, J., Che, H., Cao, J., Cheng, P., Chen, L., and Zhang, R.: Observational evidence of cloud processes contributing to daytime elevated nitrate in an urban atmosphere, Atmos. Environ., 186, 209–215, https://doi.org/10.1016/j.atmosenv.2018.05.040, 2018.
Tian, S., Pan, Y., Liu, Z., Wen, T., and Wang, Y.: Size-resolved aerosol chemical analysis of extreme haze pollution events during early 2013 in urban Beijing, China, J. Hazard. Mater., 279, 452–460, 2014.
Titos, G., Foyo-Moreno, I., Lyamani, H., Querol, X., Alastuey, A., and Alados-Arboledas, L.: Optical properties and chemical composition of aerosol particles at an urban location: An estimation of the aerosol mass scattering and absorption efficiencies, J. Geophys. Res., 117, D04206, https://doi.org/10.1029/2011JD016671, 2012.
Vaughan, N. P.: The Andersen impactor: Calibration, wall losses and numerical simulation, J. Aerosol Sci., 20, 67–90, 1989.
Wang, H., Shi, G., Tian, M., Zhang, L., Chen, Y., Yang, F., and Cao, X.: Aerosol optical properties and chemical composition apportionment in Sichuan Basin, China, Sci. Total Environ., 577, 245–257, https://doi.org/10.1016/j.scitotenv.2016.10.173, 2017.
Wang, Y., Yao, L., Wang, L., Liu, Z., Ji, D., Tang, G., Zhang, J., Sun, Y., Hu, B., and Xin, J.: Mechanism for the formation of the January 2013 heavy haze pollution episode over central and eastern China, Sci. China Earth Sci., 57, 14–25, 2014.
Watson, J. G., Chow, J. C., and Houck, J. E.: PM2.5 chemical source profiles for vehicle exhaust, vegetative burning, geological material, and coal burning in Northwestern Colorado during 1995, Chemosphere, 43, 1141–1151, 2001.
Watson, J. G.: Visibility: Science and regulation, J. Air Waste Manage., 52, 628–713, 2002.
Watson, J. G., Chow, J. C., Lowenthal, D. H., and Magliano, K. L.: Estimating aerosol light scattering at the Fresno Supersite, Atmos. Environ., 42, 1186–1196, 2008.
Wu, C. and Yu, J. Z.: Determination of primary combustion source organic carbon-to-elemental carbon (OC∕EC) ratio using ambient OC and EC measurements: secondary OC-EC correlation minimization method, Atmos. Chem. Phys., 16, 5453–5465, https://doi.org/10.5194/acp-16-5453-2016, 2016.
Wu, Y., Zhang, R., Tian, P., Tao, J., Hsu, S.C., Yan, P., Wang, Q., Cao, J., Zhang, X., and Xia, X.: Effect of ambient humidity on the light absorption amplification of black carbon in Beijing during January 2013, Atmos. Environ., 124, 217–223, 2016.
Wu, Y., Wang, X., Tao, J., Huang, R., Tian, P., Cao, J., Zhang, L., Ho, K.-F., Han, Z., and Zhang, R.: Size distribution and source of black carbon aerosol in urban Beijing during winter haze episodes, Atmos. Chem. Phys., 17, 7965–7975, https://doi.org/10.5194/acp-17-7965-2017, 2017.
Xia, Y., Tao, J., Zhang, L., Zhang, R., Li, S., Wu, Y., Cao, J., Wang, X., Ma, Q., and Xiong, Z.: Impact of size distributions of major chemical components in fine particles on light extinction in urban Guangzhou, Science of The Total Environment, 587–588, 240–247, https://doi.org/10.1016/j.scitotenv.2017.02.127, 2017.
Yao, X., Lau, A. P. S., Fang, M., Chan, C. K., and Hu, M.: Size distributions and formation of ionic species in atmospheric particulate pollutants in Beijing, China: 1-inorganic ions, Atmos. Environ., 37, 2991–3000, 2003.
Yu, H., Wu, C., Wu, D., and Yu, J. Z.: Size distributions of elemental carbon and its contribution to light extinction in urban and rural locations in the pearl river delta region, China, Atmos. Chem. Phys., 10, 5107–5119, https://doi.org/10.5194/acp-10-5107-2010, 2010.
Zhang, F., Xu, L., Chen, J., Yu, Y., Niu, Z., and Yin, L.: Chemical compositions and extinction coefficients of PM2.5 in peri-urban of Xiamen, China, during June 2009–May 2010, Atmos. Res., 106, 150–158, 2012a.
Zhang, H., Wang, S., Hao, J., Wan, L., Jiang, J. S., Zhang, M., Mestl, H. E. S., Alnes, L. W. H., Aunan, K., and Mellouki, A. W.: Chemical and size characterization of particles emitted from the burning of coal and wood in rural households in Guizhou, China, Atmos. Environ., 51, 94–99, 2012b.
Zhang, L., Vet, R., Wiebe, A., Mihele, C., Sukloff, B., Chan, E., Moran, M. D., and Iqbal, S.: Characterization of the size-segregated water-soluble inorganic ions at eight Canadian rural sites, Atmos. Chem. Phys., 8, 7133–7151, https://doi.org/10.5194/acp-8-7133-2008, 2008.
Zhang, R., Jing, J., Tao, J., Hsu, S.-C., Wang, G., Cao, J., Lee, C. S. L., Zhu, L., Chen, Z., Zhao, Y., and Shen, Z.: Chemical characterization and source apportionment of PM2.5 in Beijing: seasonal perspective, Atmos. Chem. Phys., 13, 7053–7074, https://doi.org/10.5194/acp-13-7053-2013, 2013.
Zhang, R., Wang, G., Guo, S., Zamora, M. L., Ying, Q., Lin, Y., Wang, W., Hu, M., and Wang, Y.: Formation of urban fine particulate matter, Chem. Rev., 115, 3803–3855, 2015a.
Zhang, Z., Engling, G., Zhang, L., Kawamura, K., Yang, Y., Tao, J., Zhang, R., Chan, C., and Li, Y.: Significant influence of fungi on coarse carbonaceous and potassium aerosols in a tropical rainforest, Environ. Res. Lett., 10, 034015, https://doi.org/10.1088/1748-9326/10/3/034015, 2015b.
Zhang, Z., Gao, J., Engling, G., Tao, J., Chai, F., Zhang, L., Zhang, R., Sang, X., Chan, C. Y., and Lin, Z.: Characteristics and applications of size-segregated biomass burning tracers in China's Pearl River Delta region, Atmos. Environ., 102, 290–301, 2015c.
Zhao, X. J., Zhao, P. S., Xu, J., Meng,, W., Pu, W. W., Dong, F., He, D., and Shi, Q. F.: Analysis of a winter regional haze event and its formation mechanism in the North China Plain, Atmos. Chem. Phys., 13, 5685–5696, https://doi.org/10.5194/acp-13-5685-2013, 2013.
Zheng, B., Tong, D., Li, M., Liu, F., Hong, C., Geng, G., Li, H., Li, X., Peng, L., Qi, J., Yan, L., Zhang, Y., Zhao, H., Zheng, Y., He, K., and Zhang, Q.: Trends in China's anthropogenic emissions since 2010 as the consequence of clean air actions, Atmos. Chem. Phys., 18, 14095–14111, https://doi.org/10.5194/acp-18-14095-2018, 2018.
Zheng, J., Zhang, L., Che, W., Zheng, Z., and Yin, S.: A highly resolved temporal and spatial air pollutant emission inventory for the Pearl River Delta region, China and its uncertainty assessment, Atmos. Environ., 43, 5112–5122, 2009.
Zheng, M., Hagler, G. S. W., Ke, L., Bergin, M. H., Wang, F., Louie, P. K. K., Salmon, L. G., Sin, D. W. M., Yu, J. Z., and Schauer, J. J.: Composition and sources of carbonaceous aerosols at three contrasting sites in Hong Kong, J. Geophys. Res., 111, D20313, https://doi.org/10.1029/2006JD007074, 2006.
Zhuang, H., Chan, C. K., Fang, M., and Wexler, A. S.: Formation of nitrate and non-sea-salt sulfate on coarse particles, Atmos. Environ., 33, 4223-4233, 1999a.
Zhuang, H., Chan, C. K., Fang, M., and Wexler, A. S.: Size distributions of particulate sulfate, nitrate, and ammonium at a coastal site in Hong Kong, Atmos. Environ., 33, 843–853, 1999b.
Zou, J., Liu, Z., Hu, B., Huang, X., Wen, T., Ji, D., Liu, J., Yang, Y., Yao, Q., and Wang, Y.: Aerosol chemical compositions in the North China Plain and the impact on the visibility in Beijing and Tianjin, Atmos. Res., 201, 235–246, https://doi.org/10.1016/j.atmosres.2017.09.014, 2018.