the Creative Commons Attribution 4.0 License.
the Creative Commons Attribution 4.0 License.
 | 02 Jul 2019
Observational evidence of particle hygroscopic growth in the upper troposphere–lower stratosphere (UTLS) over the Tibetan Plateau
Qianshan He
Xiangdong Zheng
Xiaolu Yan
Holger Vömel
Frank G. Wienhold
Wei Gao
Dongwei Liu
Guangming Shi
Tiantao Cheng
We measured the vertical profiles of backscatter ratio (BSR) using the balloon-borne, lightweight Compact Optical Backscatter AerosoL Detector (COBALD) instruments above Linzhi, located in the southeastern Tibetan Plateau, in the summer of 2014. An enhanced aerosol layer in the upper troposphere–lower stratosphere (UTLS), with BSR (455 nm) > 1.1 and BSR (940 nm) > 1.4, was observed. The color index (CI) of the enhanced aerosol layer, defined as the ratio of aerosol backscatter ratios (ABSRs) at wavelengths of 940 and 455 nm, varied from 4 to 8, indicating the prevalence of fine particles with a mode radius of less than 0.1 µm. We find that unlike the very small particles (mode radius smaller than 0.04 µm) at low relative humidity (RHi < 40 %), the relatively large particles in the aerosol layer were generally very hydrophilic as their size increased dramatically with relative humidity. This result indicates that water vapor can play a very important role in increasing the size of fine particles in the UTLS over the Tibetan Plateau. Our observations provide observation-based evidence supporting the idea that aerosol particle hygroscopic growth is an important factor influencing the radiative properties of the Asian Tropopause Aerosol Layer (ATAL) during the Asian summer monsoon.
- Article
(6326 KB) - Full-text XML
- BibTeX
- EndNote


The Asian Tropopause Aerosol Layer (ATAL) extends over a large area within the Asian summer monsoon circulation and may significantly influence ozone, cirrus clouds, and global climate by chemical, microphysical, and radiative processes (Gettelman et al., 2011; Vernier et al., 2011, 2015; Fadnavis et al., 2013; Thomason and Vernier, 2013). Particles in the ATAL are likely to be lifted to the lower stratosphere by the large-scale upward circulation within the south Asian anticyclone (Park et al., 2007) and then influence the aerosol amount in the global stratosphere significantly. Solomon et al. (2011) found that the radiative forcing of increased aerosols in the global stratosphere from 2000 to 2010 is −0.1 W m−2, which weakened the global warming effect from increasing greenhouse gas concentrations. In addition to the elevated concentration of aerosols found in the ATAL as mentioned above, the concentrations of tropospheric trace gases (i.e., water vapor, CO, CH4, and HCN) are higher within the Asian summer monsoon anticyclone than in surrounding regions, while the stratospheric trace gases (i.e, O3, HNO3, and HCl) are lower (Park et al., 2004; Randel et al., 2010). In fact, the elevated aerosol concentration near the tropopause over the Tibetan Plateau has also been observed by lidar and balloon-borne measurements (Kim et al., 2003; Tobo et al., 2007; He et al., 2014). Li (2005) showed that the aerosol plume is detectable in the anticyclone around the altitude of 150 hPa over the Tibetan Plateau through satellite observations and model study.
Sources and the formation mechanism of aerosols in the UTLS, especially over the tropics, have been studied over the past decades. New particle formation events can occur at very low temperatures accompanied by the outflow of convective systems, as observed in the West African monsoon (Frey et al., 2011). Both condensation and coagulation contribute to the particle growth, even though these two processes are triggered by different mechanisms. Model studies have shown that coagulation is more important than nucleation in the control of the number concentration of fine particles (with a diameter larger than 10 nm) in the UTLS (English et al., 2011; Pierce and Adams, 2009; Timmreck et al., 2010). Compared with coagulation, the effect of condensation on particle growth is less documented in previous studies. Weigel et al. (2011) found that supersaturated gases, which can nucleate to form neutral and charged molecular clusters, also condense onto preexisting aerosol particles. Earlier studies focusing on polar stratospheric clouds (PSCs) over the winter poles demonstrated that stratospheric aqueous H2SO4 aerosol can absorb a large amount of gaseous HNO3 and H2O at temperatures (about 200 K) between the nitric acid trihydrate (NAT) and ice frost points (Carslaw et al., 1994; Tabazadeh et al., 1994), leading to a steep increase in particle volume. These aerosols and PSCs are composed either of supercooled ternary solution (STS) droplets (HNO3•H2O•H2SO4), ice particles, or solid hydrates (most likely NAT) and can grow to larger particles that are easy to sediment (Voigt et al., 2008; Engel, 2013). However, unlike the studies about PSCs, the growth mechanism of the particles in the ATAL is still vague due to the lack of sufficient observations.
In-depth investigations into the aerosol size distribution, chemical composition and growth process are needed for a better understanding of the characteristics and formation mechanism of the ATAL. It is difficult to obtain much more information merely by means of remote-sensing measurements, such as satellite and lidar, because those sensors are not sensitive to ultrafine particles. In such case, balloon and/or airborne in situ measurement provide an additional and even better tool for exploring the ATAL. Using a balloon-borne optical particle counter at Lhasa, China, Tobo et al. (2007) measured the vertical profiles of aerosols and found occurrences of relatively high number concentrations of submicron-size aerosols near the tropopause region during the Asian summer monsoon period. They considered that the enhanced aerosol layer in the UTLS connected closely with the transportation of water vapor from the Asian summer monsoon. An increased amount of water vapor was found in the UTLS within the Asian summer monsoon anticyclone (Bian et al., 2012; Li et al., 2017). A series of balloon-borne activities between 2014 and 2017 over India and Saudi Arabia during the Balloon Measurements of the Asian Tropopause Aerosol Layer (BATAL) campaigns revealed that the ATAL is composed of mostly small (r<0.25 µm) liquid (∼80 %–95 %) aerosols with a dominant composition of nitrate (Vernier et al., 2017). New particle formation and the growth of particles by accretion of additional low-volatility materials (e.g., H2SO4) tend to be an irreversible but slow process due to a limited amount of condensable gases. In contrast, the hygroscopic growth of particles is a dynamic and typically reversible process and may affect the size of particles and its variation in the ATAL more remarkably in a relatively short time since a sufficient amount of water vapor can be frequently lofted to the UTLS via deep convection during the Asian monsoon (Fu et al., 2006).
As part of the project Tibetan Ozone, Aerosol and Radiation (TOAR) (Sander et al., 2014), vertical profiles of aerosols over the southeastern Tibetan Plateau were measured in June and July of 2014. In this paper, we present the results from balloon-borne radiosonde measurements and investigate the effect of hygroscopic growth on the observed sizes and optical properties of fine particles in the UTLS over the Tibetan Plateau.
The field experiment was carried out at the Linzhi Meteorological Bureau (29.67∘ N, 94.33∘ E; 2992 m above sea level, a.s.l.), located in the southeastern Tibetan Plateau, from 6 June to 31 July 2014. During the field campaign, seven balloon sondes were launched, with each sounding taking place at about 16:00 UTC on 18 June (case 1), 24 June (case 2), 6 July (case 3), 15 July (case 4), 21 July (case 5), 25 July (case 6), and 30 July (case 7), respectively. The balloon sonde payload was composed of a Compact Optical Backscatter AerosoL Detector (COBALD) instrument, iMet and RS92 radiosondes, and a cryogenic frost-point hygrometer (CFH). The payload was lifted by a 1600 g latex balloon, which ascended at a rate of 5–7 m s−1. Data were obtained from the lunching point until an altitude of between 30 and 35 km where the balloon generally burst. In this study, only the ascent data are analyzed.
2.1 COBALD particle backscatter sonde
The lightweight COBALD, developed by Thomas Peter's group at ETH Zurich, uses two high-power light-emitting diodes (LEDs) operating at 455 nm (blue) and 940 nm (infrared) with a silicon detector averaging the light scattered back from molecules or aerosols at angles centered near 173∘ for typically 1 s time periods (Rosen and Kjome, 1991; Wienhold, 2012; Cirisan et al., 2014). COBALD measurements are only carried out at local nighttime as daylight saturates the sensitive detector. Before flight, the signal from each backscatter sonde is compared with a dedicated set of four standard backscatter sondes maintained in Laramie. The repeatability of the relative calibration between backscatter sondes is about ±1 %. The absolute calibration is believed accurate to better than ±3 %. Since naturally occurring aerosol backscatter ratios may be quite low, especially in the blue channel, it is important to consider potential sources of error and uncertainty in the absolute values derived from the basic measurements themselves. In the blue channel, a conservative adjustment procedure has been made in the range of 0 % to 4 % to eliminate nonphysical average values occurring in the troposphere (Rosen et al., 1997).
Backscatter ratios (BSRs) at two wavelengths are retrieved from COBALD measurement, which is defined as
where β denotes backscatter coefficient, N the number concentration, and σ the backscatter cross section. The subscripts a and m indicate contributions from aerosol particles and air molecules, respectively. The backscatter cross section for air molecules can be calculated from Rayleigh scattering theory, and the number concentration for air molecules is derived from atmospheric pressure and temperature measured by the radiosonde. The backscattering cross section for aerosol particles can be calculated from Mie scattering theory for a specified effective radius. The aerosol backscatter ratio (ABSR) is defined as
The ABSR values at two wavelengths are used to calculate the color index (CI; Rosen et al., 1997), which is defined as the ABSR at 940 nm divided by the ABSR at 455 nm. The CI is proportional to the ratio of the backscatter cross sections at 940 and 455 nm, and hence it can provide an estimate of the particle size. Assuming an index of refraction of 1.45 with 75 % sulfate and a typical lognormal size distribution of the stratospheric aerosols (Rosen and Kjome, 1991), the backscatter cross sections σa at the wavelengths used by COBALD are calculated by Mie theory, and further the CI as a function of the mean radius of total aerosol particles is derived. Because no information on the standard deviation of the lognormal distribution is available, the possible lower and upper limits of the standard deviation are assumed to be 1.8 and 2.2 (Deshler et al., 2003). By comparing the observed CI with the calculated one for different standard deviations, the range of a possible mean radius can be obtained, and the number concentration and further volume concentration for aerosol particles can be retrieved from the observed ABSR according to the Eq. (1).
2.2 Radiosonde observations
In this study we use the air temperature profiles from the RS92 radiosondes with an uncertainty of ±0.2∘ below 100 hPa and ±0.3∘ between 100 and 20 hPa. The profiles of water vapor are obtained from CFH measurements. The CFH is a microprocessor-controlled instrument with a light weight of 400 g, and it uses a cryogenic liquid as a cooling agent and operates based on the chilled-mirror principle (Vömel et al., 2007a). The uncertainty of frost point or dew point measured by the CFH is smaller than 0.2 K. Correspondingly, the uncertainty in relative humidity is estimated to be 2 % for measurement in the lower troposphere and 5 % in the tropical tropopause region (Vömel et al., 2016). As a standard for water vapor measurements, CFH has been used in numerous intercomparison experiments, such as the validation of Aura Microwave Limb Sounder (MLS) water vapor products, globally (Vömel et al., 2007b) and specifically over the Tibetan Plateau (Yan et al., 2016).
Figure 1 shows the BSR profiles at two wavelengths and calculated CI profiles from COBALD measurement, as well as the profiles of temperature and relative humidity (RHi) over ice, respectively, from RS92 and CFH measurement for three typical cases on 18 June and 15 and 25 July 2014. The COBALD measurements suggest an enhanced aerosol layer (BSR (455 nm) > 1.1 and BSR (940 nm) > 1.4) extending from 200 hPa (∼12 km) to 10 hPa (∼28 km) with a maximum above the tropopause (90 hPa, ∼17 km). The enhanced aerosol layer from COBALD measurement is a mixture of the ATAL and the on-setting Junge layer due to the signal above 50 hPa stemming from the Junge layer but the maximum occurring in the ATAL. The RHi near the maximum of the enhanced aerosol layer varies from 30 % to 40 %, indicating that it cannot be caused by cirrus cloud, which cannot persist at these dry conditions. The calculated CI of the enhanced aerosol layer is around 5 (4–8), far below CI of cirrus cloud (being around 10, with the maximum value exceeding 20) at 250 hPa (Vernier et al., 2015).
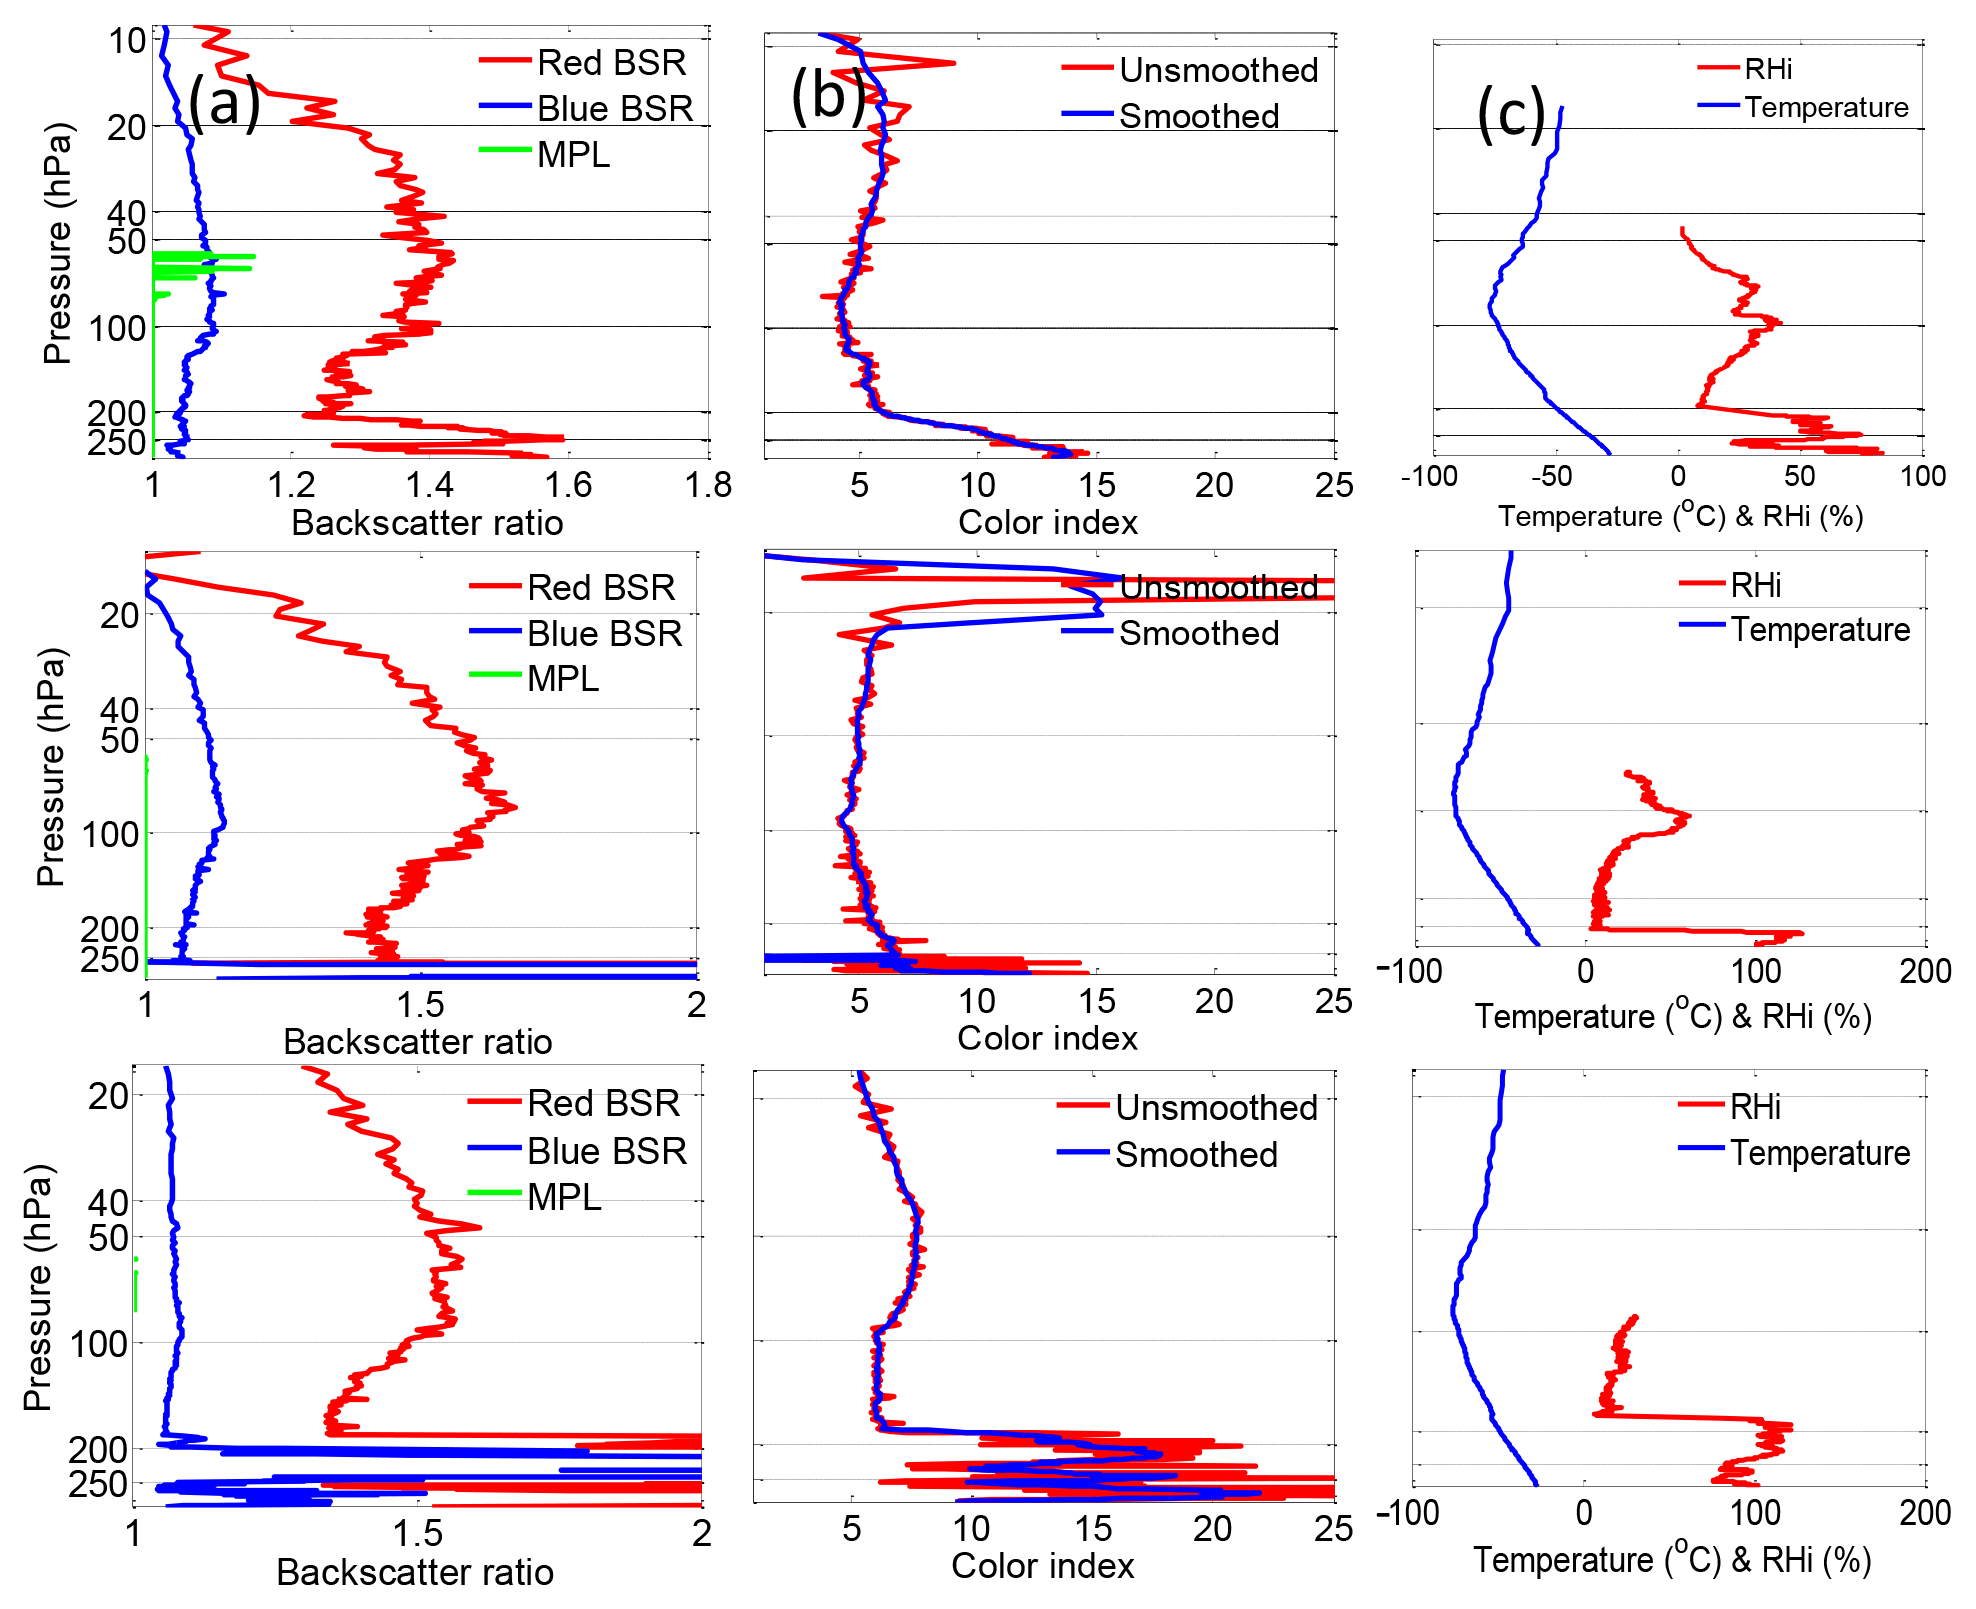
Figure 1(a) Three cases of the backscattering ratio profile from COBALD and Micro Pulse Lidar (MPL) measurements on 18 June (top), 15 July (middle), and 25 July (bottom) in 2014. (b) The calculated CI profiles from the ABSR at two wavelengths. (c) Temperature and RHi profiles measured by the RS92 radiosonde and CFH, respectively.
On 13 February 2014 the Mt. Kelud (8∘ S, 112∘ E) in Indonesia erupted, with a volcanic plume located near 18–21 km within the tropical stratosphere, which was detected 11 d after the eruption by the Cloud-Aerosol Lidar with Orthogonal Polarization (CALIOP) onboard the Cloud-Aerosol Lidar and Infrared Pathfinder Satellite Observation (CALIPSO) (Vernier et al., 2016). Stratospheric aerosols were perturbed significantly by the Kelud volcanic plumes, especially the fresh ash plume in the Southern Hemisphere (Vernier et al., 2016; Sakai et al., 2016). The Kelud volcanic eruption might have negligible influence on the observed aerosols in the ATAL, since the ATAL began to form about 4 months after the Kelud eruption when the volcanic materials in the troposphere might have vanished. On the other hand, CALIOP data analysis also showed that sulfate components from the Kelud volcanic eruption, peaking at an higher altitude with a longer residence time compared with the volcanic ashes, influenced aerosol optical depth (AOD) between 20∘ N and 20∘ S (18–25 km) considerably 3 months after the eruption (Vernier et al., 2016). It is likely that sulfate aerosols from the Kelud eruption contributed to stratospheric background aerosols above the ATAL and even in the Junge layer at a slightly higher latitude, as indicated by our COBALD measurements.
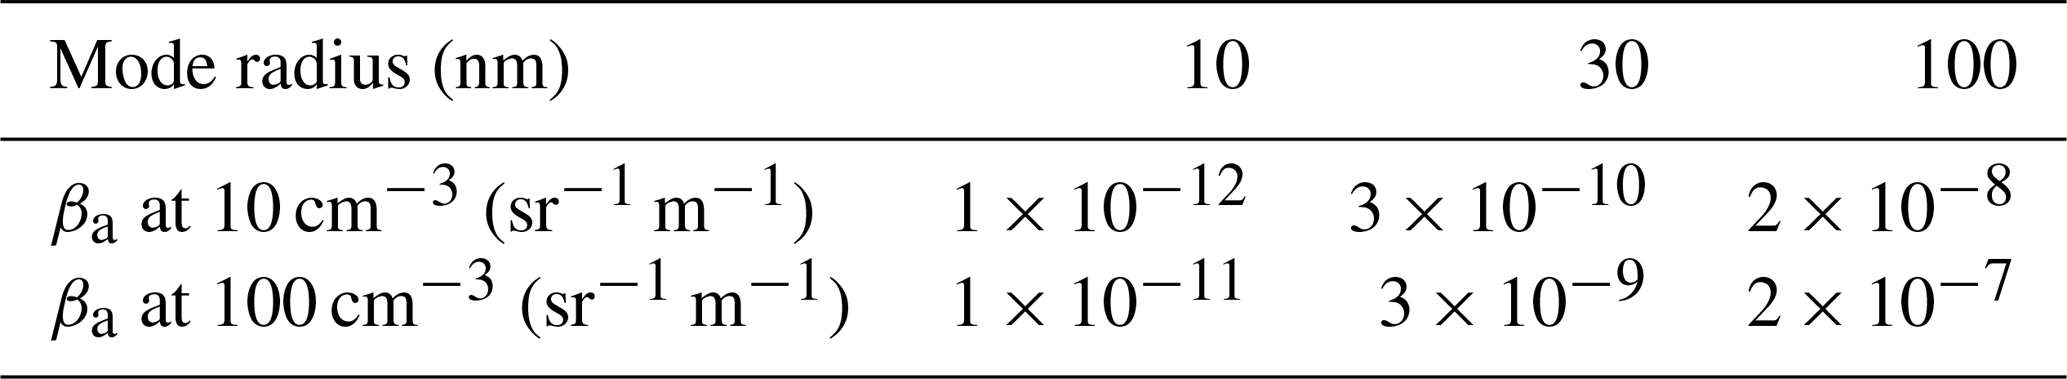
Pinnick et al. (1975) adopted a lognormal distribution with a mode radius of 0.0725 µm and a standard deviation (σ) of 1.86 to parameterize the background aerosols in the stratosphere. Rosen and Kjome (1991) suggested a mode radius between 0.04 and 0.06 µm and a σ value of ∼2.0–2.2 for the 20 km stratospheric aerosol background layer. In this study, the CI as a function of mode radius was derived from Mie calculation using a lognormal distribution for a different size of aerosols with standard deviations (σ) of 1.8 and 2.2, respectively, and the result is shown in Fig. 2. The signal-to-noise ratio at the blue channel with respect to the molecular Rayleigh backscatter in tropopause conditions (taken at 100 hPa and 210 K) is 220. Given the molecular backscatter coefficient of (sr−1 m−1) for 455 nm, this corresponds to a backscatter coefficient minimum detection limit of (sr−1 m−1), which in general holds over the entire profile. To define an aerosol size limit, typical aerosol number densities need to be assumed: 10 cm−3 for stratospheric background and 100 cm−3 for the ATAL. The aerosol backscatter coefficients of a different aerosol mode radius for the typical aerosol number densities are calculated by Mie theory and listed in Table 1. The results confirm that the particles with 100 nm radius are well detected under background conditions, which mainly contribute to the particulate backscatter ratio of approximately 0.01 and is always present. With increasing particle number density, the particles with 30 nm radius start to contribute to the particulate backscatter ratio ( sr−1 m−1). Therefore, the lower size boundary that cannot be observed by COBALD due to the lack of scattering efficiency of small aerosols can be defined as 30 nm.

Figure 2CI as a function of mode radius from Mie calculation assuming an index of refraction of 1.45 and a lognormal size distribution with the indicated standard deviations (σ) of 1.8 and 2.2. The dotted and dashed lines represent the minimum (∼4) and maximum (∼8) CI of the enhanced aerosol layer from COBALD measurement for all cases.
Table 1The aerosol backscatter coefficients of different aerosol mode radius for the typical aerosol number densities.
The CI increases monotonously from 1 to 15 with the mode radius growing from 1 nm to 1 µm. The CI of the enhanced aerosol layer from COBALD measurement usually varied from 4 to 8 as indicated in this figure. With the assumed lognormal widths, the measured CI imposes an upper limit of 100 nm on the particle radius. Therefore, we conclude that the enhanced aerosol layer is composed of a large number of fine particles with a radius of less than 0.1 µm. It has been documented that aerosols in the UTLS are mainly composed of liquid inorganics with typical mode radii smaller than 0.1 µm (Tobo et al., 2007). Our observations in Linzhi are consistent with previous findings.
The middle troposphere over the Tibetan Plateau is likely to act as a pipe for the transport of water vapor from the marine boundary layer (i.e., the Indian Ocean and South China Sea) to the UTLS, leading to an increase in the H2O mixing ratio near the tropopause (Fu et al., 2006; Lelieveld et al., 2007). Figure 3a presents the CFH H2O profiles from 110 hPa (∼16 km a.s.l.) to 90 hPa (∼17.5 km a.s.l.). It is noticed that the H2O mixing ratio changes greatly in the vertical direction (3–12 ppmv) for some cases. The dehydration process results in a minimum H2O mixing ratio just above the altitude of each lowest temperature. A pronounced decrease in the H2O mixing ratio from 110 to 90 hPa is attributed to the convective transport of moist air parcels just occurring during the balloon flying periods. The three relatively uniform H2O profiles (on 18 June and 25 and 30 July) correspond to the well-mixed status of strong upward transport prior to the balloon-based measurements. The water vapor cycle driven by synoptic-scale convection increases the possibility of aerosol hygroscopic growth near the tropopause over the Tibetan Plateau. It has been estimated that the scattering ratio could increase by 10 % to 50 % with a water vapor mixing ratio enhancement from 3 to 6 ppmv (Vernier et al., 2011).
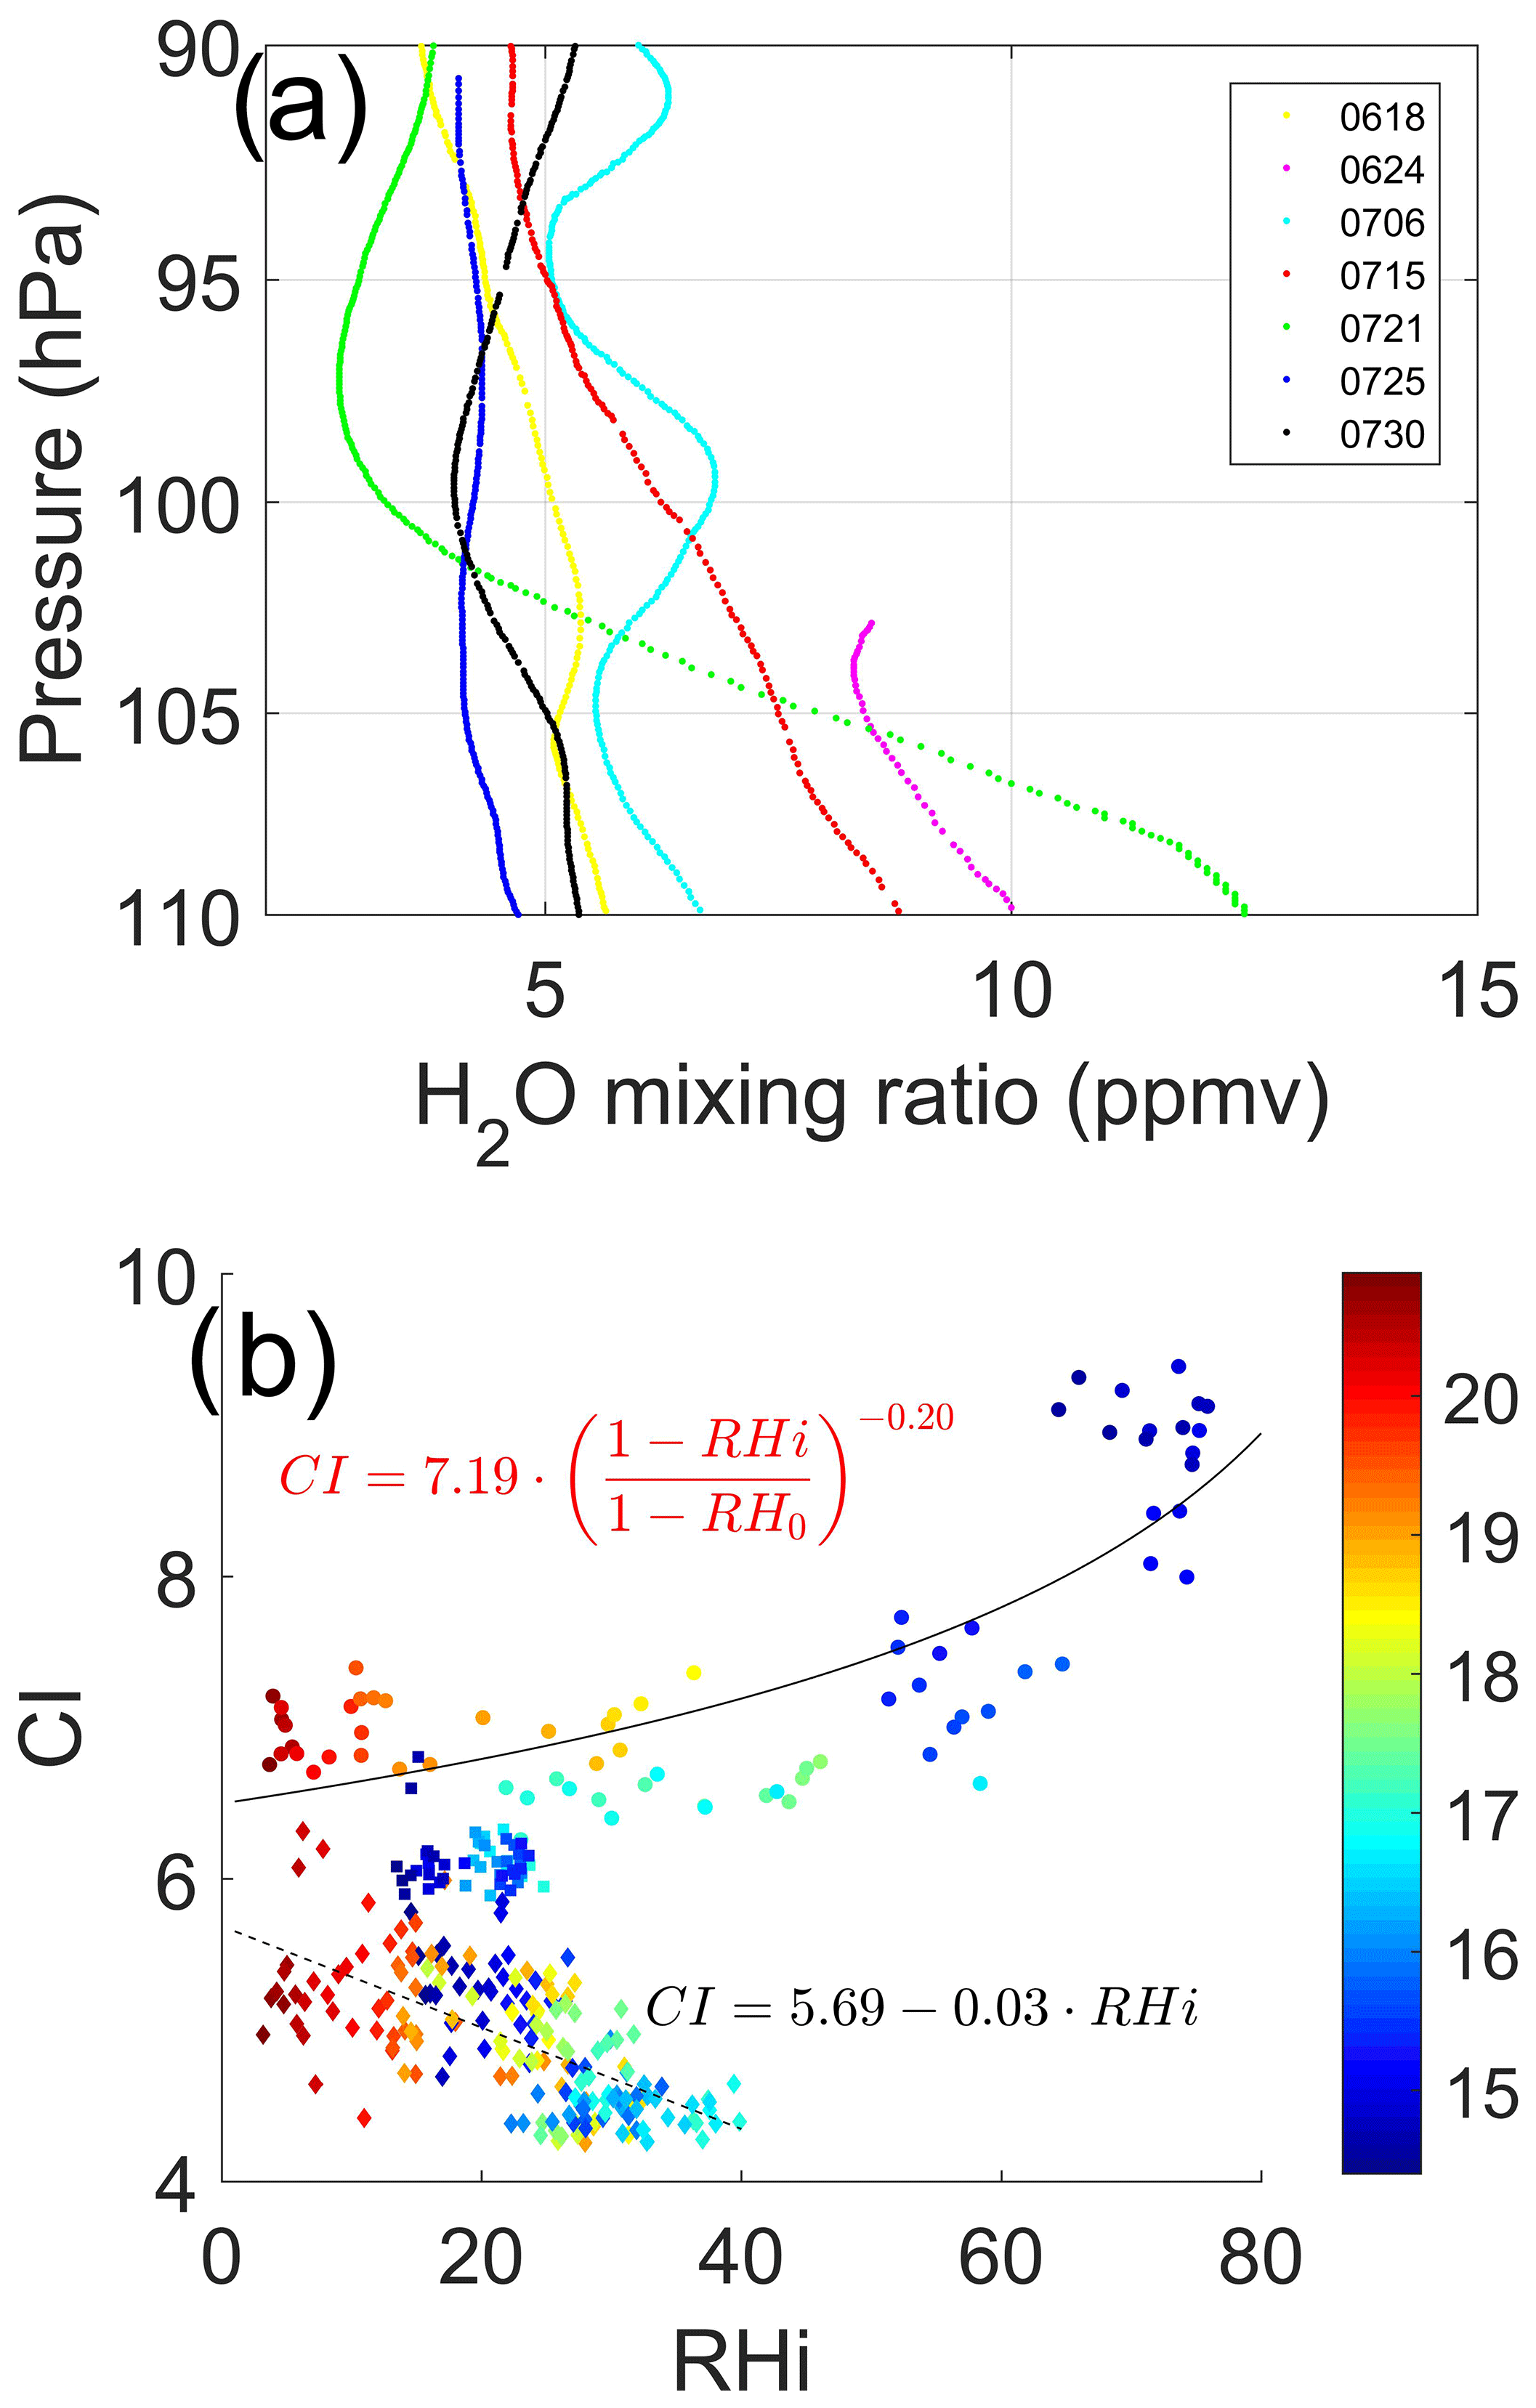
Figure 3(a) H2O mixing ratio from CFH measurements and (b) the variation in CI with RHi between 50 and 150 hPa for all cases. The circle, square, and diamond symbols refer to those particles with CI of dry aerosol larger than, close to, and smaller than about 6, respectively. The altitude (in kilometers) where particles were measured is marked with different colors. The two fitted equations exceed the 99 % significance level.
Figure 3b presents the variation in CI with RHi for all cases between 50 and 150 hPa, the typical altitude range for the ATAL. The dependence of CI on RHi can be divided into three types according to the CI of dry aerosols, i.e., the aerosols existing at very low relative humidity (e.g., RHi < 20 %):
-
when the CI of dry aerosol is larger than about 6, the CI of the enhanced aerosol layer shows an exponential growth with increasing RHi;
-
when the CI of dry aerosol is smaller than about 6, the CI of the enhanced aerosol layer decreases with increasing RHi with a slope of −0.03;
-
when the CI of dry aerosol is close to 6, it stays almost constant with the variation in RHi.
As the CI can be regarded as an indicator of aerosol particle size, it can be inferred that for those aerosol particles with large dry sizes (Type 1; i.e., CI > 6), increasing RHi facilitates water vapor and other gaseous precursors to condense onto preexisting aerosol particles and then contribute to the particle growth. For those with small dry sizes (Type 2 and Type 3; i.e., CI < = 6), the situation appears to be more completed and cannot be fully understood without more detailed information about aerosol chemical composition and their gas precursors. Since all these aerosol particles were observed at very low RHi, well below 40 % deliquescence relative humidity of most of the salts (e.g., 40 % for NH4HSO4) (Benson et al., 2009), the hygroscopic growth should have a negligible effect on the size of these particles under this condition. New particle formation through the gas-to-particle conversion process, which tends to become faster with increasing RH (Fountoukis and Nenes, 2007), increases the number concentration, resulting in a decrease in the mode radius of bulk aerosols. Therefore, the decrease in CI with RHi (Type 2) indicates that new particle formation might play an important role in the formation and prevalence of fine particles in the UTLS over the Tibetan Plateau.
Based on the BSR and CI at the UTLS altitudes (50–150 hPa) from COBALD, we calculated the aerosol volume concentration in the enhanced aerosol layer for the two typical CI variation trends according to an assumption of lognormal size distribution with a standard deviation of 1.8. The variation in aerosol volume concentration distributions with RHi is shown in Fig. 4. It can be seen from Fig. 4a that when RHi is less than 60 %, the aerosol mode radius ranges mostly between 0.04 and 0.07 µm, and it increases steeply to 0.2 µm when RHi is more than 60 %. The aerosol volume concentrations are obviously high compared with those in dry conditions, especially for those particles with a mode radius of 0.1 µm. For those aerosols with a small initial dry particle size (as shown in Fig. 4b), accompanied by a mode radius decrease from 0.04 to 0.03 µm, the aerosol volume concentration increases by 4–5 times when RHi rises from nearly zero to 40 %, indicating that the number concentrations experience an explosive increase due to the formation of new particles.
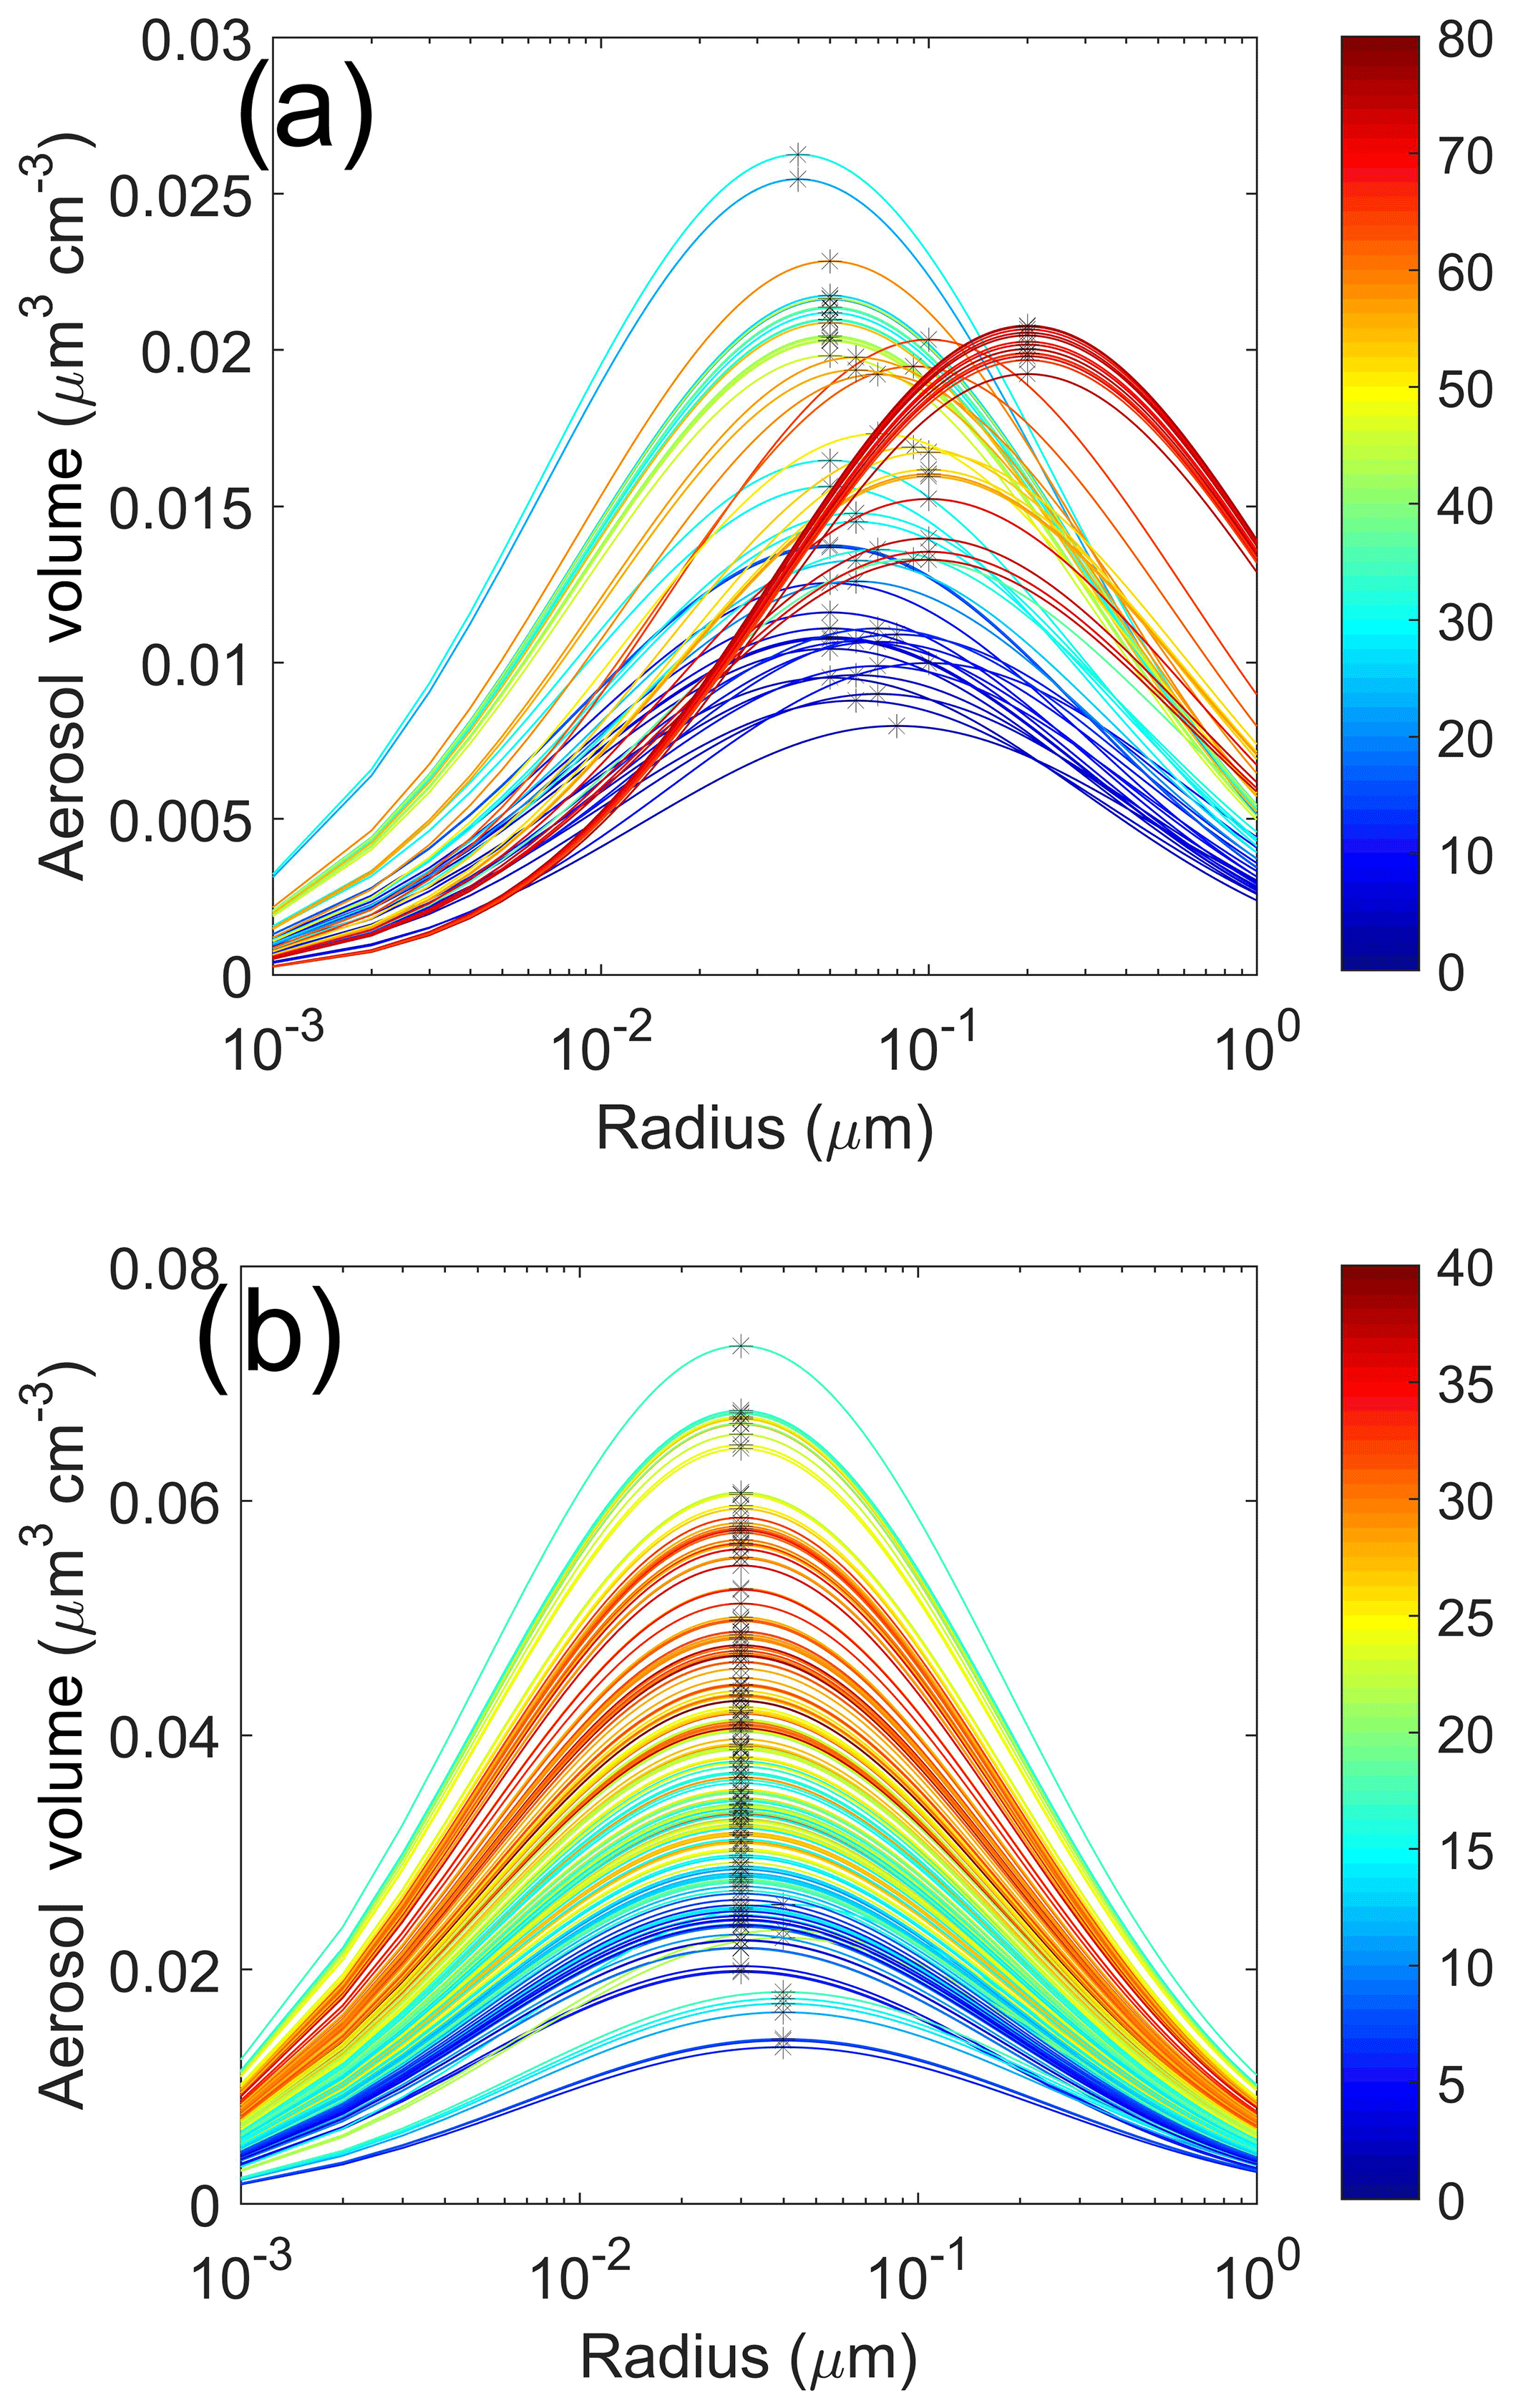
Figure 4The variation in aerosol volume concentration distributions in the enhanced aerosol layer with RHi for (a) case 5 (21 July), and (b) the other cases corresponding to the CI < 6 case (diamonds) in Fig. 3b. The color of each distribution represents RHi, indicated by the color bar. The asterisk is the mode radius of each distribution.
The vertical profiles of aerosol BSR measured over the southeastern Tibetan Plateau during summertime demonstrate an enhanced aerosol layer, consisting predominantly of fine particles with a mode radius smaller than 0.1 µm, in the UTLS. The size of particles in the enhanced aerosol layer shows an exponential increase with increasing RHi when the CI of dry aerosols is larger than 6 (corresponding mode radius larger than 0.04 µm). It can be inferred that increasing RHi leads to more condensation of water vapor onto preexisting aerosol particles and contributes to the particle growth. For the CI of dry aerosols smaller than about 6 (i.e., mode radius smaller than 0.04 µm), the size of particles in the enhanced aerosol layer decreases with increasing RHi when RHi is below 40 %, lower than the typical aerosol deliquescence point. In this case, new particle formation, which results in a decrease in aerosol mode radius and an increase in number concentration, can play an important role in the accumulation of large amounts of fine particles in the UTLS over the Tibetan Plateau. It must be borne in mind that the conclusions drawn from this study are only based on seven balloon flights so that general conclusions should be treated with caution. In fact, chemical interactions involved in the stratosphere troposphere exchange are complicated and further experimental and model studies are needed to understand the nature and origin of the ATAL and its influence on global atmospheric chemistry and climate.
The datasets can be obtained from the corresponding author upon request.
QH, JM, and XZ designed the study. HV and FGW, respectively, contributed to data quality control of COBALD and CFH. Guangming Shi calculated Mie scattering parameters. WG, DL, and TC contributed to data analysis, numerical experiments, interpretation, and paper writing. XY executed the in situ balloon sonde observation. QH did further analysis and interpreted the results. All authors contributed to improving the paper.
The authors declare that they have no conflict of interest.
This article is part of the special issue “Study of ozone, aerosols and radiation over the Tibetan Plateau (SOAR-TP) (ACP/AMT inter-journal SI)”. It is not associated with a conference.
We thank all TOAR team members and the staff from the Tibet Meteorological Service for assisting our experiment work. We also thank Yutaka Tobo, whose useful suggestions have greatly improved the paper.
This research has been supported by the National Natural Science Foundation of China (grant nos. 91637101, 91837311 and 91537213) and the Shanghai Science and Technology Committee Research Project (grant no. 16ZR1431700).
This paper was edited by Joachim Curtius and reviewed by two anonymous referees.
Benson, D. R., Erupe, M. E., and Lee, S. H.: Laboratory-measured H2SO4-H2O-NH3 ternary homogeneous nucleation rates: Initial observations, Geophys. Res. Lett., 36, L15818, https://doi.org/10.1029/2009gl038728, 2009.
Bian, J., Pan, L. L., Paulik, L., Vömel, H., Chen, H., and Lu, D.: In situ water vapor and ozone measurements in Lhasa and Kunming during the Asian summer monsoon, Geophys. Res. Lett., 39, 19808, https://doi.org/10.1029/2012GL052996, 2012.
Carslaw, K. S., Luo, B. P., Clegg, S. L., Peter, T. H., Brimblecombe, P., and Crutzen, P. J.: Stratospheric aerosol growth and HNO3 gas phase depletion from coupled HNO3 and water uptake by liquid particles, Geophys. Res. Lett., 21, 2479–2482, 1994.
Cirisan, A., Luo, B. P., Engel, I., Wienhold, F. G., Sprenger, M., Krieger, U. K., Weers, U., Romanens, G., Levrat, G., Jeannet, P., Ruffieux, D., Philipona, R., Calpini, B., Spichtinger, P., and Peter, T.: Balloon-borne match measurements of midlatitude cirrus clouds, Atmos. Chem. Phys., 14, 7341–7365, https://doi.org/10.5194/acp-14-7341-2014, 2014.
Deshler, T., Hervig, M. E., Hofmann, D. J., Rosen, J. M., and Liley, J. B.: Thirty years of in situ stratospheric aerosol size distribution measurements from Laramie, Wyoming (41∘ N), using balloon-borne instruments, J. Geophys. Res., 108, 4167, https://doi.org/10.1029/2002JD002514, 2003.
Engel, I.: The Role of Heterogeneous Nucleation in Polar Stratospheric Cloud Formation: Microphysical Modeling, ETH ZURICH, Doctor Dissertation, 2013.
English, J. M., Toon, O. B., Mills, M. J., and Yu, F.: Microphysical simulations of new particle formation in the upper troposphere and lower stratosphere, Atmos. Chem. Phys., 11, 9303–9322, https://doi.org/10.5194/acp-11-9303-2011, 2011.
Fadnavis, S., Semeniuk, K., Pozzoli, L., Schultz, M. G., Ghude, S. D., Das, S., and Kakatkar, R.: Transport of aerosols into the UTLS and their impact on the Asian monsoon region as seen in a global model simulation, Atmos. Chem. Phys., 13, 8771–8786, https://doi.org/10.5194/acp-13-8771-2013, 2013.
Frey, W., Borrmann, S., Kunkel, D., Weigel, R., de Reus, M., Schlager, H., Roiger, A., Voigt, C., Hoor, P., Curtius, J., Krämer, M., Schiller, C., Volk, C. M., Homan, C. D., Fierli, F., Di Donfrancesco, G., Ulanovsky, A., Ravegnani, F., Sitnikov, N. M., Viciani, S., D'Amato, F., Shur, G. N., Belyaev, G. V., Law, K. S., and Cairo, F.: In situ measurements of tropical cloud properties in the West African Monsoon: upper tropospheric ice clouds, Mesoscale Convective System outflow, and subvisual cirrus, Atmos. Chem. Phys., 11, 5569–5590, https://doi.org/10.5194/acp-11-5569-2011, 2011.
Fountoukis, C. and Nenes, A.: ISORROPIA II: a computationally efficient thermodynamic equilibrium model for K+-Ca2+-Mg2+--Na+---Cl−H2O aerosols, Atmos. Chem. Phys., 7, 4639–4659, https://doi.org/10.5194/acp-7-4639-2007, 2007.
Fu, R., Hu, Y., Wright, J. S., Jiang, J. H., Dickinson, R. E., Chen, M., Filipiak, M., Read, W. G., Waters, J. W., and Wu, D. L.: Short circuit of water vapor and polluted air to the global stratosphere by convective transport over the Tibetan Plateau, P. Natl. Acad. Sci. USA, 103, 5664–5669, https://doi.org/10.1073/pnas.0601584103, 2006.
Gettelman, A., Hoor, P., Pan, L. L., Randel, W. J., Hegglin, M. I., and Birner, T.: The extratropical upper troposphere and lower stratosphere, Rev. Geophys., 49, RG3003, https://doi.org/10.1029/2011RG000355, 2011.
He, Q. S., Li, C. C., Ma, J. Z., Wang, H. Q., Yan, X. L., Lu, J., Liang, Z. R., and Qi, G. M.: Lidar-observed enhancement of aerosols in the upper troposphere and lower stratosphere over the Tibetan Plateau induced by the Nabro volcano eruption, Atmos. Chem. Phys., 14, 11687–11696, https://doi.org/10.5194/acp-14-11687-2014, 2014.
Kim, Y. S., Shibata, T., Iwasaka, Y., Shi, G. Y., Zhou, X. J., Tamura, K., and Ohashi, T.: Enhancements of aerosols near the cold tropopause in summer over Tibetan Plateau: Lidar and balloon borne measurements in 1999 at Lhasa, Tibet, China, Proc. SPIE, 4893, 496–503, https://doi.org/10.1117/12.466090, 2003.
Lelieveld, J., Brühl, C., Jöckel, P., Steil, B., Crutzen, P. J., Fischer, H., Giorgetta, M. A., Hoor, P., Lawrence, M. G., Sausen, R., and Tost, H.: Stratospheric dryness: model simulations and satellite observations, Atmos. Chem. Phys., 7, 1313–1332, https://doi.org/10.5194/acp-7-1313-2007, 2007.
Li, D., Vogel, B., Bian, J., Müller, R., Pan, L. L., Günther, G., Bai, Z., Li, Q., Zhang, J., Fan, Q., and Vömel, H.: Impact of typhoons on the composition of the upper troposphere within the Asian summer monsoon anticyclone: the SWOP campaign in Lhasa 2013, Atmos. Chem. Phys., 17, 4657–4672, https://doi.org/10.5194/acp-17-4657-2017, 2017.
Li, Q.: Trapping of Asian pollution by the Tibetan anticyclone: A global CTM simulation compared with EOS MLS observations, Geophys. Res. Lett., 32, L14826, https://doi.org/10.1029/2005GL022762, 2005.
Park, M., Randel, W. J., Kinnison, D. E., Garcia, R. R., and Choi, W.: Seasonal variation of methane, water vapor, and nitrogen oxides near the tropopause: Satellite observations and model simulations, J. Geophys. Res., 109, D03302, https://doi.org/10.1029/2003JD003706, 2004.
Park, M., Randel, W. J., Gettelman, A., Massie, S. T., and Jiang, J. H.: Transport above the Asian summer monsoon anticyclone inferred from Aura Microwave Limb Sounder tracers, J. Geophys. Res., 112, D16309, https://doi.org/10.1029/2006jd008294, 2007.
Pierce, J. R. and Adams, P. J.: Can cosmic rays affect cloud condensation nuclei by altering new particle formation rates?, Geophys. Res. Lett., 36, L09820, https://doi.org/10.1029/2009GL037946, 2009.
Pinnick, R. G., Rosen, J. M., and Hofmann, D. J.: Stratospheric Aerosol Measurements III: Optical Model Calculations, J. Atmos. Sci., 33, 304–314, 1975.
Randel, W. J., Park, M., Emmons, L., and Pumphrey, H. C.: Asian monsoon transport of pollution to the stratosphere, Science, 328, 611–613, https://doi.org/10.1126/science.1182274, 2010.
Rosen, J. and Kjome, N.: Backscatter sonde: a new instrument for atmospheric aerosol research, Appl. Optics, 30, 1552–1561, 1991.
Rosen, J., Kjome, N., and Liley, J.: Tropospheric aerosol backscatter at a midlatitude site in the northern and southern hemispheres, J. Geophys. Res., 102, 21329–21339, 1997.
Sakai, T., Uchino, O., Nagai, T., Liley, B., Morino, I., and Fujimoto, T.: Long-term variation of stratospheric aerosols observed with lidars over tsukuba, japan, from 1982 and lauder, new zealand, from 1992 to 2015, J. Geophys. Res., 121, 10283–10293, 2016.
Sander, R., Su, H., Wagner, T., Wang, T., Cheng, Y., Xu, X., Tian, W., and Yin, Y. (Eds.): Study of ozone, aerosols and radiation over the Tibetan Plateau (SOAR-TP) (ACP/AMT inter-journal SI), Atmos. Chem. Phys., https://www.atmos-chem-phys.net/special_issue331.html, 2014.
Solomon, S., Daniel, J. S., Neely III, R. R., Vernier, J. P., Dutton, E. G., and Thomason, L. W.: The persistently variable background stratospheric aerosol layer and global climate change, Science, 333, 866–870, https://doi.org/10.1126/science.1206027, 2011.
Tabazadeh, A., Turco, R. P., and Jacobson, M. Z.: A model for studying the composition and chemical effects of stratospheric aerosols, J. Geophys. Res., 99, 12897–12914, 1994.
Thomason, L. W. and Vernier, J.-P.: Improved SAGE II cloud/aerosol categorization and observations of the Asian tropopause aerosol layer: 1989–2005, Atmos. Chem. Phys., 13, 4605–4616, https://doi.org/10.5194/acp-13-4605-2013, 2013.
Timmreck, C., Graf, H. F., Lorenz, S. J., Niemeier, U., Zanchettin, D., Matei, D., Jungclaus, J. H., and Crowley, T. J.: Aerosol size confines climate response to volcanic super-eruptions, Geophys. Res. Lett., 37, L24705, https://doi.org/10.1029/2010GL045464, 2010.
Tobo, Y., Iwasaka, Y., Shi, G. Y., Kim, S., Ohashi, T., Tamura, K., and Zhang, D. Z.: Balloon-borne observations of high aerosol concentrations near the summertime tropopause over the Tibetan Plateau, Atmos. Res., 84, 233–241, https://doi.org/10.1016/j.atmosres.2006.08.003, 2007.
Vernier, J. P., Thomason, L. W., and Kar, J.: CALIPSO detection of an Asian tropopause aerosol layer, Geophys. Res. Lett., 38, L07804, https://doi.org/10.1029/2010GL046614, 2011.
Vernier, J. P., Fairlie, T. D., Natarajan, M., Wienhold, F. G., Bian, J., Martinsson, B. G., Crumeyrolle, S., Thomason, L. W., and Bedka, K. M.: Increase in upper tropospheric and lower stratospheric aerosol levels and its potential connection with Asian pollution, J. Geophys. Res.-Atmos., 120, 1608–1619, 2015.
Vernier, J. P., Fairlie, T. D., Deshler, T., Natarajan, M., Knepp, T., and Foster, K.: In situ and space-based observations of the kelud volcanic plume: the persistence of ash in the lower stratosphere, J. Geophys. Res.-Atmos., 121, 11104–11118, 2016.
Vernier, J. P., Fairlie, T. D., Deshler, T., Kumar, B. S., Natarajan, M., Pandit, A. K., Akhil Raj, S. T., Hemanth Kumar, A., Jayaraman, A., Singh, A., Rastogi, N., Sinha,P. R., Kumar, S., Tiwari, S., Wegner, T., Baker, N., Vignelles, D., Stenchikov, G., Shevchenko, I., Smith, J., Bedka, K., Kesarkar, A., Singh, V., Bhate, J., Ravikiran, V., Durga Rao, M., Ravindrababu, S., Patel, A., Vernier, H., Wienhold, F. G., Liu, H., Knepp, T. N., Thomason, L., Crawford, J., Ziemba, L., Moore, J., Crumeyrolle, S., Williamson, M., Berthet, G., Jégou, F., and Renard, J. B.: BATAL: The Balloon measurement campaigns of the Asian Tropopause Aerosol Layer, B. Am. Meteorol. Soc., 99, 955–973, 2017.
Voigt, C., Schlager, H., Roiger, A., Stenke, A., de Reus, M., Borrmann, S., Jensen, E., Schiller, C., Konopka, P., and Sitnikov, N.: Detection of reactive nitrogen containing particles in the tropopause region – evidence for a tropical nitric acid trihydrate (NAT) belt, Atmos. Chem. Phys., 8, 7421–7430, https://doi.org/10.5194/acp-8-7421-2008, 2008.
Vömel, H., Selkirk, L., Miloshevich, J., Valverde-Canossa, J., Valdes, J., and Diaz, J.: Radiation Dry Bias of the Vaisala RS92 Humidity Sensor, J. Atmos. Ocean. Tech., 24, 953–963, 2007a.
Vömel, H., Barnes, J. E., Forno, R., Fujiwara, M., Hasebe, F., Iwasaki, S., Kivi, R., Komala, N., Kyrö, E., Leblanc, T., Morel, B., Ogino, S. Y., Read, W. G., Ryan, S. C., Saraspriya, S., Selkirk, H., Shiotani, M., Valverde Canossa, J., and Whiteman, D. N.: Validation of Aura Microwave Limb Sounder water vapor by balloon-borne Cryogenic Frost point Hygrometer measurements, J. Geophys. Res., 112, D24S37, https://doi.org/10.1029/2007JD008698, 2007b.
Vömel, H., Naebert, T., Dirksen, R., and Sommer, M.: An update on the uncertainties of water vapor measurements using cryogenic frost point hygrometers, Atmos. Meas. Tech., 9, 3755–3768, https://doi.org/10.5194/amt-9-3755-2016, 2016.
Weigel, R., Borrmann, S., Kazil, J., Minikin, A., Stohl, A., Wilson, J. C., Reeves, J. M., Kunkel, D., de Reus, M., Frey, W., Lovejoy, E. R., Volk, C. M., Viciani, S., D'Amato, F., Schiller, C., Peter, T., Schlager, H., Cairo, F., Law, K. S., Shur, G. N., Belyaev, G. V., and Curtius, J.: In situ observations of new particle formation in the tropical upper troposphere: the role of clouds and the nucleation mechanism, Atmos. Chem. Phys., 11, 9983–10010, https://doi.org/10.5194/acp-11-9983-2011, 2011.
Wienhold, F. G.: COBALD Data Sheet, available at: http://www.iac.ethz.ch/groups/peter/research/Balloon_soundings/COBALD_sensor (last access: June 2019), 2012.
Yan, X., Wright, J. S., Zheng, X., Livesey, N. J., Vömel, H., and Zhou, X.: Validation of Aura MLS retrievals of temperature, water vapour and ozone in the upper troposphere and lower–middle stratosphere over the Tibetan Plateau during boreal summer, Atmos. Meas. Tech., 9, 3547–3566, https://doi.org/10.5194/amt-9-3547-2016, 2016.