the Creative Commons Attribution 4.0 License.
the Creative Commons Attribution 4.0 License.
 | 17 Jan 2019
Relationship between erythema effective UV radiant exposure, total ozone, cloud cover and aerosols in southern England, UK
Nezahat Hunter
Rebecca J. Rendell
Michael P. Higlett
John B. O'Hagan
Richard G. E. Haylock
Evidence of an underlying trend in the dependence of erythema effective ultraviolet (UV) radiant exposure (Her) on changes in the total ozone, cloud cover and aerosol optical depth (AOD) has been studied using solar ultraviolet radiation measurements collected over a 25-year period (1991–2015) at Chilton in the south of England in the UK.
The monthly mean datasets of these measures corrected for underlying seasonal variation were analysed. When a single linear trend was fitted over the whole study period between 1991 and 2015, the analyses revealed that the long-term variability of Her can be best characterised in two sub-periods (1991–2004 and 2004–2015), where the estimated linear trend was upward in the first period (1991–2004) but downward in the second period (2004–2015).
Both cloud cover (CC) and total ozone (TO) were found to have a highly statistically significant influence on Her, but the influence of the AOD measure was very small. The radiation amplification factor (RAF) for the erythema action spectrum due to TO was −1.03 at constant levels of CC over the whole study period; that is, for a 1.0 % increase in TO, Her decreases by 1.03 %. Over the first period (1991–2004), the RAF related to CC was slightly higher at 0.97 compared to that for TO at 0.79. The proportion of the change in Her explained by the change in CC (47 %) was much greater than the proportion explained by changes in TO (8 %). For the second period (2004–2015), the pattern reversed, with the observed RAF related to TO being −1.25, almost double that of CC (−0.65). Furthermore, in this period the proportion of variation in Her explained by TO variation was 33 %, double that of CC at 16 %, while AOD changes had a negligible effect (1 %).
When the data were examined separately for each season, for the first period (1991–2004) the greatest effect of TO and CC on Her (i.e. the largest RAF value) was found during spring. Spring was also the season during which TO and CC variation explained the greatest proportion of variability in Her (82 %). In the later period (2004–2015), the RAF and greatest influence of TO and CC were observed in winter (67 %) and the AOD effect explained a further 5 % variability in Her.
This study provides evidence that both the increasing trend in Her for 1991–2004 and the decreasing trend in Her for 2004–2015 occur in response to variation in TO, which exhibits a small increasing tendency over these periods. CC plays a more important role in the increasing trend in Her for 1991–2004 than TO, whereas for 2004–2015, the decreasing trend in Her is less associated with changes in CC and AOD.
- Article
(2318 KB) - Full-text XML
- BibTeX
- EndNote


Ultraviolet (UV) radiation is only a small portion of the radiation we receive from the sun, but it has become a topic of increasing concern because of the harmful health effects it can cause. Stratospheric ozone is a naturally occurring gas that filters the sun's UV radiation. It absorbs most of the shorter wavelength UV-B radiation, whereas longer wavelength UV-A radiation mostly passes through the ozone layer and reaches the ground (WMO, 2014). However, in the mid-1970s it was discovered that the release of man-made chlorine-containing chemicals could cause stratospheric ozone depletion. In subsequent years temporary ozone holes appeared over the Antarctic and to a lesser extent in the Arctic (Farman et al., 1985). Stratospheric ozone depletion was also detected over populated areas such as Australia, most notably in spring when the ozone layer over Antarctica is dramatically thinned (Gies et al., 2013). Since the late 1970s, the effects of ozone depletion on UV radiation have been the subject of a large number of studies published in the literature. These studies have demonstrated that the ozone level decreased up to the mid-1990s, resulting in an increase in the amount of UV radiation reaching the Earth's surface (WHO, 2006). Concern was raised that in the long term, ozone depletion would result in significantly increased ultraviolet radiation (UVR) which in turn may result in an increased incidence of skin cancers, particularly melanoma. An increase in UVR may also cause other negative health impacts, such as sunburn, ocular pathologies, premature skin aging and a weakened immune system (AGNIR, 2002; WHO, 2006; Lucas et al., 2010; UNEP, 2010; Norval et al., 2011). However, UV radiation exposure also has known benefits to health such as the production of vitamin D, which promotes healthy bones and may help in the prevention of certain illnesses including heart diseases and cancers (Holick, 2007; McKenzie et al., 2009; Young, 2009; Epplin and Thomas, 2010).
The Montreal Protocol came into effect in 1989, banning multiple substances responsible for ozone depletion. From 1997 to the mid-2000s it became apparent that a decline in total column ozone (TO) had stopped at almost all non-polar latitudes (WMO, 2007). However, the pace of the recovery is affected by changes in temperatures, circulation and the nitrogen and hydrogen ozone-loss cycles (Waugh et al., 2009). The ozone level has remained relatively unchanged since 2000, with most studies reporting a plateau or a limited increase in total ozone (WMO, 2014).
The most important factor affecting UV radiation at the Earth's surface is the elevation of the sun in the sky – this causes terrestrial ultraviolet radiation (UVR) to vary with time of day, day of the year and geographical location (Diffey, 2002). Aside from solar elevation, the most significant factors affecting solar UV radiation are stratospheric ozone and cloud cover (CC). A number of other factors also affect UV, including aerosol optical depth (AOD), other aerosol optical parameters, albedo and changes in other trace gases; climate change influences many of these factors (Bais et al., 2011). These factors often interact with each other in a complex way, making their effect on terrestrial UV hard to quantify.
The effects of TO, clouds and aerosols on surface UV irradiance have been studied widely in Europe (den Outer et al., 2010; Fitzka et al., 2012; Zerefos et al., 2012; De Bock et al., 2014; Román et al., 2015). These studies varied in their duration between 12 and 23 years and considered various empirical models, as well as different reconstructed models including neural network techniques and radiative transfer modelling combined with empirical relationships in various locations in Europe. The majority of these studies demonstrated that observed increases in surface UV radiation were attributed to changes in weather conditions and aerosol levels rather than changes in ozone, which revealed a significant increase during their study periods. In contrast, the Belgian study reported the strong impact of TO, while the individual contribution of AOD to the non-significant negative trend of the erythema UV dose was very low (De Bock et al., 2014). Nevertheless, the influence of the aerosols on UV irradiance is still not been fully understood due to high spatial and temporal variability (WMO, 2007).
In 1990, due to the concern that the depletion of the ozone layer would cause an increase in population UV exposure and possible impacts on human health, the former National Radiological Protection Board (NRPB – now part of Public Health England, PHE) set up monitoring stations at three locations in the UK to measure terrestrial solar UV (HPA, 2012). The Chilton monitoring site is located in a rural area in the south-east of England at approximately 51.6∘ N, 1.3∘ W. An analysis of annual erythema effective UV radiant exposure (Her) at Chilton over 25 years (1991–2015) has previously been carried out; the results revealed a statistically significant increasing linear trend between 1991 and 1995 and a small decreasing linear trend from 1995 to 2015 (Hooke et al., 2017). The analyses described in this paper are complementary to those undertaken by Hooke et al. (2017), which use the same data but with methodological differences, as discussed later in the paper. In particular, this work focuses on whether the long-term trend of monthly Her can be linked to changes in ozone, cloud cover and aerosols, the most significant atmospheric factors that affect terrestrial UV.
2.1 Erythema effective UV radiant exposure (Her)
Details of the methodology for UV monitoring at Chilton are presented elsewhere (Hooke et al., 2017). A short description of materials and methods is given here, and additional analyses using the same data are pointed out. Erythema effective UV irradiance in the wavelength range 280–400 nm is measured by Robertson–Berger meters (RB-500 and RB-501 since 2004, manufactured by Solar Light Co. Philadelphia, USA). Data from these sensors are sampled to calculate 5 min mean values. To convert these values to Her per day, the erythema effective UV irradiance data were summed up daily from half an hour before sunrise to half an hour after sunset under all weather conditions (Hooke and Higlett, 2016). The units of Her are defined as the amount of energy (joules) deposited per square metre (J m−2). The first full calendar year of measurements at Chilton began in January 1991. The daily UV data considered here are the measurements for all available days during the 25-year period from 1 January 1991 to 31 December 2015. Measurements were unavailable for only 3 % of the days over the whole study period. For the modelling undertaken here, these were considered as missing data, while in our previous study, they were substituted with the average value for each day over the entire period (Hooke et al., 2017).
The broadband detectors measuring erythema effective UV radiation were calibrated annually using a co-located double-grating spectroradiometer. This spectroradiometer was calibrated and traceable to national standards. The daily radiant exposure for 22 clear days during May–October between 2003 and 2015 has been compared to the daily radiant exposure from the double-grating spectroradiometer. Data from the broadband detectors were found to be within 10 % of the spectroradiometer data on all these days (Hooke et al., 2017).
2.2 Total ozone
The ground-based instruments, Dobson spectrophotometers, used to measure daily column ozone were at the UK Meteorological (Met) Office observatory at Camborne in Cornwall (south-west of England; latitude 50.2∘ N, 5.3∘ W) for the period 1979–2003. From January 2003, ozone monitoring has been undertaken at Reading using Brewer spectrophotometers. These instruments measure total column ozone, which includes stratospheric ozone as well as tropospheric ozone in the atmosphere. Both the Dobson and Brewer ozone spectrophotometers measure TO based on measurements of the intensity of direct sunlight at selected wavelengths. Under cloudy conditions, TO can be derived by measuring the intensity of scattered light from the zenith sky (Smedley et al., 2012). TO is measured in Dobson units (DU).
These two time series of data from the Camborne and Reading sites can be combined into a single continuous TO time series (Smedley et al., 2012) as they are located at similar latitude, while the Reading site is closer to Chilton (30 km to the south-east of Chilton). The combined dataset is considered here as a surrogate for the TO data for Chilton over the whole period 1991 to 2015. Data and other information from these sites were obtained from the air quality website (UK-AIR) of the UK Department for Environment Food & Rural Affairs (DEFRA). The details of the instrumentation, the ground-based ozone data and the trend analysis of TO from these sites from 1979 to 2008 were published previously (Smedley et al., 2012).
2.3 Cloud cover
The HadISD dataset was created by the Met Office at the Hadley Centre in the UK, which used a subset of the station data held in the Integrated Surface Database (ISD) (Met Office Hadley Centre, 2018). The HadISD dataset comprises various selected climate variables, including total cloud cover (CC) data that were recorded in various weather stations globally, including in the UK for 1931–2016 (Dunn et al., 2012, 2014 and 2016).
Station-based CC data in the HadISD dataset are available in various locations for the whole of the UK. The nearest point to the PHE building in Chilton for obtaining CC data is the Benson weather station in Oxfordshire (51.6∘ N, 1.10∘ W; 15 km to the north-east of Chilton), and this has been used as a surrogate CC value for Chilton. The CC data were calculated hourly from this station's observations of total cloud amount in oktas (1 okta = cloud covering one-eighth of the sky = 12.5 %). The hourly time series of daily CC values at Benson were obtained from the Centre for Environmental Data Analysis (CEDA) for the period between 1991 and 2015. The daily average cloud amount used here is based on the recordings at this station from 11:00 to 14:00 GMT. This time period was selected because the Her values during this period contribute a large proportion of daily Her (approximately 40 %).
2.4 Aerosol optical depth
The AOD data were created worldwide in various locations from the ground-based AErosol RObotic NETwork (AERONET) sun photometer (https://aeronet.gsfc.nasa.gov/, last access: 17 January 2019).
Station-based AOD data in the AERONET are available in various locations in the UK. We used the data from the Chilbolton site that is close to the Chilton site (about 77 km south of Chilton) and situated in a very rural location in the south-east of England (51.1∘ N, 1.44∘ W). The data were available at Chilbolton from 1 January 2006 to 31 December 2015, not the full period (1991–2015). The AOD data at a wavelength 500 nm that were used here had a data level quality of 1.5, which means they were cloud-screened and quality-controlled.
This study did not take account of other potentially influential atmospheric factors such as other AOD parameters, albedo and other trace gases because there were no data available for southern England.
2.5 Estimating trends
Linear regression analyses were carried out to test whether the estimated slopes in the underlying Her, TO, AOD or CC data show real long-term trends in the UK. However, in order to assess the long-term trends in Her, TO and CC, seasonal variations were removed from the monthly data. This was done by calculating the overall average Her, TO, AOD and CC for each month and then subtracting each individual value from their associated average months over the 25-year period. For each dataset, the percentage deviation from the average for the seasonal corrected monthly mean data was estimated.
Longer term variations such as the Quasi-Biennial Oscillation (QBO) and the 11-year solar cycle were not been taken into account. Since the period of the QBO is approximately 2.3 years, it affects short-term variability rather than long-term trends. This fluctuation is small in comparison to the 25-year timescale being analysed in this paper (den Outer et al., 2005; Harris et al., 2008). The 11-year solar cycle has a longer period and therefore has the potential to impact long-term trends; however its effect on erythema effective UV levels is small (Diffey, 2002; den Outer, 2005).
The trend analyses were performed using regression analysis of the monthly mean deviation of Her, TO, AOD or CC data versus year and t tests were then used to determine whether the slopes of the fitted trend models were significantly different from zero. The shape of the trend in the time series was examined for Her, TO, AOD and CC by fitting linear and non-linear models to determine whether the observed values generally increase (or decrease) over time. Further analyses were carried out by examining the changes in Her, TO, AOD and CC separately for each season (winter, spring, summer and autumn).
The evidence of autocorrelation in the residuals of the regression analysis was tested using the Durbin–Watson (DW) statistic. This test is a well-known method of judging if autocorrelation could be undermining a model's inferential suitability (e.g. assessing the confidence in the predicted value of a dependent variable). The test compares the residual for the time period t with the residual from time period t−1, developing a statistic that measures the significance of the correlation between these successive comparisons (Chatfield, 1996). In this study, if there was evidence of autocorrelation, a non-parametric (distribution-free) test, the Mann–Kendall test (MK), was used in place of a parametric linear regression analysis, which can compensate for temporal autocorrelation and test if the slope of the estimated linear regression line differs significantly from zero (Mann, 1945; Kendall, 1975; Helsel and Hirsch, 1992). If a significant trend was found from the MK test, the rate of change was calculated using the Sen's slope (SS) estimator from a non-parametric method (Helsel and Hirsch, 1992). If the results of non-parametric analyses were similar to those results obtained by linear regression, the results from non-parametric analyses are not presented.
The relationship between Her, TO, AOD and CC was also examined using analysis of variance (ANOVA) to obtain information about levels of variability within a regression model and to form a basis for tests of significance. The correlation coefficient value (r2) was calculated to determine a measure of the strength of the relationship between Her, CC, AOD and ozone and to quantify how much of the total variation in Her could be explained by ozone, AOD or CC. A significance level p<0.05 was considered statistically significant.
Table 1Daily Her (J m−2) averaged over the whole period and for each season in Chilton during 1991–2015.

3.1 Erythema effective UV radiant exposure
Summary statistics for the daily Her are presented in Table 1. Over 25 years Her ranges from 10 J m−2 (measured on 9 January 1992, 18 days after the winter solstice) to 5655 J m−2 (measured on 20 June 2003, at the summer solstice), with a mean of 1303 J m−2.
Figure 1 shows the distribution of the daily Her using box plots for each season at Chilton. Each box shows the lower 25 % quartile (Q1) and the upper 75 % quartile (Q3), with the median as the central line. The whiskers extend from Q1 to the smallest data point and from Q3 to the largest data point. The observed results show that Her is highest in the summer months and lowest in winter months, while during spring and autumn months, Her may change rapidly day to day (Fig. 1). After 2007, in particular in spring and summer, it appears that Her values are well below their expected mean values. Data falling outside whiskers are possible extreme values, with the majority observed in winter and others spread over the seasons. These extreme values could be related to natural variability in factors that affect Her; therefore, no extreme data points were excluded from this study.
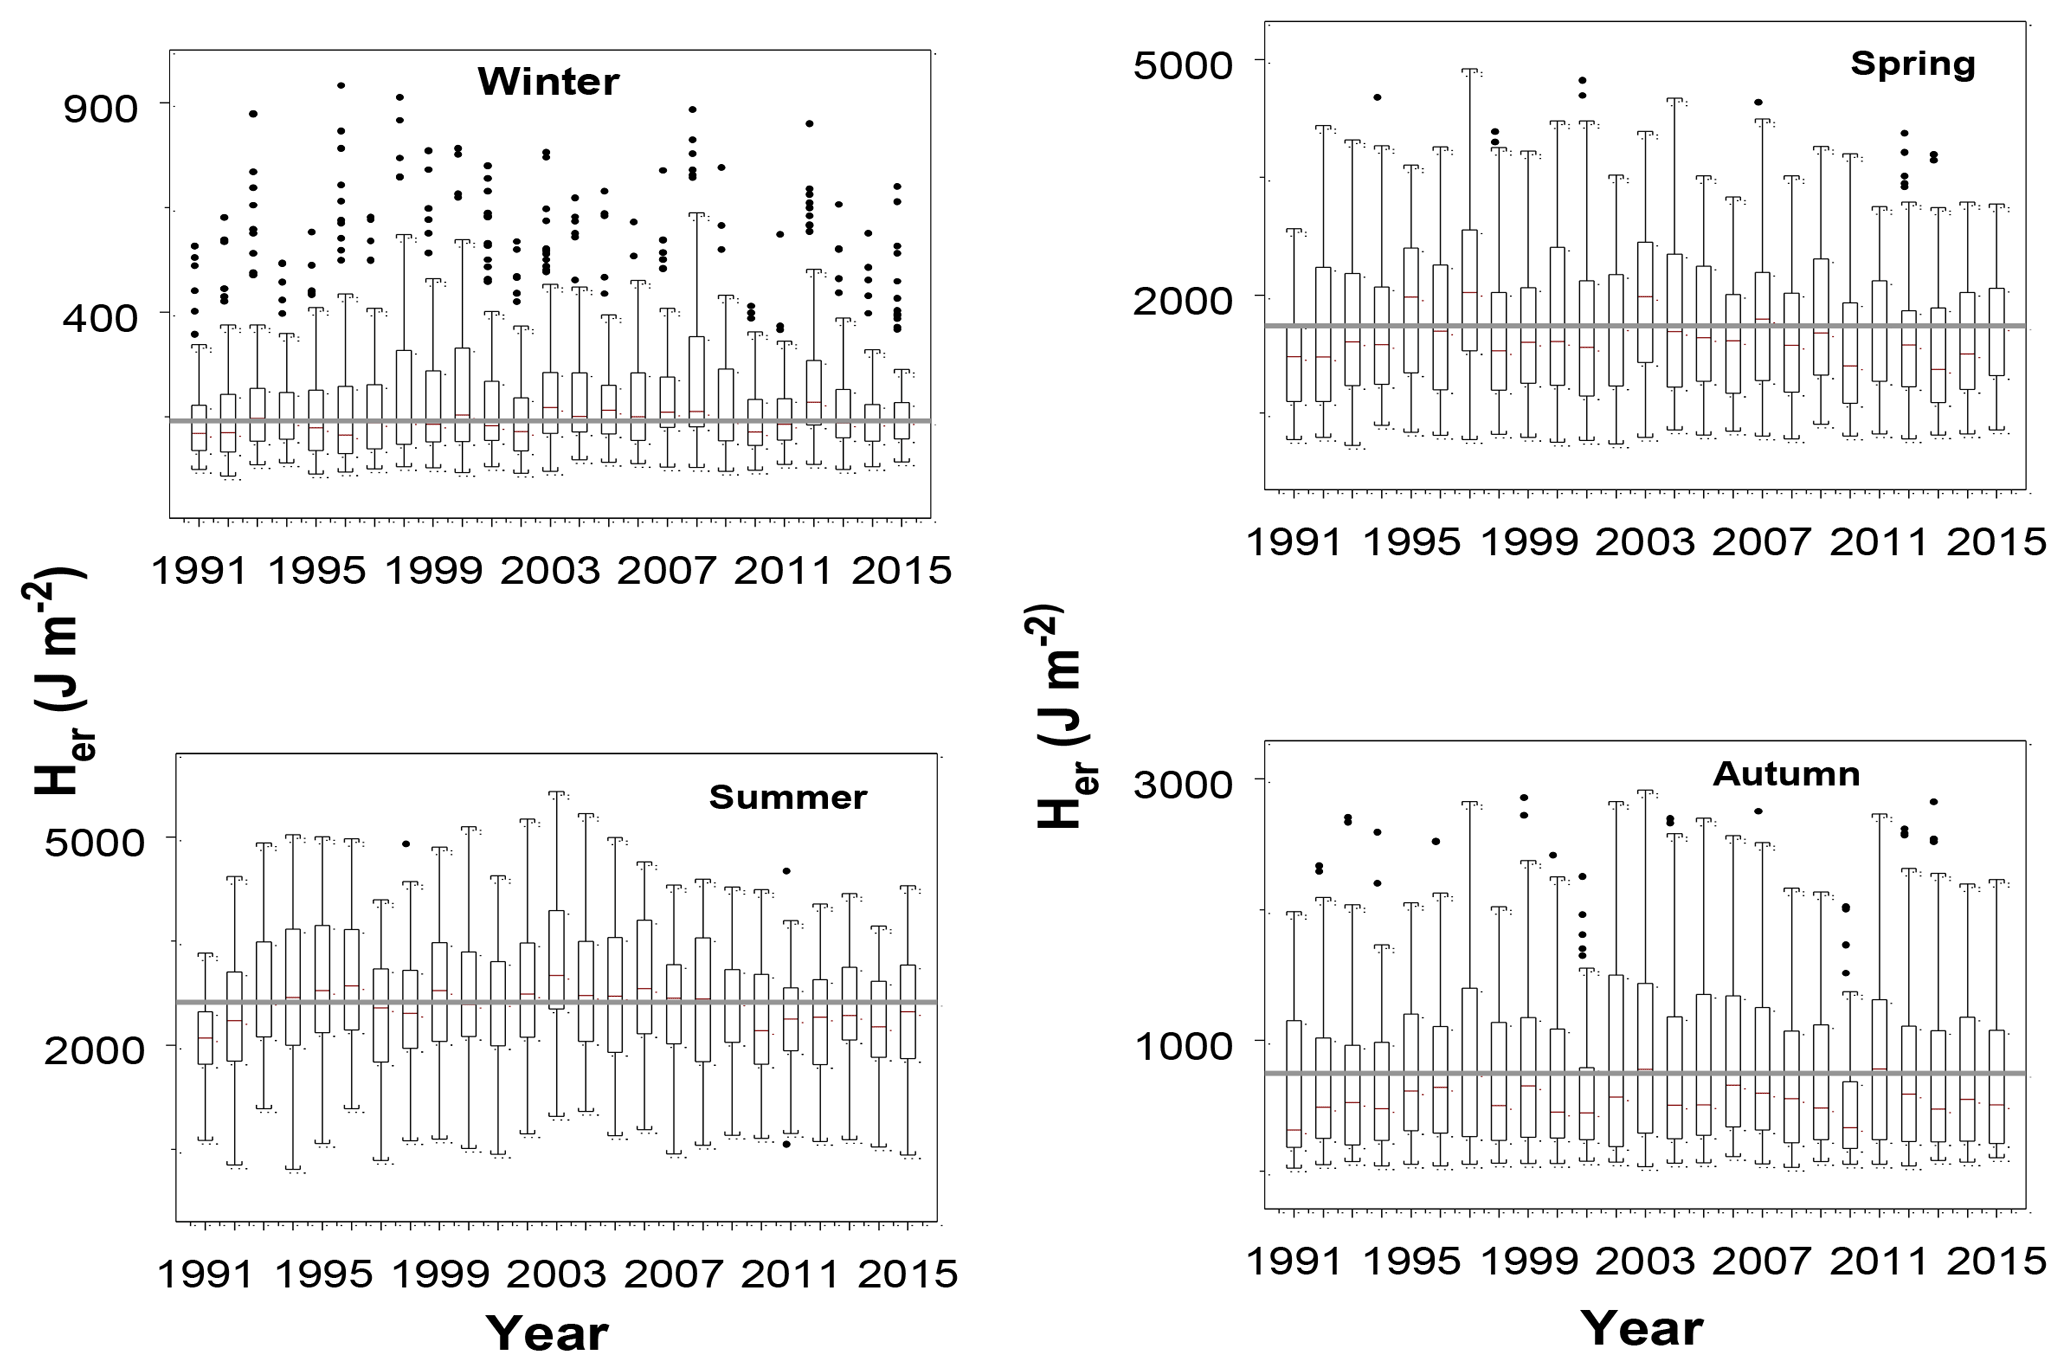
Figure 1Box plots of the daily Her data for each season at the Chilton site between 1991 and 2015 (grey solid line represents the mean value for each season).
Figure 2a shows the monthly mean deviation of Her values expressed as percentages. There is a consistent rise between 1991 and 2003, with a clear peak in 2003 when the Her values were the largest recorded at Chilton over the 25-year period. Thereafter, Her values appear to decrease. Fig. 2b also shows the mean deviation data in Her for each of the four seasons over the 25-year period. Winter and spring exhibited greater variability in comparison with summer and autumn, although summer has the greatest Her overall and therefore the largest impact on annual Her. The large variation in during the winter and spring months is likely caused by the high variability of TO. During winter months, peaks in Her were observed in various years; however, Her in winter was very low (Table 1), so the effect on annual Her is small. For spring months, clear peaks are observed in March 1997, April 1997 and March 2003 (Fig. 2b). Overall there has been less variability over the last few years.
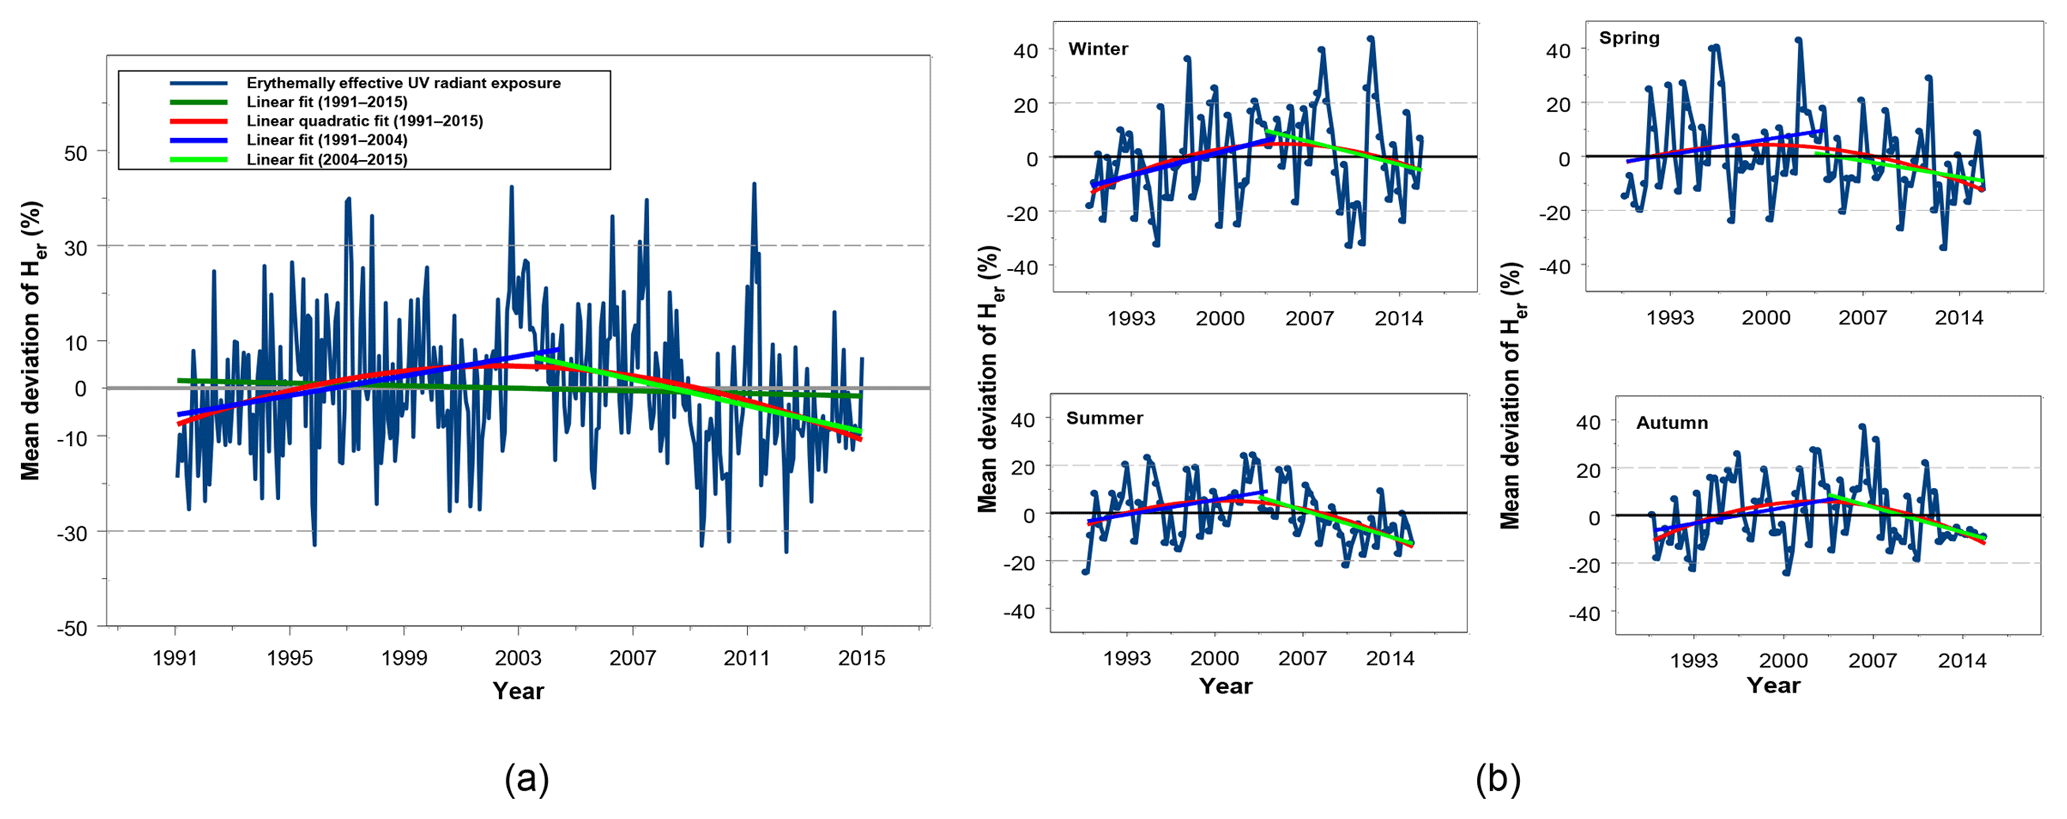
Figure 2Monthly mean deviation of Her data at Chilton (1991–2015) with trend lines: (a) all seasons combined and (b) seasonal.
The regression analyses of Her data indicate that the best fitting single linear trend covering the whole period 1991–2015 has a downward slope but that this slope is not statistically significantly different from a constant value over this period (p=0.27). Two further models were also examined. One is a linear-quadratic function, a second-degree polynomial, which allows for more gradual variation in the monthly Her across the 25-year period, and a second model consists of two linear trends with a node to allow for a single change in the linear trend over the 25-year period. Figure 2a also shows the results of fitting these four models to the monthly mean deviation of Her data.
The best fitting model was the last of these, which had two linear trends that describe an increasing trend from 1991 to 2003 and a decreasing trend thereafter, defining 2003 as the node between two trend lines. The nodal year appeared to be influenced by the particularly high observations in 2003 (Fig. 2a). In order to avoid bias that might be caused by the highest Her values observed in 2003, the year 2004 was chosen to be the nodal point in preference to 2003.
Table 2Estimated trends (in % yr−1) for Her with 95 % confidence intervals (CIs) at Chilton for two sub-periods: 1991–2004 and 2004–2015.
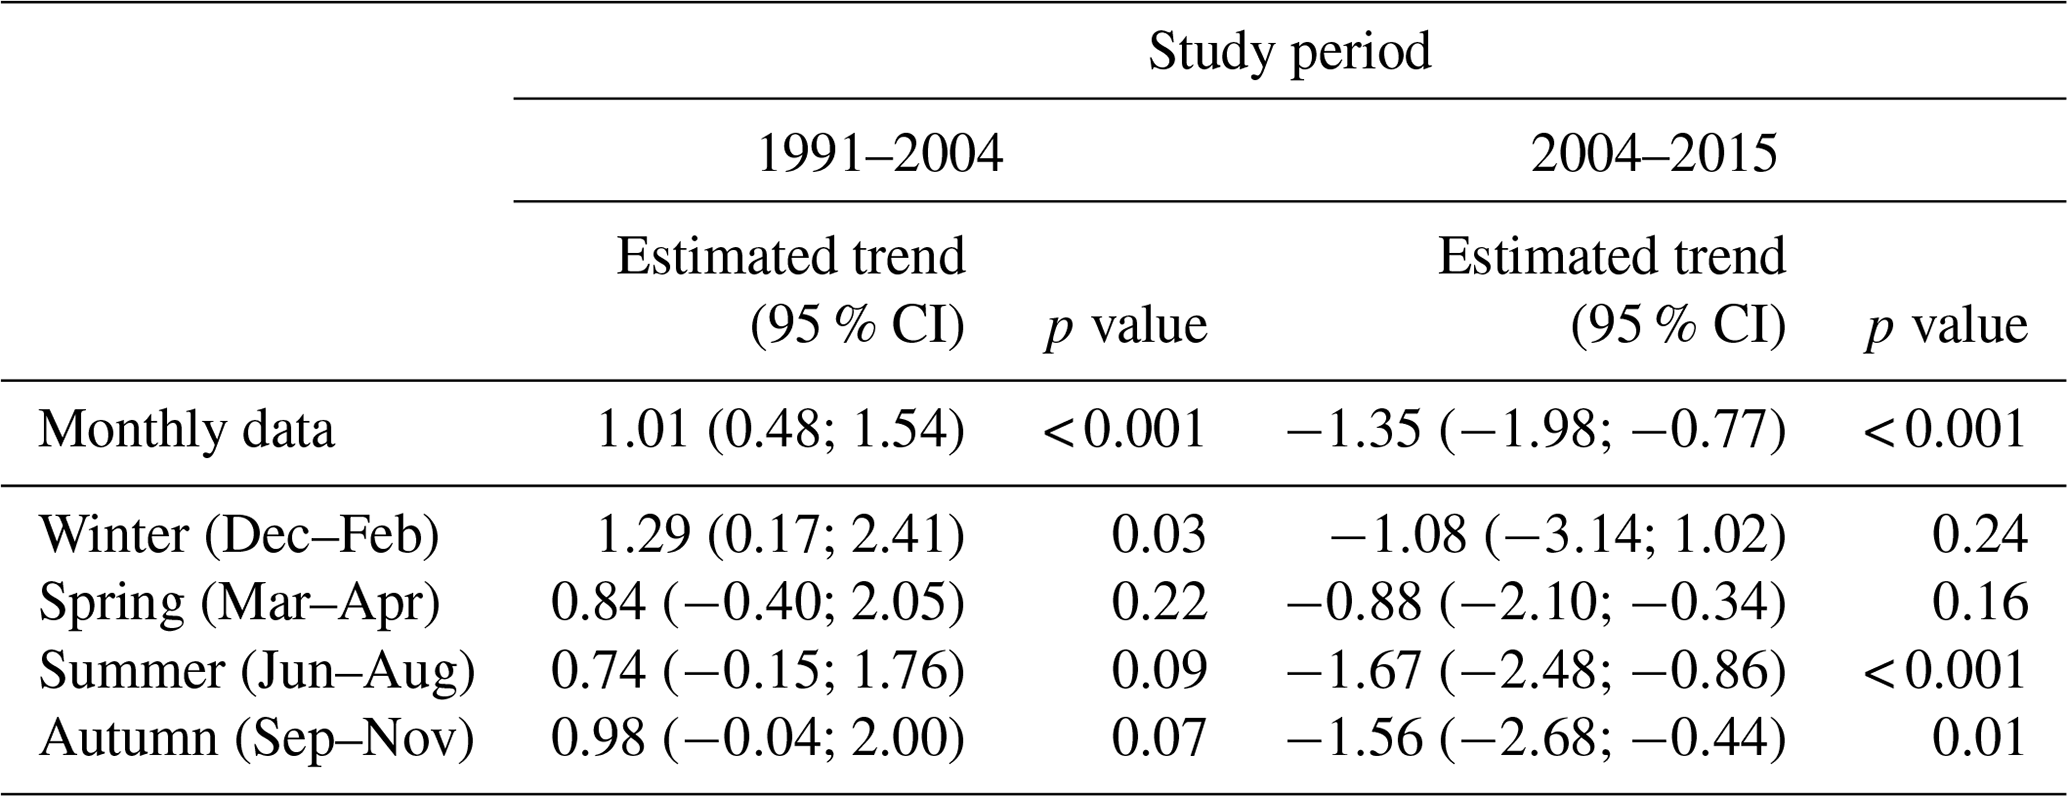
Based on the results of the initial model fitting to the whole period, statistical analyses were also carried out to investigate the long-term variability of Her for two sub-periods (1991–2004 and 2004–2015). There is evidence of a statistically significant increasing trend for the first period (1991–2004), with a mean rate of 1.01 % per year (yr−1) (95 % CI: 0.75 %; 1.27 %, p<0.001) and a decreasing trend for the second period (2004–2015), with a mean rate of 1.35 % yr−1 (95 % CI: 1.98 %; 0.72 %, p<0.001) based on all the data (Table 2). While there was evidence of autocorrelation, the results of the non-parametric analyses, which would not be influenced in the same way by the autocorrelation, were similar to those in Table 2, so they are not presented here.
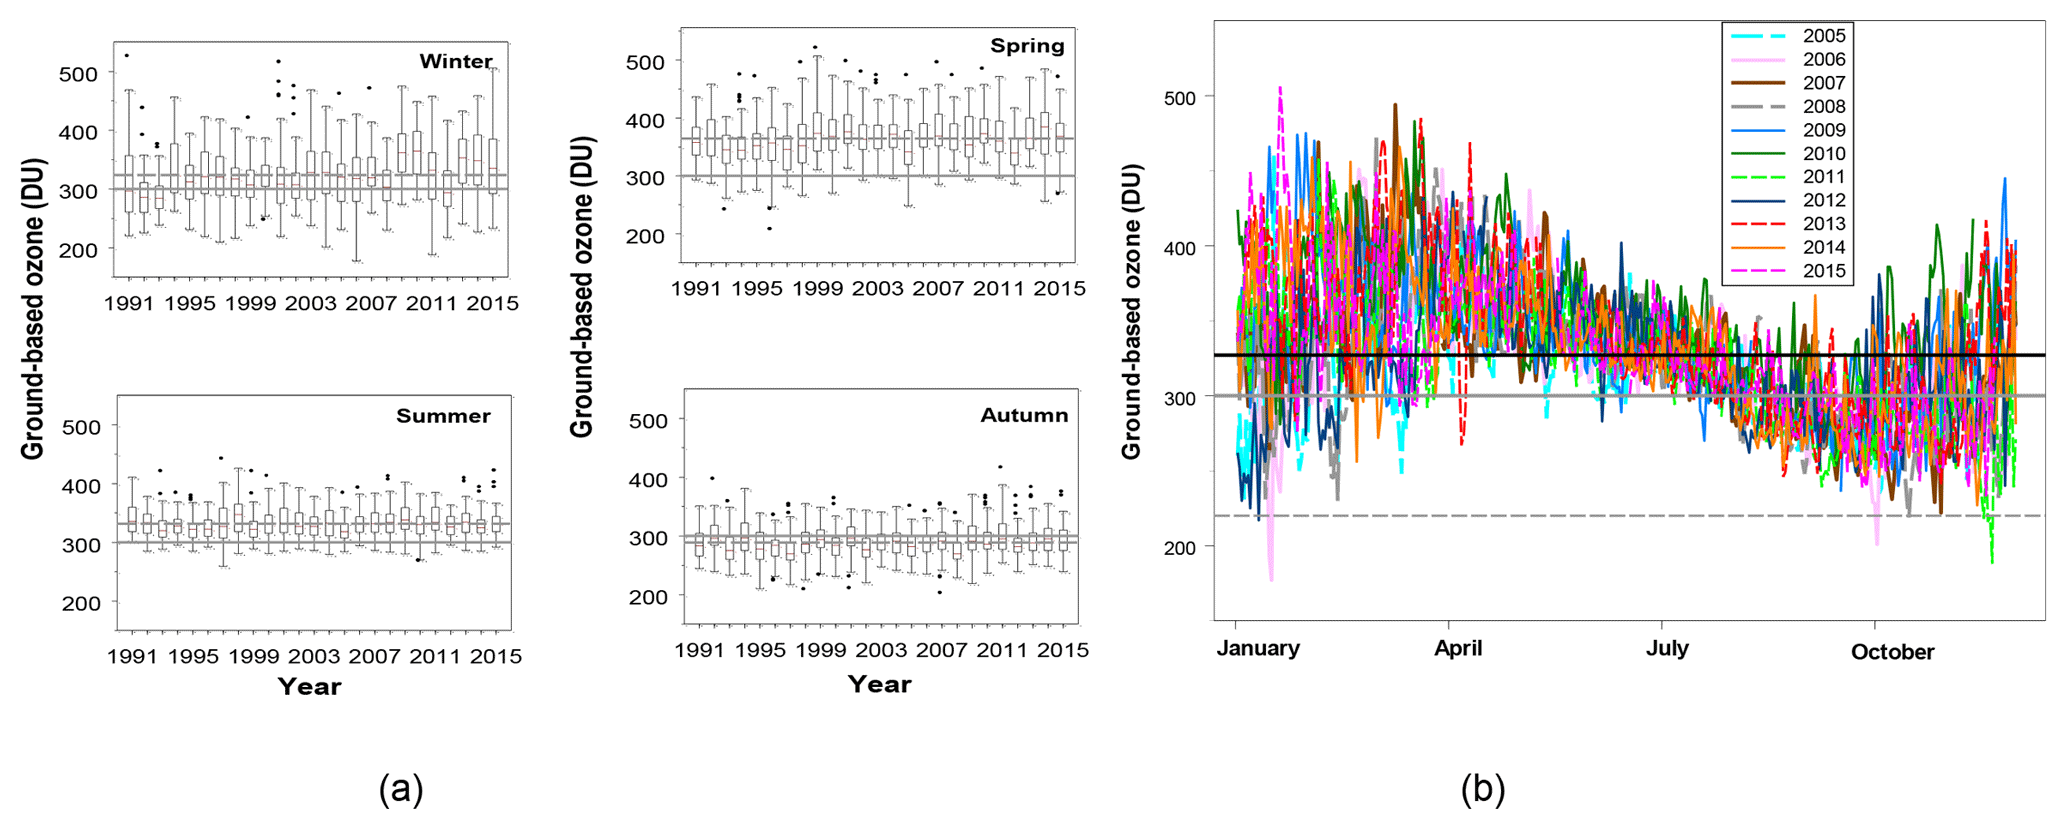
Figure 3Daily TO values: (a) box plots for each season for the period (1991–2015) in southern England and (b) line plots for the period 2005–2015 at Reading.
For seasonal trends, the only significantly increasing linear trend was seen in winter from 1991 to 2004; however, Her in winter was very low and contributed only a small proportion of the total annual Her. The highest values of Her observed in summer did not show any significant linear trend for 1991–2004 as Her was steady for this period. The absence of a significant trend in spring for this period might be explained in part by the influence of the fairly stable values of Her seen between 1998 and 2002 (Fig. 2b). Across the same period in autumn, the trend was found to be approaching statistical significance (p=0.07). For 2004–2015, the estimated trend slope was negative for each season, but the trend was only statistically significant in summer and autumn (Table 2).
3.2 Total ozone
From the combined Camborne and Reading dataset covering the period 1991–2015, TO ranges from a low of 177 DU (measured in January 2006 in Reading) to a high of 524 DU (measured in February 1991 in Camborne), with an overall mean value of 327 DU. The distribution of the daily TO values is presented in box plots for the period 1991–2015 for each season (Fig. 3a). The mean value is shown by a grey dashed line, and the bold line at 300 DU shows the average amount of ozone roughly in the atmosphere (https://ozonewatch.gsfc.nasa.gov, last access: 17 January 2017). Both graphs show a large spread of TO measurements. The data appear to be varying year to year and there is a much larger spread of TO values in winter and spring compared to summer and autumn. Due to the natural variability of the TO data, the extreme data points are not likely to be erroneous readings, and so they were not excluded from the analysis. In general the TO values were low in autumn and early winter with a few exceptional cases in March, April and August. Similarly, the maximum TO values were mostly found in late winter and in early spring (Fig. 3b). In Fig. 3b, the solid black line indicates the overall mean value (327 DU) and the grey dashed line represents the baseline ozone level of 220 DU, which is the threshold used to define the Antarctic ozone hole (https://ozonewatch.gsfc.nasa.gov).
Table 3Estimated trends (in % yr−1) for TO with 95 % CI in southern England for the monthly mean deviation data and for each season using various study periods.
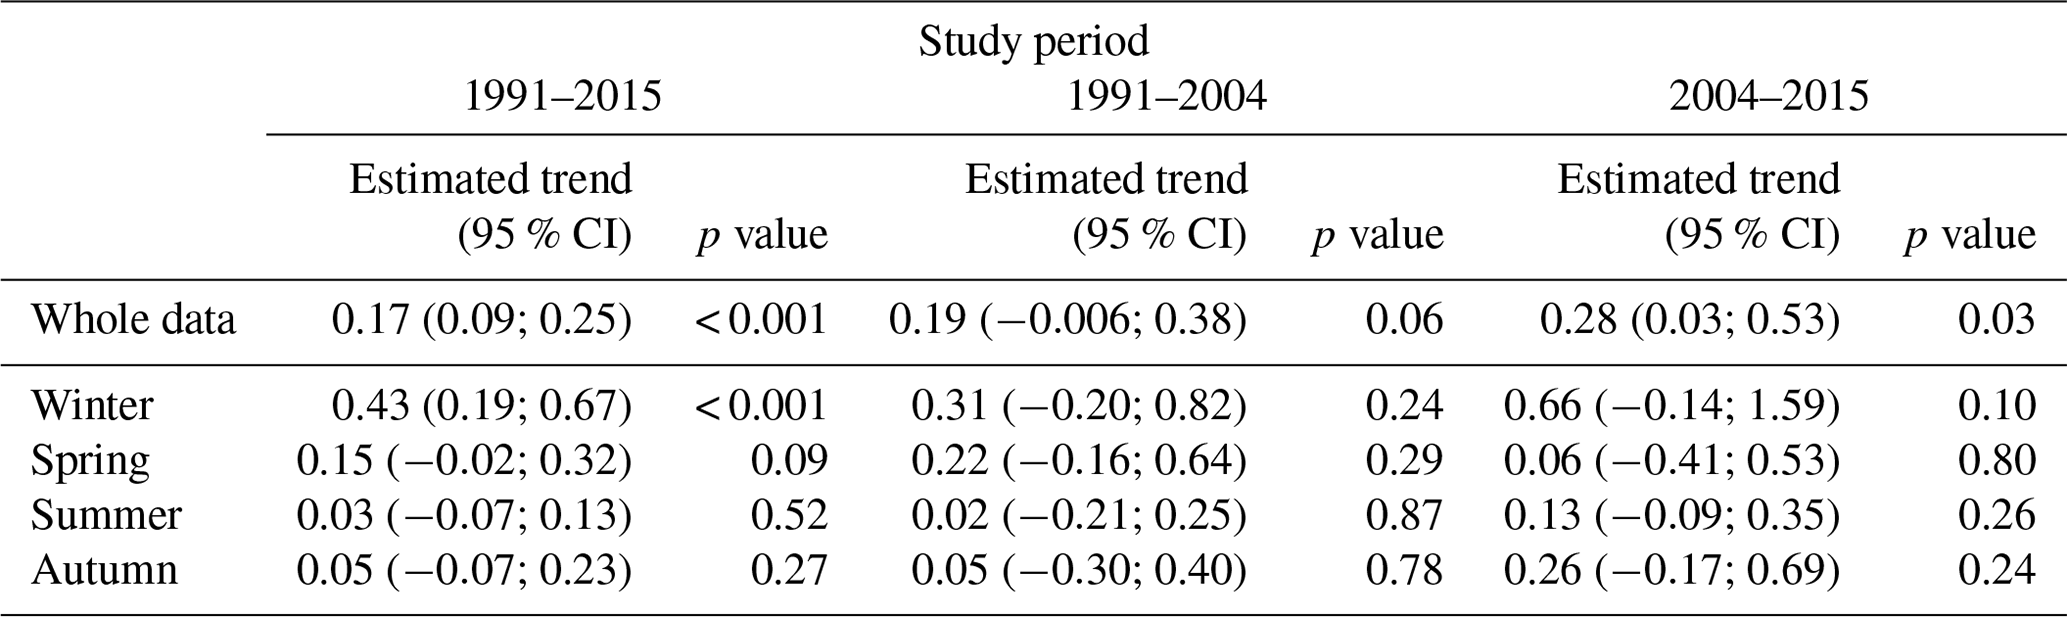
The regression analysis of the trend for the period 1991–2015 showed a highly statistically significant increasing linear trend of 0.17 % yr−1 (95 % CI: 0.09 %; 0.25 %, p<0.001) (Table 3). The evidence of autocorrelation in the residuals of this regression analysis was tested and the DW test confirmed that the overall level of autocorrelation in the residuals was highly statistically significant (p<0.001). Applying the non-parametric MK test to these data also indicated a strongly statistically significant increasing trend in the TO across the full study period, and the Sen's slope median trend estimate was 0.13 % yr−1 (95 % CI: 0.05 %; 0.21 %, p<0.001). This slope estimate was smaller than that obtained by the linear regression analysis (Table 3).
A model consisting of two trend lines with a node at 2004 was fitted to these data and the results are shown in Table 3. The regression analysis gave slightly different results to those obtained using the non-parametric methodology. The regression analysis found an increasing trend of 0.19 % yr−1 in TO for the period 1991–2004, which was a borderline statistically significant (p=0.06) upward trend and a statistically significant (p=0.03) upward trend for 2004–2015, with a value of 0.28 % yr−1 (95 % CI: 0.003; 0.53). The non-parametric test also showed that the slope of the trend during 1991–2004 was positive (0.16 % yr−1; 95 % CI: −0.02; 0.35) but not statistically significant (p=0.09), while in the latter period the slope trend was positive, 0.22 % yr−1 (95 % CI: 0.002 %; 0.44 %), but this result was of borderline statistical significance (p=0.05).
The comparable analyses of the seasonal data are presented in Table 3. The trend for the TO data was only statistically significant in winter over the period 1991–2015 (0.43 % yr−1; 95 % CI: 0.19 %; 0.67 %, p<0.001). While there was evidence of autocorrelation in the residuals, Sen's slope trend estimates were found to be very similar to the slope estimates obtained by linear regression. The slope of the trend estimate was positive for any of the seasons in the both periods (1991–2004 and 2004–2015), but these increases were not statistically significant. For the summer periods, the ozone trend was not statistically significant due to very small ozone changes and high Her, while the ozone trends in winter influenced the very low Her at that time of year, but had little impact on overall annual Her.
3.3 Erythema effective UV radiant exposure and total ozone
Further analyses were carried out to examine the relationship between Her and TO for the period 1991–2015. Figure 4 shows an inverse relationship between Her and TO, Her being high when TO is low and vice versa. This is evident for all seasons (Fig. 4b). The greater variability in Her observed in winter and spring appears to be caused by the greater variability in TO for the same seasons (Fig. 4a). However, the effect on Her was negligibly small in winter and might be significant in spring if TO events were very low. An inverse relationship was also observed in summer and in autumn, but not to the same extent as that seen in winter and spring. In particular, lower TO and higher Her values were observed during spring 1997 and also from December 2011 to March 2012, but the highest Her values recorded at Chilton over the 25-year period were during spring 2003 and there was no significant TO reduction over the same year. In contrast, particular fluctuation of higher TO and lower Her values were observed after 2007 (Fig. 4a). In absolute terms, all these observed changes are small and implications for Her in winter are small.
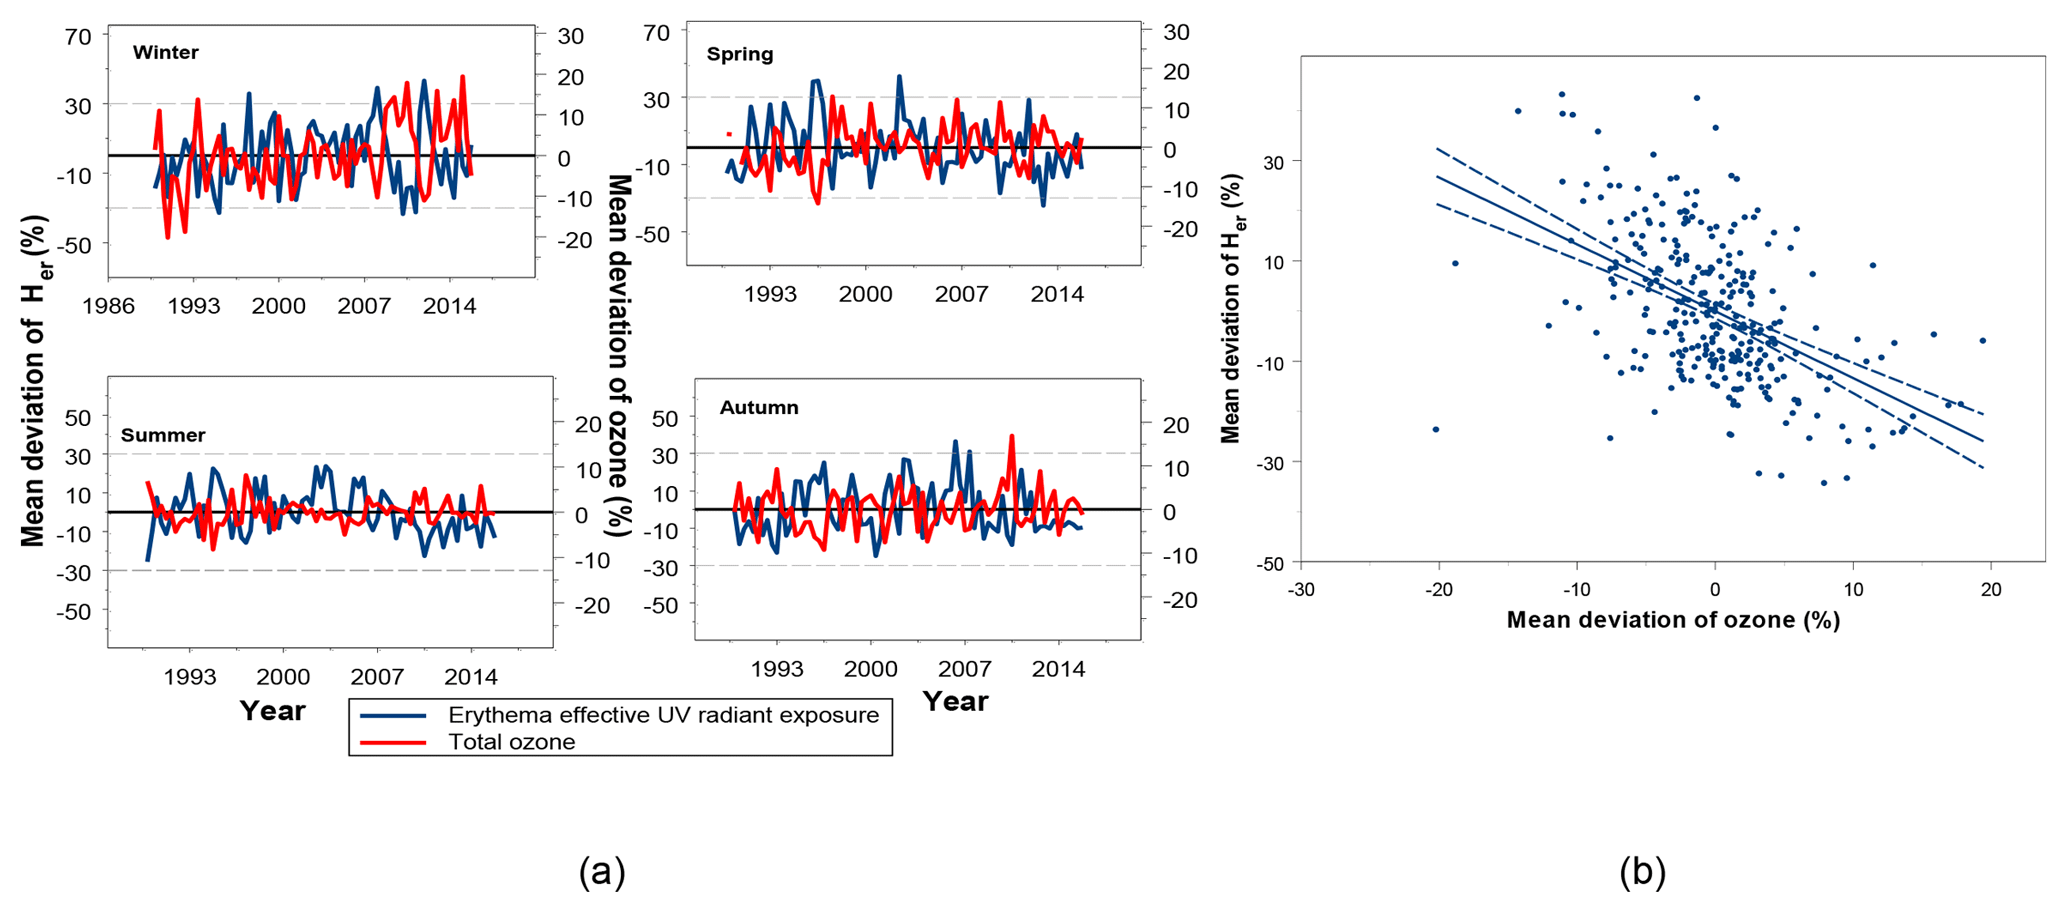
Figure 4Relationship between monthly mean deviation of Her (1991–2015) and TO (1991–2015): (a) seasonal and (b) fitted linear regression line with 95 % CI.
Table 4Estimated effect of TO ozone on Her with 95 % confidence intervals (CIs) based on three study periods.
∗ p=0.12.
Table 4 shows the results of the regression analyses of the monthly mean deviation of Her against TO by season and for all seasons together for the period 1991–2015, as well as the correlation coefficient estimates (r2) for each regression model. The inverse correlation between Her and TO was found to be strongly statistically significant (p<0.001) for the period 1991–2015 such that a 1 % increase in TO was associated with a 1.3 % decrease in Her. This is known as the radiation amplification factor (RAF) for the erythema action spectrum for sunburn of human skin; i.e. the RAF for TO was −1.3. This corresponded to the observed increasing trend (0.13 % yr−1) in long-term TO, corresponding to a negative trend of −0.17 % yr−1 in Her when the TO trend was multiplied by the changes in Her (−1.3). The scatterplot between Her and ozone in Fig. 4b also shows this slope of the trend line in which there is a wide spread of data points around the line. This indicates a weak correlation, as confirmed by an r2 value of 25 %. However, 75 % of the variation could not be explained by TO alone so other factors such as CC and aerosols are likely to be important.
The results for the two sub-periods 1991–2004 and 2004–2015 are also presented in Table 4. A statistically significant negative correlation was found between Her and TO (p<0.001) for both periods. The estimated slope was negative for both periods, where a 1 % increase in TO leads to a 1.2 % and 1.5 % decrease in Her respectively. These RAF values are slightly different to those for the full study period (1991–2015), but a test of heterogeneity in the three RAF values showed that there was no statistically significant difference between them (p=0.68). When the ozone trend was multiplied by the RAF, the increasing ozone trend for both periods (0.16 % yr−1 and 0.22 % yr−1) corresponded to a negative trend of −0.19 % yr−1 and −0.33 % yr−1 in Her. Only a small proportion of the variation in Her over the first and second period could be explained by TO (18 % and 33 % respectively), indicating that other factors such as CC and AOD may have a stronger influence over these periods.
For the seasonal data, the inverse correlation between Her and TO was also highly statistically significant (p<0.001) for 1991–2015 (Table 4). Variability in Her explained by TO rose in spring (41 %) and summer (34 %). A 1 % increase in TO during spring and summer seasons leads to an average of 2.4 % and 1.9 % decrease in Her respectively. The RAF value in winter was less negative than the values in summer, spring and autumn. This pattern is expected since an increase in cloudiness tends to reduce Her. A test of heterogeneity in RAF values between seasons showed no statistically significant difference in the RAF values except between winter and summer (p<0.001) and winter and spring (p<0.001).
Across both sub-periods, the inverse correlation between Her and TO for the period 1991–2004 was statistically significant for all seasons except during winter (p=0.12) and the variability in Her explained by TO in summer was 42 % and in spring was 37 %. In contrast, for the period 2004–2015, variability in Her explained by TO was stronger in winter (52 %) and in spring (48 %) than in summer (24 %) and autumn (17 %), although Her in winter is very low. The test of heterogeneity in RAF values between spring, summer and autumn showed no statistically significant difference in the RAF values for the period 1991–2004 (p>0.20). For the period 2004–2015, there were no differences in RAF values between any of the seasons (p=0.53).
3.4 Erythema effective radiant exposure and cloud cover
The long-term changes in Her in all weather conditions also differ according to variations in CC. The regression analysis of all the CC data showed a statistically significant downward linear trend, with a mean rate of 0.19 % yr−1 (95 % CI: −0.34 %; −0.04 %, p=0.01). When the data for each season were considered separately, a statistically significant downward linear trend was only found in spring (p=0.025) although the trend slope was negative for the other three seasons. The regression analysis of CC for the first period (1991–2004) also showed a statistically significant downward linear trend of 0.68 % yr−1 (95 % CI: −1.03; −0.33, p=0.0002), but for 2004–2015 the downward linear trend was small (−0.04 % yr−1) and not statistically significant (p=0.85). Seasonally, the slope estimates were negative for all four seasons for 1991–2004, but only the trends for winter and spring were statistically significant (−0.93 % yr−1, p=0.02 and −0.72 % yr−1, p=0.03 respectively). In contrast, for 2004–2015, there was no evidence of a trend in CC for any season, although the trend estimate was negative for winter and spring, but positive for summer and autumn.
Figure 5 shows the relationship between CC and Her for the period 1991–2015. As expected an inverse relationship was observed and peak Her was seen to increase in response to decreasing CC for all seasons.
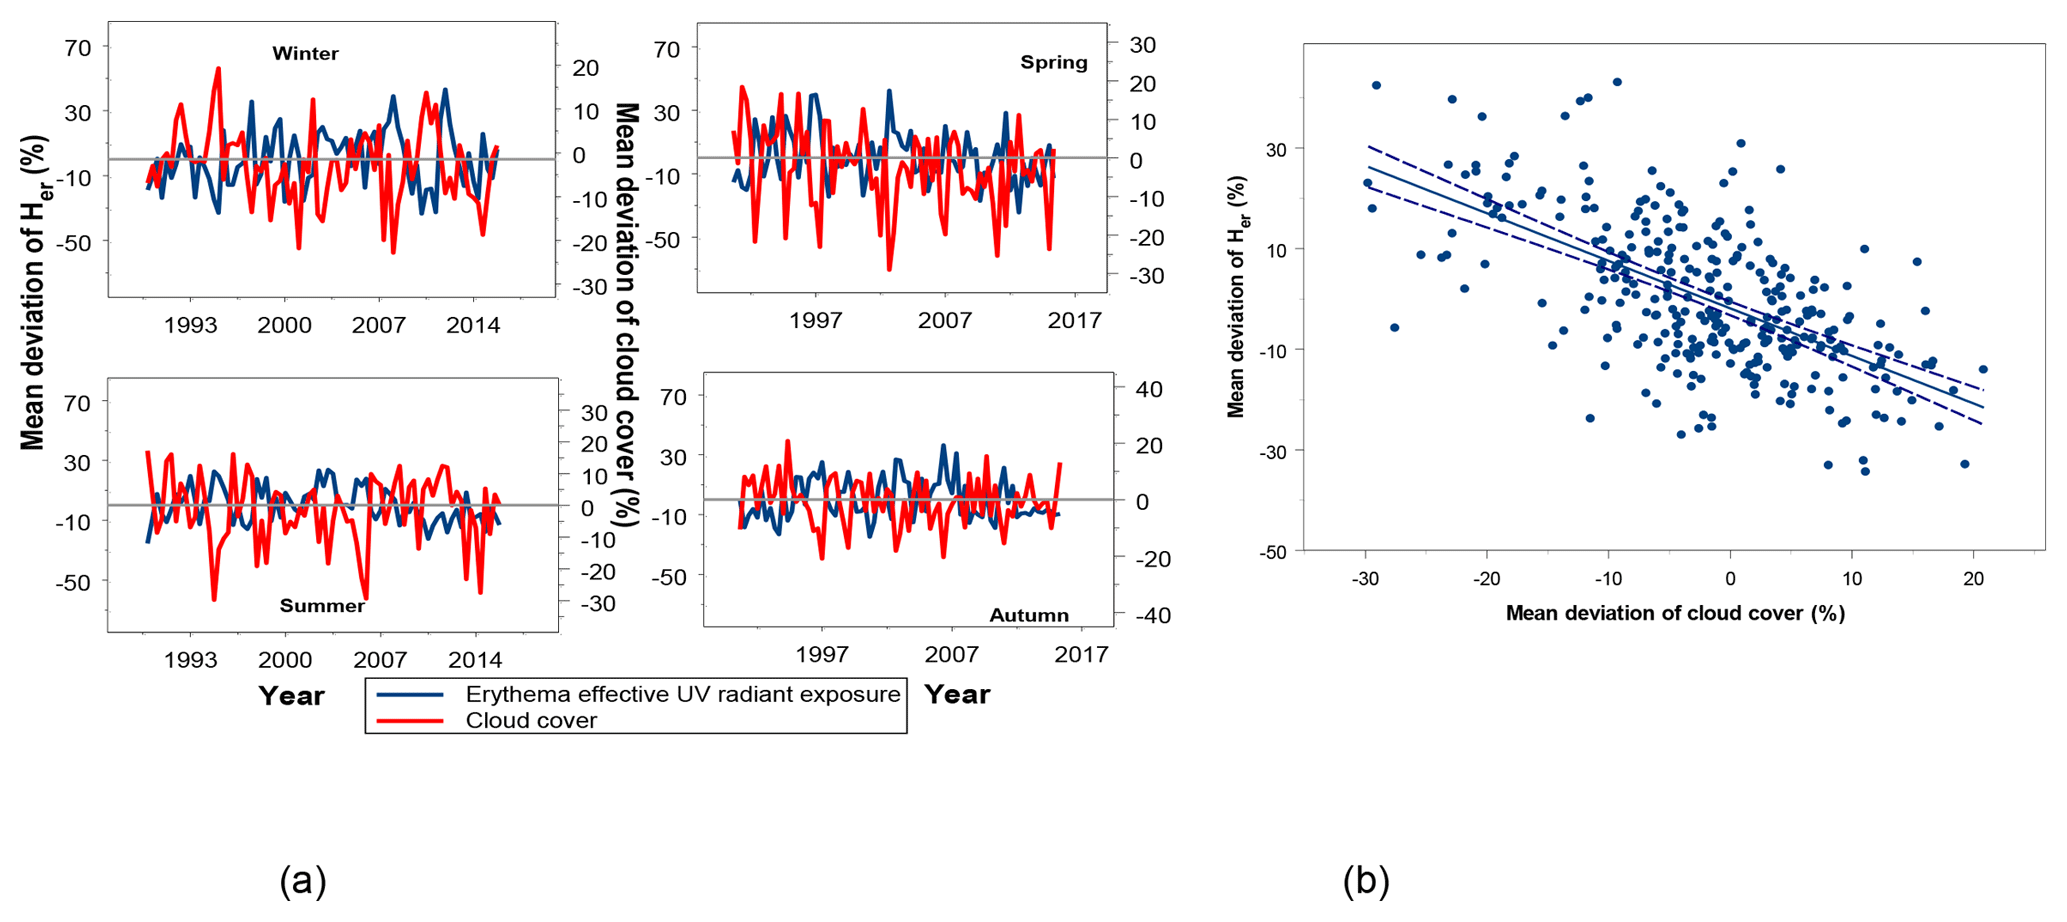
Figure 5Relationship between the mean deviation of Her (%) and CC at Chilton (1991–2015): (a) seasonal and (b) correlation plot showing the linear regression line with 95 % CI.
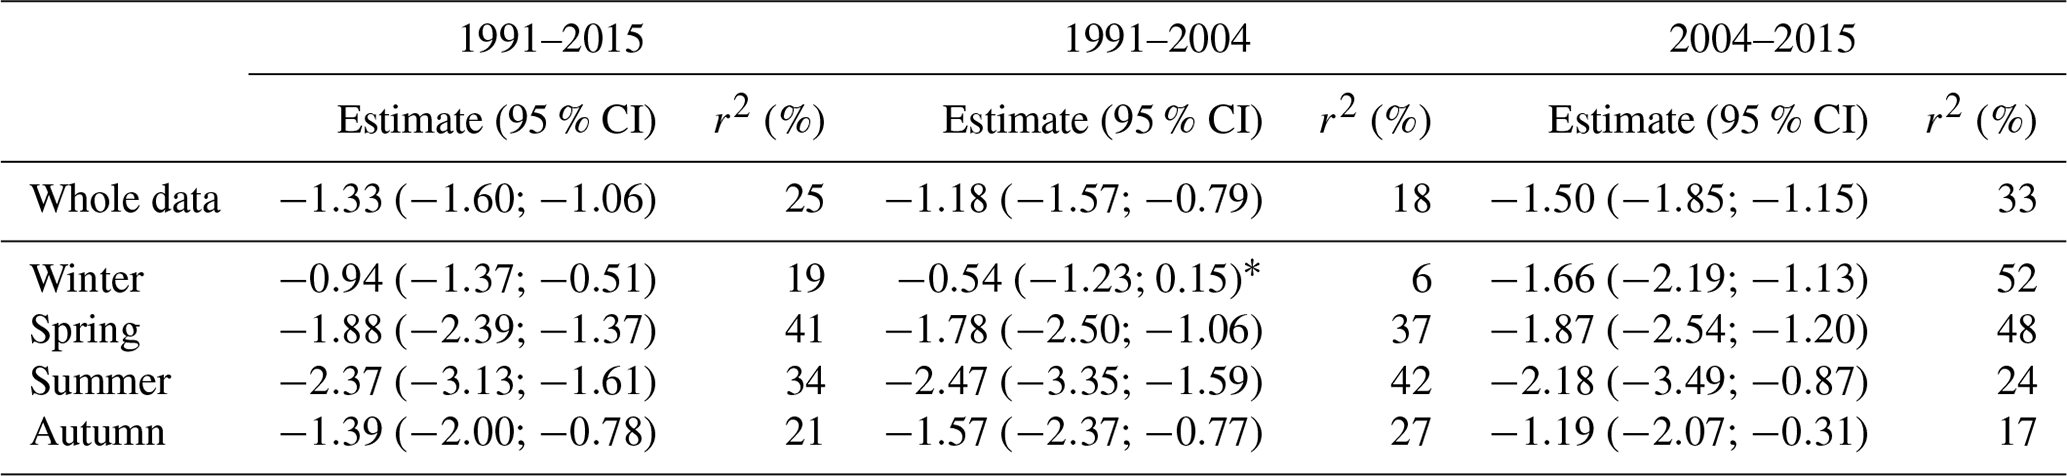
Table 5Estimated effect of CC on Her (%) with 95 % CI, based on three study periods.
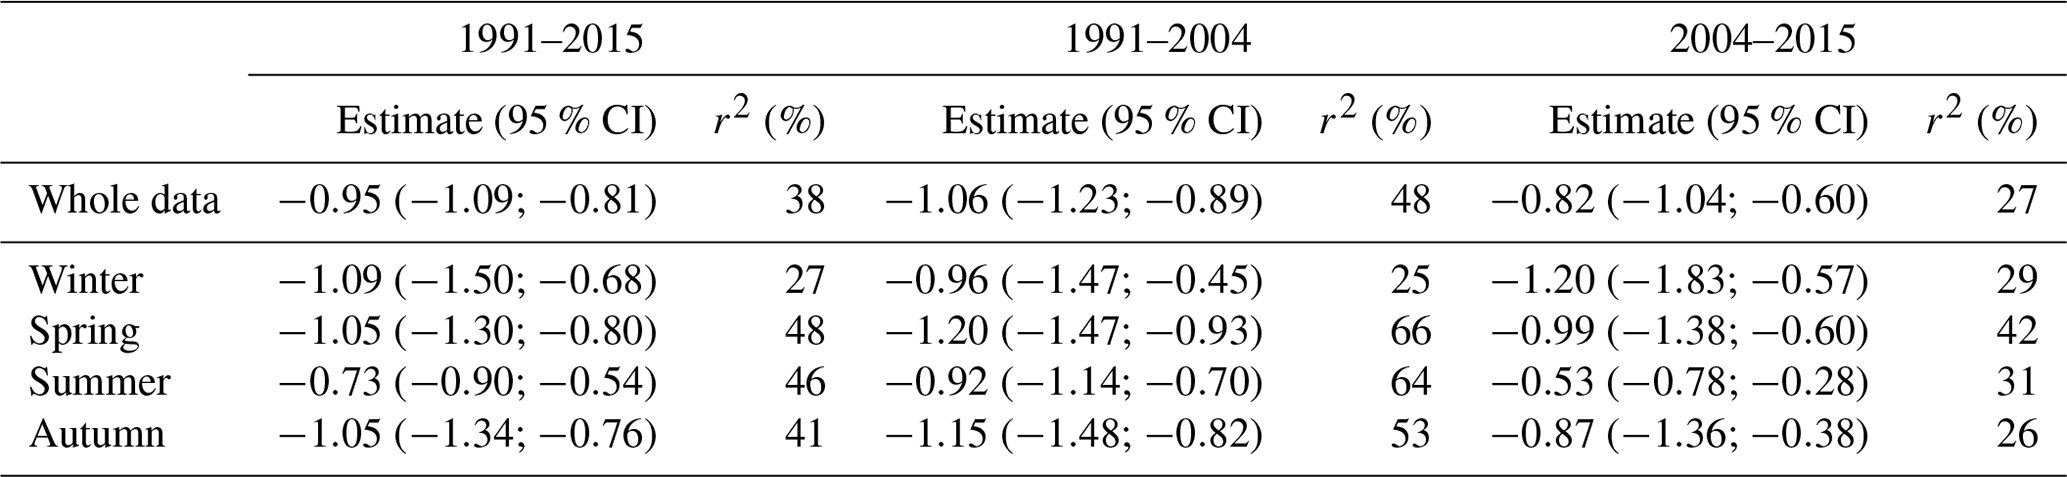
Table 5 shows the results of the regression analyses of the monthly mean deviation of Her data against CC. A highly statistically significant inverse correlation was found for each season and for all seasons together. For the whole data over the period 1991–2015 the analysis shows a 1 % increase in cloud was associated with a decrease of about 1 % in Her; i.e. the RAF for CC is −1. This slope of the trend line on a scatterplot in Fig. 5b indicates modest correlation between TO and Her, confirmed by an r2 value of 38 %, leaving 62 % of the variation unexplained. Seasonally, changes in Her explained by CC were the highest in spring (48 %) and summer (46 %) over the period 1991–2015. The decrease in the long-term CC (−0.19 % yr−1) corresponded to a positive trend of 0.18 % yr−1 in Her when the CC trend was multiplied by the RAF for CC (−1).
A statistically significant negative correlation was found for the two sub-periods 1991–2004 and 2004–2015 (p<0.001 for both periods); results are presented in Table 5. While the slopes of the trend estimates were similar for both periods (RAF for CC, −1.06 % and −0.82 % respectively), the strength of the correlation between Her and ozone was moderate (48 %) for 1991–2004, but low for 2004–2015 (27 %). The decrease in CC trend for the period 1991–2004 (−0.68 % yr−1) and for 2004–2015 (−0.04 % yr−1) corresponded to a positive trend of 0.72 % yr−1 and 0.03 % yr−1 in Her respectively when the CC trend was multiplied by RAF for CC −1.06 % and −0.82 %.
For the seasonal data for the periods 1991–2004 and 2004–2015, all slope estimates were negative and statistically significant (Table 5). The correlation was strongest in spring (66 %) and summer (64 %) for 1991–2004, but moderate for the same seasons for 2004–2015.
3.5 Erythema effective radiant exposure and aerosol optical depth
The long-term changes in Her also differ in relation to aerosols. Aerosols can affect ground-level UV irradiances directly through solar radiation absorption and scatter, reducing the amount of solar radiation reaching the surface of the Earth. Aerosols can also affect UV levels indirectly by modifying cloud formation (Calbó et al., 2005). Atmospheric aerosols originate from both natural sources (such as soil dust) and from anthropogenic sources – such as air pollution from industry and traffic in urban areas.
Since both the Chilbolton and Chilton sites are in a very rural location, AOD levels at both sites should be comparable. The AOD showed a statistically significantly decreasing linear trend with a mean rate of about 4.3 % yr−1 (95 % CI: −6.20; −2.40 yr−1, p<0.001) over the period (2006–2015). Seasonally, a statistically significant downward linear trend was only found in winter and spring, with a mean rate of 4.6 % yr−1 (p=0.003) and 5.8 % yr−1 (p=0.02) respectively. The slope of the trend for the other two seasons was also negative, but not statistically significant (p<10).
When Her was compared to AOD for the period 2006–2015, the estimated slope was small and positive (0.09 %) and the correlation between Her and AOD was statistically significant (p=0.03). The AOD effect explained only 4 % of the variability in Her. Based on seasonal-specific analysis, the statistically significant correlation between Her and AOD was only found in summer (p=0.03) and the estimated slope was positive (0.15 %), while the variability in Her explained by AOD was 16 %. Although the correlation between Her and AOD was not statistically significant for the other three seasons, the AOD effect was the largest and positive for winter (0.21 %, the smallest in the summer (0.09 %) and the effect was negative in autumn (−0.04 %).
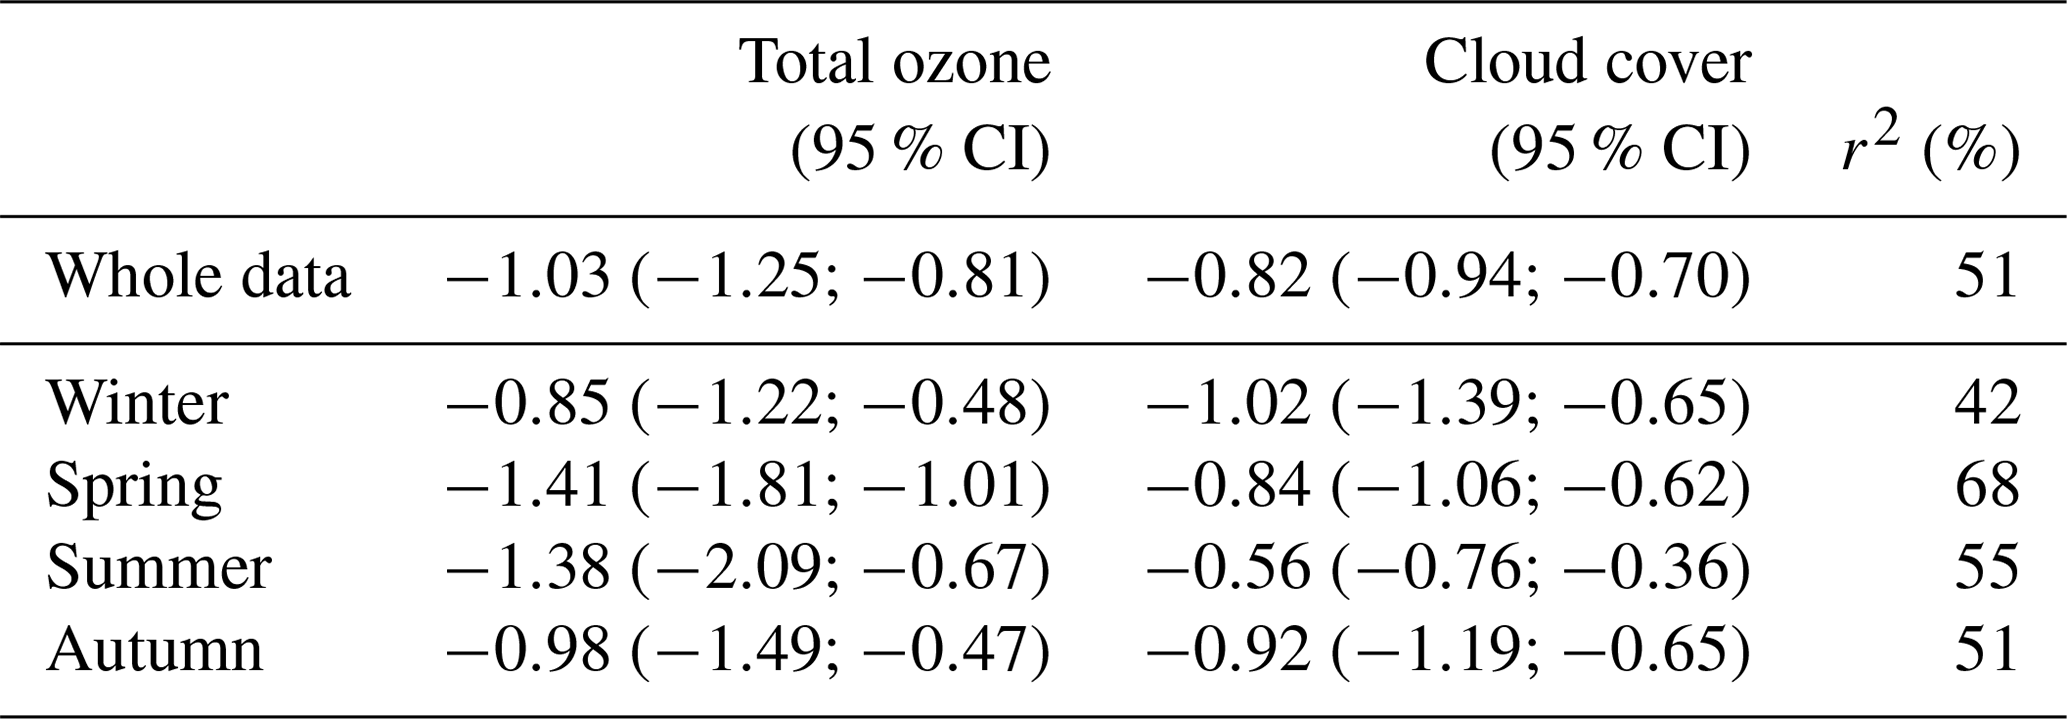
Table 6Estimated effect on Her with 95 % CI from the combined effect of both TO and CC trends for the period 1991–2015.
3.6 Erythema effective radiant exposure, total ozone, cloud cover and aerosol optical depth
A multiple linear regression analysis was used to investigate how the variation in CC and TO considered together relates to changes in Her for 1991–2015. The results showed that CC and TO have the largest and statistically significant influence on Her (p<0.001), and the results are presented in Table 6. The estimated slopes for both CC and TO were negative and statistically significant for all seasons. On average, Her decreased by 0.82 % for a 1 % increase in CC at constant levels of TO. Similarly, Her decreased by 1.03 % for a 1 % increase in TO, at constant levels of CC. The RAF due to TO (−1.03) was slightly different to the one based on the previous model with no CC effect adjustment, but the difference was not statistically significant (p=0.50). The combined model using TO and CC explained only 51 % of the variability in Her, with the individual contributions of 14 % (TO) and 37 % (CC), leaving 49 % unexplained.
Across the season-specific analyses, Her changes induced by TO and CC variability were highest in spring (68 %) and summer (55 %) for 1991–2015. The individual contribution of CC accounted for the largest variation in Her (47 % and 46 % respectively), while the variation in Her explained by TO was low (21 % and 12 %) when CC was in the model (Table 6). Winter changes in Her induced by these two factors were the lowest (42 %); individual contributions were 27 % (CC) and 15 % (TO). For autumn the changes were moderate (51 %), with variation in CC accounting for 41 % and TO explaining only 10 % of the total variation in Her. There was no statistically significant difference in RAF values due to TO between the seasons (p>0.50), except for winter and spring p=0.02 at constant levels of CC.
Table 7Estimated effect on Her with 95 % CI from the combined effect of TO and CC trend for two sub-periods: 1991–2004 and 2004–2015.
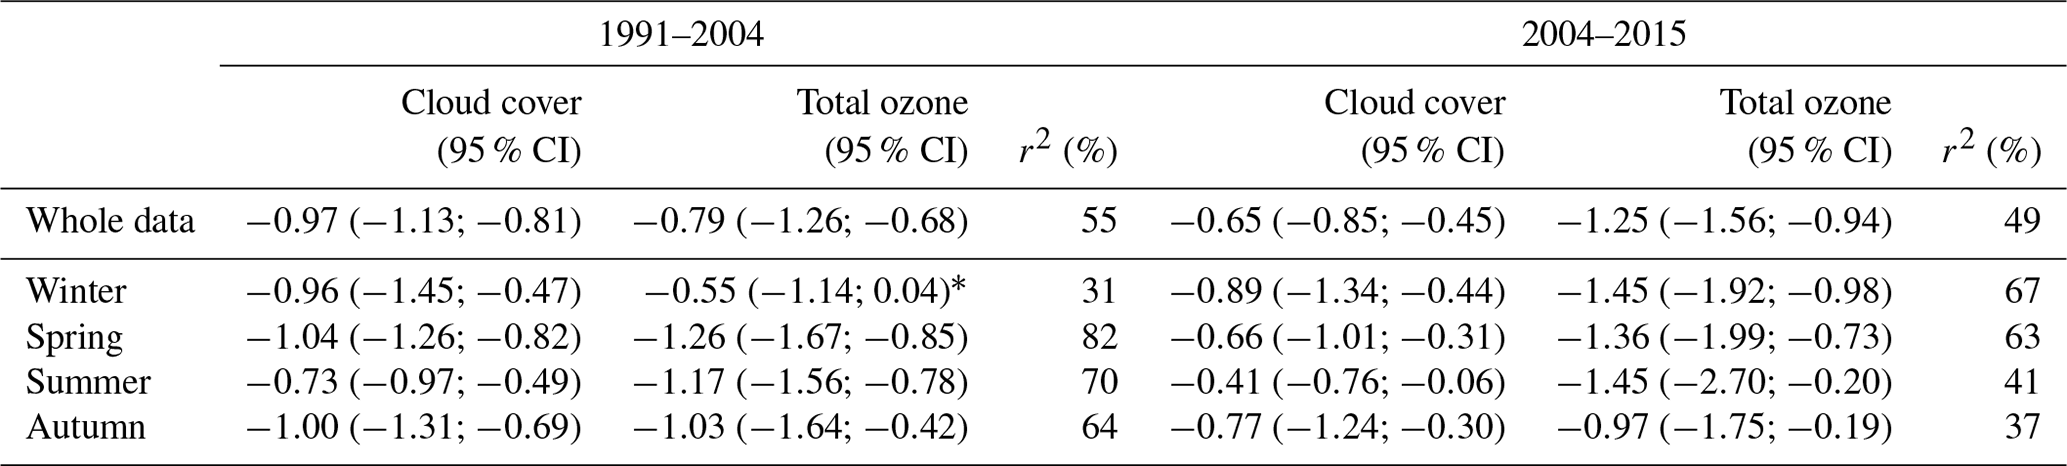
∗ p value =0.07.
Table 7 shows the results from the multiple linear regression analysis for 1991–2004 and 2004–2015. For 1991–2004 at constant levels of CC, a 1 % increase in TO caused Her to decrease by 0.79 % (RAF for TO was −0.79). For 1991–2004, 55 % of the total variation in Her was explained by CC and TO, together with respective contributions of 47 % and 8 %. In this case the relative contribution from TO was small.
In contrast, for 2004–2015, of the total 49 % of the variation in Her, 33 % was explained by TO and 16 % by CC. Her decreased by 0.65 % for a 1 % increase in CC at constant levels of TO, while 1991–2015 showed that Her decreased by 0.97 % for the same conditions. The RAF value for TO (−1.25) in 2004–2015 was different to that in 1991–2004 and for 1991–2015, but a test of heterogeneity showed that this was not statistically significant (p=0.44).
The season-specific results showed that the highest correlation for the period 1991–2004 was observed in spring (82 %) and of this total, 65 % was explained by CC and 17 % by TO. In contrast, the highest correlation value for 2004–2015 was found in winter (67 %), with 15 % explained by CC and 52 % by TO. For summer and autumn, CC was found to have the larger influence on the variation in Her (31 % and 26 %, respectively) in comparison with TO (10 % and 11 %, respectively), which shows a clear swap in the main contributing factor between autumn and winter. The heterogeneity test for RAF values for TO between seasons showed no statistically significant differences for either period (p>0.10).
When the AOD effect added to the model which also contained the TO and CC effects on Her for the period 2006–2015, the estimated slope for AOD was small and positive (0.02 %), but the AOD did not lead to a statistically significantly change in Her (p=0.47) and contributed only 1 % changes in Her in comparison to the contribution from TO (40 %) and CC (12 %). AOD therefore has a negligible impact.
Seasonally, the changes in AOD only showed a statistically significant effect on Her in winter (p=0.04), when the AOD effect was added to the model that contained the TO and CC effects for the period 2006–2015. The total variation explained in Her by these three factors together was 76 %, and of this total, TO, CC and AOD contributed to the changes by 57 %, 14 % and 5 % respectively. The estimated slope for TO, CC and AOD was −1.44, −1.04 and +0.18. The AOD effect was very small and positive in spring and summer, and negative in autumn, but the AOD did not lead to statistically significant changes in Her for three seasons.
4.1 Erythema effective UV radiant exposure
This paper reports an analysis of the effect of TO and CC on Her at Chilton between 1991 and 2015. During this period the highest values of Her were observed in 2003, likely due to low CC, but not with any significant reduction in TO level. It was also the same year that a heat wave affected much of western Europe including England (Beniston, 2004; Vieno et al., 2010). However, hot weather does not necessarily mean high UV and cold weather does not necessarily mean low UV (Wong et al., 2015). High levels of Her were also reported at two sites, Lindenberg in Germany and Bilthoven in Holland (den Outer et al., 2005; WMO, 2007) in 2003. These sites are at latitudes (49∘ N, 52∘ N respectively) which are close to that of Chilton (52∘ N). Den Outer and colleagues suggested that the high annual erythema effective UV dose received in Holland in 2003 was associated with extremely low cloud levels combined with moderately low ozone values. However, no such associations were reported at Uccle in Belgium with a latitude of 51∘ (De Bock et al., 2014) or at Reading in the UK (Smedley et al., 2012). Her data at Chilton also showed a reversal in trend before and after 2003, with an increasing trend from 1991 to 2003 but a decreasing trend thereafter. In order to avoid bias in the analyses caused by the highest Her values occurring in 2003, the year 2004 was chosen to be the changing point in preference to 2003.
In our previous analysis of the long-term variability of Her between 1991 and 2015 at Chilton, the data were divided into two separate time series due to geophysical phenomena: the first being from 1991 to 1995, due to the ozone turning point in the mid-1990s (WMO, 2014), and the second time series being from 1995 to 2015 (Hooke et al., 2017). This current work considered the entire time period of 1991–2015 and also splits the time series according to statistical analysis. In contrast, the Her data for 1991–2015 (based on a non-linear model over the full period) were statistically better described by two linear trends: the first a statistically significant increasing linear trend value of 1.01 % yr−1 (p<0.01) for 1991–2004, and the second a statistically significant decreasing trend of 1.35 % yr−1 (p<0.01) for 2004–2015. Our finding for the first period is consistent with our earlier result for the period 1991–1995, but a higher estimate (4.4 % yr−1) was obtained due to the relatively short time period of 5 years. Our findings for the second period also agree with those of our early study for 1995–2015, but the trend estimate was slightly lower (−0.8 % yr−1).
The finding in this study for the first period (1991–2004) is in good agreement with those from European studies that also reported significant increasing linear trends. At Lindenberg in Germany an increasing trend of 0.77 % yr−1 during 1996–2003 was reported, 0.85 % yr−1 for the period 1999–2004 and 1.4 % yr−1 over the period 1998–2005. The studies at Norrköping in Sweden and also at Bilthoven in Holland both reported an increasing trend during 1996–2004 (1.2 % and 0.86 % yr−1 respectively) based on solar zenith angles (SZAs) of 60∘, but the trend was higher (1.7 % yr−1) at Bilthoven for the period 1998–2005 when the noon values of the erythema UV radiation were used (Bais et al., 2007). The study at the Hoher Sonnblick site in Austria (Fitzka et al., 2012) showed a significant upward trend in the erythema weighted irradiance for the period 1997–2011, with a range from 0.84 % ± 0.52 % yr−1 at 45∘ SZA to 1.26 % ± 0.36 % yr−1 at 65∘ SZA under all weather conditions. However, a smaller and less significant result was seen at wavelengths of 305 nm (between −0.76 % ± 1.13 % yr−1 and 0.79 % ± 0.73 % yr−1, depending on SZA) at Hoher Sonnblick. In the UK, Reading also found a significant increasing linear trend (0.66 % per year) for the period from 1993 to 2008 based on the midday values of the UV index (Smedley et. al 2012). A significant increasing trend at 325 nm (0.34 % yr−1) in Europe based on averaged data from five selected stations was reported for the period 1995–2011 (Zerefos et al., 2012).
The trend in Her in this study over the second period (2004–2015) at Chilton is consistent with values derived for the averaged UV-B data over Canada, Europe and Japan that showed statistically significant evidence of a reduction in UV-B for the period 2007–2011, with the slope estimates ranging from −1.5 % to −2 % under cloudless conditions (Zerefos et al., 2012). These authors also showed that this slowdown of the upward trend in UV-B had a turning point after 2007 under constant cloudiness. Our findings are also in good agreement with the results of Fountoulakis et al. (2016) at Thessaloniki in Greece, where a turning point in the trends of UV irradiance was reported as occurring in 2006: a statistically significant increasing trend of 0.71 % ± 0.21 % yr−1 for the period 1994–2006 and an insignificant decreasing trend of 0.33 % ± 0.32 % yr−1 for 2006–2014. It appeared that the trend showed a similar behaviour in the UV irradiance between this UK study and the Greek study, although these countries differ significantly in terms of climate and location (51.6∘ N Chilton versus 40∘ N Thessaloniki). However, a recent study at Uccle in Belgium covering the period 1991–2013 (similar to that examined in this study period) found a strongly statistically significant increasing linear trend of 0.7 % yr−1 (De Bock et al., 2014). In comparison, our results for the period 1991–2015 found a non-significant downward trend.
When Her data for each season were analysed separately, a statistically significant increasing trend was only found in winter for the first period 1991–2004, despite large inter-month variability. However, winter only contributes a small fraction of the total annual Her in the UK. Much of this significant result might be caused by the high frequency of low TO events observed in winter (see Sect. 4.2). However, there was no significant linear trend in Her in either spring or in summer at Chilton. The absence of a significant trend in spring for this period might be due to higher values of the TO level over the same period.
The Her changes for the second period 2004–2015 showed a linear downward trend for all four seasons, but the trend was only statistically significant in summer and autumn. The results of the current study are comparable with those of the Belgian study at the Uccle site for the period 1991–2013. The results from the Belgian study showed the largest statistically significant increasing trend in Her in spring, but a negative trend in winter, albeit not statistically significant (De Bock et al., 2014). In addition, the Austrian study at the Hoher Sonnblick site for the period 1997–2011 found that the largest and most significant linear trends were during winter and spring.
4.2 Erythema effective UV radiant exposure and TO
The significantly increasing linear trend in TO of 0.13 % yr−1 (p<0.001) in the south of England for 1991–2015 could be due to natural variability in TO. This result is lower than but generally in good agreement with the significant upward trends reported in other European studies: 0.19 % yr−1 at Hoher Sonnblick in Austria during 1997-2011 (Fitzka et al., 2012) and 0.26 % yr−1 at Uccle in Belgium during 1991–2013 (De Bock et al., 2014). Our findings are also consistent with the result for the period 1995–2011 over Canada, Europe and Japan (Zerefos et al., 2012). The Reading study, however, using a subset of the same TO data used here, reported a small and not significant increase over the period 1993–2008, but the estimate lay within the range of trends observed at other European stations (Smedley et al., 2012). The analysis of seasonal data here showed the largest and most significant increasing linear trend during winter; while there was an upward trend in other seasons, it was markedly smaller and not significant. The Reading study, however, did not show any significant trend for any season, although an increasing rate in winter was noted for the period 1993–2008. Unlike this study, the Belgian study at the Uccle site only found statistically significant increasing linear trends of TO in spring and summer for the period 1991–2013 (De Bock et al., 2014).
A statistically significant inverse relationship was found between TO and Her (p<0.001). The RAF due to TO suggested that a 1 % increase in TO was associated with a 1.3 % decrease in Her for the period 1991–2015, in good agreement with studies from the USA (RAF ; Hall, 2017) and Spain (RAF to −1.4; Antón et al., 2009). However, the variability in Her due to the TO was weak (25 %). This is not surprising as the amount of UV radiation reaching the Earth's surface depends on a number of factors such as CC, atmospheric aerosols and air pollution as well as other climate factors, not solely on TO (Calbó et al., 2005).
We found an increasing tendency trend of 0.16 % yr−1 (p=0.09) and 0.22 % yr−1 (p=0.05) in TO for both periods 1991–2004 and 2004–2015. The association between Her and TO was found to be statistically significant for both periods; the RAF value showed that a 1 % increase in TO was associated with a −1.2 % and −1.5 % decrease in Her for the two periods respectively. The increase in TO trend for 1991–2004 and 2004–2015 corresponded to a negative trend of −0.19 % yr−1 and −0.33 yr−1 in Her respectively. However, the amount of variation in Her explained by that of TO was low (18 % and 33 % for each time period respectively). The size of the slope estimates in TO is smaller than of those reported in the study by Zerefos et al. (2012), in which the increasing ozone effect on 305 nm irradiance was estimated to be on the order of −4 % over the period 2007–2011. This higher estimate obtained in that study might be due to the relatively short time period (5 years) in comparison to our study period (2004–2015, 12 years), and also their result was based on the averaged data over Canada, Europe and Japan sites. The Belgian study (De Bock et al., 2014) also reported a greater effect of TO on the erythema UV dose (−5 %) during the period 1991–2008 when measures of global solar radiation and AOD were taken into account that resulted in the bigger TO. The Reading study, however, did not find any correlation between the surface UV radiation and TO for the period 1993–2008. The authors suggested that the majority of the variability in UV radiation was due to changes in CC and other effects (Smedley et al., 2012).
Examining our data on a season-by-season basis over the whole period from 1991 to 2015, we found a highly negative slope estimate for each season between TO and Her. The RAF varied from −0.94 in winter to −2.37 in summer. However, there were some differences in the amount of Her variation that was explained by TO across the seasons. In spring and summer the variability explained was moderate at 41 % and 34 % respectively, but in winter and autumn it was considerably lower at 19 % and 21 %.
Over the first period (1991–2004) the RAF ranged from −0.54 for winter and −2.47 for summer. The greatest impact of TO on Her was seen in spring (37 %) and summer (42 %), but for the second period (2004–2015), the impact was bigger in winter (52 %) and spring (48 %) than in summer (24 %) and autumn (17 %). This was mainly due to the strong inverse relationship between Her and TO that was observed during spring and winter in the period 2008–2015 (63 % and 56 %), while most TO values were higher and remained stable for the same period (Fig. 4).
4.3 Erythema effective UV radiant exposure and CC
CC can have a marked impact on the amount of UV that reaches the Earth's surface. An increase in CC usually results in a reduction of UV radiation below the clouds. Whilst UV can pass through thin and broken clouds, thick clouds tend to reflect, absorb or scatter UV radiation. Puffy, fair-weather clouds reflect rays and can actually increase the UV radiation reaching the Earth's surface (Alados-Arboledas et al., 2003).
There was a statistically significant decreasing trend of 0.19 % yr−1 in CC for the period 1991–2015. Our analysis of CC variation also showed a small significant decreasing trend of −0.68 % yr−1 (p<0.001) for the first period (1991–2004), but no significant trend for the second period (2004–2015) although the estimated slope was small and remained negative (−0.04 % yr−1). Our findings agree partly with other studies that reported a significant decrease in CC (Norris and Slingo, 2009; Eastman and Warren, 2013) and those that did not find any evidence of a decreasing trend in CC, for example, the studies at the Hoher Sonnblick site in Austria over the period 1997–2011 (Fitzka et al., 2012) and in the study examining data from Europe, Canada and Japan for the period 1995–2011 (Zerefos et al., 2012).
The association between Her and CC was also statistically significant; a 1 % decreasing trend in CC was associated with a 0.95 % increase in Her for the period 1991–2015 and the CC explained 38 % of the variability in Her. This is higher than the variability in Her explained by TO alone. The inverse correlation between Her and CC was also strongly statistically significant for both 1991–2004 and 2004–2015 (−1.06 % and −0.82 % respectively). The decrease in CC trend for the same periods corresponded to a positive trend of 0.72 % yr−1 and 0.03 % yr−1 in Her. However, while about half the variation in Her was explained by CC in the first period, this fell to just over one-quarter for the second period.
Examining our data on a season-by-season basis, the only statistically significant trends in cloud reduction observed were in spring and winter during the period 1991–2004. For 2004–2015, the variation in Her explained by CC dropped below 50 % for all seasons, particularly autumn (26 %), which was slightly lower than that for winter (29 %). These observations agree with the findings from the Austria study at Hoher Sonnblick for 1997–2011 (Fitzka et al., 2012). Even though the study did not look at the correlation between CC and UV, the authors reported that a total cloud reduction of 1.04 % yr−1 was evident for UV at SZA 55∘ for the period 1997–2011.
4.4 Erythema effective UV radiant exposure and AOD
The ground-based AOD measurements at the Chilbolton site showed a statistically significant decreasing trend of −4.3 % yr−1 (p<0.001) for 2006–2015. This finding agrees with the studies that reported a declining trend in AOD in Europe during the period 2003–2015, attributed to increasing air quality due to environmental regulations (Alpert et al.. 2012; Provençal et al., 2017). Our trend estimate is consistent with AOD estimates derived at five stations in Europe (−4.3 yr−1), which used the dataset from the satellite MODIS for the period 1995–2011 (Zerefos at al., 2012). However, it disagrees with the insignificant negative trend that was found in the Belgian study at Uccle, with a slower rate of −0.8 % yr−1 for the period 1991–2013 (De Bock et al., 2014). The Austrian study at Sonnblick found an even smaller decline in the AOD trend of −0.5 to −0.6 % yr−1 over 1997–2011, and the trend was statistically significant (Fitzka et al., 2012).
Seasonally, a statistically significant downward AOD linear trend was only found in winter and spring in this study, whereas the Belgian study reported that the AOD trend was negative and significant during summer and autumn (De Bock et al., 2014).
When Her was compared to AOD for the period 2006–2015 in this study, the slope estimate for AOD exhibited a small and positive (0.09 %), yet significant, effect on Her (p=0.03). Our finding agrees with the study by Zerefos et al. (2012), but the AOD effect at 305 nm irradiance – based on data averaged over Canada, Europe and Japan sites – was bigger, with a positive estimate of a 1.8 % increase over the period 2007–2011. The authors also showed that UV-B at 305 nm increased as a result of reduced AOD.
A similar positive AOD effect on Her was also seen for the seasonal specific analysis, in which the Her level increased with increasing AOD level (except autumn), and it was only statistically significant in summer (p=0.03). Similarly, the study at Uccle also reported a positive AOD effect on Her for all seasons except in summer. Authors stated that an increase in AOD could lead to an increase in UV radiation if the increase in AOD were caused by an increase in the amount of small scattering aerosol particles (De Bock et al., 2014). However, here we do not have any information on these parameters.
4.5 Erythema effective UV radiant exposure, TO, CC and AOD
Given that we found clear evidence that variation in Her could be partially explained by variation in TO and CC separately, we considered their combined effects using additive multiple linear regression analysis. An additive multiple regression model with just TO and CC showed that for a 1 % change of Her, the model factors TO and CC changed by −1.03 % and −0.82 % respectively for the period 1991–2015. This RAF estimate due to TO (−1.03) is consistent with the RAF values due to TO in the US study (Hall, 2017), in which the impact of clouds on the RAF was determined and ranged from a low of −0.80 to a high of −1.38.
Over the whole period 1991–2015, half of the variation in Her could be explained by TO and CC, with TO accounting for 14 % and CC accounting for 37 % of the variation in Her. In this work, the combined effects of TO and CC on a season-by-season basis showed that the biggest proportion of variability in Her was in spring (68 %), while the smallest proportion was in winter. In each season, CC explained far more of the variability than TO from the additive linear regression model that was used.
The combined effect of TO and CC on Her was assessed using two linear trends with a node at 2004. Over 1991–2004 the proportion of Her variability explained by these two factors rose a small amount (4 %), but fell slightly for 2004–2015 (2 %) compared to the proportion for 1991–2015. A major difference was seen in how much of the variability was explained by each factor across the two periods. For 1991–2004, CC variation accounted for a lot more of the explained variability compared to TO (47 % in comparison to 8 %), whereas for 2004–2015 the proportions were 16 % and 33 % respectively. This reversal can be attributed to a significant correlation between TO and Her observed in winter and spring in particular during 2008–2015, which has a bigger impact on Her than CC for the same period.
Across the seasons there were marked differences in the proportion of Her variability explained by TO and CC. For the period 1991–2004, combining TO and CC together explained 82 % of the variability in Her in spring but only 31 % in winter. However, for 2004–2015, TO and CC together explained the greatest proportion of Her variability in winter and spring (67 % and 63 %), with summer and autumn explaining 41 % and 37 % respectively.
The season-specific analysis of these data also showed that the size of the respective contributions that TO and CC made to the variation in Her changed between the two periods. For 1991–2004, in spring and summer, TO explained 17 % and 7 % of the variability respectively compared to the 65 % and 63 % contributions of CC. In winter and spring of 2004–2015, TO explained 52 % and 48 % of the Her variability compared to a CC contribution of 15 % for both seasons.
When the effects of TO, CC and AOD were combined together for the period 2006–2015F, we found significant evidence that variation in Her could be partially explained by the changes in TO and CC. However, there was a lack of clear evidence of any underlying dependence of AOD on changes in Her, although the effect of AOD on Her was positive. For the season-specific analysis, when the AOD effect was added to the model that contained the TO and CC effects, the AOD effect was only statistically significant in winter (p=0.04); the AOD effect on Her was positive (0.18 %) and the corresponding estimate for TO and CC was −1.44 and −1.04 respectively over the period 2006–2015. The total variation explained in Her by these three factors together in winter was 76 % and of this total, TO, CC and AOD contributed to the changes by 57 %, 14 % and 5 %.
This study demonstrated that for the first period 1991–2004, the CC effect on Her was greater than that of TO, while for the second period 2004–2015 the opposite was found and the impact of AOD was negligible, although the AOD effect was small and significant in winter. Our findings from the first period partly agree with those from the Austrian study at Hoher Sonnblick over the period 1997–2011 and the Spanish study on the Iberian Peninsula for the period 1985–2011. Both studies reported that the significant increase in Her was attributed to changes in CC and AOD rather than TO (Fitzka et al., 2012; Román et al., 2015). The study over Canada, Europe and Japan during 1995–2006 showed that the decline of AOD and significant increase in TO were associated with increased UV-B, although a non-significant trend with CC was found (Zerefos et al., 2012). In contrast, the Belgian study reported that AOD only had a very small impact on the erythema UV dose, whilst the impact from TO was strong (De Bock et al., 2014).
This study provides evidence that both the increasing trend in Her for 1991–2004 and the decreasing trend in Her for 2004–2015 occur in response to variation in TO, which exhibits a small increasing tendency over these periods. CC plays a more important role in the increasing trend in Her for 1991–2004 than TO, whereas for 2004–2015, the decreasing trend in Her is less associated with changes in CC and AOD.
UV radiant exposure data are available on request. The total ozone data are from https://uk-air.defra.gov.uk/data/ozone-data (last access: 15 January 2019; UK Air, 2019), and AODs are available from http://aeronet.gsfc.nasa.gov (last access: 15 January 2019; NASA, 2019). The cloud cover data are provided by the Centre for Environmental Data Analysis at Harwell Oxford (http://www.ceda.ac.uk; last access: 15 January 2019; CEDA, 2019).
NH obtained UV radiant exposure, total ozone, cloud cover and AOD datasets from various places and carried out all statistical data analyses and interpretation. RJR, MPH and JBO were involved in the technical side of the UV radiant exposure and data measurements. The paper was internally peer-reviewed by RH. NH prepared the manuscript with contributions from all co-authors.
The authors declare that they have no conflict of interest.
We wish to thank Ruth Petrie and the whole of the Centre for
Environmental Data Analysis (CEDA) for all their help and for providing us with the
cloud cover data from the Benson station at Oxfordshire. We also thank Iain
H. Woodhouse, Judith Agnew and Judith Jeffrey and their staff for
establishing and maintaining the AERONET sites and also the NERC Field
Spectroscopy Facility (FSF) used in this investigation. We would also like
to express thanks to the Department for Environment, Food and Rural Affairs (DEFRA) for making total ozone data available on their website. The authors
would like to thank three anonymous reviewers and the co-editor for their
constructive comments.
Edited by: Stelios Kazadzis
Reviewed by: three anonymous referees
AGNIR (Advisory Group on Non-ionising Radiation): Health Effects from Ultraviolet Radiation, Report of an Advisory Group on Non-ionising Radiation, Documents of the NRPB, 13:1, 2002.
Alados-Arboledas, L., Alados, I., Foyo-Moreno, I., Olmo, F. J., and Alcántara, A.: The influence of clouds on surface UV erythemal irradiance, Atmos. Res., 66, 273–290, https://doi.org/10.1002/joc.1883, 2003.
Alpert, P., Shvainshtein, O., and Kishcha, P.: AOD trends over megacities based on space monitoring using MODIS and MISR, Am. J. Clim. Change, 12, 117–131, https://doi.org/10.4236/ajcc.2012.13010, 2012.
Antón, M., Serrano, A., Cancillo, M. L., and García, J. A.: An empirical model to estimate ultraviolet erythemal transmissivity, Ann. Geophys., 27, 1387–1398, https://doi.org/10.5194/angeo-27-1387-2009, 2009.
Bais, A. F., Kazadzis, S., Meleti, C., Kouremeti, N., Kaurola, J., Lakkala, K., Slaper, H., den Outer, P. N., Josefsson, W., Feister, U., and Janouch, M.: Variability in spectral UV radiation at seven European stations, edited by: Gröbner J., One century of UV radiation research, Proceedings of the UV conference, July 2007, Davos, Switzerland, 1, 27–28, 2007.
Bais, A. F., Tourpali, K., Kazantzidis, A., Akiyoshi, H., Bekki, S., Braesicke, P., Chipperfield, M. P., Dameris, M., Eyring, V., Garny, H., Iachetti, D., Jöckel, P., Kubin, A., Langematz, U., Mancini, E., Michou, M., Morgenstern, O., Nakamura, T., Newman, P. A., Pitari, G., Plummer, D. A., Rozanov, E., Shepherd, T. G., Shibata, K., Tian, W., and Yamashita, Y.: Projections of UV radiation changes in the 21st century: impact of ozone recovery and cloud effects, Atmos. Chem. Phys., 11, 7533–7545, https://doi.org/10.5194/acp-11-7533-2011, 2011.
Beniston, M.: The 2003 heat wave in Europe: A shape of things to come? An analysis based on Swiss climatological data and model simulations, Geophys. Res. Lett., 31, L02202, https://doi.org/10.1029/2003GL018857, 2004.
Calbó, J., Pagès, D., and González, J.-B.: Empirical studies of cloud effects on UV radiation: A review, Rev. Geophys., 43, RG2002, https://doi.org/10.1029/2004RG000155, 2005.
CEDA: Cloud cover data, available at: http://www.ceda.ac.uk, last access: 15 January 2019.
Chatfield C.: The analysis of time series: an introduction, Sixth Edition, Chapman and Hall, London, UK, CRC text in statistical science, 1996.
De Bock, V., De Backer, H., Van Malderen, R., Mangold, A., and Delcloo, A.: Relations between erythemal UV dose, global solar radiation, total ozone column and aerosol optical depth at Uccle, Belgium, Atmos. Chem. Phys., 14, 12251–12270, https://doi.org/10.5194/acp-14-12251-2014, 2014.
den Outer, P. N., Slaper, H., and Tax, R. B.: UV radiation in the Netherlands: Assessing long-term variability and trends in relation to ozone and clouds, J. Geophys. Res., 110, D02203, https://doi.org/10.1029/2004JD004824, 2005.
den Outer, P. N., Slaper, H., Kaurola, J., Lindfors, A., Kazantzidis, A., Bais, A. F., Feister, U., Junk, J., Janouch, M., and Josefsson, W.: Reconstructing of erythemal ultraviolet radiation levels in Europe for the past 4 decades, J. Geophys. Res., 115, D10102, https://doi.org/10.1029/2009JD012827, 2010.
Diffey, B. L.: Sources and measurement of ultraviolet radiation, Methods, 28, 4–13, https://doi.org/10.1016/S1046-2023(02)00204-9, 2002.
Dunn, R. J. H., Willett, K. M., Thorne, P. W., Woolley, E. V., Durre, I., Dai, A., Parker, D. E., and Vose, R. S.: HadISD: a quality-controlled global synoptic report database for selected variables at long-term stations from 1973–2011, Clim. Past, 8, 1649–1679, https://doi.org/10.5194/cp-8-1649-2012, 2012.
Dunn, R. J. H., Willett, K. M., Morice, C. P., and Parker, D. E.: Pairwise homogeneity assessment of HadISD, Clim. Past, 10, 1501–1522, https://doi.org/10.5194/cp-10-1501-2014, 2014.
Dunn, R. J. H., Willett, K. M., Parker, D. E., and Mitchell, L.: Expanding HadISD: quality-controlled, sub-daily station data from 1931, Geosci. Instrum. Method. Data Syst., 5, 473–491, https://doi.org/10.5194/gi-5-473-2016, 2016.
Eastman, R. and Warren, S. G.: A 39-yr survey of cloud changes from land stations worldwide 1971–2009: long-term trends, relation to aerosols and expansion of the tropical belt, J. Climate, 26, 1286–1303, https://doi.org/10.1175/JCLI-D-12-00280.1, 2013.
Epplin, J. and Thomas, S. A.: Vitamin D: It does a body good, Annals of Long-Term Care, 18, 39–45, 2010.
Farman, J. C., Gardiner, B. G., and Shanklin, J. D.: Large losses of total ozone in Antarctica reveal seasonal ClOx ∕ NOx interaction, Nature, 315, 207–210, 1985.
Fitzka, M., Simic, S., and Hadzimustafic, J.: Trends in spectral UV radiation from long-term measurements at Hoher Sonnblick, Austria, Theor. Appl. Climatol., 110, 585–593, https://doi.org/10.1007/s00704-012-0684-0, 2012.
Fountoulakis, I., Bais, A. F., Fragkos, K., Meleti, C., Tourpali, K., and Zempila, M. M.: Short- and long-term variability of spectral solar UV irradiance at Thessaloniki, Greece: effects of changes in aerosols, total ozone and clouds, Atmos. Chem. Phys., 16, 2493–2505, https://doi.org/10.5194/acp-16-2493-2016, 2016.
Gies, P., Klekociuk, A., Tully, M., Henderson, S., Javorniczky, J., King, K., Lemus-Deschamps, L., and Makin, J.: Low ozone over Southern Australia in August 2011 and its impact on solar ultraviolet radiation levels, Photochem. Photobiol., 89, 984–994, https://doi.org/10.1111/php.12076, 2013.
Hall, E. S.: Comparison of five modelling approaches to quantify and estimate the effect of clouds on the radiation amplification factors (RAF) for solar ultraviolet radiation, Atmosphere, 8, 153, https://doi.org/10.3390/atmos8080153, 2017.
Harris, N. R. P., Kyrö, E., Staehelin, J., Brunner, D., Andersen, S.-B., Godin-Beekmann, S., Dhomse, S., Hadjinicolaou, P., Hansen, G., Isaksen, I., Jrrar, A., Karpetchko, A., Kivi, R., Knudsen, B., Krizan, P., Lastovicka, J., Maeder, J., Orsolini, Y., Pyle, J. A., Rex, M., Vanicek, K., Weber, M., Wohltmann, I., Zanis, P., and Zerefos, C.: Ozone trends at northern mid- and high latitudes – a European perspective, Ann. Geophys., 26, 1207–1220, https://doi.org/10.5194/angeo-26-1207-2008, 2008.
Helsel, D. R. and Hirsch, R. M.: Statistical methods in water resources, Studies in Environmental Science, 49, Elsevier, New York, USA, 1992.
Holick, M. F.: Vitamin D deficiency, New Engl. J. Med., 357, 266–281, https://doi.org/10.1056/NEJMra070553, 2007.
Hooke, R. J. and Higlett, M. P.: Temperature Correction of Historic Erythema Effective Solar Uv Data Resulting in a Continuous 25-Year Data Set at Chilton, UK, Radiat. Prot. Dosim., 175, 363–367, https://doi.org/10.1093/rpd/ncw358, 2016.
Hooke, R. J., Higlett, M. P., Hunter, N., and O'Hagan J. B.: Long term variations in erythema effective solar UV at Chilton, UK, from 1991 to 2015, Photochem. Photobio. S., 16, 1596–1603 https://doi.org/10.1039/C7PP00053G, 2017.
HPA (Health Protection Agency): Health Effects of Climate Change in the UK 2012, An update of the Department of Health report 2001/2002, edited by: Vardoulakis, S. and Heaviside, C. Health Protection Agency (in partnership with the Department of Health), Chilton, UK, ISBN 978-0-85951-723-2, 2012.
Kendall, M. G.: Rank Correlation Methods, 4th edition, Charles Griffin, London, UK, 1975.
Lucas, R.: World Health Organisation (WHO) report: Solar Ultraviolet Radiation, Environmental Burden of Disease Series, No. 17, World Health Organization, Geneva, Switzerland, ISBN 978-92-4-159917-7, 2010.
Mann, H. B.: Non-parametric tests against trend, Econometrica, 13, 163–171, 1945.
McKenzie, R. L., Liley, J. B., and Björn, L. O.: UV radiation: Balancing risks and benefits, Photochem. Photobiol., 85, 88–98, https://doi.org/10.1111/j.1751-1097.2008.00400.x, 2009.
Met Office Hadley Centre: National Centers for Environmental Information – NOAA (2018): HadISD: Global sub-daily, surface meteorological station data, 1931–2017, v2.0.2.2017p. Centre for Environmental Data Analysis, available at: http://catalogue.ceda.ac.uk/uuid/3c67dfe728594fadabb920564af4df4a, last access: December 2018.
NASA: Aerosol Optical Depth, available at: http://aeronet.gsfc.nasa.gov, last access: 15 January 2019.
Norris, J. R. and Slingo, A.: Trends in observed cloudiness and Earth's radiation budget what do we not know and what do we need to know?, in: Clouds in the Perturbed Climate System, edited by: Heintzenberg, J. and Charlson, R. J., MIT Press, Cambridge, MA, USA, 17–36, 2009.
Norval, M., Lucas, R. M., Cullen, A. P., de Gruijl, F. R., Longstreth, J., Takizawa, Y., and van der Leun, J. C.: The Human Health Effects of Ozone Depletion and Interactions with Climate Change. Photochem. Photobiol. S., 10, 199–225, https://doi.org/10.1039/C0PP90044C, 2011.
Provençal, S., Kishcha, P., da Silva, A. M., Elhacham, E., and Alpert, P.: AOD distributions and trends of major aerosol species over a selection of the world's most populated cities based on the 1st Version of NASA's MERRA Aerosol Reanalysis, Urban Clim., 20, 168–191, https://doi.org/10.1016/j.uclim.2017.04.001, 2017.
Román, R., Bilbao, J., and de Miguel, A.: Erythemal ultraviolet irradiation trends in the Iberian Peninsula from 1950 to 2011, Atmos. Chem. Phys., 15, 375–391, https://doi.org/10.5194/acp-15-375-2015, 2015.
Smedley, A. R. D., Rimmer, J. S., Moore, D., Toumi, R., and Webb, A. R.: Total ozone and surface UV trends in the United Kingdom: 1979–2008, Int. J. Climatol., 32, 338–346, https://doi.org/10.1002/joc.2275, 2012.
UK Air: Total ozone data, available at: https://uk-air.defra.gov.uk/data/ozone-data, last access: 15 January 2019.
UNEP (United Nations Environment Programme ): Environmental effects of ozone depletion and its interactions with climate change: 2010 assessment, 236 pp., UNEP, Nairobi, Kenya, ISBN: 92-807-2312-X, 2010.
Vieno, M., Dore, A. J., Stevenson, D. S., Doherty, R., Heal, M. R., Reis, S., Hallsworth, S., Tarrason, L., Wind, P., Fowler, D., Simpson, D., and Sutton, M. A.: Modelling surface ozone during the 2003 heat-wave in the UK, Atmos. Chem. Phys., 10, 7963–7978, https://doi.org/10.5194/acp-10-7963-2010, 2010.
Waugh, D. W., Oman, L., Kawa, S. R., Stolarski, R. S., Pawson, S., Douglass, A. R., Newman, P. A., and Nielsen, J. E.: Impacts of climate change on stratospheric ozone recovery, Geophys. Res. Lett., 36, L03805, https://doi.org/10.1029/2008GL036223, 2009.
WHO (World Health Organisation): Solar Ultraviolet Radiation. Global burden of disease from solar ultraviolet radiation, Environmental Burden of Disease Series, No. 13, World Health Organization, Geneva, Switzerland, ISBN: 92-4-159440-3, 2006.
WMO: (World Meteorological Organization): Scientific Assessment of Ozone Depletion: 2006, Global ozone Research and Monitoring Project-Report No. 50, Geneva, Switzerland, 2007.
WMO: (World Meteorological Organization): Scientific Assessment of Ozone Depletion: 2014, Global ozone Research and Monitoring Project-Report No. 55, Geneva, Switzerland, 2014.
Wong, C. C., Liu, W., Gies, P., and Nixon, R.: Think UV, not heat!, Australas. J. Dermatology, 56, 275–278, 2015.
Young, C.: Solar ultraviolet radiation and skin cancer, Occup. Med., 59, 82–88, https://doi.org/10.1093/occmed/kqn170, 2009.
Zerefos, C. S., Tourpali, K., Eleftheratos, K., Kazadzis, S., Meleti, C., Feister, U., Koskela, T., and Heikkilá, A.: Evidence of a possible turning point in solar UV-B over Canada, Europe and Japan, Atmos. Chem. Phys., 12, 2469–2477, https://doi.org/10.5194/acp-12-2469-2012, 2012.