the Creative Commons Attribution 4.0 License.
the Creative Commons Attribution 4.0 License.
 | 09 May 2019
Regional new particle formation as modulators of cloud condensation nuclei and cloud droplet number in the eastern Mediterranean
Panayiotis Kalkavouras
Aikaterini Bougiatioti
Nikos Kalivitis
Iasonas Stavroulas
Maria Tombrou
Athanasios Nenes
Nikolaos Mihalopoulos
A significant fraction of atmospheric particles that serve as cloud condensation nuclei (CCN) are thought to originate from the condensational growth of new particle formation (NPF) from the gas phase. Here, 7 years of continuous aerosol and meteorological measurements (June 2008 to May 2015) at a remote background site of the eastern Mediterranean were recorded and analyzed to assess the impact of NPF (of 162 episodes identified) on CCN and cloud droplet number concentration (CDNC) formation in the region. A new metric is introduced to quantitatively determine the initiation and duration of the influence of NPF on the CCN spectrum. NPF days were found to increase CCN concentrations (from 0.10 % to 1.00 % supersaturation) between 29 % and 77 %. Enhanced CCN concentrations from NPF are mostly observed, as expected, under low preexisting particle concentrations and occur in the afternoon, relatively later in the winter and autumn than in the summer. Potential impacts of NPF on cloud formation were quantified by introducing the observed aerosol size distributions and chemical composition into an established cloud droplet parameterization. We find that the supersaturations that develop are very low (ranging between 0.03 % and 0.27 %) for typical boundary layer dynamics (σw ∼0.3 m s−1) and NPF is found to enhance CDNC by a modest 13 %. This considerable contrast between CCN and CDNC response is in part from the different supersaturation levels considered, but also because supersaturation drops from increasing CCN because of water vapor competition effects during the process of droplet formation. The low cloud supersaturation further delays the appearance of NPF impacts on CDNC to clouds formed in the late evening and nighttime – which has important implications for the extent and types of indirect effects induced by NPF events. An analysis based on CCN concentrations using prescribed supersaturation can provide very different, even misleading, conclusions and should therefore be avoided. The proposed approach here offers a simple, yet highly effective way for a more realistic impact assessment of NPF events on cloud formation.
- Article
(3135 KB) - Full-text XML
-
Supplement
(1184 KB) - BibTeX
- EndNote


Cloud condensation nuclei (CCN) and cloud droplet formation constitute the direct microphysical link between aerosols and clouds. Quantifying how changes in aerosols affect global clouds, precipitation, and climate is limited by the large number of processes and scales that need to be captured in models (Stevens and Feingold, 2009; Pöschl et al., 2010; Seinfeld et al., 2016; Cecchini et al., 2017). New particle formation (NPF), the process during which new particles are formed directly from the gas phase, is thought to significantly shape the distribution of CCN throughout the atmosphere (Pierce and Adams, 2007; Westervelt et al., 2013; Gordon et al., 2017). Although initially too small (1–2 nm; Kerminen et al., 2012) to act as CCN, particles from NPF can grow to sufficient size and hygroscopicity over a period of a few hours to days and eventually act as efficient CCN.
Field studies have demonstrated substantial local enhancement in CCN number from NPF. For example, Wiedensohler et al. (2009) observed that the CCN size distribution was dominated by the growing nucleation mode (above 80 %) in a highly polluted region around Beijing, while Dameto de España et al. (2017) found that NPF in Vienna, Austria, increases the CCN number concentration by up to 143 % at 0.50 % supersaturation. Sihto et al. (2011) found at the Hyytiälä Forestry Field Station (of the University of Helsinki, Finland) that NPF increases the CCN concentrations in the evening of an NPF day by 70 %–110 % depending on the supersaturation level, while Rose et al. (2017) observed that CCN concentrations were increased by 168 % to 996 % during NPF events at the Chacaltaya station, Bolivia (5240 m a.s.l.). Additionally, model investigations suggest atmospheric NPF to be an important contributor to CCN and by extension to aerosol–cloud–climate interactions. Spracklen et al. (2008) have shown that boundary layer (BL) particle formation can cause an increase in global BL CCN concentrations at 0.20 % supersaturation by 3 %–20 % and by 5 %–50 % at 1.00 % supersaturation. Merikanto et al. (2010) found that 45 % of global low-level CCN at 0.20 % supersaturation originates from NPF. Moreover, Westervelt et al. (2014) estimated a 49 %–78 % average increase in global boundary layer CCN number concentration (at 0.20 % supersaturation) from NPF.
NPF events followed by growth to CCN-sized particles are observed to take place frequently and over relatively large spatial scales in continental boundary layers, including forested areas at mid and high latitudes, other remote continental regions, urban areas, and even highly polluted environments (e.g., Kerminen et al., 2018). NPF events are long known to occur in marine environments, highlighting the role of iodine species as precursors for new particle cluster formation (Sellegri et al., 2016) from the oxidation of biogenic alkyl-halides in near-coastal areas (e.g., O'Dowd et al., 2002; Vaattovaara et al., 2006) and providing the most comprehensive mechanistic description of coastal NPF presented to date (Sipilä et al., 2016). Furthermore, NPF can be triggered by the rapid dimethylsulfide (DMS) oxidation above clouds (Bates et al., 1987; Kreidenweis et al., 1991; Katoshevski et al., 1999) and cloud outflow regions associated with convection (e.g., Hermann et al., 2003). NPF within marine boundary layers can strongly affect CCN number concentrations at all cloud-relevant supersaturations (e.g., Kalivitis et al., 2015; Kalkavouras et al., 2017; Debevec et al., 2018). When these small particles, however, are mixed within the boundary layer, they may subsequently grow to CCN-relevant sizes, or even act as CCN in strongly convective clouds (Fan et al., 2013; Wang et al., 2016).
A thorough assessment of NPF impacts on CCN levels requires knowledge of all events and subsequent microphysical processing that occurred throughout the path of an air mass. Observationally, this is almost impossible to carry out; one can therefore only quantify the CCN concentration perturbation, or enhancement, above “background” levels that existed prior to an NPF event (Peng et al., 2014; Wu et al., 2015; Ma et al., 2016). Although conceptually straightforward, studies differ in the approach used to define the initiation of an NPF event (e.g., a strong enhancement in total particle number, the shape of the size distribution), the pre-event CCN concentration (e.g., a 30 min or 1 h average CCN concentration before the initiation time), and also the metric used to quantify the CCN enhancement from an NPF event (e.g., peak enhancement, a time-averaged enhancement, and the size defining the lower limit of CCN activation). Furthermore, observational studies quantify CCN enhancements from measurements of aerosol number size distributions; the link to CCN concentrations is done by using a prescribed (or calculated) “critical diameter” (dc), above which all particles act as CCN in clouds. Studies vary widely in the approach used to determine this critical diameter, dc, so additional considerations are required between assessments. Theoretically, dc depends on the level of supersaturation that develops in clouds and the chemical composition of the particles (Seinfeld and Pandis, 2006). Often, dc is prescribed between 50 and 150 nm, corresponding roughly to clouds with maximum supersaturation levels between 1.00 % and 0.10 %, respectively (Kerminen et al., 2012). However, clouds are not characterized by a constant supersaturation; rather, they exhibit variable levels that instantaneously adjust to the intensity of cloud updrafts and the CCN spectra (e.g., Nenes and Seinfeld, 2003; Hudson and Noble, 2014). It is clear that all the above conventions need careful consideration, as they can affect the magnitude and duration of CCN enhancement for each event.
Asmi et al. (2011) at the Pallas Global Atmospheric Watch (GAW) station in northern Finland estimated the contribution of NPF to CCN concentration. The method adopted was to subtract the concentration of particles larger than 80 nm diameter (N80) at the end of the NPF, from the average N80 before the NPF influence (defined from the time where the NPF started up to where the nucleation-mode particles reach 80 nm diameter). A similar approach was used to quantify the enhancement from NPF to particles larger than 50 and 100 nm (N50 and N100, respectively). The relative enhancement of N50, N80, and N100 from NPF was 160±270 %, 210±110 %, and 50±130 %, respectively. In the boreal forest station of Hyytiälä, Kerminen et al. (2012) calculated the CCN number concentrations using the particle number size distributions for diameters above 50 and 100 nm. The contribution of any NPF event was determined from the comparison of the maximum particle number concentration (Nmax) that develops during an event (1 h average) over the particle number concentration (Nprior) prior to the event (1 h average). N50(max)∕N50(prior) and N100(max)∕N100(prior) presented an increase of 317 % and 202 %, respectively, in CCN concentration. The approach of Kerminen et al. (2012) has been used in China (Peng et al., 2014), where the contribution of NPF events to CCN at 0.20 % supersaturation was 6 % at regional sites, while Wu et al. (2015) using 2 h averaging in Melpitz, Germany, found that NPF enhanced CCN number concentration 63 %, 66 %, and 69 % for 0.10 %, 0.40 %, and 0.60 % supersaturation, respectively.
Apart from impacting CCN number concentrations, NPF events can also influence clouds and climate by promoting cloud dimming, and thus regional warming, during periods with high NPF frequency over the comparatively polluted area of the midwestern USA (Sullivan et al., 2018). Furthermore, it is clear that the timing of the initiation of the NPF event and the subsequent growth of particles to CCN and eventually droplets is of utmost importance, as the time delay between the different processes actually limits the time during which the albedo of clouds is affected by NPF. In reality, the total contribution of atmospheric nucleation (including indirect effects) to a net shortwave radiation balance in the atmosphere depends on the rate at which the emission of gas-phase compounds responsible for nucleation (and subsequent growth) vary during an NPF day, on the coagulation of newly formed particles as well as on primary particles acting as a condensation sink.
Although most prior observation studies linked NPF to CCN number enhancement, very few actually link NPF to the process of cloud droplet formation and cloud droplet number concentration (CDNC). The latter distinction is important, given that droplet numbers in clouds exhibit a sublinear response to aerosol increases (Twomey, 1977; Leaitch et al., 1986; Ghan et al., 1993; Boucher and Lohmann, 1995; Gultepe and Isaac, 1996; Nenes et al., 2001; Ramanathan et al., 2001; Ghan et al., 2011; Sullivan et al., 2016), owing to the elevated competition for water vapor and reduction in cloud supersaturation. The understanding of NPF impacts on CCN levels may therefore provide a biased view of its potential impact on droplet number (Nd) and the aerosol indirect effect. Using cloud droplet parameterizations to interpret observed aerosol size distribution data, however, may allow one to address this issue in a simple yet effective manner. Kalkavouras et al. (2017) illustrated this issue by using a “conventional” approach to quantify CCN enhancement, using the critical diameter (dc) at which all particles act as CCN depending on observed composition and a prescribed supersaturation. They reported much higher CCN number enhancement (∼87 %) for two sites in the eastern Mediterranean (Santorini and Finokalia) than in cloud droplet number concentration, Nd, (∼12 %) during two consecutive NPF episodes in summer. The reason for this 8-fold discrepancy lies in the drastically different supersaturation used to quantify CCN enhancement (0.20 %, 0.40 %, 0.60 %, and 0.80 %) than what was computed for cloud droplet number concentrations (0.10 % and 0.13 % for updraft velocities of 0.3 and of 0.6 m s−1, respectively).
The current study follows up on the initial work of Kalkavouras et al. (2017) and quantifies the impact of NPF on CCN levels and cloud droplet number concentrations in the eastern Mediterranean atmosphere over 7 years of field measurements (June 2008 to May 2015) of aerosol number size distributions and chemical composition. From this data, we aim to (i) quantify the seasonality and contribution of atmospheric NPF to the production of newly CCN in the eastern Mediterranean marine atmosphere, (ii) determine the timing properties of newly formed particles from the beginning of NPF events (i.e., starting time (tstart) and duration) throughout their activation into cloud droplets and their relative contribution to the CCN budget, and (iii) investigate the NPF impacts on CDNC (Nd) and on maximum supersaturation (smax) formed in clouds in the vicinity of Finokalia. In the process of addressing these goals, we consider major issues regarding the calculation of cloud supersaturation and event characteristics that affect the NPF impact calculations.
2.1 Experimental site
From June 2008 to May 2015, measurements were performed at the atmospheric observation station of the University of Crete at Finokalia, Crete, Greece (35∘20′ N, 25∘40′ E; 50 m from the shore and 250 m a.s.l.). The monitoring station of Finokalia (http://finokalia.chemistry.uoc.gr/, last access: 1 May 2019) is located at the top of a hill over the coastline, in the northeast part of the island of Crete, facing the Aegean Sea in the wide north sector. Since the site was established in 1993, Finokalia has experienced two characteristic periods during the year; the dry period from April to September and the wet one from October to March. The dry period is dominated by strong winds of N–NW direction (up to 90 % originating from central and eastern Europe and the Balkans) of speeds exceeding 10 m s−1. The wet period is characterized by limited prevalence of the N–NW sector and significant transport from the Sahara (S–SW winds; occurrence up to 20 %). An extensive description of the site and prevailing meteorology can be found in Mihalopoulos et al. (1997).
2.2 Aerosol composition and size distribution
The number size distribution of particles having mobility diameters of 9 to 848 nm (scanned range) were measured with a 5 min time resolution, using a custom-built scanning mobility particle sizer (SMPS; TROPOS-Type, Wiedensohler et al., 2012). The system is closed-loop, with a 5:1 ratio between the aerosol and sheath flow, and it comprises a Kr-85 aerosol neutralizer (TSI 3077), a Hauke medium differential mobility analyzer (DMA), and a TSI-3772 condensation particle counter (CPC). The sampling was made through a PM10 sampling head and the sample humidity was regulated to a relative humidity below 40 % using Nafion® dryers in both the aerosol and sheath flow. Particles were charged via a Kr-85 neutralizer and thereafter introduced into the DMA. By setting different voltages in the DMA, particles of different electrical mobility are selected and their particle number concentration can be measured. The fluctuation of voltage yields an electrical particle mobility distribution, which can be inverted into a particle number size distribution. The recorded number size distributions were corrected for particle losses by diffusion on the various parts of the SMPS following the recommendations by Wiedensohler et al. (2012). Three different types of calibration were performed for the SMPS, namely DMA voltage supply calibration, aerosol and sheath flows calibrations, and size calibrations.
The complete dataset of particle size distributions was checked for the presence of NPF events, identified by a sudden increase in the nucleation-mode particles concentration (i.e., those with diameters below 25 nm) and further growth of these freshly formed particles that led to a continuous increase in larger particle concentrations over a short period of time (usually less than 4 h) (Kulmala et al., 2004). The NPF event progression is characterized by the relative changes in the three particle modes: “nucleation” (diameter less than 25 nm), “Aitken” (diameter between 25 and 100 nm), and “accumulation” (diameter larger than 100 nm). The modal concentration of particles is obtained from the respective SMPS size bins, as follows:
where n(dp) is the aerosol number size distribution, ΔNi is its binned approximation from the SMPS data for particles in each mode (9–25 nm for nucleation, 25–100 nm for Aitken, and 100–848 nm for accumulation), and particle concentration of each mode is the sum of particle concentration in all size bins of the corresponding diameter range. The upper and lower sizes are limits of size detection for the particular SMPS.
From the period between June 2008 and December 2011, the bulk aerosol chemical composition of PM10 was measured in parallel with the size distributions using daily 24 h quartz fiber filters (PALL Tissuquartz, 2500 QAT 47 mm). Samples were analyzed for water-soluble ions after extraction with nanopure water. The solutions acquired were first filtered using syringe filters (PALL IC Acrodisc® (PES), 0.45 µm, 13 mm) to remove any non-soluble species and subsequently analyzed using ion chromatography (IC) for anions (Cl−, Br−, ) and cations (K+, Na−, , Mg2+ Ca2+), using the procedure of Bardouki et al. (2003). Furthermore, the PM10 quartz filters were analyzed for organic and elemental carbon (Carbon Aerosol Analysis Lab Instrument, SUNSET Laboratory Inc.) using the EUSAAR 2 protocol of analysis (Cavalli et al., 2010). For the estimation of the fine particulate matter fraction (PM1) chemical composition, the respective concentrations of sulfates, organics, and ammonium from the bulk PM10 are considered using the approach presented in Bougiatioti et al. (2009). According to this study, bulk chemical composition from daily filter analysis was used to calculate the volume fraction of organics and ammonium sulfate. With the subsequent application of Köhler theory, CCN number concentrations were calculated for closure purposes considering two different scenarios for the solubility of organics. As far as CCN concentrations are concerned, results showed that limitations of using bulk, instead of size-resolved and daily chemical composition are minimal, as CCN closure was achieved with an error of 0.6±6 %. For the conversion of organic carbon to matter needed for the application of Köhler theory and the calculation of the organics volume fraction, a ratio of OM∕OC of 2.1 was used, based on other studies from this site (Sciare et al., 2005; Hildebrandt et al., 2010). Any CCN prediction uncertainty from using bulk, daily chemical composition is further reduced when used to compute droplet number (e.g., Sotiropoulou et al., 2007; Kalkavouras et al., 2017).
From May 2012 to May 2015, the mass and chemical composition of non-refractory submicron aerosol particles (, , , Cl−, and organic matter) was provided with a 30 min time resolution, by a Quadrupole Aerosol Chemical Speciation Monitor (ACSM), equipped with a standard vaporizer (Ng et al., 2011). The instrument sampled through a BGI Inc. SCC 1.197 sharp-cut cyclone operated at 3 L min−1, yielding a cutoff diameter of almost 2 µm. The response factor (RF) for nitrate along with the relative ionization efficiency (RIE) for ammonium was determined by ammonium nitrate calibrations, while the RIE for sulfate was determined according to the fitting approach proposed by Budisulistiorini et al. (2014). Mass concentrations were corrected using a chemical-composition-dependent collection efficiency (Middlebrook et al., 2012).
2.3 Cloud condensation nuclei
Measurements of CCN concentration (cm−3) between 0.38 % and 0.73 % supersaturation were conducted using a Droplet Measurement Technologies (DMT) continuous-flow streamwise thermal gradient CCN counter (CFSTGC; Roberts and Nenes, 2005), from November 2014 to May 2015. The CFSTGC is composed of a cylindrical diffusion chamber in which supersaturation is generated and controlled by the airflow rate, pressure, and a streamwise temperature gradient maintained by a heater and a set of thermoelectric coolers (Roberts and Nenes, 2005; Lance et al., 2006). The airflow rate used was 0.5 L min−1 with a sheath-to-aerosol flow ratio of 10:1 and a top–bottom column temperature difference, ΔT, of between 4 and 15 K. Concentrations were measured at each supersaturation (0.38 %, 0.52 %, 0.66 %, and 0.73 %) for 15 min, yielding a CCN spectrum consisting of four different supersaturations approximately every hour. Calibration of the instrument supersaturation was performed by determining the minimum diameter of monodisperse ammonium sulfate aerosol generated from a DMA, which activates at a given chamber flow rate, ΔT, and chamber pressure following the procedure of Bougiatioti et al. (2009). The CCN instrument was calibrated numerous times throughout the campaign. For the lower supersaturation, the relative variability between calibrations did not exceed 1 %, whereas for the highest supersaturation the variability was under 4 %. As CCN concentrations during the measurement period rarely exceeded 5000 cm−3, no correction for water vapor depletion inside the CFSTGC chamber was deemed necessary (Lathem and Nenes, 2011).
2.4 Calculation of CCN concentrations from size distribution data
As in numerous prior studies, CCN number concentrations can be calculated from the observed number size distributions by integrating the SMPS data from a characteristic diameter dc to the largest size particles measured:
where dc is the SMPS size bin that contains the critical diameter and “848” is the bin with the largest particles measured by the SMPS. Instead of prescribing dc (as done in other studies), we link it to a desired supersaturation level, sc, using κ-Köhler theory:
where Mw is the molar mass of water, σw is the surface tension of water, R is the universal gas constant, T is the temperature, and ρw is the density of water. Even though when using bulk, daily chemical composition, one κ value is used per day, dc changes also depend on temperature and critical supersaturation. In our case, where past experience has shown that the composition displays remarkably consistent behavior (Bougiatioti et al., 2009, 2011), the successful CCN closure shows that the used approach is indeed sufficient in calculating effectively the dc and not using a prescribed value. CCN number concentrations are then taken as being equal to the concentration of particles with a diameter above dc (Kalkavouras et al., 2017). The aerosol hygroscopicity parameter, κ, is calculated assuming that it is a mixture of an organic and inorganic component with volume fraction εorg, εinorg and characteristic hygroscopicity κorg, κinorg, respectively (). Past studies at Finokalia have suggested that prescribing κorg=0.16 and κinorg=0.6 reproduces CCN to within 2 % on average but exhibit some size dependence (Bougiatioti et al., 2009, 2011). Furthermore, Koulouri et al. (2008) and Bougiatioti et al. (2013) have established that sulfate is mostly found in the fine fraction (82.7±12.7 % of PM10 sulfate found in PM1), and the same applies also to ammonium (88±13.3 % of PM10 ammonium found in PM1). Therefore, as far as sulfate and ammonium are concerned, the uncertainty in the κ calculation, arising from the use of PM10 chemical composition to derive the respective PM1 information is minimal. This is not the case for the organic matter, as it appears that 75±11 % of PM10 organic matter is found in PM1. This is translated into a difference in the calculation of κ on the order of 2.5±0.2 %, with the recalculated κ values being higher, as organic contribution decreases. Nevertheless, this 2.5 % difference in κ has an almost insignificant impact on CDNC and CCN, as changes in κ of more than a factor of 2 are generally required to have an important influence on CDNC.
Indicatively, for four NPF days during August and September 2012, the combined processing of the concurrent CCN and ACSM data during NPF events provides the size-resolved κ (Fig. S1 in the Supplement), which can be used to assess the validity of using a common κ for all sizes (supersaturations). For supersaturations below 0.20 %, the size-resolved κ from the CCN data is higher by 23 % compared to the bulk κ from the ACSM data, while for supersaturations between 0.20 % and 0.40 %, the CCN-derived values agree quite well with bulk chemical composition data (slope 0.94) but with considerable scatter. For supersaturations above 0.40 %, κ derived from the chemical composition data exhibits on average an overestimation bias of 38.5 %. Altogether, the κ trends suggest that the composition of particles tends to increasingly deviate (or vary) from the bulk as they get smaller (i.e., with higher supersaturation) – an indication of enrichment by organics, often observed for NPF-derived particles (e.g., Cerully et al., 2011). The large scatter at around 0.40 % supersaturation can be attributed to chemical composition fluctuations, given that concentrations are affected by both the fresh organic-rich and aged sulfate-rich modes, more at least than found in the higher- or lower-supersaturation CCN. Overall however, this level of hygroscopicity error is not expected to induce substantial errors in CCN concentration predictions, as demonstrated in the closure study below; a size-dependent consideration of hygroscopicity is therefore deemed unnecessary.
We subsequently test the aforementioned approach for calculating CCN from chemical composition and size-distribution measurements (Eq. 4) against direct CCN measurements (Sect. 2.3) collected from November 2014 to May 2015. The degree of “CCN closure” is assessed with 5 min averaged data at 0.38 %, 0.52 %, 0.66 %, and 0.73 % supersaturation (Fig. S2). The measured values of CCN at each supersaturation correlate strongly with the predicted values, when considering all the available data. With increasing supersaturation, s, the value of the coefficient of determination (R2) increased and the scattering of data decreased (Table S1 in the Supplement). For the lowest supersaturations (0.38 % and 0.52 %), there is an overestimation (22 %) of predicted CCN concentrations – consistent with the fact that using bulk κ, which is higher than the “real” size-dependent κ, would lead to slight overestimations in CCN. Interestingly enough, although these κ biases increase with decreasing size, the overestimation and scatter in CCN are decreased for the higher supersaturations (0.66 % and 0.73 % – estimated and measured values agree within 10 %) because an increasingly larger fraction of the aerosol activates, so the error in absolute CCN number is diminished. Regardless of supersaturation, CCN prediction errors and scatter do not seem to exceed 40 %; these are considered minor, especially within the context of droplet number calculations, because the former exhibit a strongly sublinear response to CCN changes in the eastern Mediterranean (e.g., Bougiatioti et al., 2016; Kalkavouras et al., 2017), which means that CCN errors translate to much smaller errors in CDNC. Conversely, to contrast our method with using a prescribed dc, from the available CCN data we calculated a mean dc at each supersaturation level and afterwards estimated the CCN number concentrations for this respective “fixed” dc. Using both the calculated CCN from a fixed dc against the CCN concentrations from chemical composition and size-distribution measurements, we evaluated the two different approaches at 0.20 %, 0.38 %, 0.52 %, 0.73 %, and 1.00 % supersaturation. The values of our initial approach with estimated CCN concentrations from κ and size-distribution measurements are generally higher. More specifically, when using a fixed dc, estimated CCN concentrations are almost 30 % lower compared to those using κ and size-distribution measurements for all supersaturation levels above 0.38 %, whereas for 0.20 % supersaturation, the estimated CCN concentrations are approximately 60 % lower for the fixed dc approach, and this would further translate into higher discrepancies in an attempted closure study.
2.5 Cloud droplet formation calculations
From knowledge of the aerosol hygroscopicity, size distribution, and cloud updraft velocity, we can determine the cloud droplet number concentrations (Nd) and maximum supersaturation for clouds forming in the vicinity of Finokalia during all NPF events. Such calculations are useful to directly link aerosol with CDNC in NPF-influenced clouds and determine the “cloud-relevant” supersaturations for which CCN perturbation calculations are relevant. For such calculations we use the droplet parameterization based on the “population splitting” concept of Nenes and Seinfeld (2003), later improved by Fountoukis and Nenes (2005), Barahona et al. (2010), and Morales and Nenes (2014). These formulations provide a rapid and accurate calculation of CDNC that forms in cloud updrafts and largely captures the CDNCs that form in ambient clouds (e.g., Ghan et al., 2011; Morales et al., 2011). When calculating Nd, the size distribution is described using a sectional representation (Nenes and Seinfeld, 2003) derived directly from the SMPS distribution data, similar to what was done in Kalkavouras et al. (2017). Observations of cloud updraft velocity are not available at Finokalia for the time period examined, but published measurements and model simulations suggest that the distribution of updraft velocities in cloudy boundary layers in the region of Finokalia show a dispersion of σw=0.2–0.3 m s−1 during the period of northerly (Etesian) winds (Tombrou et al., 2015; Dandou et al., 2017). The aforementioned distribution of the cloud updraft velocity in the marine boundary layer of Finokalia is consistent with values observed in marine boundary layers (e.g., Albrecht et al., 1998, and references therein; Fountoukis et al., 2007; Ghan et al., 2011), where they display a spectral dispersion around zero value (σw is calculated to range from 0.2 to 0.3 m s−1). Thus, we can use the characteristic cloud updraft velocity approach of Morales and Nenes (2010) when applying the droplet parameterization to obtain the cloud updraft velocity probability density function (PDF)-averaged values of cloud droplet number concentration and smax. Moreover, a sensitivity test also considers a more turbulent boundary layer (σw=0.6 m s−1), following Kalkavouras et al. (2017).
Furthermore, we determine the relative contribution of aerosol chemical composition, εκ, and aerosol number concentration, εNtotal, to variations in droplet number using a propagation of variance (Sullivan et al., 2016; Bougiatioti et al., 2016; 2017):
where is the variance in the droplet number, σNtotal is the standard deviation of the total aerosol number, σκ is the standard deviation of the hygroscopicity parameter, and and represent the average sensitivity of Nd to aerosol number and hygroscopicity, respectively, throughout an NPF episode, as calculated by the droplet parameterization (Bougiatioti et al., 2016, 2017). The relative contribution of κ and Ntotal to the Nd droplet number variation is estimated only during periods with high temporal resolution in chemical composition in order to capture the diurnal variability of κ (ACSM measurements, May 2012 to May 2015).
2.6 Back trajectories and meteorological data
For the entire dataset, three-dimensional back trajectories have been calculated to determine the origin and trajectories of air masses arriving at Finokalia. The HYSPLIT4 (Hybrid Single-Particle Lagrangian Integrated Trajectory; https://ready.arl.noaa.gov/HYSPLIT.php, last access: 1 May 2019) back-trajectory model (Stein et al., 2015) was used. The back trajectories initialized with meteorological conditions from the Global Data Assimilation System (GDAS) (0.5∘ resolution) were calculated at several heights (100, 500, and 1000 m above ground level, a.g.l.), with a duration of 48 h. The back trajectories are important for understanding the provenance of the different air masses and how they are related to the occurrence and evolution of NPF events. Meteorological parameters, such as wind speed and direction, temperature, relative humidity, and solar radiation, were also continuously monitored during the study period by the automatic weather station installed at Finokalia at 2 m a.g.l., and the time resolution for all of the measurements was 5 min (http://finokalia.chemistry.uoc.gr/, last access: 1 May 2019).
3.1 Aerosol chemical composition and hygroscopicity during NPF events
Overall, 162 NPF episodes were recognized (Kalivitis et al., 2019), and the chemical composition of submicron particulate matter during these episodes was primarily composed of sulfate, contributing on average 39±8 % to the total estimated PM1 mass from June 2008 to December 2011 as derived from the respective bulk PM10 24 h quartz fiber filters and 51±12 % from May 2012 to May 2015 as derived from the ACSM high-resolution measurements. Regarding the organic material, its contribution to the total estimated PM1 mass was found to be on the order of 38±10 % using the bulk PM10 24 h quartz fiber filters, and its contribution to the total PM1 mass was calculated to be 44±12 % using the ACSM data, indicating that the relative abundance of sulfate and organics dictates to a high extent the hygroscopic and cloud-activating properties of submicron particles over Finokalia. Figure S3 shows that sulfate contributed to a greater fraction of the aerosol during summer and autumn and to an almost equal extent in winter and springtime when considering the daily 24 h quartz fiber filters and the ACSM data, respectively. By contrast, for both chemical composition techniques, organic material contributed more during winter due to the long-range transport of organic-rich material from the Greek mainland, whilst its contribution was minimal during autumn.
Following Sect. 2.4, κ was calculated using the chemical composition data. The predicted κ derived from the estimated PM1 varied from 0.21 to 0.52, with a mean value of 0.38±0.06, while when the ACSM data were considered, κ varied from 0.20 to 0.45, with a mean value of 0.36±0.06. This insignificant difference regarding κ is due to the lower values of organic and inorganic volume fractions εorg and εinorg derived from the ACSM data. Mean κ values were estimated to be somehow lower in winter and higher during autumn, while in spring and summer the average aerosol hygroscopicity exhibited generally similar values. Indicatively, the diurnal variability of κ derived from the chemical composition analysis and from the CCN data for supersaturations below 0.20 % and for supersaturations ranging from 0.20 % to 0.40 %, 0.40 % to 0.50 %, and 0.60 % to 0.70 % on 29 August 2012 is presented in Fig. S4. It can be seen that κ exhibited lower values throughout the morning hours (06:00 to 09:00 LT), and tended to increase between 12:00 and 21:00 LT, when considering the data derived from the ACSM and the CCN counter for each critical supersaturation. This increase regarding κ can be ascribed to the downward transport of secondary organic aerosol (SOA) during the boundary layer mixing, whilst at some point after noon, κ began to augment, probably linked to the formation of particulate sulfate during this period. In particular, the increase was estimated to be 21 % when the ACSM data were considered and 24 %, 29 %, 69 % and 42 % for supersaturations under 0.20 %, from 0.20 % to 0.40 %, from 0.40 % to 0.50 %, and from 0.60 % to 0.73 %, respectively, when the CCN data were used. As expected, lower supersaturation levels are associated with higher κ values, indicating that smaller particles were much less hygroscopic than larger ones, with an average difference of 0.2 κ units between the lower (under 0.20 %) and the maximum supersaturation (0.60 %–0.70 %). This feature has been attributed to the enrichment of organic material in sub-100 nm particles (Kalivitis et al., 2015). The chemically derived κ from the ACSM measurements generally does not present any remarkable fluctuation (see grey crosses in Fig. S4), and it seems to converge better with the CCN-derived κ values for supersaturations varying from 0.20 % to 0.40 % compared to the other supersaturations. This relatively constant character of the chemically derived κ may be evidence that using prescribed levels of supersaturation or critical diameters to calculate CCN number concentrations can provide a biased influence of NPF events on CCN, since the preassigned s or dc are essentially different from those occurring in real cloud-forming conditions (see below, Sect. 3.3).
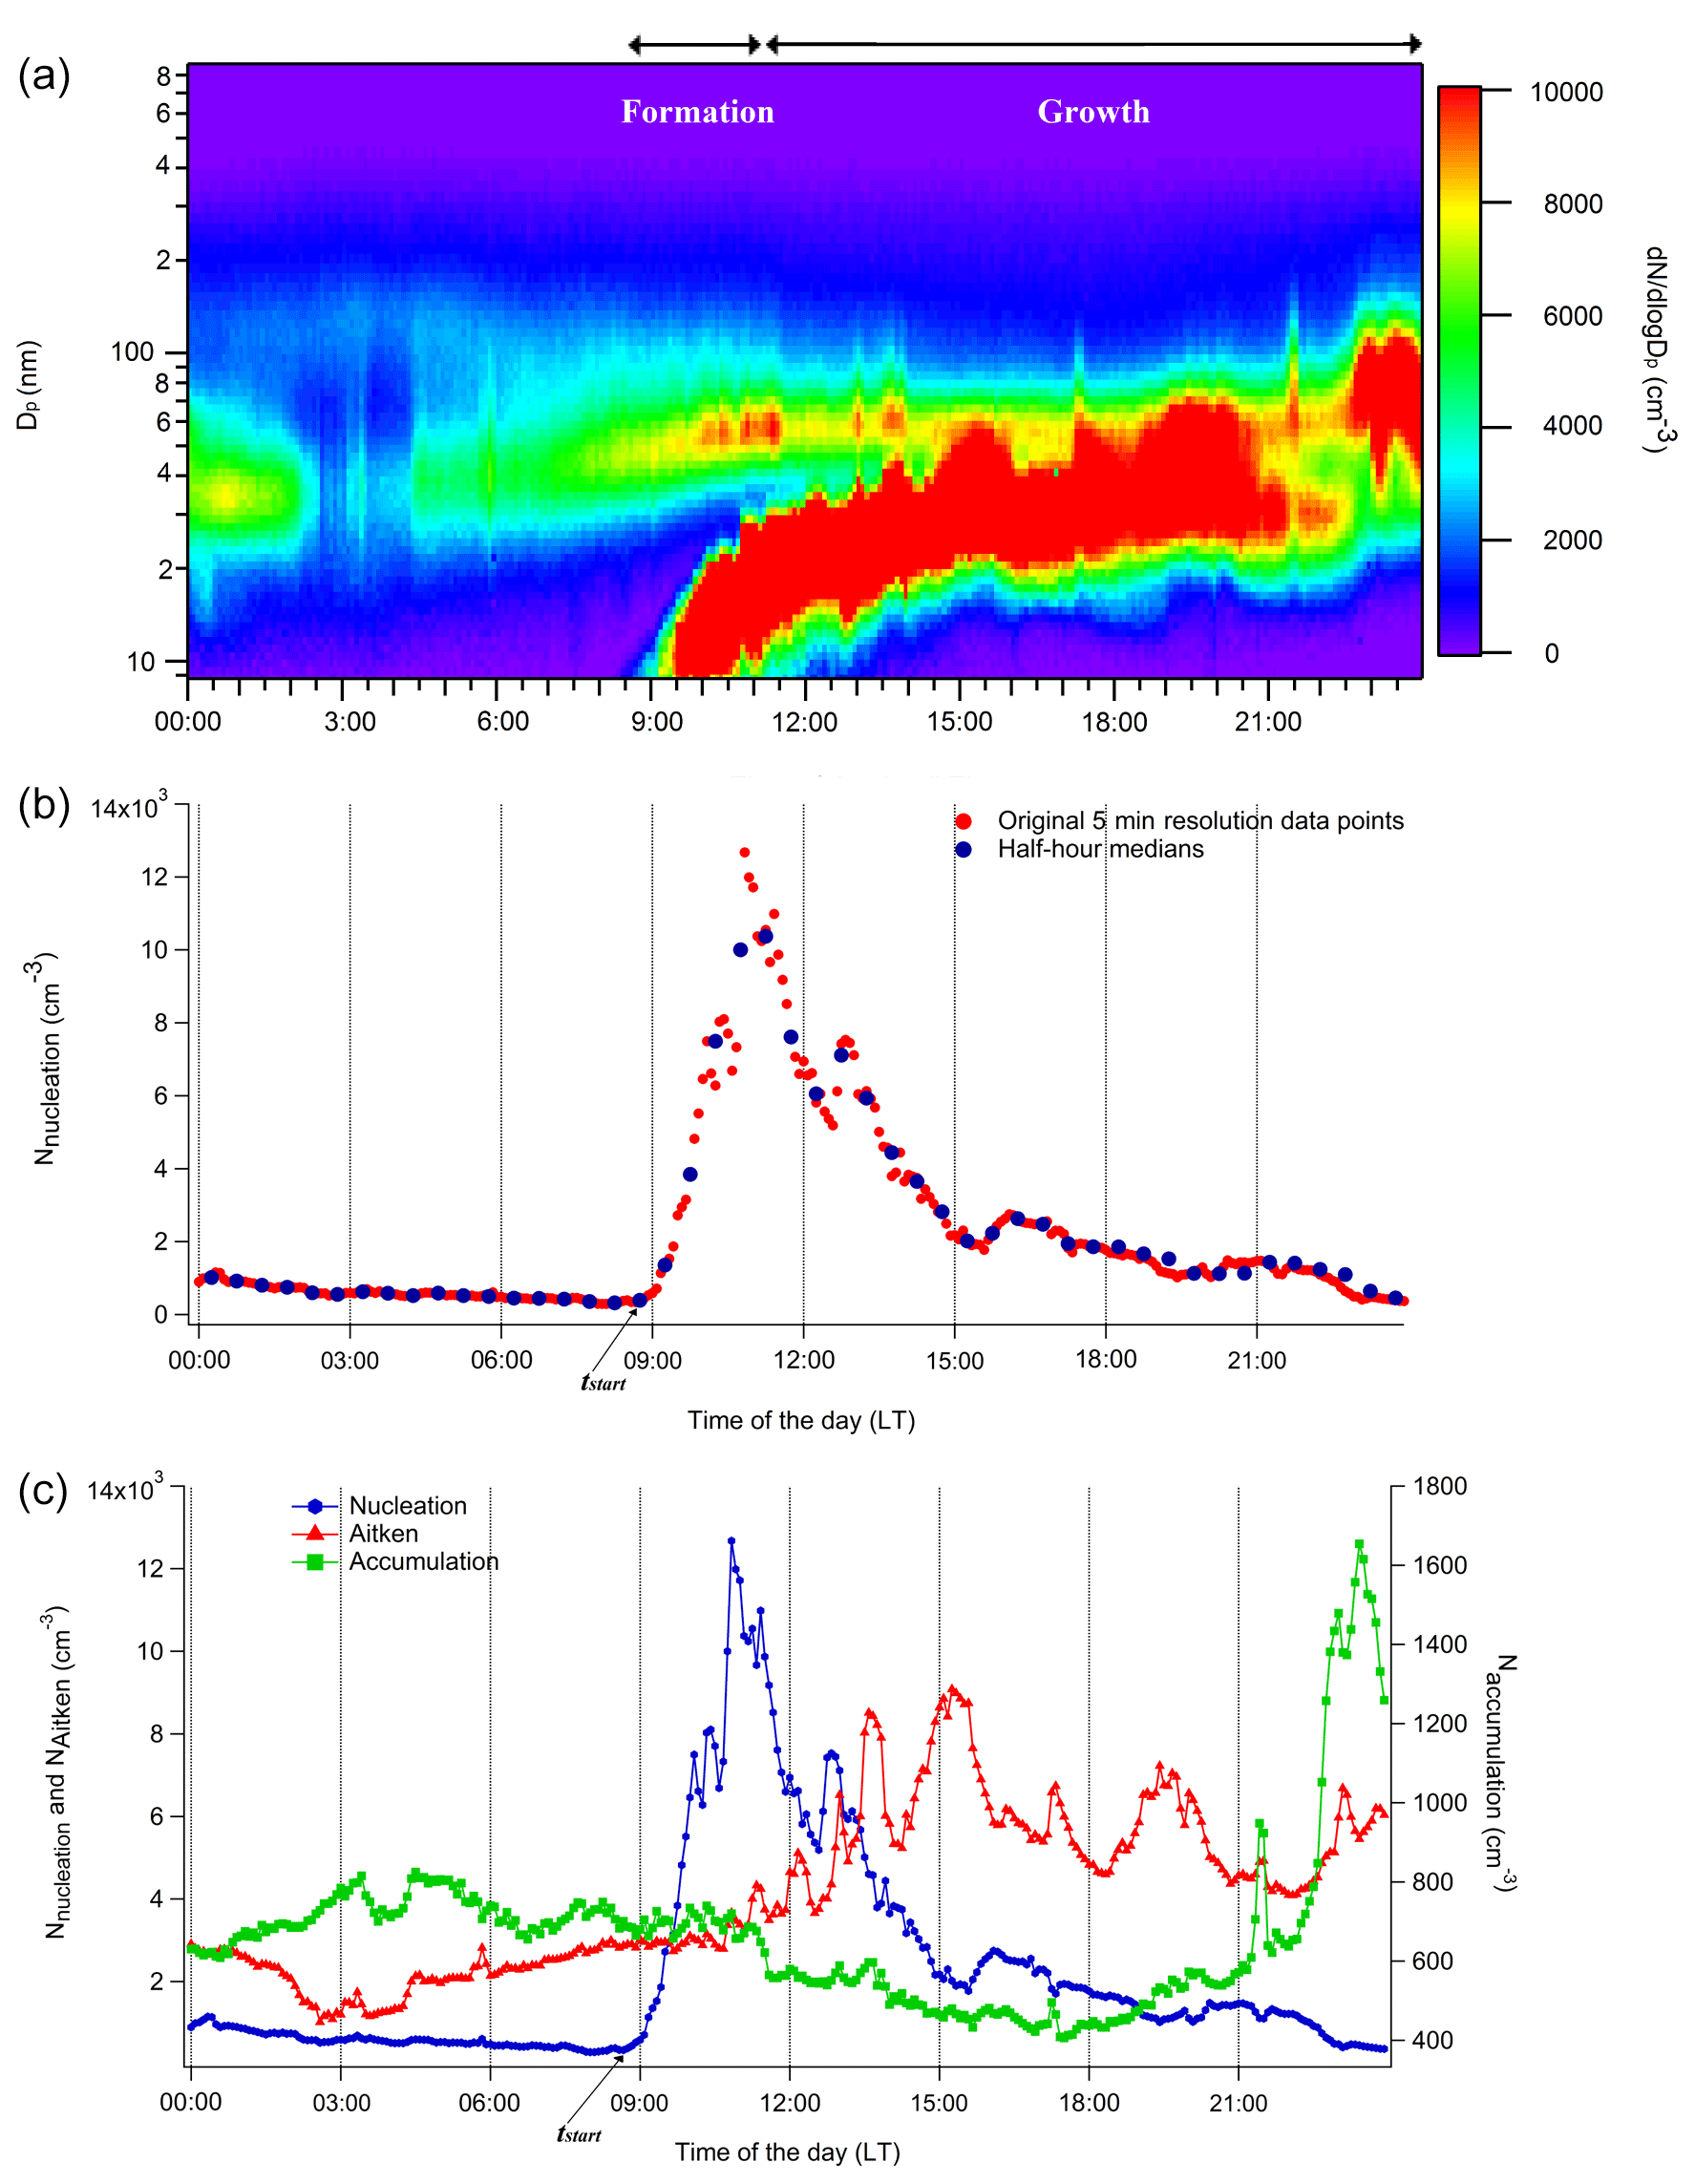
Figure 1A “representative” new particle formation event captured at Finokalia on 29 August 2012. (a) Diurnal evolution of the aerosol size distribution, (b) temporal evolution between 5 min resolution original points (red dots) and calculated half-hour median concentrations of particles in size range of 9–25 nm (blue dots), and (c) diurnal evolution of nucleation (blue line), Aitken (red line), and accumulation mode particle number concentration (green line), respectively.
3.2 Characteristics and interpretation of the Finokalia NPF events
In several studies to date (summarized in the introduction), NPF impacts on CCN number concentrations are based on an analysis of the evolution of the aerosol size distribution over time to quantify (i) how long it takes before freshly formed particles in a given air mass reach CCN-relevant sizes and (ii) the degree to which CCN number concentrations are augmented from the NPF. Here we present in detail the corresponding methodology used to interpret the NPF data from Finokalia by applying to a “representative” type-I NPF event (according to the Dal Maso et al., 2005, classification) observed at Finokalia on 29 August 2012 (Fig. 1), where the subsequent growth of the aerosols generates a characteristic “banana shape” in the time series of diurnal particle number concentration (Fig. 1a). The episode was characterized by a burst in particle number concentration in the 9 to 25 nm diameter range (nucleation mode) and enables a robust determination of the starting time (tstart) of the NPF event. Since we had no means to determine the intermediate negative-ion concentrations, we modified the concept of Leino et al. (2016) using the intermediate nucleation-mode particles, which correspond to particles with diameters from 9 to 25 nm, in order to determine the initiation of an NPF event. We calculated half-hour median concentrations of the nucleation-mode particles from the measurement data, since the half-hour median concentration was deemed sufficient to determine tstart. When plotting the time series of the intermediate nucleation-mode particles, the NPF is distinctly visible as the particle concentrations rapidly increase from 400 to just under 13 000 cm−3 over a 2.5 h period starting at 08:30 LT (Fig. 1b). The beginning of the NPF is further confirmed by the evolution of the particle size distribution (banana shape pattern; see Fig. 1a) when the new 9 nm particles appear and shift gradually towards to larger sizes. The nucleation-mode particles peak at 11:00 LT (see Fig. 1c), without any visible change in the Aitken-mode concentrations until after 11:30 LT. This increase, in conjunction with the decrease in the nucleation-mode particles in number, strongly suggests the transfer of nucleation-mode to Aitken-mode particles owing to condensation and coagulation. The NPF event is said to terminate when the nucleation-mode particles start to decrease. The appearance and formation of the nucleation-mode particles are linked to the onset of solar radiation (Fig. 2). Afterwards, particles continued to grow faster in size for several hours, consistently with findings in other studies (e.g., Paasonen et al., 2018), exceeding 100 nm in diameter at 21:30 LT. Following the methodology of mode fitting (Hussein et al., 2004; Kulmala et al., 2012), the nucleation-mode particles exhibited a growth rate of 3.7 nm h−1, while the formation rate value of particles in the nucleation mode was 2.0 cm−3 s−1 (Kulmala et al., 2012), which is well in the range of the representative values reported by Kalivitis et al. (2019) at the Finokalia site.

Figure 2Diurnal evolution of the temperature (magenta line), relative humidity (light blue line), and solar radiation (orange line), respectively, during the “representative” new particle formation event observed at Finokalia on 29 August 2012.
To quantify the impact of NPF on CCN number concentrations, the following approach is used. From the time series of the aerosol size distribution and chemical composition that spans each NPF event, the time series of CCN concentration for a number of supersaturations s, CCNs, is calculated following Sect. 2.4. It should be noted that, from June 2008 to December 2011 when daily bulk PM10 quartz fiber filters were used, there was only one κ available for each NPF day. We then determine the starting time, tstart, and its corresponding CCN concentration, CCN. The enhancement of CCN from the NPF at supersaturation s, Rs, is then calculated by normalizing the CCN time series with CCN for each NPF event; . By definition, the Rs is equal to unity at tstart and theoretically should remain so until the “wave” of new particles reaches a large enough size to influence CCNs.
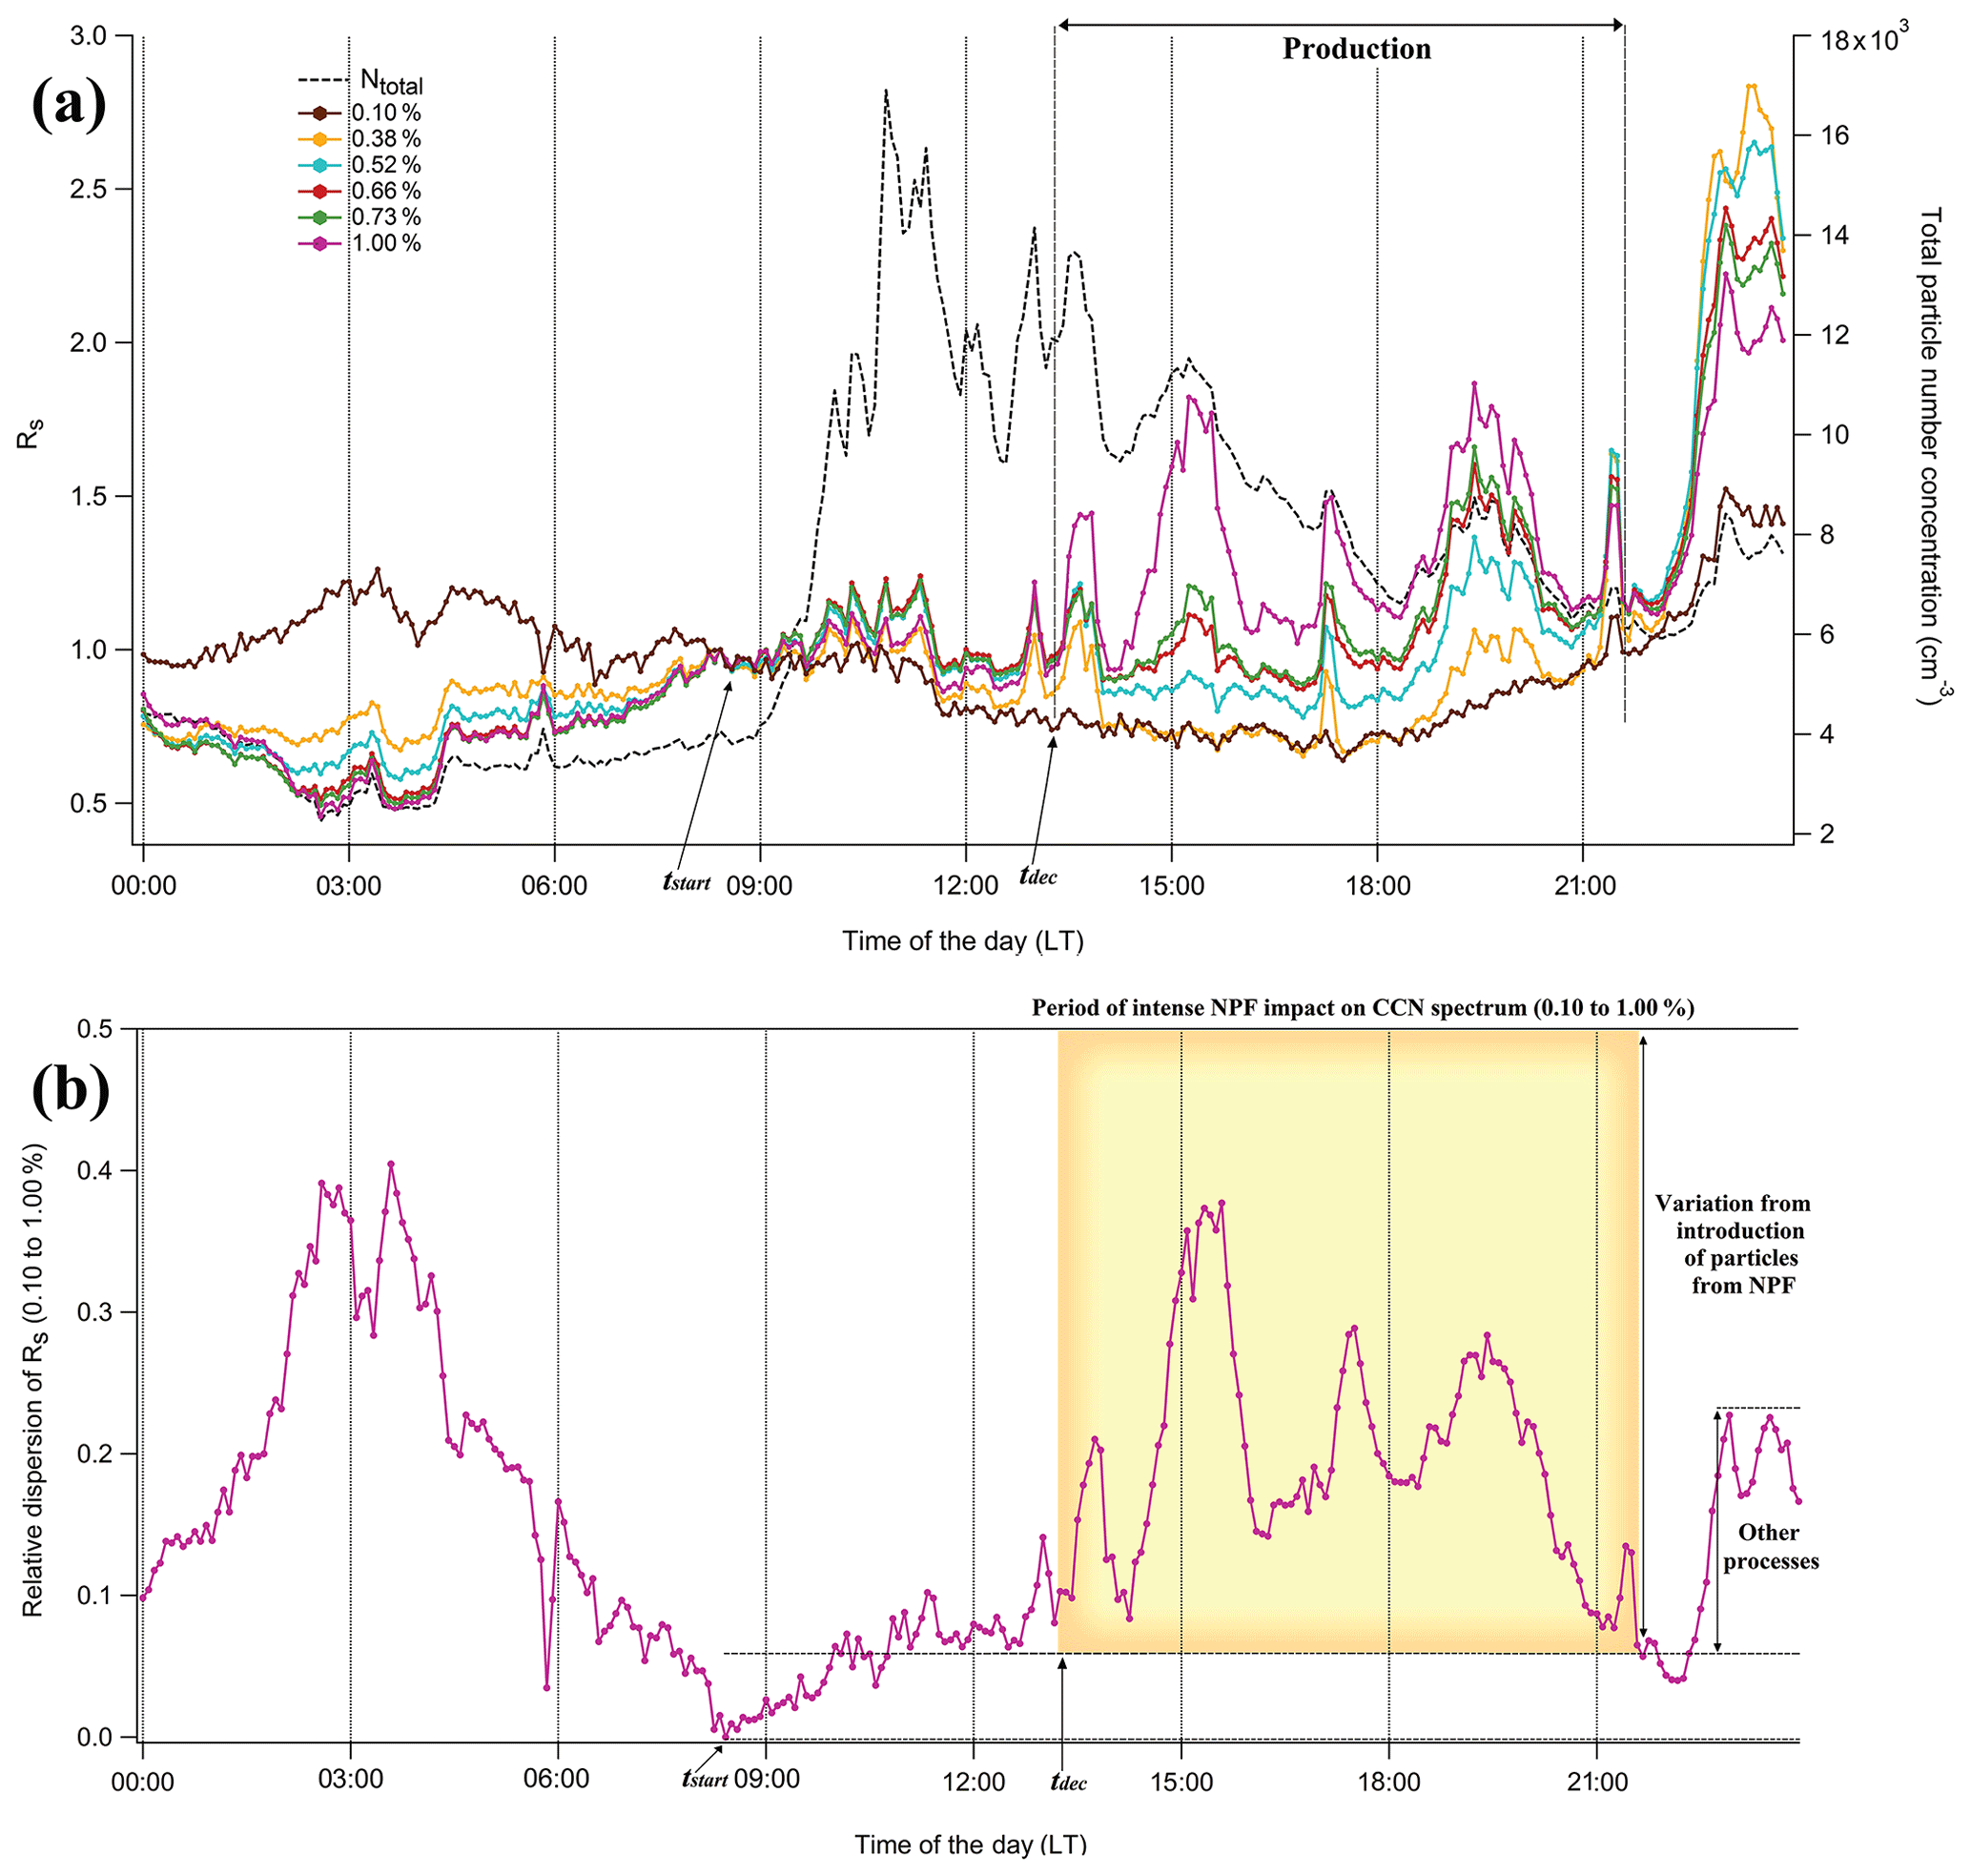
Figure 3(a) Diurnal evolution of the Rs for supersaturation 0.10 (brown line), 0.38 (orange line), 0.52 (light blue line), 0.66 (red line), 0.73 (green line), and 1.00 % (magenta line) (left axis) and total particle number concentrations, Ntotal (black line – right axis) during the “representative” new particle formation event captured at Finokalia on 29 August 2012. (b) Diurnal evolution of the relative dispersion (RD) of the Rs for all supersaturations (s) (0.10 % to 1.00 %) during the “representative” new particle formation event captured at Finokalia on 29 August 2012. tstart (08:30 LT) is the starting time of the NPF event, while tdec is the “decoupling time” (13:30 LT), when the NPF episode starts to influence the CCN concentrations according to the approach described in the main text. The period of intense NPF events on the CCN spectrum for all s is shaded yellow.
Figure 3a presents the evolution of the Rs for each supersaturation against aerosol number concentrations before, during, and after the event. From 08:30 LT (tstart) and for 5 h afterwards (13:30 LT), the Rs displays a similar pattern, especially for supersaturations above 0.38 %, with values ranging from 0.75 to 1.32 (average 1.00±0.06). This pattern reveals that during the morning hours and until 13:30 LT, the estimated CCN number concentrations exhibit almost equal values for each supersaturation, since the denominator is constantly the same. At 13:30 LT, the Rs acquires different values in a given supersaturation as depicted in Fig. 3a. This time is crucial in order to estimate the initiation of the influence on the potential CCN due to NPF, and it is termed the “decoupling time”, tdec. We determine tdec, and therefore the period (i.e., start and end) of intense NPF impact on the CCN spectrum, based on the temporal evolution of the relative dispersion (RD) of the Rs for all supersaturations (Fig. 3b). RD was calculated by dividing the standard deviation of the instantaneous values of the Rs (at 0.10 %, 0.38 %, 0.52 %, 0.66 %, 0.73 %, and 1.00 % supersaturation) with their average value at each time step (5 min temporal resolution). RD is useful, as it is highly sensitive to the introduction and evolution of particles from NPF as they transit the distribution over the resolved supersaturation range. It is said that NPF influences the CCN as long as the RD exceeds the envelope of (low) values seen during the initial stages of the NPF event. Indeed, from 08:30 to 13:30 LT, the RD is low (generally less than 0.1), and rapidly increases at 13:30 LT and onwards – indicative of the large spread in Rs from the influence of NPF on the production of particles which activate at larger supersaturations; therefore 13:30 LT corresponds to tdec. The impact of NPF on the CCN spectrum is terminated when the RD drops to values seen prior to tdec (21:30 LT; see Fig. 3b), presumably when the NPF evenly affects CCN number concentrations at all s levels. However, it should be clarified that this “end time” (e.g., 21:30 LT) is identified on the day of the NPF episode, since we had no real means to record the continued growth processes due to NPF from a previous day and beyond the point of the influence of NPF on droplet formation (tNd; see in Sect. 3.3). The elevated RD seen after 23:00 LT may be a result of residual NPF particles mixing in the air masses sampled at Finokalia or a result of other small-scale variations (from local sources) in the CCN spectrum.
Subsequently, we calculate the evolution of the Rs before and after tdec for each supersaturation on 29 August 2012 (Fig. 3a). Specifically, “before” is the time period between tstart and tdec, whereas “after” is the period from tdec until the end of CCN production (21:30 LT). This variation in the Rs indicates, for each supersaturation value, the increase in the CCN number concentration due to particles originating from the NPF. The Rs was estimated to be 0.89±0.09, 0.94±0.08, 1.02±0.09, 1.04±0.09, 1.03±0.09, and 0.99±0.08 prior to the beginning of the CCN production (i.e., between 08:30 and 13:30 LT) and 0.90±0.23, 1.09±0.60, 1.21±0.52, 1.25±0.43, 1.26±0.40, and 1.39±0.32 for 0.10 %, 0.38 %, 0.52 %, 0.66 %, 0.73 %, and 1.00 % supersaturation, respectively, after 13:30 LT and until the end of production. The time intervals and tdec are driven by the processes that affect the aerosol number distributions (i.e., coagulation and condensation) and hence affect the CCN population. Assuming a constant growth rate (e.g., 3.7 nm h−1), we estimate the duration time after tstart, during which the freshly formed particles need to grow in size reaching the respective dc (35, 43, 46, 54, 67, and 162 nm for s 1.00 %, 0.73 %, 0.66 %, 0.52 %, 0.38 %, and 0.10 %, respectively) and act as CCN. Considering an initial diameter of 9 nm for the newly formed particles at tstart, tdec appears 7 to 41 h after tstart for supersaturations between 1.00 % and 0.10 % and from 2.7 to 37 h when an initial diameter of 25 nm is considered for the same supersaturation range. This feature shows that when only constant growth rate (GR) is considered, the freshly nucleated atmospheric particles attain the largest sizes (dc=162 nm when s=0.10 %) during the night (21:30 LT) of the following day (30 August) and early in the morning (01:30 LT) on the 31 August, when 25 and 9 nm were considered as initial diameters at tstart, respectively. Therefore, it is apparent that it takes a longer time compared to the RD methodology to observe the influence of NPF on the concentration of particles which are able to act as CCN at lower supersaturations (e.g., 0.10 %), when the GR is the sole factor determining the time delay from tstart to tdec. Observed tdec is generally earlier compared to the aforementioned values, and this temporal inconsistency may occur owing to the previous consideration of a constant growth rate, since the growth rate has the ability to change and specifically to increase with an increasing particle diameter (Paasonen et al., 2018). Concurrently there are also several microphysical processes (i.e., the synoptic wind flow, the boundary layer dynamics, the presence of preexisting particles) which influence the time lag between tstart and tdec.
The Rs exhibits almost similar mean values after tdec until 21:30 LT for 0.52 %, 0.66 %, and 0.73 % supersaturation. Thus, the number of the newly formed particles which reach the CCN size (dc varying from 43 to 54 nm) is independent of s, indicative of the assumption of a similar chemical composition for all sizes, or it could be merely that particle number in the size range between 43 and 54 nm particles increased more or less to the same extent after tdec. Using the abovementioned values of the Rs, we determined the subsequent percentage increase in the CCN number concentrations related to particles originating from NPF. The enhancement of the CCN number concentrations was calculated to be 1 %, 16 %, 19 %, 20 %, 22 %, and 40 % for s of 0.10 %, 0.38 %, 0.52 %, 0.66 %, 0.73 %, and 1.00 %, respectively. For a supersaturation of 0.10 % the increase was merely 1 %, while for the supersaturations 0.38, 0.52, 0.66, and 0.73, the augmentation was generally the same, which is consistent with the similar Rs observed in the same size range, as mentioned above. Regarding the s of 1.00 %, the aerosol sizes are even smaller (∼35 nm) and the contribution of NPF on CCN increases considerably. When looking at the diurnal evolution of the aerosol size distribution (Fig. 1a), particles in the size range of around 35 nm also preexisted the NPF event (tstart) and could contribute to CCN number concentrations. These contributions are suggestive of the convolution of NPF with condensational growth of both fresh and preexisting (background) particles, introducing an upper limit of bias of approximately 50 %, which could originate from the preexistence of large enough particles (not originating from NPF) that can grow to CCN-relevant sizes. The amount of the background particles, which are large enough and also have sufficient time to grow to CCN, was calculated by subtracting the mean value of the concentration of particles in the nucleation mode from tstart until 11:30 LT (the formation of the nucleation-mode particles ceased – Fig. 1a) and the respective mean value 2 h prior to tstart. The latter shows that the impact of NPF on CCN number concentrations, and subsequently on cloud properties, also depends on the background conditions (clean vs. polluted air). Under clean-air conditions (limited preexisting particles preceding the NPF), which constitute 40 % of the NPF days, it has been found that CCN concentrations are enhanced by 45 % to 80 % in the 0.10 % to 1.00 % supersaturation range, compared to more polluted conditions.
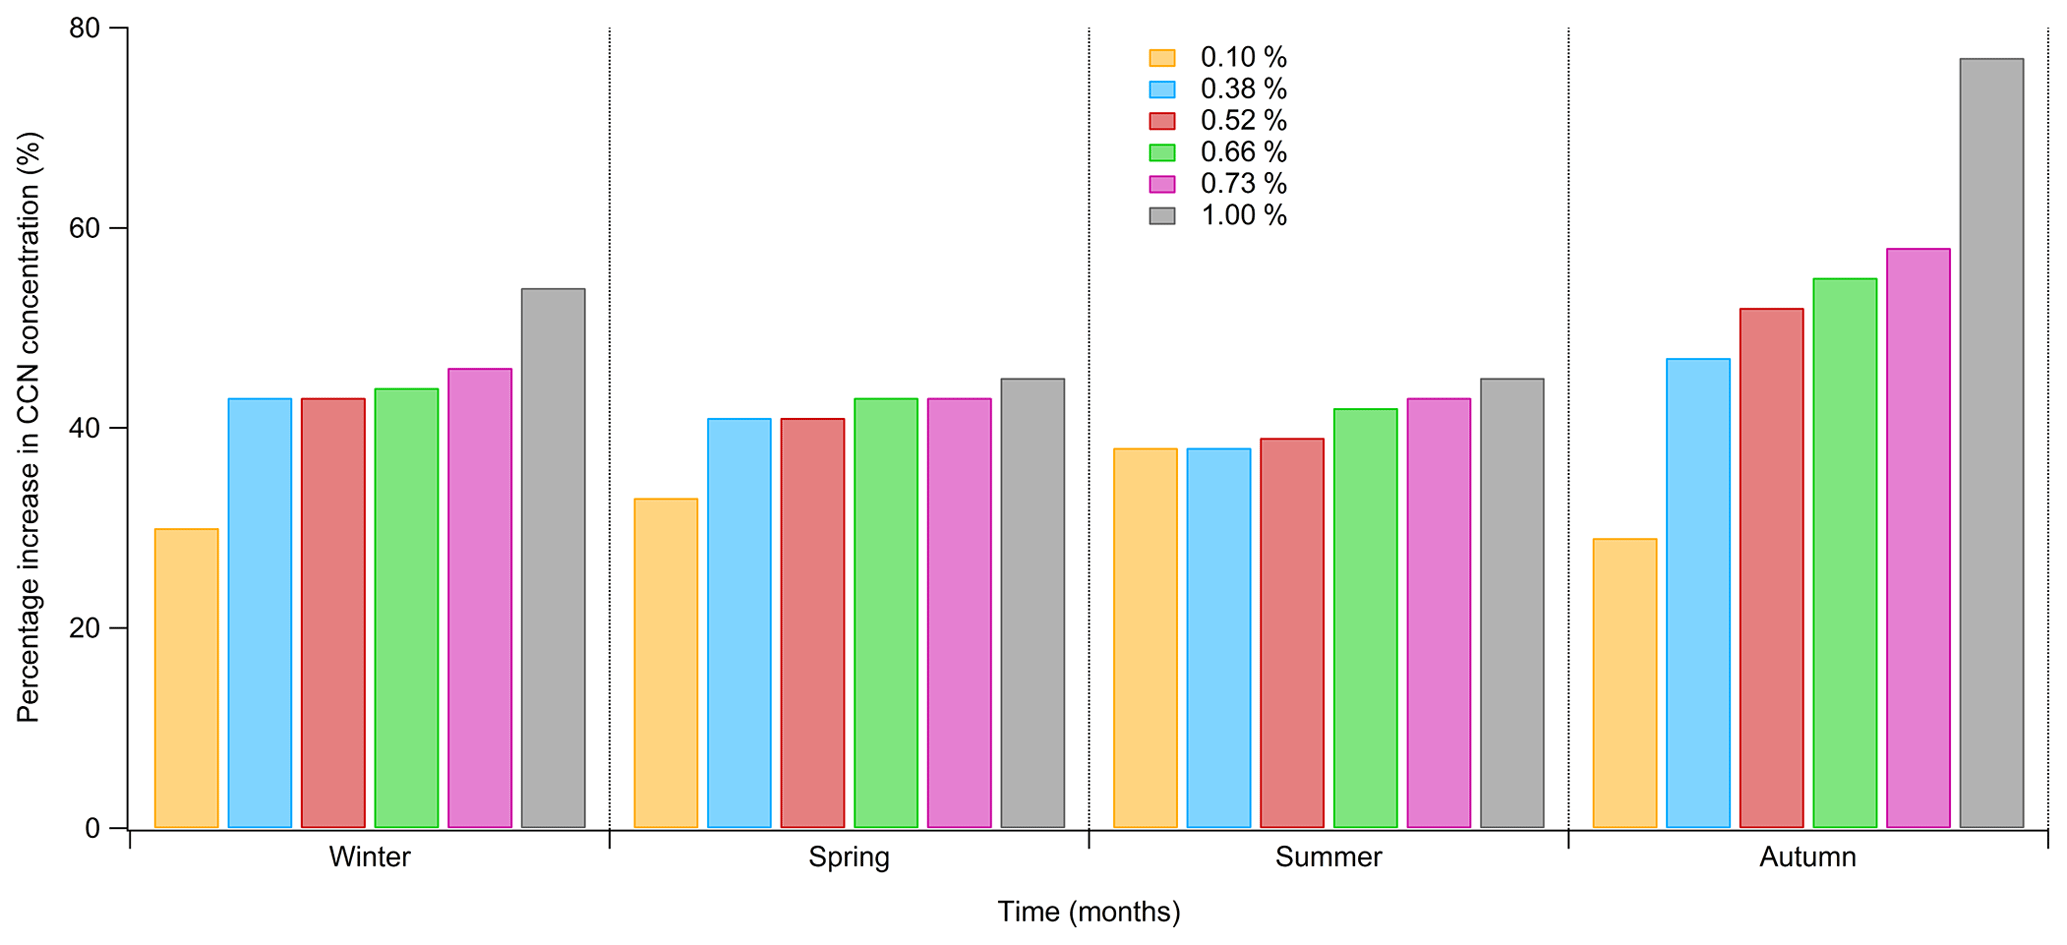
Figure 4Seasonal variation in percentage increase regarding the estimated CCN concentrations for supersaturation 0.10 % (orange bars), 0.38 % (light blue bars), 0.52 % (red bars), 0.66 % (green bars), 0.73 % (magenta bars), and 1.00 % (grey bars) relative to the available 162 NPF days at Finokalia throughout the period June 2008–May 2015.
The procedure outline in Sect. 3.2 is repeated for the all 161 remaining NPF episodes to determine the increase in the CCN number concentrations owing to particles originating from the NPF episodes. The comprehensive results are presented in Table S2, and an extensive seasonal analysis is found in the Supplement 3.2 (SM 3.2). Altogether, when considering all 162 NPF episodes we found that the average contribution of NPF to the CCN budget over the eastern Mediterranean varied from 29 % to 77 % in the 0.10 % to 1.00 % supersaturation range and displayed a seasonal variation (Fig. 4). In winter, tstart was observed during daytime (median 11:00 LT), followed by tdec 2.5 h later. The increase in CCN number concentrations due to the atmospheric NPF and growth was estimated to be 30 %, 43 %, 43 %, 44 %, 46 %, and 54 % for 0.10 %, 0.38 %, 0.52 %, 0.66 %, 0.73 %, and 1.00 % supersaturation, respectively (Fig. 4). For spring and summer, tstart exhibited a median value at 10:00 and 09:00 LT, respectively, whilst tdec was on average 2.5 h after tstart. The CCN production associated with the nuclei growth to larger sizes increased by almost 41 % for both seasons (Fig. 4) and for the aforementioned supersaturations. Finally, throughout autumn, tstart was detected in the morning (median 09:30 LT), followed by tdec on average 3.5 h after tstart, whereas the NPF episodes elevated the CCN numbers by 29 %, 47 %, 52 %, 55 %, 58 %, and 77 % (Fig. 4) for each supersaturation. Hence, according to the above conceptual model, NPF taking place in the eastern Mediterranean may considerably influence CCN numbers (compared to levels prior to tdec) for prescribed levels of supersaturation. According to Kalivitis et al. (2019), higher growth rates are calculated for summer and autumn, compared to winter and spring. Consequently, it would be expected that the time delay between tstart and tdec would be lower during summer and autumn if only the influence of growth rate is considered. Nevertheless, the GR is not entirely responsible for the growth of the freshly nucleated atmospheric particles into CCN-relevant sizes and cloud droplets, and further microphysical processes favor the NPF and consequently determine tdec, as we have seen above. The air masses reaching Finokalia during summer contain significant concentrations of preexisting particles (before tstart on average higher by 58 % compared to winter and spring, with a larger load in the Aitken mode) providing a sink for newly formed particles via condensation and coagulation (Dameto de España et al., 2017), a feature which has an impact on the growth of the freshly formed particles to larger sizes and therefore also determines tdec as already seen in the RD analysis.
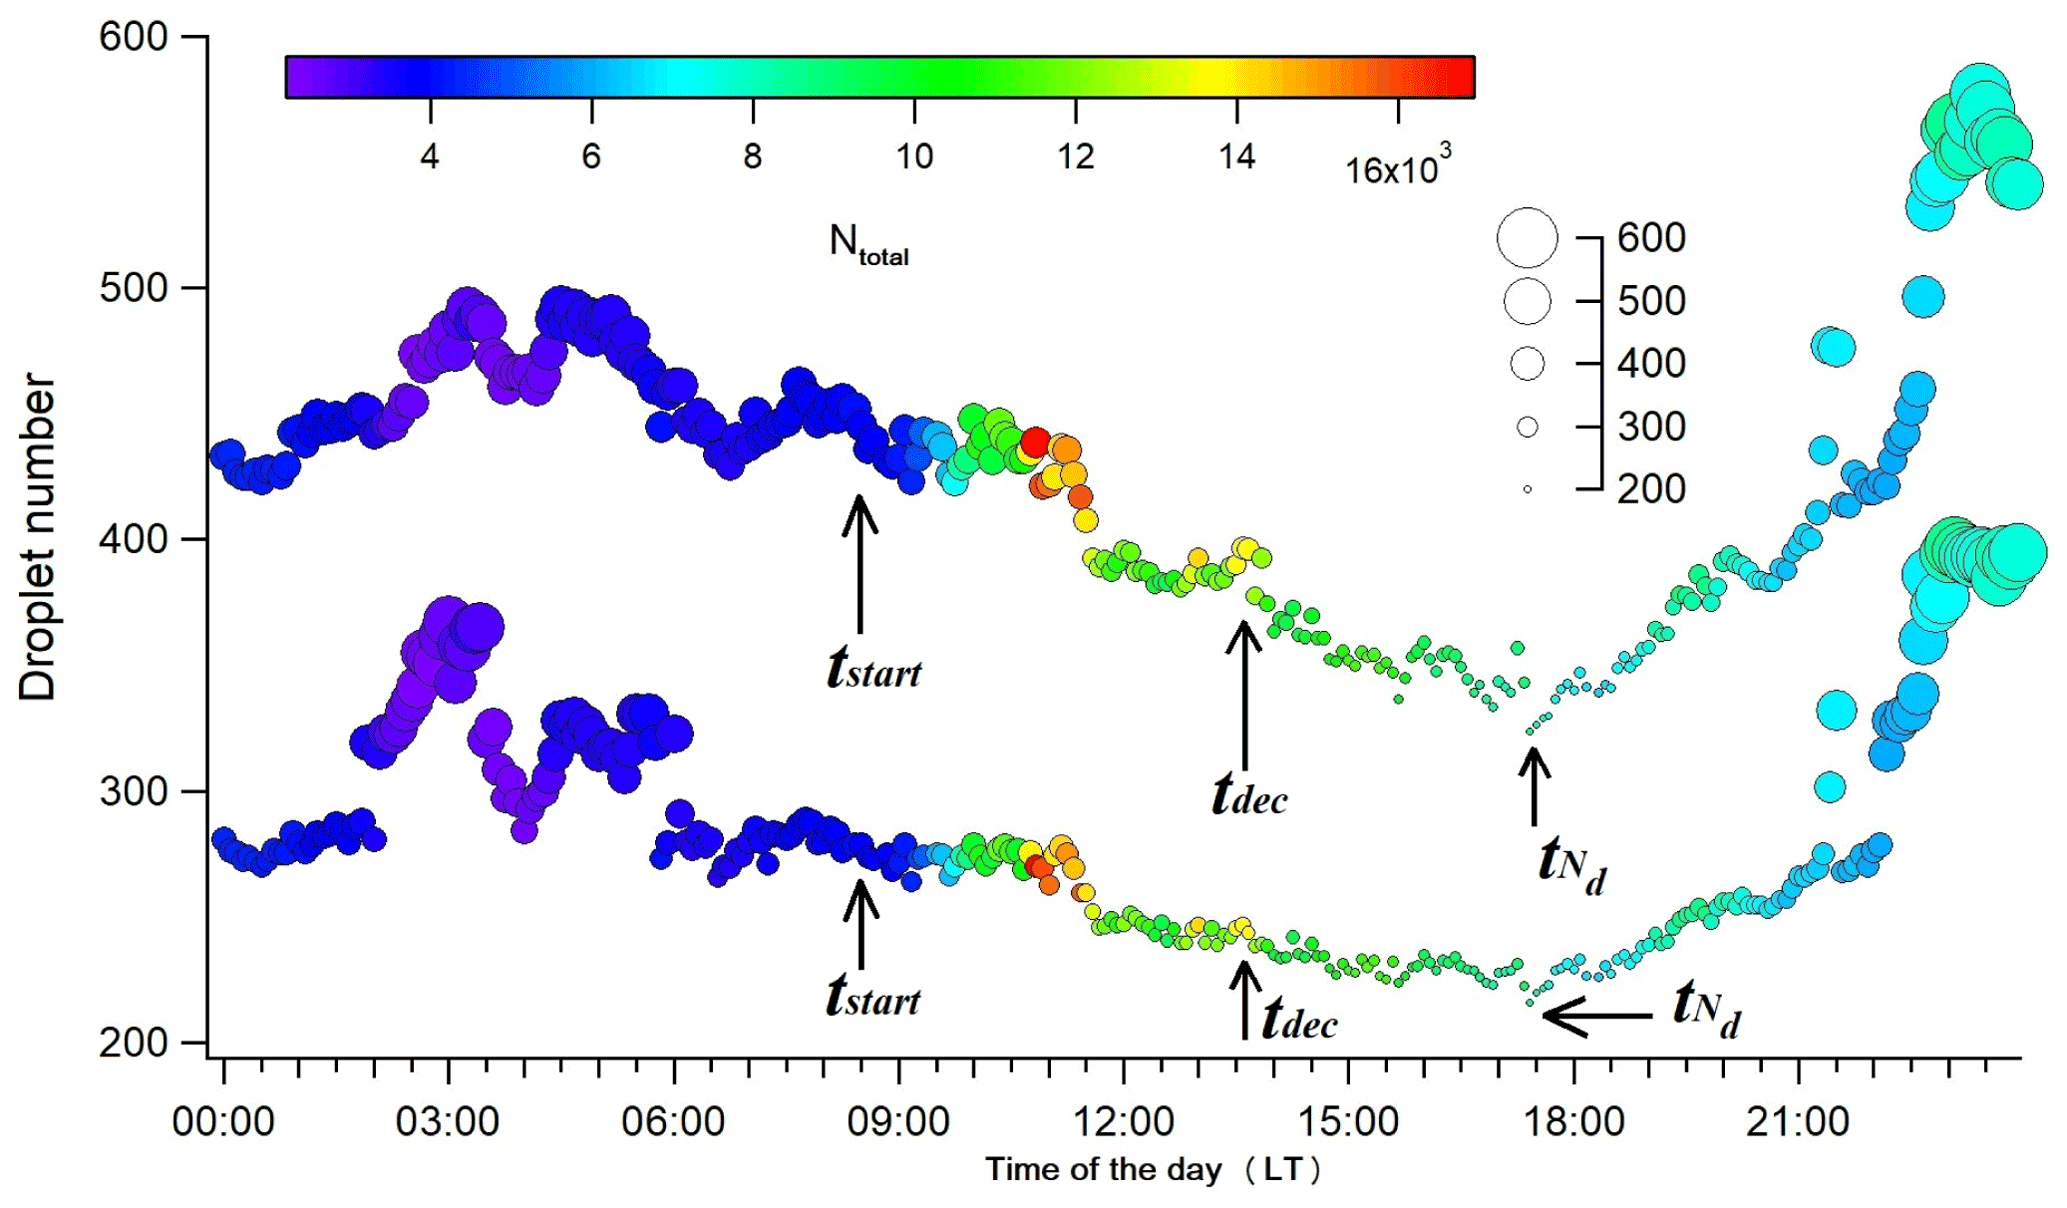
Figure 5Diurnal evolution of the total aerosol particle number concentrations in cm−3 (Ntotal – color bar) and calculated cloud droplet number concentrations (Nd) (left axis) for updraft velocities of σw=0.3 (bottom) and σw=0.6 m s−1 (top) during the “representative” new particle formation event captured at Finokalia on 29 August 2012. The size of the circles corresponds to the number concentration of Nd, while tdec is the “decoupling time” (13:30 LT) and tNd is the time when the number of droplets starts to “feel” the NPF (17:25 LT), according to the approach described in the main text.
3.3 Impact of NPF on droplet number and cloud formation
Following the proposed methodology (Sect. 2.5), we estimated the number of droplets (Nd) and the maximum supersaturation (smax) that would form in a cloud, based on the aerosol number size distribution (Ntotal), chemical composition (κ), and cloud updraft velocity (σw) throughout each NPF event. Results of Nd are shown in Fig. 5 for cloud updraft velocities of 0.3 m s−1 (bottom) and of 0.6 m s−1 (top), while Fig. 6 depicts the corresponding smax during the representative NPF event recorded at Finokalia on 29 August 2012. As expected, the higher cloud updraft velocity generates larger values of both smax and Nd. On the time period between 08:30 and 17:25 LT, which includes the formation (08:30–11:00 LT) and growth hours (after 11:00 LT) of the episode, as well as the beginning of the CCN influence due to NPF (13:30 LT), the arrival of the air mass is followed by a depression in Nd (relative mean decrease 7.9±2.9 % for σw=0.3 m s−1 and 13.5±3.9 % for σw=0.6 m s−1). Concurrently, there is a slight increase in the maximum supersaturation (relative mean increases 4.7±2.1 % for σw=0.3 m s−1 and 6.9±2.3 % for σw=0.6 m s−1). Both trends are related to decreases in the accumulation-mode aerosol number (from 08:30 to 17:25 LT; see Fig. 1c, right-hand y axis), owing to processes other than NPF (e.g., the development of the boundary layer, dry deposition) – as the latter has not had the chance to influence particles that act as CCN in clouds. For both values of cloud updraft velocity, smax was calculated to be under 0.17 %, highlighting the low levels of smax developed. Hence, according to these low values of supersaturation formed in the clouds, and in conjunction with the mean dc at 162 nm for 0.10 % supersaturation, it is clear that most of the activated droplets belong to the accumulation-mode particles. Nd exhibits the minimum value at 17:25 LT (Fig. 5), coinciding with when smax begins decreasing (CCN start to grow further to form droplets, and they compete for water vapor, thus decreasing smax), depicting the moment when droplet formation begins to “feel” the particles generated from NPF. Furthermore, this time stamp also coincides with the time when the number concentration of particles in the accumulation mode exhibits the lowest value as well (see Fig. 1c). Hereafter, this time will be expressed as tNd (Fig. 5). There is a time lag between tdec and tNd, since particles formed in an NPF event need sufficient time to grow into CCN-relevant sizes and subsequently into a cloud droplet. After tNd, smax is negatively correlated with Nd for both cloud updraft velocities due to the increasing competition for water vapor from the growing number of CCN. For both cloud updraft velocities, the increase in Nd until midnight was similar and on the order of 20.0±6.5 %, leading to a simultaneous decrease in smax by 6.0±2.7 % (Table S3). Interestingly, water vapor competition effects can be assessed by comparing the number concentration of Nd with the estimated CCN number for a supersaturation equal to the value of smax at the time of tNd (where competition effects from the NPF-generated particles are vanishingly small) for the time period between tNd and midnight. Using this approach, and by comparing the derived estimated CCN with the respective Nd (assuming that without competition effects all CCN would activate in droplets), we find that competition effects suppress Nd by 20 % for σw=0.3 m s−1 and 12.3 % for σw=0.6 m s−1. It is worth noting that, if smax did not vary over the period of Nd influence, the increase in Nd from tNd until midnight was similar for both σw and was merely 5.5±2.5 %, since the competition for water vapor is restricted considerably. This clearly shows that the prescription of a constant supersaturation in the CCN analysis may lead to biased results regarding the impact of NPF on regional clouds. Since Nd does not increase significantly until midnight, it is clear that most of the impact of the NPF is on nocturnal clouds, which carries important implications for the formation of drizzle and the structure of the boundary layer the following day.
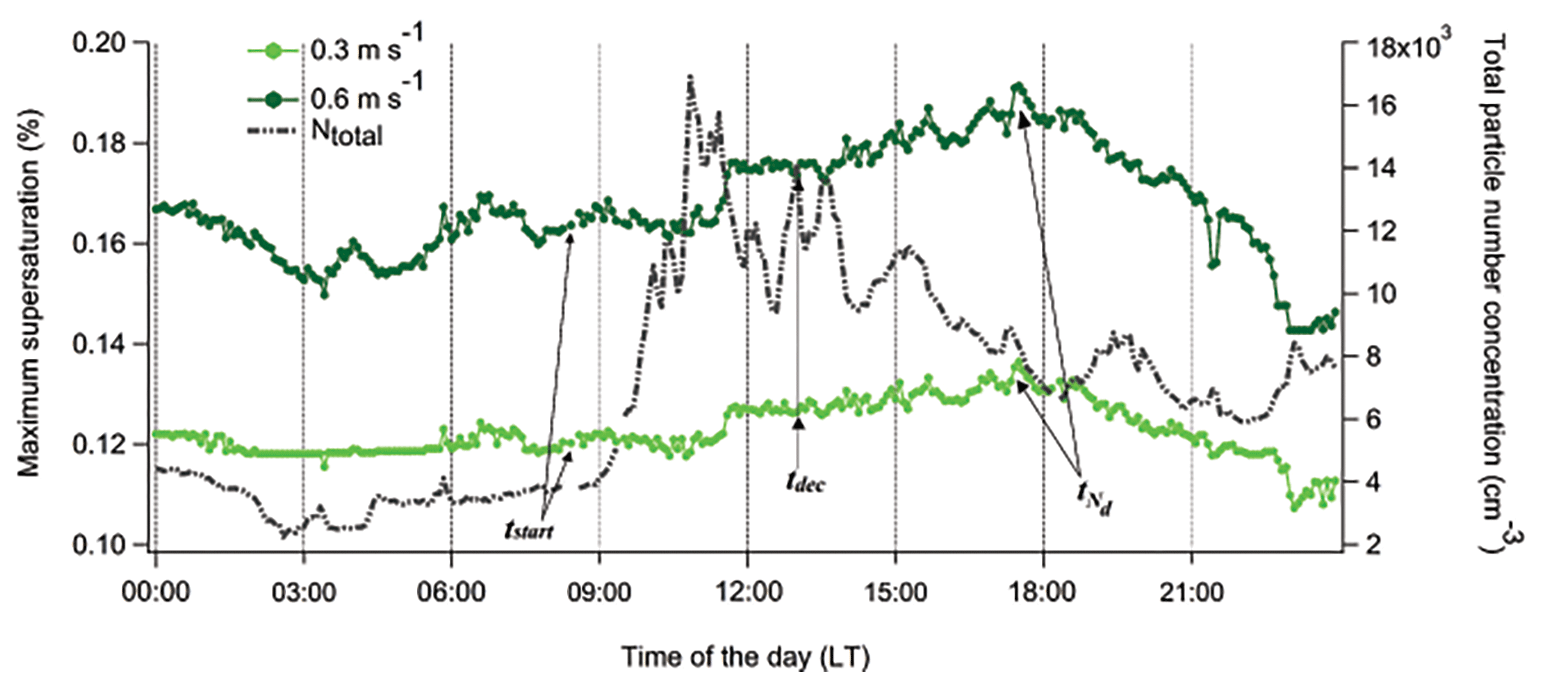
Figure 6Diurnal evolution of the calculated maximum supersaturation (smax) (lest axis) and total aerosol particle number concentrations (Ntotal) (right axis) for updraft velocities of σw=0.3 m s−1 and σw=0.6 m s−1 during the “representative” new particle formation event captured at Finokalia on 29 August 2012.
The degree to which Ntotal and κ variations influence Nd variability can be expressed by calculating the relative contribution of the total aerosol number and the hygroscopicity to the droplet number using Eqs. (6) and (7) in Sect. 2.5. The results are displayed in detail in Table S4. We find that the variance in the droplet number from tNd to midnight (see Sect. 2.5) averages 30 cm−3 when σw is equal to 0.3 m s−1 and 35 cm−3 for σw equal to 0.6 m s−1. In total, 68 % of this variance can be attributed to the aerosol number and the remaining 32 % to changes in the chemical composition. The above procedure, when carried out for the 161 remaining NPF episodes, provides consistently similar results (results depicted in Table S3) for both cloud updraft velocities examined. A detailed summary of the analysis by episode and season is presented in the Supplement 3.3 (SM 3.3).
Overall, during the 162 NPF days, the smax formed in clouds augments slowly after tstart and decreases gradually after tNd, when the particles from NPF begin contributing to Nd. After tNd, the mean value of smax was calculated to be 0.11±0.03 % and 0.15±0.05 % for σw of 0.3, and 0.6 m s−1, respectively. Concurrently, Nd is influenced from the afternoon and onwards, and its average increase due to the NPF varied from 1 % to 55 % and from 0.2 % to 62 % for each σw (Table S3). In wintertime, tNd was observed in the afternoon (median value at 17:30 LT). A slight decrease in smax was calculated after tNd, compared to the period between tstart and tdec (10 % for σw=0.3 m s−1 and 9 % for σw=0.6 m s−1), whilst the respective increase regarding the Nd due to the NPF episodes was estimated to be 13 % and 17 %, for the aforementioned σw (see Table S5). For spring, tNd showed a median value at 15:40 LT. smax decreases by 10 % and 7.5 % for both cloud updraft velocities, whilst the expected augmentation of the Nd compared to pre-tNd values during the NPF days was calculated to be 12 % (for σw=0.3 m s−1) and 15 % (for σw=0.6 m s−1). Throughout summer, tNd occurred at 15:00 LT (median value). For both σw the decrease in smax caused by the NPF was on average all the same (10 %), whereas at the same time the NPF is followed by a limited augmentation (7 % and 9 % for σw equal to 0.3 and 0.6 m s−1, respectively) regarding the Nd. In autumn, tNd displayed a median value at 16:30 LT, and the variations regarding smax and Nd are similar with the respective values calculated during spring (see Table S5). Finally, from the relative contribution of the total aerosol number and chemical composition to Nd, it can be seen that the variance in the total aerosol number dominates in all seasons (on average 91 %), with chemical composition contributing the remaining 9 % variance (Table S5).
The aerosol particle number size distributions along with chemical composition and meteorological parameters were studied at a remote background site in the eastern Mediterranean over a 7-year period in order to quantify how regional new particle formation (NPF) events modulate the concentration of aerosol, cloud condensation nuclei (CCN), droplet number and maximum supersaturation developed in clouds of the region.
Overall, 162 NPF episodes were recorded with the majority occurring during spring and summer (32 % and 30.8 %, respectively), few during winter (14.8 %) and the rest (22.4 %) during autumn. The timing and duration of NPF influences on the CCN spectrum and cloud droplet number concentration were determined using a set of new statistical metrics derived from the observational data. Wintertime NPF events were found to start around 11:00 LT (tstart) and to begin to increase the CCN number concentrations 3 h after tstart, while in springtime they were initiated 1 h earlier and started to increase the CCN number concentrations 2.5 h after tstart. During summer, the recorded NPF events began the earliest (09:30 LT), and the augmentation on the CCN number concentrations occurred roughly 2.5 h after tstart, while in autumn NPF episodes were observed between 09:30 and 10:00 LT, but with the largest delays regarding the increase in the CCN number concentrations – 3 h 30 min after tstart. Generally, when accounting for all NPF episodes, we found that the average increase in CCN levels (0.10 %–1.00 % supersaturation) from the NPF over the eastern Mediterranean ranged from 29 % to 77 %, with air masses containing lower amounts of preexisted particles (cleaner air) exhibiting a higher increase in the CCN number concentration and consequently in cloud droplet number concentrations due to NPF.
When the observed size distributions and chemical composition are used in conjunction with a cloud droplet parameterization, the impact of NPF on Nd differs considerably from the CCN-based analysis. Regardless of season, we find that the maximum supersaturation developed in typical boundary layer clouds in the eastern Mediterranean (cloud updraft velocities of the order of 0.3 m s−1) vary between 0.07 % and 0.12 %, giving on average cloud droplet number increases of 7 % to 13 %. This 4- to 10-fold decrease in Nd sensitivity to NPF (compared to what is deduced from the CCN analysis) is primarily from the actual cloud supersaturation being much lower than the prescribed levels in the CCN analysis. Nd sensitivity to NPF, however, is further reduced during the evolution of NPF events owing to their increased competition for water vapor when forming cloud droplets (the droplet response can be suppressed by almost one-fifth compared to assuming constant supersaturation throughout the NPF). Nevertheless, most of this droplet variability is driven by changes in aerosol number (91 %), the rest being driven by composition changes. The lowest impact on Nd is observed during summer, as this season exhibits the highest aerosol concentrations prior to NPF events, which either act as CCN or grow to become so during an event. Preexisting particles have been estimated to contribute up to 50 % of the activated CCN during summer, denoting the importance of background conditions. A striking consequence of the low cloud supersaturations is that NPF impacts on Nd are observed much later in the event, typically in the afternoon (after 15:00 LT) and that Nd is relatively insensitive to increases in CCN during the course of an event owing to the competition effects for water vapor. Thus, the impacts of NPF events on eastern Mediterranean clouds occur during the late evening and nighttime. Although such Nd enhancements may limit the short-term impact of NPF on shortwave cloud forcing – it may reduce cloud drizzle and promote stabilization of the marine boundary layer with potentially important implications for the overall boundary layer structure (e.g., Rosenfeld et al., 2006) in days following NPF events.
Perhaps one of the most important findings of this study is the importance of constraining the levels of supersaturation that are generated in ambient clouds, and the diurnal characteristics of the influence of NPF events on cloud properties. Even though the events themselves can occur early in the day, CCN number concentrations start becoming affected after 2–3 h and CDNC much later, in the late afternoon and even early evening. Thus, choosing prescribed levels of supersaturation or diameters to define CCN number concentrations can provide substantially biased or incomplete insights into the influence of NPF events on regional clouds and by extension the hydrological cycle and climate. The approach presented here offers a simple and effective paradigm for quantifying the potential impacts of NPF events on clouds, with tools available to interested researchers upon request.
The data are available from the corresponding authors upon request. All backtrajectory data can be obtained from the HYSPLIT transport and dispersion model and the READY website (https://www.ready.noaa.gov, last access: 1 May 2019).
The supplement related to this article is available online at: https://doi.org/10.5194/acp-19-6185-2019-supplement.
AN and AB conceived the study and developed the analysis tools. AB, NK, IS, and NM contributed measurements. AN, AB, PK, and IS carried out the analysis and AN, AB, PK, and NM wrote the paper. All authors commented on the paper.
The authors declare that they have no conflict of interest.
This research is cofinanced by Greece and the European Union (European Social Fund- ESF) through the Operational Programme “Human Resources Development, Education and Lifelong Learning” in the context of the project “Reinforcement of Postdoctoral Researchers” (MIS-5001552), implemented by the State Scholarships Foundation (IKY). This study also received financial support from the PANhellenic infrastructure for Atmospheric Composition and climatE change” (MIS 5021516) which is implemented under the action “Reinforcement of the Research and Innovation Infrastructure”, funded by the operational programme “Competitiveness, Entrepreneurship and Innovation” (NSRF 2014-2020) and cofinanced by Greece and the European Union (European Regional Development Fund). We also acknowledge project PyroTRACH (ERC-2016-COG) funded by H2020-EU.1.1. – Excellent Science – European Research Council (ERC), project ID 726165.
This paper was edited by Ari Laaksonen and reviewed by two anonymous referees.
Albrecht, B. A.: Observations of cloudy boundary layers, Chapter 8, Verhandelingen Natuurkunde, Eerste Reeks, deel, 48, 179–198, 1998.
Asmi, E., Kivekäs, N., Kerminen, V.-M., Komppula, M., Hyvärinen, A.-P., Hatakka, J., Viisanen, Y., and Lihavainen, H.: Secondary new particle formation in Northern Finland Pallas site between the years 2000 and 2010, Atmos. Chem. Phys., 11, 12959–12972, https://doi.org/10.5194/acp-11-12959-2011, 2011.
Barahona, D., West, R. E. L., Stier, P., Romakkaniemi, S., Kokkola, H., and Nenes, A.: Comprehensively accounting for the effect of giant CCN in cloud activation parameterizations, Atmos. Chem. Phys., 10, 2467–2473, https://doi.org/10.5194/acp-10-2467-2010, 2010.
Bardouki, H., Liakakou, H., Economou, C., Sciare, J., Smolík, J., Ždímal, V., Eleftheriadis, K., Lazaridis, M., Dyef, C., and Mihalopoulos, N.: Chemical composition of size-resolved atmospheric aerosols in the eastern Mediterranean during summer and winter, Atmos. Environ., 37, 195–208, https://doi.org/10.1016/S1352-2310(02)00859-2, 2003.
Bates, T. S., Charlson, R. J., and Gammon, R. H.: Evidence for the climatic role of marine biogenic sulphur, Nature 329, 319–321, https://doi.org/10.1038/329319a0, 1987.
Boucher, O. and Lohmann, U.: The sulfate-CCN-cloud albedo effect, Tellus, 47B, 281–300, 1995.
Bougiatioti, A., Fountoukis, C., Kalivitis, N., Pandis, S. N., Nenes, A., and Mihalopoulos, N.: Cloud condensation nuclei measurements in the marine boundary layer of the Eastern Mediterranean: CCN closure and droplet growth kinetics, Atmos. Chem. Phys., 9, 7053–7066, https://doi.org/10.5194/acp-9-7053-2009, 2009.
Bougiatioti, A., Nenes, A., Fountoukis, C., Kalivitis, N., Pandis, S. N., and Mihalopoulos, N.: Size-resolved CCN distributions and activation kinetics of aged continental and marine aerosol, Atmos. Chem. Phys., 11, 8791–8808, https://doi.org/10.5194/acp-11-8791-2011, 2011.
Bougiatioti, A., Zarmpas, P., Koulouri, E., Antoniou, M., Theodosi, C., Kouvarakis, G., Saarikoski, S., Mäkelä, T., Hillamo, R., and Mihalopoulos, N.: Organic, elemental and water-soluble organic carbon in size segregated aerosols, in the marine boundary layer of the Eastern Mediterranean, Atmos. Environ., 64, 251–262, doi.org/10.1016/j.atmosenv.2012.09.071, 2013.
Bougiatioti, A., Bezantakos, S., Stavroulas, I., Kalivitis, N., Kokkalis, P., Biskos, G., Mihalopoulos, N., Papayannis, A., and Nenes, A.: Biomass-burning impact on CCN number, hygroscopicity and cloud formation during summertime in the eastern Mediterranean, Atmos. Chem. Phys., 16, 7389–7409, https://doi.org/10.5194/acp-16-7389-2016, 2016.
Bougiatioti, A., Argyrouli, A., Solomos, S., Vratolis, S., Eleftheriadis, K., Papayannis, A., and Nenes, A.: CCN activity, variability and influence on droplet formation during the HygrA-Cd campaign in Athens, Atmosphere, 8, 108, https://doi.org/10.3390/atmos8060108, 2017.
Budisulistiorini, S. H., Canagaratna, M. R., Croteau, P. L., Baumann, K., Edgerton, E. S., Kollman, M. S., Ng, N. L., Verma, V., Shaw, S. L., Knipping, E. M., Worsnop, D. R., Jayne, J. T., Weber, R. J., and Surratt, J. D.: Intercomparison of an Aerosol Chemical Speciation Monitor (ACSM) with ambient fine aerosol measurements in downtown Atlanta, Georgia, Atmos. Meas. Tech., 7, 1929–1941, https://doi.org/10.5194/amt-7-1929-2014, 2014.
Cavalli, F., Viana, M., Yttri, K. E., Genberg, J., and Putaud, J.-P.: Toward a standardised thermal-optical protocol for measuring atmospheric organic and elemental carbon: the EUSAAR protocol, Atmos. Meas. Tech., 3, 79–89, https://doi.org/10.5194/amt-3-79-2010, 2010.
Cecchini, M. A., Machado, L. A. T., Andreae, M. O., Martin, S. T., Albrecht, R. I., Artaxo, P., Barbosa, H. M. J., Borrmann, S., Fütterer, D., Jurkat, T., Mahnke, C., Minikin, A., Molleker, S., Pöhlker, M. L., Pöschl, U., Rosenfeld, D., Voigt, C., Weinzierl, B., and Wendisch, M.: Sensitivities of Amazonian clouds to aerosols and updraft speed, Atmos. Chem. Phys., 17, 10037–10050, https://doi.org/10.5194/acp-17-10037-2017, 2017.
Cerully, K. M., Raatikainen, T., Lance, S., Tkacik, D., Tiitta, P., Petäjä, T., Ehn, M., Kulmala, M., Worsnop, D. R., Laaksonen, A., Smith, J. N., and Nenes, A.: Aerosol hygroscopicity and CCN activation kinetics in a boreal forest environment during the 2007 EUCAARI campaign, Atmos. Chem. Phys., 11, 12369–12386, https://doi.org/10.5194/acp-11-12369-2011, 2011.
Dal Maso, M., Kulmala, M., Riipinen, I., Wagner, R., Hussein, T., Aalto, P. P., and Lehtinen, K. E. J.: Formation and growth of fresh atmospheric aerosols: eight years of aerosol size distribution data from SMEAR II, Hyytiälä, Finland, Boreal Environ. Res., 10, 323–336, 2005.
Dameto de España, C., Wonaschütz, A., Steiner, G., Rosati, B., Demattio, A., Schuh, H., and Hitzenberger, R.: Long-term quantitative field study of New Particle Formation (NPF) events as a source of Cloud Condensation Nuclei (CCN) in the urban background of Vienna, Atmos. Environ., 164, 289–298, doi.org/10.1016/j.atmosenv.2017.06.001, 2017.
Dandou, A., Tombrou, M., Kalogiros, J., Bossioli, E., Biskos, G., Mihalopoulos, N., and Coe, H.: Investigation of Turbulence Parametrization Schemes with Reference to the Atmospheric Boundary Layer Over the Aegean Sea During Etesian Winds', Bound.-Lay. Meteorol., 164, 303–329, doi.org/10.1007/s10546-017-0255-0, 2017.
Debevec, C., Sauvage, S., Gros, V., Sellegri, K., Sciare, J., Pikridas, M., Stavroulas, I., Leonardis, T., Gaudion, V., Depelchin, L., Fronval, I., Sarda-Esteve, R., Baisnée, D., Bonsang, B., Savvides, C., Vrekoussis, M., and Locoge, N.: Driving parameters of biogenic volatile organic compounds and consequences on new particle formation observed at an eastern Mediterranean background site, Atmos. Chem. Phys., 18, 14297–14325, https://doi.org/10.5194/acp-18-14297-2018, 2018.
Fan, J., Leung, R., Rosenfeld, D., Chen, Q., Li, Z., Zhang, J., and Yan, H.: Microphysical effects determine macrophysical response for aerosol impacts on deep convective clouds, P. Natl. Aacad. Sci. USA, 110, E4581–E4590, https://doi.org/10.1073/pnas.1316830110, 2013.
Fountoukis, C. and Nenes, A.: Continued development of a cloud droplet formation parameterization for global climate models, J. Geophys. Res., 110, D11212, https://doi.org/10.1029/2004JD005591, 2005.
Fountoukis, C., Nenes, A., Meskhidze, N., Bahreini, R., Conant, W. C., Jonsson, H., Murphy, S., Sorooshian, A., Varutbangkul, V., Brechtel, F., Flagan, R. C., and Seinfeld, J. H.: Aerosol-cloud drop concentration closure for clouds sampled during the International Consortium for Atmospheric Research on Transport and Transformation 2004 campaign, J. Geophys. Res., 112, D10S30, https://doi.org/10.1029/2006JD007272, 2007.
Gordon, H., Kirkby, J., Baltensperger, U., Bianchi, F., Breitenlechner, M., Curtius, J., Dias, A., Dommen, J., Donahue, N. M., Dunne, E. M., Duplissy, J., Ehrhart, S., Flagan, R. C., Frege, C., Fuchs, C., Hansel, A., Hoyle, C. R., Kulmala, M., Kürten, A., Lehtipalo, K., Makhmutov, V., Molteni, U., Rissanen, M. P., Stozkhov, Y., Tröstl, J., Tsagkogeorgas, G., Wagner, R., Williamson, C., Wimmer, D., Winkler, P. M., Yan, C., and Carslaw, K. S.: Causes and importance of new particle formation in the present-day and preindustrial atmospheres, J. Geophys. Res.-Atmos., 122, 8739–8760, https://doi.org/10.1002/2017JD026844, 2017.
Ghan, S., Chung, C., and Penner, J.: A parameterization of cloud droplet nucleation part I: single aerosol type, Atmos. Res., 30, 198–221, https://doi.org/10.1016/0169-8095(93)90024-I, 1993.
Ghan, S., Abdul-Razzak, H., Nenes, A., Ming, Y., Liu, X., Ovchinnikov, M., Shipway, B., Meskhidze, N., Xu, J., and Shi, X.: Droplet Nucleation: Physically-based Parameterization and Comparative Evaluation, J. Adv. Model. Earth Syst., 3, M10001, https://doi.org/10.1029/2011MS000074, 2011.
Gultepe, I. and Isaac, G. A.: The relationship between cloud droplet and aerosol number concentrations for climate models, Int. J. Climatol., 16, 941–946, 1996.
Hermann, M., Heintzenberg, J., Wiedensohler, A., Zahn, A., Heinrich, G., and Brenninkmeijer, C. A. M.: Meridional distribution of aerosol particle number concentrations in the upper troposphere and lower stratosphere obtained by Civil Aircraft for Regular Investigation of the Atmosphere Based on an Instrument Container (CARIBIC) flights, J. Geophys. Res., 108, 4114, https://doi.org/10.1029/2001JD001077, 2003.
Hildebrandt, L., Engelhart, G. J., Mohr, C., Kostenidou, E., Lanz, V. A., Bougiatioti, A., DeCarlo, P. F., Prevot, A. S. H., Baltensperger, U., Mihalopoulos, N., Donahue, N. M., and Pandis, S. N.: Aged organic aerosol in the Eastern Mediterranean: the Finokalia Aerosol Measurement Experiment – 2008, Atmos. Chem. Phys., 10, 4167–4186, https://doi.org/10.5194/acp-10-4167-2010, 2010.
Hudson, J. G. and Noble, S.: CCN and vertical velocity influences on droplet concentrations and supersaturations in clean and polluted stratus clouds, J. Atmos. Sci., 7, 312–331, https://doi.org/10.1175/JAS-D-13-086.1, 2014.
Hussein, T., Puustinen, A., Aalto, P. P., Mäkelä, J. M., Hämeri, K., and Kulmala, M.: Urban aerosol number size distributions, Atmos. Chem. Phys., 4, 391–411, https://doi.org/10.5194/acp-4-391-2004, 2004.
Kalivitis, N., Kerminen, V.-M., Kouvarakis, G., Stavroulas, I., Bougiatioti, A., Nenes, A., Manninen, H. E., Petäjä, T., Kulmala, M., and Mihalopoulos, N.: Atmospheric new particle formation as a source of CCN in the eastern Mediterranean marine boundary layer, Atmos. Chem. Phys., 15, 9203–9215, https://doi.org/10.5194/acp-15-9203-2015, 2015.
Kalivitis, N., Kerminen, V.-M., Kouvarakis, G., Stavroulas, I., Tzitzikalaki, E., Kalkavouras, P., Daskalakis, N., Myriokefalitakis, S., Bougiatioti, A., Manninen, H. E., Roldin, P., Petäjä, T., Boy, M., Kulmala, M., Kanakidou, M., and Mihalopoulos, N.: Formation and growth of atmospheric nanoparticles in the eastern Mediterranean: results from long-term measurements and process simulations, Atmos. Chem. Phys., 19, 2671–2686, https://doi.org/10.5194/acp-19-2671-2019, 2019.
Kalkavouras, P., Bossioli, E., Bezantakos, S., Bougiatioti, A., Kalivitis, N., Stavroulas, I., Kouvarakis, G., Protonotariou, A. P., Dandou, A., Biskos, G., Mihalopoulos, N., Nenes, A., and Tombrou, M.: New particle formation in the southern Aegean Sea during the Etesians: importance for CCN production and cloud droplet number, Atmos. Chem. Phys., 17, 175–192, https://doi.org/10.5194/acp-17-175-2017, 2017.
Katoshevski, D., Nenes, A., and Seinfeld, J. H.: A Study of processes that govern the maintenance of aerosols in the marine boundary layer, J. Atmos. Sci., 30, 503–532, https://doi.org/10.1016/S0021-8502(98)00740-X, 1999.
Kerminen, V.-M., Paramonov, M., Anttila, T., Riipinen, I., Fountoukis, C., Korhonen, H., Asmi, E., Laakso, L., Lihavainen, H., Swietlicki, E., Svenningsson, B., Asmi, A., Pandis, S. N., Kulmala, M., and Petäjä, T.: Cloud condensation nuclei production associated with atmospheric nucleation: a synthesis based on existing literature and new results, Atmos. Chem. Phys., 12, 12037–12059, https://doi.org/10.5194/acp-12-12037-2012, 2012.
Kerminen, V.-M., Chen, X., Vakkari, V., Petäjä, T., Kulmala, M., and Bianchi, F.: Atmospheric new particle formation and growth: review of field observations, Environ. Res. Lett., 13, 103003, doi.org/10.1088/1748-9326/aadf3c, 2018.
Koulouri, E., Saarikosko, S., Theodosi, C., Markaki, Z., Gerasopoulos, E., Kouvarakis, G., Mäkelä, T., Hillamo, R., and Mihalopoulos, N.: Chemical composition and sources of fine and coarse aerosol particles in the Eastern Mediterranean, Atmos. Environ., 42, 6542–6550, doi.org/10.1016/j.atmosenv.2008.04.010, 2008.
Kreidenweis, S. M., Penner, J. E., Yin, F., and Seinfeld, J. H.: The effects of dimethylsulfide upon marine aerosol concentrations, Atmos. Environ., 25A, 2501–2511, 1991.
Kulmala, M., Vehkamäki, H., Petäjä, T., Dal Maso, M., Lauri, A., Kerminen, V.-M., Birmili, W., and McMurry, P. H.: Formation and growth rates of ultrafine atmospheric particles: a review of observations, J. Aerosol Sci., 35, 143–176, 2004.
Kulmala, M., Petäjä, T., Nieminen, T., Sipilä, M., Manninen, H. E., Lehtipalo, K., Dal Maso, M., Aalto, P., Junninen, H., Paasonen, P., Riipinen, I., Lehtinen, K. E. J., Laaksonen, A., and Kerminen, V.-M.: Measurement of the nucleation of atmospheric aerosol particles, Nat. Protocol., 7, 1651–1667, https://doi.org/10.1038/nprot.2012.091, 2012.
Lance, S., Nenes, A., Medina, J., and Smith, J.N.: Mapping the operation of the DMT continuous flow CCN counter, Aerosol Sci. Tech., 40, 242–254, https://doi.org/10.1080/02786820500543290, 2006.
Lathem, T. L. and Nenes, A.: Water vapor depletion in the DMT continuous-flow CCN chamber: effects on supersaturation and droplet growth, Aerosol Sci. Tech., 45, 604–615, https://doi.org/10.1080/02786826.2010.551146, 2011.
Leaitch, W. R., Strapp, J. W., and Isaac, G. A.: Cloud droplet nucleation and cloud scavenging of aerosol sulphate in polluted atmospheres, Tellus, 38B, 328–344, 1986.
Leino, K., Nieminen, T., Manninen, H. E., Petäjä, T., Kerminen, V.-M., and Kulmala, M.: Intermediate ions as a strong indicator of new particleformation bursts in a boreal forest, Boreal Environ. Res., 21, 274–286, 2016.
Ma, N., Zhao, C., Tao, J., Wu, Z., Kecorius, S., Wang, Z., Größ, J., Liu, H., Bian, Y., Kuang, Y., Teich, M., Spindler, G., Müller, K., van Pinxteren, D., Herrmann, H., Hu, M., and Wiedensohler, A.: Variation of CCN activity during new particle formation events in the North China Plain, Atmos. Chem. Phys., 16, 8593–8607, https://doi.org/10.5194/acp-16-8593-2016, 2016.
Merikanto, J., Spracklen, D. V., Pringle, K. J., and Carslaw, K. S.: Effects of boundary layer particle formation on cloud droplet number and changes in cloud albedo from 1850 to 2000, Atmos. Chem. Phys., 10, 695–705, https://doi.org/10.5194/acp-10-695-2010, 2010.
Middlebrook, A. M., Bahreini, R., Jimenez, J. L., and Canagaratna, M. R.: Evaluation of Composition-Dependent Collection Efficiencies for the Aerodyne Aerosol Mass Spectrometerusing Field Data, Aerosol Sci. Tech., 46, 258–271, doi.org/10.1080/02786826.2011.620041, 2012.
Mihalopoulos, N., Stephanou, E., Kanakidou, M., Pilitsidis, S., and Bousquet, P.: Tropospheric aerosol ionic composition in the Eastern Mediterranean region, Tellus B, 49, 314–326, doi.org/10.1034/j.1600-0889.49.issue3.7.x, 1997.
Morales, R. and Nenes, A.: Characteristic updrafts for computing distribution-averaged cloud droplet number and stratocumulus cloud properties, J. Geophys. Res., 115, D18220, https://doi.org/10.1029/2009JD013233, 2010.
Morales, R., Nenes, A., Jonsson, H., Flagan, R. C., and Seinfeld, J. H.: Evaluation of a diabatic droplet activation parameterization using in-situ cloud data, J. Geophys. Res., 116, D15205, https://doi.org/10.1029/2010JD015324, 2011.
Morales Betancourt, R. and Nenes, A.: Droplet activation parameterization: the population-splitting concept revisited, Geosci. Model Dev., 7, 2345–2357, https://doi.org/10.5194/gmd-7-2345-2014, 2014.
Nenes, A. and Seinfeld, J. H.: Parameterization of cloud dropletformation in global climate models, J. Geophys. Res, 108, 4415, https://doi.org/10.1029/2002JD002911, 2003.
Nenes, A., Chan, S., Abdul-Razzak, H., Chuang, P., and Seinfeld, J. H.: Kinetic limitations on cloud droplet formation and impact on cloud albedo, Tellus 53B, 133–149, https://doi.org/10.3402/tellusb.v53i2.16569, 2001.
Ng, N. L., Herndon, S. C., Trimborn, A., Canagaratna, M. R., Croteau, P. L., Onasch, T. B., Sueper, D., Worsnop, D. R., Zhang, Q., Sun, Y. L., and Jayne, J. T.: An Aerosol Chemical Speciation Monitor (ACSM) for routine monitoring of the composition and mass concentrations of ambient aerosol, Aerosol Sci. Tech., 45, 770–784, https://doi.org/10.1080/02786826.2011.560211, 2011.
O'Dowd, C. D., Hämeri, K., Mäkelä, J. M., Pirjola, L., Kulmala, M., Jennings, S. G., Berresheim, H., Hansson, H.-C., Leeuw, G., Kunz, G. J., Allen, A. G., Hewitt, C. N., Jackson, A., Viisanen, Y., and Hoffmann, T.: A dedicated study of new Particle Formation and Fate in the Coastal Environment (PARFORCE): Overview of objectives and achievements, J. Geophys. Res., 107, 8108, https://doi.org/10.1029/2001JD000555, 2002.
Paasonen, P., Peltola, M., Kontkanen, J., Junninen, H., Kerminen, V.-M., and Kulmala, M.: Comprehensive analysis of particle growth rates from nucleation mode to cloud condensation nuclei in boreal forest, Atmos. Chem. Phys., 18, 12085–12103, https://doi.org/10.5194/acp-18-12085-2018, 2018.
Peng, J. F., Hu, M., Wang, Z. B., Huang, X. F., Kumar, P., Wu, Z. J., Guo, S., Yue, D. L., Shang, D. J., Zheng, Z., and He, L. Y.: Submicron aerosols at thirteen diversified sites in China: size distribution, new particle formation and corresponding contribution to cloud condensation nuclei production, Atmos. Chem. Phys., 14, 10249–10265, https://doi.org/10.5194/acp-14-10249-2014, 2014.
Pierce, J. R. and Adams, P. J.: Efficiency of cloud condensation nuclei formation from ultrafine particles, Atmos. Chem. Phys., 7, 1367–1379, https://doi.org/10.5194/acp-7-1367-2007, 2007.
Pöschl, U., Martin, S. T., Sinha, B., Chen, Q., Gunthe, S. S., Huffman, J. A., Borrmann, S., Farmer, D. K., Garland, R. M., Helas, G., Jinemez, J. L., King, S. M., Manzi, A., Mikhailov, E., Pauliquevis, T., Petters, M. D., Prenni, A. J., Roldin, P., Rose, D., Schneider, J., Su, H., Zorn, S. R., Artaxo, P., and Andreae, M. O.: Rainforest aerosols as biogenic nuclei of clouds and precipitation in the Amazon, Science, 329, 1513–1516, https://doi.org/10.1126/science.1191056, 2010.
Ramanathan, V., Crutzen, P. J., Kiehl, J. T., and Rosenfeld, D.: Aerosols, climate, and the hydrological cycle, Science, 294, 2119–2124, https://doi.org/10.1126/science.1064034, 2001.
Roberts, G. C. and Nenes, A.: A Continuous-Flow Streamwise Thermal-Gradient CCN Chamber for Atmospheric Measurements, Aerosol Sci. Tech., 39, 206–221, 2005.
Rose, C., Sellegri, K., Moreno, I., Velarde, F., Ramonet, M., Weinhold, K., Krejci, R., Andrade, M., Wiedensohler, A., Ginot, P., and Laj, P.: CCN production by new particle formation in the free troposphere, Atmos. Chem. Phys., 17, 1529–1541, https://doi.org/10.5194/acp-17-1529-2017, 2017.
Rosenfeld, D., Kaufman, Y. J., and Koren, I.: Switching cloud cover and dynamical regimes from open to closed Benard cells in response to the suppression of precipitation by aerosols, Atmos. Chem. Phys., 6, 2503–2511, https://doi.org/10.5194/acp-6-2503-2006, 2006.
Sciare, J., Oikonomou, K., Cachier, H., Mihalopoulos, N., Andreae, M. O., Maenhaut, W., and Sarda-Estève, R.: Aerosol mass closure and reconstruction of the light scattering coefficient over the Eastern Mediterranean Sea during the MINOS campaign, Atmos. Chem. Phys., 5, 2253–2265, https://doi.org/10.5194/acp-5-2253-2005, 2005.
Seinfeld, J. and Pandis, S. (Eds.): Atmospheric Chemistry and Physics: From Air Pollution to Climate Change, 2nd Edn., John Wiley, edited by: Hoboken, N. J., ISBN 978-0-471-72018-8, 1232 pp., 2006.
Seinfeld, J. H., Bretherton, C. S., Carslaw, K. S., Coe, H., DeMott, P. J., Dunlea, E. J., Feingold, G., Ghan, S. J., Guenther, A.B., Kahn, R. A., Kracunas, I. P., Kreidenweis, S. M., Molina, M. J., Nenes, A., Penner, J. E., Prather, K. A., Ramanathan, V., Ramaswamy, V., Rasch, P. J., Ravishankara, A. R., Rosenfeld, D., Stephens, G., and Wood R.: Improving Our Fundamental Understanding of the Role of Aerosol-Cloud Interactions in the Climate System, P. Nat. Acad. Sci. USA, 113, 5781–5790, https://doi.org/10.1073/pnas.1514043113, 2016.
Sellegri, K., Pey, J., Rose, C., Culot, A., DeWitt, H. L., Mas, S., Schwier, A. N., Temime-Roussel, B., Charriere, B., Saiz-Lopez, A., Mahajan, A.S., Parin, D., Kukui, A., Sempere, R., D'Anna, B., and Marchand, N.: Evidence of atmospheric nanoparticle formation from emissions of marine microorganisms, Geophys. Res. Lett., 43, 6596–6603, doi.org/10.1002/2016GL069389, 2016.
Sihto, S.-L., Mikkilä, J., Vanhanen, J., Ehn, M., Liao, L., Lehtipalo, K., Aalto, P. P., Duplissy, J., Petäjä, T., Kerminen, V.-M., Boy, M., and Kulmala, M.: Seasonal variation of CCN concentrations and aerosol activation properties in boreal forest, Atmos. Chem. Phys., 11, 13269–13285, https://doi.org/10.5194/acp-11-13269-2011, 2011.
Sipilä, M., Sarnela, N., Jokinen, T., Henschel, H., Junninen, H., Kontkanen, J., Richters, S., Kangasluoma, J., Franchin, A., Peräkylä, O., Rissanen, M.-P., Ehn, M., Vehkamäki, H., Kurten, T., Berndt, T., Petäjä, T., Worsnop, D., Ceburnis, D., Kerminen, V.-M., Kulmala, M., and O' Dowd, C.: Molecular-scale evidence of aerosol particle formation via sequential addition of HIO3, Nature, 537, 532–534, https://doi.org/10.1038/nature19314, 2016.
Sotiropoulou, R. E. P., Nenes, A., Adams, P. J., and Seinfeld, J. H.: Cloud condensation nuclei prediction error from application of Kohler theory: Importance for the aerosol indirect effect, J. Geophys. Res., 112, D12202, https://doi.org/10.1029/2006JD007834, 2007.
Spracklen, D. V., Carslaw, K. S., Kulmala, M., Kerminen, V.-M., Sihto, S.-L., Riipinen, I., Merikanto, J., Mann, G. W., Chipperfield, M. P., Wiedensohler, A., Birmili, W., and Lihavainen, H.: Contribution of particle formation to global cloud condensation nuclei concentrations, Geophys. Res. Lett., 35, L06808, https://doi.org/10.1029/2007GL033038, 2008a.
Spracklen, D. V., Bonn, B., and Carslaw, K. S.: Boreal forests, aerosols and the impacts of clouds and climate, Philos. T. Roy. Soc. A., 366, 4613–4626, 2008b.
Stein, A. F., Draxler, R. R., Rolph, G. D., Stunder, B. J. B., Cohen, M. D., and Ngan, F.: NOAA's HYSPLIT atmospheric transport and dispersion modeling system, B. Am. Meteorol. Soc., 96, 2059–2077, https://doi.org/10.1175/BAMS-D-14-00110.1, 2015.
Stevens, B. and Feingold, G.: Untangling aerosols effects on clouds and precipitation in a buffered system, Nature, 461, 607–613, https://doi.org/10.1038/nature08281, 2009.
Sullivan, S. C., Lee, D., Oreopoulos, L., and Nenes, A.: The role of updraft velocity in temporal variability of cloud hydrometeor number, P. Natl. Acad. Sci. USA, 113, 5781–5790, https://doi.org/10.1073/pnas.1514043113, 2016.
Sullivan, R. C., Crippa, P., Matsui, H., Leung, L. R., Zhao, C., Thota, A., and Pryor, S. C.: New particle formation leads to cloud dimming, Climate and Atmospheric Science, 1, 1–9, https://doi.org/10.1038/s41612-018-0019-7, 2018.
Tombrou, M., Bossioli, E., Kalogiros, J., Allan, J. D., Bacak, A., Biskos, G., Coe, H., Dandou, A., Kouvarakis, G., Mihalopoulos, N., Percival, C. J., Protonotariou, A. P., and Szabó-Takács, B.: Physical and chemical processes of airmasses in the Aegean Sea during Etesians: Aegean-GAME airborne campaign, Sci. Total Environ., 506–507, 201–216, https://doi.org/10.1016/j.scitotenv.2014.10.098, 2015.
Twomey, S.: The influence of pollution on the shortwave albedo of clouds, J. Atmos. Sci., 34, 1149–1152, 1977.
Vaattovaara, P., Huttunen, P. E., Yoon, Y. J., Joutsensaari, J., Lehtinen, K. E. J., O'Dowd, C. D., and Laaksonen, A.: The composition of nucleation and Aitken modes particles during coastal nucleation events: evidence for marine secondary organic contribution, Atmos. Chem. Phys., 6, 4601–4616, https://doi.org/10.5194/acp-6-4601-2006, 2006.
Wang, Q., Zhao, J., Du, W., Ana, G., Wang, Z., Sun, L., Wang, Y., Zhang, F., Li, Z., Ye, X., and Sun, Y.: Characterization of submicron aerosols at a suburban site in central China, Atmos. Environ., 131, 115–112, https://doi.org/10.1016/j.atmosenv.2016.01.054, 2016.
Westervelt, D. M., Pierce, J. R., Riipinen, I., Trivitayanurak, W., Hamed, A., Kulmala, M., Laaksonen, A., Decesari, S., and Adams, P. J.: Formation and growth of nucleated particles into cloud condensation nuclei: model-measurement comparison, Atmos. Chem. Phys., 13, 7645–7663, https://doi.org/10.5194/acp-13-7645-2013, 2013.
Westervelt, D. M., Pierce, J. R., and Adams, P. J.: Analysis of feedbacks between nucleation rate, survival probability and cloud condensation nuclei formation, Atmos. Chem. Phys., 14, 5577–5597, https://doi.org/10.5194/acp-14-5577-2014, 2014.
Wiedensohler, A., Chen, Y. F., Nowak, A., Wehner, B., Achtert, P., Berghof, M., Birmili, W., Wu, Z. J., Hu, M., Zhu, T., Takegawa, N., Kita, K., Kondo, Y., Lou, S. R., Hofzumahaus, A., Holland, F., Wahner, A., Gunthe, S. S., Rose, D., Su, H., and Pöschl, U.: Rapid aerosol particle growth and increase of cloud condensation nucleus activity by secondary aerosol formation and condensation: A case study for regional air pollution in northeastern China, J. Geophys. Res., 114, D00G08, https://doi.org/10.1029/2008JD010884, 2009.
Wiedensohler, A., Birmili, W., Nowak, A., Sonntag, A., Weinhold, K., Merkel, M., Wehner, B., Tuch, T., Pfeifer, S., Fiebig, M., Fjäraa, A. M., Asmi, E., Sellegri, K., Depuy, R., Venzac, H., Villani, P., Laj, P., Aalto, P., Ogren, J. A., Swietlicki, E., Williams, P., Roldin, P., Quincey, P., Hüglin, C., Fierz-Schmidhauser, R., Gysel, M., Weingartner, E., Riccobono, F., Santos, S., Grüning, C., Faloon, K., Beddows, D., Harrison, R., Monahan, C., Jennings, S. G., O'Dowd, C. D., Marinoni, A., Horn, H.-G., Keck, L., Jiang, J., Scheckman, J., McMurry, P. H., Deng, Z., Zhao, C. S., Moerman, M., Henzing, B., de Leeuw, G., Löschau, G., and Bastian, S.: Mobility particle size spectrometers: harmonization of technical standards and data structure to facilitate high quality long-term observations of atmospheric particle number size distributions, Atmos. Meas. Tech., 5, 657–685, https://doi.org/10.5194/amt-5-657-2012, 2012.
Wu, Z. J., Poulain, L., Birmili, W., Größ, J., Niedermeier, N., Wang, Z. B., Herrmann, H., and Wiedensohler, A.: Some insights into the condensing vapors driving new particle growth to CCN sizes on the basis of hygroscopicity measurements, Atmos. Chem. Phys., 15, 13071–13083, https://doi.org/10.5194/acp-15-13071-2015, 2015.