the Creative Commons Attribution 4.0 License.
the Creative Commons Attribution 4.0 License.
 | 03 May 2019
Increased inorganic aerosol fraction contributes to air pollution and haze in China
Yonghong Wang
Yuesi Wang
Tuukka Petäjä
Qiaozhi Zha
Chongshui Gong
Sixuan Li
Yuepeng Pan
Jinyuan Xin
Markku Kulmala
The detailed formation mechanism of an increased number of haze events in China is still not very clear. Here, we found that reduced surface visibility from 1980 to 2010 and an increase in satellite-derived columnar concentrations of inorganic precursors from 2002 to 2012 are connected with each other. Typically, higher inorganic mass fractions lead to increased aerosol water uptake and light-scattering ability in elevated relative humidity. Satellite observation of aerosol precursors of NO2 and SO2 showed increased concentrations during the study period. Our in situ measurement of aerosol chemical composition in Beijing also confirmed increased contribution of inorganic aerosol fraction as a function of the increased particle pollution level. Our investigations demonstrate that the increased inorganic fraction in the aerosol particles is a key component in the frequently occurring haze days during the study period, and particularly the reduction of nitrate, sulfate and their precursor gases would contribute towards better visibility in China.
- Article
(2485 KB) - Full-text XML
-
Supplement
(639 KB) - BibTeX
- EndNote


As one of the most heavily polluted regions in the world, China has suffered from air pollution for decades (Hao et al., 2007; Zhang et al., 2015). Aerosol particles, as a major air pollutant, have significant effects on human health (Lelieveld et al., 2015). The general public and the central government of China have realized the severe situation and have taken some actions to improve the air quality nationwide in recent years. For example, the state council published a plan for air pollution control, in September 2013, aimed at reducing PM2.5 concentrations by 10 %–25 % in different regions of China. The successful implementation requires a sufficient knowledge of haze formation mechanisms (Kulmala, 2015) and a comprehensive observation network (Kulmala, 2018). Our understanding of haze events with high PM2.5 concentrations in China is still limited due to the spatial–temporal variation of aerosol properties and limited observation information (Wang et al., 2016). Recent studies found that secondary aerosol components were important during the intense haze events in Beijing, Xi'an, Chengdu and Guangzhou during January of 2013, and the reduction of aerosol precursors is a key step to reduce particle pollution (Guo et al., 2014; Huang et al., 2014). The analysis of longer time series data from Nanjing shows that secondary particles are typically dominating even the number concentrations in polluted conditions (Kulmala, 2016). A recent study has suggested significantly decreased trends of PM2.5 and SO2 in China from 2015 to 2017 by analyzing data sets from the Ministry of Ecology and Environment of China (Silver et al., 2018). The column NO2 concentration obtained from the Ozone Monitoring Instrument (OMI) showed an increased trend during 2005–2011, while a decreasing trend was shown during 2012–2015 (Itahashi et al., 2016). The SO2 concentration has decreased around 50 % from 2012 to 2015 in the North China Plain due to economic slowdown and government efforts to restrain emissions from power and industrial sectors (Krotkov et al., 2016). However, the most abundant mass fractions of atmospheric aerosol are inorganic and organic components, which have large spatiotemporal variation (Jimenez et al., 2009). Identifying the most abundant as well as critical aerosol species that contribute to the haze formation in a long time perspective is important to draw up effective plans for the air pollution control.
Here, comprehensive data sets were used to reveal that an increasing trend of inorganic components in atmospheric aerosol may be a pivotal factor, at least, which leads to frequently occurring haze events in China from 1980 to 2010. We suggests that the control of inorganic aerosol components of nitrate, sulfate and their precursors should be a high priority due to their strong water uptake abilities and therefore light-scattering ability in high relative humidity (RH) conditions.
The daily averaged visibility and relative humidity data in 262 sites in China are obtained from the Integrated Surface Dataset (ISD) from the National Oceanic and Atmospheric Administration National Climate Data Center of the USA from 1980 to 2010 (https://www.ncdc.noaa.gov/isd, last access: 30 April 2019). The visibility observations were made three times a day at 8 h intervals beginning at 00:00 LT by well-trained technicians. They measured visual range using distinctive markers, such as tall buildings, mountains and towers, to which the distance from the meteorological monitoring stations is known.
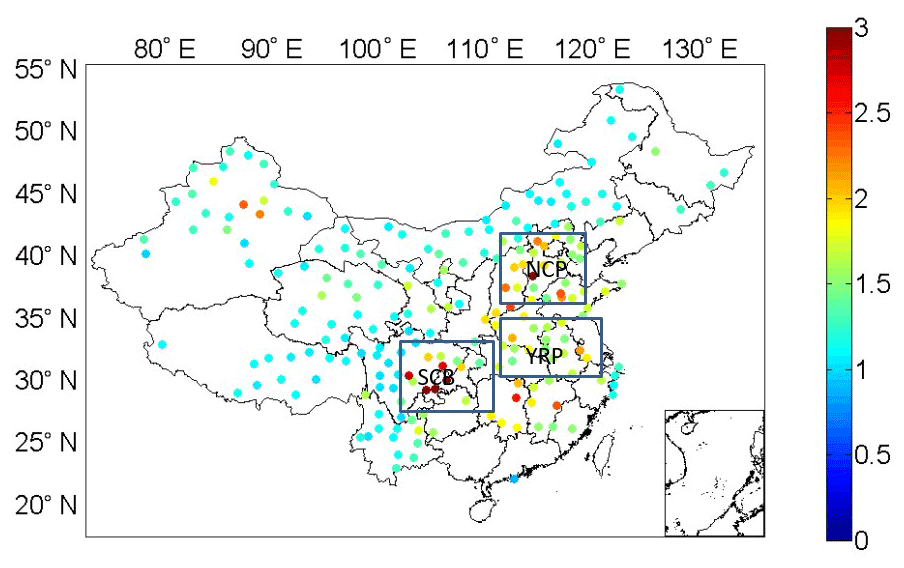
Figure 1The distribution of the average surface visibility ratio in dry and wet conditions based on observations at 262 surface observation sites in China. The aerosol in the industrialized regions of China in the east are more hygroscopic than aerosol particles in the west of China.
We quantified the importance of relative humidity to visibility as the hygroscopic inorganic compounds typically grow in size in high humidity (Swietlicki et al., 2008). Aerosol size growth and composition change in the high-humidity condition are highly related to light-scattering ability (Zhang et al., 2015). Studies always use f(RH), a parameter which is defined as the ratio of light-scattering coefficient under high RH to that under low RH. f(RH) is a unitless number, which usually ranges from 1 to 2. At ambient RH around 80 %, a higher f(RH) value usually corresponds to higher inorganic aerosol fraction, while a lower value usually corresponds to high organic fraction. The reason is that inorganic aerosol compounds of nitrate, sulfate and ammonium have stronger water uptake ability than organic compounds. In addition, the high-humidity condition at ambient RH prefers the formation of inorganic aerosol from precursors of NO2 and SO2 (Wang et al., 2014). In this study, for a given site and given year, we defined a f(RH)-like parameter, Ri, using the observed annual visibility (V) as a ratio (Ri) between visibility values from the surface observation stations, when the daily average RH was below 40 % for more than 20 d. In the corresponding high-humidity cases, daily RH was between 80 % and 90 % for more than 20 d each year at a given observation site:
We use this ratio to infer a long trend of aerosol hygroscopicity information. In addition, we calculate anomaly (A) from the ratio for a given year i as a difference from the 30-year period (R30 yr) from 1980 to 2010:
Our spatial focus is placed on the North China Plain, Yangtze River Plain and Sichuan Basin due to frequent haze events (Zhang et al., 2012). The stations in the Pearl River Delta region and other southern China stations were not included due to limited days with the daily average RH below 40 %.
The atmospheric column amount of NO2 and SO2 data is obtained from 2002 to 2012 and 2004 to 2012, respectively, from SCIAMACHY (Scanning Imaging Absorption Spectrometer for Atmospheric Chartography) satellite products. SCIAMACHY is an atmospheric sensor aboard the European satellite Envisat. It was launched in March 2002 as a joint project of Germany, the Netherlands and Belgium. It measures atmospheric absorption in spectral bands from the ultraviolet to the near infrared (240–2380 nm) and allows to retrieve atmospheric column concentrations of O3, BrO, OClO, ClO, SO2, H2CO, NO, NO2, NO3, CO, CO2, CH4, H2O, N2O, aerosols, radiation and cloud properties (Boersma et al., 2004). Aerosol chemical composition from the Goddard Earth Observing System chemical transport model (GEOS-Chem) combined with satellite aerosol optical depth (AOD) products in China during 1998–2012 is used. The model utilizes assimilated meteorology data and regional emission inventories with a horizontal resolution of with 47 vertical levels from the surface to 80 km. The PM2.5 concentration was retrieved from AOD of satellite and the relationship between PM2.5 and AOD in GEOS-Chem. The detailed information about the model can be found in Boys et al. (2014). Aerosol chemical composition of organic aerosol, sulfate, nitrate, ammonium and chloride were measured with a high-resolution time-of-flight aerosol mass spectrometers during an intensive campaign in urban Beijing from November 2010 to January 2011 (DeCarlo et al., 2006). Detailed information on data analysis, collection efficiencies (CEs) and relative ionization efficiencies is presented in Zhang et al. (2014).
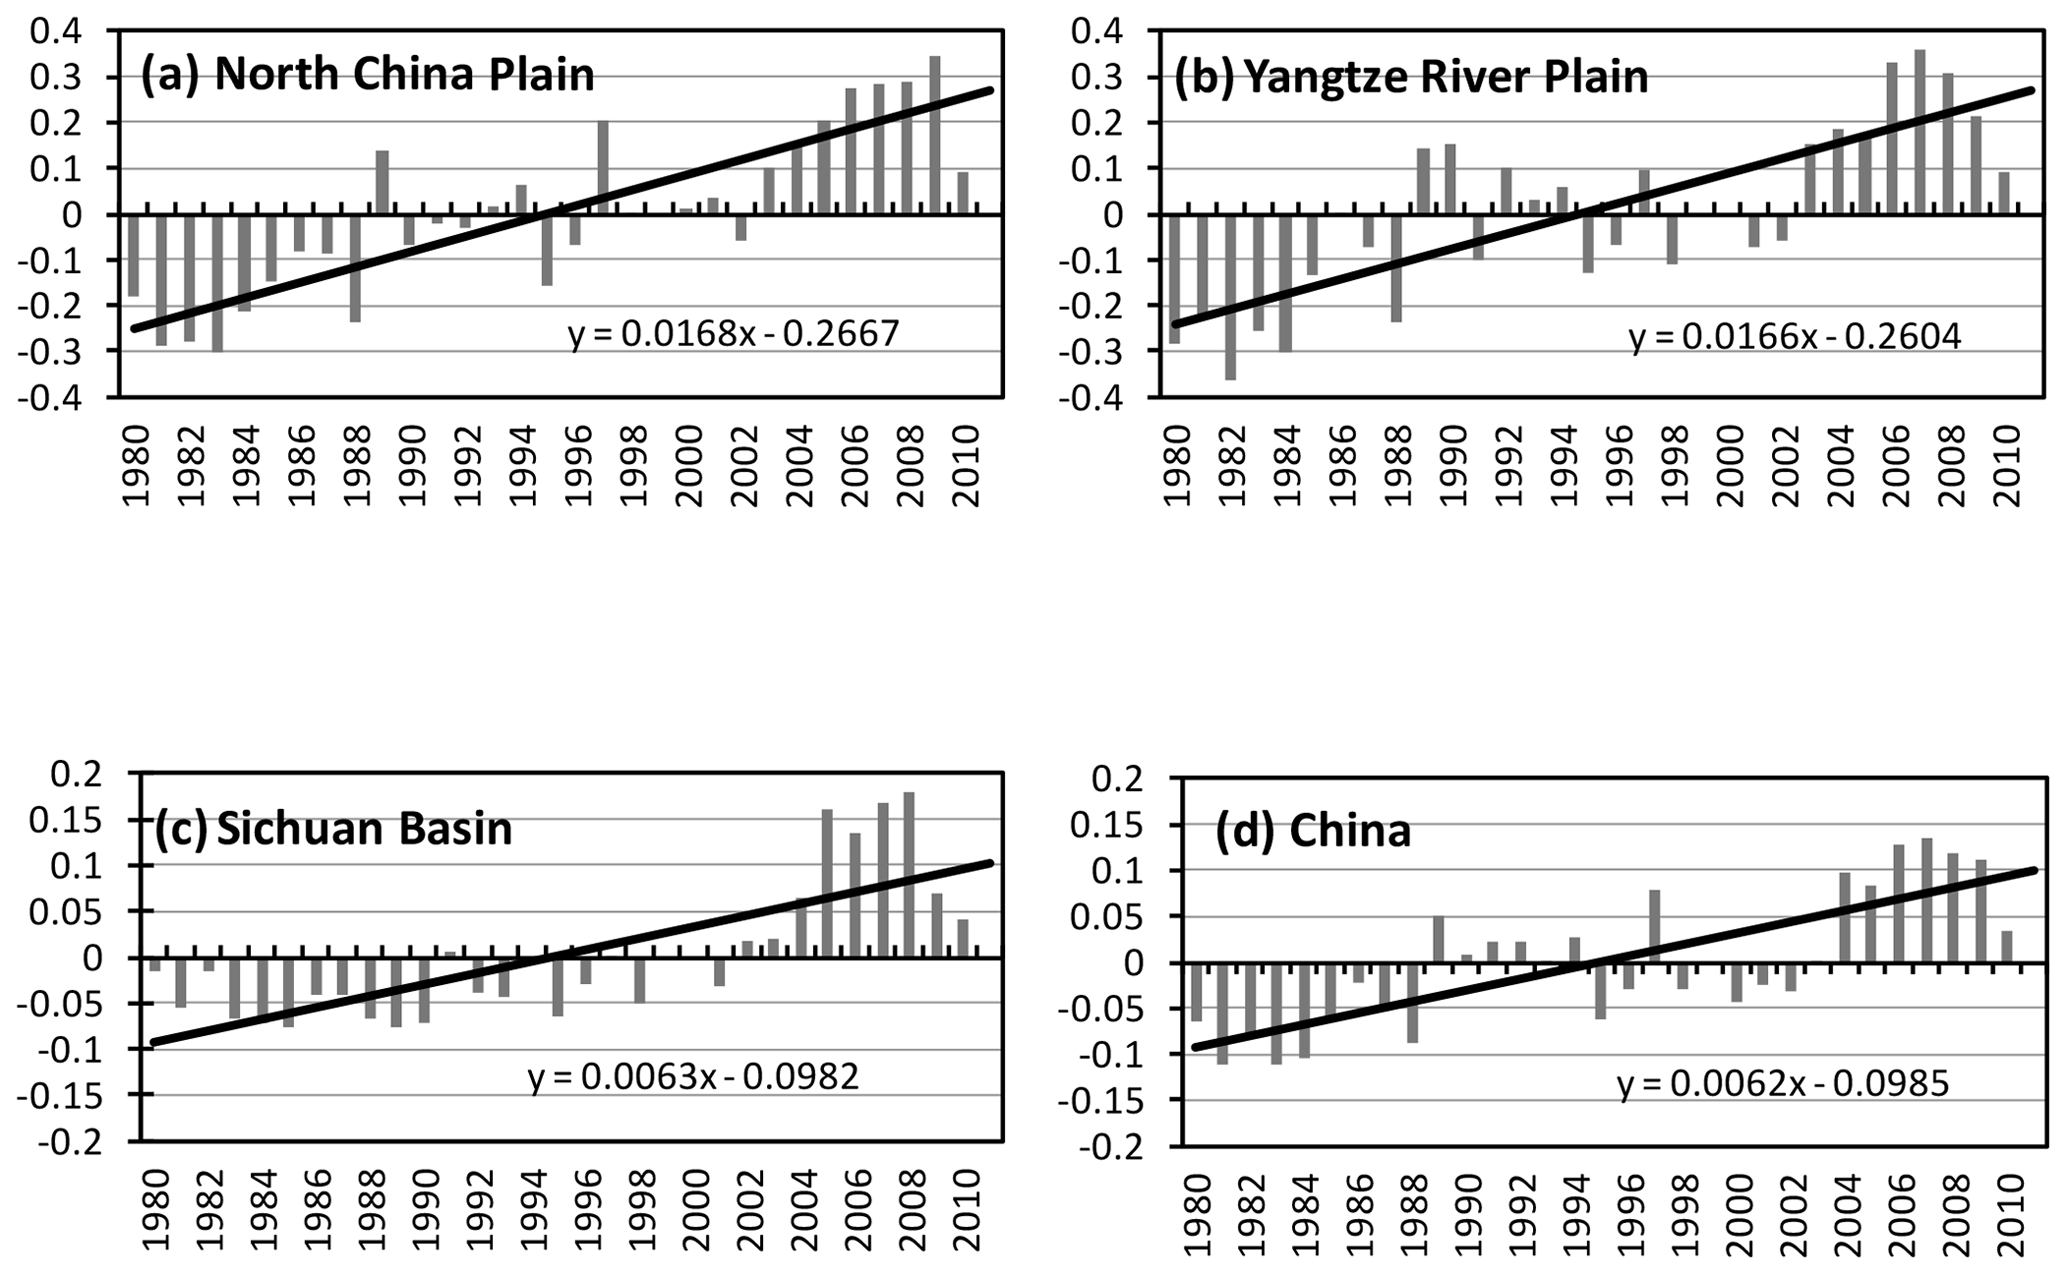
Figure 2Anomalies and trends of the ratio of visibility in the North China Plain, Yangtze River Plain, Sichuan Basin and China as a whole. The relative contribution of hygroscopic aerosols to the visibility reduction has increased from 1980 to 2010 in China.
3.1 Decreasing trend in visibility in high relative humidity conditions
According to the geographical division, our study sites are mainly in the North China Plain (NCP), Sichuan Basin (SCB) and Yangtze River Plain (YRP), as shown in Fig. 1. The average visibility in low RH in NCP, SCB, YRP and China is 18.2, 21.4, 19.5 and 23.3 km, while the values in high-RH conditions are 10.6, 13.7, 13.7 and 17.4 km, respectively. In general, visibility in the low-RH condition has a fluctuating trend, particularly in the North China Plain, Sichuan Basin and Yangtze River Plain region, whereas visibility in high-RH conditions showed a decreasing trend, as shown in Fig. S1a and b. The average ratio of visibility in low RH to that in high RH from 1980 to 2010 is presented in Fig. 1. The maximum ratios were identified in eastern China and in some western Chinese cities. Three heavily polluted regions, the North China Plain, Sichuan Basin and Yangtze River Plain, were identified based on values of high Ri, which are also consistent with aerosol mass concentrations and haze-day distributions (van Donkelaar et al., 2010; Xin et al., 2015). That is, the higher ratios occurred in more severe air pollution areas, like the North China Plain, Sichuan Basin and the city of Ürümqi, where the contribution of hygroscopic aerosol is more pronounced in comparison with non-hygroscopic dust particles. The average Ri values during 1980–1984 in the North China Plain, Sichuan Basin and Yangtze River Plain are 1.62, 1.41, 1.29 and 1.31, respectively, contrasting with the values of 1.98, 1.81, 1.70 and 1.52 during 2006–2010. The increments are 22.3 %, 27.3 %, 31 % and 16 %, respectively. It is worth noting that the Ri in the Yangtze River Plain region exhibits the most increments, which implies the increased emissions with rapid economic growth. Long time trends of this ratio at a specific site can reveal the variation of inorganic aerosol fraction and organic fraction due to their different hygroscopicity and water uptake capacity and associated light extinction ability. That is, the mass fractions and concentrations of sulfate, nitrate and ammonium may have increased over the study period as they dominate water uptake ability compared with other components (e.g., organic aerosol, black carbon, dust and metal elements; see Table S1) in the atmospheric aerosol (Wang et al., 2015). For the selected regions, we have calculated the anomaly as a regional average, as shown in Fig. 2. The ratio showed increasing trends over three regions of China and the maximum trends occurred in the North China Plain with the value of 0.0168 per year, which indicates an increase of hygroscopic aerosol in these regions during the 30-year observation period.
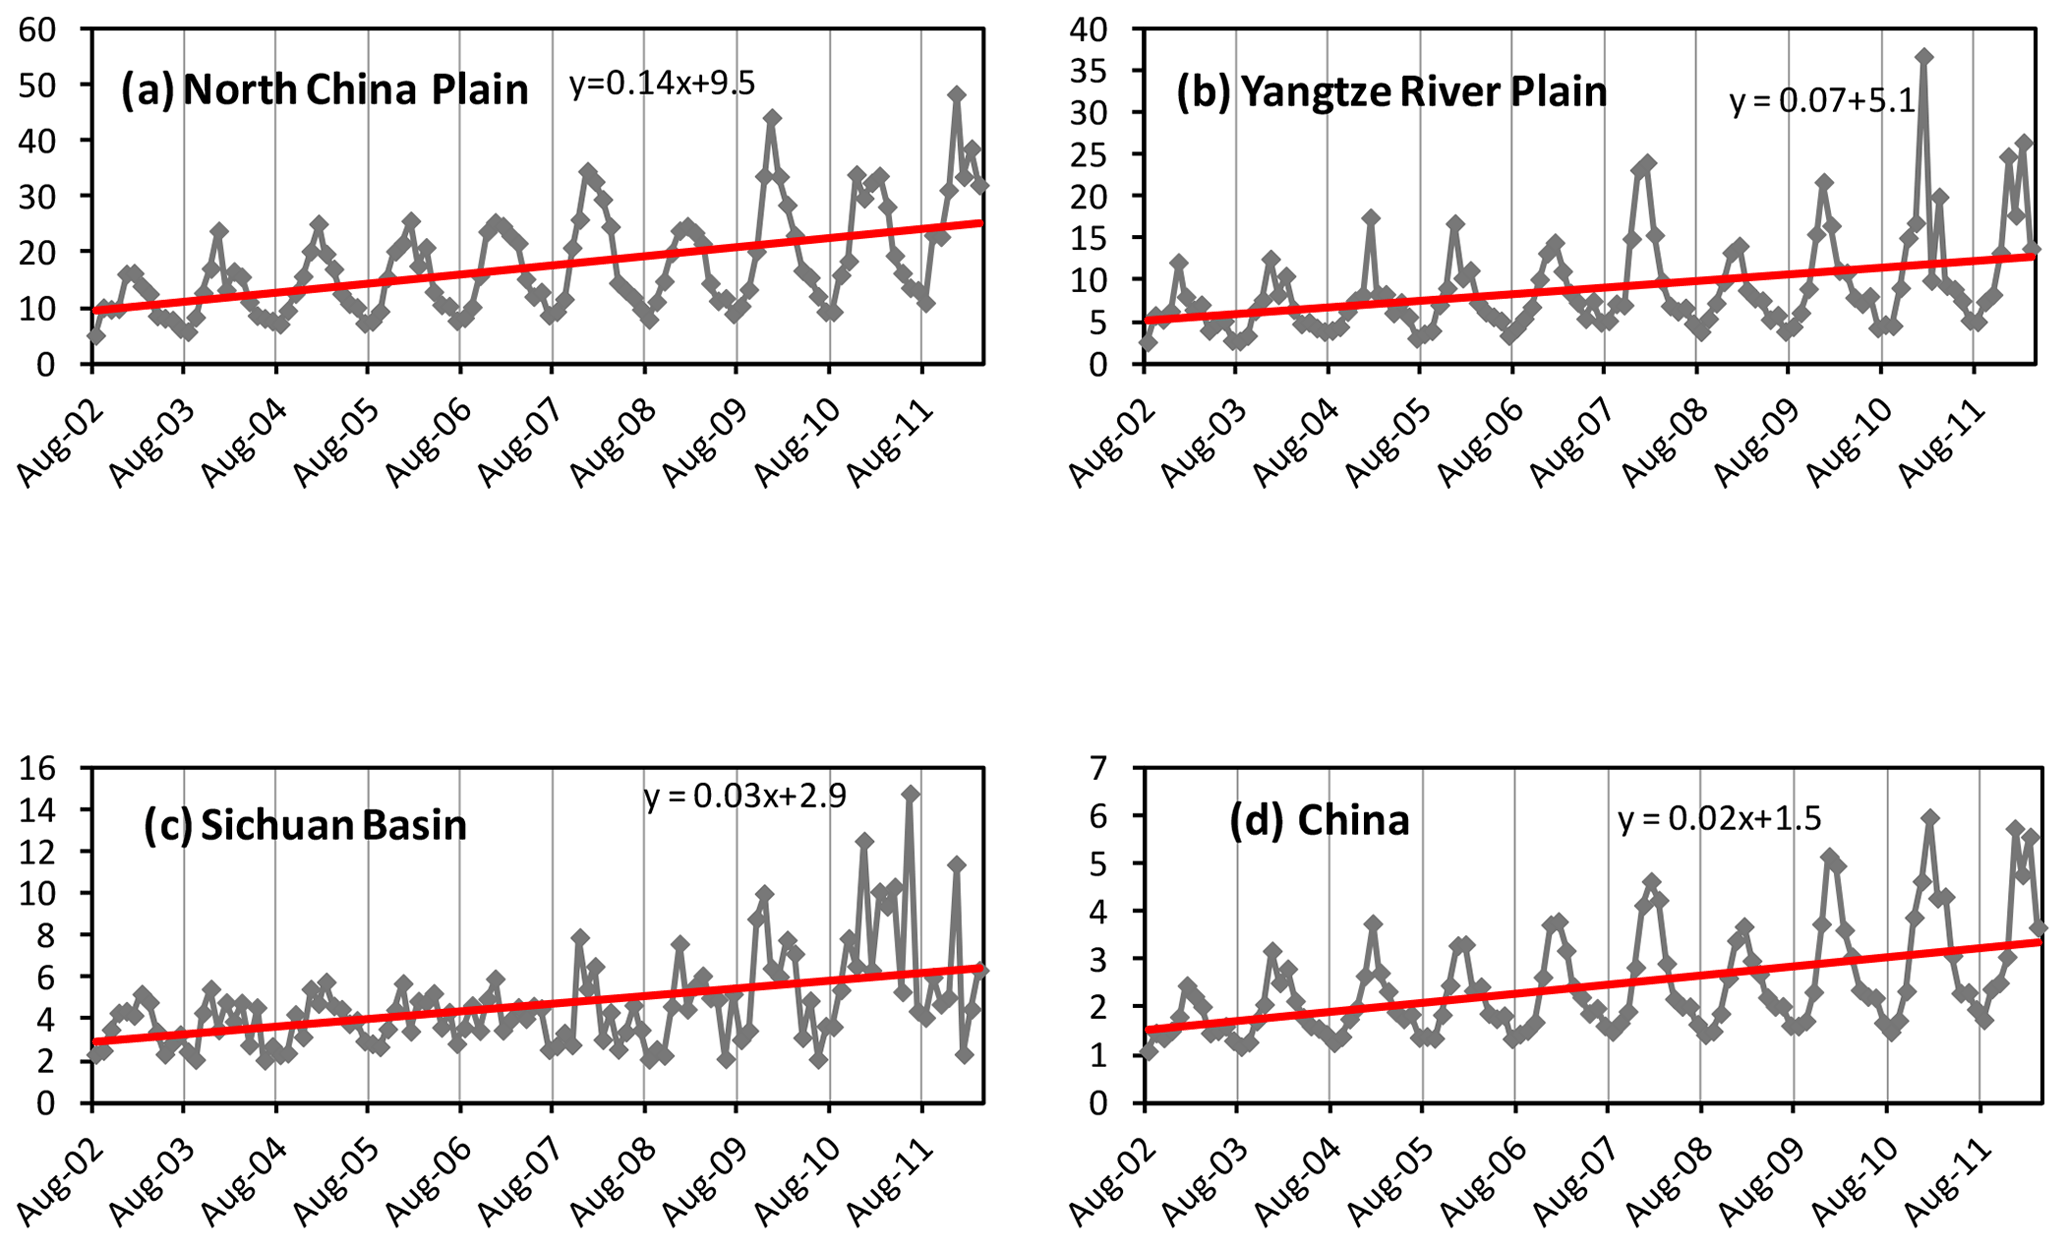
Figure 3Trends of NO2 concentration over China from SCIAMACHY for the years 2002–2012 (1015 mol cm−2).
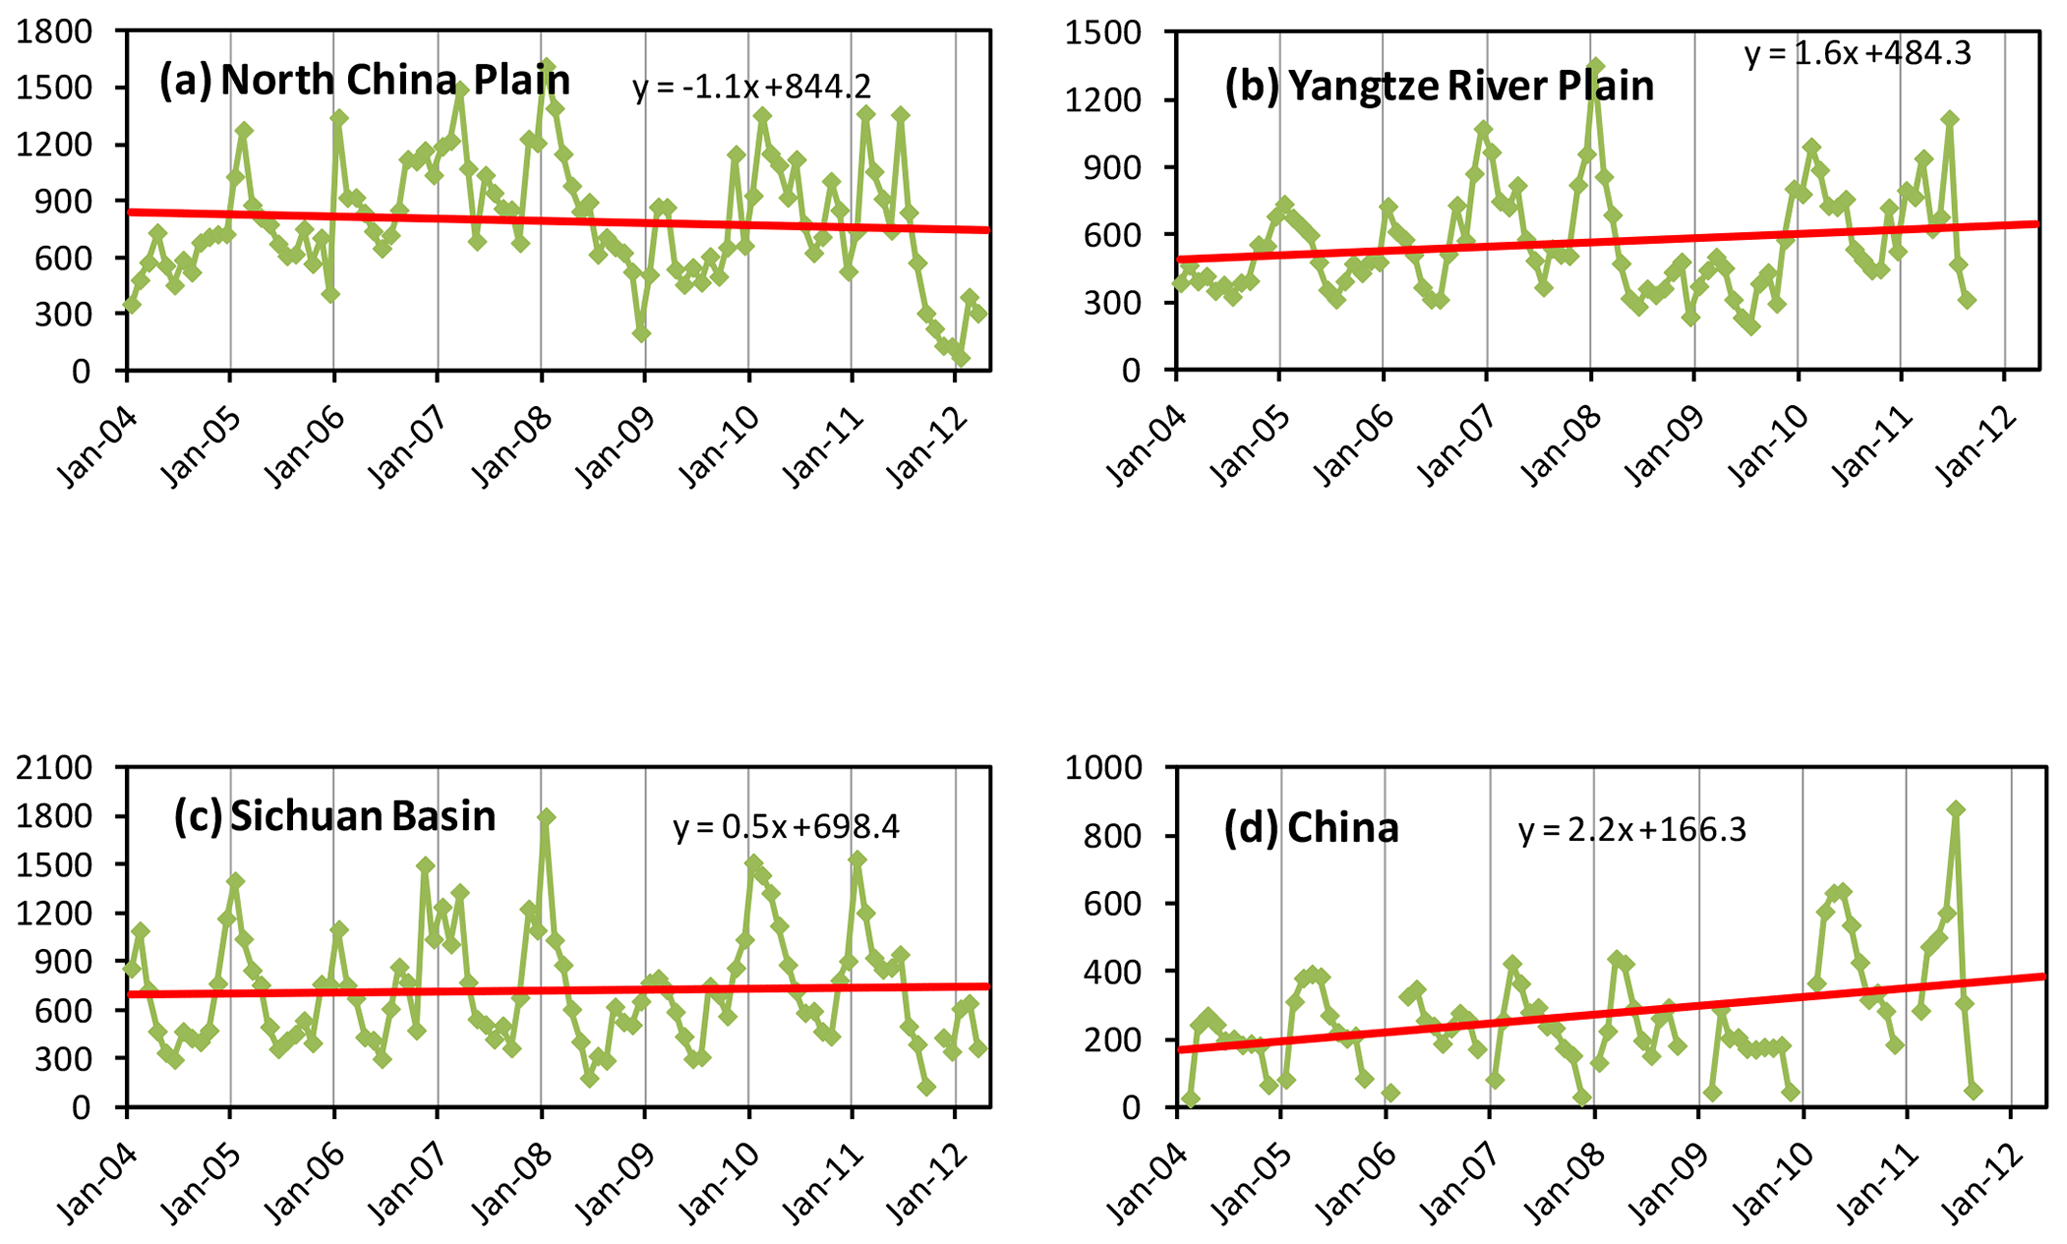
Figure 4Trends of SO2 concentration over China from SCIAMACHY for the years 2004–2012 (1000 × DU, Dobson unit).
To corroborate our results, Yang et al. (2011) showed an increasing fraction of inorganic components by 20 % in Beijing from 1998 to 2008 using in situ offline aerosol chemical composition measurement, especially in summer, while the fractions of hydrophobic components such as organic aerosol and black carbon decreased in the aerosol phase. A study by Boys et al. (2014) revealed that increasing fraction of secondary inorganic aerosol is dominated in the increased mass concentration of PM2.5 in China from 1998 to 2012 using the GEOS-Chem model combined satellite results. By using observed meteorology data sets, Fu et al. (2014) revealed that the number of haze days has significantly increased in the past three decades over the North China Plain due to the increase in hygroscopic inorganic aerosol composition.
3.2 Enhanced emissions of inorganic aerosol precursors
The long-term trends of aerosol precursors and their spatial variability can improve our understanding of the trends in aerosol chemical composition. Figures 3 and 4 show atmospheric column trends of NO2 and SO2 observed from SCIAMACHY. The column NO2 level can be a good proxy for vehicle and coal burning emissions associated with oil and coal consumption (Richter et al., 2005). The column amount of NO2 showed pronounced increasing trends in three regions of China, particularly in northern China with the value of 0.14×10¹⁵ mol cm−2 year−1 from 2002 to 2011. This is probably associated with the increase in power plant and on-road vehicle emissions (Wu et al., 2012; Krotkov et al., 2016). The average NO2 concentration in northern China increased by more than 2-fold, while the Yangtze River Plain region experienced a considerably smaller trend in NO2, with the value of 9.7×10¹⁵ mol cm−2 in 2010 and 6.4×10¹⁵ mol cm−2 in 2002. It is worth noting a decreased trend occurred during the year 2008, which is mainly due to emission reduction during the Olympic Games and economic downturn (Lin and McElroy, 2011). As a whole, the column NO2 concentration in China doubled from 2002 to 2010, with the values of 1.4×10¹⁵ mol cm−2 in 2002 and 2.8×10¹⁵ mol cm−2 in 2010, respectively.

Figure 5Variation of (a) NO2, SO2, (b) chemical composition and (c) mass fraction of organic aerosol, nitrate, sulfate, ammonium and chloride with decreased visibility during the intensive campaign in Beijing.

Figure 6Relationship between RH and volume fractions of (a) ammonium sulfate, (b) ammonium nitrate and (c) organic aerosol.

Figure 7A schematic picture illustrating the process of enhanced emission of inorganic aerosol precursors and formation of inorganic aerosol components, leading to increased hygroscopicity and aerosol water uptake ability, leading to considerable visibility degradation in China. The plus symbols represent the strengthening of a specific process.
Figure 4 depicts the trend in SO2 concentration in four regions of China from 2004 to 2010. The SO2 concentration showed increasing trends in the North China Plain, Sichuan Basin and Yangtze River Plain but increased mostly in China from 2004 to 2012. A decreasing trend was observed during the years 2008 and 2009, especially in the North China Plain. This may be due to a combination of Chinese economic downturn and emission reduction during the Olympic Games (Lin and McElroy, 2011) (Wang et al., 2010). Anyway, as an important aerosol precursor, NO2 showed the most increasing trend in China from 2002 to 2012, consistent with the trend of increased aerosol concentration by modelling result (Xing et al., 2015). Figure S3 shows the annual trends of inorganic aerosol fraction in PM2.5 mass concentration from 1998 to 2012 with the GEOS-Chem model combined with satellite results in China. The results indicate that the North China Plain area suffered the most from heavy pollution, consistent with our surface observations (Xin et al., 2015). Aerosol concentrations have increased considerably from 1980 to 2010. The modelling combined with satellite results by Boys et al. (2014) shows that concurrently the fraction of inorganic aerosol has increased more rapidly. Consequently, the water uptake of the aerosol has increased, leading to reduced visibility as we suggested, which is consistent with ground-based observations (Yang et al., 2011).
3.3 Validation of increased inorganic aerosol components with elevated air pollution level with in situ measurement
To validate our hypothesis that the increased inorganic components contribute to visibility degradation, we used 4 months of aerosol chemical composition and visibility data from urban Beijing from November 2010 to February 2011. As shown in Fig. 5, we divided the visibility values into four bins, which correspond to clean time to heavy pollution time and to conditions in between. The inorganic aerosol precursors of SO2 and NO2 nearly doubled as the visibility decreased from more than 10 km (clean time) to less than 2 km (heavily polluted time). At the same time, the mass concentrations of nitrate, sulfate and ammonium components increased to 13.5, 15.5 and 10.6 µg m−3, respectively. Meanwhile, the mass fraction of these inorganics increased from 11.3 % to 17.3 %, from 13.0 % to 19.9 % and from 9.6 % to 13.6 %, respectively. At the same time, the mass concentration and fraction of organic components changed from 12.2 to 33.4 µg m−3 and 60 % to 46 %, respectively.
We also investigated the relationship between RH and volume fractions of ammonium sulfate, ammonium nitrate and organic aerosols as shown in Fig. 6. The results indicated that ammonium nitrate increased most significantly with elevated RH. On the contrary, ammonium sulfate, as another inorganic compound, showed only a moderate positive correlation with RH and a decrease in the volume fraction was observed in RH values larger than 75 %. This might be associated with liquid-phase oxidation of SO2 under the high-RH condition to sulfate aerosol. Increasing RH may provide more atmospheric oxidants and reaction media for the aqueous-phase oxidation (Zhang et al., 2015). The volume fraction of organic aerosol showed a negative correlation with increasing RH, as presented in Fig. 6c, which was maybe due to a faster increasing volume fraction of inorganic aerosol than organic aerosol.
This direct observation shows that the contribution of inorganic components increased during this campaign. It is plausible that the increased concentrations of SO2 and NO2 are highly associated with this, giving rise to the long-term trends observed in Fig. 2 (Pan et al., 2016; Wang et al., 2014).
Atmospheric pollution and associated haze events have a dramatic effect on climate change, human health and visibility degradation (Ding et al., 2013; Petäjä et al., 2016; Wang et al., 2015; Zhang et al., 2015). Here, long-term visibility measurements combined with satellite data sets, in situ measurements and model results revealed that increased fractions of inorganic aerosol components in the particle matter are crucial in contributing to more haze events from 1980 to 2010. In this way, aerosol hygroscopic growth has occurred in lower relative humidity conditions than before due to more ammonium nitrate aerosol, and the light-scattering ability of atmospheric aerosol was enhanced, as shown in Fig. 7. Another mechanism is that high concentration of NOx can promote the conversion of SO2 to form sulfate aerosol via aqueous-phase oxidation during intensive pollution periods (He et al., 2014; Wang et al., 2016). Considering the vast energy consumption in the future decades and the sources of inorganic components in atmospheric aerosol, we demonstrate that the reduction of nitrate, sulfate, ammonium and their precursors should be continued to obtain better visibility in China.
The meteorology data and visibility data were acquired from the Integrated Surface Dataset (ISD) from the National Oceanic and Atmospheric Administration National Climate Data Center of the USA (https://www.ncdc.noaa.gov/isd, NOAA, 2019). The NO2 and SO2 data from the SCIAMACHY sensor were obtained from http://www.temis.nl (TEMIS, 2019). The aerosol chemical composition data can be acquired by requesting them from the corresponding author.
The supplement related to this article is available online at: https://doi.org/10.5194/acp-19-5881-2019-supplement.
YHW had the original idea. LLW and CSG provided and processed satellite and visibility data. YSW provided measurements of aerosol chemical composition data. YHW, YSW, LLW, TP and MK interpreted the data and wrote the paper. All the authors commented on the paper.
The authors declare that they have no conflict of interest.
This article is part of the special issue “Pan-Eurasian Experiment (PEEX)”. It is not associated with a conference.
We acknowledge Brian Boys and Randall Martin of Dalhousie University for providing GEOS-Chem model results in China. We acknowledge the free use of tropospheric NO2 and SO2 column data from the SCIAMACHY sensor from http://www.temis.nl, last access: 30 April 2019. This work was supported by the Ministry of Science and Technology of China (no. 2017YFC0210000), the National Research Program for key issues in air pollution control (DQGG0101), the National Natural Science Foundation of China (no. 41775162) and Academy of Finland via Center of Excellence in Atmospheric Sciences and the National Natural Science Foundation of China (41605119).
This paper was edited by Dominick Spracklen and reviewed by two anonymous referees.
Boersma, K. F., Eskes, H. J., and Brinksma, E. J.: Error analysis for tropospheric NO 2 retrieval from space , J. Geophys. Res.-Atmos., 109, D04311, doi:10.1029/2003jd003962, 2004.
Boys, B. L., Martin, R., van Donkelaar, A., MacDonell, R., Hsu, C., Cooper, M., Yantosca, R., Lu, Z., G Streets, D., Zhang, Q., and Wang, S.: Fifteen-Year Global Time Series of Satellite-Derived Fine Particulate Matter, Environ. Sci. Technol., 48, 11109–11118, 2014.
DeCarlo, P., Kimmel, J., Trimborn, A., Northway, J. M., Jayne, T. J., Aiken, A., Gonin, M., Fuhrer, K., Horvath, T., Docherty, S. K., Worsnop, R. D., and Jimenez, L. J.: Field-Deployable, High-Resolution, Time-of-Flight Aerosol Mass Spectrometer, Anal. Chem., 78, 8281–8289, 2006.
Ding, A. J., Fu, C. B., Yang, X. Q., Sun, J. N., Petäjä, T., Kerminen, V.-M., Wang, T., Xie, Y., Herrmann, E., Zheng, L. F., Nie, W., Liu, Q., Wei, X. L., and Kulmala, M.: Intense atmospheric pollution modifies weather: a case of mixed biomass burning with fossil fuel combustion pollution in eastern China, Atmos. Chem. Phys., 13, 10545–10554, https://doi.org/10.5194/acp-13-10545-2013, 2013.
Fu, G. Q., Xu, W. Y., Yang, R. F., Li, J. B., and Zhao, C. S.: The distribution and trends of fog and haze in the North China Plain over the past 30 years, Atmos. Chem. Phys., 14, 11949–11958, https://doi.org/10.5194/acp-14-11949-2014, 2014.
Guo, S., Hu, M., Zamora, M. L., Peng, J., Shang, D., Zheng, J., Du, Z., Wu, Z., Shao, M., Zeng, L., Molina, M. J., and Zhang, R.: Elucidating severe urban haze formation in China, P. Natl. Acad. Sci. USA, 111, 17373–17378, 2014.
Hao, J., He, K., Duan, L., Li, J., and Wang, L.: Air pollution and its control in China, Front. Environ. Sci. En., 1, 129–142, 2007.
He, H., Wang, Y., Ma, Q., Ma, J., Chu, B., Ji, D., Tang, G., Liu, C., Zhang, H., and Hao, J.: Mineral dust and NOx promote the conversion of SO2 to sulfate in heavy pollution days, Sci. Rep., 4, 4172, https://doi.org/10.1038/srep04172, 2014.
Huang, R.-J., Zhang, Y., Bozzetti, C., Ho, K. F., Cao, J., Han, Y., Daellenbach, K., G Slowik, J., Platt, S., Canonaco, F., Zotter, P., Wolf, R., Pieber, S., Bruns, E., Crippa, M., Ciarelli, G., Piazzalunga, A., Schwikowski, M., Abbaszade, G., and Prevot, A.: High secondary aerosol contribution to particulate pollution during haze events in China, Nature, 514, 218–222, 2014.
Itahashi, S., Muto, T., Irie, H., Uno, I., and Kurokawa, J.: Turnaround of Tropospheric Nitrogen Dioxide Pollution Trends in China, Japan, and South Korea, Sola, 12, 170–174, doi:10.2151/sola.2016-035, 2016.
Jimenez, J. L., Canagaratna, M. R., Donahue, N. M., Prevot, A. S. H., Zhang, Q., Kroll, J. H., DeCarlo, P. F., Allan, J. D., Coe, H., Ng, N. L., Aiken, A. C., Docherty, K. S., Ulbrich, I. M., Grieshop, A. P., Robinson, A. L., Duplissy, J., Smith, J. D., Wilson, K. R., Lanz, V. A., Hueglin, C., Sun, Y. L., Tian, J., Laaksonen, A., Raatikainen, T., Rautiainen, J., Vaattovaara, P., Ehn, M., Kulmala, M., Tomlinson, J. M., Collins, D. R., Cubison, M. J., Dunlea, J., Huffman, J. A., Onasch, T. B., Alfarra, M. R., Williams, P. I., Bower, K., Kondo, Y., Schneider, J., Drewnick, F., Borrmann, S., Weimer, S., Demerjian, K., Salcedo, D., Cottrell, L., Griffin, R., Takami, A., Miyoshi, T., Hatakeyama, S., Shimono, A., Sun, J. Y., Zhang, Y. M., Dzepina, K., Kimmel, J. R., Sueper, D., Jayne, J. T., Herndon, S. C., Trimborn, A. M., Williams, L. R., Wood, E. C., Middlebrook, A. M., Kolb, C. E., Baltensperger, U., and Worsnop, D. R.: Evolution of Organic Aerosols in the Atmosphere, Science, 326, 1525–1529, 2009.
Krotkov, N. A., McLinden, C. A., Li, C., Lamsal, L. N., Celarier, E. A., Marchenko, S. V., Swartz, W. H., Bucsela, E. J., Joiner, J., Duncan, B. N., Boersma, K. F., Veefkind, J. P., Levelt, P. F., Fioletov, V. E., Dickerson, R. R., He, H., Lu, Z., and Streets, D. G.: Aura OMI observations of regional SO2 and NO2 pollution changes from 2005 to 2015, Atmos. Chem. Phys., 16, 4605–4629, https://doi.org/10.5194/acp-16-4605-2016, 2016.
Kulmala, M.: China's choking cocktail, Nature, 526, 497–499, 2015.
Kulmala, M.: Build a global Earth observatory, Nature, 553, 21–23, 2018.
Kulmala, M., Luoma, K., Virkkula, A., Petäjä, T., Paasonen, P., Kerminen, V.-M., Nie, W., Qi, X., Shen, Y., Chi, X., and Ding, A.: On the mode-segregated aerosol particle number concentration load: contributions of primary and secondary particles in Hyytiälä and Nanjing, Boreal Env. Res., 21, 319–331, 2016.
Lelieveld, J., Evans, J. S., Fnais, M., Giannadaki, D., and Pozzer, A.: The contribution of outdoor air pollution sources to premature mortality on a global scale, Nature, 525, 367–71, 2015.
Lin, J.-T. and McElroy, M. B.: Detection from space of a reduction in anthropogenic emissions of nitrogen oxides during the Chinese economic downturn, Atmos. Chem. Phys., 11, 8171–8188, https://doi.org/10.5194/acp-11-8171-2011, 2011.
NOAA: The meteorology data and visibility data, available at: https://www.ncdc.noaa.gov/isd, last access: 30 April 2019.
Pan, Y., Wang, Y., Zhang, J., Liu, Z., Wang, L., Tian, S., Tang, G., Gao, W., Ji, D., Tao, S., and Wang, Y.: Redefining the importance of nitrate during haze pollution to help optimize an emission control strategy, Atmos. Environ., 141, 197–202, 2016.
Petaja, T., Jarvi, L., Kerminen, V. M., Ding, A. J., Sun, J. N., Nie, W., Kujansuu, J., Virkkula, A., Yang, X. Q., Fu, C. B., Zilitinkevich, S., and Kulmala, M.: Enhanced air pollution via aerosol-boundary layer feedback in Chin, Sci. Rep., 6, 18998, https://doi.org/10.1038/srep18998, 2016.
Richter, A., Burrows, J. P., Nusz, H., Granier, C., and Niemeier, U.: Increase in tropospheric nitrogen dioxide over China observed from space, Nature, 437, 129–132, 2005.
Silver, B., Reddington, C. L., Arnold, S. R., and Spracklen, D. V.: Substantial changes in air pollution across China during 2015–2017, Environ. Res. Lett., 13, 114012, https://doi.org/10.1088/1748-9326/aae718, 2018.
Swietlicki, E., Hansson, H. C., HäMeri, K., Svenningsson, B., Massling, A., McFiggans, G., H. Mcmurry, P., PetäJä, T., Tunved, P., Gysel, M., Do, T., Weingartner, E., Baltensperger, U., Rissler, J., Wiedensohler, A., and Kulmala, M.: Hygroscopic properties of submicrometer atmospheric aerosol particles measured with H-TDMA instruments in various environments – a review, Tellus B, Chem. Phys. Meteorol., 60, 432–469, 2008.
TEMIS: Tropospheric data products, avaiable at: http://www.temis.nl, last access: 30 April 2019.
van Donkelaar, A., Martin Randall, V., Brauer, M., Kahn, R., Levy, R., Verduzco, C., and Villeneuve Paul, J.: Global estimates of ambient fine particulate matter concentrations from satellite-based aerosol optical depth: development and application, Environ, Health Perspect., 118, 847–855, 2010.
Wang, G., Zhang, R., Gomez, M. E., Yang, L., Levy Zamora, M., Hu, M., Lin, Y., Peng, J., Guo, S., Meng, J., Li, J., Cheng, C., Hu, T., Ren, Y., Wang, Y., Gao, J., Cao, J., An, Z., Zhou, W., Li, G., Wang, J., Tian, P., Marrero-Ortiz, W., Secrest, J., Du, Z., Zheng, J., Shang, D., Zeng, L., Shao, M., Wang, W., Huang, Y., Wang, Y., Zhu, Y., Li, Y., Hu, J., Pan, B., Cai, L., Cheng, Y., Ji, Y., Zhang, F., Rosenfeld, D., Liss, P. S., Duce, R. A., Kolb, C. E., and Molina, M. J.: Persistent sulfate formation from London Fog to Chinese haze, P. Natl. Acad. Sci. USA, 113, 13630–13635, 2016.
Wang, S., Zhao, M., Xing, J., Wu, Y., Zhou, Y., Lei, Y., He, K., Fu, L., and Hao, J.: Quantifying the Air Pollutants Emission Reduction during the 2008 Olympic Games in Beijing, Environ. Sci. Technol., 44, 2490–2496, 2010.
Wang, Y., Li, Y., Wang, L., Liu, Z., Ji, D., Tang, G., Zhang, J., Sun, Y., Hu, B., and Xin, J.: Mechanism for the formation of the January 2013 heavy haze pollution episode over central and eastern China, Sci. China Earth Sci., 57, 14–25, 2014.
Wang, Y. H., Liu, Z. R., Zhang, J. K., Hu, B., Ji, D. S., Yu, Y. C., and Wang, Y. S.: Aerosol physicochemical properties and implications for visibility during an intense haze episode during winter in Beijing, Atmos. Chem. Phys., 15, 3205–3215, https://doi.org/10.5194/acp-15-3205-2015, 2015.
Wu, Y., Zhang, S. J., Li, M. L., Ge, Y. S., Shu, J. W., Zhou, Y., Xu, Y. Y., Hu, J. N., Liu, H., Fu, L. X., He, K. B., and Hao, J. M.: The challenge to NOx emission control for heavy-duty diesel vehicles in China, Atmos. Chem. Phys., 12, 9365–9379, https://doi.org/10.5194/acp-12-9365-2012, 2012.
Xin, J., Wang, Y., Pan, Y., Ji, D., Liu, Z., Wen, T., Wang, Y., Li, X., Sun, Y., Sun, J., Wang, P., Wang, G., Wang, X., Cong, Z., Tao, S., Hu, B., Wang, L., Tang, G., Gao, W., and Wang, L.: The Campaign on Atmospheric Aerosol Research Network of China: CARE-China, B. Am. Meteorol. Soc., 96, 1137–1155, 2015.
Xing, J., Mathur, R., Pleim, J., Hogrefe, C., Gan, C.-M., Wong, D. C., Wei, C., Gilliam, R., and Pouliot, G.: Observations and modeling of air quality trends over 1990–2010 across the Northern Hemisphere: China, the United States and Europe, Atmos. Chem. Phys., 15, 2723–2747, https://doi.org/10.5194/acp-15-2723-2015, 2015.
Yang, F., Tan, J., Zhao, Q., Du, Z., He, K., Ma, Y., Duan, F., Chen, G., and Zhao, Q.: Characteristics of PM2.5 speciation in representative megacities and across China, Atmos. Chem. Phys., 11, 5207–5219, https://doi.org/10.5194/acp-11-5207-2011, 2011.
Zhang, J. K., Sun, Y., Liu, Z. R., Ji, D. S., Hu, B., Liu, Q., and Wang, Y. S.: Characterization of submicron aerosols during a month of serious pollution in Beijing, 2013, Atmos. Chem. Phys., 14, 2887–2903, https://doi.org/10.5194/acp-14-2887-2014, 2014.
Zhang, R., Wang, G., Guo, S., Zamora, M. L., Ying, Q., Lin, Y., Wang, W., Hu, M., and Wang, Y.: Formation of urban fine particulate matter, Chem. Rev., 115, 3803–3855, 2015
Zhang, X. Y., Wang, Y. Q., Niu, T., Zhang, X. C., Gong, S. L., Zhang, Y. M., and Sun, J. Y.: Atmospheric aerosol compositions in China: spatial/temporal variability, chemical signature, regional haze distribution and comparisons with global aerosols, Atmos. Chem. Phys., 12, 779–799, https://doi.org/10.5194/acp-12-779-2012, 2012.