the Creative Commons Attribution 4.0 License.
the Creative Commons Attribution 4.0 License.
 | 03 May 2019
Mechanism of ozone loss under enhanced water vapour conditions in the mid-latitude lower stratosphere in summer
Sabine Robrecht
Bärbel Vogel
Jens-Uwe Grooß
Karen Rosenlof
Troy Thornberry
Andrew Rollins
Martina Krämer
Lance Christensen
Rolf Müller
Water vapour convectively injected into the mid-latitude lowermost stratosphere could affect stratospheric ozone. The associated potential ozone loss process requires low temperatures together with elevated water vapour mixing ratios. Since this ozone loss is initiated by heterogeneous chlorine activation on liquid aerosols, an increase in sulfate aerosol surface area due to a volcanic eruption or geoengineering could increase the likelihood of its occurrence. However, the chemical mechanism of this ozone loss process has not yet been analysed in sufficient detail and its sensitivity to various conditions is not yet clear. Under conditions of climate change associated with an increase in greenhouse gases, both a stratospheric cooling and an increase in water vapour convectively injected into the stratosphere are expected. Understanding the influence of low temperatures, elevated water vapour and enhanced sulfate particles on this ozone loss mechanism is a key step in estimating the impact of climate change and potential sulfate geoengineering on mid-latitude ozone.
Here, we analyse the ozone loss mechanism and its sensitivity to various stratospheric conditions in detail. By conducting a box-model study with the Chemical Lagrangian Model of the Stratosphere (CLaMS), chemistry was simulated along a 7 d backward trajectory. This trajectory was calculated neglecting mixing of neighbouring air masses. Chemical simulations were initialized using measurements taken during the Studies of Emissions and Atmospheric Composition, Clouds and Climate Coupling by Regional Surveys (SEAC4RS) aircraft campaign (2013, Texas), which encountered an elevated water vapour mixing ratio of 10.6 ppmv at a pressure level around 100 hPa. We present a detailed analysis of the ozone loss mechanism, including the chlorine activation, chlorine-catalysed ozone loss cycles, maintenance of activated chlorine and the role of active nitrogen oxide radicals (NOx). Focussing on a realistic trajectory in a temperature range from 197 to 202 K, a threshold in water vapour of 10.6 ppmv has to be exceeded and maintained for stratospheric ozone loss to occur. We investigated the sensitivity of the water vapour threshold to temperature, sulfate content, inorganic chlorine (Cly), inorganic nitrogen (NOy) and inorganic bromine (Bry). The water vapour threshold is mainly determined by the temperature and sulfate content. However, the amount of ozone loss depends on Cly, Bry and the duration of the time period over which chlorine activation can be maintained. NOy affects both the potential of ozone formation and the balance between reactions yielding chlorine activation and deactivation, which determines the water vapour threshold. Our results show that in order to deplete ozone, a chlorine activation time of 24 to 36 h for conditions of the water vapour threshold with low temperatures must be maintained. A maximum ozone loss of 9 % was found for a 20 ppmv water vapour mixing ratio using North American Monsoon (NAM) tropopause standard conditions with a chemical box-model simulation along a realistic trajectory. For the same trajectory, using observed conditions (of 10.6 ppmv H2O), the occurrence of simulated ozone loss was dependent on the sulfate amount assumed. Detailed analysis of current and future possibilities is needed to assess whether enhanced water vapour conditions in the summertime mid-latitude lower stratosphere lead to significant ozone loss.
- Article
(4133 KB) - Full-text XML
-
Supplement
(843 KB) - BibTeX
- EndNote


The impact of water vapour convectively injected into the lowermost stratosphere on the mid-latitude ozone layer is a matter of current debate (Anderson et al., 2012, 2017; Ravishankara, 2012; Schwartz et al., 2013). While Anderson et al. (2012) focused on the heterogeneous chemistry of cold liquid sulfate aerosol, earlier studies have focussed on the influence of cirrus clouds on ozone chemistry in the lowermost stratosphere (Borrmann et al., 1996, 1997; Solomon et al., 1997; von Hobe et al., 2011). Anderson et al. (2012) proposed a potential ozone depletion in the mid-latitude stratosphere in summer on liquid sulfate aerosols under conditions of enhanced water vapour and low temperatures. They proposed this chemical ozone loss to be initiated through heterogeneous chlorine activation and to be driven by catalytic ozone loss cycles related to ozone loss known from polar regions in early spring (e.g. Grooß et al., 2011; Solomon, 1999; Vogel et al., 2011). Here, we present a detailed analysis of this ozone loss mechanism and an extensive investigation of its sensitivity to a variety of conditions.
In the bulk and on the surface of cold condensed stratospheric particles, such as binary H2SO4∕H2O solutions, ternary solutions, NAT (nitric acid trihydrate) and ice particles (e.g. Spang et al., 2018), inactive chlorine species (HCl, ClONO2) can be converted to active chlorine (ClOx = ) through the heterogeneous Reactions (R1), (R2) and (R3) (Solomon et al., 1986; Prather, 1992; Crutzen et al., 1992) and the subsequent photolysis of Cl2 and HOCl.
The heterogeneous Reactions (R1) and (R2) drive the conversion of active nitrogen oxides (NOx = ) into HNO3. After chlorine activation, catalytic ozone loss cycles can occur, such as the ClO–dimer cycle (Molina and Molina, 1987) and the ClO–BrO cycle (McElroy et al., 1986). These cycles are responsible for the rapid ozone loss observed in Antarctic spring (e.g. Solomon, 1999). A third cycle with ClO and HO2 (see Sect. 3) proposed by Solomon et al. (1986) would be expected to play a role in ozone loss in the mid-latitude lower stratosphere (e.g. Daniel et al., 1999; Ward and Rowley, 2016). This cycle was originally proposed as an ozone-depleting cycle in the Antarctic lower stratosphere, but for polar ozone destruction, this cycle turned out to be of minor importance (Solomon, 1999).
Under the very dry conditions in the polar stratosphere, very low temperatures (below ∼195 K) are required for heterogeneous chlorine activation through Reactions (R1)–(R3) (Solomon, 1999; Shi et al., 2001). An enhancement of water vapour above background values would allow chlorine activation at higher temperatures (200–205 K) (Drdla and Müller, 2012), which led to the hypothesis that chlorine activation and subsequent ozone loss could occur at mid-latitudes in summer in the lowermost stratosphere (Anderson et al., 2012, 2017; Anderson and Clapp, 2018). The aim of our study is to investigate, for a variety of conditions, how much water vapour has to be enhanced for chlorine activation to occur at these higher temperatures.
An enhanced stratospheric sulfate aerosol content increases heterogeneous chlorine activation by increasing the surface area of the condensed particles (Drdla and Müller, 2012; Solomon, 1999). As an example, the aerosol surface area density in the lower stratosphere ranges between ∼0.5 and 1.5 µm2 cm−3 under non-volcanic conditions (Thomason and Peter, 2006), while the perturbation of Mt. Pinatubo yielded peak values of more than 40 µm2 cm−3 (Thomason et al., 1997). In the stratosphere, water vapour increases with altitude, primarily due to methane oxidation (LeTexier et al., 1988; Rohs et al., 2006). The upper branch of the Brewer–Dobson circulation (BDC) transports higher stratospheric water vapour mixing ratios down to lower altitudes at mid-latitudes to high latitudes, and this air mixes with the low water vapour containing air from the tropics that has moved poleward in the lower branch of the BDC (e.g. Brewer, 1949; Randel et al., 2004; Poshyvailo et al., 2018), giving typical mid-latitude lowermost stratosphere values of 2–6 ppmv H2O.
However, above North America in summer, enhanced water vapour mixing ratios of 10–18 ppmv at an altitude of ∼16.5 km (380 K potential temperature, ∼100 hPa) (Smith et al., 2017) have been observed, which were connected with deep convective storm systems penetrating the tropopause (Homeyer et al., 2014; Herman et al., 2017; Smith et al., 2017). These convective overshooting events can transport ice crystals into the lowermost stratosphere, where the ice evaporates leading to a local enhancement of water vapour (Hanisco et al., 2007; Schiller et al., 2009; Herman et al., 2017). As greenhouse gases increase in the atmosphere, models predict that more water may be convectively transported into the stratosphere (Trapp et al., 2009; Klooster and Roebber, 2009). This increases the probability that the ozone loss process proposed by Anderson et al. (2012) will occur, especially in the case of an additional enhancement of stratospheric sulfate particles caused by volcanic eruptions or sulfate geoengineering. The occurrence of this ozone loss process requires halogens to be present, which are decreasing in the stratosphere due to the Montreal Protocol and its amendments and adjustments (WMO, 2018). However, for assessing the impact of geoengineering on the ozone layer, the impact of very short-lived halogens also needs to be taken into account (Tilmes et al., 2012). For estimating the impact of both climate change and a possible sulfate geoengineering on the mid-latitude ozone layer, it is necessary to consider the influence of enhanced water vapour and sulfate content on mid-latitude ozone chemistry in the lowermost stratosphere in detail.
In the study by Anderson et al. (2012), a range of initial mixing ratios for HCl and ClONO2 with rather high concentrations of 850 pptv HCl and 150 pptv ClONO2 was assumed. Here, we investigate ozone loss in mid-latitude summer based on measurements from flights by the NASA ER-2 aircraft during the Studies of Emissions and Atmospheric Composition, Clouds and Climate Coupling by Regional Surveys (SEAC4RS) campaign, which was based in Houston, Texas, in 2013 (Toon et al., 2016). Conducting box-model simulations with the Chemical Lagrangian Model of the Stratosphere (CLaMS; McKenna et al., 2002a, b), the ozone loss mechanism is analysed in greater detail. The model set-up is described in Sect. 2. In Sect. 3, the chlorine activation step, catalytic ozone loss cycles and the maintenance of activated chlorine levels in the mid-latitude stratosphere are investigated in detail. The sensitivity of this mechanism to water vapour, sulfate content, temperature, Cly mixing ratio (Cly = ), reactive nitrogen (NOy = NOx+HNO3) and inorganic bromine (Bry) is explored in Sect. 4. Case studies, which extend the simulated time period and assume conditions based on SEAC4RS measurements as well as conditions used in the study of Anderson et al. (2012), further illustrate these sensitivities in Sect. 5.
The simulations presented here were performed with the box-model version of CLaMS (McKenna et al., 2002a, b). Stratospheric chemistry is simulated based on a set-up used in previous studies (Grooß et al., 2011; Müller et al., 2018; Zafar et al., 2018) for single air parcels along trajectories including diabatic descent and neglecting mixing between neighbouring air masses. A full chemical reaction scheme comprising gas phase and heterogeneous chemistry is applied using the SVODE solver (Brown et al., 1989). Chemical reaction kinetics are taken from Sander et al. (2011), photolysis rates are calculated for spherical geometry (Becker et al., 2000), and heterogeneous reaction rates for Reactions (R1)–(R3) were calculated based on the study of Shi et al. (2001). For heterogeneous particle formation, the initial liquid aerosol number density (N0=10.0 cm−3), the standard deviation of the logarithmic normal distribution of the particle size (σ=1.8), and the gas phase equivalent of the amount of sulfuric acid in the aerosol (for chosen values see Table 1) are set prior to the simulation. The gas phase equivalent is used to calculate the density of liquid particles as described in the study of Shi et al. (2001) (binary solutions) and Luo et al. (1996) (ternary solutions). Particle size and surface area density are calculated based on the density of liquid particles, the aerosol number density, and the standard deviation. In contrast to the set-ups in Grooß et al. (2011), Müller et al. (2018) and Zafar et al. (2018), only formation of liquid particles (both binary H2O∕H2SO4 and ternary solutions) is allowed (i.e. no NAT or ice particles are formed in this model set-up) to enable a better comparability with the studies of Anderson et al. (2012, 2017) and Anderson and Clapp (2018). Note that this is also different from the study of Borrmann et al. (1996, 1997), who investigated lowermost stratospheric ozone chemistry on cirrus clouds.
2.1 Measurements
The box model simulations were initialized using water vapour, ozone and CH4 measurements taken during the SEAC4RS aircraft campaign (more information on the chemical initialization is provided in Sect. 2.3). It was based in Houston, Texas, and took place during August and September 2013 (Toon et al., 2016). One aim of this campaign was to investigate the impact of deep convective clouds on the water vapour content and the chemistry in the lowermost stratosphere. We initialized the model using measurements taken on 8 August 2013 by the Harvard Lyman-α photofragment fluorescence hygrometer (HWV, Weinstock et al., 2009), which flew on the NASA ER-2 high altitude research aircraft. Ozone was initialized in our simulations using O3 measurements from the National Oceanic and Atmospheric Administration (NOAA) UAS O3 instrument (Gao et al., 2012). Initial Cly and NOy were determined using tracer–tracer correlations (for more information see Sect. 2.3) based on methane measurements with the Harvard University Picarro Cavity Ring down Spectrometer (HUPCRS) (Werner et al., 2017).
2.2 Trajectories
Diabatic trajectories were calculated using wind and temperature data from the ERA-Interim reanalysis (Dee et al., 2011) with resolution provided by the European Centre for Medium-Range Weather Forecasts (ECMWF). The vertical velocities were calculated from the total diabatic heating rates derived from ERA-Interim data (Ploeger et al., 2010). Trajectories (7 d forward and backward) were initialized during SEAC4RS at locations where stratospheric water vapour was over 10 ppmv.
A selected example of calculated trajectories is shown in Fig. 1. This trajectory was chosen for the chemical analysis, because its initial conditions exhibited enhanced water vapour relative to the overall background, low temperatures and enhanced Cly (higher than for comparable water vapour and temperature conditions). Cly was calculated from tracer–tracer correlations (see Sect. 2.3). This trajectory is then most suitable for the occurrence of the mechanism proposed by Anderson et al. (2012). In Fig. 1a, a backward trajectory is presented in the range of −7 to 0 d from the time of measurement (red line) and a forward trajectory in the range from 0 to 7 d. In Fig. 1b and c, the location of the measurement is shown by a red square.
The trajectories shown (Fig. 1, a forward and a backward trajectory) are based on measurements on 8 August 2013 during the SEAC4RS campaign. With a potential temperature of 380 to 390 K, these trajectories are above the tropopause of ∼366 K (Fig. 1a, grey line), deduced from the temperature profile measured during the flight. Both the forward and backward trajectories stay in the region of the North American continent.
For the SEAC4RS campaign, the temperature range of the backward trajectory varies between 197 and 202 K and the forward trajectory exhibits increasing temperatures. In addition, we considered trajectories based on other SEAC4RS measurements with enhanced water vapour; however, most of them exhibit higher mean temperatures of at least 200 K. Since low temperatures are expected to push stratospheric ozone depletion in mid-latitudes (Anderson et al., 2012) due to faster heterogeneous chemical reactions and thus faster chlorine activation, the SEAC4RS backward trajectory (Fig. 1, day −7 to 0) is selected here as the standard trajectory. This trajectory is used to analyse the chemical mechanisms affecting lower stratospheric ozone under various water vapour conditions, and to explore the sensitivity of these processes to different initial conditions.
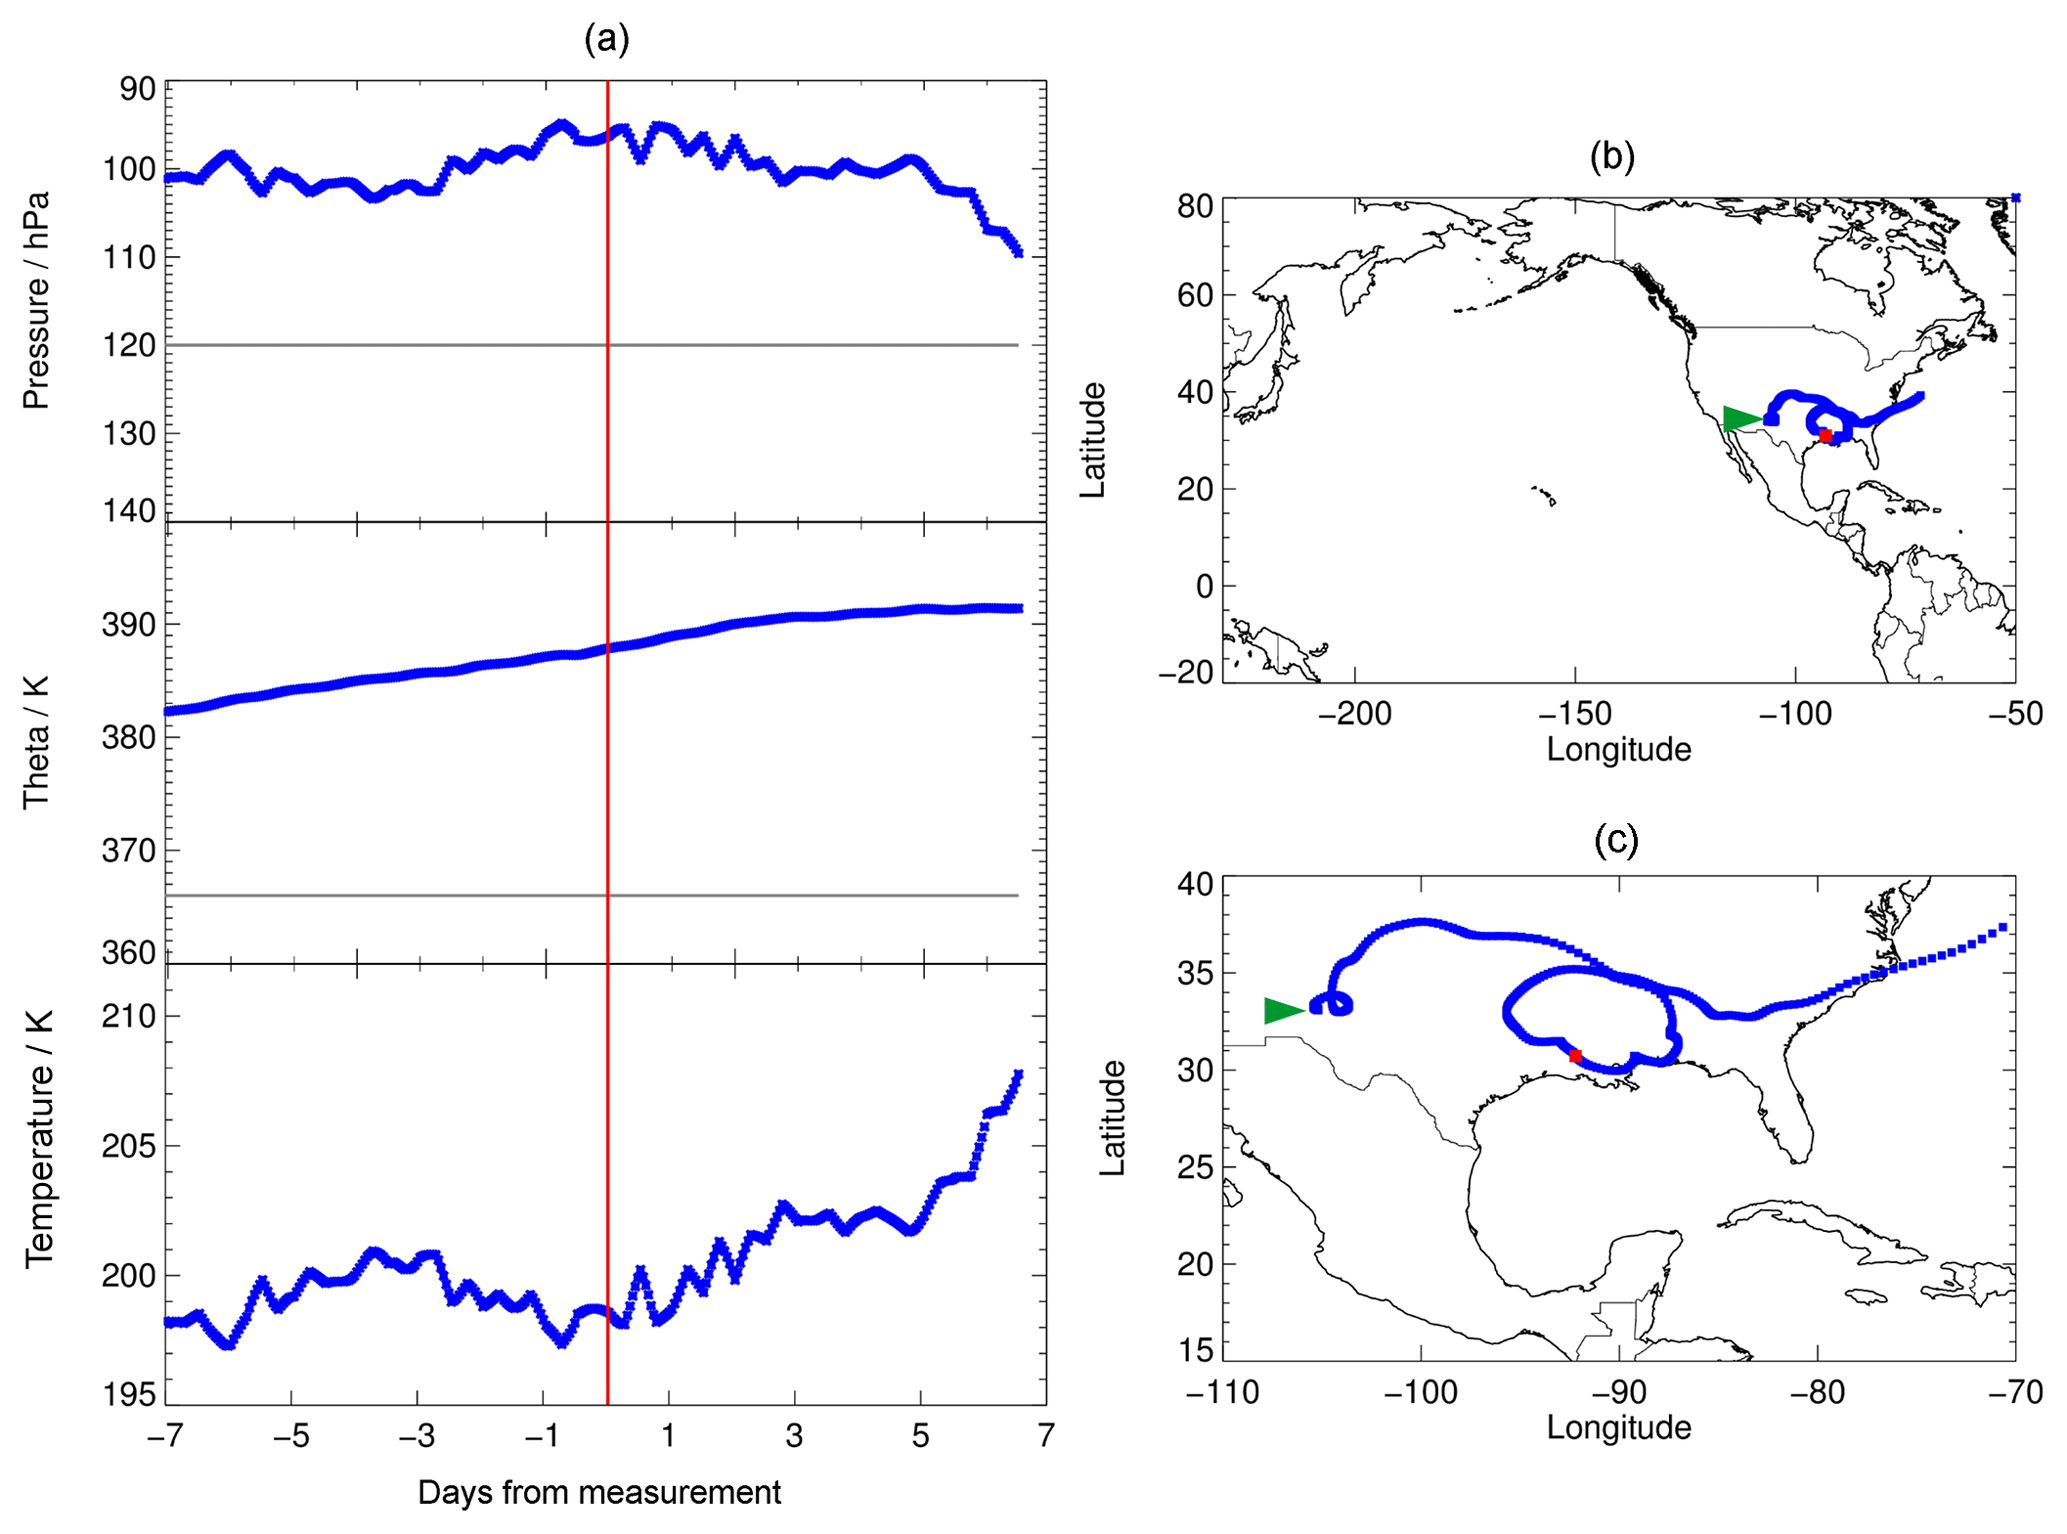
Figure 1Pressure, potential temperature, temperature and location of the selected 7 d trajectories (forward and backward) calculated based on measurements with enhanced water vapour during the SEAC4RS aircraft campaign. In (a), the grey line marks the approximate tropopause altitude, deduced from the temperature profile measured during the flight. The red line in (a) marks the time of measurement and red squares in (b, c) mark the location of the measurement. Panel (c) exhibits a close-up of (b) and the beginning of the backward trajectory (1 August) is marked by a green arrow.
2.3 Initialization
Important trace gases for ozone chemistry – O3, Cly and NOy – are initialized based on measurements during the SEAC4RS aircraft campaign over North America (see Sect. 2.1). Ozone and water vapour were measured directly during the aircraft campaign, and Cly and NOy are inferred from tracer–tracer correlations using CH4 measured on the aircraft employed. The initialization of all further trace gases except for water vapour were taken from the full chemistry 3D-CLaMS simulation (Vogel et al., 2015, 2016) for summer 2012 at the location of the measurement. Chemistry was initialized 7 d before the measurement. However, this time shift does not affect the sensitivities and the mechanism investigated here, because the trace gases Cly and NOy were initialized based on measured CH4 mixing ratios, which do not change significantly during a 7 d box-model simulation.
2.3.1 Standard case
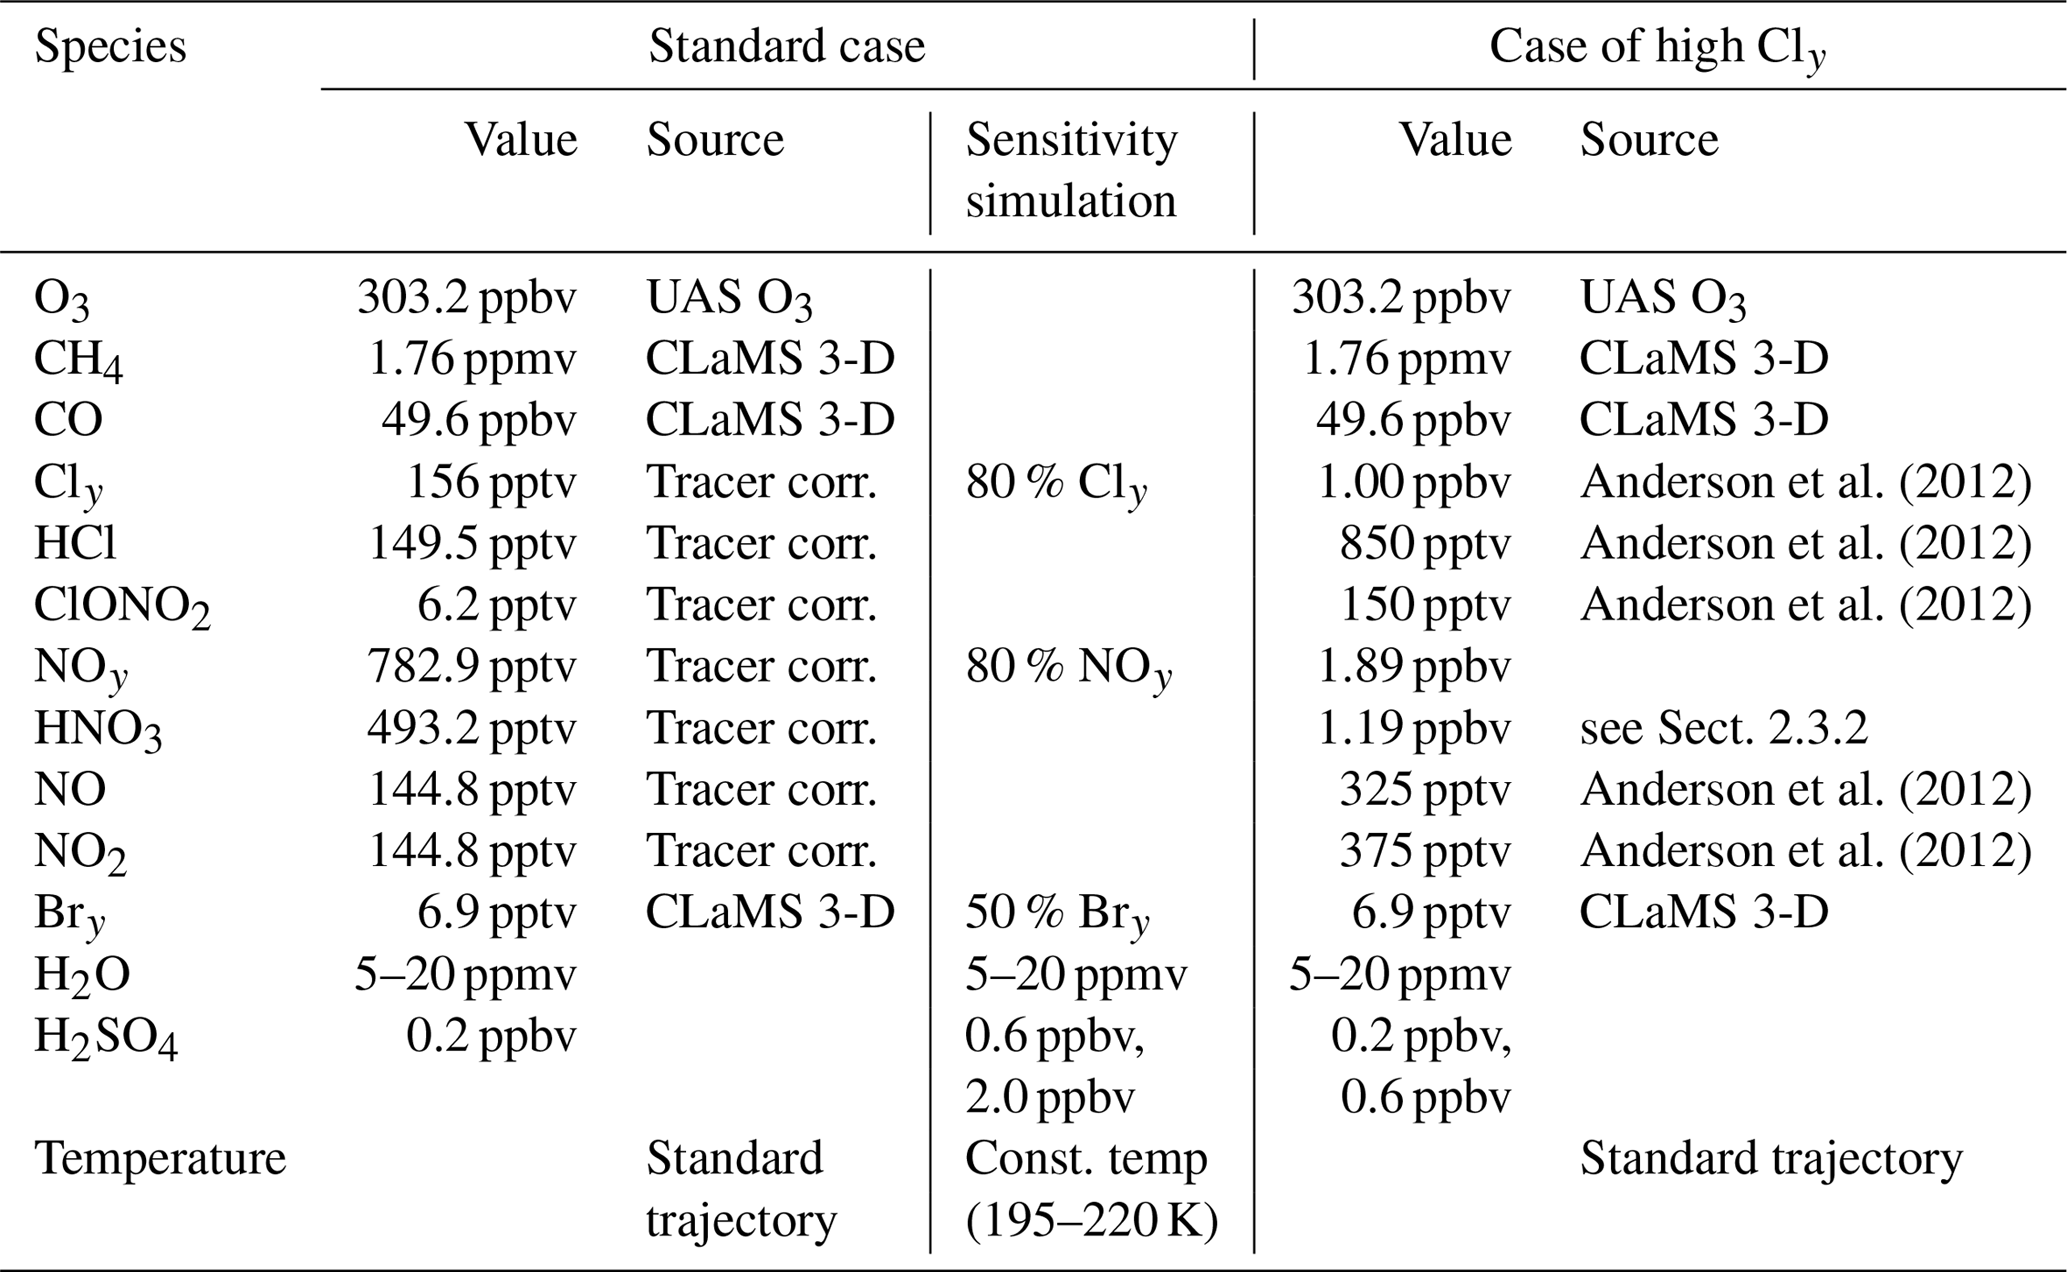
In the standard case, the initial values of O3, Cly and NOy are determined based on an observation with an enhanced water vapour content of 10.6 ppmv (measured by the HWV instrument) from the SEAC4RS (Toon et al., 2016) aircraft campaign. A gas phase equivalent mixing ratio for background sulfuric acid (H2SO4) of 0.20 ppbv is assumed. Initial CO (49.6 ppbv) is taken from the 3D-CLaMS simulation (Vogel et al., 2015), which is higher than the measured value of 34.74 ppbv (measured by the HUPCRS instrument). Simulations assuming the measured CO mixing ratio showed only a minor difference to the results presented here. The initial values for the main trace gases for the standard case are summarized in Table 1. Note that in the 3D-CLaMS simulation, the mixing ratios of HCl (131 ppt, CLaMS), O3 (206 ppb, CLaMS) and HNO3 (354 ppt, CLaMS) at the location of the SEAC4RS measurement are lower than in the standard initialization (see Table 1).
Since Cly and NOy were not measured during the SEAC4RS ER-2 flights in the lowermost stratosphere, values for Cly and NOy are calculated through tracer–tracer correlations (Grooß et al., 2014; see Appendix C for equations) based on a SEAC4RS CH4 measurement (of 1.776 ppmv) on 8 August 2013.
The Cly−CH4 correlation was calculated from measurements of the Airborne Chromatograph for Atmospheric Trace Species (ACATS) during flights of the ER-2 aircraft and from measurements by the cryogenic whole air sampler of Goethe University Frankfurt (on board the TRIPLE balloon gondola) during balloon flights at mid-latitudes and high latitudes in the year 2000 (Grooß et al., 2002). Between the year 2000 and 2013 stratospheric CH4 increased and Cly decreased. Hence, the change in both lowermost stratospheric CH4 and Cly has to be taken into account when using this tracer–tracer correlation. The increase in CH4 was estimated to be equivalent to the growth rate for tropospheric CH4. This growth rate was calculated to be 45.8 ppbv from the year 2000 to 2013 by determining and adding every annual mean of the tropospheric CH4 growth rate given in GHG Bulletin (2014). Subtracting this increase in CH4 from the measured CH4 mixing ratio yields an CH4 equivalent for the year 2000. From the CH4 equivalent, an equivalent Cly mixing ratio for the year 2000 was calculated using the tracer–tracer correlation (Grooß et al., 2014). The annual decrease in Cly is assumed to be 0.8 % (WMO, 2014) from the year 2000 to 2013, and thus the initial Cly is calculated to be 156 ppt. Since most Cly is deactivated in the mid-latitude lowermost stratosphere, the initial mixing ratio of ClOx species is assumed to be zero. A simulation assuming a ClO mixing ratio of 1 % of total Cly does not yield a significant difference to our standard case.
Initial NOy was calculated through an N2O correlation. Since no N2O was measured on the ER-2 flights during SEAC4RS, stratospheric N2O was first estimated through a methane correlation (Grooß et al., 2002), which is based on measurements from the year 2000. Hence, the equivalent CH4 mixing ratio for the year 2000 (see above) was used to calculate an N2O equivalent. Considering an estimated increase in N2O of 10.4 ppbv from 2000 to 2013, which was determined in the same way as the CH4 change (GHG Bulletin, 2014), the N2O mixing ratio related to the time of the measurement in 2013 was calculated. Afterwards NOy is calculated with a correlation from Grooß et al. (2014) to be 782.9 ppt.
This standard case initialization is shown in Table 1. Because of the uncertain conditions in convective overshooting plumes, sensitivity box-model simulations are conducted. Furthermore, testing the impact of various parameters on chemical ozone loss is intended to yield a better understanding of the balance between stratospheric ozone production and ozone loss, which is a key aspect for potential mid-latitude ozone depletion. The assumed water vapour content in a simulation is varied from 5 to 20 ppmv. In addition, simulations assuming the same water vapour range and a constant temperature in a range from 195 to 220 K are conducted assuming sulfate background conditions with a gas phase equivalent of 0.20 ppbv and 10× enhanced sulfate (2.00 ppbv) for illustrating the dependence of ozone loss on water vapour and temperature. Furthermore, sensitivity simulations are conducted, assuming 80 % Cly, 80 % NOy or 50 % Bry, and a standard case simulation along a 19 d trajectory is calculated.
Anderson et al. (2012)Anderson et al. (2012)Anderson et al. (2012)Anderson et al. (2012)Anderson et al. (2012)Table 1Mixing ratios and sources used for initialization of relevant trace gases. The standard initialization is based on SEAC4RS measurements. Cly and NOy values were determined based on tracer–tracer correlations (see Sect. 2.3.1). The high Cly case is based on Fig. 2 from Anderson et al. (2012). Initial mixing ratios of ClOx species were assumed to be zero for all cases.
2.3.2 Case of high Cly
Simulations conducted assuming high Cly and NOy concentrations taken from Fig. 2 in Anderson et al. (2012) are referred to as the “case of high Cly”, which constitutes a worst-case scenario. In the case of high Cly, HNO3 is determined as 1.19 ppbv assuming the same ratio for HNO3 (63 % of total NOy) and NO+NO2 (37 % of total NOy) as in the standard case. An overview of the important trace gases in the initialization is given in Table 1. The results of the case initialized with high Cly are compared with the results obtained from standard case simulations.
Mid-latitude ozone chemistry in the lowermost stratosphere depends on water vapour abundance and temperature. This study focuses on the water vapour dependence of stratospheric ozone chemistry by analysing chemical processes occurring in a box-model simulation along a realistic trajectory in the temperature range from 197 to 202 K under several water vapour conditions. In Fig. 2, the mixing ratio of ozone, ClOx and NOx is shown for two simulations assuming 5 ppmv (dashed line) and 15 ppmv (solid line) H2O. These water vapour mixing ratios are chosen, because they are clearly in the regime of the low water vapour background (5 ppmv) of the lower mid-latitude stratosphere and of enhanced water vapour (15 ppmv) as it can be reached through convective overshooting events. For the low water vapour (5 ppmv) case, net ozone formation occurs, the ClOx mixing ratio remains low and the NOx mixing ratio high. In contrast, assuming a water vapour mixing ratio of 15 ppmv, ozone depletion occurs, accompanied by a decrease in NOx and coupled with chlorine activation as indicated by the increasing ClOx mixing ratio.
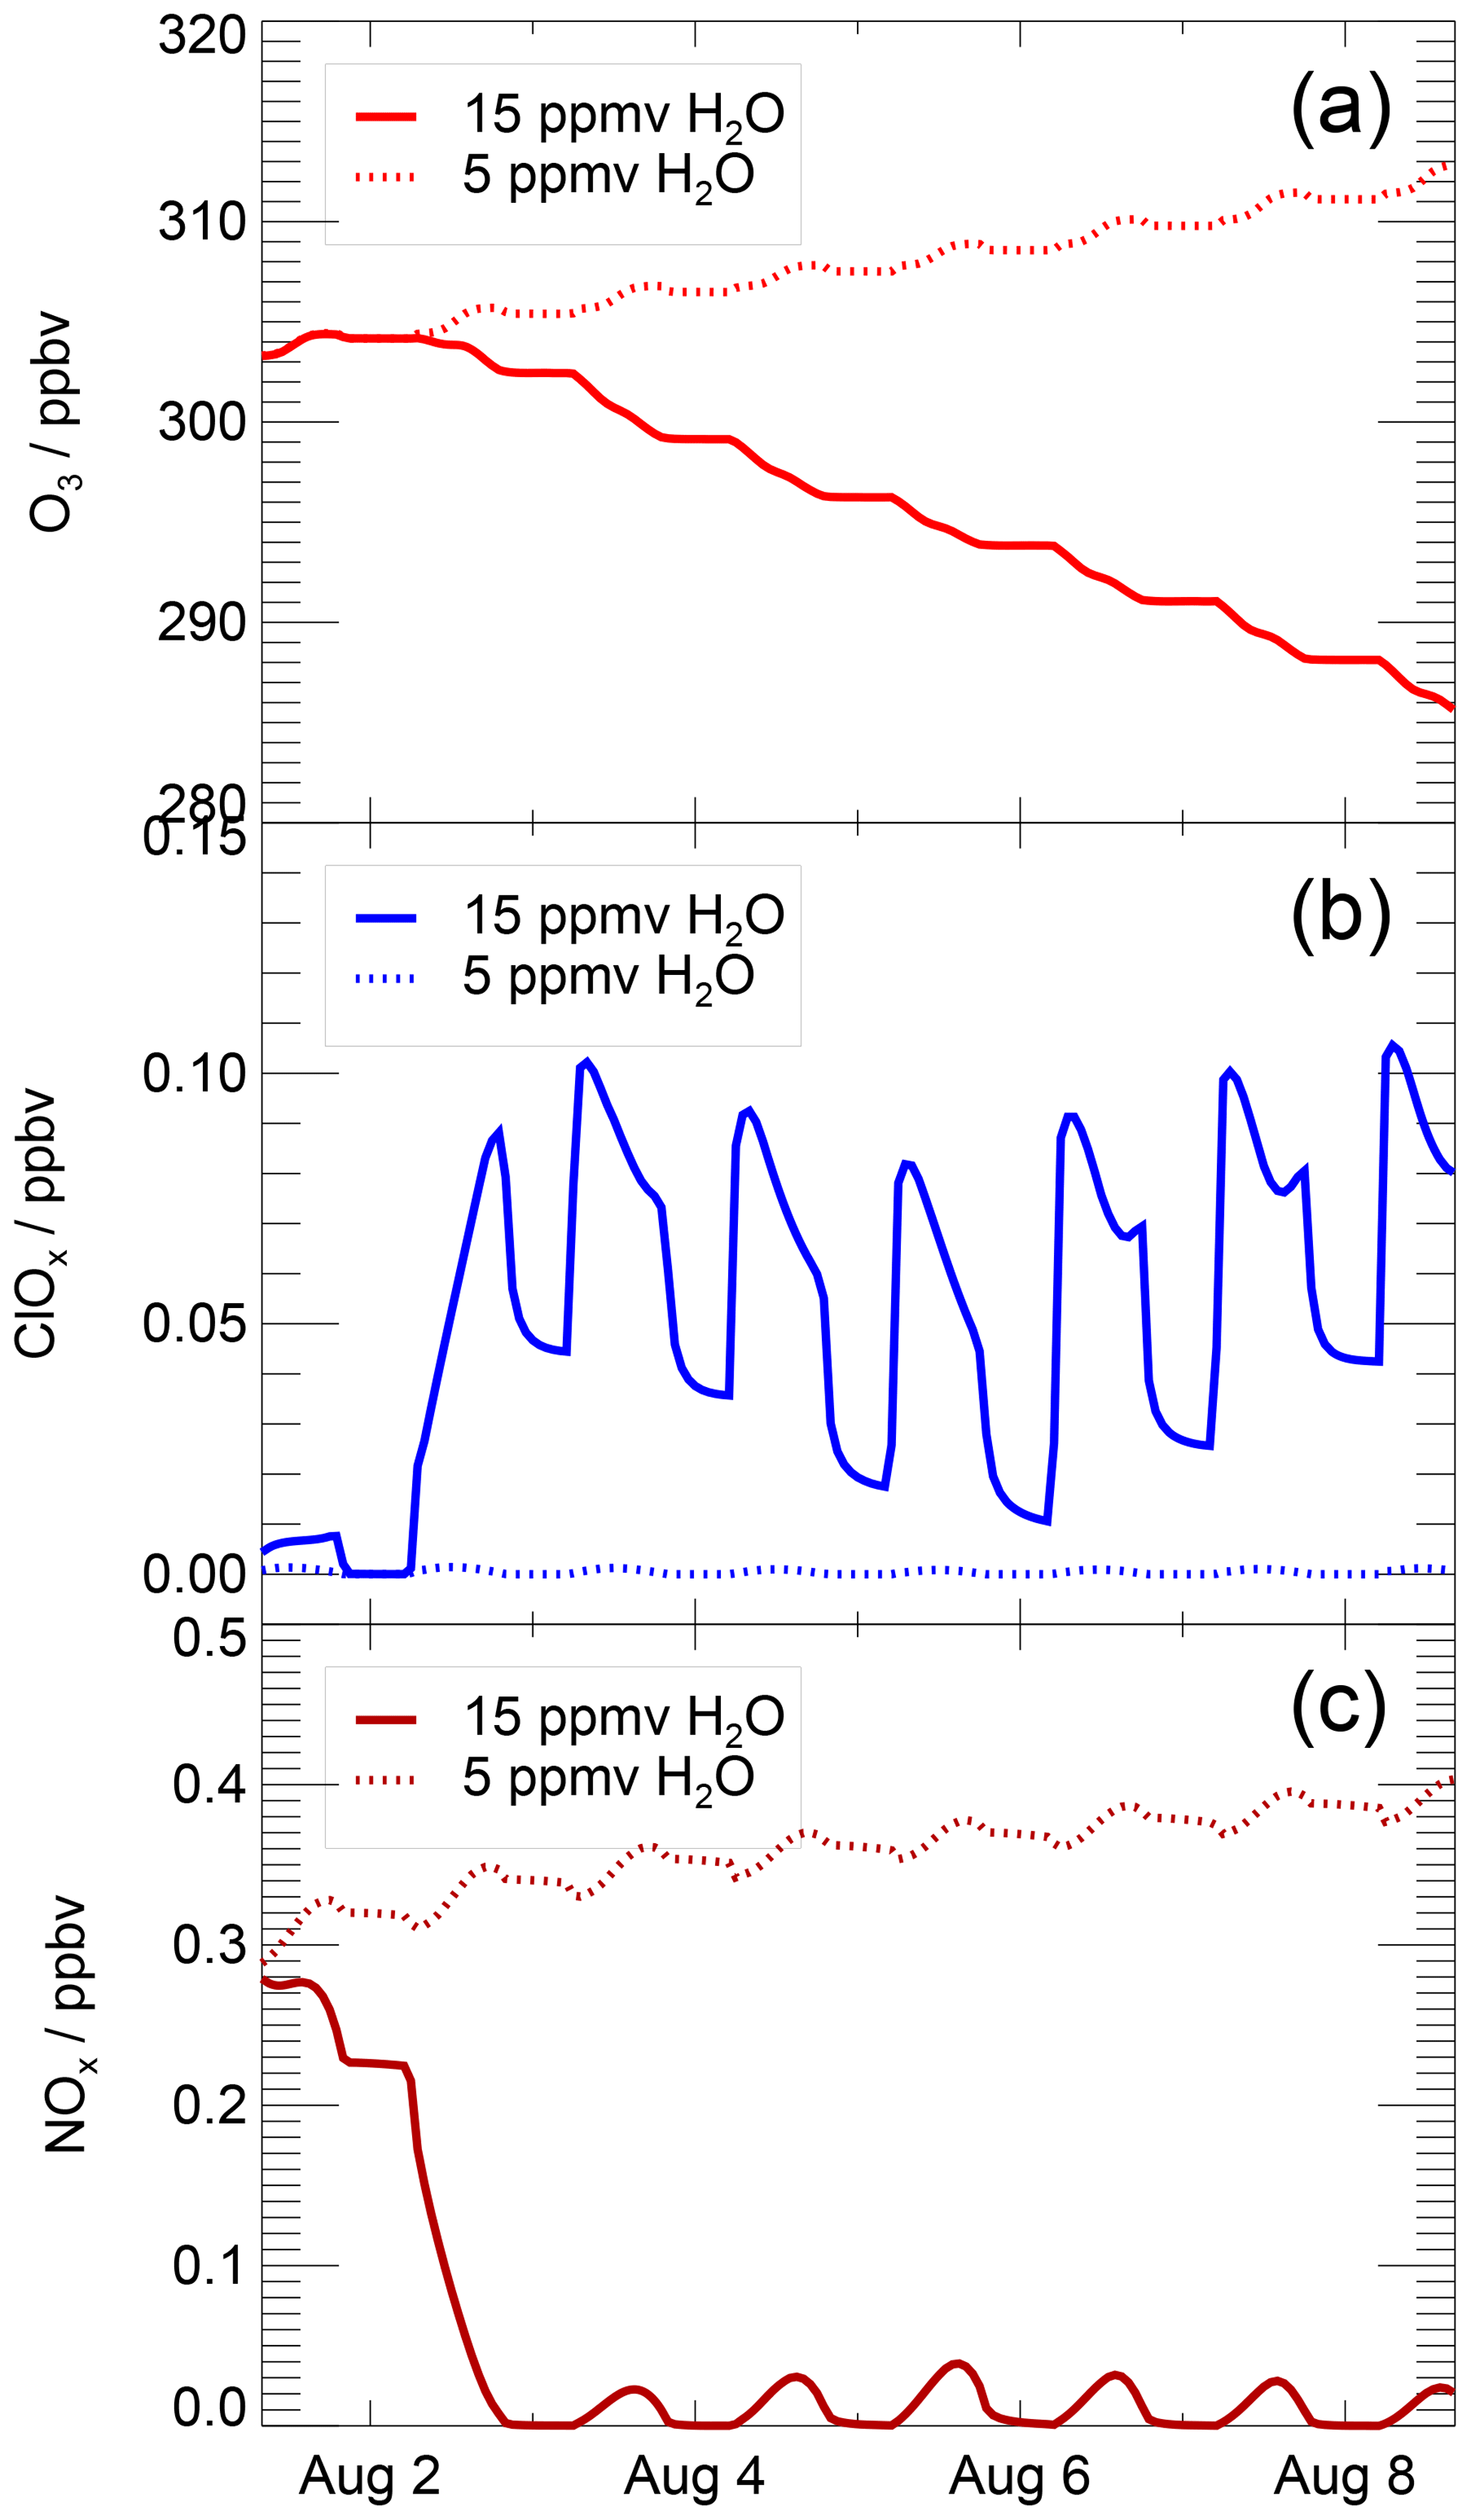
Figure 2Volume mixing ratio of O3 (a), ClOx (b) and NOx (c) during a simulation with 15 ppmv H2O and 5 ppmv H2O. These water vapour mixing ratios are chosen because they are clearly in the regime of low (5 ppmv) and elevated (15 ppmv) water vapour. The x axis marks refer to 00:00 local time (06:00 UTC).
The sensitivity of stratospheric ozone to variations in water vapour conditions is tested here by conducting simulations with standard conditions but varying the assumed water vapour mixing ratio from 5 to 20 ppmv in varying increments, with the resolution increased near the changeover from ozone production to destruction.
In Fig. 3, the ozone values reached at the end of the 7 d simulation (final ozone, blue squares) are plotted as a function of the assumed water vapour mixing ratio. The initial ozone value, of 303.2 ppbv, is shown by the grey line. Blue squares lying above that line are cases with ozone production, and those lying below that line are cases with ozone destruction. The decrease in final ozone with higher water vapour mixing ratios is related to chlorine activation. The time until chlorine activation occurs in this simulation is plotted in Fig. 3 as violet triangles, assuming that chlorine activation occurs when the ClOx mixing ratio exceeds 10 % of total Cly (Drdla and Müller, 2012). Shown is the time when chlorine activation first occurs in the model. Since the ClOx∕Cly ratio is dependent on the diurnal cycle, the 24 h mean value of the ClOx mixing ratio was used to determine the chlorine activation time. For low water vapour mixing ratios, no chlorine activation time is plotted, because no chlorine activation occurs. For chlorine activation to occur, a threshold in water vapour has to be reached. Here, we determine the lowest water vapour mixing ratio at which chlorine activation occurs as the water vapour threshold (marked by a blue arrow in Fig. 3). In our standard case, this threshold is reached at a water vapour mixing ratio of 10.6 ppmv. Between 10.6 and 11.8 ppmv H2O, chlorine activation does not lead to an ozone destruction during the 7 d simulation. For 10.6 to 11.2 ppmv H2O, chlorine only remains activated for up to 28 h, because of increasing temperatures, and almost no impact on final ozone is observable. By 12.0 ppmv of water vapour, chlorine activation yields ozone destruction within the 7 d simulation. Near the water vapour threshold, the activation time is 24 to 36 h and it decreases with increasing water vapour mixing ratios. It requires 5 h at 20 ppmv H2O. The shorter the chlorine activation time, the longer activated chlorine exists during the simulation, yielding greater ozone depletion. The processes yielding ozone depletion at high water vapour conditions as well as ozone formation at low water vapour are analysed in detail in the subsequent sections. For this investigation we use the simulated reaction rates for each chemical reaction along the course of the calculation. For high water vapour mixing ratios the roles of both chlorine activation and a decrease in the NOx mixing ratio (Fig. 2) are discussed.
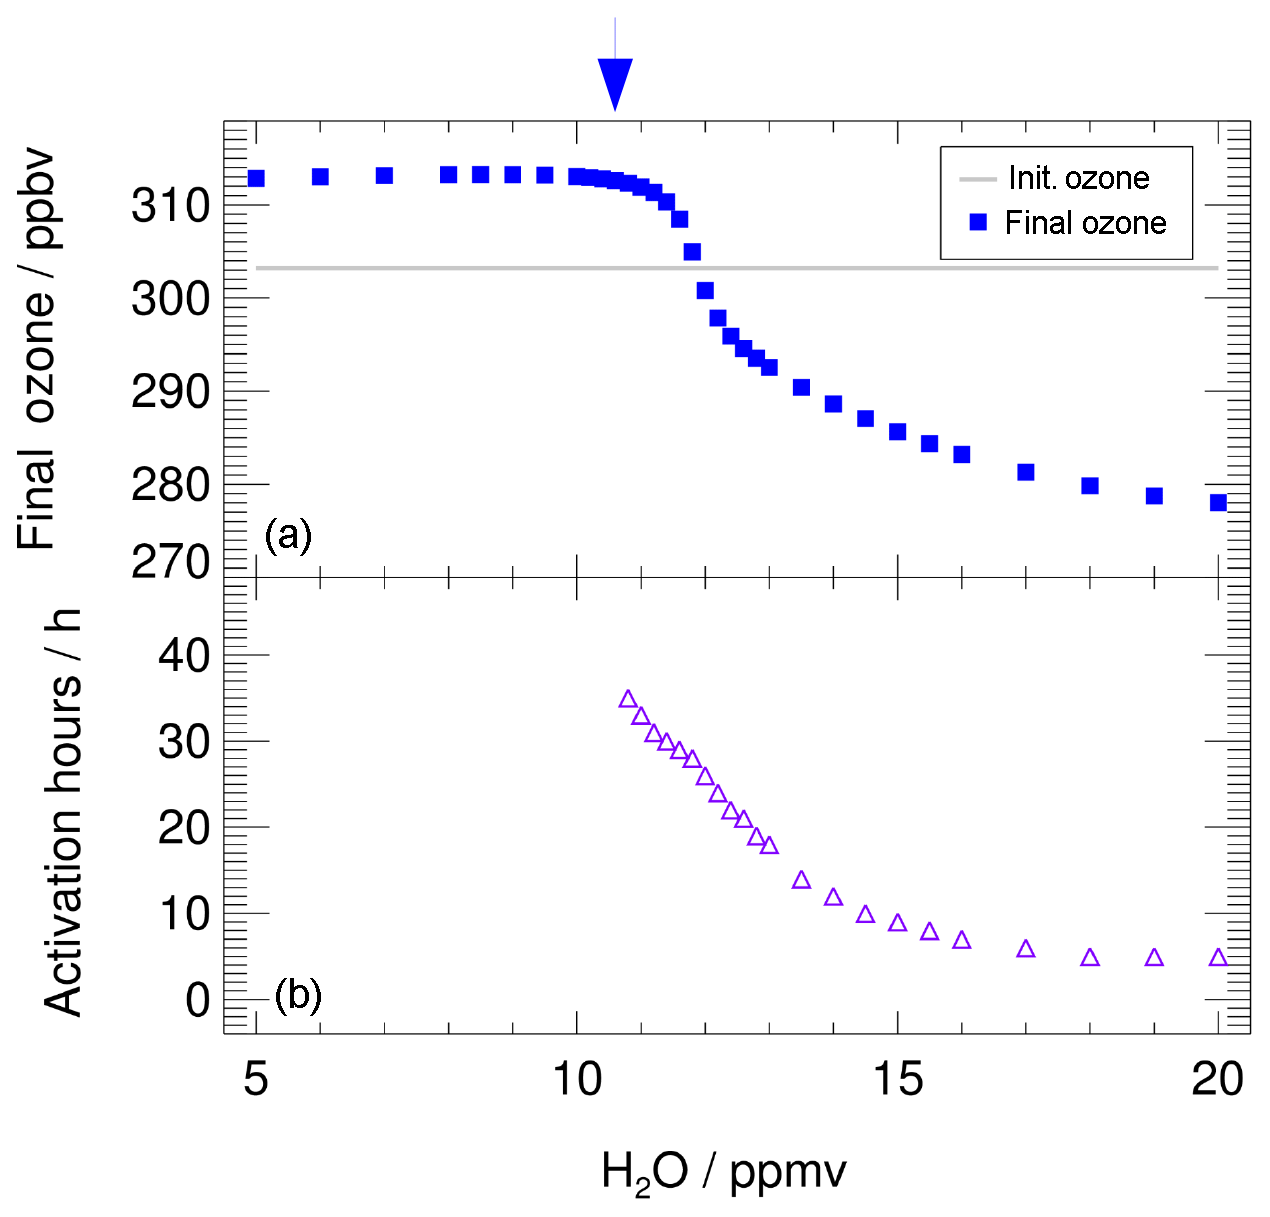
Figure 3Impact of the water vapour content on the ozone mixing ratio (final ozone, a) reached at the end of the 7 d simulation along the standard trajectory and assuming standard conditions. The initial ozone amount is marked by the grey line. The arrow marks the water vapour threshold, which has to be exceeded for chlorine activation at standard conditions to occur. In (b), violet triangles show the time until chlorine activation occurs. For low water vapour mixing ratios no chlorine activation occurs.
3.1 Ozone formation at low water vapour mixing ratios
At water vapour mixing ratios up to 11.8 ppmv, net ozone formation occurs during the 7 d simulation (see Fig. 3). This ozone formation is mainly driven by the photolysis of O2. Additionally the “Ozone Smog Cycle” (Haagen-Smit, 1952) known from tropospheric chemistry can yield ozone formation in the lower stratosphere (Grenfell et al., 2006; Grooß et al., 2011).
The rate of this cycle is determined by Reaction (R4) at low water vapour mixing ratios, and its net reaction is the oxidation of CO. The ozone formation through this cycle contributes around 40 % to the total ozone formation at 5 ppmv in our box model standard simulation. Hence, the ozone formation which occurs in the simulations assuming low water vapour mixing ratios is due to both the photolysis of O2 and cycle (C1).
3.2 Ozone loss at high water vapour mixing ratios
For higher water vapour mixing ratios than 12 ppmv, net ozone depletion is simulated (Fig. 3) in the 7 d standard simulation. The ozone loss mechanism generally consists of two steps: a chlorine activation step transferring inactive chlorine (HCl) into active ClOx followed by catalytic ozone loss processes (Anderson et al., 2012). We analyse both the chlorine activation step and subsequent catalytic ozone loss cycles potentially occurring in mid-latitudes in the lower stratosphere under enhanced water vapour conditions. Since ozone depletion is larger at high water vapour mixing ratios, conditions with a water vapour mixing ratio of 15 ppmv are chosen here to analyse the chemical ozone loss mechanism. Figure 4 shows an overview of the development of important mixing ratios and reaction rates during the 7 d simulation. Panel (a) illustrates temperature (black line) and surface area density of liquid particles (blue line).
The first phase of the ozone loss mechanism (dark grey background in Fig. 4) is dominated by the occurrence of heterogeneous reactions. The most important heterogeneous chlorine activation reaction is Reaction (R1) (Fig. 4b), which leads to the chlorine activation chain (von Hobe et al., 2011)
This chlorine activation chain yields a transformation of inactive HCl into active ClOx as well as of NOx into HNO3. The ozone loss due to this reaction chain is negligible and no depleting effect on ozone occurs during the first phase (Fig. 4c). In Fig. 4f, the NOx mixing ratio is seen to decrease and HNO3 increases due to Reaction (R1). Further, in the first phase the HCl mixing ratio decreases, yielding an increase in ClOx (Fig. 4f). Both decreasing NOx and increasing ClOx have an impact on ozone during the second phase of the ozone loss mechanism (light grey background in Fig. 4), which is characterized by a decreasing ozone mixing ratio (Fig. 4c). The role of NOx and ClOx is discussed in detail in the next sections.
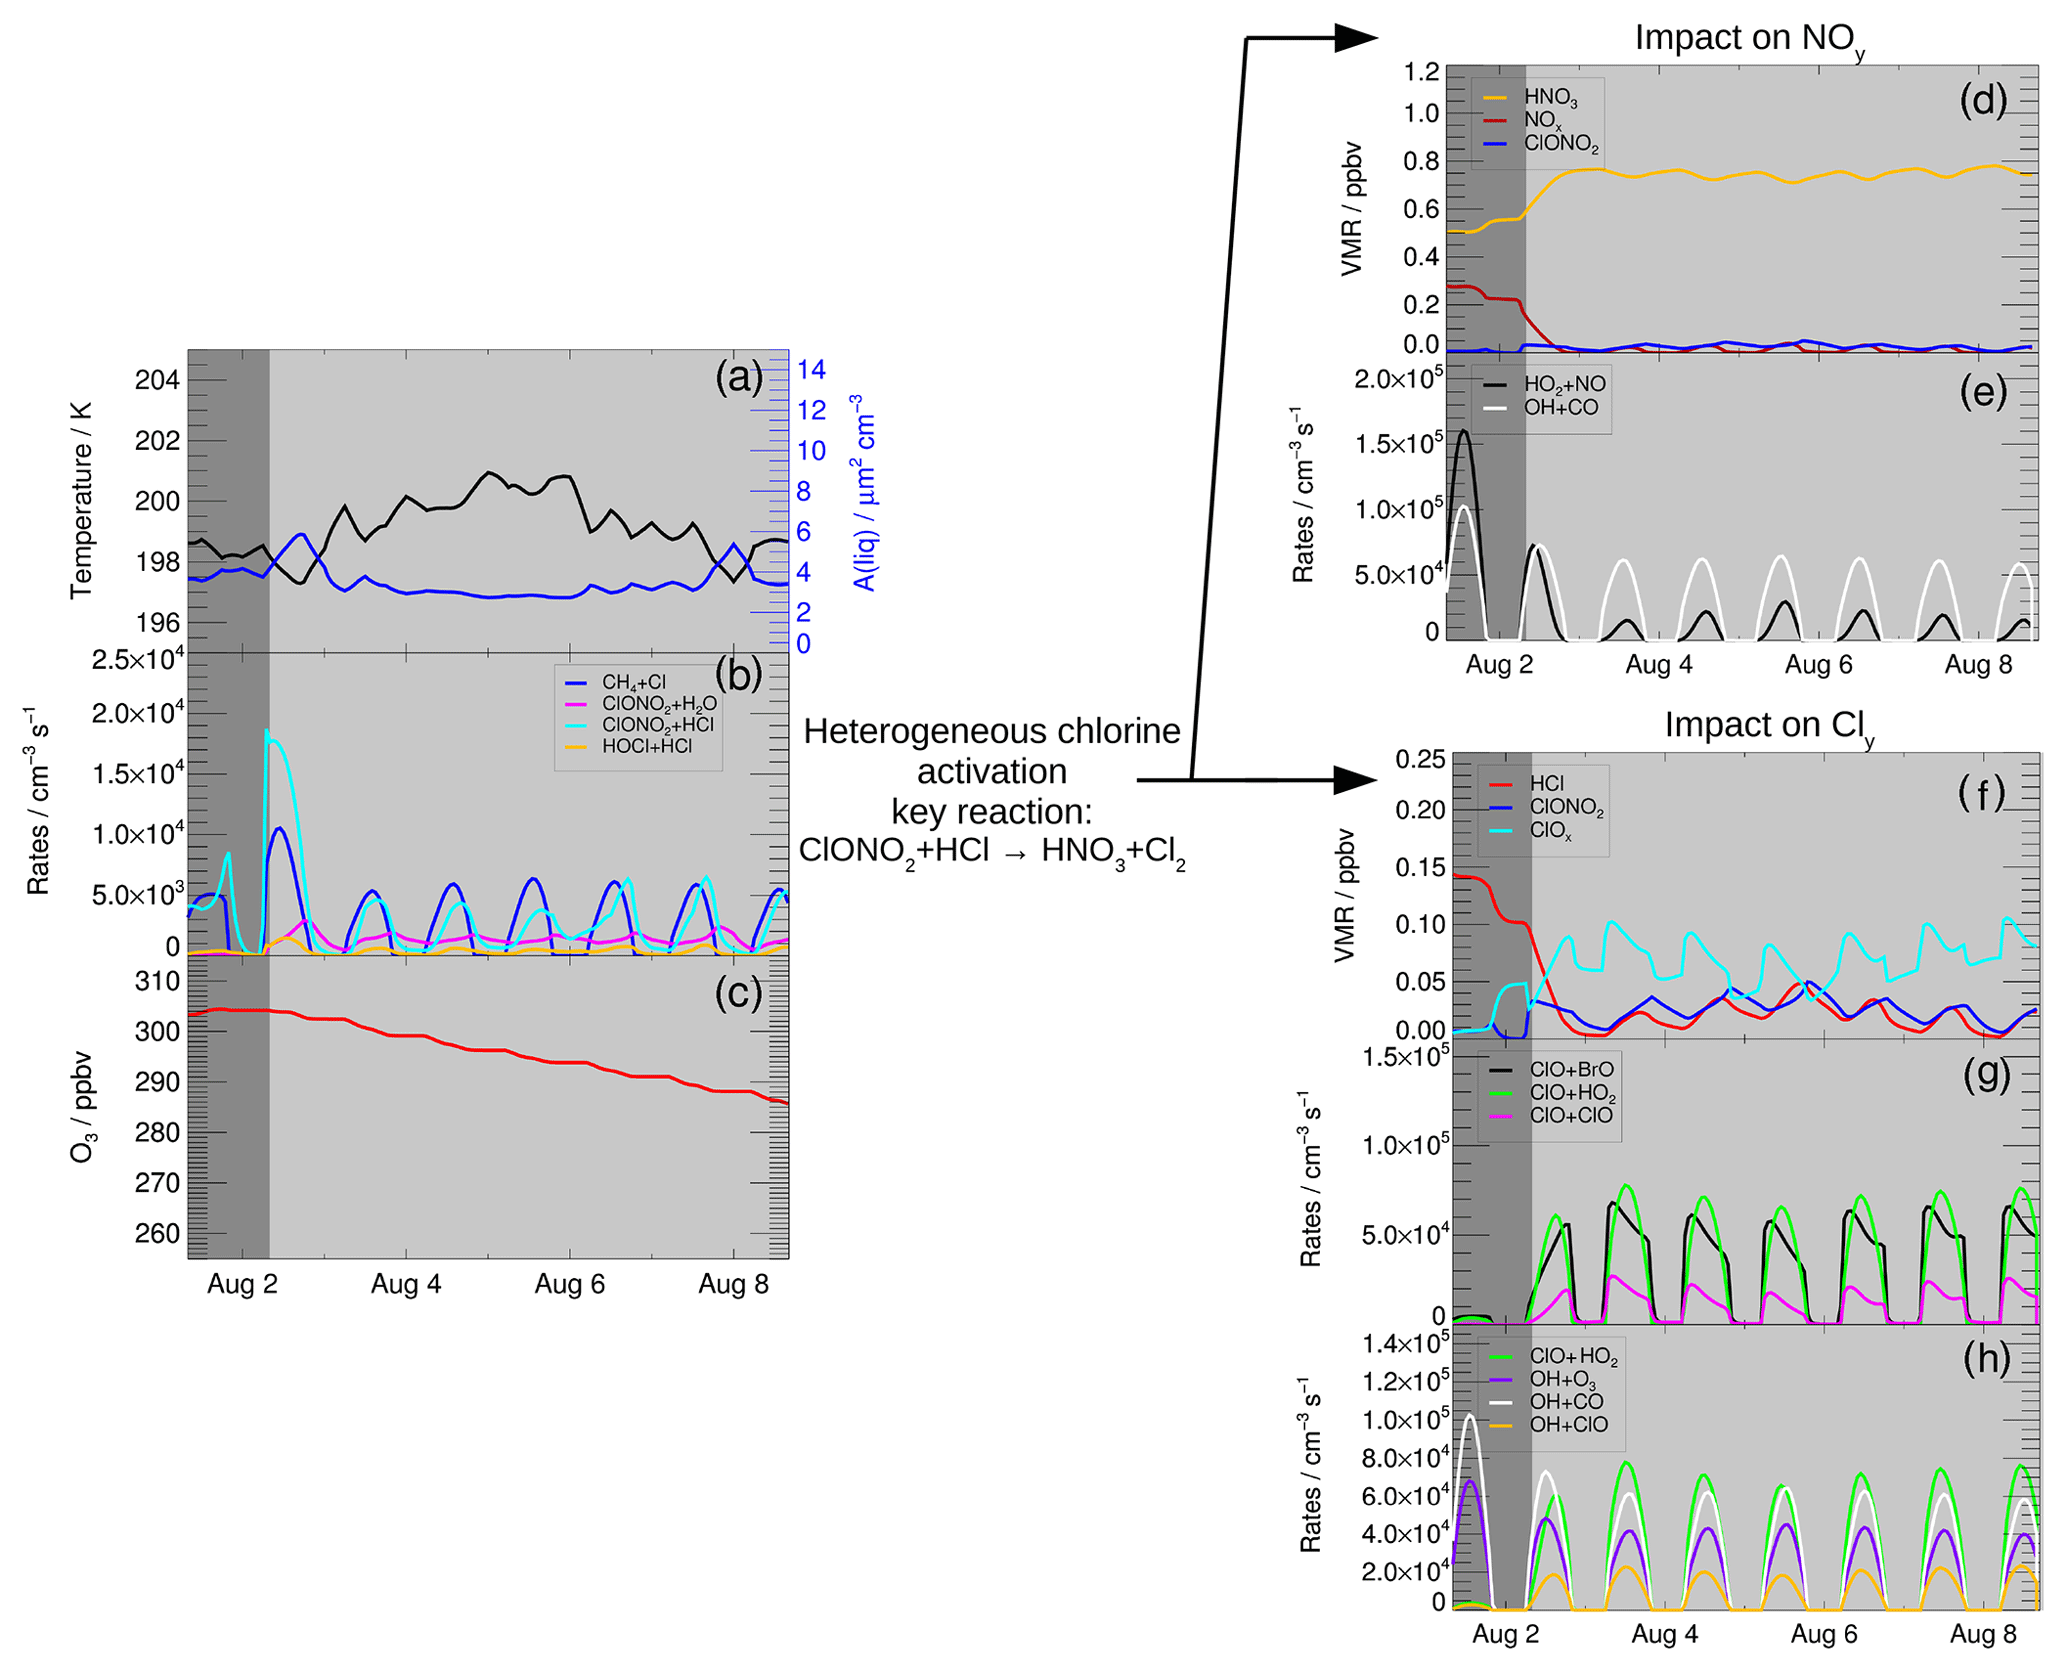
Figure 4Reaction rates and mixing ratios important for the ozone loss mechanism in the standard simulation using 15 ppmv H2O. The chlorine activation phase is shaded in dark grey, while the phase of ozone loss has a light grey background. Panel (a) shows the temperature of the trajectory and the liquid surface area density; the ozone mixing ratio is presented in panel (c). Heterogeneous reaction rates are shown in panel (b) as well as the rate of the gas phase reaction CH4+Cl. Panel (d) shows the mixing ratio of HNO3 (gas phase + condensed), NOx and ClONO2, and (e) shows the role of NOy for the ozone loss process. Reaction (R4) (OH+CO, panel e) limits ozone formation in cycle (C1) at high NOx mixing ratios and Reaction (R6) (HO2+NO) at lower NOx concentrations. Panels (f)–(h) illustrate the role of chlorine for ozone loss by showing the mixing ratio of HCl, ClOx and ClONO2 (f), main reaction rates (Reaction R16, ClO+ClO, Reaction R17, ClO+BrO, Reaction R13, ClO+HO2) for catalytic ozone loss cycles (g) and potential reaction pathways for the OH radical (Reaction R4, OH+CO, Reaction R18, OH+ClO, Reaction R15, OH+O3) as possible reaction chains following Reaction (R13) (ClO+HO2) (h). The x axis marks refer to 00:00 local time (06:00 UTC).
3.2.1 Role of NOx
The transformation of NOx radicals into HNO3 is due to Reaction (R9) (ClO+NO2) and subsequent the occurrence of the heterogeneous Reactions (R1) (ClONO2+HCl) and (R2) (ClONO2+H2O), which form HNO3. This behaviour was also found in former studies (e.g. Keim et al., 1996; Pitari et al., 2016; Berthet et al., 2017), investigating the impact of volcanic aerosols on stratospheric ozone chemistry. Dependent on temperature and water vapour content, the HNO3 formed remains in the condensed particles. In the standard simulation using 15 ppmv H2O, 64 % of HNO3 remains in the condensed phase on the day with the lowest temperature (197.3 K, 2 August 2013), while at higher temperatures (4–7 August 2013) 85 % of HNO3 are released to the gas phase. After the transformation of NOx into HNO3, the NOx mixing ratio remains low in the second phase of the mechanism (Fig. 4d, light grey region) while the HNO3 mixing ratio (condensed + gas) remains high.
The transformation of NOx radicals into HNO3, due to the occurrence of heterogeneous reactions at elevated water vapour amounts, affects stratospheric ozone chemistry. In the presence of a high NOx concentration (as at low water vapour mixing ratios), ozone formation in Cycle (C1) is determined by the rate of Reaction (R4) (OH+CO). But if the NOx concentration is low (as in the second phase of the mechanism), this ozone formation cycle is rate limited by Reaction (R6) (NO+HO2). For the standard case at 15 ppmv H2O, both rates are shown in Fig. 4e. In the first phase before NOx is transferred into HNO3, Cycle (C1) is limited by Reaction (R4) (OH+CO), which peaks on 1 August 2013 with a maximum rate of 1.0×105 cm−3 s−1. In the second phase at low NOx concentrations, Cycle (C1) is limited by Reaction (R6) (NO+HO2), which peaks on 3 August 2013 with a maximum rate of 1.5×104 cm−3 s−1. Hence, due to the occurrence of the heterogeneous Reaction (R1) the net ozone formation decreases by at least 3.5×104 cm−3 s−1 from 1 to 3 August.
3.2.2 Role of ClOx
In the first phase of the mechanism, chlorine activation yields a transformation of inactive chlorine into active ClOx. Net chlorine activation occurs when the rates of the heterogeneous Reactions (R1) (ClONO2+HCl), (R2) (ClONO2+H2O) and (R3) (HCl+HOCl) exceed the gas phase HCl formation dominated by the reaction
Enhanced ClOx concentrations induce catalytic ozone loss cycles at low temperatures, such as the ClO–dimer cycle (Molina et al., 1987), the ClO–BrO cycle (McElroy et al., 1986) and the cycle with ClO and HO2 (Cycle C2, Solomon et al., 1986)
Under conditions of low water vapour (stratospheric background), the rate-limiting steps of these cycles are the reactions
and
The rates of the Reactions (R16), (R17) and (R13) increase strongly in the second phase of the mechanism (light grey area in Fig. 4g) and thus catalytic ozone loss cycles occur. Under the assumed conditions, ozone depletion is mainly driven by reaction pathways following both Reactions (R17) and (R13). The reaction rates peak on 3 August with a value of 7.8×10⁴ for Reaction (R13) (ClO+HO2), 6.8×10⁴ for Reaction (R17) (ClO+BrO) and 2.7×10⁴ for Reaction (R16) (ClO+ClO).
Additionally the sensitivity of various reaction rates to the water vapour mixing ratio was tested. In Fig. 5, the mean reaction rates on 3 August are plotted against the water content assumed during the simulation. Panel (a) shows an acceleration of the ClO–BrO cycle (based on Reaction R17) and Cycle (C2) (based on Reaction R13) beginning from a water vapour mixing ratio of 11 ppmv. The rate-determining reaction of the ClO–dimer cycle (Reaction R16) increases at a higher water vapour mixing ratio. In contrast, the rate of ozone loss due to the reactions between ClOx and Ox (Ox = O3, O) species is negligible here (as shown by the low rate of the reaction , Fig. 5a).
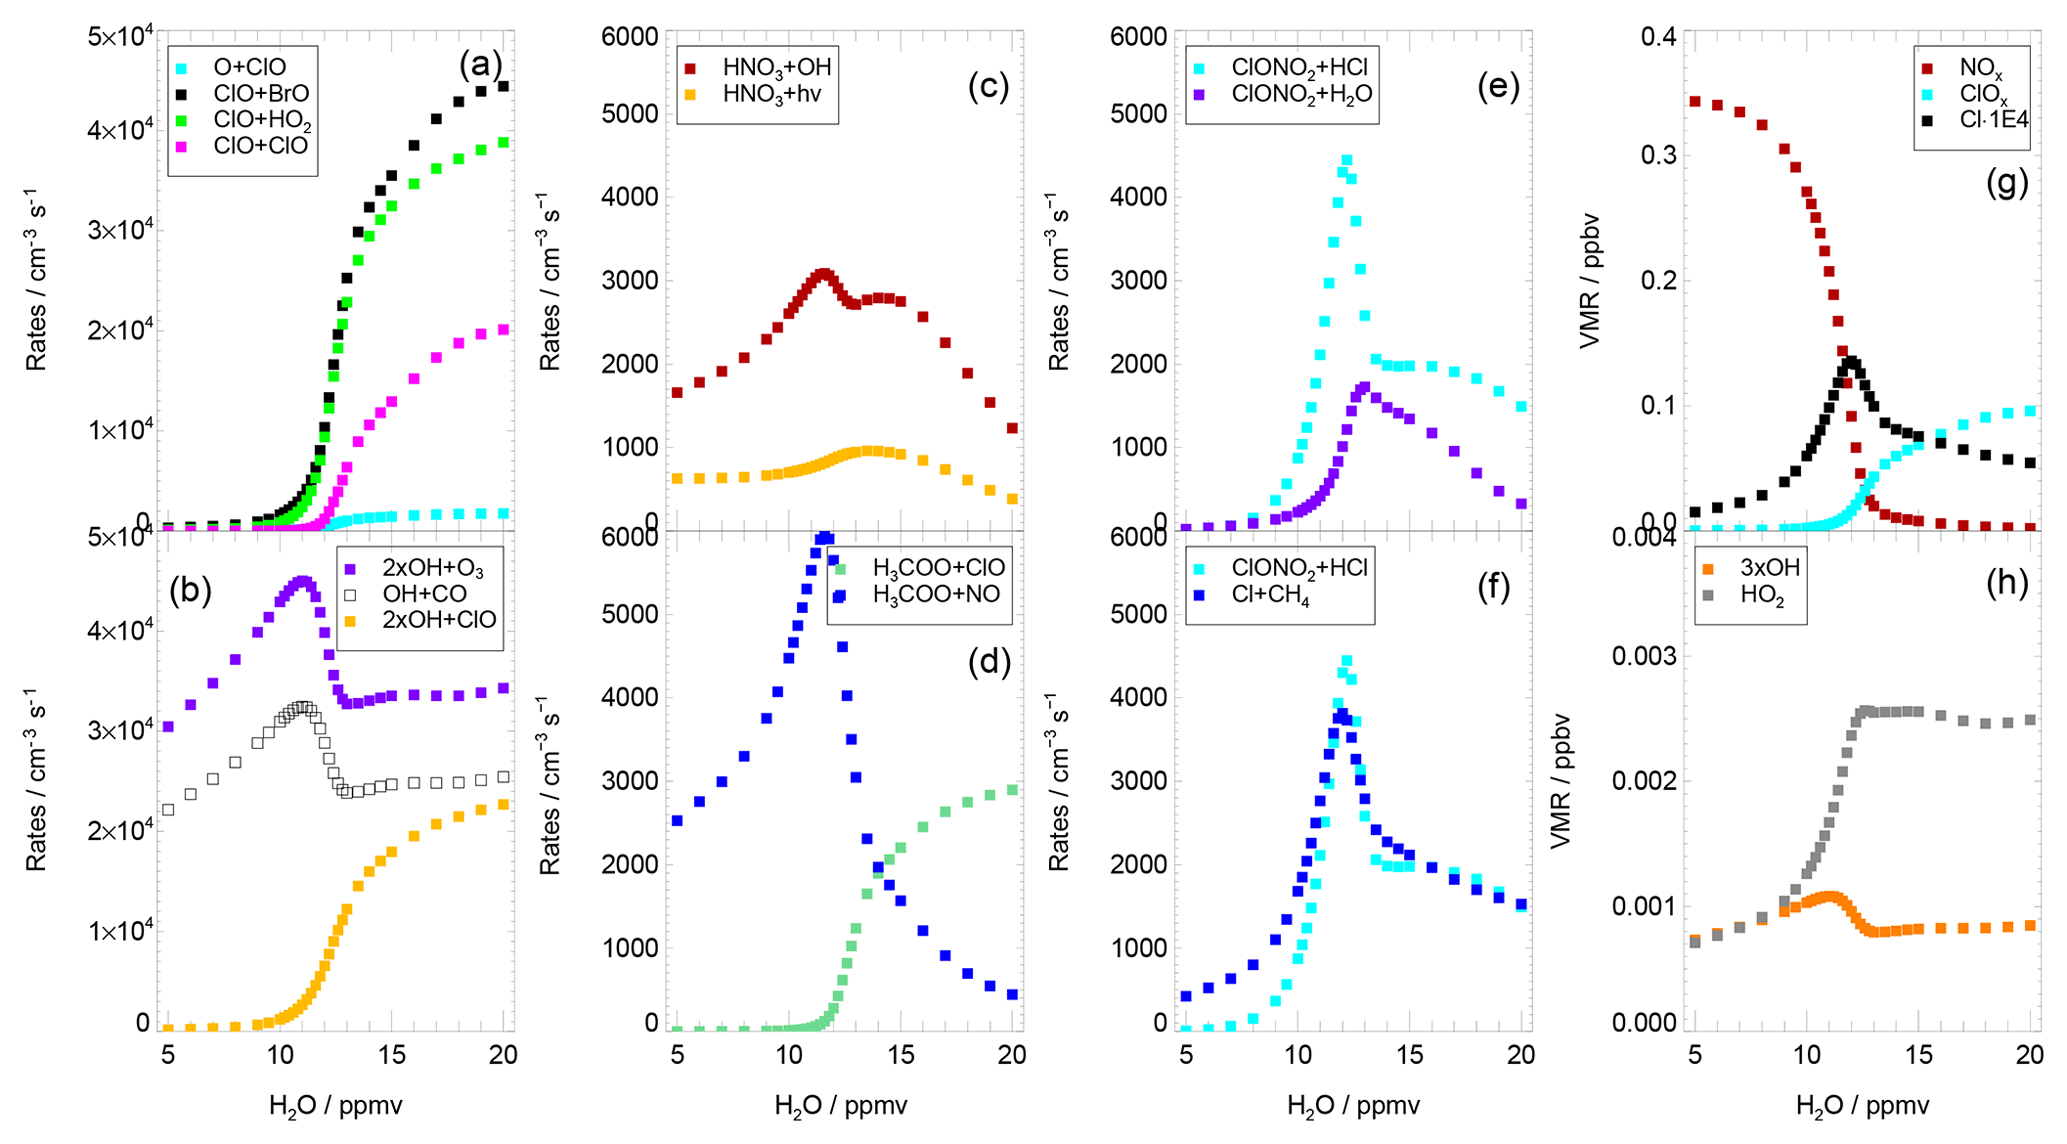
Figure 5Average reaction rates and volume mixing ratios from the standard simulations on 3 August dependent on water vapour content. Panel (a) shows the reaction rates of Reaction (R16) (ClO+ClO), Reaction (R17) (ClO+BrO), Reaction (R13) (ClO+HO2) and resulting in ozone reduction; panel (b) possible reaction pathways for the OH radical (Reaction R4, OH+CO, Reaction R18, OH+ClO, and Reaction R15, OH+O3); panel (c) reactions yielding depletion of HNO3 (Reaction R19, HNO3+OH, Reaction R20, HNO3+hν); panel (d) reactions of the H3COO radical (Reaction R22, H3COO+ClO, and Reaction R21, H3COO+NO); panel (e) important heterogeneous reactions (Reaction R1, ClONO2+HCl, Reaction R2, ClONO2+H2O); and panel (f) the balance between Reaction (R1) (ClONO2+HCl) and Reaction (R12) (CH4+Cl). Panel (g) shows the mixing ratios of NOx, ClOx and 1000 ⋅ Cl and panel (h) the mixing ratios of OH and HO2.
At stratospheric background conditions with a low water vapour mixing ratio, the rate-determining step of Cycle (C2) is Reaction (R13) (Solomon et al., 1986; Ward and Rowley, 2016). For the conditions with enhanced water vapour of 15 ppmv in the standard simulation, the rate of Reaction (R15) (OH+O3) is limiting this cycle (Fig. 4f). An investigation of possible reaction pathways of the OH radical yields that reactions of OH with CO (Reaction R4) and ClO (Reaction R18) exhibit a rate similar to the reaction with ozone (Reaction R15; Fig. 5b).
Based on these reactions, two further reaction chains affecting ozone can be deduced. In Cycle (C3), the OH radical reacts with CO yielding CO2 and a hydrogen radical, from which HO2 is formed. Subsequently HOCl can be formed via Reaction (R13) (ClO+HO2) and photolysed in Reaction (R14). Thus, the net reaction of this pathway is the oxidation of CO to CO2 and the simultaneous destruction of ozone (Cycle C3).
Furthermore, when the OH radical reacts with ClO, the products are HO2 and Cl and thus another catalytic ozone loss cycle (C4) results.
In the Cycles (C2) and (C4) two ozone molecules are destroyed, while one ozone molecule is destroyed in Cycle (C3). To assess the effectiveness regarding ozone loss of Cycles (C2)–(C4), the rate of Reaction (R4) (limiting Cycle C3) is compared with 2 times the rate of Reaction (R15) (limiting Cycle C2) and Reaction (R18) (limiting Cycle C4). This comparison shows that Cycle (C2) is more relevant for ozone loss than Cycles (C3) and (C4) (Fig. 5b). However, the relevance of Cycle (C4) for catalytic ozone destruction increases for higher water vapour mixing ratios.
A requirement for the effectiveness of the ozone loss cycles is a high mixing ratio of activated chlorine (ClOx). In Fig. 4b, the rate of the main HCl formation Reaction (R12) (Cl+CH4, dark blue) shows a formation of HCl, which is mainly balanced by the heterogeneous HCl destruction Reaction (R1) (ClONO2+HCl) holding the HCl mixing ratio low and thus ClOx values high. This balance between chlorine activation (Reaction R1, ClONO2+HCl) and chlorine deactivation (Reaction R12, Cl+CH4) is schematically illustrated with blue arrows in Fig. 6 and similar to HCl null cycles (Müller et al., 2018), which balance gas phase HCl formation and heterogeneous HCl destruction under Antarctic polar night conditions. In these polar HCl null cycles each HCl formed in Reaction (R12) is depleted through the heterogeneous Reaction (R3) (HCl+HOCl). For the conditions in the mid-latitudes during summer considered here, a higher NOx mixing ratio prevails than under Antarctic ozone hole conditions. As a consequence Reaction (R1) (ClONO2+HCl) is here mainly responsible for HCl depletion. Reaction (R1) combined with Reaction (R9) (ClO+NO2) yields additionally the transformation of NOx into HNO3. This HNO3 formation is balanced by reaction
(see Fig. 6, green), leading to a steady HNO3 mixing ratio (Fig. 4d).
A further option to convert HNO3 into active NOx may be the HNO3 photolysis
but the rate of Reaction (R19) is more than 2.5 times larger than the rate of the HNO3 photolysis (Reaction R20, Fig. 5c). Hence, the heterogeneous Reaction (R1) couples two pathways: a pathway balancing HCl destruction in Reaction (R1) and HCl formation in Reaction (R12) (Cl+CH4) and thus maintaining a high ClOx mixing ratio, and a pathway balancing HNO3 formation in Reaction (R1) and HNO3 destruction in Reaction (R19) and thus maintaining a low NOx mixing ratio.
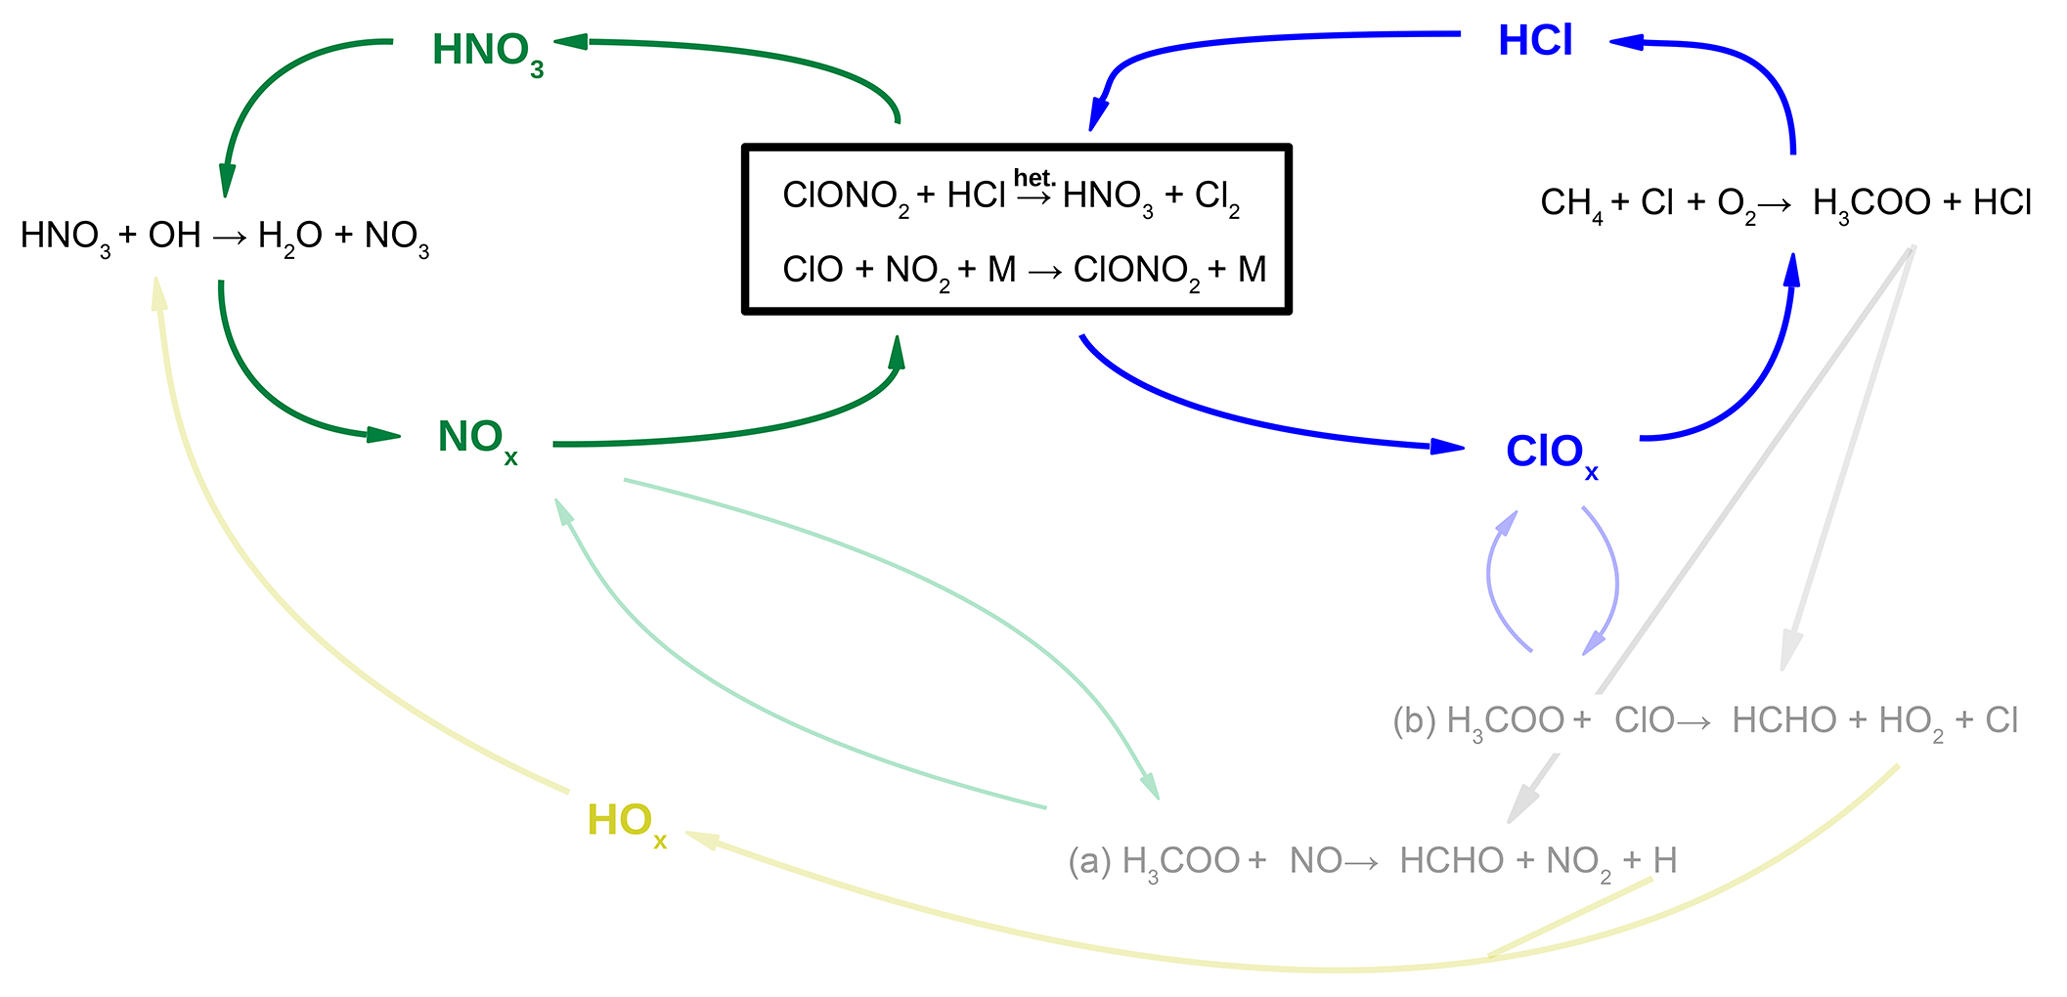
Figure 6Reaction scheme to illustrate the balance between chlorine activation and chlorine deactivation (blue, right) and NOx activation and deactivation (green, left). The heterogeneous reaction ClONO2+HCl (Reaction R1) links both cycles. Additional reaction pathways which balance radicals are shown in light colours.
The balance of radical species, which are converted in both pathways, additionally links both pathways (Fig. 6, light colours). In Reaction (R12), besides HCl a methylperoxy radical (H3COO) is formed, which reacts either with NO or with ClO, leading to HOx formation (HOx = H, OH, HO2).
In Reaction (R19), HNO3 is depleted in a reaction with an HOx radical (Fig. 6, yellow). How the H3COO radical reacts depends on the mixing ratios of ClOx and NOx. For water vapour mixing ratios around the water vapour threshold, the NOx mixing ratio is higher than the ClOx mixing ratio (Fig. 5g). Hence, the methylperoxy radical reacts with NO rather than with ClO (Fig. 5d), leading to pathway (a) in Fig. 6. At higher water vapour mixing ratios, H3COO rather reacts with ClO (Reaction R22), leading to pathway (b) in Fig. 6. The balance between HCl formation and destruction as well as HNO3 formation and destruction due to the occurrence of the heterogeneous reaction (R1) is analysed in detail in Appendix A.
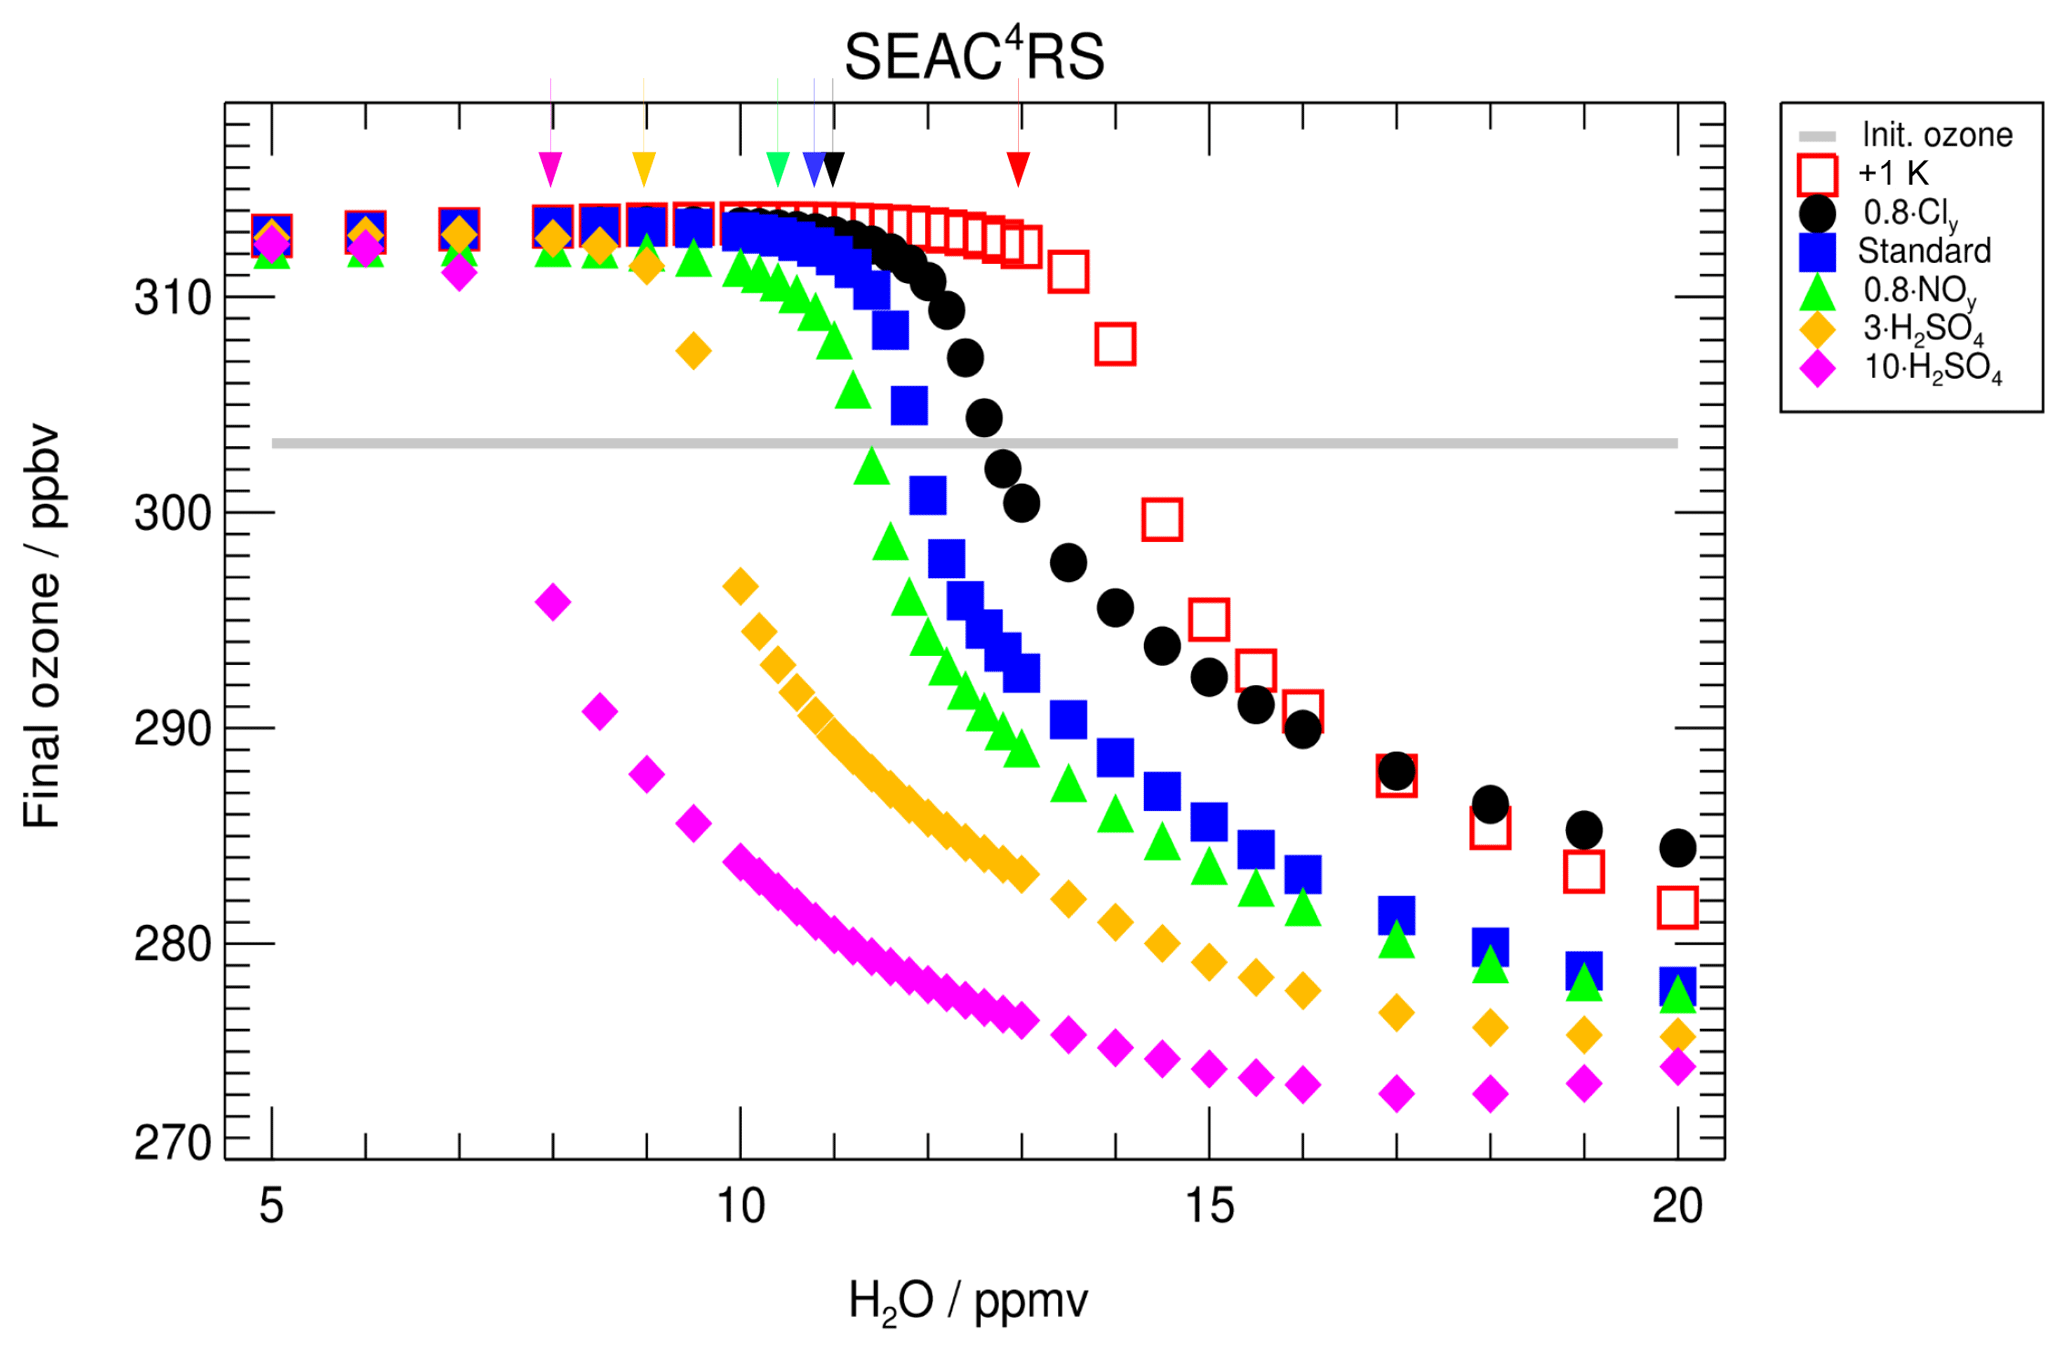
Figure 7Impact of the water vapour content on the ozone mixing ratio (final ozone) reached at the end of the 7 d simulation along the standard trajectory (SEAC4RS). The standard case is shown in blue and the initial ozone amount is marked by the grey line. An impact on the final ozone mixing ratios is observable after exceeding a critical threshold in water vapour, which is marked with an arrow for the different cases. This threshold changes with a shift in trajectory temperature (+1 K, red), the Cly mixing ratio to 0.8 Cly (black), the NOy mixing ratio (0.8 NOy, green) and the sulfate content (3× standard H2SO4, yellow, and 10× standard H2SO4, magenta).
In this example the heterogeneous HCl destruction (Reaction R1, ClONO2+HCl) does not balance the HCl formation (Reaction R12, Cl+CH4) (Fig. 4b) completely, because of increasing temperatures (Fig. 4a). Higher temperatures decelerate the heterogeneous HCl destruction and thus result in the slightly increasing HCl mixing ratio from 4 to 7 August 2013 (Fig. 4f). Such temperature fluctuations (Fig. 4a) affect the balance between HCl formation and destruction less at higher water vapour mixing ratios, because the heterogeneous HCl destruction rate (Reaction R1) increases for both low temperatures and high water vapour mixing ratios (see Sect. 4). Thus, regarding the balance between HCl formation and HCl destruction (and hence the balance between chlorine deactivation and chlorine activation), a high water vapour mixing ratio can compensate a small range of temperature fluctuations. This balance maintains activated chlorine levels, which is essential for catalytic ozone loss cycles to proceed.
In the previous section we showed that in the temperature range of 197–202 K there is a threshold for water vapour, which has to be exceeded to yield chlorine activation and thus enables substantial ozone destruction. Here, we investigate the sensitivity of this threshold on sulfate content, temperature, and the Cly and NOy mixing ratio.
4.1 Sensitivity of the water vapour threshold
Modifying temperature, sulfate amount, or the mixing ratios of Cly or NOy yields a shift of the water vapour threshold. Figure 7 shows the ozone values reached at the end of the 7 d simulation (final ozone) for a variety of sensitivity cases assuming the standard trajectory. For each case, the water vapour threshold is marked with an arrow in the colour of the corresponding case.
The water-vapour-dependent final ozone values for the standard case are plotted as blue squares (Fig. 7) with a water vapour threshold of 10.6 ppmv (see Sect. 3). Raising the trajectory temperature by 1 K over the standard case leads to a higher water vapour threshold of 13.0 ppmv (open red squares), while increasing the sulfate content by a factor of 3 results in a lower threshold region of ∼ 9.0 ppmv (yellow diamonds). An even larger enhancement of the sulfate content (10× H2SO4, magenta diamonds) lowers the water vapour threshold further to a value near ∼ 8 ppmv. Reducing the NOy mixing ratio to 80 % of the standard case yields a shift of the threshold to a lower water vapour mixing ratio (green filled triangles), while an equivalent reduction in the Cly mixing ratio shifts the threshold to higher water vapour mixing ratios (black circles). A reduction in Cly also reduces ozone destruction and hence results in higher ozone mixing ratios at the end of the simulation. The sensitivity of the water vapour threshold to temperature, sulfate abundance, and the Cly and NOy mixing ratio is explained in the next section (Sect. 4.2).
As a further example for an event with high stratospheric water vapour mixing ratios based on airborne measurements, simulations based on measurements during the Mid-latitude Airborne Cirrus Properties Experiments (MACPEX) were conducted. This campaign was based in Texas during springtime 2011 and hence prior to the formation of the North American Monsoon (NAM). A detailed description of this MACPEX case is given in Appendix B. For the MACPEX case, changes in sulfate, Cly and NOy mixing ratios affect the water vapour threshold similarly to that observed for the SEAC4RS trajectory. Thus, the MACPEX results confirm the SEC4RS findings. Therefore, we conclude that in the considered temperature range (∼197–202 K), an ozone reduction occurs after exceeding a water vapour threshold and that this threshold varies with Cly, NOy, sulfate content and temperature.
4.2 Explanation of the water vapour threshold
The sensitivity of the water vapour threshold to Cly, NOy, sulfate loading and temperature is investigated, focussing on the balance between heterogeneous chlorine activation mainly due to Reaction (R1) (ClONO2+HCl) and gas phase chlorine deactivation mainly due to Reaction (R12) (Cl+CH4). Net chlorine activation takes place when the chlorine activation rate exceeds the chlorine deactivation rate. Reaction (R1) is the key reaction in the chlorine activation process. Therefore, in the following, first the dependence of Reaction (R1) on the water vapour content is analysed in detail. Second, the balance between chlorine activation and deactivation is investigated, also considering the impact of Cly, NOy, sulfate and temperature on the water vapour threshold.
In general the rate of Reaction (R1) (ClONO2+HCl) vR1 is determined through
The concentrations of ClONO2 and HCl cHCl are associated with the gas phase mixing ratio, and the rate constant kR1, as a measure of the reactivity of the heterogeneous reaction, depends in this case on the γ value γR1, the surface area of the liquid particle Aliq, the temperature T and cHCl (Eq. 2) (Shi et al., 2001).
The γ value describes the uptake of ClONO2 into liquid particles due to the decomposition of ClONO2 during Reaction (R1) and is thus a measure of the probability of the occurrence of this heterogeneous reaction (Shi et al., 2001). Laboratory studies showed a dependence of γR1 on the solubility of HCl in the droplet, which generally increases for a lower H2SO4 fraction in the particle (H2SO4 wt %) (Elrod et al., 1995; Hanson, 1998; Zhang et al., 1994; Hanson and Ravishankara, 1994). From Eq. (2) it is obvious that a large surface area Aliq and a high γ value γR1 increase kR1 and thus the heterogeneous reaction rate vR1.

Figure 8Dependence on water vapour of the rate of the main heterogeneous chlorine activation Reaction (R1) vR1, the rate coefficient (kR1), they value γR1, the liquid surface area density Aliq, and the H2SO4 weight percent. Presented parameters correspond to the values after the first chemistry time step of the box-model simulation. Additionally the impact of an enhanced sulfate content (0.6 ppbv H2SO4, yellow), reduced NOy (0.8 NOy, green), reduced Cly (0.8 Cly, black) and enhanced temperatures (red) is shown. The standard case is shown as blue squares.
In Fig. 8, the impact of the water vapour content on the H2SO4 weight percent, γR1, Aliq, kR1 and the reaction rate vR1 is shown. To avoid the influence of Reaction (R1) itself on these parameters as much as possible, these parameters are selected for 1 August 2013 at 13:00 UTC. This point in time corresponds to the values after the first chemistry time step during the chemical simulation. The weight percent of H2SO4 in the particles decreases for all cases with increasing water vapour from more than 50 wt % at 5 ppmv H2O to around 20 wt % at 20 ppmv H2O due to an increasing uptake of H2O in the thermodynamic equilibrium. The standard case is illustrated in blue squares (Fig. 8) and exhibits a strongly increasing gamma value especially for water vapour mixing ratios between 9 and 14 ppmv due to a lower H2SO4 wt %. In the same water vapour range, the liquid surface area density Aliq increases slightly. It increases more for higher water vapour mixing ratios because of HNO3 uptake into the particles. Due to the increasing γ value with increasing water vapour, the rate constant kR1 increases (Shi et al., 2001) and thus induces a larger reaction rate vR1 with an increasing water vapour mixing ratio.
At low water vapour mixing ratios, not only the rate of Reaction (R1) (ClONO2+HCl) but also that of Reaction (R12) (CH4+Cl) increases with increasing water content (Fig. 5f). An increasing heterogeneous reaction rate (Reaction R1) results in both a lower NOx mixing ratio and more HCl converted into ClOx. A higher ClOx concentration yields a higher Cl mixing ratio and thus an increase in the rate of Reaction (R12) (CH4+Cl). Since both the rates of Reactions (R1) and (R12) increase, no significant net chlorine activation occurs. Around the water vapour threshold, the Cl mixing ratio peaks (Fig. 5g), because less ClO is converted into Cl through
due to the decreasing NOx mixing ratio. The lower Cl mixing ratio reduces the HCl formation in Reaction (R12) (CH4+Cl). Hence, the increasing heterogeneous reactivity kR1 yields a higher rate of Reaction (R1) and in the same way it impedes Reaction (R12) by reducing the NOx mixing ratio. As a consequence the rate of Reaction (R1) exceeds the rate of Reaction (R12) and a net chlorine activation takes place, leading to a reduction in HCl. The decline in both HCl and NOx yields smaller rates of Reactions (R1) and (R12) at high water amounts and thus a peak of Reactions (R1) and (R12) (Fig. 5f). Hence, the increasing heterogeneous reactivity (kR1) of Reaction (R1) destabilizes the balance between chlorine activation and deactivation by promoting the chlorine activation (due to an increasing rate of Reaction R1) and impeding chlorine deactivation (due to a reduction of Reaction R12). This yields heterogeneous chlorine activation to exceed gas phase HCl formation in the water vapour threshold region.
For an enhanced sulfate content (Fig. 8, yellow diamonds), the particle surface area density (Aliq) is larger, leading to both a stronger increase in the heterogeneous reactivity (kR1) and hence a higher heterogeneous reaction rate than in the standard case. Due to this higher heterogeneous reactivity (kR1), the chlorine activation rate exceeds the chlorine deactivation at a lower water vapour mixing ratio and the net chlorine activation is reached at a lower water vapour threshold. A shift to higher temperatures (Fig. 8, red) yields almost no change in the surface area density (Aliq) but a reduced y value due to a higher H2SO4 fraction in the particles (H2SO4 wt %) and thus a lower heterogeneous reactivity (kR1). The reduced reactivity causes the net chlorine activation to occur at a higher water vapour threshold.
In contrast, the shift of the threshold for simulations with only 80 % of standard NOy (0.8 NOy; Fig. 8, green) or Cly (0.8 Cly; Fig. 8, black) can not be explained only by an increase in kR1. In these cases, further effects on the balance between chlorine activation and chlorine deactivation have to be taken into account. The water vapour threshold in the 0.8 NOy simulation (green triangles) is shifted to lower water vapour values due to a smaller Cl∕ClO ratio for lower NOx concentrations. This yields a reduced HCl formation through Reaction (R12) (CH4+Cl) than in the standard case and thus impedes chlorine deactivation. The reduced chlorine deactivation affects the balance between chlorine activation and deactivation in a way that the water vapour threshold region in the 0.8 NOy case is lower than in the standard case. In the 0.8 Cly case (Fig. 8, black), the HCl and ClONO2 mixing ratios are reduced. This leads to a lower chlorine activation rate vR1 than in the standard case, despite the slight higher heterogeneous reactivity (kR1), which is due to the inverse dependence of kR1 on the HCl concentration (Eq. 2). The lower dependence of Reaction (R12) (Cl+CH4) than of Reaction (R1) (HCl+ClONO2) on the Cly mixing ratio would push chlorine deactivation (Reaction R12) in the balance between chlorine activation and deactivation and hence shift the water vapour threshold to higher water vapour mixing ratios. Additionally caused by the lower rate of Reaction (R1) (ClONO2+HCl) for reduced Cly, the NOx mixing ratio decreases more slowly. This enhances the rate of Reaction (R12) compared with the standard case as well, because more NOx yields a higher Cl∕ClO ratio.
In summary, the water vapour threshold is determined by the balance between chlorine activation and deactivation and is thus in a certain temperature range especially sensitive to the water dependence of the heterogeneous reactivity (kR1), mainly described through the y value γR1 and the particle surface Aliq. These parameters are dependent on the present temperature and sulfate content. However, further parameters influencing this balance, such as the NOy and Cly mixing ratio, have an impact on the water vapour threshold as well.
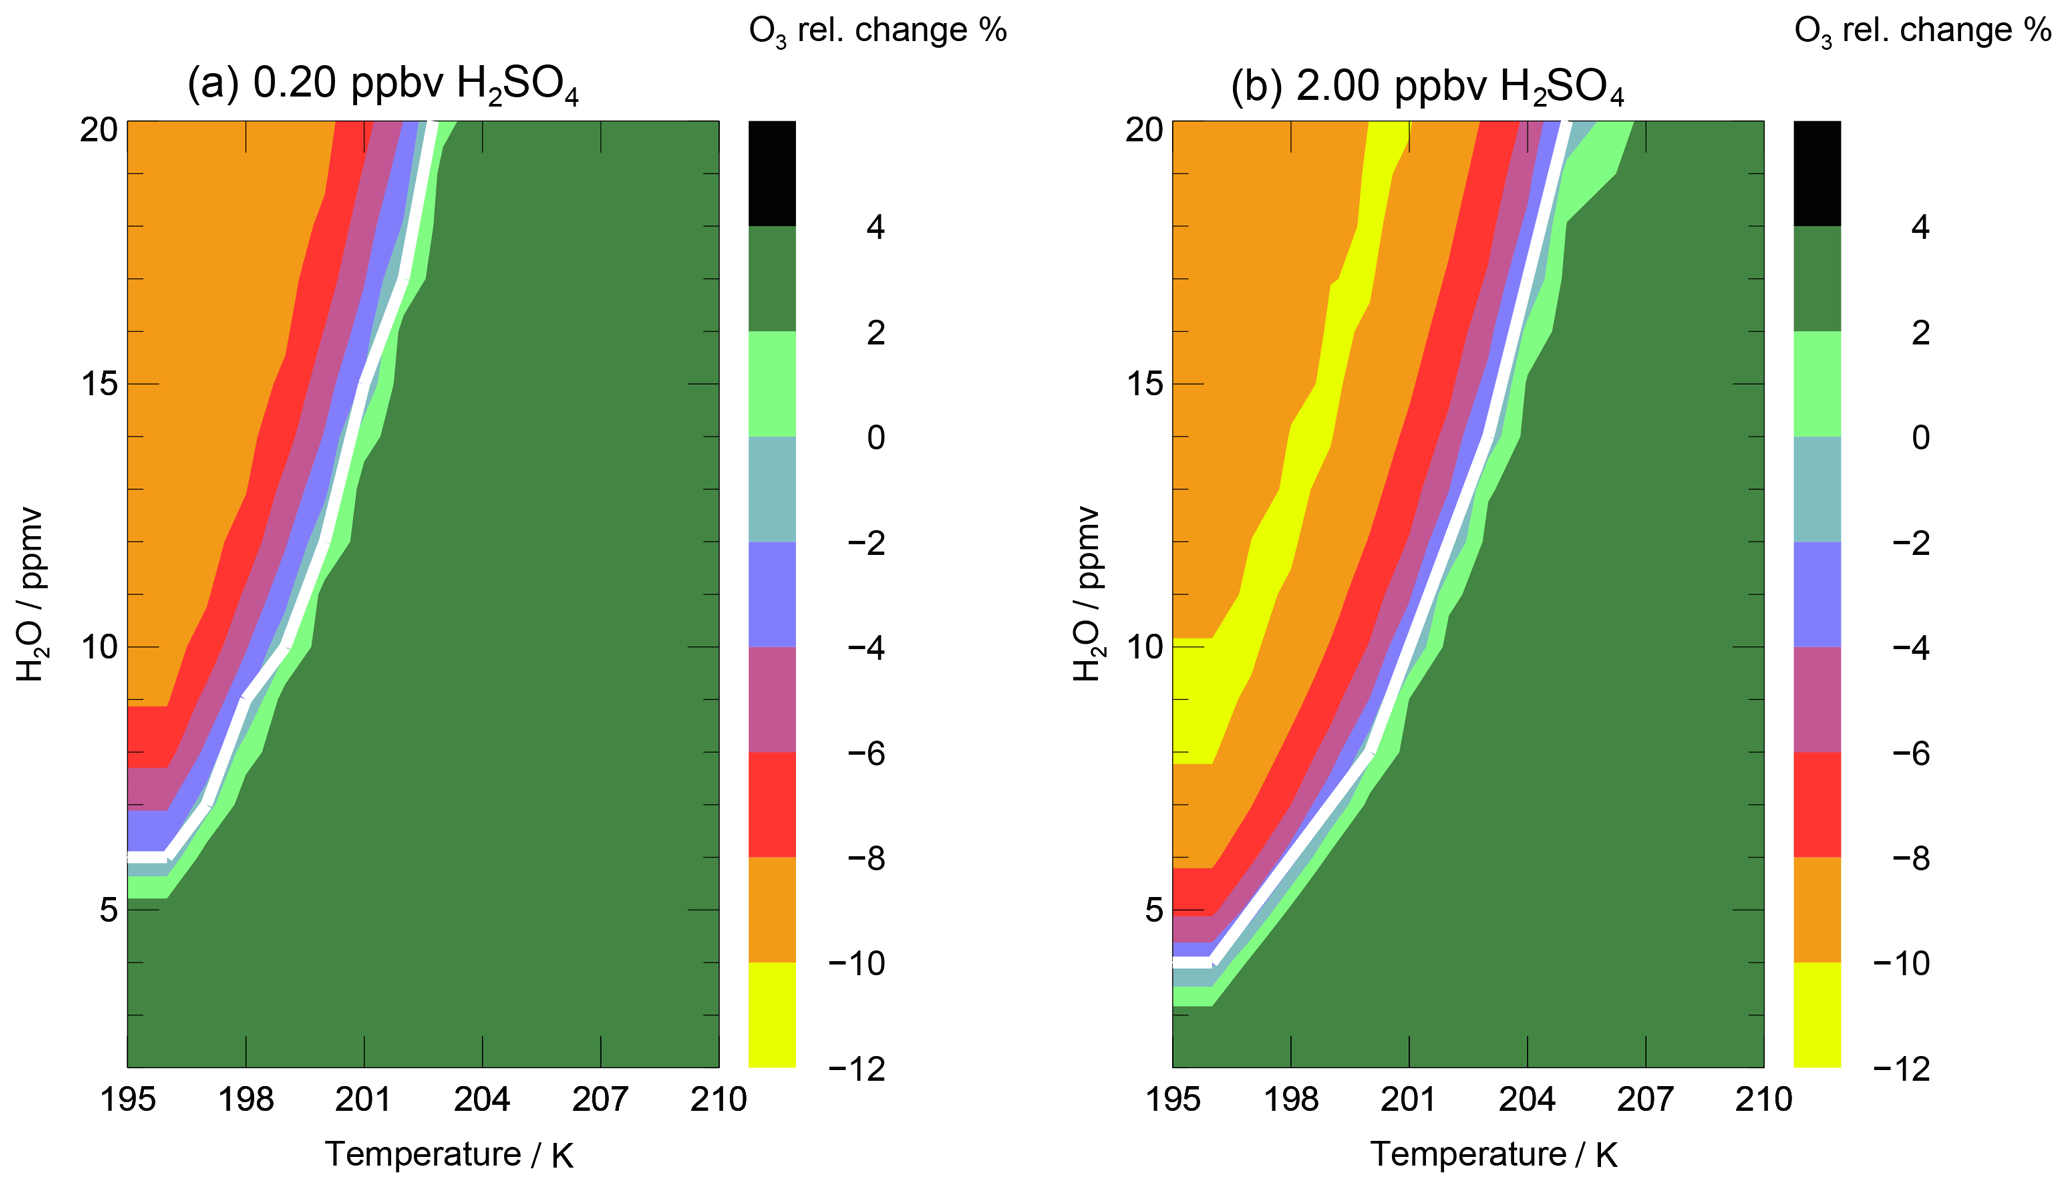
Figure 9Relative ozone change during the 7 d simulation along the standard trajectory dependent on temperature and H2O ratio for climatological non-enhanced (a) and enhanced (b) sulfate conditions. The white line corresponds to the water- and temperature-dependent chlorine activation threshold.
4.3 Temperature dependence
The water vapour threshold, which has to be exceeded for chlorine activation and stratospheric ozone loss to occur, is mainly dependent on the temperature. To illustrate the impact of both temperature and water vapour mixing ratio on stratospheric ozone, the relative ozone change occurring after a 7 d simulation, in which a constant temperature and water vapour concentration and the Cly and NOy values of the standard case are assumed, is shown in Fig. 9. In panel (a), ozone change as a function of temperature and water vapour is plotted for non-enhanced sulfate amounts. In the right panel, the relative ozone change is shown for 10× standard sulfate to estimate a potential impact of volcanic eruptions or sulfate geoengineering on stratospheric ozone. Since mixing of neighbouring air parcels is neglected in the box-model study, the relative ozone change calculated corresponds to the largest possible ozone change for the conditions assumed. A mixing of moist tropospheric air with dry stratospheric air is expected to reduce the water vapour mixing ratio during the time period of the 7 d trajectory and hence could stop ozone depletion before the end of the trajectory is reached. In addition to the relative ozone change, the threshold for chlorine activation is shown as a white line in both panels. When temperature is held constant, this threshold corresponds to the water vapour threshold discussed above. Chlorine activation occurs at higher water mixing ratios and lower temperatures relative to the white line plotted. Here, chlorine is defined to be activated, if the ClOx∕Cly ratio exceeds 10 %.
For climatological non-enhanced sulfate amounts (Fig. 9a), the temperature has to fall below 203 K for chlorine activation to occur, even for high water vapour mixing ratios of 20 ppmv. For the simultaneous presence of high water vapour and low temperatures an ozone loss of 9 % (max. 27 ppbv O3) was found. This maximal ozone loss occurs for a range of low temperatures (195–200 K) and enhanced water vapour mixing ratios (10–20 ppmv), because of a similar time until chlorine activation occurs. If the temperatures are higher and water vapour mixing ratios lower than the chlorine activation line, the ozone mixing ratio increases around 3.5 % (∼10 ppbv O3). At enhanced sulfate conditions (Fig. 9b) an ozone loss of max. 10 % (30 ppmv O3) occurs for low temperatures and high water vapour mixing ratios. For a water vapour mixing ratio of 20 ppmv the temperature has to fall below 205 K for ozone loss to occur. If the temperatures are very low (195–200 K) and the water vapour is high (10–20 ppmv) ozone loss is slightly reduced. This turnaround occurs, because at a high sulfate loading in combination with high water and low temperatures more HCl is taken up by condensed particles. This leads to less Cly in the gas phase and thus lower rates of catalytic ozone loss.
In summary, the combination of low temperatures, enhanced sulfate concentrations and high water vapour mixing ratios promotes an ozone decrease in up to ∼10 % (corresponding to maximum −30 ppbv O3). In comparison to the study of Anderson et al. (2012), the temperatures have to fall below 203 K (here) instead of 205 K (in Anderson et al., 2012) for non-enhanced sulfate conditions, below 205 K instead of 208 K (in Anderson et al., 2012) for enhanced sulfate conditions, and a water vapour mixing ratio of 20 ppmv for chlorine activation and thus ozone loss to occur. Hence, Anderson et al. (2012) found ozone loss in mid-latitudes at high water vapour mixing ratios for temperatures 2 to 3 K higher than in our simulations.
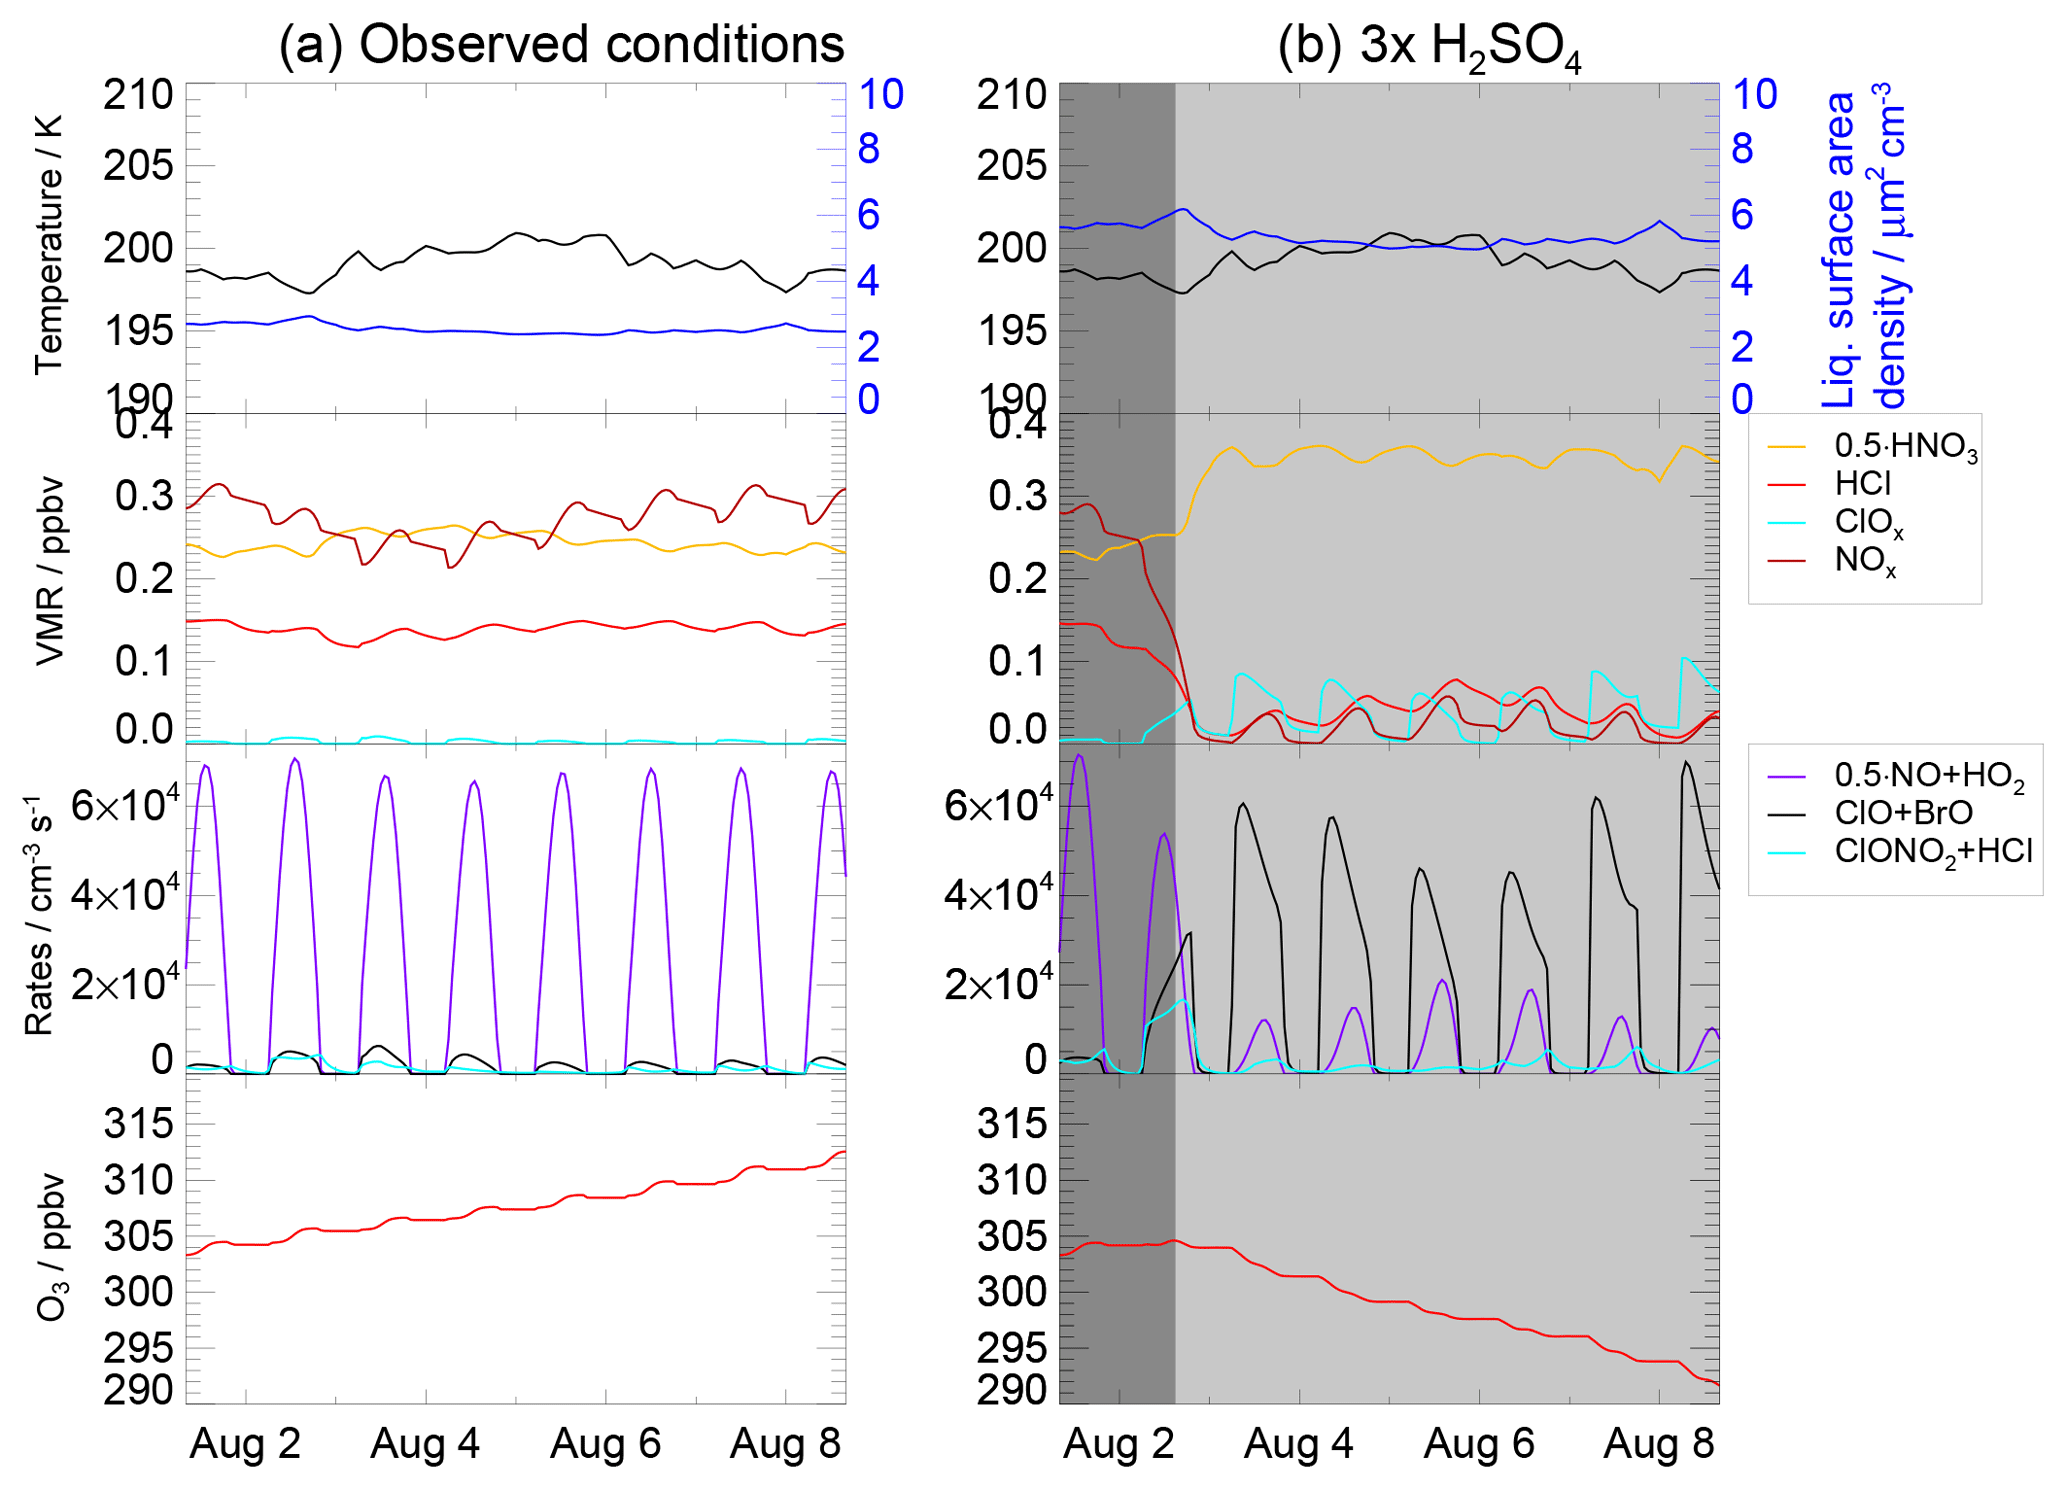
Figure 10Panel (a) presents the temperature, liquid surface area density, ozone mixing ratio, reaction rates of Reaction (R1) (ClONO2+HCl, cyan), Reaction (R17) (ClO+BrO, black) (as an example for ozone loss cycles), Reaction (R6) (NO+HO2, violet) which limits ozone formation at low NOx concentrations as well as volume mixing ratios of HCl (red), ClOx (light blue), NOx (black) and HNO3 (scaled with 0.5) for the “case based on observations” with 10.6 ppmv H2O and 0.20 ppbv H2SO4. Panel (b) shows the same quantities, but for enhanced sulfate conditions (0.60 ppbv H2SO4). The x axis marks refer to 00:00 local time (06:00 UTC) of that day.
Case studies were conducted to illustrate the sensitivities described above on ozone loss and to estimate the impact of realistic conditions and an upper boundary on the ozone loss process. In the “case based on observations”, standard conditions and the measured water vapour mixing ratio of 10.6 ppmv were assumed using both the low sulfate content of the standard case and a slightly enhanced sulfate content, which represents the possible impact of volcanic eruptions or geoengineering conditions. As a kind of worst-case study (upper boundary), the “case of high Cly” was simulated using Cly and NOy mixing ratios based on the study of Anderson et al. (2012), which uses Cly and NOy much larger than inferred from tracer–tracer correlations (Table 1). In the “reduced Bry case”, standard conditions with a 50 % reduced Bry mixing ratio were assumed to test uncertainties in current observations of stratospheric bromine burden. Additionally the previously noted standard 7 d trajectory was extended to a 19 d trajectory to infer the dependence of ozone loss on the simulated time period.
5.1 Case based on observations
The simulation of the case based on observations during the SEAC4RS aircraft campaign corresponds to the most realistic case for today's chemical conditions. It is identical to that of the standard case but assumes a fixed water vapour mixing ratio of 10.6 ppmv observed on 8 August 2013. Under these conditions, neither relevant heterogeneous chlorine activation due to Reaction (R1) (ClONO2+HCl) nor catalytic ozone loss cycles (e.g. based on ClO+BrO) can be observed in the simulation (Fig. 10a). Instead, ozone is formed. In comparison, the same simulation with 0.6 ppbv gas phase equivalent H2SO4 instead of 0.2 ppbv was conducted (Fig. 10b). The enhanced sulfate content yields a larger liquid surface area density and thus an increased heterogeneous reactivity. Hence, Reaction (R1) occurs in the 3×H2SO4 simulation significantly, leading to a slightly increasing ClOx mixing ratio and a decrease in the NOx mixing ratio. Both a reduced ozone formation in Cycle (C1) (which is at decreased NOx concentrations limited by Reaction R6) and ozone loss cycles (e.g. based on the reaction ClO+BrO or ClO+HO2) can be observed, resulting in a reduction in ozone.
Using initial conditions, the trajectory corresponding to the SEAC4RS observations shows ozone loss with sulfate enhanced by a factor of 3. However, we note that this was an unusually cold trajectory. A more common case with higher mean temperatures would require a higher sulfate content to enhance the heterogeneous reactivity so that chlorine activation can occur. Thus under current chemical conditions in the UTLS (upper troposphere, lower stratosphere), it is most unlikely to get significant ozone loss by convectively injected water vapour in mid-latitudes.
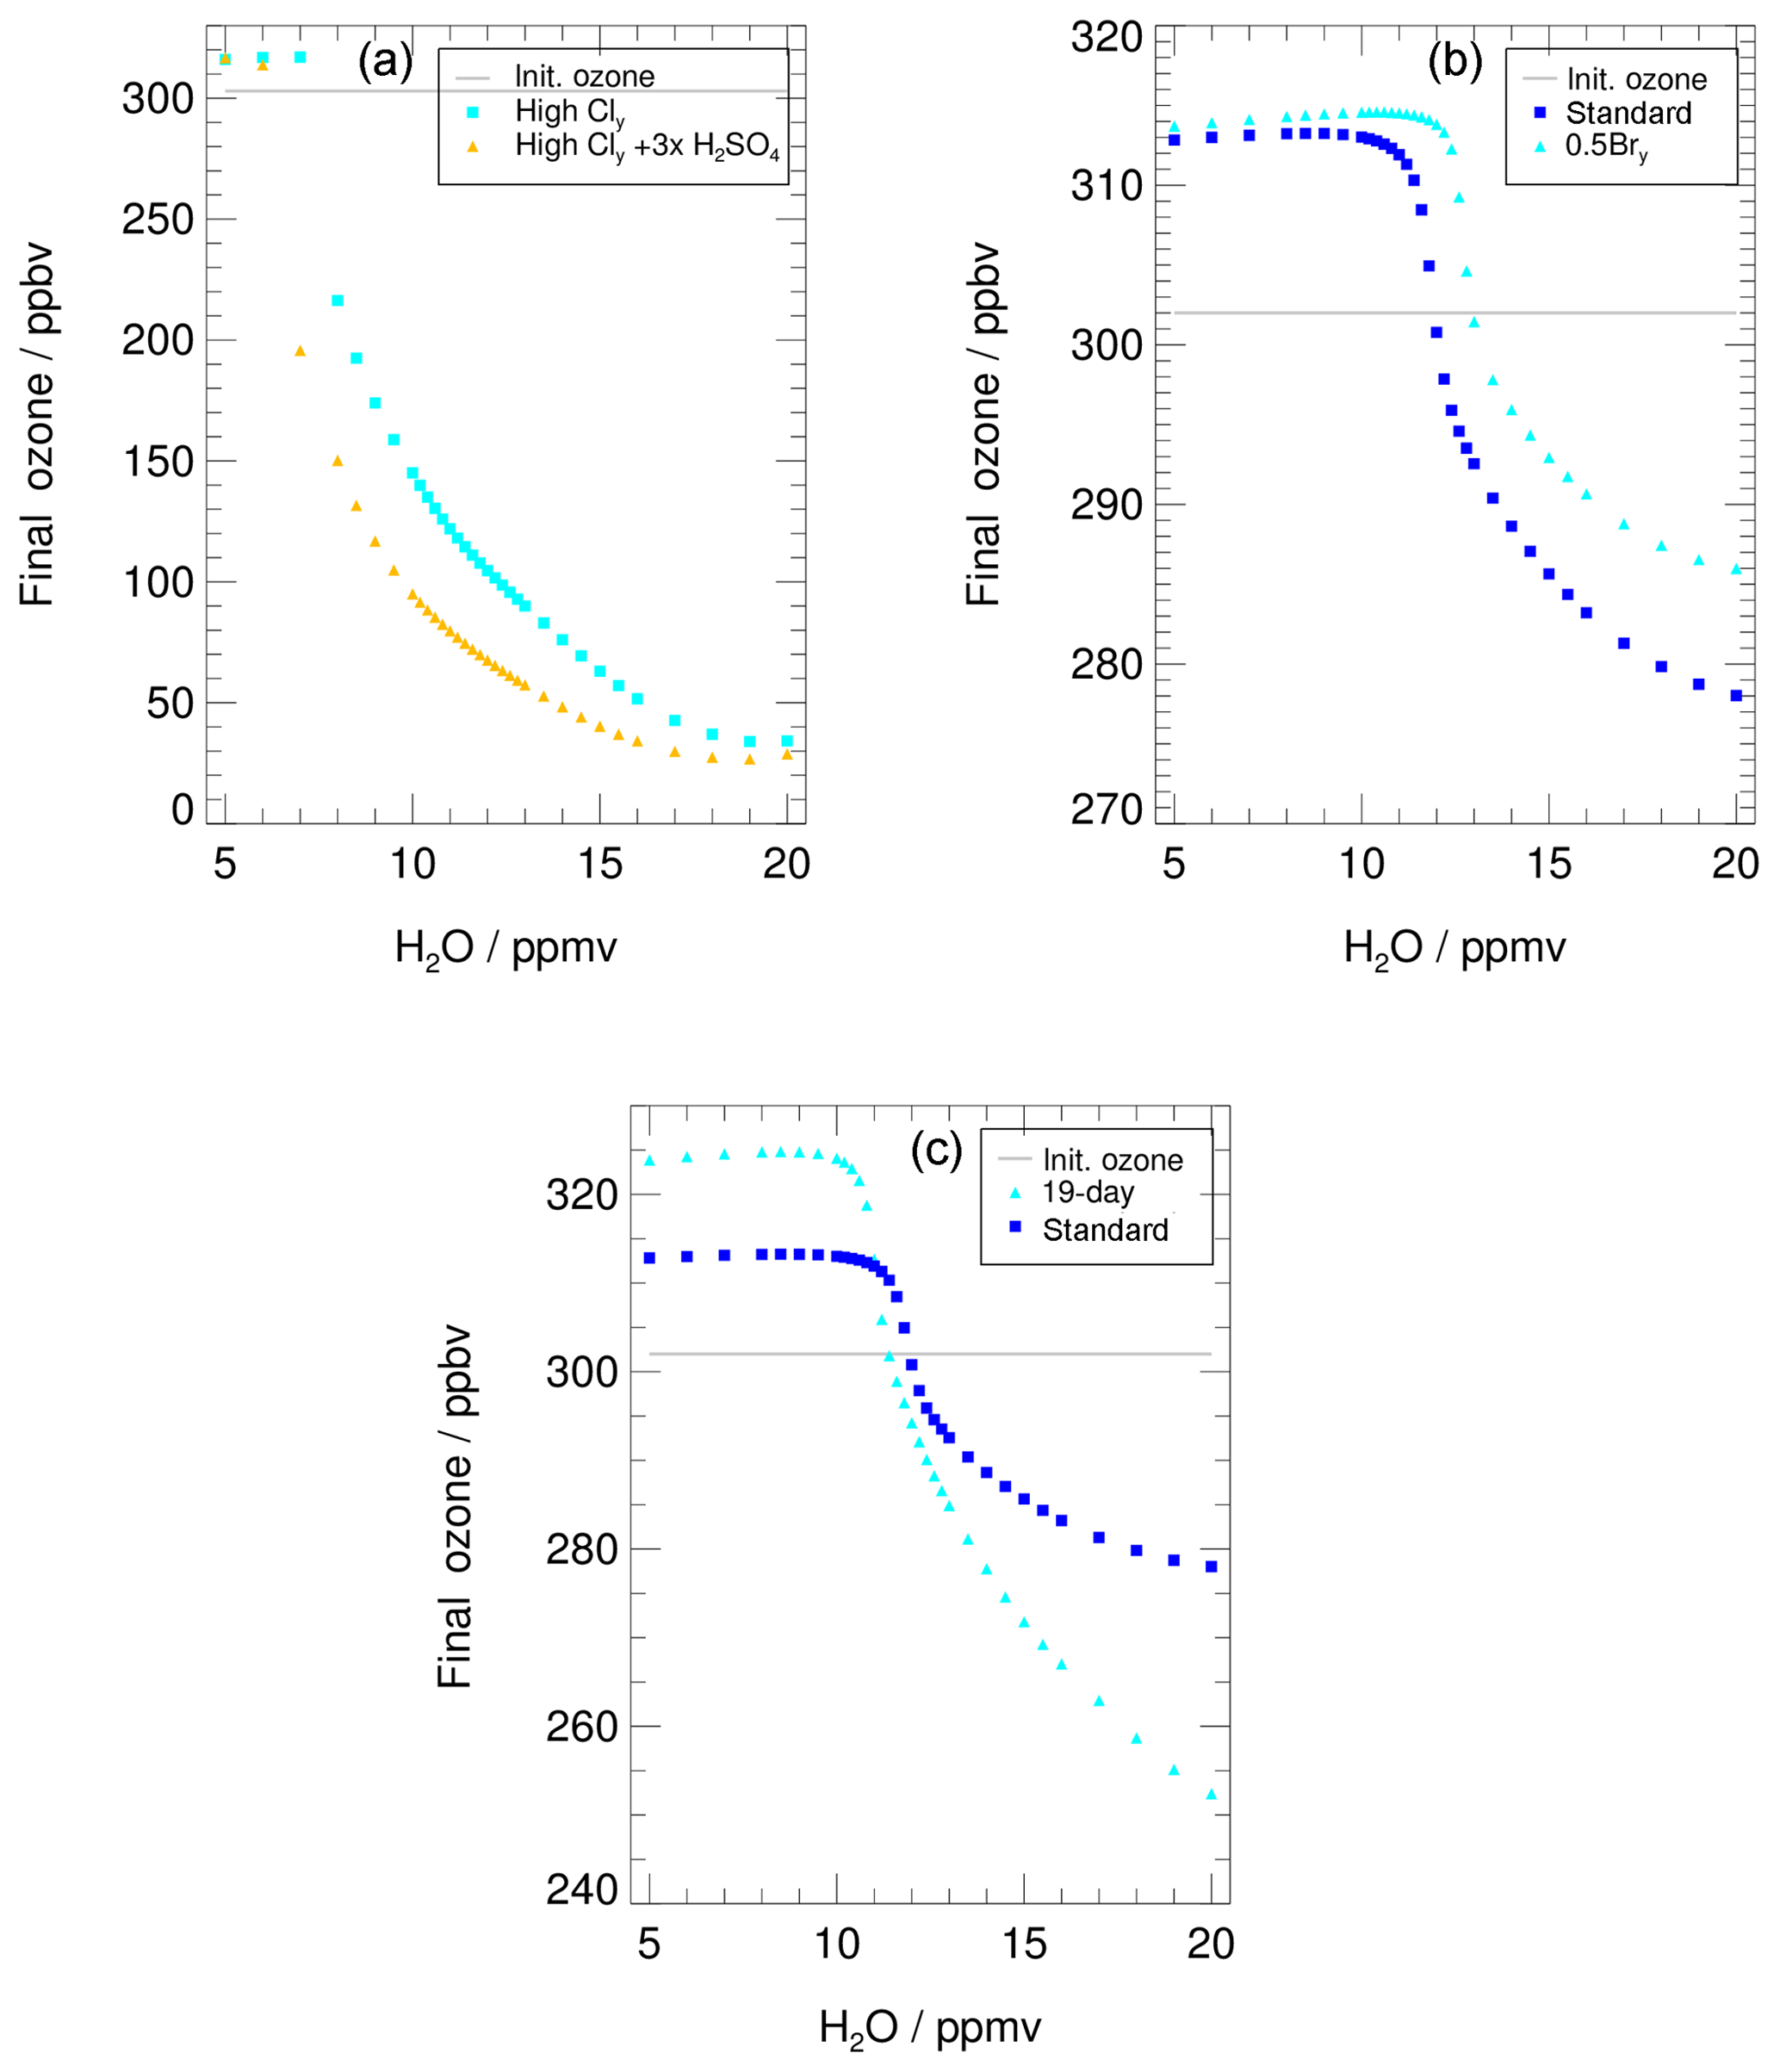
Figure 11The water-dependent final ozone value is shown for (a) the “case of high Cly” (see Table 1 for NOy and Cly initialization) assuming background aerosol (light blue) and tripled H2SO4 (yellow), (b) reduced Bry (light blue, “Reduced Bry case”), and (c) an extended time period of activated chlorine (light blue, “19 d simulation”). In panel (b) and (c) final ozone of the standard case is also shown (blue). Initial ozone is marked with a grey line. Note that the scales of all y axes differ.
5.2 Case of high Cly
Under conditions of substantially higher initial Cly and NOy mixing ratios (see Table 1) than in the standard case used in Anderson et al. (2012), a larger ozone loss up to 265 ppbv during the 7 d simulation is simulated (Fig. 11a). Since these high-Cly conditions have been criticized in other studies (e.g. Schwartz et al., 2013; Homeyer et al., 2014) as being unrealistically high, they are assumed here as a worst-case scenario. Under high chlorine conditions, and for a high water vapour content (more than ≈18 ppmv), an almost complete ozone destruction with a final ozone value of less than 50 ppbv is simulated (Fig. 11a), which corresponds to parcel ozone loss of 85 %. During the 3.5 d simulation in the study of Anderson et al. (2012), an ozone loss of 20 % with respect to initial ozone occurs for 18 ppmv H2O. This difference in relative ozone loss for similar conditions here and in the study of Anderson et al. (2012) is caused by a longer assumed ozone destruction period in our simulation. Since the Cly mixing ratio is much higher than in the standard case, the catalytic ozone loss cycles are dominated by the ClO–dimer cycle (see Sect. S1 in the Supplements for chemical details). Assuming the measured water vapour content of 10.6 ppmv for high chlorine conditions would lead to an ozone depletion of 57 % during the 7 d simulation. In comparison, in the standard case an ozone loss of 8 % is reached when a high water vapour mixing ratio of 20 ppmv is assumed. However, even for the standard trajectory and a high chlorine content, a water vapour amount of 8 ppmv has to be exceeded to yield any ozone reduction. This threshold shifts from 8 ppmv to 7 ppmv for the case where stratospheric sulfate is tripled (Fig. 11a, yellow triangles).
5.3 Reduced Bry case
The mixing ratio of inorganic bromine (Bry) has a high uncertainty in the lowermost stratosphere due to the influence of very short-lived bromine-containing substances. For example, during the CONTRAST field campaign (January–February 2014, western Pacific region), Koenig et al. (2017) observed a Bry mixing ratio in the lower stratosphere of 5.6–7.3 pptv and the contribution of Bry, which crosses the tropopause, was estimated to be 2.1 ± 2.1 pptv (Wales et al., 2018). Navarro et al. (2017) found somewhat different bromine partitioning depending on the ozone, NO2 and Cly concentrations, using very short-lived bromine species observations in the eastern and western Pacific ocean from the ATTREX campaign. Because our Bry values are not based on measurements for this specific case modelled, we tested the sensitivity to a value that is half of our standard case. The impact of this Bry reduction is illustrated in Fig. 11b.
Comparing the final ozone value for the 0.5 Bry simulations (Fig. 11b, light blue triangles) with those of the standard case (blue squares), a higher water vapour threshold and a reduced ozone loss of about 30 % at high water vapour mixing ratios are simulated. The shift of the water vapour threshold is due to the impact of Bry on the NO2∕NO ratio. Due to the reaction
reduced Bry yields a smaller NO2∕NO ratio and hence less ClONO2 formation in Reaction (R9) (ClO+NO2). Since ClONO2 formation is essential for chlorine activation in Reaction (R1) (ClONO2+HCl), reduced Bry yields a lower chlorine activation rate (von Hobe et al., 2011) and thus a shift of the water vapour threshold to higher water vapour mixing ratios. In the case of reduced Bry, less ozone is destroyed regarding the standard case. The ozone destruction in the ClO–BrO cycle is reduced, while the rates of Reaction (R16) (ClO+ClO) and Reaction (R13) (ClO+HO2) are similar to those of the standard case (Fig. 4e; for chemical details of the reduced-Bry case see Sect. S2). This results in the reduced ozone destruction in the 0.5 Bry case.
5.4 Extended time period
Since the occurrence of the ozone loss process analysed in this study is strongly dependent on a variety of parameters, the time period over which the ozone loss might occur is very uncertain. The impact of this time period on ozone loss was tested by extending the 7 d trajectory used in the sections above to span the entire period with temperatures low enough to maintain chlorine activation. In this time-extended simulation, temperatures are well below 200 K at the beginning of the simulation and remain below 201 K for 14 d. Hence, chlorine activation can be maintained for a longer time period than in the standard case and breaks up due to increasing temperatures (for details regarding chemical processes and temperature development along the extended trajectory see Sect. S3).
Because of the extended time period, the final ozone values using the enhanced water vapour mixing ratios for the longer trajectory (cyan triangles Fig. 11c) are much lower than those of the standard 7 d simulation (blue squares). Additionally, more ozone is formed when using low water vapour concentrations. Comparing the water vapour threshold of the 7 d trajectory (∼10.6 ppmv) and the 19 d simulation (10.2 ppmv), a shift to lower water vapour mixing ratios occurs in the 19 d trajectory. This shift is likely due to an extended time period with a temperature well below 200 K at the beginning of this trajectory, which allows a chlorine activation to occur even for slightly lower water vapour amounts. Simulations along a trajectory starting on the same day as the 7 d trajectory, but finishing on 15 August, yield the same water vapour threshold as the 7 d simulation (not shown), indicating that the shift in the threshold shown in Fig. 11 is associated with the very cold conditions at the start of the 19 d simulation. Hence, the length of the chosen trajectory has no impact on the water vapour threshold but does affect the final ozone.
Many uncertainties affect the assessment of the extent of ozone loss that occurs in the lowermost stratosphere at mid-latitudes under enhanced water vapour conditions. The number and depth of convective overshooting events as well as the area and duration affected by enhanced water vapour mixing ratios is a subject of recent research (e.g. Homeyer et al., 2014; Smith et al., 2017). The mixing ratios of important trace gases (O3, Cly, Bry, NOy) in overshooting plumes and the probability that water vapour mixing ratios high enough for chlorine activation meet temperatures low enough is a matter of debate (e.g. Schwartz et al., 2013; Homeyer et al., 2014).
The ozone loss mechanism investigated here requires the occurrence of the heterogeneous Reaction (R1), which leads to enhanced ClOx and reduced NOx mixing ratios and thus maintains effective catalytic ozone loss cycles. Enhanced ClO and reduced NO concentrations were observed by Keim et al. (1996) and Thornton et al. (2007) close to the mid-latitude tropopause under conditions with both enhanced water vapour and enhanced concentrations of condensation nuclei, such as sulfate particles. These observations were attributed to the occurrence of the heterogeneous reactions (Reaction R1, ClONO2+HCl, and Reaction R2, ClONO2+H2O; Thornton et al., 2007; Keim et al., 1996). For the temperature and the water vapour range observed in the studies of Keim et al. (1996) (15 ppmv H2O, ∼207 K) and Thornton et al. (2007) (15–22 ppmv H2O, ∼213–215 K), a heterogeneous chlorine activation would not occur in the box-model simulation conducted here, not even in a sensitivity simulation assuming a high sulfate gas phase equivalent of 7.5 ppbv H2SO4 (not shown). At low temperatures (≲196 K), heterogeneous chlorine activation may occur in the tropical stratosphere (Solomon et al., 2016; von Hobe et al., 2011). Von Hobe et al. (2011) observed enhanced ClO mixing ratios during aircraft campaigns over Australia (SCOUT-O3, 2005) and Brazil (TROCCINOX, 2005) in combination with low temperatures and the occurrence of cirrus clouds. Analysing the balance between chlorine activation and deactivation, von Hobe et al. (2011) showed an increase in the chlorine activation rate (Reaction R1) with higher ClO, BrO and O3 mixing ratios. Thus, once started, Reaction (R1) accelerates due to higher ClO mixing ratios subsequently yielding a fast conversion of NOx into HNO3 (von Hobe et al., 2011), comparable to the NOy repartitioning found in the present study. Von Hobe et al. (2011) found a threshold in ozone mixing ratio, which has to be exceeded for chlorine activation to occur. Hence, the water vapour threshold discussed here is expected to depend on the ozone mixing ratio as well. Furthermore a potential occurrence of ice particles in the lowermost mid-latitude stratosphere (Spang et al., 2015) might affect the water vapour threshold due to a different heterogeneous reactivity on ice than on liquid particles (Solomon, 1999).
An enhanced sulfate content increases the heterogeneous reaction rate caused by an enlarged liquid surface. Due to this relation, an impact of stratospheric albedo modification (by applying solar geoengineering) on the ozone loss process proposed by Anderson et al. (2012) is discussed (Dykema et al., 2014). Applying solar geoengineering would also affect the temperature in the lowermost stratosphere by perturbing the eddy heat fluxes and would change the lower stratospheric dynamics (Visioni et al., 2017). It would also affect large-scale latitudinal mixing of atmospheric tracers in the lower branch of the Brewer–Dobson circulation, leading to a different level of isolation of the tropical pipe with mid-latitudes and would result in a different chemical composition of the lower mid-latitude stratosphere (Visioni et al., 2017). Varying the sulfate content in our study showed that for temperatures and water vapour conditions of the case based on observations, a moderate enhancement of 3×H2SO4 is sufficient to yield ozone depletion. Considering the temperature and water vapour dependence of the chlorine activation line (Fig. 9, white line), a 10× enhancement of stratospheric sulfate yields a shift of chlorine activation to slightly lower water vapour mixing ratios and higher temperatures. However, even for enhanced sulfate and a water vapour mixing ratio of 20 ppmv, the temperature has to fall below 205 K for chlorine activation (and hence ozone depletion) to occur at the assumed Cly and NOy conditions of the standard case.
After the chlorine activation step, catalytic ozone loss cycles can occur: the ClO–dimer cycle, the ClO–BrO cycle and cycles subsequent to Reaction (R13) (ClO+HO2, Cycles C2–C4). Cycle (C2) is reported to have an impact on stratospheric ozone in mid-latitudes in previous studies (e.g. Johnson et al., 1995; Kovalenko et al., 2007; Ward and Rowley, 2016). Here, Cycle (C2) was found to be the dominate cycle based on Reaction (R13) under standard conditions. Nevertheless, simulating the “0.5 Bry” and “high Cly” case has shown that the relevance of the ClO–dimer cycle and the ClO–BrO cycle depends on the assumed initial values of Cly and Bry. Anderson and Clapp (2018) discussed the occurrence of the ClO–dimer cycle and the ClO–BrO cycle dependent on water vapour, the Cly mixing ratio and temperature. They illustrate a significant increase in the rate of Reactions (R16) (ClO+ClO) and (R17) (ClO+BrO) if the combination of enhanced water vapour and low temperatures is sufficient for chlorine activation to occur. If chlorine activation occurs in their model study, a higher Cly mixing ratio yields higher catalytic ozone loss rates (Reactions R16, R17). Their finding regarding the effect of temperature, water vapour and chlorine on the ozone loss process is consistent with the results found here. The occurrence of net chlorine activation is determined by the temperature and water vapour mixing ratios, while the Cly mixing ratio controls how much ozone is destroyed.
A measure for the effect of temperature and water vapour on stratospheric chlorine activation and ozone chemistry is the temperature- and water-vapour-dependent chlorine activation line (Fig. 9, white line). Anderson et al. (2012) reported that lower temperatures than 205 K are necessary for chlorine activation to occur at a water vapour mixing ratio of 20 ppmv and a climatological non-enhanced sulfate content. In comparison, assuming standard conditions for Cly and NOy but a constant temperature here, temperatures lower than 203 K are required for ozone loss to occur at similar H2O and sulfate concentrations. The standard trajectory was chosen here to hold for conditions most likely for chlorine activation based on SEAC4RS measurements. For the temperature range of this trajectory and the measured water vapour mixing ratio (10.6 ppmv) no significant ozone depletion occurs. Hence, for all SEAC4RS and MACPEX trajectories calculated (not only the shown examples), no trajectory produced ozone loss. A further requirement for the occurrence of chlorine activation is the maintenance of the conditions, which yield chlorine activation, during the entire time of chlorine activation. Assuming standard conditions and a water vapour mixing ratio of 20 ppmv, chlorine activation takes 5 h. However, for a water vapour content close to the water vapour threshold, low temperatures and enhanced water vapour mixing ratios have to be maintained for 24–36 h for chlorine activation to have an impact on stratospheric ozone chemistry. For the occurrence of ozone depletion, temperatures have also to remain low and water vapour mixing ratios high after the chlorine activation step.
The maximum ozone depletion at standard conditions occurs here for a water vapour mixing ratio of 20 ppmv. Final ozone assuming 20 ppmv H2O in the 7 d simulation is 11 % lower than the final ozone reached under atmospheric background conditions assuming 5 ppmv H2O. For the 19 d simulation assuming 20 ppmv H2O, the final ozone is reduced by 22 % compared to the 19 d simulation assuming 5 ppmv H2O. Anderson and Clapp (2018) calculated a similar ozone reduction of 17 % in a 14 d simulation and the same potential temperature range of 380 K assuming 20 ppmv H2O and somewhat higher Cly (∼ 0.2 ppbv) than as used here in the realistic case. In contrast assuming the high Cly and NOy mixing ratios employed by Anderson et al. (2012) in the case of high Cly would lead to an ozone loss of 85 % (265 ppbv) during the 7 d simulation. This ozone loss would occur in the lower stratosphere.
Borrmann et al. (1996, 1997) and Solomon et al. (1997) conducted a study about the impact of cirrus clouds on chlorine activation and ozone chemistry in the mid-latitude lowermost stratosphere. They found a significant impact of heterogeneous processes occurring on cirrus clouds for ozone chemistry of the lowermost stratosphere but a minor effect for column ozone. Anderson and Clapp (2018) calculated a fractional loss in the total ozone column of 0.24 %–0.27 % assuming a full Cly profile in the altitude range of 12–18 km with a constant water vapour mixing ratio of 20 ppmv and the mixing ratio of Cly somewhat higher (∼0.2 ppbv at a potential temperature of 380 K) than in our standard case. However, our simulations and those of Anderson and Clapp (2018) assume a constant high water vapour mixing ratio and neglect mixing with the stratospheric background, which is characterized by much lower water vapour mixing ratios and subsequent dilution of convective uplifted air masses. Ozone loss would only occur in the specific volume of stratospheric air, which is directly affected by the convectively injected additional water. Hence, the ozone loss presented here corresponds to the maximal possible ozone loss for rather realistic convective overshooting conditions.
We investigated in detail the ozone loss mechanism at mid-latitudes in the lower stratosphere occurring under enhanced water vapour conditions and the sensitivity of this ozone loss mechanism under a variety of conditions. A CLaMS box-model study was conducted including a standard assumption and a variety of sensitivity cases regarding the chemical initialization, temperatures and duration of the simulated period. The assumed standard conditions (155.7 pptv Cly, 728.8 pptv NOy, 197–202 K and an H2SO4 gas phase equivalent of 0.20 ppbv) were determined based on measurements in an H2O environment showing strongly enhanced H2O values compared to the stratospheric background during the SEAC4RS aircraft campaign in Texas 2013.
The ozone loss mechanism consists of two phases: the first step is chlorine activation due to the heterogeneous reaction ClONO2+HCl (Reaction R1), which yields both an increase in ClOx and a decrease in NOx. In the second phase, when chlorine is activated, enhanced ClOx mixing ratios lead to catalytic ozone loss cycles. Our findings show that besides the ClO–dimer cycle and the ClO–BrO cycle, three ozone loss cycles (C2)–(C4) based on the reaction ClO+HO2 (Reaction R13) have to be taken into account. The relevance of the different ozone loss cycles for ozone destruction depends on water vapour, Cly and Bry mixing ratios. Reduced NOx mixing ratios yield a decreasing chemical net ozone formation in Cycle (C1). This reduced ozone formation at high water vapour mixing ratios in the box-model simulation amounts to around 20 % of the ozone destruction in catalytic ozone loss cycles. Furthermore a detailed analysis of chemical processes revealed the occurrence of pathways which maintain high ClOx and low NOx mixing ratios after the chlorine activation step but do not destroy ozone, similar to HCl null cycles in the lower stratosphere in Antarctic early spring (Müller et al., 2018).
Focussing on the dependence of chlorine activation on temperature and water vapour mixing ratio, we found that the temperature has to fall below 203 K for chlorine activation to occur at a water vapour mixing ratio of 20 ppmv and Cly and NOy for our standard case. Testing the water vapour dependence of ozone loss along a realistic trajectory that experienced very low temperatures between 197 and 202 K, we observed a water vapour threshold of 10.6 ppmv H2O, which has to be exceeded for chlorine activation to occur. An ozone loss occurs in these simulations for at least 12 ppmv H2O. For our assumed standard conditions, a maximum ozone loss of 9 % (27 ppbv) was calculated for a water vapour mixing ratio of 20 ppmv. In contrast, a simulation assuming the observed conditions (10.6 ppmv H2O) yielded ozone formation; but a tripling of background sulfate gas phase equivalent (as it can be reached under geoengineering conditions or volcanic eruptions) is sufficient for a slight ozone loss to occur under these unusually cold conditions. Simulating a high Cly case assuming initial Cly and NOy based on the study of Anderson et al. (2012) results in both a lower water vapour threshold of ∼8 ppmv and a larger ozone depletion of 85 % (265 ppbv) at high water vapour mixing ratios. The model runs described here assume an air parcel moving along the trajectory, which does not mix with neighbouring air masses. In the case of water, mixing would likely reduce the concentration. Because mixing was neglected, the runs discussed here are likely an extreme case, and the ozone loss simulated provides an upper bound.
Considering the duration for which low temperatures and high water vapour mixing ratios have to be maintained to activate chlorine and deplete stratospheric ozone, a chlorine activation time of 24 to 36 h when the water vapour abundance is close to the water vapour threshold and of 5 h assuming 20 ppmv H2O was calculated. The water vapour threshold depends strongly on a changing temperature and sulfate content as well as on Cly, NOy and Bry mixing ratios. The dependence of the water vapour threshold is explained here by focussing on the water dependence of the heterogeneous reactivity (Reaction R1) and the balance between heterogeneous chlorine activation (Reaction R1, ClONO2+HCl) and gas phase chlorine deactivation (Reaction R12, Cl+CH4).
The ozone loss mechanism was investigated here by conducting box-model simulations along a trajectory, which was calculated based on measurements of enhanced water vapour. Sensitivity and case studies, which cover a range of uncertainties, illustrate the impact of the Cly, NOy, Bry and H2O mixing ratios, the temperature, the sulfate gas equivalent and the duration of the simulated period on the ozone loss process. While the water vapour threshold which has to be exceeded for chlorine activation to occur is mainly determined by the temperature, water vapour mixing ratio and sulfate content, the intensity of ozone loss depends on and the duration of the time period, for which a chlorine activation can be maintained. Our comprehensive sensitivity studies are a basis on which to assess the impact of enhanced water vapour mixing ratios in the lower mid-latitude stratosphere on ozone under sulfate geoengineering conditions and in a changing climate. However, for the conditions observed during SEAC4RS (in particulary H2O=10.6 ppmv), we did not simulate any ozone depletion. Global modelling studies are needed to establish whether the mechanism analysed here is of concern for the future.
The complete SEAC4RS data are available at https://www-air.larc.nasa.gov/cgi-bin/ArcView/seac4rs (last access: 30 April 2019, NASA, 2019). The CLaMS box model calculations can be requested from Sabine Robrecht (sa.robrecht@fz-juelich.de).
In Sect. 3.2.2 chlorine-catalysed ozone loss cycles are analysed and the maintenance of activated chlorine is described schematically based on Fig. 6. Here, we describe the pathways yielding the maintenance of activated chlorine and balancing the NOx mixing ratio in more detail, including all radical balancing reactions. Since the pathway balancing HCl formation and destruction is coupled with the pathway balancing HNO3 formation and destruction, both are combined here. In total, two pathways are described here, which balance HCl formation and destruction as well as HNO3 formation and destruction, and which mainly differ in the reaction of the methylperoxy radical (H3COO+NO, Reaction R21, or H3COO+ClO, Reaction R22).
At water vapour mixing ratios slightly higher than the water vapour threshold, H3COO reacts instead with NO. Hence, pathway (AC1) mainly balances HCl and ClOx as well as HNO3 and NOx.
In pathway (AC1), HCl is formed in Reaction (R12). The methyl radical formed in Reaction (R12) reacts quickly with oxygen in Reaction (AR1), yielding a methylperoxy radical H3COO, which reacts with NO in Reaction (R21). In Reaction (R9) ClONO2 is formed, which reacts with HCl heterogeneously in Reaction (R1) (and thus leads to an HCl depletion). HNO3 formed in Reaction (R1) is depleted in Reaction (R19). These reactions constitute the balance between HCl and HNO3 formation and destruction. Reactions (R10) and (R11) balance the ClOx species, Reactions (R7) and (AR3) the NOx species, Reactions (R13) and (R14) the HOx species and Reaction (R8) odd oxygen (Ox). All of these radical reactions are significantly faster than the reactions, which constitute the balance between HCl and HNO3 formation and destruction. Hence, the net reaction of this pathway is the oxidation of CH4 to HCHO (formaldehyde).
In Pathway (AC1) the H3COO radical reacts with NO (Reaction R21). As an alternative the H3COO radical reacts with ClO (Reaction R22) at high water vapour mixing ratios yielding to Pathway (AC2) as the balance between HCl and HNO3 formation and destruction.
The main difference between pathway (AC1) and (AC2) is the reaction of the H3COO radical. Reactions (R12), (AR1), (R9), (R1) and (R19) balance HCl and ClOx as well as HNO3 and NOx. Reactions (R10), (R11), (R13), (R14) and (R8) convert the radical species and are very fast. The net reaction of this pathway is the oxidation of methane (CH4) into formaldehyde (HCHO) with simultaneous ozone destruction. Since the ozone destruction due to the catalytic ozone loss cycles discussed in Sect. 3.2.2 is much faster, the ozone destruction in Pathway (AC2) is negligible compared to the ozone loss cycles discussed above.
The MACPEX case (Mid-latitude Airborne Cirrus Properties Experiment) was conducted to complement the results obtained from the standard case as a further example for an event with high stratospheric water vapour based on airborne measurements. In this section, first the model set-up for the MACPEX case is described. In a second step, the results of model calculations of the MACPEX case are presented, comprising the chosen trajectory for chemical simulations and the sensitivity of ozone chemistry to various conditions.
B1 Model set-up
Simulations are performed similarly to the SEAC4RS case (see. Sect. 2) based on measurements with enhanced water vapour of at least 10 ppmv taken during the MACPEX campaign (Rollins et al., 2014). Chemistry is calculated for single air parcels along trajectories including diabatic descent. Trajectories are calculated as described in Sect. 2.2. For chemical initialization, important trace gases for ozone chemistry – O3, Cly and NOy – are initialized based on MACPEX measurements. Ozone and water vapour were measured directly during the aircraft campaign, and Cly and NOy are inferred from tracer–tracer relations using N2O measured on the aircraft employed. The initialization of all further trace gases except for water vapour were taken from the full-chemistry 3-D CLaMS simulation (Vogel et al., 2015, 2016) for summer 2012 at the location of the measurement. Chemistry was initialized 7 d before the measurement.
The MACPEX campaign (Rollins et al., 2014) took place during spring 2011 and was based in Houston, Texas. The water vapour values used here were measured by the Fast In situ Stratospheric Hygrometer (FISH), which employs the Lyman-α photofragment fluorescence technique (Meyer et al., 2015). MACPEX ozone was measured by the UAS O3 instrument (Gao et al., 2012). Initial Cly and NOy were assumed based on tracer–tracer correlations with N2O that was measured by the Jet Propulsion Laboratory's Aircraft Laser Infrared Absorption Spectrometer (ALIAS) instrument (Webster et al., 1994).
Initial Cly and NOy is calculated based on N2O tracer–tracer correlations (Grooß et al., 2014; see also Appendix C) with corrections considering a N2O increase from 2009 to 2013. Cly is determined using the same correlation with CH4 as for the standard case (see Sect. 2.3). Therefore CH4 is first calculated using measured N2O of 320.28 ppbv and a correlation based on measurements from 2009 (Grooß et al., 2014). The increase in stratospheric CH4 and N2O is considered as described for the standard case (GHG Bulletin, 2014). First, an increase in N2O of 1.6 ppbv from 2009 to 2011 is estimated to adjust N2O. Furthermore calculated CH4 is adjusted considering a difference in CH4 between 2000 and 2009 of 0.026 ppm. The annual decrease in Cly from 2000 to 2011 is assumed to be 0.8 % (WMO, 2014). A summary of the initial values for main tracers assumed in the MACPEX case are given in Table B1. Furthermore sensitivity studies assuming only 80 % of initial Cly (0.8 Cly), 80 % of initial NOy (0.8 NOy), and an elevated H2SO4 background (0.6 ppbv H2SO4) are conducted.
Table B1Mixing ratios and sources used for initialization of relevant trace gases for the MACPEX case. Cly and NOy values were determined based on tracer–tracer correlations (see text). Initial mixing ratios of ClOx species were assumed to be zero.

B2 Results of MACPEX simulations
During the MACPEX campaign only a few cases with enhanced stratospheric water vapour were observed. Here we present an example for a trajectory calculated based on such a case. This trajectory is used to test the sensitivity of the lowermost stratospheric ozone in mid-latitudes on the water vapour, Cly and NOy mixing ratios and on an enhancement of stratospheric sulfate.
B2.1 MACPEX trajectory
The selected trajectory for the MACPEX case is shown in Fig. B1. It refers to a measurement on 11 April 2011 during the MACPEX campaign. In panel (a), a backward trajectory is presented in the range of −7 to 0 d from the time of measurement and a forward trajectory in the range from 0 to 7 d. In panel (b), the location of the measurement is shown by a red square.
The potential temperature level of this trajectory is around 380 K and above the tropopause located at ∼350 K, which was deduced from the temperature profile measured during the flight on 11 April 2011. The forward trajectory shows a strongly increasing temperature and pressure level due to a decrease in altitude. Coming from the western Pacific, this air parcel passes the North American continent briefly. The backward trajectory reaches very low temperatures with a minimum temperature of 191 K. Because of its low temperature, which pushes the occurrence of heterogeneous reactions, the backward trajectory is chosen to test the sensitivity of lowermost stratospheric ozone to a variety of conditions.
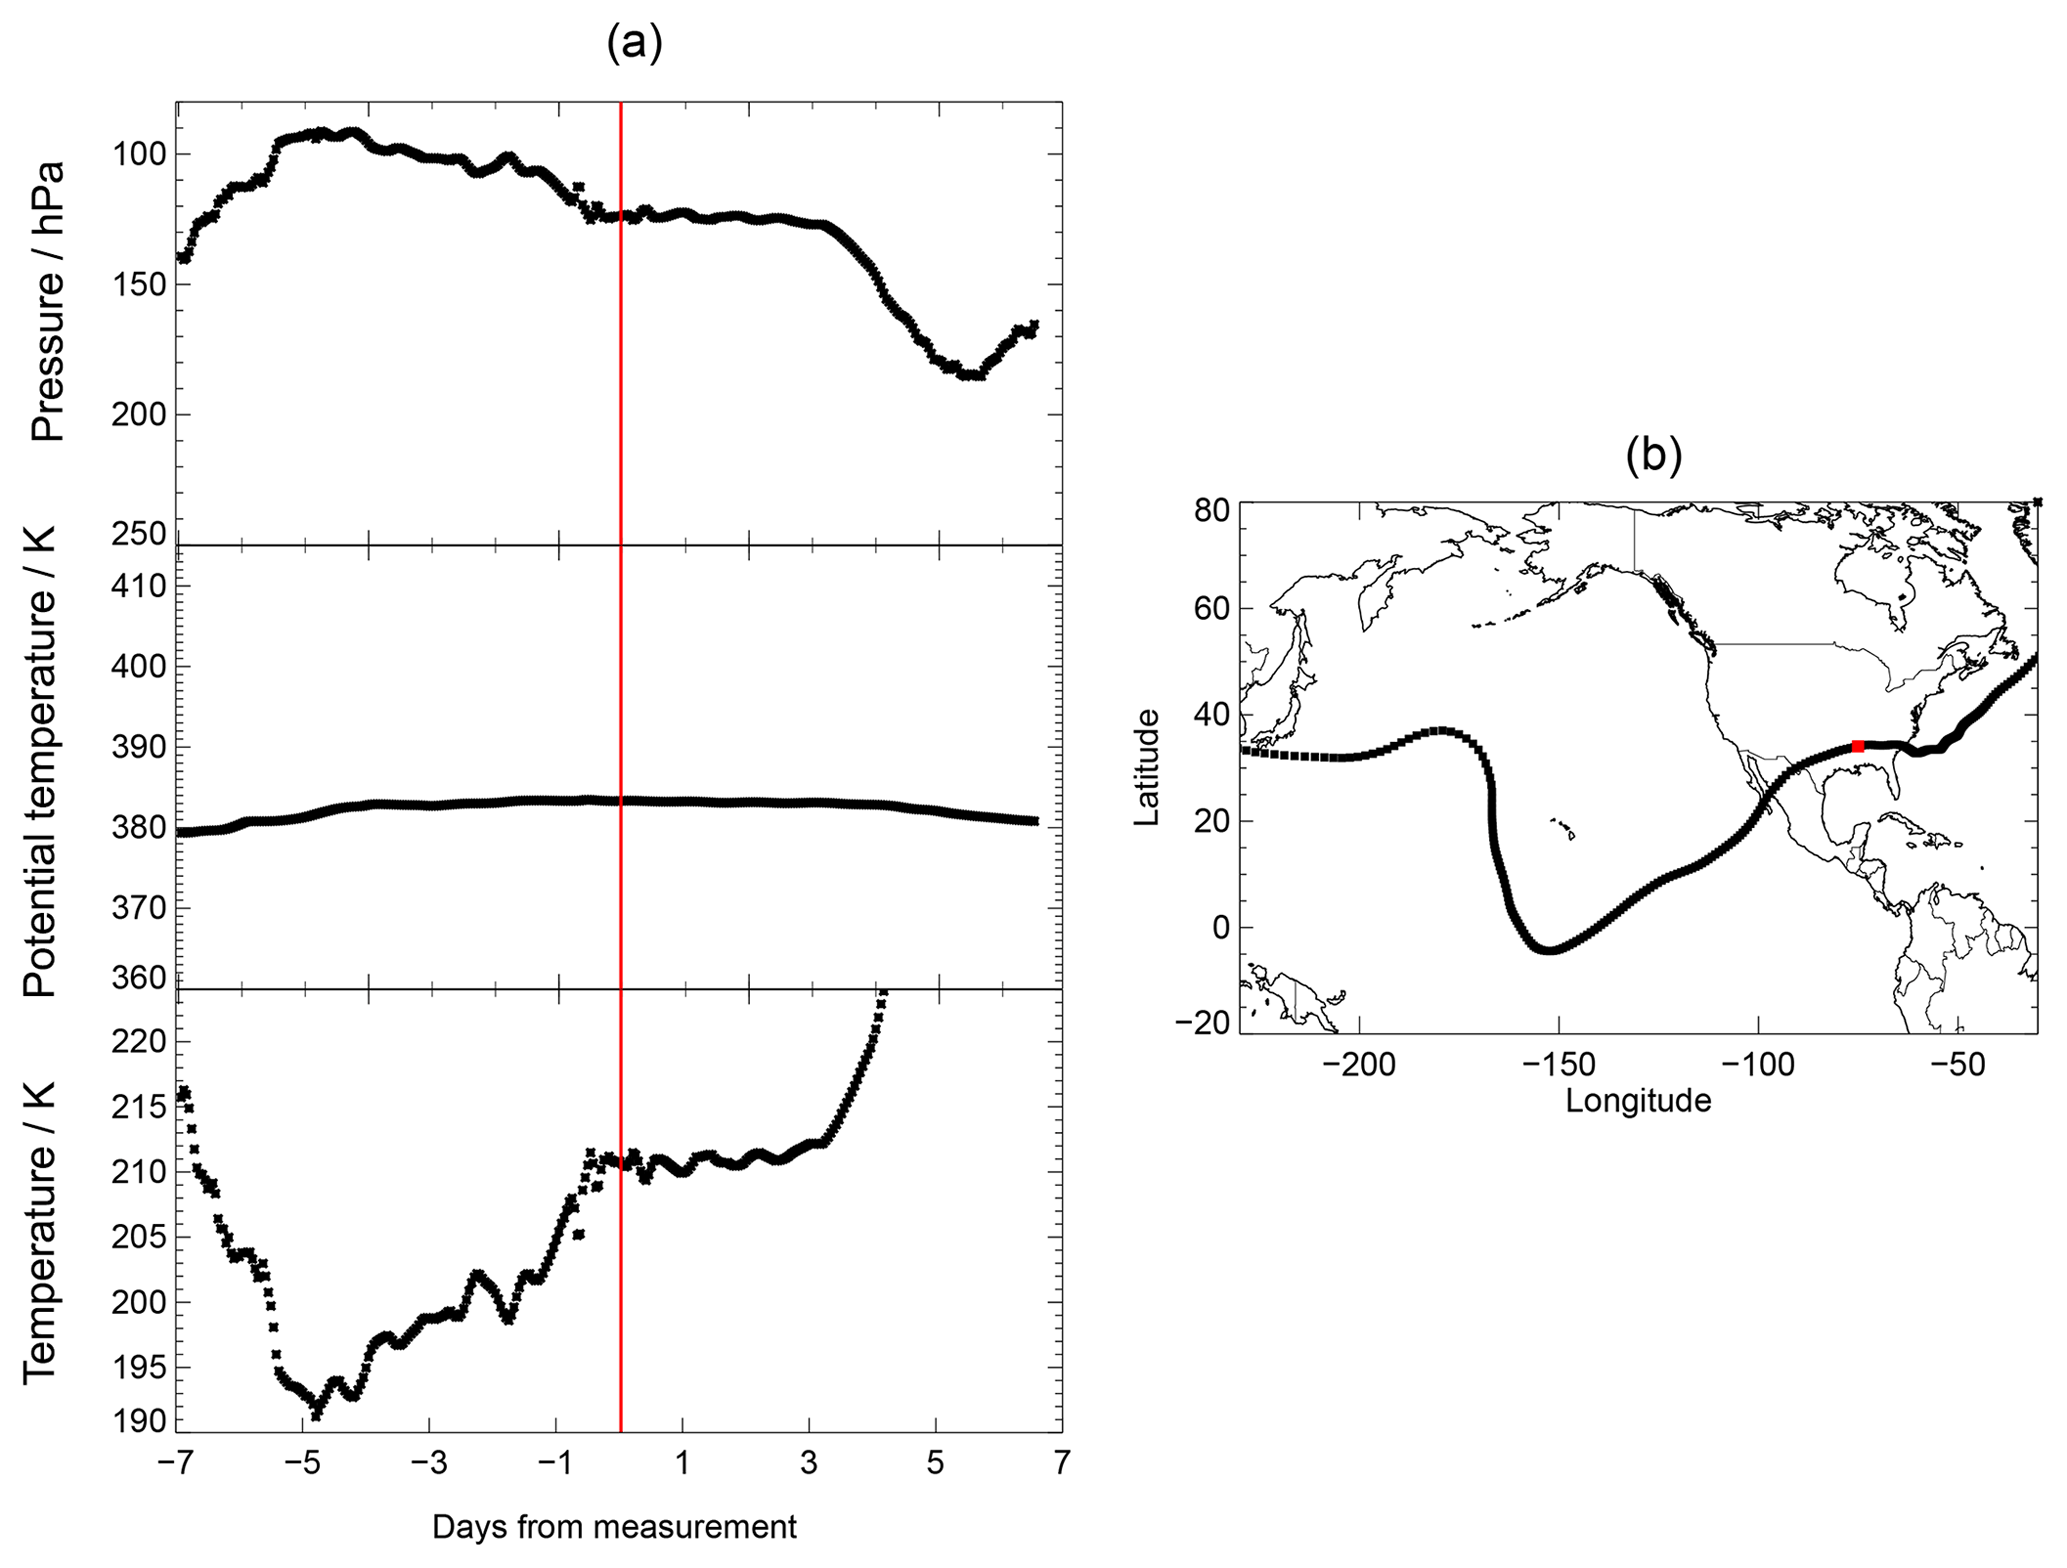
Figure B1Pressure, potential temperature, temperature and location of the selected trajectory calculated based on measurements with enhanced water vapour during the MACPEX aircraft campaign. The red line (a) marks the time of measurement and the red square (b) mark the location of the measurement. Since the tropopause is very low, it is not plotted here. In (b), the beginning of the trajectory (4 April 2011) is at the left edge of the panel. In the bottom panel of (a), the MACPEX trajectory consists of single squares due to a faster movement of the air parcel in that region.
B2.2 Sensitivity studies
Chemical simulations assuming the MACPEX initialization (Table B1) and a water vapour mixing ratio varying between 5 and 20 ppmv are performed along the MACPEX 7 d backward trajectory. Final ozone, reached at the end of this simulations, is shown as blue squares in Fig. B2. The water vapour threshold necessary for chlorine activation to occur is reached at 8 ppmv H2O. It is a lower water vapour mixing ratio than for the SEAC4RS case, because of the very low temperatures reached. For the MACPEX trajectory and 8 ppmv H2O, the time until chlorine is activated is 63 h from the beginning of the trajectory. Because of increasing temperatures (see Fig. B2), chlorine activation can be maintained for 14 h at this water vapour mixing ratio. Hence, no decrease in final ozone can be observed during this simulation. For higher water vapour mixing ratios, chlorine activation is maintained for a longer time and final ozone is reduced compared with final ozone reached for low water vapour mixing ratios. In general, the decrease in final ozone is much lower for the MACPEX case than for the SEAC4RS case. In the MACPEX initialization, Cly is a third of Cly in the SEAC4RS initialization. Hence, catalytic ozone loss has lower rates for MACPEX conditions and ozone is less affected by chlorine activation. Even assuming high water vapour of 20 ppmv yields higher final ozone than initial ozone for MACPEX conditions. Although chlorine is activated in the MACPEX case, no net ozone destruction occurs.
The impact of changes in sulfate, Cly and NOy is tested for the MACPEX case as well. The changes affect the water vapour threshold in the same way as in the SEAC4RS case. An enhancement of sulfate (Fig. 7, yellow diamonds), and a reduction in NOy (green triangles) shifts the water vapour threshold to lower water vapour mixing ratios. A reduction in Cly (black circles) shifts it to higher water vapour mixing ratios.
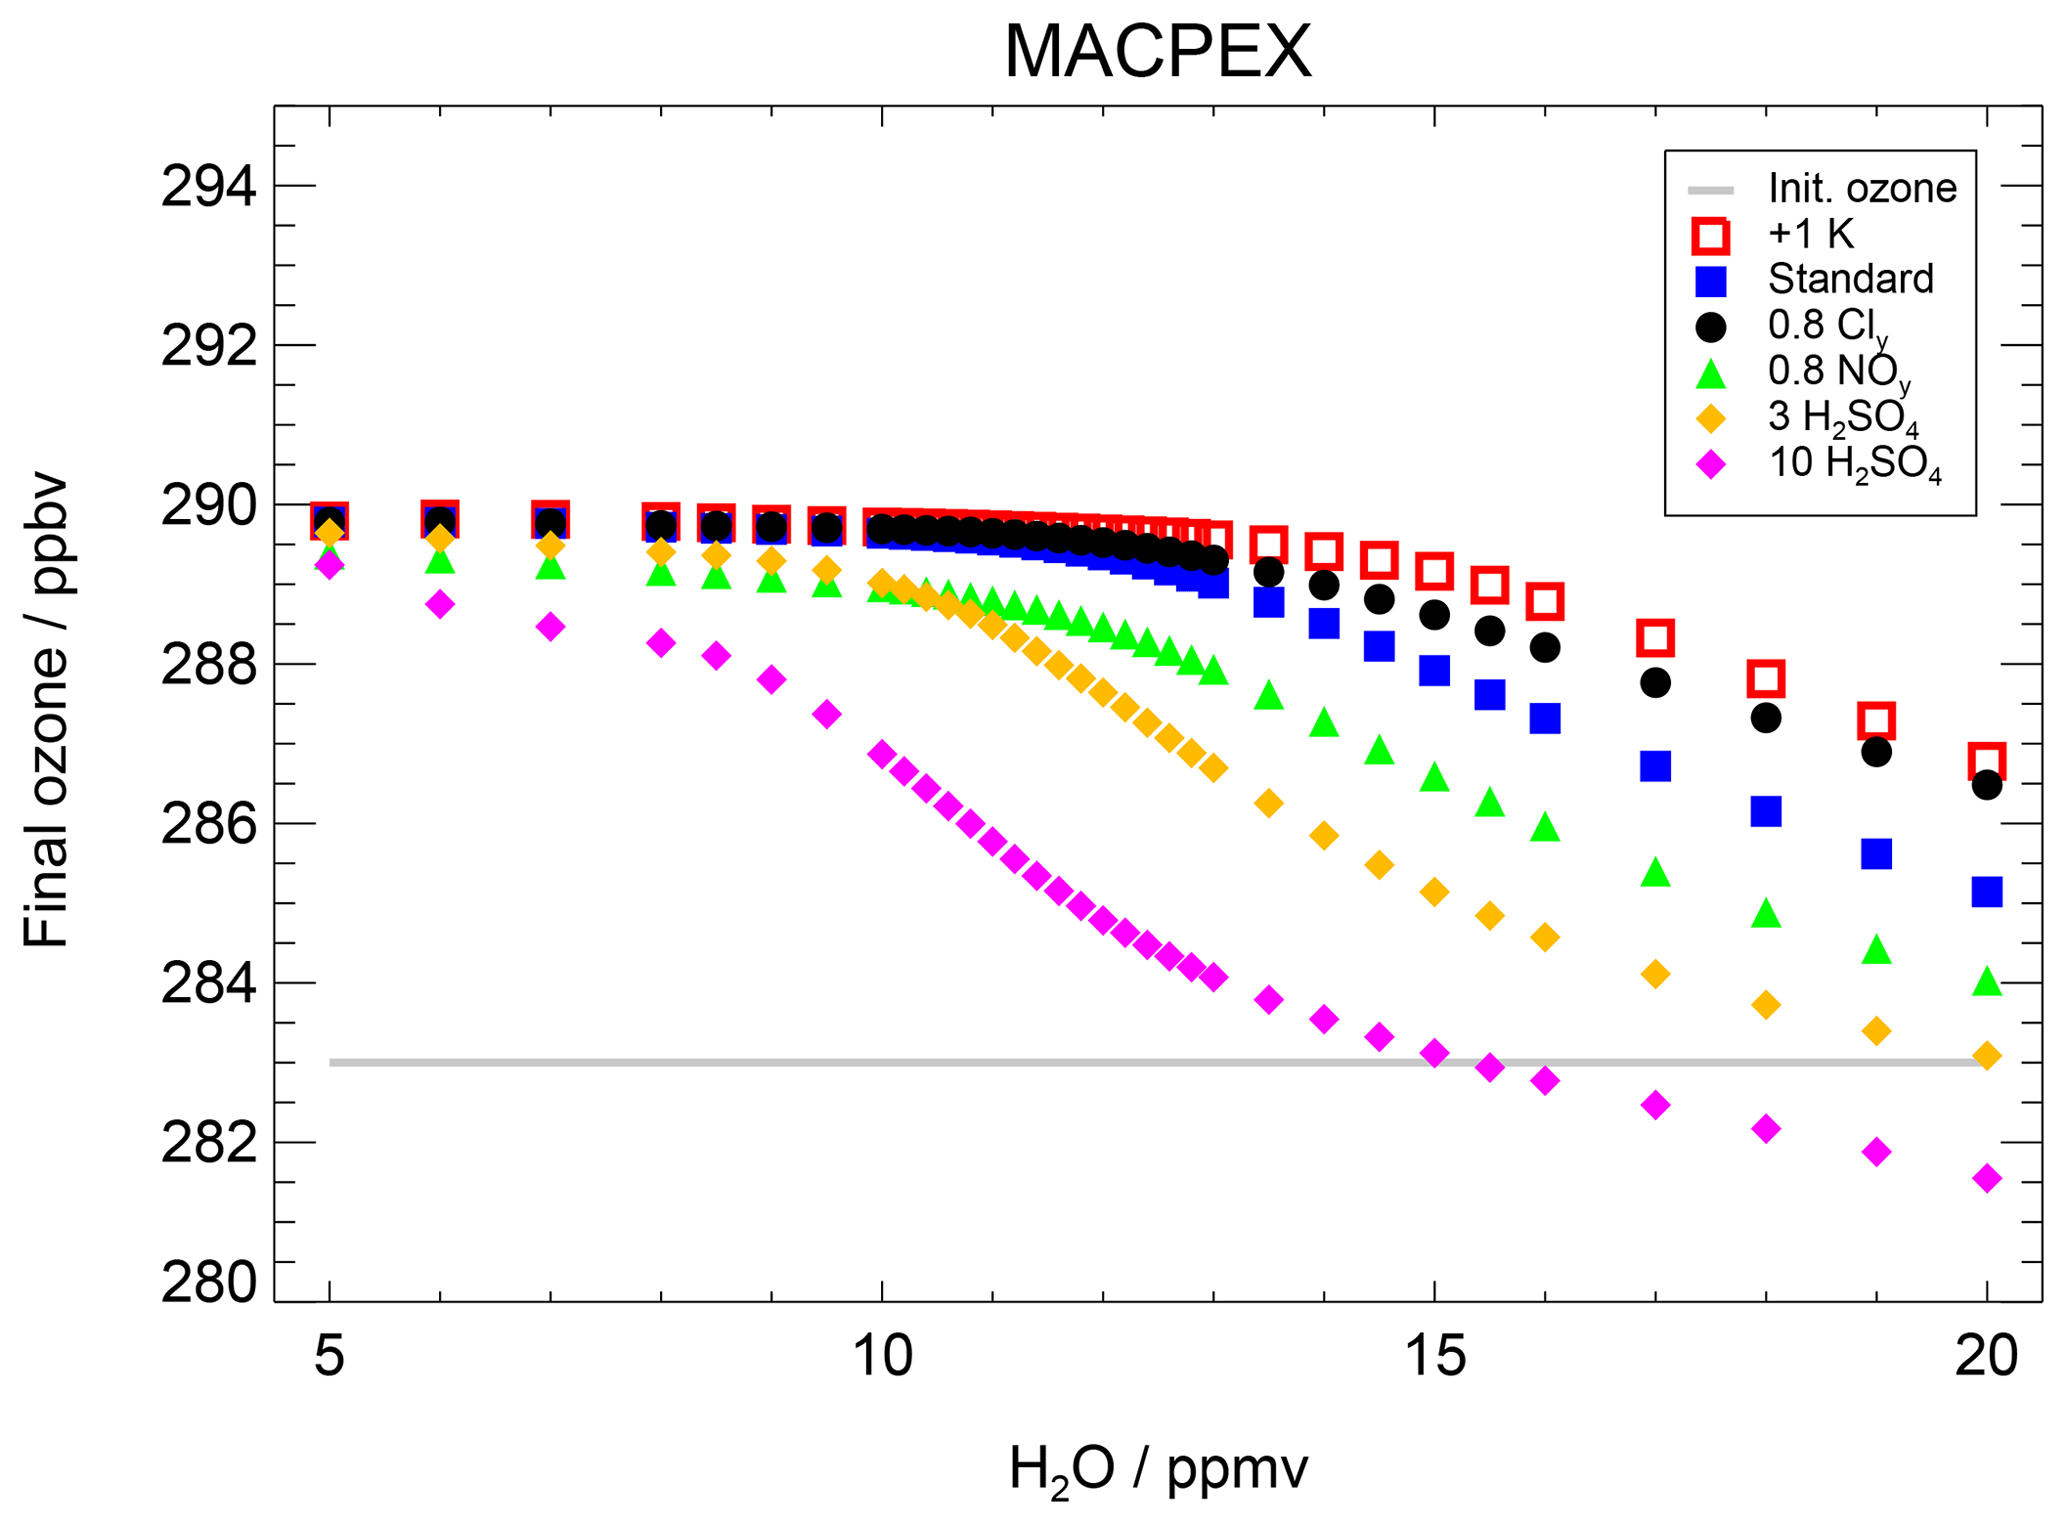
Figure B2Impact of the water vapour content on the ozone mixing ratio (final ozone) reached at the end of the 7 d simulation along the MACPEX trajectory. The standard case is shown in blue and the initial ozone amount is marked by the grey line. An impact on the final ozone mixing ratios is observable after exceeding a critical threshold in water vapour. This threshold changes with a shift in the temperature (+1 K, red), the Cly mixing ratio to 0.8 Cly (black), the NOy mixing ratio (0.8 NOy, green) and the sulfate content (3× standard H2SO4, yellow, 10× standard H2SO4, pink).
The mixing ratios of Cly and NOy were initialized based on stratospheric tracer–tracer correlations from Grooß et al. (2014). Cly and NOy were initialized based on a CH4 measurement during the SEAC4RS aircraft campaign. Initial Cly was calculated using the tracer–tracer correlation (Grooß et al., 2014)
The volume mixing ratio of Cly ([Cly]) is here in parts per trillion of volume (pptv) and the mixing ratio of methane ([CH4]) is in parts per million of volume (ppmv).
To determine NOy based on the CH4 measurement, first N2O was calculated through
assuming [N2O] (in ppbv) and [CH4] (in ppmv) (Grooß et al., 2002). Subsequently NOy (in ppt) was calculated in a correlation with N2O.
In the MACPEX case NOy and Cly were initialized based on N2O measurements. NOy was calculated using Eq. (C3). Cly was calculated using Eq. (C1). Therefore first CH4 (in ppmv) had to be calculated based on a correlation with N2O (in ppbv) (Grooß et al., 2014).
The supplement related to this article is available online at: https://doi.org/10.5194/acp-19-5805-2019-supplement.
SR, BV and RM developed the concept of the study. SR conducted the box-model simulations. SR,BV, JUG, KR and RM contributed to data interpretation. AR, TT, LC and MK provided in situ measurements and gave advice on the use of the data. SR wrote the manuscript and designed the figures with contributions of all co-authors.
The authors declare that they have no conflict of interest.
Our activities were funded by the German Science Foundation (Deutsche
Forschungsgemeinschaft, DFG) under the DFG project CE-O3 in the context of
“Priority Program Climate Engineering: Risks, Challenges,
Opportunities?” (SPP 1689; VO 1276/4-1). We thank the European Centre for Medium-Range
Weather Forecasts (ECMWF) for providing ERA-Interim data. We thank the group
of Steven Wofsy (Harvard University, Department Earth and Planetary Science,
Cambridge, MA USA) and Jessica Smith for providing their data measured during
the SEAC4RS aircraft campaign. Furthermore, we thank Simone Tilmes for
helpful discussions.
The article processing charges for this open-access
publication were covered by a Research
Centre
of the Helmholtz Association.
This paper was edited by Martin Dameris and reviewed by two anonymous referees.
Anderson, J. G. and Clapp, C. E.: Coupling free radical catalysis, climate change, and human health, Phys. Chem. Chem. Phys., 20, 10569–10587, https://doi.org/10.1039/C7CP08331A, 2018. a, b, c, d, e, f
Anderson, J. G., Wilmouth, D. M., Smith, J. B., and Sayres, D. S.: UV Dosage Levels in Summer: Increased Risk of Ozone Loss from Convectively Injected Water Vapor, Science, 337, 835–839, https://doi.org/10.1126/science.1222978, 2012. a, b, c, d, e, f, g, h, i, j, k, l, m, n, o, p, q, r, s, t, u, v, w, x, y, z, aa, ab, ac, ad
Anderson, J. G., Weisenstein, D. K., Bowman, K. P., Homeyer, C. R., Smith, J. B., Wilmouth, D. M., Sayres, D. S., Klobas, J. E., Leroy, S. S., Dykema, J. A., and Wofsy, S. C.: Stratospheric ozone over the United States in summer linked to observations of convection and temperature via chlorine and bromine catalysis, P. Natl. Acad. Sci. USA, 114, 4905–4913, https://doi.org/10.1073/pnas.1619318114, 2017. a, b, c
Becker, G., Grooß, J.-U., McKenna, D. S., and Müller, R.: Stratospheric photolysis frequencies: Impact of an improved numerical solution of the radiative transfer equation, J. Atmos. Chem., 37, 217–229, https://doi.org/10.1023/A:1006468926530, 2000. a
Berthet, G., Jégou, F., Catoire, V., Krysztofiak, G., Renard, J.-B., Bourassa, A. E., Degenstein, D. A., Brogniez, C., Dorf, M., Kreycy, S., Pfeilsticker, K., Werner, B., Lefèvre, F., Roberts, T. J., Lurton, T., Vignelles, D., Bègue, N., Bourgeois, Q., Daugeron, D., Chartier, M., Robert, C., Gaubicher, B., and Guimbaud, C.: Impact of a moderate volcanic eruption on chemistry in the lower stratosphere: balloon-borne observations and model calculations, Atmos. Chem. Phys., 17, 2229–2253, https://doi.org/10.5194/acp-17-2229-2017, 2017. a
Borrmann, S., Solomon, S., Dye, J. E., and Luo, B.: The potential of cirrus clouds for heterogeneous chlorine activation, Geophys. Res. Lett., 23, 2133–2136, https://doi.org/10.1029/96GL01957, 1996. a, b, c
Borrmann, S., Solomon, S., Avallone, L., Toohey, D., and Baumgardner, D.: On the occurrence of ClO in cirrus clouds and volcanic aerosol in the tropopause region, Geophys. Res. Lett., 24, 2011–2014, https://doi.org/10.1029/97GL02053, 1997. a, b, c
Brewer, A. W.: Evidence for a world circulation provided by the measurements of helium and water vapour distribution in the stratosphere, Q. J. Roy. Meteorol. Soc., 75, 351–363, https://doi.org/10.1002/qj.49707532603, 1949. a
Brown, P. N., Byrne, G. D., and Hindmarsh, A. C.: VODE: A variable coefficient ODE solver, SIAM J. Sci. Stat. Comput., 10, 1038–1051, https://doi.org/10.1137/0910062, 1989. a
Crutzen, P. J., Müller, R., Brühl, C., and Peter, T.: On the potential importance of the gas phase reaction and the heterogeneous reaction in “ozone hole” chemistry, Geophys. Res. Lett., 19, 1113–1116, https://doi.org/10.1029/92GL01172, 1992. a
Daniel, J. S., Solomon, S., Portmann, R. W., and Garcia, R. R.: Stratospheric ozone destruction: The importance of bromine relative to chlorine, J. Geophys. Res., 104, 23871–23880, https://doi.org/10.1029/1999JD900381, 1999. a
Dee, D. P., Uppala, S. M., Simmons, A. J., Berrisford, P., Poli, P., Kobayashi, S., Andrae, U., Balmaseda, M. A., Balsamo, G., Bauer, P., Bechtold, P., Beljaars, A. C. M., van de Berg, L., Bidlot, J., Bormann, N., Delsol, C., Dragani, R., Fuentes, M., Geer, A. J., Haimberger, L., Healy, S. B., Hersbach, H., Hólm, E. V., Isaksen, L., Kållberg, P., Köhler, M., Matricardi, M., McNally, A. P., Monge-Sanz, B. M., Morcrette, J.-J., Park, B.-K., Peubey, C., de Rosnay, P., Tavolato, C., Thépaut, J.-N., and Vitart, F.: The ERA-Interim reanalysis: configuration and performance of the data assimilation system, Q. J. Roy. Meteor. Soc., 137, 553–597, https://doi.org/10.1002/qj.828, 2011. a
Drdla, K. and Müller, R.: Temperature thresholds for chlorine activation and ozone loss in the polar stratosphere, Ann. Geophys., 30, 1055–1073, https://doi.org/10.5194/angeo-30-1055-2012, 2012. a, b, c
Dykema, J. A., Keith, D. W., Anderson, J. G., and Weisenstein, D.: Stratospheric controlled pertubation experiment: a small-scale experiment to improve understanding of the risks of solar geoengineering, Phil. Trans. R. Soc. A, 372, 1–22, https://doi.org/10.1098/rsta.2014.0059, 2014. a
Elrod, M. J., Koch, R. E., Kim, J. E., and Molina, M.: HCl vapour pressures and reaction probabilities for ClONO2+HCl on liquid solutions, Faraday Discuss., 100, 269–278, 1995. a
Gao, R. S., Ballard, J., Watts, L. A., Thornberry, T. D., Ciciora, S. J., McLaughlin, R. J., and Fahey, D. W.: A compact, fast UV photometer for measurement of ozone from research aircraft, Atmos. Meas. Tech., 5, 2201–2210, https://doi.org/10.5194/amt-5-2201-2012, 2012. a, b
GHG Bulletin: WMO Greenhouse Gas Bulletin, GHG Bulletin No.10, WMO, available at: https://library.wmo.int/pmb_ged/ghg-bulletin_10_en.pdf (last access: 16 April 2019), 2014. a, b, c
Grenfell, J. L., Lehmann, R., Mieth, P., Langematz, U., and Steil, B.: Chemical reaction pathways affecting stratospheric and mesospheric ozone, J. Geophys. Res. A, 111, D17311, https://doi.org/10.1029/2004JD005713, 2006. a
Grooß, J.-U., Günther, G., Konopka, P., Müller, R., McKenna, D. S., Stroh, F., Vogel, B., Engel, A., Müller, M., Hoppel, K., Bevilacqua, R., Richard, E., Webster, C. R., Elkins, J. W., Hurst, D. F., Romashkin, P. A., and Baumgardner, D. G.: Simulation of ozone depletion in spring 2000 with the Chemical Lagrangian Model of the Stratosphere (CLaMS), J. Geophys. Res., 107, 8295, https://doi.org/10.1029/2001JD000456, 2002. a, b, c
Grooß, J.-U., Brautzsch, K., Pommrich, R., Solomon, S., and Müller, R.: Stratospheric ozone chemistry in the Antarctic: what determines the lowest ozone values reached and their recovery?, Atmos. Chem. Phys., 11, 12217–12226, https://doi.org/10.5194/acp-11-12217-2011, 2011. a, b, c, d
Grooß, J.-U., Engel, I., Borrmann, S., Frey, W., Günther, G., Hoyle, C. R., Kivi, R., Luo, B. P., Molleker, S., Peter, T., Pitts, M. C., Schlager, H., Stiller, G., Vömel, H., Walker, K. A., and Müller, R.: Nitric acid trihydrate nucleation and denitrification in the Arctic stratosphere, Atmos. Chem. Phys., 14, 1055–1073, https://doi.org/10.5194/acp-14-1055-2014, 2014. a, b, c, d, e, f, g, h
Haagen-Smit, A. H.: Chemistry and physiology of the Los Angeles photochemical smog, Ind. Eng. Chem., 44, 1342–1346, https://doi.org/10.1021/ie50510a045, 1952. a
Hanisco, T. F., Moyer, E. J., Weinstock, E. M., Clair, J. M. S., Sayres, D. S., Smith, J. B., Lockwood, R., Anderson, J. G., Dessler, A. E., Keutsch, F. N., Spackman, J. R., Read, W. G., and Bui, T. P.: Observations of deep convective influence on stratospheric water vapor and its isotopic composition, Geophys. Res. Lett., 34, L04814, https://doi.org/10.1029/2006GL027899, 2007. a
Hanson, D. R.: Reaction of ClONO2 with H2O and HCl in sulfuric acid and mixtures, J. Phys. Chem. A, 102, 4794–4807, 1998. a
Hanson, D. R. and Ravishankara, A. R.: Reactive Uptake of ClONO2 onto Sulfuric Acid Due to Reaction with HCl and H2O, J. Phys. Chem., 98, 5728–5735, 1994. a
Herman, R. L., Ray, E. A., Rosenlof, K. H., Bedka, K. M., Schwartz, M. J., Read, W. G., Troy, R. F., Chin, K., Christensen, L. E., Fu, D., Stachnik, R. A., Bui, T. P., and Dean-Day, J. M.: Enhanced stratospheric water vapor over the summertime continental United States and the role of overshooting convection, Atmos. Chem. Phys., 17, 6113–6124, https://doi.org/10.5194/acp-17-6113-2017, 2017. a, b
Homeyer, C. R., Pan, L. L., Dorsi, S. W., Avallone, L. M., Weinheimer, A. J., O'Brien, A. S., DiGangi, J. P., Zondlo, M. A., Ryerson, T. B., Diskin, G. S., and Campos, T. L.: Convective transport of water vapor into the lower stratosphere observed during double-tropopause events, J. Geophys. Res., 119, 10941–10958, https://doi.org/10.1002/2014JD021485, 2014. a, b, c, d
Johnson, D. G., Traub, W. A., Chance, K. V., Jucks, K. W., and Stachnik, R. A.: Estimating the abundance of ClO from simultaneous remote sensing measurements of HO2, OH, and HOCl, Geophys. Res. Lett., 22, 1869–1871, https://doi.org/10.1029/95GL01249, 1995. a
Keim, E. R., Fahey, D. W., Negro, L. A. D., Woodbridge, E. L., Gao, R., Wennberg, P. O., Cohen, R. C., Stimpfle, R. M., Kelly, K. K., Hintsa, E. J., Wilson, J. C., Jonsson, H. H., Dye, J. E., Baumgardner, D. G., Kawa, S. R., Salawitch, R. J., Proffitt, M. H., Loewenstein, M., Podolske, J. R., and Chan, K. R.: Observations of large reductions in the NO∕NOy ratio near the mid-latitude tropopause and the role of heterogeneous chemistry, Geophys. Res. Lett., 23, 3223–3226, https://doi.org/10.1029/96GL02593, 1996. a, b, c, d
Klooster, S. L. V. and Roebber, P. J.: Surface-Based Convective Potential in the Contiguous United States in a Business-as-Usual Future Climate, J. Climate, 22, 3317–3330, https://doi.org/10.1175/2009JCLI2697.1, 2009. a
Koenig, T. K., Volkamer, R., Baidar, S., Dix, B., Wang, S., Anderson, D. C., Salawitch, R. J., Wales, P. A., Cuevas, C. A., Fernandez, R. P., Saiz-Lopez, A., Evans, M. J., Sherwen, T., Jacob, D. J., Schmidt, J., Kinnison, D., Lamarque, J.-F., Apel, E. C., Bresch, J. C., Campos, T., Flocke, F. M., Hall, S. R., Honomichl, S. B., Hornbrook, R., Jensen, J. B., Lueb, R., Montzka, D. D., Pan, L. L., Reeves, J. M., Schauffler, S. M., Ullmann, K., Weinheimer, A. J., Atlas, E. L., Donets, V., Navarro, M. A., Riemer, D., Blake, N. J., Chen, D., Huey, L. G., Tanner, D. J., Hanisco, T. F., and Wolfe, G. M.: BrO and inferred Bry profiles over the western Pacific: relevance of inorganic bromine sources and a Bry minimum in the aged tropical tropopause layer, Atmos. Chem. Phys., 17, 15245–15270, https://doi.org/10.5194/acp-17-15245-2017, 2017. a
Kovalenko, L. J., Jucks, K. W., Salawitch, R. J., Toon, G. C., Blavier, J.-F., Johnson, D. G., Kleinböhl, A., Livesey, N. J., Margitan, J. J., Pickett, H. M., Santee, M. L., Sen, B., Stachnik, R. A., and Waters, J. W.: Observed and modeled HOCl profiles in the midlatitude stratosphere: Implication for ozone loss, Geophys. Res. Lett., 34, L19801, https://doi.org/10.1029/2007GL031100, 2007. a
LeTexier, H., Solomon, S., and Garcia, R. R.: The role of molecular hydrogen and methane oxidation in the water vapour budget of the stratosphere, Q. J. Roy. Meteor. Soc., 114, 281–295, https://doi.org/10.1002/qj.49711448002, 1988. a
Luo, B., Krieger, U. K., and Peter, T.: Densities and refractive indices of solutions to stratospheric temperatures, Geophys. Res. Lett., 23, 3707–3710, https://doi.org/10.1029/96GL03581, 1996. a
McElroy, M. B., Salawitch, R. J., Wofsy, S. C., and Logan, J. A.: Reductions of Antarctic Ozone due to Synergistic Interactions of Chlorine and Bromine, Nature, 321, 759–762, https://doi.org/10.1038/321759a0, 1986. a, b
McKenna, D. S., Grooß, J.-U., Günther, G., Konopka, P., Müller, R., Carver, G., and Sasano, Y.: A new Chemical Lagrangian Model of the Stratosphere (CLaMS): 2. Formulation of chemistry scheme and initialization, J. Geophys. Res., 107, 4256, https://doi.org/10.1029/2000JD000113, 2002a. a, b
McKenna, D. S., Konopka, P., Grooß, J.-U., Günther, G., Müller, R., Spang, R., Offermann, D., and Orsolini, Y.: A new Chemical Lagrangian Model of the Stratosphere (CLaMS): 1. Formulation of advection and mixing, J. Geophys. Res., 107, 4309, https://doi.org/10.1029/2000JD000114, 2002b. a, b
Meyer, J., Rolf, C., Schiller, C., Rohs, S., Spelten, N., Afchine, A., Zöger, M., Sitnikov, N., Thornberry, T. D., Rollins, A. W., Bozóki, Z., Tátrai, D., Ebert, V., Kühnreich, B., Mackrodt, P., Möhler, O., Saathoff, H., Rosenlof, K. H., and Krämer, M.: Two decades of water vapor measurements with the FISH fluorescence hygrometer: a review, Atmos. Chem. Phys., 15, 8521–8538, https://doi.org/10.5194/acp-15-8521-2015, 2015. a
Molina, L. T. and Molina, M. J.: Production of Cl2O2 from the self-reaction of the ClO radical, J. Phys. Chem., 91, 433–436, https://doi.org/10.1021/j100286a035, 1987. a
Molina, M. J., Tso, T.-L., Molina, L. T., and Wang, F. C.-Y.: Antarctic Stratospheric Chemistry of Chlorine Nitrate, Hydrogen Chloride, and Ice: Release of Active Chlorine, Science, 238, 1253–1257, https://doi.org/10.1126/science.238.4831.1253, 1987. a
Müller, R., Grooß, J.-U., Zafar, A. M., Robrecht, S., and Lehmann, R.: The maintenance of elevated active chlorine levels in the Antarctic lower stratosphere through HCl null cycles, Atmos. Chem. Phys., 18, 2985–2997, https://doi.org/10.5194/acp-18-2985-2018, 2018. a, b, c, d
National Aeronautics and Space Administration (NASA): SEAC4RS data, available at: https://www-air.larc.nasa.gov/cgi-bin/ArcView/seac4rs, last access: 30 April 2019. a
Navarro, M. A., Saiz-Lopez, A., Cuevas, C. A., Fernandez, R. P., Atlas, E., Rodriguez-Lloveras, X., Kinnison, D., Lamarque, J.-F., Tilmes, S., Thornberry, T., Rollins, A., Elkins, J. W., Hintsa, E. J., and Moore, F. L.: Modeling the inorganic bromine partitioning in the tropical tropopause layer over the eastern and western Pacific Ocean, Atmos. Chem. Phys., 17, 9917–9930, https://doi.org/10.5194/acp-17-9917-2017, 2017. a
Pitari, G., Visioni, D., Mancini, E., Cionni, I., Di Genova, G., and Gandolfi, I.: Sulfate aerosols from non-explosive volcanoes: chemical-radiative effects in the troposphere and lower stratosphere, Atmosphere, 7, 85, https://doi.org/10.3390/atmos7070085, 2016. a
Ploeger, F., Konopka, P., Günther, G., Grooß, J.-U., and Müller, R.: Impact of the vertical velocity scheme on modeling transport across the tropical tropopause layer, J. Geophys. Res., 115, D03301, https://doi.org/10.1029/2009JD012023, 2010. a
Poshyvailo, L., Müller, R., Konopka, P., Günther, G., Riese, M., Podglajen, A., and Ploeger, F.: Sensitivities of modelled water vapour in the lower stratosphere: temperature uncertainty, effects of horizontal transport and small-scale mixing, Atmos. Chem. Phys., 18, 8505–8527, https://doi.org/10.5194/acp-18-8505-2018, 2018. a
Prather, M. J.: More rapid ozone depletion through the reaction of HOCl with HCl on polar stratospheric clouds, Nature, 355, 534–537, https://doi.org/10.1038/355534a0, 1992. a
Randel, W. J., Wu, F., Oltmans, S. J., Rosenlof, K. H., and Nodoluha, G. E.: Interannual Changes of Stratospheric Water Vapor and Correlations with Tropical Tropopause Temperatures, J. Atmos. Sci., 61, 2133–2148, https://doi.org/10.1175/1520-0469(2004)061<2133:ICOSWV>2.0.CO;2, 2004. a
Ravishankara, A. R.: Water Vapor in the Lower Stratosphere, Science, 337, 809–810, https://doi.org/10.1126/science.1227004, 2012. a
Rohs, S., Schiller, C., Riese, M., Engel, A., Schmidt, U., Wetter, T., Levin, I., Nakazawa, T., and Aoki, S.: Long-term changes of methane and hydrogen in the stratosphere in the period 1978–2003 and their impact on the abundance of stratospheric water vapor, J. Geophys. Res., 111, D14315, https://doi.org/10.1029/2005JD006877, 2006. a
Rollins, A. W., Thornberry, T. D., Gao, R. S., Smith, J. B., Sayres, D. S., Sargent, M. R., Schiller, C., Krämer, M., Spelten, N., Hurst, D. F., Jordan, A. F., Hall, E. G., Vomel, H., Diskin, G. S., Podolske, J. R., Christensen, L. E., Rosenlof, K. H., and Fahey, D. W.: Evaluation of UT/LS hygrometer accuracy by intercomparison during the NASA MACPEX mission, J. Geophys. Res.-Atmos., 119, 1915–1935, https://doi.org/10.1002/2013JD020817, 2014. a, b
Sander, S. P., Friedl, R. R., Barker, J. R., Golden, D. M., Kurylo, M. J., Wine, P. H., Abbatt, J. P. D., Burkholder, J. B., Kolb, C. E., Moortgat, G. K., Huie, R. E., and Orkin, V. L.: Chemical kinetics and photochemical data for use in atmospheric studies, JPL Publication 10-6, 2011. a
Schiller, C., Grooß, J.-U., Konopka, P., Plöger, F., Silva dos Santos, F. H., and Spelten, N.: Hydration and dehydration at the tropical tropopause, Atmos. Chem. Phys., 9, 9647–9660, https://doi.org/10.5194/acp-9-9647-2009, 2009. a
Schwartz, M. J., Read, W. G., Santee, M. L., Livesesy, N. J., Froidevaux, L., Lamert, A., and Manney, G. L.: Convectively injected water vapor in the North American summer lowermost stratosphere, Geophys. Res. Lett., 40, 2316–2321, https://doi.org/10.1002/grl.50421, 2013. a, b, c
Shi, Q., Jayne, J. T., Kolb, C. E., Worsnop, D. R., and Davidovits, P.: Kinetic model for reaction of ClONO2 with H2O and HCl and HOCl with HCl in sulfuric acid solutions, J. Geophys. Res., 106, 24259–24274, https://doi.org/10.1029/2000JD000181, 2001. a, b, c, d, e, f
Smith, J. B., Wilmouth, D. M., Bedka, K. M., Bowman, K. P., Homeyer, C. R., Dykema, J. A., Sargent, M. R., Clapp, C. E., Leroy, S. S., Sayres, D. S., Dean-Day, J. M., Bui, T. P., and Anderson, J. G.: A case study of convectively sourced water vapor observed in the overworld stratosphere over the United States, J. Geophys. Res., 122, 9529–9554, https://doi.org/10.1002/2017JD026831, 2017. a, b, c
Solomon, S.: Stratospheric ozone depletion: A review of concepts and history, Rev. Geophys., 37, 275–316, https://doi.org/10.1029/1999RG900008, 1999. a, b, c, d, e, f
Solomon, S., Garcia, R. R., Rowland, F. S., and Wuebbles, D. J.: On the depletion of Antarctic ozone, Nature, 321, 755–758, https://doi.org/10.1038/321755a0, 1986. a, b, c, d
Solomon, S., Borrmann, S., Garcia, R. R., Portmann, R., Thomason, L., Poole, L. R., Winker, D., and McCormick, M. P.: Heterogeneous chlorine chemistry in the tropopause region, J. Geophys. Res., 102, 21411–21429, 1997. a, b
Solomon, S., Kinnison, D., Garcia, R. R., Bandoro, J., Mills, M., Wilka, C., Neely III, R. R., Schmidt, A., Barnes, J. E., Vernier, J.-P., and Hoepfner, M.: Monsoon circulations and tropical heterogeneous chlorine chemistry, Geophys. Res. Lett., 43, 12624–12633, https://doi.org/10.1002/2016GL071778, 2016. a
Spang, R., Günther, G., Riese, M., Hoffmann, L., Müller, R., and Griessbach, S.: Satellite observations of cirrus clouds in the Northern Hemisphere lowermost stratosphere, Atmos. Chem. Phys., 15, 927–950, https://doi.org/10.5194/acp-15-927-2015, 2015. a
Spang, R., Hoffmann, L., Müller, R., Grooß, J.-U., Tritscher, I., Höpfner, M., Pitts, M., Orr, A., and Riese, M.: A climatology of polar stratospheric cloud composition between 2002 and 2012 based on MIPAS/Envisat observations, Atmos. Chem. Phys., 18, 5089–5113, https://doi.org/10.5194/acp-18-5089-2018, 2018. a
Thomason, L. W. and Peter, T. (Eds.): SPARC Assessment of Stratospheric Aerosol Properties, SPARC Report No. 4, WCRP-124, WMO/TD-No.1295, available at: https://www.sparc-climate.org/wp-content/uploads/sites/5/2017/12/SPARC_Report_No4_Feb2006_ASAP.pdf (last access: 16 April 2019), 2006. a
Thomason, L. W., Poole, L. R., and Deshler, T.: A global climatoloy of stratospheric aerosol surface area density deduced from Stratospheric Aerosol and Gas Experiment II measurements: 1984–1994, J. Geophys. Res., 102, 8967–8976, https://doi.org/10.1029/96JD02962, 1997. a
Thornton, B. F., Toohey, D. W., Tuck, A. F., Elkins, J. W., Kelly, K. K., Hovde, S. J., Richard, E. C., Rosenlof, K. H., Thompson, T. L., Mahoney, M. J., and Wilson, J. C.: Chlorine activation near the midlatitude tropopause, J. Geophys. Res., 112, D18306, https://doi.org/10.1029/2006JD007640, 2007. a, b, c
Tilmes, S., Kinnison, D. E., Garcia, R. R., Salawitch, R., Canty, T., Lee-Taylor, J., Madronich, S., and Chance, K.: Impact of very short-lived halogens on stratospheric ozone abundance and UV radiation in a geo-engineered atmosphere, Atmos. Chem. Phys., 12, 10945–10955, https://doi.org/10.5194/acp-12-10945-2012, 2012. a
Toon, O. B., Maring, H., Dibb, J., Ferrare, R., Jacob, D. J., Jensen, E. J., Luo, Z. J., Mace, G. G., Pan, L. L., Pfister, L., Rosenlof, K. H., Redemann, J., Reid, J. S., Singh, H. B., Thompson, A. M., Yokelson, R., Minnis, P., Chen, G., Jucks, K. W., and Pszenny, A.: Planning, implementation, and scientific goals of the Studies of Emissions and Atmospheric Composition, Clouds and Climate Coupling by Regional Surveys (SEAC4RS) field mission, J. Geophys. Res. Atmos., 121, 4967–5009, https://doi.org/10.1002/2015JD024297, 2016. a, b, c
Trapp, R. J., Diffenbaugh, N. S., and Gluhovsky, A.: Transient response of severe thunderstorm forcing to elevated greenhouse gas concentrations, Geophys. Res. Lett., 36, L01703, https://doi.org/10.1029/2008GL036203, 2009. a
Visioni, D., Pitari, G., Aquila, V., Tilmes, S., Cionni, I., Di Genova, G., and Mancini, E.: Sulfate geoengineering impact on methane transport and lifetime: results from the Geoengineering Model Intercomparison Project (GeoMIP), Atmos. Chem. Phys., 17, 11209–11226, https://doi.org/10.5194/acp-17-11209-2017, 2017. a, b
Vogel, B., Feck, T., and Grooß, J.-U.: Impact of stratospheric water vapor enhancements caused by CH4 and H2 increase on polar ozone loss, J. Geophys. Res., 116, D05301, https://doi.org/10.1029/2010JD014234, 2011. a
Vogel, B., Günther, G., Müüller, R., Grooß, J.-U., and Riese, M.: Impact of different Asian source regions on the composition of the Asian monsoon anticyclone and of the extratropical lowermost stratosphere, Atmos. Chem. Phys., 15, 13699–13716, https://doi.org/10.5194/acp-15-13699-2015, 2015. a, b, c
Vogel, B., Günther, G., Müller, R., Grooß, J.-U., Afchine, A., Bozem, H., Hoor, P., Krämer, M., Müller, S., Riese, M., Rolf, C., Spelten, N., Stiller, G. P., Ungermann, J., and Zahn, A.: Long-range transport pathways of tropospheric source gases originating in Asia into the northern lower stratosphere during the Asian monsoon season 2012, Atmos. Chem. Phys., 16, 15301–15325, https://doi.org/10.5194/acp-16-15301-2016, 2016. a, b
von Hobe, M., Grooß, J.-U., Günther, G., Konopka, P., Gensch, I., Krämer, M., Spelten, N., Afchine, A., Schiller, C., Ulanovsky, A., Sitnikov, N., Shur, G., Yushkov, V., Ravegnani, F., Cairo, F., Roiger, A., Voigt, C., Schlager, H., Weigel, R., Frey, W., Borrmann, S., Müller, R., and Stroh, F.: Evidence for heterogeneous chlorine activation in the tropical UTLS, Atmos. Chem. Phys., 11, 241–256, https://doi.org/10.5194/acp-11-241-2011, 2011. a, b, c, d, e, f, g
Wales, P. A., Salawitch, R. J., Nicely, J. M., Anderson, D. C., Canty, T. P., Baidar, S., Dix, B., Koenig, T. K., Volkamer, R., Chen, D., Huey, L. G., Tanner, D. J., Cuevas, C. A., Fernandez, R. P., Kinnison, D. E., Lamarque, J.-F., Saiz-Lopez, A., Atlas, E. L., Hall, S. R., Navarro, M. A., Pan, L. L., Schauffler, S. M., Stell, M., Tilmes, S., Ullmann, K., Weinheimer, A. J., Akiyoshi, H., Chipperfield, M. P., Deushi, M., Dhomse, S. S., Feng, W., Graf, P., Hossaini, R., Jöckel, P., Mancini, E., Michou, M., Morgenstern, O., Oman, L. D., Pitari, G., Plummer, D. A., Revell, L. E., Rozanov, E., Saint-Martin, D., Schofield, R., Stenke, A., Stone, K. A., Visioni, D., Yamashita, Y., and Zeng, G.: Stratospheric Injection of Brominated Very Short-Lived Substances: Aircraft Observations in the Western Pacific and Representation in Global Models, J. Geophys. Res.-Atmos., 123, 5690–5719, https://doi.org/10.1029/2017JD027978, 2018. a
Ward, M. K. M. and Rowley, D. M.: Kinetics of the ClO+CH3O2 reaction over the temperature range T=250–298 K, Phys. Chem. Chem. Phys., 18, 13646–13656, https://doi.org/10.1039/c6cp00724d, 2016. a, b, c
Webster, C. R., May, R. D., Trimble, C. A., Chave, R. G., and Kendall, J.: Aircraft laser infrared absorption spectrometer (ALIAS) for in situ atmospheric measurements of HCl, N2O, CH4, NO2, and HNO3, Appl. Opt., 33, 454–472, https://doi.org/10.1364/AO.33.000454, 1994. a
Weinstock, E. M., Smith, J. B., Sayres, D. S., Pittman, J. V., Spackman, J. R., Hintsa, E. J., Hanisco, T. F., Moyer, E. J., St Clair, J. M., Sargent, M. R., and Anderson, J. G.: Validation of the Harvard Lyman-α in situ water vapor instrument: Implications for the mechanisms that control stratospheric water vapor, J. Geophys. Res.-Atmos., 114, D23301, https://doi.org/10.1029/2009JD012427, 2009. a
Werner, B., Stutz, J., Spolaor, M., Scalone, L., Raecke, R., Festa, J., Colosimo, S. F., Cheung, R., Tsai, C., Hossaini, R., Chipperfield, M. P., Taverna, G. S., Feng, W., Elkins, J. W., Fahey, D. W., Gao, R.-S., Hintsa, E. J., Thornberry, T. D., Moore, F. L., Navarro, M. A., Atlas, E., Daube, B. C., Pittman, J., Wofsy, S., and Pfeilsticker, K.: Probing the subtropical lowermost stratosphere and the tropical upper troposphere and tropopause layer for inorganic bromine, Atmos. Chem. Phys., 17, 1161–1186, https://doi.org/10.5194/acp-17-1161-2017, 2017. a
WMO: Scientific assessment of ozone depletion: 2014, Global Ozone Research and Monitoring Project–Report No. 55, Geneva, Switzerland, 2014. a, b
WMO: Scientific assessment of ozone depletion: 2018, Global Ozone Research and Monitoring Project–Report No. 58, Geneva, Switzerland, 2018. a
Zafar, A. M., Müller, R., Grooß, J.-U., Robrecht, S., Vogel, B., and Lehmann, R.: The relevance of reactions of the methyl peroxy radical (CH3O2) and methylhypochlorite (CH3OCl) for Antarctic chlorine activation and ozone loss, Tellus B, 70, 1507391, https://doi.org/10.1080/16000889.2018.1507391, 2018. a, b
Zhang, R., Jayne, J. T., and Molina, M. J.: Heterogeneous interactions of ClONO2 and HCl with sulfuric acid tetrahydrate: Implications for the stratosphere, J. Phys. Chem., 98, 867–874, 1994. a
- Abstract
- Introduction
- Model set-up
- Mid-latitude ozone chemistry
- Analysis of chlorine activation
- Case studies
- Discussion
- Conclusions
- Data availability
- Appendix A: Maintenance of activated chlorine
- Appendix B: MACPEX case
- Appendix C: Tracer–tracer correlations
- Author contributions
- Competing interests
- Acknowledgements
- Review statement
- References
- Supplement