the Creative Commons Attribution 4.0 License.
the Creative Commons Attribution 4.0 License.
Contribution and uncertainty of sectorial and regional emissions to regional and global PM2.5 health impacts
Monica Crippa
Greet Janssens-Maenhout
Diego Guizzardi
Rita Van Dingenen
Frank Dentener
In this work we couple the HTAP_v2.2 global air pollutant emission inventory with the global source receptor model TM5-FASST to evaluate the relative contributions of the major anthropogenic emission sources (power generation, industry, ground transport, residential, agriculture and international shipping) to air quality and human health in 2010. We focus on particulate matter (PM) concentrations because of the relative importance of PM2.5 emissions in populated areas and the well-documented cumulative negative effects on human health. We estimate that in 2010, depending on the region, annual averaged anthropogenic PM2.5 concentrations varied between ca. 1 and 40 µg m−3, with the highest concentrations observed in China and India, and lower concentrations in Europe and North America. The relative contribution of anthropogenic emission sources to PM2.5 concentrations varies between the regions. European PM pollution is mainly influenced by the agricultural and residential sectors, while the major contributing sectors to PM pollution in Asia and the emerging economies are the power generation, industrial and residential sectors. We also evaluate the emission sectors and emission regions in which pollution reduction measures would lead to the largest improvement on the overall air quality. We show that air quality improvements would require regional policies, in addition to local- and urban-scale measures, due to the transboundary features of PM pollution. We investigate emission inventory uncertainties and their propagation to PM2.5 concentrations, in order to identify the most effective strategies to be implemented at sector and regional level to improve emission inventories, knowledge and air quality modelling. We show that the uncertainty of PM concentrations depends not only on the uncertainty of local emission inventories, but also on that of the surrounding regions. Countries with high emission uncertainties are often impacted by the uncertainty of pollution coming from surrounding regions, highlighting the need for effective efforts in improving emissions not only within a region but also from extra-regional sources. Finally, we propagate emission inventory uncertainty to PM concentrations and health impacts. We estimate 2.1 million premature deaths per year with an uncertainty of more than 1 million premature deaths per year due to the uncertainty associated only with the emissions.
- Article
(2816 KB) - Full-text XML
- Companion paper
-
Supplement
(1421 KB) - BibTeX
- EndNote
Ambient particulate matter pollution ranks among the top five risk factors globally for loss of healthy life years and is the largest environmental risk factor (Lim et al., 2013; Anderson et al., 2012; Anenberg et al., 2009; Cohen et al., 2017). The World Health Organization (WHO, 2016) reported about 3 million premature deaths worldwide attributable to ambient air pollution in 2012. Health impacts of air pollution can be attributed to different anthropogenic emission sectors (power generation, industry, residential, transport, agriculture, etc.) and sector-specific policies could effectively reduce health impacts of air pollution. These policies are usually implemented under national legislation (Henneman et al., 2017; Morgan, 2012), while in Europe transboundary air pollution is also addressed by the regional protocol under the UNECE Convention on Long-Range Transboundary of Air Pollution (CLRTAP). At city and local level, several studies have been developed to assess the contribution of sector-specific emissions to PM2.5 (particulate matter with a diameter less than 2.5 µm) concentrations with the aim of designing air quality plans at local and regional level (Karagulian et al., 2015; Thunis et al., 2016). Indeed, particulate matter can travel thousands of kilometres, crossing national borders, oceans and even continents (HTAP, part A, Dentener et al., 2010). Local, regional and international coordination is therefore needed to define air pollution policies to improve global air quality and possibly human health. The CLRTAP's Task Force on Hemispheric Transport of Air Pollution looks at the long-range transport of air pollutants in the Northern Hemisphere, to identify promising mitigation measures to reduce background pollution levels and their contribution to pollution in rural as well as urban regions. Although primary PM2.5 and intermediately lived (days-to-weeks) precursor gases can travel over long distances, the transboundary components of anthropogenic PM are mainly associated with secondary aerosols which are formed in the atmosphere through complex chemical reactions and gas-to-aerosol transformation, transport and removal processes of gaseous precursors transported out of source regions (Maas and Grennfelt, 2016). However, the most extreme episodes of exposure often occur under extended periods of low wind speeds and atmospheric stability, favouring the formation of secondary aerosols close to the source regions. Secondary aerosol from anthropogenic sources consists of both inorganic – mainly ammonium nitrate and ammonium sulfate and ammonium bisulfate and associated water, formed from emissions of sulfur dioxide (SO2), nitrogen oxides (NOx) and ammonia (NH3) – and organic compounds involving thousands of compounds and often poorly known reactions (Hallquist et al., 2009). Exposure to and impact from aerosols on humans can be estimated by a variety of approaches, ranging from epidemiological studies to pure modelling approaches. The Burnett et al. (2014) risk–response methodology is often used in models to estimate premature deaths (PDs) due to air pollution exposure, e.g. in Lelieveld et al. (2015) and Silva et al. (2016), who report a global mortality in 2010 due to air quality issues induced by anthropogenic emissions of 2.5 and 2.2 million people, respectively. A higher global mortality is found in a more recent work by Cohen et al. (2017), who account for 3.9 million premature deaths per year due to different model assumptions. In Europe, Brant et al. (2013) estimate 680 000 premature deaths, which is twice as high as the numbers reported for the CAFE (Clean Air for Europe) study (Watkiss et al., 2005). Recently, using the same emission database as in this study, Im et al. (2018) report a multi-model mean estimate of PD of 414 000 (range 230–570 000) for Europe and 160 000 PDs for the USA. At the global scale, models, in some cases using satellite information (Brauer et al., 2015; Van Donkelaar et al., 2016), are the most practical source of information of exposure to air pollution. However, model calculations are subject to a range of uncertainties related to incomplete understanding of transport, chemical transformation, removal processes and, not least, emission information.
This work is developed in the context of the TF HTAP Phase 2 (Galmarini et al., 2017), where a number of models are deployed to assess long-range sensitivities to extra-regional emissions, using the same HTAP_v2.2 anthropogenic emission inventory (Janssens-Maenhout et al., 2015). Differences in model results illustrate uncertainties in model formulations of transport, chemistry and removal processes and are addressed in separate studies (Liang et al., 2018), but not of uncertainties in emission inventories. The objectives and novelties of this study are the evaluation of (i) the relative contribution of anthropogenic emission sources to PM2.5 concentrations at global scale, (ii) the emission sectors and emission regions in which pollution reduction measures would lead to the largest improvement on the overall air quality, and (iii) the relevance of uncertainties in regional sectorial emission inventories (power generation, industry, ground transport, residential, agriculture and international shipping), and their propagation in modelled PM2.5 concentrations and associated impacts on health. This work applies the global source–receptor model TM5-FASST (TM5-FAst Scenario Screening Tool), which is extensively described and evaluated in this special issue (Van Dingenen et al., 2018), and couples it to the HTAP_v2.2 global emission inventory for the year 2010 to estimate global air quality and associated health impacts in terms of PM2.5 concentrations. The regional and global scale and the focus on annual PM2.5 and associated health metrics warrant the use of the TM5-FASST model. However, the most extreme episodes of pollution may occur at more local-to-regional scales, justifying the need for local measures. For instance, a recent study performed over hundreds of cities in Europe (Thunis et al., 2017) shows that in order to comply with the standards prescribed by the Air Quality Directives and the health guidelines by WHO, local actions at the city scale are needed.
Specifically, we show that the impact of emission inventory uncertainty on mortality estimates is comparable with the range of uncertainty induced by air quality models and population exposure functions. We also investigate the uncertainties in PM2.5 from within the region to extra-regional contributions. Based on our analysis of the importance of emission uncertainties at sector and regional level on PM2.5, we aim at informing local, regional and hemispheric air quality policy makers on the potential impacts of sectors with larger uncertainties (e.g. residential and agriculture) or regions (e.g. developing and emerging countries).
2.1 TM5-FASST model and emission perturbations
This work is an application of the TM5-FASST model, which is extensively documented in a companion publication in this special issue. Van Dingenen et al. (2018) provide an extensive evaluation of the model, model assumptions and performance with regard to the linearity and additivity of concentration response to different size of emission perturbations and future emission scenarios. Below we summarise the most important features of relevance for this work and refer for more detail to Van Dingenen et al. (2018).
In order to calculate PM2.5 concentrations corresponding to the HTAP_v2.2 emissions, we use the native 1∘ × 1∘ resolution source–receptor grid maps obtained for TM5-FASST_v0 (Van Dingenen et al., 2018). The TM5-FASST source–receptor model is based on a set of emission perturbation experiments (−20 %) of SO2, NOx, CO, NH3, and volatile organic compounds (VOCs) and CH4 using the global 1∘ × 1∘ resolution TM5 model, the meteorological year 2001 (which was also used for the HTAP Phase 1 experiments) and the community emission dataset prepared for the IPCC AR5 report (RCP, Representative Concentration Pathway) for the year 2000 (Lamarque et al., 2010). TM5-FASST uses aggregated regional emissions (i.e. one annual emission value per pollutant or precursor for each of the 56 regions + shipping), with an implicit underlying 1∘ × 1∘ resolution emission spatial distribution from RCP year 2000 which was partly based EDGAR methodology and grid maps. The concentration of PM2.5 contributing from and to each of 56 receptor regions is estimated as a linear function of the emissions of the source regions, including the aerosol components BC, primary organic matter (POM), SO4, NO3, and NH4. While secondary organic aerosol (SOA) from natural sources is included in the model calculations using the parameterisation described in Dentener et al. (2006), no explicit treatment of anthropogenic SOA is considered, since no reliable emission inventories of SOA precursor gases was available, and formation processes were not included in the parent TM5 model. A recent study by Farina et al. (2010) indicates a global source of 1.6 Tg, or ca. 5.5 % of the overall SOA formation due to anthropogenic SOA. The relative importance of anthropogenic SOA varies widely by region, and is deemed higher in regions with fewer VOC emission controls. Inclusion of SOA would possibly lead to a somewhat larger role of the transboundary pollution transport (Farina et al., 2010; Peng et al., 2016; Shiraiwa et al., 2017), mainly for regions and sectors with large PM and VOC emissions (e.g. residential, and to some extent transport and industry).
Under the assumption that the individual sector contributions add up linearly to total PM2.5 – this assumption is evaluated in Van Dingenen et al. (2018) and holds in most regions within 15 % error – the comparison of PM2.5 concentrations calculated for the reference and scenario case yields an estimation of the contribution of each sector to total PM2.5 concentrations.
Specifically, the reduced-form model TM5-FASST is computing the concentration resulting from an arbitrary precursor emission strength Ei using a first-order perturbation approach, i.e. for each PM component j, the change in concentration dPMj resulting from a change in emission strength Ei(x) of precursor i in source region x, relative to a reference emission Ei,ref(x), is approximated by the first linear term of a Taylor expansion of PM as a function of emissions:
where
Aij[x,y] is a set of independently computed source–receptor matrices, expressing the linearised emission–concentration response between each relevant precursor (i) emission and PM component j concentration, for each pair of source (x) and receptor (y) regions (Van Dingenen et al., 2018).
In Sect. S1.2 we explain in detail how Eq. (1) can also be applied for evaluating the attribution by sector as well as by source region, based on the work by Van Dingenen et al. (2018). Thus to calculate total PM2.5 concentration in each receptor region, the 56 source regions' individual contributions must be summed. Using this approach, it is possible to evaluate the PM2.5 concentrations from “within-region” and “extra-regional” PM2.5 emissions. The extra-regional contribution represents the RERER metric (Response to Extra-Regional Emission Reduction) for a specific region used across the whole HTAP experiment (Galmarini et al., 2017), in particular focusing on the PM2.5 concentration reduction due to the contribution of the emissions of each anthropogenic sector (Eq. 3):
where R represents the concentration response to each sector emission decrease.
As depicted in Fig. S1 in the Supplement, the 56 TM5-FASST regions cover the entire globe, but their areal extent differs in terms of size, population, emission magnitude and presence of neighbouring countries (e.g. Europe comprises 18 TM5-FASST regions). In order to make the evaluation of external impacts on smaller regions (e.g. European countries) comparable to those of larger regions (like the USA, China and India), in this work an aggregation procedure to 10 world regions (refer to Table S2 in the Supplement) has been applied (China+, India+, SE Asia, North America, Europe, Oceania, Latin America, Africa, Russia and the Middle East). In this work we focus on particulate matter due to its negative effects on human health (WHO, 2013; Pope and Dockery, 2006; Worldbank, 2016). The TM5-FASST model includes an assessment of the premature mortality due to ambient PM2.5 concentrations on an exposed population following the methodology developed by Burnett et al. (2014), as discussed in Sect. 4. Health impacts due to indoor air pollution or ozone are not evaluated in this work.
In the following, we will address the uncertainty of sector-specific emissions from this inventory in a quantitative way as well as the differences we observe from one region to the other, based on the uncertainty of activity data and emission factors. As discussed in the next section, the reason to use HTAP_v2.2, and not for example the RCP2000 as the basis for our assessment of emission propagation is that the TF HTAP aims at bringing policy-relevant information, and to this end, it has compiled a policy-relevant emission inventory (HTAP_v2.2) for the most recently available year. While the RCP2000 was at the basis of the FASST calculations, and presented the best community emissions effort at the time, the HTAP_v2.2 inventory is now much more accurate, in particular given the focus on regional emission analysis of our work.
2.2 HTAP_v2.2 emissions
The global anthropogenic emission inventory HTAP_v2.2 for the year 2010 (Janssens-Maenhout et al., 2015) is input to the global source–receptor model TM5-FASST to evaluate PM2.5 concentrations for each world region/country with the corresponding health effects. The HTAP_v2.2 inventory includes for most countries official and semi-official annual anthropogenic emissions of SO2, NOx, CO (carbon monoxide), NMVOC (non-methane volatile organic compounds), PM10 (particulate matter with a diameter less than 10 µm) PM2.5, BC (black carbon) and OC (organic carbon) by country and sector (Janssens-Maenhout et al., 2015). Here we focus on the six major anthropogenic emission sectors contributing to global PM2.5 concentrations, namely the power generation (“power”), non-power industry, industrial processes and product use (“industry”), ground transportation (“transport”), residential combustion and waste disposal (“residential”), agriculture (“agriculture”), and international shipping (“ship”). International and domestic aviation emissions are not considered in this study due to the lower contribution to air pollution compared to other anthropogenic sectors. It should be noted that agricultural emissions do not include agricultural waste burning and forest and savannah fires. Details on the emissions included in each aggregated sector can be found in Janssens-Maenhout et al. (2015). In addition to the reference HTAP_v2.2 emissions for the year 2010, a set of emission perturbation scenarios has been created by subtracting from the reference dataset the emissions of each sector.
2.3 Emission inventory uncertainties
In order to investigate how computed PM2.5 concentrations are affected by the uncertainty of emission inventories, we perform a sensitivity analysis testing the upper and lower range of HTAP_v2.2 emissions including their uncertainties. Aggregated emissions of a certain pollutant p, from a sector i and country c, are calculated as the product of activity data (AD) and emission factors (EFs); therefore the corresponding uncertainty () is calculated as following:
where σAD and σEF are the uncertainties (%) of the activity data and emission factors for a certain sector (i), country (c) and pollutant (p). Uncertainty values of the activity data by sector and country are obtained from Table 2 of Janssens-Maenhout et al. (2017) and Olivier et al. (2016). Using this approach, the uncertainty in the global total anthropogenic CO2 emissions is estimated to range from −9 % to +9 % (95 % confidence interval), with larger uncertainties of about ±15 % for non-Annex I countries, and uncertainties of less than ±5 % are obtained for the 1990 OECD countries1 for the time series from 1990 (Olivier et al., 2016) reported to UNFCCC. Uncertainty values for the emission factors of gaseous pollutants are retrieved from the EMEP/EEA Guidebook (2013) and Bond et al. (2004) for particulate matter. In this work we assume that reported countries' emissions are based on independent estimations of activity data and EFs, and hence no cross-country correlation structure is assumed. This is in contrast to bottom-up gridded emission inventories like EDGAR, where the use of global activity datasets may lead to correlated errors between countries.
Therefore, we can calculate the overall uncertainty σEMIp,c with the following equation (EMEP/EEA, 2013).
where EMI (in kt) represents the emission of a certain pollutant (p) in a certain country (c) from a specific sector (i) and EMI (in kt) the corresponding emissions from all sectors for that country and pollutant.
Table S3 reports the overall uncertainty calculated for each pollutant and for each TM5-FASST region. Using an additional constraint that EFs and activities cannot be negative, a lognormal distribution of the calculated uncertainties is assumed (Bond et al., 2004). Therefore we can calculate the upper and lower range of emission estimates, multiplying and dividing the reference emissions by (), respectively. We do not account for the uncertainties of the atmospheric transport model and the uncertainties due to aggregation, which are larger over smaller TM5-FASST regions. Based on the upper and lower emission range per region, new TM5-FASST model runs have been performed per source region to retrieve the corresponding range of concentrations in receptor regions (therefore the total number of computations is 56⋅2 for the uncertainty analysis).
In this section, we first provide “central” estimates of regional (Sect. 3.1), sectorial (Sect. 3.2) and gridded (Sect. 3.3) contributions, whereas the corresponding uncertainty estimates are discussed from Sect. 3.4 onward.
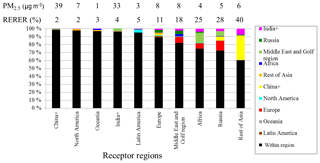
Figure 1Within-region vs. imported extra-regional anthropogenic population-weighted PM2.5 concentrations (%) for aggregated world regions based on “central” estimates. Annual average population-weighted anthropogenic concentrations (in µg m−3) are reported on top of each bar together with the RERER metric (%). Shipping emissions are not included.
3.1 Regional contributions to PM2.5 concentrations
Figure 1 provides a global perspective on the fraction of within-region and extra-regional PM2.5 concentrations for 10 aggregated world receptor regions using emissions of the year 2010, with the extra-regional fraction (using the RERER metric) broken down into source region contributions. Annual average population-weighted anthropogenic PM2.5 concentrations (refer to Van Dingenen et al., 2018, for the calculation of this metric) range from a few µg m−3 (e.g. in Oceania or Latin America), around 7–8 µg m−3 for North America and Europe, up to 33–39 µg m−3 in China+ (including also Mongolia) and India+ (including also the rest of south Asia). Anthropogenic PM2.5 pollution in China+ and India+ is mainly affected by large emission sources within the country (98 % and 96 %, respectively; RERER 2 %–4 %), although 4 % of the Indian anthropogenic PM2.5 pollution is mainly transported from the Gulf region and the Middle East, as was also observed by Venkataraman et al. (2018). North America (98 %) and Oceania (98 %) are mainly influenced by within-regional pollution due to their geographical isolation from other regions. TM5-FASST computations attribute 11 % of the PM2.5 in Europe to extra-regional sources; for the Middle East and Gulf region extra-regional contributions amount to 18 % (mainly from Europe and Russia), for Africa 25 % (mainly from Europe and the Middle East), and Russia 28 % (mainly from Europe, the Middle East and the Gulf region, and China). Shipping emissions are not considered in this figure due to their international origin, while inland waterway emissions are still included in the ground transport sector. Transboundary air pollution is known to be an important issue in the rest of Asia, in particular for pollution transported from China to North and South Korea and Japan (Park et al., 2014) and we estimate that the contribution of transported PM is up to 40 % in south-eastern Asia (mainly from China and India). Within-region and extra-regional PM2.5 concentrations for all the TM5-FASST regions are reported in Table S2.
Focusing on Europe, Fig. 2 shows within-region (in black) vs. extra-regional absolute population-weighted PM2.5 concentrations (in µg m−3) for 16 EU countries plus Norway and Switzerland, defined in TM5-FASST, as well as the source regions contributing to this pollution. Regional annual averages of population-weighted PM2.5 concentrations in Europe vary between 2 and 4 µg m−3 in northern European countries (like Finland, Norway and Sweden) up to 10–12 µg m−3 for continental Europe. Although most of the computed annual average PM2.5 concentrations for Europe are below the World Health Organization Air Quality Guideline of 10 µg m−3 PM2.5 (as annual average), these values represent only regional averages while several exceedances in urban areas are often observed in Europe. As further discussed in Sect. 3.2, an additional contribution to PM2.5 concentrations comes from the shipping sector, mainly influencing Mediterranean countries (like Italy, Spain and France) and countries facing the North Sea, Baltic Sea and Atlantic Ocean (e.g. Benelux, Sweden, Great Britain). Transboundary air pollution from external regions contributes by 27 % to 75 % and on average by 51 % to PM2.5 pollution in European countries. Countries surrounded by oceans are mainly influenced by within-region pollution due to their geographical isolation from other source regions (e.g. Italy, Spain, Great Britain and Norway); therefore, the fraction of extra-regional pollution ranges from 27 % to 35 %. The largest extra-regional contributions are calculated for Hungary (75 %, mainly from Austria, the Czech Republic, the rest of central EU, Poland and Germany), the Czech Republic (67 %, mainly from Poland, Germany and Austria), Austria and Slovenia (66 %, mainly from the Czech Republic, Germany and Italy), Sweden + Denmark (65 %, mainly from Germany, Norway and Poland), Bulgaria (63 %, mainly from Romania), and Greece (61 %).
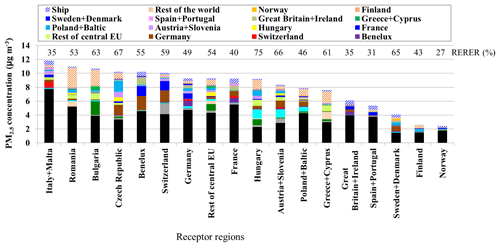
Figure 2Anthropogenic PM2.5 concentrations in 18 countries and sub-regions in Europe separated in within-region and extra-regional contributions. The RERER metric (%) is reported on top of each bar.
The remaining EU countries are affected by both within-region and extra-regional pollution (the latter ranging from 40 % to 59 %), highlighting the importance of transboundary transport of PM2.5 concentrations. For example Switzerland is influenced by the pollution coming from France, Italy and Germany; the rest of the central EU by Poland and Germany; Germany by France and Benelux; and Poland by the Czech Republic and Germany. Interestingly, Romania, Bulgaria, Greece and Hungary are also significantly affected by the pollution transported from Ukraine and Turkey, which is included in the “rest of the world” contribution of Fig. 2. Our results are consistent with the findings of the latest UNECE Scientific Assessment Report (Maas and Grennfelt, 2016), which highlights the importance of transboundary transport of organic and inorganic PM. As discussed in Sect. 3.4, insights into the uncertainty of within-region and extra-regional contributions to PM2.5 concentrations are provided in Fig. 5 for each TM5-FASST region.
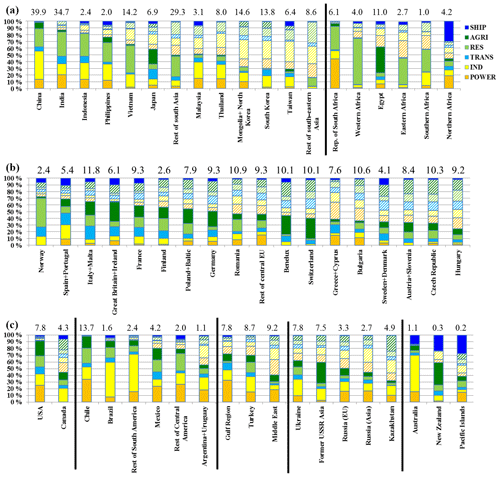
Figure 3Fraction of within-region and extra-regional (shaded areas) anthropogenic PM2.5 concentrations separated by sector for receptor region within the macro-regions: Asia and Africa (a), Europe (b), North America, Latin America, the Middle East, Russia, and Oceania (c). Annual averaged PM2.5 anthropogenic concentrations (in µg m−3) are reported on top of each bar. The RERER metric (%) for the 56 TM5-FASST regions is also reported in Table S2.
3.2 Sectorial contributions to PM2.5 concentrations
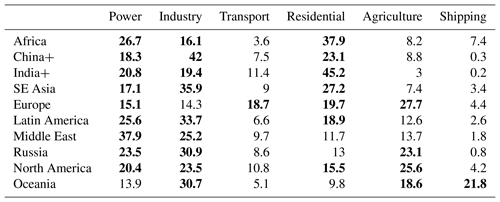
Figure 3 shows the relative sectorial contributions to anthropogenic PM2.5 concentrations for the 56 TM5-FASST receptor regions, separating the fraction of extra-regional (RERER) (shaded colours) and within-region pollution, while Table 1 shows regional average values of sector-specific relative contributions. In most African regions (except Egypt) anthropogenic PM2.5 concentrations are mainly produced by emissions in the residential sector. Agriculture is an important sector for Egypt, while northern Africa is strongly influenced by shipping emissions in the Mediterranean (30 %). PM2.5 concentrations in emerging economies in Asia, Latin America and the Middle East are dominated by the residential sector, power generation and industry. Asian countries such as China, India, Indonesia and the Philippines are mainly influenced by within-region pollution, with the largest contributions coming from power, industry and residential sectors. PM2.5 pollution in Japan is characterised by the contribution of local sources like transport and agriculture, but it is also affected by transported pollution from China, especially from the industrial sector. Anthropogenic PM2.5 in the remaining Asian countries is influenced by more than 50 % by the pollution coming from China (e.g. Vietnam, Malaysia, Thailand, Mongolia, South Korea, Taiwan) or India (e.g. the rest of south Asia and south-eastern Asia) from the power, industry and residential activities. A different picture is seen for Europe where, according to our calculations, annual PM concentrations stem mainly from the agricultural and residential sectors, with a somewhat lower contribution from the transport sector. In eastern European countries noticeable contributions are also found from the power and industrial sectors due to the relatively extensive use of polluting fuels like coal. PM2.5 concentrations in USA and Canada are mostly from the power, industry and agricultural sectors. In Oceania industry and agriculture are the most important sectors. PM2.5 from ship emissions mainly affects coastal areas of northern Africa, SE Asia (e.g. in Japan, Taiwan, Malaysia, Indonesia and the Philippines), Mediterranean countries (Spain 11 %, Italy 5 %, France 7 % of their corresponding country totals), northern EU regions (Great Britain 10 %, Norway 6 %, Sweden and Denmark 10 % of their corresponding country totals) and Oceania (22 % of the regional total). Over the international areas of sea and air no distinction between within-region and extra-regional concentrations is reported. Further details on within-region and extra-regional concentrations can be found in Sect. S2 of the Supplement.
Table 1Sector-specific contribution (%) to annual anthropogenic PM2.5 concentrations for aggregated world regions based on the “central” estimates which do not consider uncertainty. The largest contributing sectors (above a threshold of 15 %) are shaded in bold font.
3.3 Gridded PM2.5 concentrations
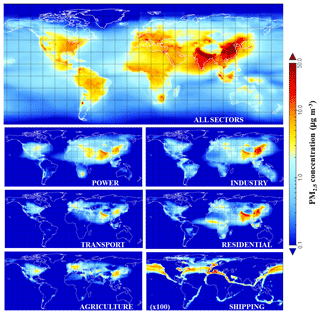
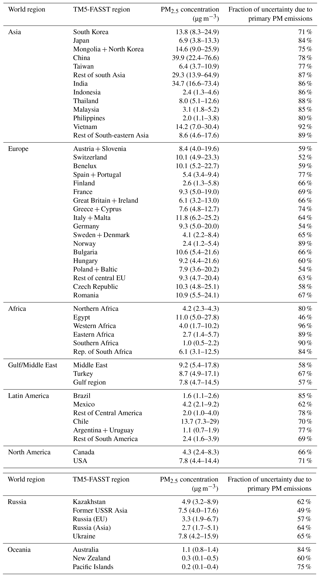
Figure 4 shows the global 1∘ × 1∘ grid maps of anthropogenic PM2.5 concentrations in 2010 for the reference case as well as the computed contributions from each of the major anthropogenic emission sectors. Anthropogenic PM2.5 is ubiquitous globally and covers a range from a few µg m−3 or less over the oceans and seas to more than 50 µg m−3 over Asia. As shown in Fig. 3, the most polluted countries in Asia are China, India and the rest of south Asia (which includes Afghanistan, Bangladesh, Bhutan, Nepal and Pakistan), with annual average anthropogenic PM2.5 concentrations ranging from 29 to 40 µg m−3; Mongolia and North Korea, Vietnam, South Korea, the rest of south-eastern Asia (including Cambodia, Lao People's Democratic Republic and Myanmar), Thailand, Japan, and Taiwan are rather polluted areas, with PM2.5 concentration in the range of 6 to 14 µg m−3. The highest annual PM2.5 concentrations in Africa are computed in Egypt (11 µg m−3 as annual average), the Republic of South Africa (6.1 µg m−3 as annual average) and western Africa (4.0 µg m−3 as annual average). The highest pollution in Europe is observed in the Benelux region, Italy and in some of the eastern countries (e.g. Romania, Bulgaria and the Czech Republic), while in Latin America the most polluted areas are Chile (13.7 µg m−3 as annual average) and Mexico (4.2 µg m−3 as annual average). The Middle East, the Gulf region, Turkey, Ukraine and the former USSR are also characterised by PM2.5 concentrations ranging between 7.5 µg m−3 and 9.2 µg m−3 as annual averages. Table 2 reports annual average PM2.5 concentrations and the corresponding uncertainty range for each TM5-FASST region as discussed in Sect. 3.4.
Table 2Annual average PM2.5 concentrations (µg m−3) with upper and lower ranges in brackets due to emission inventory uncertainty (1 standard deviation, σ). The upper and lower range of PM2.5 concentrations are calculated as the reference concentrations multiplied and divided by (1+σ) respectively. The third column reflects the fractional uncertainty due to the contribution of primary PM2.5 emissions.
The TM5-FASST model (Van Dingenen et al., 2018) is also validated against concentration estimates derived from the WHO database and satellite-based measurements (van Donkelaar et al., 2010, 2014). The TM5-FASST modelled PM2.5 concentrations are compared to satellite products which are based on aerosol optical depth measurements together with chemical transport model information to retrieve from the total column the information of PM concentrations in the lowest layer of the atmosphere (Boys et al., 2014; van Donkelaar et al., 2010, 2014). The regional comparison of annul mean population-weighted concentrations shows consistent results with the satellite-based retrievals (e.g. rather good agreement for the globe as a whole, EU and USA within less than 15 % deviation, with lower agreement for developing and emerging countries). Section S4 in the Supplement of the paper by van Dingenen et al. (2018) also reports the comparison between the PM2.5 concentrations modelled by TM5-FASST and the measured ones reported in the WHO database, showing rather good agreement for Europe, North America and partly for China due to the higher accuracy of the measurements. The comparison for Latin America and Africa is much less robust and the scatter possibly highlights non-optimal modelling of specific sources relevant for these regions by the TM5-FASST model (e.g. large-scale biomass burning).
In our work, modelled PM2.5 concentrations are in the range of the measurements and satellite-based estimates provided in several literature studies (Brauer et al., 2012, 2015; Boys et al., 2014; Evans et al., 2013; Van Donkelaar et al., 2016), reporting annual averaged PM2.5 concentrations for all of Europe in the range between 11 and 17 µg m−3, for Asia from 16 to 58 µg m−3, Latin America 7–12 µg m−3, Africa and the Middle East 8–26 µg m−3, Oceania 6 µg m−3, and North America 13 µg m−3 (note that measurements and satellite estimates would not separate anthropogenic and natural sources of PM, e.g. dust, large-scale biomass burning, while the concentrations in this study consider anthropogenic emissions alone).
In order to understand the origin of global PM2.5 concentrations, we look at sector-specific maps (Fig. 4). The power and industrial sectors are mainly contributing to PM concentrations in countries with emerging economies and fast development (e.g. the Middle East, China and India), while the ground transport sector is a more important source of PM concentrations in industrialised countries (e.g. North America and Europe) and in developing Asian countries. The residential sector is an important source of PM all over the world, also affecting indoor air quality (Ezzati, 2008; Lim et al., 2013; Chafe et al., 2014). PM concentrations in Africa and Asia are strongly influenced by this sector due to the incomplete combustion of rather dirty fuels and solid biomass deployed for domestic heating and cooking purposes. Interestingly, the agricultural sector is strongly affecting pollution in Asia as well as in Europe (Backes et al., 2016; Erisman et al., 2004) and North America, confirming the findings of the UNECE Scientific Assessment Report and several other scientific publications (Maas and Grennfelt, 2016; Pozzer et al., 2017; Tsimpidi et al., 2007; Zhang et al., 2008). The residential and agriculture sectors are less spatially confined, and it is more difficult to regulate emissions effectively than point source emissions of the industrial and power sectors (e.g. in Europe the Large Combustion Plant Directive, the National Emission Ceilings Directive, the Industrial Emissions Directive, the European emission standards for road transport). Finally, shipping is mainly contributing to the pollution in countries and regions with substantial coastal areas, and with ship tracks on the Mediterranean Sea and the Atlantic, Pacific and Indian Oceans, as depicted in Fig. 4.
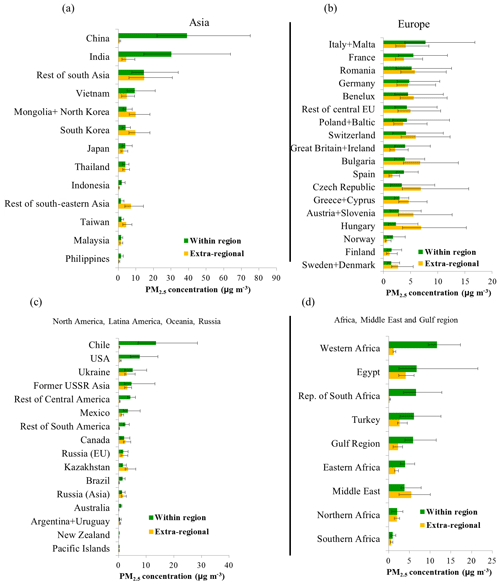
Figure 5Within-region and extra-regional anthropogenic PM2.5 concentrations and emission-related uncertainties for Asia (a); Europe (b); North America, Latin America, Oceania and Russia (c); and Africa, the Gulf region and the Middle East (d). The error bars are calculated by multiplying and dividing the reference emissions by (1+σ) as discussed in Sect. 2.3.
3.4 Uncertainty from emissions
3.4.1 Propagation of emission uncertainties to anthropogenic PM2.5 concentrations
Table 2, as well as Fig. 5, report the annual average anthropogenic PM2.5 concentrations (µg m−3) estimated by TM5-FASST with the uncertainty bars representing the upper and lower range of concentrations due to emission inventory uncertainty. The extra-regional contribution to uncertainty is also addressed as well as the contribution of the uncertainty of primary particulate matter emissions to the upper range of PM2.5 concentrations (Table 2). Primary PM emissions represent the dominant source of uncertainties, contributing from 45 % to 97 % to the total uncertainty in anthropogenic PM2.5 concentrations for each country/region.
Figure 5 depicts the results of the propagation of the lowest and highest range of emissions including their uncertainty to PM2.5 concentrations in Asia (Fig. 5a) and – in more detail – Europe (Fig. 5b), highlighting the contribution of within-region and extra-regional PM2.5 concentrations and the corresponding uncertainties (error bars). Due to their large sizes, Indian and Chinese PM2.5 concentrations and uncertainties are mainly affected by uncertainties from the residential, transport and agricultural sectors within these countries. Interestingly, in south-eastern and eastern Asia uncertainties in PM2.5 are strongly influenced by the Indian residential emissions. On the other hand, PM2.5 in Thailand, Japan, Taiwan, South Korea, Mongolia and Vietnam are strongly affected by the uncertainty in the Chinese residential and industrial emissions. Consequently reducing the uncertainties in the Chinese and Indian emission inventories will help in improving the understanding of the long-range contribution of PM2.5 pollution in most Asian countries.
In Europe, the highest uncertainties in PM2.5 concentrations are associated with the emissions from the residential, agriculture and transport sectors. In most of the central and eastern European countries modelled PM2.5 is strongly affected by the uncertainty of transported extra-regional pollution, produced from the residential, agricultural and transport sectors. Conversely, uncertainties in Norway are dominated by national emissions, mainly from the residential and transport sectors, and in Italy from the residential and agriculture sectors. The remaining European countries are affected both by within-country and imported uncertainties. Figure 5c represents the results of the propagation of the emissions range including their uncertainty to PM2.5 concentrations for North America, Latin America, Oceania and Russia, while Fig. 5d displays emission uncertainties for Africa, the Middle East and the Gulf region. The uncertainty in the USA agricultural and residential emissions affect more than 50 % of modelled Canadian PM2.5 concentrations and the uncertainty in Mexico and Argentina is influenced by similar magnitudes (30 %–50 %) from neighbouring countries. The uncertainty in within-region emissions, especially from the residential sector, dominates the overall levels of PM2.5 uncertainties in Latin America. However, in addition, Chile's own agriculture and power sectors contribute significantly to the overall uncertainty levels. PM2.5 levels in most of the African regions are strongly affected by the uncertainty in their own residential emissions, while in Egypt they are mostly influenced by the agricultural sector uncertainties (refer to Fig. 5d). Interestingly, anthropogenic PM2.5 in northern Africa is influenced by uncertainties in Italian emissions as well as those from shipping emissions. Conversely, the Middle East and Turkey regions are influenced by a range of extra-regional emission uncertainties (e.g. the Middle East is affected by the uncertainty of Turkey, Egypt and the Gulf region, while Turkey is affected by Bulgaria, the Gulf region and the rest of the central EU).
3.4.2 Ranking the sector-specific contribution to emission uncertainties
Figure 6 shows the average sector-relative contribution to total emission-inventory-related uncertainty for the main PM2.5 concentration precursors and world regions. These contributions can be interpreted as a ranking of the most effective improvements to be taken regionally to better constrain their inventories and reduce the final formation of PM2.5 concentrations. The complete overview of all TM5-FASST regions contributions is provided in Fig. S2, where the share of each term of the sum of Eq. (5) represents the sector contribution to the uncertainty of each pollutant in each region. SO2 uncertainties mainly derive from the power generation sector, especially in countries with dominant coal use; however, substantial contributions are also computed for the industrial sector in South Africa, Asia, Norway, some Latin American countries, Canada and Russia. Interestingly, for SO2 some contributions are also observed from the residential sector in Africa and from the transport sector in some Asian countries (e.g. North and South Korea, Vietnam, Indonesia, south-eastern Asia). Smith et al. (2011) report a range of regional uncertainty for SO2 emissions up to 30 %, while our estimates are slightly higher (up to 50 %). NOx emission uncertainty mainly stems from the transport sector, although some contributions are also seen from power generation in Russia, countries strongly relying on gas (e.g. Russia), the Middle East and the residential sector in Africa. Depending on the region, CO uncertainty (not shown) is dominated by either the transport or residential (particularly in Africa and Asia) sectors and for some regions by a similar contribution of these two sectors. NMVOC emission uncertainties mainly derive from poorly characterised industrial, transport and residential activities due to the complex mixture and reactivity of such pollutants. As expected, NH3 emission uncertainty is dominated by the agricultural sector which appears to be less relevant for all other pollutants. Among all air pollutants, primary PM2.5 represents one of the most uncertain pollutant due to very different combustion conditions, different fuel qualities and lack of control measures (Klimont et al., 2017).
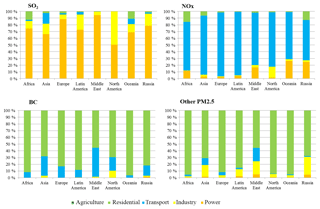
Figure 6Contribution of anthropogenic sectors to the emission uncertainty of various pollutants for different world regions.
Primary particulate matter emissions should be mainly improved for the residential, transport and in particular industrial sectors. Black carbon emission inventories should be better characterised in Europe, Japan, North and South Korea, Malaysia etc. for the transport sector, where the higher share of diesel used as fuel for vehicles leads to higher BC emissions; in addition, BC emissions from the residential sector require further effort to better define EFs for the different type of fuels used under different combustion conditions. To constrain and improve particulate organic matter emissions, efforts should be made to improve residential emissions estimates. Therefore, in the following section, we try to assess one of the major sources of uncertainty in the residential emissions in Europe, which is the use of solid biofuel.
3.4.3 Assessing the uncertainty in household biofuel consumption with an independent inventory in Europe
The combustion of solid biomass (i.e. biofuel) for household heating and cooking purposes is one of the major sources of particulate matter emissions in the world. Wood products and residues are widely used in the residential sector, but national reporting often underestimates the emissions from this sector, due to the fact that often informal economic wood sales are not accurately reflected in the official statistics of wood consumption (AD) (Denier Van Der Gon et al., 2015). An additional uncertainty is related to the lack of information in the inventory regarding the EF variability, which depends on the combustion efficiency and type of wood (Weimer et al., 2008; Chen et al., 2012). In our work we estimate the uncertainty attributable to wood combustion in the residential sector (σAD,RES_bio) by comparing it to the recent TNO RWC (Netherlands Organization for Applied Scientific Research, Residential Wood Combustion) inventory of Denier van der Gon et al. (2015), which includes a revised biomass fuel consumption with the corresponding EDGARv4.3.2 activity data (Janssens-Maenhout et al., 2017), as shown in Table S4. In the TNO RWC inventory, wood use for each country has been updated comparing the officially reported per capita wood consumption data (from GAINS, Greenhouse Gas and Air Pollution Interactions and Synergies, and IEA, International Environmental Agency) with the expected specific wood use for a country, including the wood availability information (Visschedijk et al., 2009; Denier Van Der Gon et al., 2015). We can therefore assume that the TNO RWC inventory represents an independent estimate of wood consumption in the residential sector, allowing a more precise uncertainty estimation of the AD for this sector. Assuming that emissions are calculated as the product of AD and EF, the corresponding uncertainty can be calculated with Eq. (4), where σAD ranges from 5 % to 10 % for European countries and Russia as reported for international statistics (Olivier et al., 2016). We can therefore calculate the residential emission factors uncertainty of each individual pollutant (σEFp) from Eq. (4). In addition, based on the comparison of the recent estimates of wood consumption provided by TNO RWC AD, which should match better with observations, and the EDGARv4.3.2 data, we can evaluate the mean normalised absolute error (MNAE) considering all N countries, following Eq. (6) (Yu et al., 2006), which represents our estimate of σAD,RES_bio.
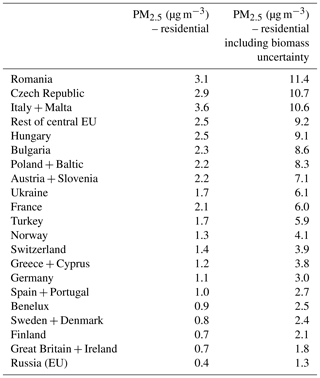
We estimate a value of σAD,RES_bio of 38.9 %, which is much larger compared to the 5 %–10 % uncertainty reported for the fuel consumption of the international statistics (σAD). The issue of biofuel uncertainty mainly affects rural areas where wood is often used instead of fossil fuel. Then, using Eq. (4) and the calculated σAD,RES_bio and σEFp, we can evaluate a new σEMIp,RES_bio for the residential sector including the uncertainty of the AD due to the use of wood as fuel for this sector, as reported in Table S5. Comparing the results shown in Table S5 with the factor-of-2 uncertainty values expected for PM emissions from the residential sector (Janssens-Maenhout et al., 2015), we derive that the uncertainty associated with the emission factors for biomass combustion in the residential sector is the dominant source of uncertainty compared to the uncertainty in wood burning activity data. Large increases in reported biomass usage for domestic use has been noted in IEA energy statistics for some European countries (IEA, 2016) and further increases are expected as countries are shifting their methodologies to estimate biofuel activity data away from fuel sales statistics to a modelling approach based on energy demand. In addition, several EU countries are increasing the use of biomass in order to accomplish the targets set in the context of the renewable energy directive (2009/28/EC) as reported in their national renewable energy action plans (http://ec.europa.eu/energy/node/71, last access: April 2019). When comparing the UNFCCC and the TNO RWC data, a higher value of σAD,RES_bio is obtained (59.5 % instead of 38.9 %), although its effect on the final residential emission uncertainty is less strong, as shown in Table S6. Table 3 shows the impact of biofuel combustion uncertainty on PM2.5 concentrations in the residential sector. Upper-end uncertainties indicate that PM2.5 concentrations could be between 2.6 and 3.7 times larger than those derived from the HTAP_v2.2 inventory.
Annual population-weighted PM2.5 concentrations represent the most robust and widely used metric to analyse the long-term impacts of particulate matter air pollution on human mortality (Pope and Dockery, 2006; Dockery, 2009). As described in Sects. 2.5 and S5 of the paper by Van Dingenen et al. (2018), the mortality estimation in TM5-FASST is based on the integrated exposure-response functions defined by Burnett et al. (2014). The increased risk from exposure to air pollution is estimated using exposure-response functions for five relevant causes of death, namely ischaemic heart disease (IHD), cerebrovascular disease (CD, stroke), chronic obstructive pulmonary disease (COPD), lung cancer (LC) and acute lower respiratory infections (ALRIs). The relative risk (RR) represents the proportional increase in the assessed health outcome due to a given increase in PM2.5 concentrations (Burnett et al., 2014).
In this section, we investigate the impact of total and sector-specific anthropogenic population-weighted PM2.5 concentrations on health and we show comparisons with mortality estimates provided by WHO and recent scientific publications (Silva et al., 2016). Figure 7 represents the PD distribution due to air pollution, using population-weighted PM2.5 concentrations and representative for anthropogenic emissions in the year 2010. The most affected areas are China and India, but also some countries of western Africa and urban areas in Europe (in particular in the Benelux region and eastern Europe). Our computations indicate that annual global outdoor premature mortality due to anthropogenic PM2.5 amounts to 2.1 million premature deaths, with an uncertainty range related to emission uncertainty of 1–3.3 million deaths per year. In our work we only evaluate how the uncertainty of emission inventories influences the health impact estimates focusing on the interregional aspects (i.e. we do not evaluate effects of misallocation of sources within regions) and not all the other sources of uncertainties, such as the uncertainty of concentration-response estimates, of air quality models used to estimate particulate matter concentrations, etc. An overview of the propagation of the uncertainty associated with an ensemble of air quality models to health and crop impacts is provided by Solazzo et al. (2018). Solazzo et al. (2018) find in their analysis over the European countries a mean number of PDs due to exposure to PM2.5 and ozone of approximately 370 000 (inter-quantile range between 260 000 and 415 000). Moreover, they estimate that a reduction in the uncertainty of the modelled ozone concentration by 61 %–80 % (depending on the aggregation metric used) and by 46 % for PM2.5 produces a reduction in the uncertainty in premature mortality and crop loss of more than 60 %. However, we show here that the often neglected emission inventories' uncertainty provides a range of premature deaths of ±1.1 million at the global scale, which is of the same order of magnitude of the uncertainty of air quality models and concentration-response functions (Cohen et al., 2017). In 2010, using our central estimate, 82 % of the PDs occur in fast-growing economies and developing countries, especially in China with 670 000 and India with an almost equal amount of 610 000 PDs per year. Table 4 summarises our estimates of premature mortality for aggregated world regions, with Europe accounting for 210 000 PDs per year and North America 100 000 PDs per year.
Table 4Absolute and population size normalised number of premature deaths per year due to anthropogenic PM2.5 air pollution in world regions and corresponding uncertainty range.
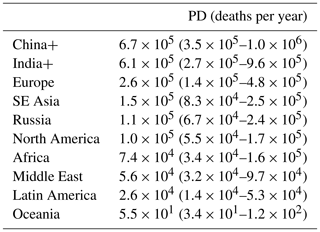
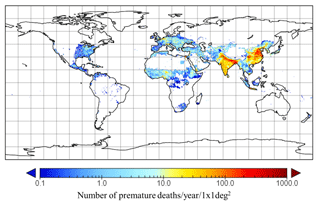
Figure 7Global distribution of premature deaths in 2010 caused by anthropogenic particulate matter pollution estimated using the methodology described in Burnett et al. (2014). A threshold value of 5.8 µg m−3 is assumed and no urban increment adjustments are considered. The relative risk functions of Burnett et al. (2014) are used for the premature death dose-response estimates.
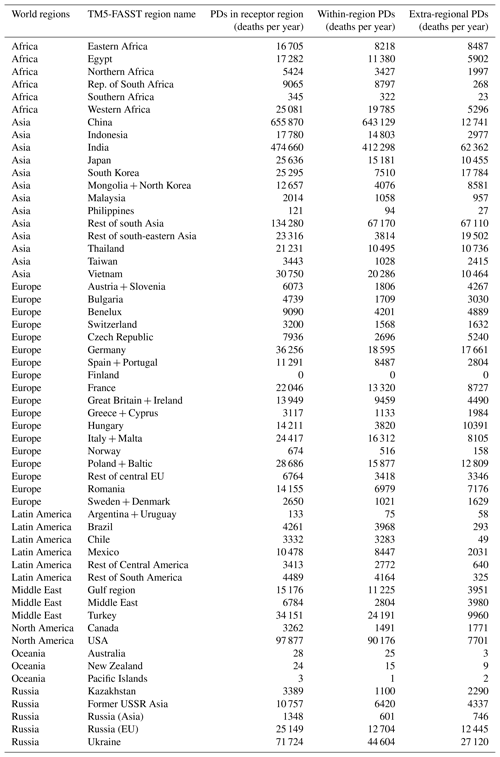
Table 5Number of premature deaths for each receptor region including the within-region and extra-regional attribution based on PM2.5 “central” estimates, which do not consider uncertainty. For the RERER metric refer also to Table S2.
Our results are comparable with Lelieveld et al. (2015) and Silva et al. (2016) who, using the same Burnett et al. (2014) methodology, estimate a global premature mortality of 2.5 and 2.2 million people, respectively, due to air quality in 2010 for the same anthropogenic sectors. However, a recent work published by Cohen et al. (2017) estimates a higher value of global mortality (3.9 million PDs per year) mainly due to a lower minimum risk exposure level set in the exposure response function, the inclusion of the urban increment calculation and the contribution of natural sources. When comparing mortality estimates we need to take into account that several elements affect the results, like the resolution of the model, the urban increment subgrid adjustment (including information on urban and rural population; refer to Van Dingenen et al., 2018), the inclusion or not of natural components, the impact threshold value used, and RR functions. In this study, we use the population-weighted PM2.5 concentration (excluding natural components) at 1×1∘ resolution as the metric for estimating health effects due to air pollution, with a threshold value of 5.8 µg m−3, no urban increment adjustment and relative risk functions accordingly with Burnett et al. (2014). We also estimate that 7 % of the global non-accidental mortalities from the Global Burden of Disease (IHME, 2015, http://vizhub.healthdata.org/gbd-compare, last access: April 2019; Forouzanfar et al., 2015) are attributable to air pollution in 2010; 8.6 % of total mortality in Europe is due to air pollution, ranging from less than 1 % up to 17 % depending on the country; similarly, Asian premature mortality due to air quality is equal to 8.7 % of total Asian mortality, with 10.6 % contribution in China and 8.5 % in India. Lower values are found for African countries and Latin America where other causes of mortalities are still dominant compared to developed countries.
Table 5 shows the number of premature deaths for each receptor region, highlighting the premature mortality induced within the country itself and outside the receptor region. The PD induced by Chinese and Indian emissions are mainly found within these two countries; however, the annual PDs caused by China and India in external regions contribute an additional 700 000 and ca. 500 000 PDs per year, respectively, representing more than 50 % of the global mortality. Clearly, reducing emissions and emission uncertainties in these two regions will therefore have the largest overall benefit on global air quality improvement as well as on global human health. As explained in Sect. 3.1, PDs attributed to internal and external emissions are directly linked (proportional) to the internal and external PM2.5 contributions. For most of the TM5-FASST regions, PDs due to anthropogenic emissions within the source region are higher than the extra-regional contributions. However, there are marked exceptions, such as Hungary, the Czech Republic, Mongolia, etc., where the extra-regional and within-region contributions to mortality are at least comparable. For instance, Hungary and the Czech Republic are strongly influenced by polluted regions in Poland (mainly); likewise, Mongolia is affected by the vicinity of sources in China. The Gulf region produces a lot of its own pollution but is also influenced by transport from Africa and Eurasia as reported by Lelieveld et al. (2009).
Detailed information on the premature deaths for each TM5-FASST region and the contributing anthropogenic emission sectors is shown in Fig. 8a and b. Health effects induced by air quality in industrialised countries are mainly related to agriculture (32.4 % of total mortality or 68 000 PDs per year), residential combustion (17.8 % or 37 000 PDs per year) and road transport (18.7 % or 39 000 PDs per year) for Europe and with power generation (26.4 % or 26 000 PDs per year), industry (19 % or 19 000 PDs per year), residential (17 % or 17 000 PDs per year) and agriculture (24.0 % or 24 000 PDs per year) for North America. The health impacts observed in most western EU countries is due to both within-region and extra-regional pollution, while in several eastern EU countries the impact of neighbouring countries is even larger compared to within-region pollution. The premature deaths induced by international shipping emissions represent 5.5 % of total EU PD, which is in the range of the results of Brandt et al. (2013) (ca. 50 000 PDs). PM-related mortality in developing countries and fast-growing economies is mostly affected by industrial (up to 42 % in China or 279 000 PDs per year) and residential activities (ranging from 27 % in China and 76 % in western Africa), and also by power generation (up to 24 % in India or 113 000 PDs per year). Chinese emissions have a strong impact on China, Japan, Vietnam, Mongolia + North Korea, and Thailand while the Indian emissions impact the rest of south and south-eastern Asia. Reducing Chinese and Indian emissions will reduce the PM-related mortality in almost all countries in Asia. Our results are in agreement with the study of Oh et al. (2015) where they highlight the role of transported pollution from China in affecting the PM2.5 concentrations and health standards of North and South Korea and other south-eastern Asian countries, as well as the need for international measures to improve air quality.
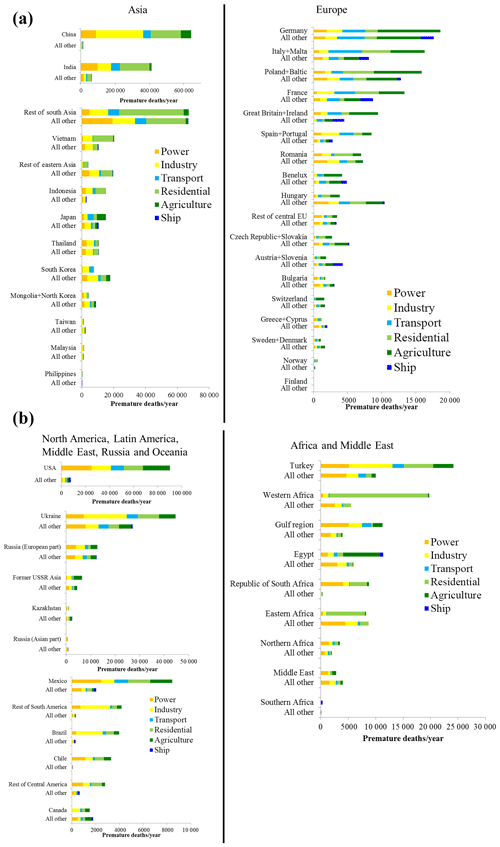
Figure 8Anthropogenic emission sector contributions to premature mortality (deaths per year) due to PM2.5 population-weighted concentrations in the TM5-FASST receptor regions of (a) Asia (left) and Europe (right) and (b) North America, Latin America, Russia, the Middle East and Oceania (left hand side) and Africa (right hand side). Note that mortality estimates for Argentina + Uruguay, Australia, New Zealand and Pacific Islands are not reported being several orders of magnitude lower than other countries estimates. Sector and region contributions pertain to the “central” emission estimates.
In this work we couple the global anthropogenic emission estimates provided by the HTAP_v2.2 inventory for 2010 (merging national and regional inventories) with the global source receptor model TM5-FASST, to study PM2.5 concentrations and the corresponding health impacts, including an evaluation of the impacts of uncertainties in national emission inventories. Annual and regionally averaged anthropogenic PM2.5 concentrations, corresponding to the 2010 emissions, vary between ca. 1 and 40 µg m−3, with the highest annual concentrations computed in China (40 µg m−3, range: 22.4–76.6 µg m−3), India (35 µg m−3, range: 16.6–73.4 µg m−3), North America (8 µg m−3, range: 4.4–14.4 µg m−3) and Europe (on average ca. 8 µg m−3, range: 5–18 µg m−3). Anthropogenic PM2.5 concentrations are mainly due to emissions within the source region, but extra-regional transported air pollution can contribute by up to 40 % (e.g. from China to SE Asia, from EU to Russia). Moreover, due to the transport of PM between European countries, EU-wide directives can help improve the air quality across Europe.
For our analysis we aggregate our results derived from 56 TM5-FASST source regions into 10 global regions to facilitate the comparison of results in regions of more equal size. The relative contribution of anthropogenic sectors to PM2.5 concentrations varies in different regions. In Europe in 2010, the agriculture and residential combustion sectors contribute the most PM2.5 concentrations and these sectors are also associated with relatively large emission uncertainties. PM2.5 concentrations in China and other emerging economies are predominantly associated with the power generation, industry and residential activities.
Using the HTAP_v2.2 emission inventory and TM5-FASST, we also evaluate how the uncertainty in sectors and regions propagates into PM2.5 concentrations. The aim of our analysis is to provide insights into where improvement of country emission inventories would give the largest benefits, because of their highest uncertainty and highest contribution to the formation of PM2.5 concentrations. The uncertainty of PM concentrations depends in variable proportions to the uncertainties of the emissions within receptor regions, and surrounding regions. We show that reducing the uncertainties in the Chinese and Indian emission inventories (e.g. from industry and residential sectors) will be highly relevant for more accurate quantification of the contribution of the long-range sources to PM2.5 pollution in most Asian countries. Here we demonstrate how analysis of uncertainties in national and regional sectorial emission inventories can further inform coordinated transboundary and sector-specific policies to significantly improve global air quality. Among all anthropogenic emission sectors, the combustion of biomass for household purposes represents one of the major sources of uncertainties in emission inventories both in terms of wood consumption and emission factor estimates. Further effort is therefore required at national level to better characterise this source.
Finally, we analyse the air quality effects on health. Global health effects due to PM2.5 concentrations calculated with TM5-FASST and anthropogenic emissions in 2010 are estimated to be ca. 2.1 million premature deaths per year, but the uncertainty associated with emission ranges between 1 and 3.4 million deaths per year, with the largest fraction of PD (82 %) in developing countries.
Data used in this research are publicly accessible through the EDGAR website (http://edgar.jrc.ec.europa.eu/htap_v2/index.php, last access: April 2019; https://doi.org/10.2904/JRC_DATASET_EDGAR; Janssens-Maenhout et al., 2013) and the TM5-FASST online tool (http://tm5-fasst.jrc.ec.europa.eu/, last access: April 2019).
The supplement related to this article is available online at: https://doi.org/10.5194/acp-19-5165-2019-supplement.
MC developed the scenarios, performed the TM5-FASST analysis and drafted the manuscript. GJM developed the concept of the work and supervised it. DG compiled the HTAP_v2.2 emission inventory. RVD and FD developed the TM5-FASST model and the concept of this work.
The authors declare that they have no conflict of interest.
This article is part of the special issue “Global and regional assessment of intercontinental transport of air pollution: results from HTAP, AQMEII and MICS”. It is not associated with a conference.
The authors acknowledge financial support by the Administrative Arrangement AMITO2 with DG ENV. This analysis was inspired by HTAP2 joint studies on regional contributions to global air pollution. This publication is an application of the companion paper “TM5-FASST: a global atmospheric source–receptor model for rapid impact analysis of emission changes on air quality and short-lived climate pollutants” by Van Dingenen et al. (2018).
This paper was edited by Kathy Law and reviewed by two anonymous referees.
Anderson, J., Thundiyil, J., and Stolbach, A.: Clearing the Air: A Review of the Effects of Particulate Matter Air Pollution on Human Health, J. Med. Toxicol., 8, 166–175, https://doi.org/10.1007/s13181-011-0203-1, 2012.
Anenberg, S. C., West, J. J., Fiore, A. M., Jaffe, D. A., Prather, M. J., Bergmann, D., Cuvelier, K., Dentener, F. J., Duncan, B. N., Gauss, M., Hess, P., Jonson, J. E., Lupu, A., MacKenzie, I. A., Marmer, E., Park, R. J., Sanderson, M. G., Schultz, M., Shindell, D. T., Szopa, S., Vivanco, M. G., Wild, O., and Zeng, G.: Intercontinental Impacts of Ozone Pollution on Human Mortality, Environ. Sci. Technol., 43, 6482–6487, https://doi.org/10.1021/es900518z, 2009.
Backes, A. M., Aulinger, A., Bieser, J., Matthias, V., and Quante, M.: Ammonia emissions in Europe, part II: How ammonia emission abatement strategies affect secondary aerosols, Atmos. Environ., 126, 153–161, https://doi.org/10.1016/j.atmosenv.2015.11.039, 2016.
Bond, T. C., Streets, D. G., Yarber, K. F., Nelson, S. M., Woo, J.-H., and Klimont, Z.: A technology-based global inventory of black and organic carbon emissions from combustion, J. Geophys. Res.-Atmos., 109, D14203, https://doi.org/10.1029/2003jd003697, 2004.
Boys, B., Martin, R., Van Donkelaar, A., MacDonell, R., Hsu, N., Cooper, M., Yantosca, R., Lu, Z., Streets, D., and Zhang, Q.: Fifteen-year global time series of satellite-derived fine particulate matter, Environ. Sci. Technol., 48, 11109–11118, 2014.
Brandt, J., Silver, J. D., Christensen, J. H., Andersen, M. S., Bønløkke, J. H., Sigsgaard, T., Geels, C., Gross, A., Hansen, A. B., Hansen, K. M., Hedegaard, G. B., Kaas, E., and Frohn, L. M.: Assessment of past, present and future health-cost externalities of air pollution in Europe and the contribution from international ship traffic using the EVA model system, Atmos. Chem. Phys., 13, 7747–7764, https://doi.org/10.5194/acp-13-7747-2013, 2013.
Brauer, M., Amann, M., Burnett, R. T., Cohen, A., Dentener, F., Ezzati, M., Henderson, S. B., Krzyzanowski, M., Martin, R. V., and Van Dingenen, R.: Exposure assessment for estimation of the global burden of disease attributable to outdoor air pollution, Environ. Sci. Technol, 46, 652–660, 2012.
Brauer, M., Freedman, G., Frostad, J., Van Donkelaar, A., Martin, R. V., Dentener, F., Dingenen, R. v., Estep, K., Amini, H., and Apte, J. S.: Ambient air pollution exposure estimation for the global burden of disease 2013, Environ. Sci. Technol., 50, 79–88, 2015.
Burnett, R. T., Pope, C. A., Ezzati, M., Olives, C., Lim, S. S., Mehta, S., Shin, H. H., Hwashin, H., Singh, G., Hubbell, B., Brauer, M., Anderson, H. R., Smith, K. R., Balmes, J. R., Bruce, N. G., Kan, H., Laden, F., Prüss-Ustün, A., Turner, M. C., Gapstur, S. M., Diver, W. R., and Cohen, A.: An Integrated Risk Function for Estimating the Global Burden of Disease Attributable to Ambient Fine Particulate Matter Exposure, Environ. Health Persp., 122, 397–403, https://doi.org/10.1289/ehp.1307049, 2014.
Chafe, Z. A., Brauer, M., Klimont, Z., Van Dingenen, R., Mehta, S., Rao, S., Riahi, K., Dentener, F., and Smith, K. R.: Household Cooking with Solid Fuels Contributes to Ambient PM(2.5) Air Pollution and the Burden of Disease, Environ. Health Persp., 122, 1314–1320, https://doi.org/10.1289/ehp.1206340, 2014.
Chen, Y., Roden, C. A., and Bond, T. C.: Characterizing biofuel combustion with patterns of real-time emission data (PaRTED), Environ. Sci. Technol., 46, 6110–6117, 2012.
Cohen, A. J., Brauer, M., Burnett, R., Anderson, H. R., Frostad, J., Estep, K., Balakrishnan, K., Brunekreef, B., Dandona, L., Dandona, R., Feigin, V., Freedman, G., Hubbell, B., Jobling, A., Kan, H., Knibbs, L., Liu, Y., Martin, R., Morawska, L., Pope, C. A., Shin, H., Straif, K., Shaddick, G., Thomas, M., van Dingenen, R., van Donkelaar, A., Vos, T., Murray, C. J. L., and Forouzanfar, M. H.: Estimates and 25-year trends of the global burden of disease attributable to ambient air pollution: an analysis of data from the Global Burden of Diseases Study 2015, Lancet, 389, 1907–1918, https://doi.org/10.1016/S0140-6736(17)30505-6, 2017.
Denier van der Gon, H. A. C., Bergström, R., Fountoukis, C., Johansson, C., Pandis, S. N., Simpson, D., and Visschedijk, A. J. H.: Particulate emissions from residential wood combustion in Europe – revised estimates and an evaluation, Atmos. Chem. Phys., 15, 6503–6519, https://doi.org/10.5194/acp-15-6503-2015, 2015.
Dentener, F., Kinne, S., Bond, T., Boucher, O., Cofala, J., Generoso, S., Ginoux, P., Gong, S., Hoelzemann, J. J., Ito, A., Marelli, L., Penner, J. E., Putaud, J.-P., Textor, C., Schulz, M., van der Werf, G. R., and Wilson, J.: Emissions of primary aerosol and precursor gases in the years 2000 and 1750 prescribed data-sets for AeroCom, Atmos. Chem. Phys., 6, 4321–4344, https://doi.org/10.5194/acp-6-4321-2006, 2006.
Dentener, F., Keating, T., and Akimoto, H.: Hemispheric Transport of Air Pollution 2010: Part A – Ozone and Particulate Matter, Air Pollution Studies, No. 17, UN, New York, https://doi.org/10.18356/2c908168-en, 2010.
Dockery, D. W.: Health effects of particulate air pollution, Ann. Epidemiol., 19, 257–263, 2009.
EMEP/EEA: EMEP/EEA air pollutant emission inventory guidebook 2013, European Environment Agency, Copenhagen, 2013.
Erisman, J. W. and Schaap, M.: The need for ammonia abatement with respect to secondary PM reductions in Europe, Environ. Pollut., 129, 159–163, https://doi.org/10.1016/j.envpol.2003.08.042, 2004.
Evans, J., van Donkelaar, A., Martin, R. V., Burnett, R., Rainham, D. G., Birkett, N. J., and Krewski, D.: Estimates of global mortality attributable to particulate air pollution using satellite imagery, Environ. Res., 120, 33–42, 2013.
Ezzati, M.: Indoor air pollution and health in developing countries, Lancet, 366, 104–106, https://doi.org/10.1016/s0140-6736(05)66845-6, 2008.
Farina, S. C., Adams, P. J., and Pandis, S. N.: Modeling global secondary organic aerosol formation and processing with the volatility basis set: Implications for anthropogenic secondary organic aerosol, J. Geophys. Res.-Atmos., 115, D09202, https://doi.org/10.1029/2009jd013046, 2010.
Galmarini, S., Koffi, B., Solazzo, E., Keating, T., Hogrefe, C., Schulz, M., Benedictow, A., Griesfeller, J. J., Janssens-Maenhout, G., Carmichael, G., Fu, J., and Dentener, F.: Technical note: Coordination and harmonization of the multi-scale, multi-model activities HTAP2, AQMEII3, and MICS-Asia3: simulations, emission inventories, boundary conditions, and model output formats, Atmos. Chem. Phys., 17, 1543–1555, https://doi.org/10.5194/acp-17-1543-2017, 2017.
Hallquist, M., Wenger, J. C., Baltensperger, U., Rudich, Y., Simpson, D., Claeys, M., Dommen, J., Donahue, N. M., George, C., Goldstein, A. H., Hamilton, J. F., Herrmann, H., Hoffmann, T., Iinuma, Y., Jang, M., Jenkin, M. E., Jimenez, J. L., Kiendler-Scharr, A., Maenhaut, W., McFiggans, G., Mentel, Th. F., Monod, A., Prévôt, A. S. H., Seinfeld, J. H., Surratt, J. D., Szmigielski, R., and Wildt, J.: The formation, properties and impact of secondary organic aerosol: current and emerging issues, Atmos. Chem. Phys., 9, 5155–5236, https://doi.org/10.5194/acp-9-5155-2009, 2009.
Henneman, L. R. F., Liu, C., Mulholland, J. A., and Russell, A. G.: Evaluating the effectiveness of air quality regulations: A review of accountability studies and frameworks, J. Air Waste Manage., 67, 144–172, https://doi.org/10.1080/10962247.2016.1242518, 2017.
IEA: World Energy Balances 2016, International Energy Agency, Paris, ISBN 978-92-64-26311-6, 2016.
IHME (Institute for Health Metrics and Evaluation): GBD Compare. Seattle, WA, IHME, University of Washington, available at: http://vizhub.healthdata.org/gbd-compare (last access: 7 July 2016), 2015.
Im, U., Brandt, J., Geels, C., Hansen, K. M., Christensen, J. H., Andersen, M. S., Solazzo, E., Kioutsioukis, I., Alyuz, U., Balzarini, A., Baro, R., Bellasio, R., Bianconi, R., Bieser, J., Colette, A., Curci, G., Farrow, A., Flemming, J., Fraser, A., Jimenez-Guerrero, P., Kitwiroon, N., Liang, C.-K., Nopmongcol, U., Pirovano, G., Pozzoli, L., Prank, M., Rose, R., Sokhi, R., Tuccella, P., Unal, A., Vivanco, M. G., West, J., Yarwood, G., Hogrefe, C., and Galmarini, S.: Assessment and economic valuation of air pollution impacts on human health over Europe and the United States as calculated by a multi-model ensemble in the framework of AQMEII3, Atmos. Chem. Phys., 18, 5967–5989, https://doi.org/10.5194/acp-18-5967-2018, 2018.
Janssens-Maenhout, G., Crippa, M., Guizzardi, D., Muntean, M., and Schaaf, E.: HTAP_v2.2: a mosaic of regional and global emission grid maps for 2008 and 2010 to study hemispheric transport of air pollution. European Commission, Joint Research Centre (JRC), Dataset, available at: http://data.europa.eu/89h/jrc-edgar-htap_v2-2 (last access: 15 April 2019), 2013.
Janssens-Maenhout, G., Crippa, M., Guizzardi, D., Dentener, F., Muntean, M., Pouliot, G., Keating, T., Zhang, Q., Kurokawa, J., Wankmüller, R., Denier van der Gon, H., Kuenen, J. J. P., Klimont, Z., Frost, G., Darras, S., Koffi, B., and Li, M.: HTAP_v2.2: a mosaic of regional and global emission grid maps for 2008 and 2010 to study hemispheric transport of air pollution, Atmos. Chem. Phys., 15, 11411–11432, https://doi.org/10.5194/acp-15-11411-2015, 2015.
Janssens-Maenhout, G., Crippa, M., Guizzardi, D., Muntean, M., Schaaf, E., Dentener, F., Bergamaschi, P., Pagliari, V., Olivier, J. G. J., Peters, J. A. H. W., van Aardenne, J. A., Monni, S., Doering, U., and Petrescu, A. M. R.: EDGAR v4.3.2 Global Atlas of the three major Greenhouse Gas Emissions for the period 1970–2012, Earth Syst. Sci. Data Discuss., https://doi.org/10.5194/essd-2017-79, 2017.
Karagulian, F., Belis, C. A., Dora, C. F. C., Prüss-Ustün, A. M., Bonjour, S., Adair-Rohani, H., and Amann, M.: Contributions to cities' ambient particulate matter (PM): A systematic review of local source contributions at global level, Atmos. Environ., 120, 475–483, https://doi.org/10.1016/j.atmosenv.2015.08.087, 2015.
Klimont, Z., Kupiainen, K., Heyes, C., Purohit, P., Cofala, J., Rafaj, P., Borken-Kleefeld, J., and Schöpp, W.: Global anthropogenic emissions of particulate matter including black carbon, Atmos. Chem. Phys., 17, 8681–8723, https://doi.org/10.5194/acp-17-8681-2017, 2017.
Lamarque, J.-F., Bond, T. C., Eyring, V., Granier, C., Heil, A., Klimont, Z., Lee, D., Liousse, C., Mieville, A., Owen, B., Schultz, M. G., Shindell, D., Smith, S. J., Stehfest, E., Van Aardenne, J., Cooper, O. R., Kainuma, M., Mahowald, N., McConnell, J. R., Naik, V., Riahi, K., and van Vuuren, D. P.: Historical (1850–2000) gridded anthropogenic and biomass burning emissions of reactive gases and aerosols: methodology and application, Atmos. Chem. Phys., 10, 7017–7039, https://doi.org/10.5194/acp-10-7017-2010, 2010.
Lelieveld, J., Evans, J. S., Fnais, M., Giannadaki, D., and Pozzer, A.: The contribution of outdoor air pollution sources to premature mortality on a global scale, Nature, 525, 367–371, https://doi.org/10.1038/nature15371, 2015.
Liang, C.-K., West, J. J., Silva, R. A., Bian, H., Chin, M., Davila, Y., Dentener, F. J., Emmons, L., Flemming, J., Folberth, G., Henze, D., Im, U., Jonson, J. E., Keating, T. J., Kucsera, T., Lenzen, A., Lin, M., Lund, M. T., Pan, X., Park, R. J., Pierce, R. B., Sekiya, T., Sudo, K., and Takemura, T.: HTAP2 multi-model estimates of premature human mortality due to intercontinental transport of air pollution and emission sectors, Atmos. Chem. Phys., 18, 10497–10520, https://doi.org/10.5194/acp-18-10497-2018, 2018.
Lim, S. S., Vos, T., Flaxman, A. D., Danaei, G., Shibuya, K., Adair-Rohani, H., AlMazroa, M. A., Amann, M., Anderson, H. R., Andrews, K. G., Aryee, M., Atkinson, C., Bacchus, L. J., Bahalim, A. N., Balakrishnan, K., Balmes, J., Barker-Collo, S., Baxter, A., Bell, M. L., Blore, J. D., Blyth, F., Bonner, C., Borges, G., Bourne, R., Boussinesq, M., Brauer, M., Brooks, P., Bruce, N. G., Brunekreef, B., Bryan-Hancock, C., Bucello, C., Buchbinder, R., Bull, F., Burnett, R. T., Byers, T. E., Calabria, B., Carapetis, J., Carnahan, E., Chafe, Z., Charlson, F., Chen, H., Chen, J. S., Cheng, A. T.-A., Child, J. C., Cohen, A., Colson, K. E., Cowie, B. C., Darby, S., Darling, S., Davis, A., Degenhardt, L., Dentener, F., Des Jarlais, D. C., Devries, K., Dherani, M., Ding, E. L., Dorsey, E. R., Driscoll, T., Edmond, K., Ali, S. E., Engell, R. E., Erwin, P. J., Fahimi, S., Falder, G., Farzadfar, F., Ferrari, A., Finucane, M. M., Flaxman, S., Fowkes, F. G. R., Freedman, G., Freeman, M. K., Gakidou, E., Ghosh, S., Giovannucci, E., Gmel, G., Graham, K., Grainger, R., Grant, B., Gunnell, D., Gutierrez, H. R., Hall, W., Hoek, H. W., Hogan, A., Hosgood, H. D., III, Hoy, D., Hu, H., Hubbell, B. J., Hutchings, S. J., Ibeanusi, S. E., Jacklyn, G. L., Jasrasaria, R., Jonas, J. B., Kan, H., Kanis, J. A., Kassebaum, N., Kawakami, N., Khang, Y.-H., Khatibzadeh, S., Khoo, J.-P., Kok, C., Laden, F., Lalloo, R., Lan, Q., Lathlean, T., Leasher, J. L., Leigh, J., Li, Y., Lin, J. K., Lipshultz, S. E., London, S., Lozano, R., Lu, Y., Mak, J., Malekzadeh, R., Mallinger, L., Marcenes, W., March, L., Marks, R., Martin, R., McGale, P., McGrath, J., Mehta, S., Memish, Z. A., Mensah, G. A., Merriman, T. R., Micha, R., Michaud, C., Mishra, V., Hanafiah, K. M., Mokdad, A. A., Morawska, L., Mozaffarian, D., Murphy, T., Naghavi, M., Neal, B., Nelson, P. K., Nolla, J. M., Norman, R., Olives, C., Omer, S. B., Orchard, J., Osborne, R., Ostro, B., Page, A., Pandey, K. D., Parry, C. D. H., Passmore, E., Patra, J., Pearce, N., Pelizzari, P. M., Petzold, M., Phillips, M. R., Pope, D., Pope, C. A., III, Powles, J., Rao, M., Razavi, H., Rehfuess, E. A., Rehm, J. T., Ritz, B., Rivara, F. P., Roberts, T., Robinson, C., Rodriguez-Portales, J. A., Romieu, I., Room, R., Rosenfeld, L. C., Roy, A., Rushton, L., Salomon, J. A., Sampson, U., Sanchez-Riera, L., Sanman, E., Sapkota, A., Seedat, S., Shi, P., Shield, K., Shivakoti, R., Singh, G. M., Sleet, D. A., Smith, E., Smith, K. R., Stapelberg, N. J. C., Steenland, K., Stöckl, H., Stovner, L. J., Straif, K., Straney, L., Thurston, G. D., Tran, J. H., Van Dingenen, R., van Donkelaar, A., Veerman, J. L., Vijayakumar, L., Weintraub, R., Weissman, M. M., White, R. A., Whiteford, H., Wiersma, S. T., Wilkinson, J. D., Williams, H. C., Williams, W., Wilson, N., Woolf, A. D., Yip, P., Zielinski, J. M., Lopez, A. D., Murray, C. J. L., and Ezzati, M.: A comparative risk assessment of burden of disease and injury attributable to 67 risk factors and risk factor clusters in 21 regions, 1990–2010: a systematic analysis for the Global Burden of Disease Study 2010, Lancet, 380, 2224–2260, https://doi.org/10.1016/s0140-6736(12)61766-8, 2013.
Maas, R. and Grennfelt, P.: Towards Cleaner Air, Scientific Assessment Report 2016, EMEP Steering Body and Working Group on Effects of the Convention on Long-Range Transboundary Air Pollution, Oslo, 2016.
Morgan, R. K.: Environmental impact assessment: the state of the art, Impact Assess. Proj. A., 30, 5–14, https://doi.org/10.1080/14615517.2012.661557, 2012.
Oh, H.-R., Ho, C.-H., Kim, J., Chen, D., Lee, S., Choi, Y.-S., Chang, L.-S., and Song, C.-K.: Long-range transport of air pollutants originating in China: a possible major cause of multi-day high-PM10 episodes during cold season in Seoul, Korea, Atmos. Environ., 109, 23–30, 2015.
Olivier, J. G. J., Janssens-Maenhout, G., Muntean, M., and Peters, J. A. H. W.: Trends in global CO2 emissions: 2016 Report, no. 2315, PBL Netherlands Environmental Assessment Agency, The Hague, 2016.
Park, M. E., Song, C. H., Park, R. S., Lee, J., Kim, J., Lee, S., Woo, J.-H., Carmichael, G. R., Eck, T. F., Holben, B. N., Lee, S.-S., Song, C. K., and Hong, Y. D.: New approach to monitor transboundary particulate pollution over Northeast Asia, Atmos. Chem. Phys., 14, 659–674, https://doi.org/10.5194/acp-14-659-2014, 2014.
Peng, J., Hu, M., Gong, Z., Tian, X., Wang, M., Zheng, J., Guo, Q., Cao, W., Lv, W., Hu, W., Wu, Z., and Guo, S.: Evolution of secondary inorganic and organic aerosols during transport: A case study at a regional receptor site, Environ. Pollut., 218, 794–803, https://doi.org/10.1016/j.envpol.2016.08.003, 2016.
Pope, C. A. and Dockery, D. W.: Health Effects of Fine Particulate Air Pollution: Lines that Connect, J. Air Waste Manage., 56, 709–742, https://doi.org/10.1080/10473289.2006.10464485, 2006.
Pozzer, A., Tsimpidi, A. P., Karydis, V. A., de Meij, A., and Lelieveld, J.: Impact of agricultural emission reductions on fine-particulate matter and public health, Atmos. Chem. Phys., 17, 12813–12826, https://doi.org/10.5194/acp-17-12813-2017, 2017.
Shiraiwa, M., Li, Y., Tsimpidi, A. P., Karydis, V. A., Berkemeier, T., Pandis, S. N., Lelieveld, J., Koop, T., and Pöschl, U.: Global distribution of particle phase state in atmospheric secondary organic aerosols, Nat. Commun., 8, 15002, https://doi.org/10.1038/ncomms15002, 2017.
Silva, R. A., Adelman, Z., Fry, M. M., and West, J. J.: The impact of individual anthropogenic emissions sectors on the global burden of human mortality due to ambient air pollution, Environ. Health Persp., 124, 1776, https://doi.org/10.3390/rs9070744, 2016.
Smith, S. J., van Aardenne, J., Klimont, Z., Andres, R. J., Volke, A., and Delgado Arias, S.: Anthropogenic sulfur dioxide emissions: 1850–2005, Atmos. Chem. Phys., 11, 1101–1116, https://doi.org/10.5194/acp-11-1101-2011, 2011.
Solazzo, E., Riccio, A., Van Dingenen, R., Valentini, L., and Galmarini, S.: Evaluation and uncertainty estimation of the impact of air quality modelling on crop yields and premature deaths using a multi-model ensemble, Sci. Total Environ., 633, 1437–1452, https://doi.org/10.1016/j.scitotenv.2018.03.317, 2018.
Thunis, P., Degraeuwe, B., Pisoni, E., Ferrari, F., and Clappier, A.: On the design and assessment of regional air quality plans: The SHERPA approach, J. Environ. Manage., 183, 952–958, https://doi.org/10.1016/j.jenvman.2016.09.049, 2016.
Thunis, P., Degraeuwe, B., Pisoni, E., Trombetti, M., Peduzzi, E., Belis, C. A., Wilson, J., and Vignati, E.: Urban PM2.5 Atlas – Air Quality in European Cities, EUR 28804 EN, Publication Office of the European Union, Luxembourg, 2017.
Tsimpidi, A. P., Karydis, V. A., and Pandis, S. N.: Response of Inorganic Fine Particulate Matter to Emission Changes of Sulfur Dioxide and Ammonia: The Eastern United States as a Case Study, J. Air Waste Manage., 57, 1489–1498, https://doi.org/10.3155/1047-3289.57.12.1489, 2007.
Van Dingenen, R., Dentener, F., Crippa, M., Leitao, J., Marmer, E., Rao, S., Solazzo, E., and Valentini, L.: TM5–FASST: a global atmospheric source–receptor model for rapid impact analysis of emission changes on air quality and short-lived climate pollutants, Atmos. Chem. Phys., 18, 16173–16211, https://doi.org/10.5194/acp-18-16173-2018, 2018.
van Donkelaar, A., Martin, R. V., Brauer, M., Kahn, R., Levy, R., Verduzco, C., and Villeneuve, P. J.: Global Estimates of Ambient Fine Particulate Matter Concentrations from Satellite-Based Aerosol Optical Depth: Development and Application, Environ. Health Persp., 118, 847–855, https://doi.org/10.1289/ehp.0901623, 2010.
van Donkelaar, A., Martin, R. V., Brauer, M., and Boys, B. L.: Use of Satellite Observations for Long-Term Exposure Assessment of Global Concentrations of Fine Particulate Matter, Environ. Health Persp., https://doi.org/10.1289/ehp.1408646, 2014.
Van Donkelaar, A., Martin, R. V., Brauer, M., Hsu, N. C., Kahn, R. A., Levy, R. C., Lyapustin, A., Sayer, A. M., and Winker, D. M.: Global estimates of fine particulate matter using a combined geophysical-statistical method with information from satellites, models, and monitors, Environ. Sci. Technol., 50, 3762–3772, 2016.
Venkataraman, C., Brauer, M., Tibrewal, K., Sadavarte, P., Ma, Q., Cohen, A., Chaliyakunnel, S., Frostad, J., Klimont, Z., Martin, R. V., Millet, D. B., Philip, S., Walker, K., and Wang, S.: Source influence on emission pathways and ambient PM2.5 pollution over India (2015–2050), Atmos. Chem. Phys., 18, 8017–8039, https://doi.org/10.5194/acp-18-8017-2018, 2018.
Visschedijk, A., Denier van der Gon, H., Droge, R., and Van der Brugh, H.: A European high resolution and size-differentiated emission inventory for elemental and organic carbon for the year 2005, TNO, Utrecht, 2009.
Watkiss, P., Pye, S., and Holland, M.: CAFE CBA: Baseline Analysis 2000 to 2020. Service Contract for Carrying out Cost-Benefit Analysis of Air Quality Related Issues, in particular in the clean Air for Europe (CAFE) Programme, April 2005, available at: http://ec.europa.eu/environment/archives/cafe/activities/pdf/cba_baseline_results2000_2020.pdf (last access: 25 February 2013), 2005.
Weimer, S., Alfarra, M., Schreiber, D., Mohr, M., Prévôt, A., and Baltensperger, U.: Organic aerosol mass spectral signatures from wood-burning emissions: Influence of burning conditions and wood type, J. Geophys. Res.-Atmos., 113, D10304, https://doi.org/10.1029/2007JD009309, 2008.
WHO: Review of evidence on health aspects of air pollution – REVIHAAP, Technical report, The WHO European Centre for Environment and Health, Bonn, WHO Regional Office for Europe, 2013.
WHO: Ambient air pollution: a global assessment of exposure and burden of disease, Geneva, World Health Organization, 2016.
Worldbank: Death in the Air: Air Pollution Costs Money and Lives, available at: http://www.worldbank.org/en/news/infographic/2016/09/08/death-in-the-air-air-pollution-costs-money-and-lives (last access: February 2018), 2016.
Yu, S., Eder, B., Dennis, R., Chu, S. H., and Schwartz, S. E.: New unbiased symmetric metrics for evaluation of air quality models, Atmos. Sci. Lett., 7, 26–34, 2006.
Zhang, Y., Wu, S.-Y., Krishnan, S., Wang, K., Queen, A., Aneja, V. P., and Arya, S. P.: Modeling agricultural air quality: Current status, major challenges, and outlook, Atmos. Environ., 42, 3218–3237, https://doi.org/10.1016/j.atmosenv.2007.01.063, 2008.
OECD countries in 1990: Australia, Austria, Belgium, Canada, Denmark, Finland, France, Germany, Greece, Iceland, Ireland, Italy, Japan, Luxembourg, Netherlands, New Zealand, Norway, Portugal, Spain, Sweden, Switzerland, Turkey, United Kingdom, United States.


