the Creative Commons Attribution 4.0 License.
the Creative Commons Attribution 4.0 License.
 | 28 Feb 2019
Interpretation of measured aerosol mass scattering efficiency over North America using a chemical transport model
Robyn N. C. Latimer
Aerosol mass scattering efficiency affects climate forcing calculations, atmospheric visibility, and the interpretation of satellite observations of aerosol optical depth. We evaluated the representation of aerosol mass scattering efficiency (αsp) in the GEOS-Chem chemical transport model over North America using collocated measurements of aerosol scatter and mass from IMPROVE network sites between 2000 and 2010. We found a positive bias in mass scattering efficiency given current assumptions of aerosol size distributions and particle hygroscopicity in the model. We found that overestimation of mass scattering efficiency was most significant in dry (RH <35 %) and midrange humidity (35 % < RH <65 %) conditions, with biases of 82 % and 40 %, respectively. To address these biases, we investigated assumptions surrounding the two largest contributors to fine aerosol mass, organic (OA) and secondary inorganic aerosols (SIA). Inhibiting hygroscopic growth of SIA below 35 % RH and decreasing the dry geometric mean radius, from 0.069 µm for SIA and 0.073 µm for OA to 0.058 µm for both aerosol types, significantly decreased the overall bias observed at IMPROVE sites in dry conditions from 82 % to 9 %. Implementation of a widely used alternative representation of hygroscopic growth following κ-Kohler theory for secondary inorganic (hygroscopicity parameter κ=0.61) and organic (κ=0.10) aerosols eliminated the remaining overall bias in αsp. Incorporating these changes in aerosol size and hygroscopicity into the GEOS-Chem model resulted in an increase of 16 % in simulated annual average αsp over North America, with larger increases of 25 % to 45 % in northern regions with high RH and hygroscopic aerosol fractions, and decreases in αsp up to 15 % in the southwestern U.S. where RH is low.
- Article
(5190 KB) - Full-text XML
- BibTeX
- EndNote


The interaction of atmospheric aerosols with radiation has substantial implications for the direct radiative effects of atmospheric aerosols, atmospheric visibility, and satellite retrievals of aerosol optical properties. The direct radiative effects of aerosols remain a major source of uncertainty in radiative forcing (Myhre et al., 2013). Atmospheric visibility affects the appearance of landscape features, which is of particular concern in national parks and wilderness areas (Malm et al., 1994). Gaining insight into the concentration and composition of atmospheric aerosols via interpretation of satellite retrievals of aerosol optical depth (AOD) also relies heavily on an understanding of the interaction of aerosols with radiation (Kahn et al., 2005). Analysis of collocated measurements of aerosol scatter, mass, and composition could offer valuable insight into aerosol optical properties.
Mass scattering efficiency is a complex function of aerosol size, composition, hygroscopicity, and mixing state (Hand and Malm, 2007; Malm and Kreidenweis, 1997; White, 1986). Current chemical transport models and global circulation models often calculate atmospheric extinction due to aerosols from speciated aerosol mass concentrations using a composition- and size-dependent mass extinction efficiency (αext, m2 g−1). Many of these models use aerosol optical and physical properties defined by the Global Aerosol Data Set (GADS), compiled from measurements and models from 1970 to 1995 (Koepke et al., 1997). The subsequent expansion in long-term aerosol monitoring offers an exciting possibility to further improve model representation of aerosol physical and optical properties. The Interagency Monitoring of Protected Visual Environments (IMPROVE) network offers long-term collocated measurements since 1987 of particle scatter (bsp), relative humidity (RH), particulate mass concentrations less than 10 µm (PM10) and less than 2.5 µm (PM2.5), as well as PM2.5 chemical composition at sites across the United States and Canada (Malm et al., 1994, 2004). These collocated measurements provide direct estimates of mass scattering efficiency (αsp) across North America that are useful to evaluate and improve the mass scattering efficiency currently used in models.
Several prior studies have analysed mass scattering efficiencies. Hand et al. (2007) performed an extensive review that examined and compared mass scattering efficiencies calculated from ground-based measurements from approximately 60 mostly short-term studies from 1990 to 2007. In this review, the importance of long-term measurements was emphasized. Malm and Hand (2007) applied IMPROVE network data between 1987 and 2003 to evaluate mass scattering efficiency of organic and inorganic aerosols at 21 IMPROVE sites. A couple of more recent examples of short-term studies of mass scattering efficiency are Titos et al. (2012) and Tao et al. (2014). Many other long-term multi-site studies have investigated aerosol optical properties (e.g. Andrews et al., 2011; Collaud Coen et al., 2013; Pandolfi et al., 2017), but few include measurements of aerosol mass concentrations and therefore do not provide information on mass scattering efficiencies. Our study builds upon previous studies of mass scattering efficiency by reducing initial assumptions regarding size and hygroscopicity of inorganic and organic aerosols and by using measurements of particle speciation, mass, and scatter to inform the representation of these properties. We interpret long-term measurement data to obtain a representation of mass scattering efficiency that can be used across an array of conditions and locations to facilitate incorporation into chemical transport models.
Here we interpret collocated measurements of PM2.5, PM10, bsp, and RH from the IMPROVE network to understand factors affecting the representation of mass scattering efficiency. Section 2 provides a description of IMPROVE network measurements, of the GEOS-Chem chemical transport model, and of an alternative aerosol hygroscopic growth scheme. In Sect. 3, we present an analysis of the current representation of mass scattering efficiency in the GEOS-Chem model, and identify changes that improve the consistency with observations. The impacts of these changes on GEOS-Chem-simulated mass scattering efficiency, as well as on agreement between the GEOS-Chem model and observations from the IMPROVE network, are described in Sect. 4.
2.1 IMPROVE network measurements
The IMPROVE network (Malm et al., 1994) is a long-term monitoring program established in 1987 to monitor visibility trends in national parks and wilderness areas in the United States. The network offers measurements of PM2.5 speciation, PM2.5 and PM10 gravimetric mass, and collocated measurements of bsp and RH at a subset of sites that we interpret to understand mass scattering efficiency.
The IMPROVE particle sampler collects PM2.5 and PM10 on filters. Sampling occurs over a 24 h period every third day. Collected PM2.5 is analysed for fine gravimetric mass, elemental concentrations (including Al, Si, Ca, Fe, Ti), ions (, , , Cl−), and organic and elemental carbon. Collected PM10 undergoes gravimetric analysis for total particulate mass less than 10 µm, allowing for the determination of coarse mass (PM10−PM2.5) (Malm et al., 1994).
Particle scatter (bsp) is measured at 550 nm at a subset of IMPROVE sites using OPTEC NGN-2 open air integrating nephelometers (Malm et al., 1994; Malm and Hand, 2007; Molenar, 1997). bsp is reported hourly at ambient air temperature and relative humidity; all three parameters are recorded. We filter bsp data to exclude measurements likely affected by meteorological interference such as fog. These conditions include an RH threshold of 95 %, a maximum bsp threshold of 5000 Mm−1, and an hourly rate of change threshold for bsp of 50 Mm−1, following IMPROVE filtering protocols (IMPROVE, 2004).
The IMPROVE network collects collocated samples at a subset of sites, which can provide insight into precision errors associated with the measurements of major species. Hyslop and White (2008) and Solomon et al. (2014) found mean collocated precision errors ranging from 6 % to 11 % for particulate mass measured by IMPROVE. Typical uncertainties in IMPROVE bsp measurements are in the range of 5 %–15 % (Gebhart et al., 2001). Due to nephelometer truncation errors, uncertainties in measured bsp increase as particle size distributions increase, and coarse particle scattering can be underestimated (Molenar, 1997).
For this study, we select sites where fine aerosol mass and speciation measurements are collocated with IMPROVE nephelometers between 2000 and 2010. We exclude data after 2010 to address concerns about variable laboratory RH for PM10 measurement after 2010. Sea salt aerosols are excluded from the analysis from 2000 to 2004, as reliable estimates of sea salt concentrations were not reported during this period. We exclude coastal sites during this period, as sea salt can contribute significantly to bsp in coastal conditions of high RH due to its highly hygroscopic nature (Lowenthal and Kumar, 2006). We use only days with coincident mass and scatter measurements, and a minimum of 23 hourly measurements per day, to reduce influence of meteorological interference. Additionally, only sites with a minimum of 90 days of measurements are included in the analysis.
Figure 1 shows at the 28 sites used in this study the average hourly bsp at ambient RH and the average 24 h PM10 and PM2.5 measured between 2000 and 2010. Measured bsp values vary by a factor of 7, with scatter below 20 Mm−1 across the southwestern U.S. and scatter above 50 Mm−1 across the southeastern U.S. Measured PM10 concentrations vary by a factor of 3, with values below 6 µg m−3 in the west to above 14 µg m−3 in the southeast. Measured PM2.5 concentrations also vary by a factor of 3, with values below 3 µg m−3 in the west to above 9 µg m−3 in the southeast.
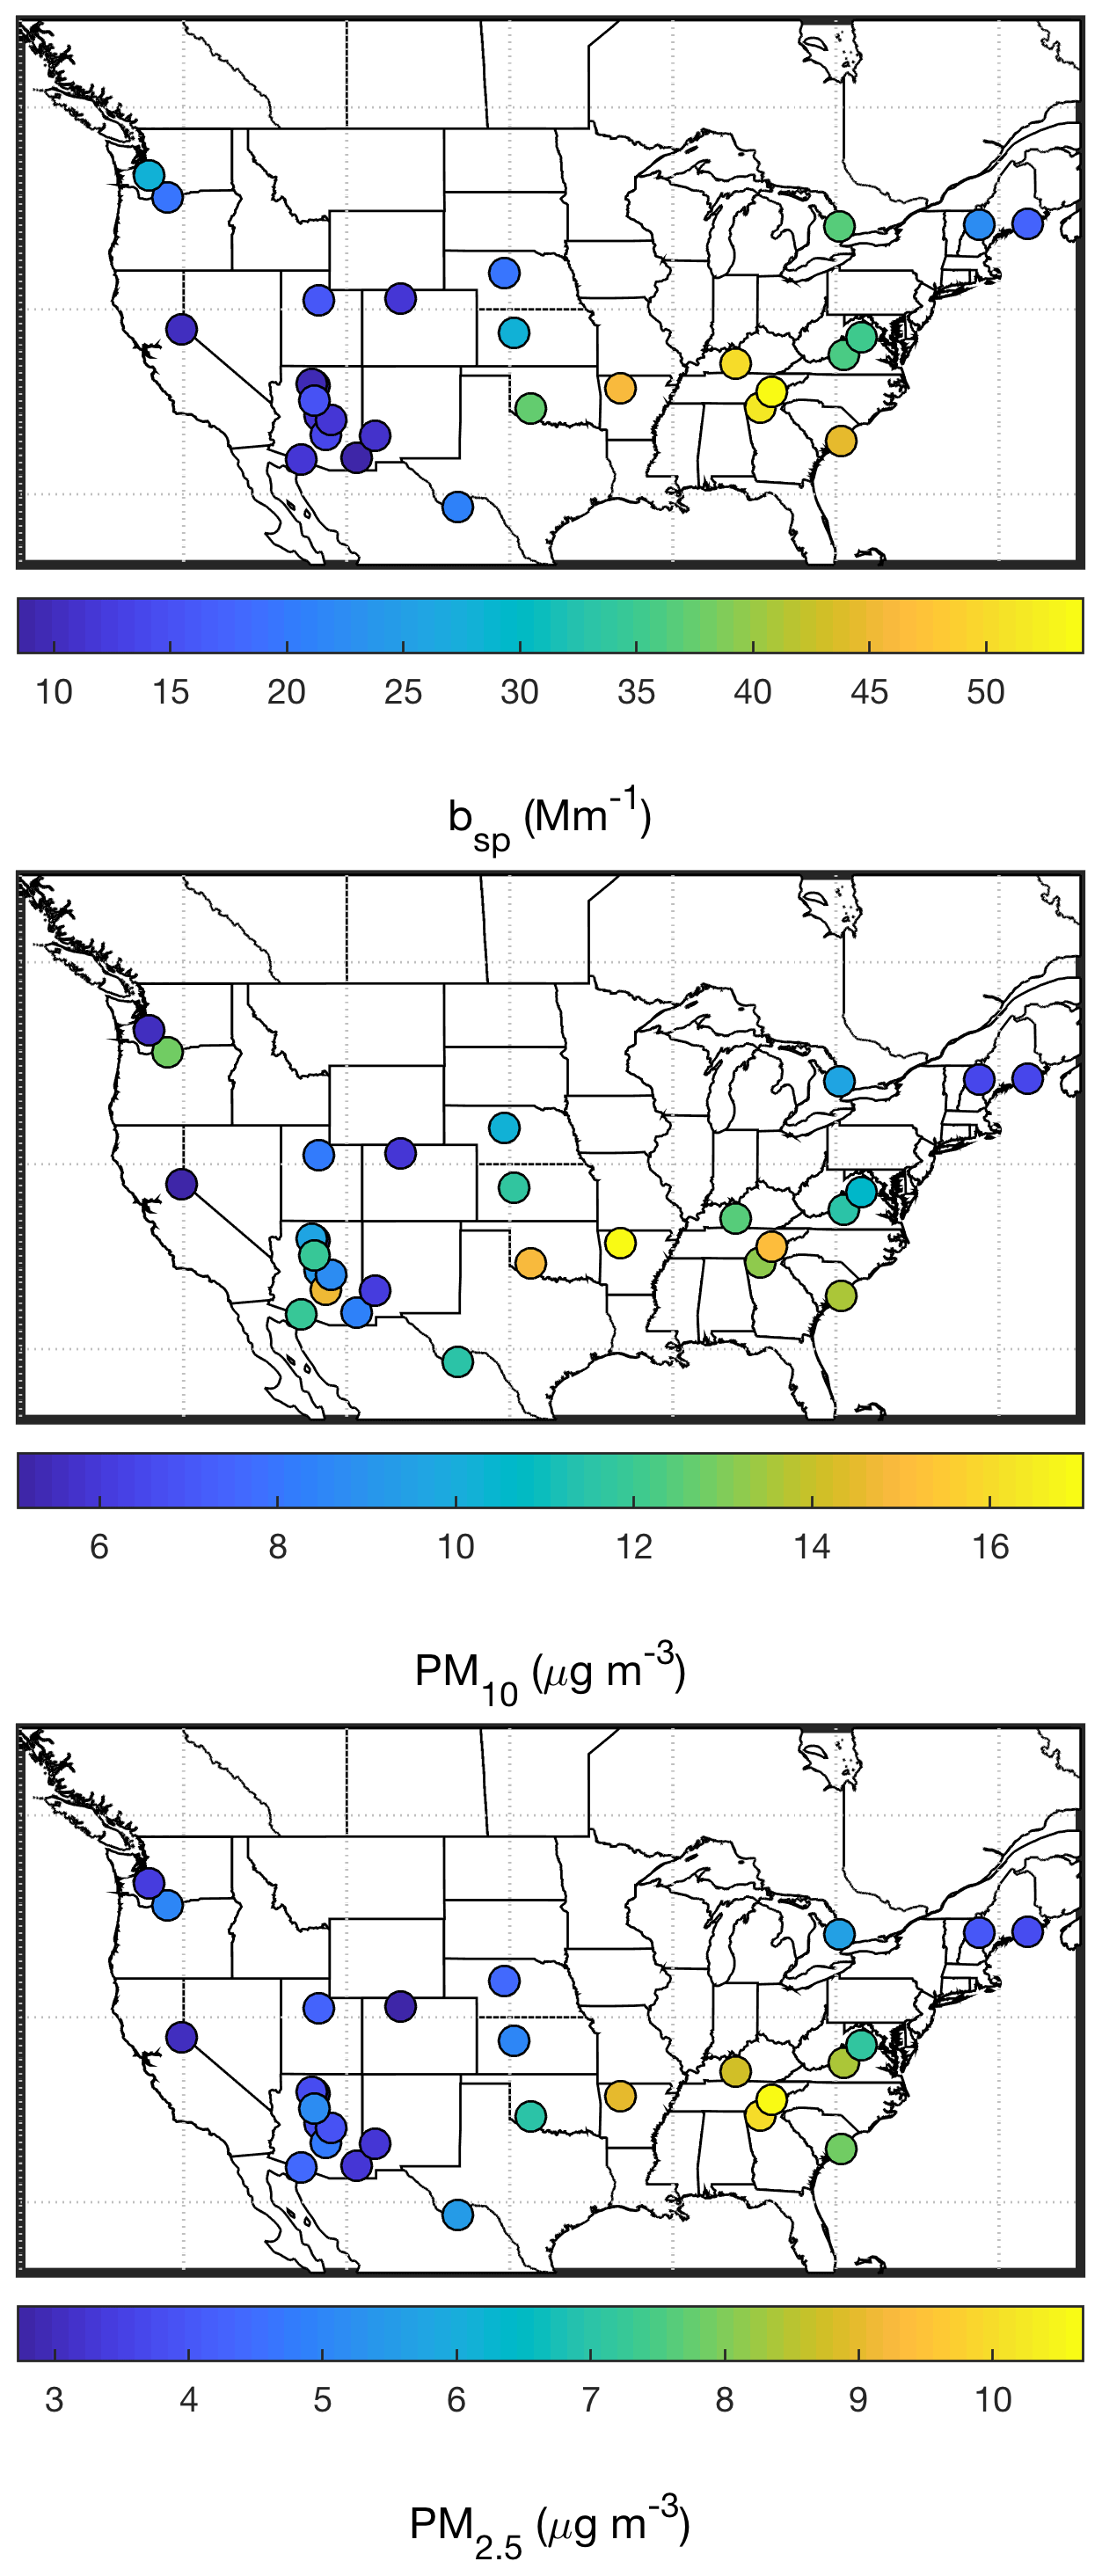
Figure 1Map of IMPROVE sites with collocated scatter (bsp) at 550 nm and ambient relative humidity, PM10, and PM2.5 measurements in North America between 2000 and 2010.
2.2 GEOS-Chem simulation
We simulate hourly PM2.5 and PM10 mass concentrations and particle scatter using the global chemical transport model GEOS-Chem (version 11-02, http://geos-chem.org, last access: 7 September 2017). The GEOS-Chem model is driven by assimilated meteorology from the Goddard Earth Observation System (GEOS MERRA-2, Gelaro et al., 2017) of the NASA Global Modeling and Assimilation Office (GMAO). Our simulation for North America is conducted at 2∘ × 2.5∘ resolution over 47 vertical levels.
The majority of our analysis focuses on the accuracy of the GEOS-Chem parameterization of mass scattering efficiency based on optical parameters given in Table A1. These default aerosol physical and optical properties are defined by the Global Aerosol Data Set (GADS) (Koepke et al., 1997), as implemented by Martin et al. (2003), with modifications to dry size distributions (Drury et al., 2010) and dust mass partitioning (Ridley et al., 2012). After evaluating and improving this parameterization, implications are examined using the full GEOS-Chem simulation in Sect. 3.3.
GEOS-Chem simulates detailed aerosol-oxidant chemistry (Bey et al., 2001; Park et al., 2004). The aerosol simulation includes the sulfate–nitrate–ammonium system (Park et al., 2004), primary (Park et al., 2003; Wang et al., 2014) and secondary (Pye et al., 2010) carbonaceous aerosols, mineral dust (Fairlie et al., 2007, 2010; Zhang et al., 2013), and sea salt (Jaeglé et al., 2011). Organic matter (OM) is estimated from primary organic carbon (OC) using spatially and seasonally varying OM ∕ OC ratios at 0.1∘ × 0.1∘ resolution (Philip et al., 2014b). The thermodynamic equilibrium model ISORROPIA-II (Fountoukis and Nenes, 2007), implemented by Pye et al. (2009), is used to calculate gas–aerosol partitioning. Total PM10 is calculated following van Donkelaar et al. (2010), but at 40 % RH here for consistency with the IMPROVE network gravimetric analysis in the range of 30 %–50 % RH (Solomon et al., 2014). Particle scatter and aerosol optical depth are calculated at modelled ambient RH based on dry species mass concentrations and aerosol physical and optical properties. The GEOS-Chem aerosol simulation has been extensively evaluated with observations of mass (van Donkelaar et al., 2015; Li et al., 2016), composition (Achakulwisut et al., 2017; Kim et al., 2015; Marais et al., 2016; Philip et al., 2014a; Ridley et al., 2017; Zhang et al., 2013), and scatter (Drury et al., 2010).
We conduct a simulation for the year 2006, to represent the period of greatest measurement density of collocated bsp and PM sites over North America. We archive model fields every hour over North America. We simulate PM10, PM2.5, and bsp, allowing for the comparison of model mass scattering efficiency coincident with that measured at IMPROVE network sites over the same time period over North America.
2.3 Determining mass scattering efficiency (αsp)
One method of determining mass scattering efficiencies from measurements involves bsp measurements and particle mass concentration measurements (Mmeas). Mass scattering efficiency of a given aerosol population can be defined as the ratio of particle scatter to mass.
Hourly mass scattering efficiencies are determined using collocated measurements of bsp and mass concentrations from the IMPROVE network, treating IMPROVE mass concentrations as constant over each 24 h sampling period. Total scatter is typically dominated by fine-mode aerosols, but in certain conditions coarse dust can also make a significant contribution (White et al., 1994). Thus, measured PM10 mass is used in the denominator of Eq. (1).
Multiple definitions of αsp exist. We define αsp operationally here based on optical measurements at ambient RH, and PM measurements at controlled RH (treated as 40 % RH for consistency with IMPROVE protocols prior to 2011). At 40 % RH, hygroscopic components of PM10 will have associated water, and thus measured PM10 mass is not treated as dry. We compare these measured αsp with calculated αsp based on species-specific mass scattering efficiencies (αGC, j) used in GEOS-Chem, constrained with mass concentrations (Mj) and PM10 mass measured by IMPROVE.
To reduce the impacts of meteorological variation on the comparison of measured and calculated mass scattering efficiency, we perform averages of hourly bsp, calc, bsp, meas, and PM10 over the entire sampling period at each IMPROVE site i. Equation (3) is then used to obtain average calculated and measured mass scattering efficiency at each site.
Although the OPTEC open air nephelometer reduces truncation error compared with other nephelometers, truncation error can be significant for coarse particles (Hand and Malm, 2007; Lowenthal and Kumar, 2006). Thus our analysis below focuses on conditions dominated by fine-mode aerosols, and mechanisms affecting fine-mode aerosols.
Appendix A describes the calculation of mass scattering efficiency in more detail. This approach enables isolation of the mass scattering efficiencies used in GEOS-Chem from the species concentrations.
2.4 Introducing an alternate hygroscopic growth scheme
We examine for GEOS-Chem the use of a widely adopted alternate hygroscopic growth scheme, in which aerosol hygroscopic growth is defined by a single parameter, κ (Petters and Kreidenweis 2007, 2008, 2013). This representation of water uptake by aerosols was originally developed for supersaturated CCN conditions, but in recent years has been used extensively in subsaturated conditions (Dusek et al., 2011; Hersey et al., 2013).
The hygroscopic parameter κ is defined by
where Vd is dry particulate matter volume, Vw is the water volume, and aw is water activity (Petters and Kreidenweis, 2013), which is unity for secondary inorganic aerosols (SIA) and organic aerosols (OA). The diameter growth factor (GF ) can be expressed (Snider et al., 2016) as
where D is the wet aerosol radius and Dd is the dry aerosol radius. Typically, κ is in the range of 0.5–0.7 for SIA (Hersey et al., 2013; Kreidenweis et al., 2008; Petters and Kreidenweis, 2007) and 0–0.2 for OA (Duplissy et al., 2011; Kreidenweis et al., 2008; Rickards et al., 2013; Snider et al., 2016).
3.1 Understanding the current representation of αsp
Figure 2 (left) shows measured vs. calculated mass scattering efficiency using GEOS-Chem default optical tables. Each point represents the average αsp over the entire sampling period at each IMPROVE site. A significant correlation (r=0.94) is apparent; however, a bias in αsp is evident. A positive correlation between average mass scattering efficiency and RH is apparent; sites with low average RH have low average αsp and vice versa. (Panel (b) of Fig. 2 is discussed below.)
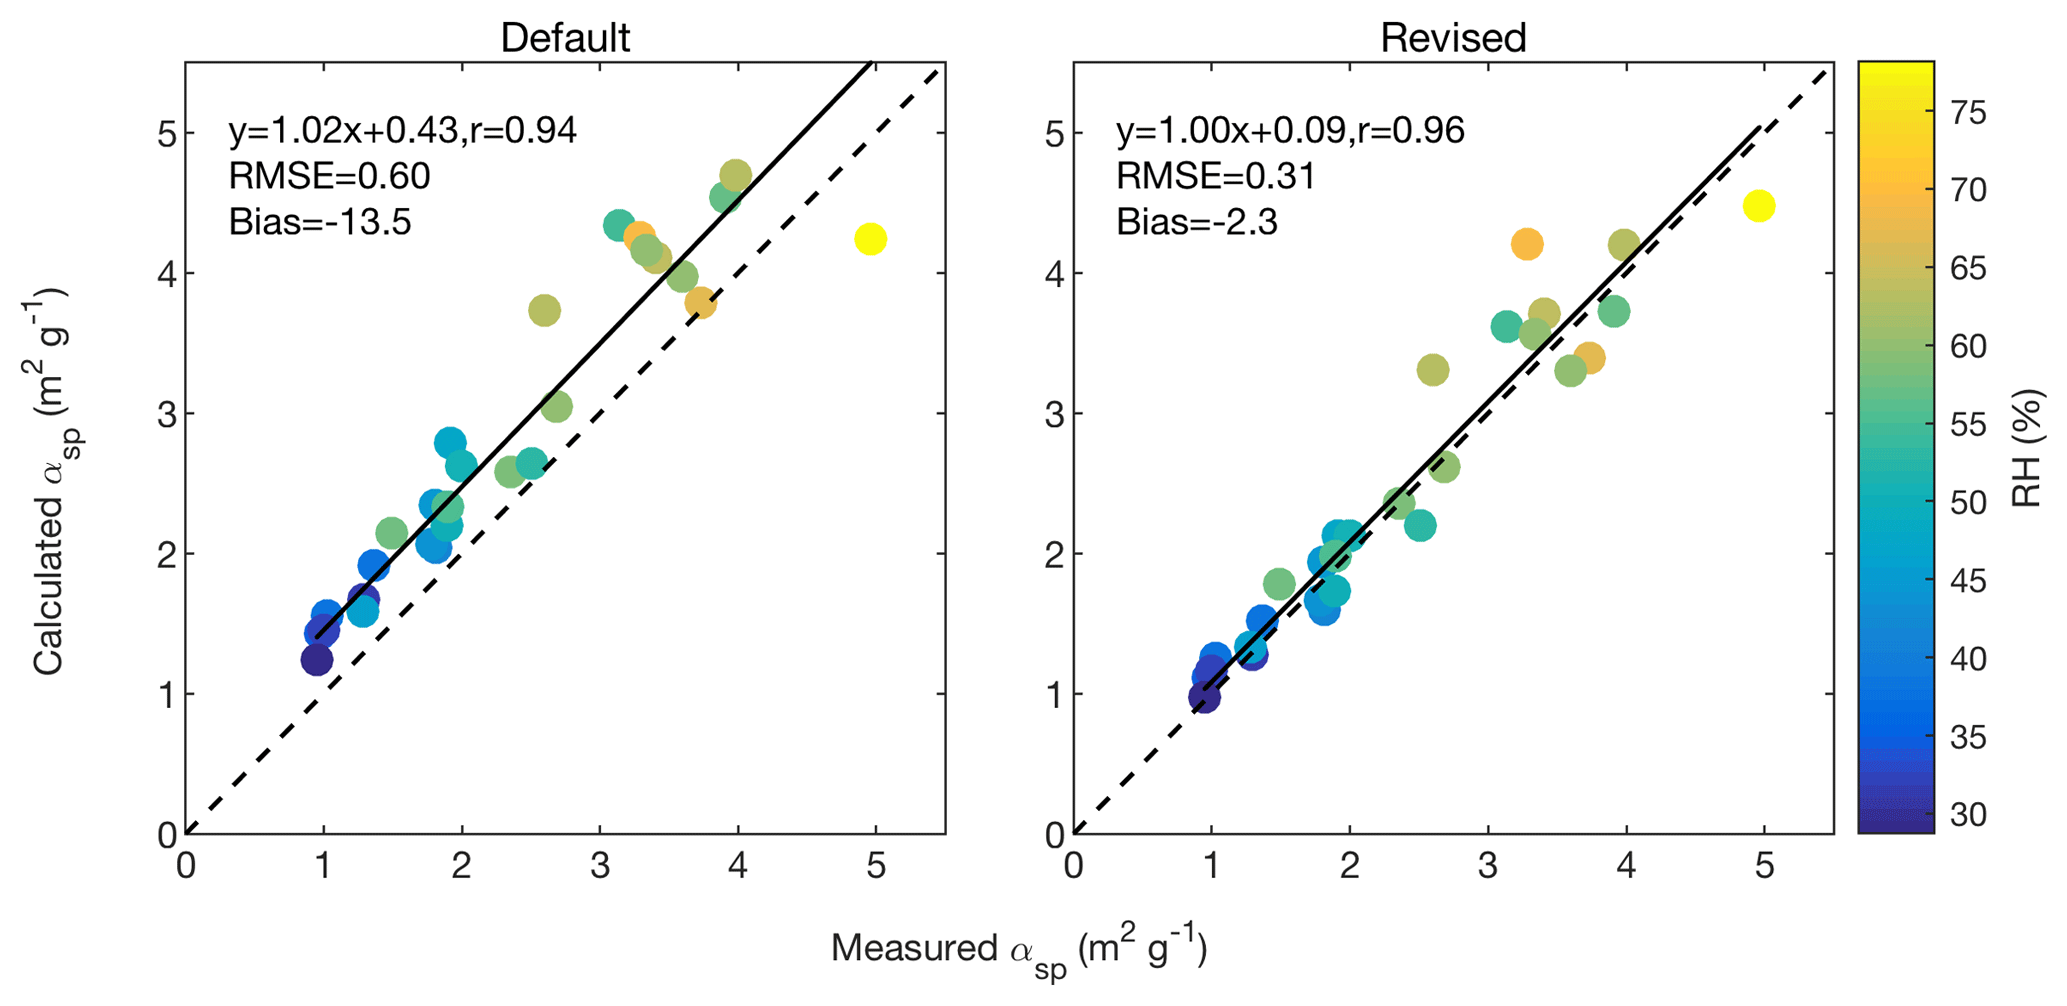
Figure 2Average measured vs. calculated αsp at 550 nm at IMPROVE sites between 2000 and 2010 using GEOS-Chem default optical tables and revised optical tables. The colour of each point corresponds to the average relative humidity at the site. The 1:1 line is black. Slope, offset, and correlation coefficient are inset.
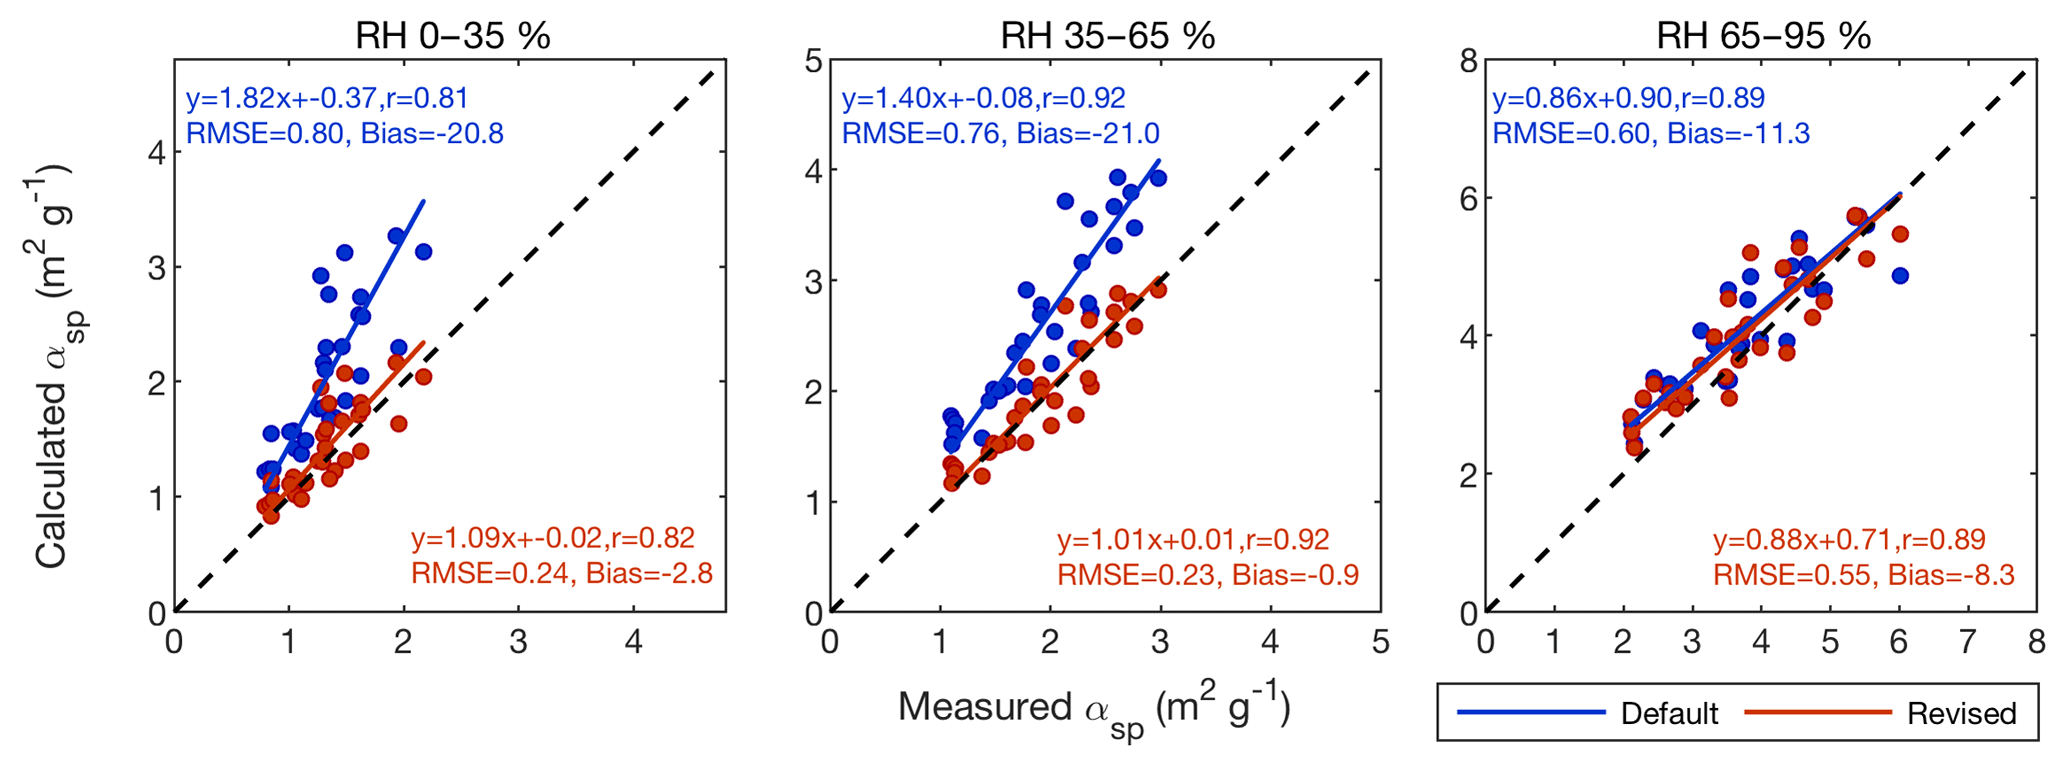
Figure 3Average measured vs. calculated αsp at 550 nm at IMPROVE sites between 2000 and 2010 using GEOS-Chem default and revised optical tables (Table A1) for measurements taken in 0 %–35 %, 35 %–65 %, and 65 %–95 % RH conditions. The 1:1 line is black. Slope, offset, and correlation coefficient are inset.
To further investigate the RH dependence of this bias, we separate our analysis of calculated αsp into three relative humidity groupings: 0 %–35 % (low), 35 %–65 % (mid), and 65 %–95 % (high). The IMPROVE data are divided among the RH groupings using IMPROVE measurements of hourly RH. Within each grouping, average calculated and measured mass scattering efficiencies are obtained for each site using Eq. (3). The blue dots in Fig. 3 show average calculated vs. measured αsp for each RH range. In the low RH case, a significant overestimation of mass scattering efficiency is apparent at most sites, with a bias of 82 % indicated by the slope. In the mid RH case, overestimation of αsp is less significant but still apparent, with a bias of 40 % indicated by the slope. At high RH, bias is weak.
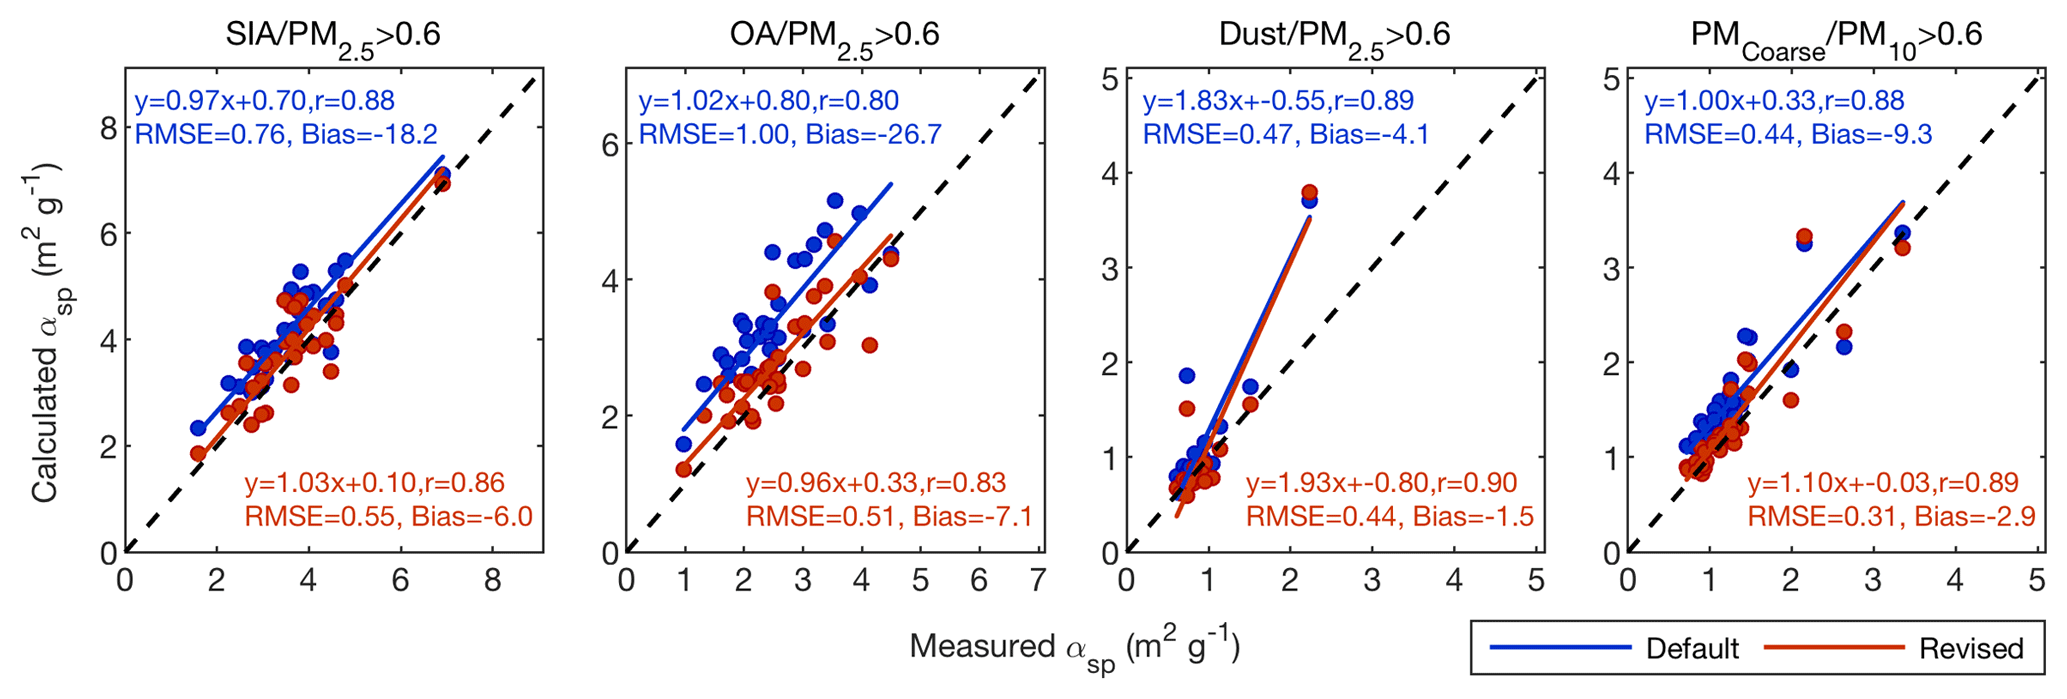
Figure 4Average measured vs. calculated αsp (550 nm) at IMPROVE sites between 2000 and 2010 using GEOS-Chem default and revised optical tables for measurements taken in conditions dominated by secondary inorganic aerosols (SIA), organic aerosols (OA), fine dust, and PMcoarse (PM10–PM2.5). The 1:1 line is black. Slope, offset, and correlation coefficient are inset.
To further understand the source of the bias in calculated mass scattering efficiency, we now examine calculated αsp in conditions dominated by different aerosol types. Using IMPROVE measurements of 24 hr PM2.5 mass and speciation and PM10 mass, the IMPROVE data are grouped based on dominant aerosol type. Within each group, average calculated and measured mass scattering efficiency is obtained for each site using Eq. (3). Figure 4 shows in blue average measured vs. calculated αsp using default optical tables for conditions where measured PM2.5 is dominated (>60 %) by secondary inorganic aerosol, organic aerosol, and fine dust, as well as conditions where PM10 is dominated (>60 %) by PMcoarse (PM10–PM2.5). The scatterplot in the SIA-dominant case resembles the overall relationship shown in Fig. 2. αsp is overestimated at most sites, with significant correlation (r=0.88) and a bias evident in the offset of 0.70. Where OA is the dominant component of PM2.5, the slope is close to unity (1.02), but the large offset of 0.80 m2g−1 results in αsp being largely overestimated. Where dust is the dominant fine aerosol, correlation is significant (r=0.89) and mass scattering efficiency is accurately calculated at the vast majority of sites, despite a prominent outlier at a site in the Columbia River Gorge, Washington. The PMcoarse-dominant case shows significant correlation (r=0.88) and a slight tendency for overestimation of αsp. As this case is not independent of the other cases, this overestimation is likely linked to the overestimation in the OA- and SIA-dominant cases as demonstrated below.
These results indicate that the bias in calculated mass scattering efficiency arises mostly due to the representation of the physical and optical properties of secondary inorganic and organic aerosols. The following will focus on improving the representation of physical and optical properties of these two aerosol types.
3.2 Changing the physical properties of SIA and OA
Figure 5 shows mass scattering efficiency as a function of aerosol size for secondary inorganic (orange) and organic (blue) aerosols for dry aerosols (solid) and aerosols at 80 % RH (dashed lines) as calculated using a Mie algorithm (Mishchenko et al., 1999). Water uptake at 80 % RH for OA and SIA is calculated using default hygroscopic growth factors from GEOS-Chem. The uptake of water increases aerosol scatter, decreases aerosol density, and decreases the refractive index. The increase in aerosol scatter with increasing ambient RH drives the increase in αsp.
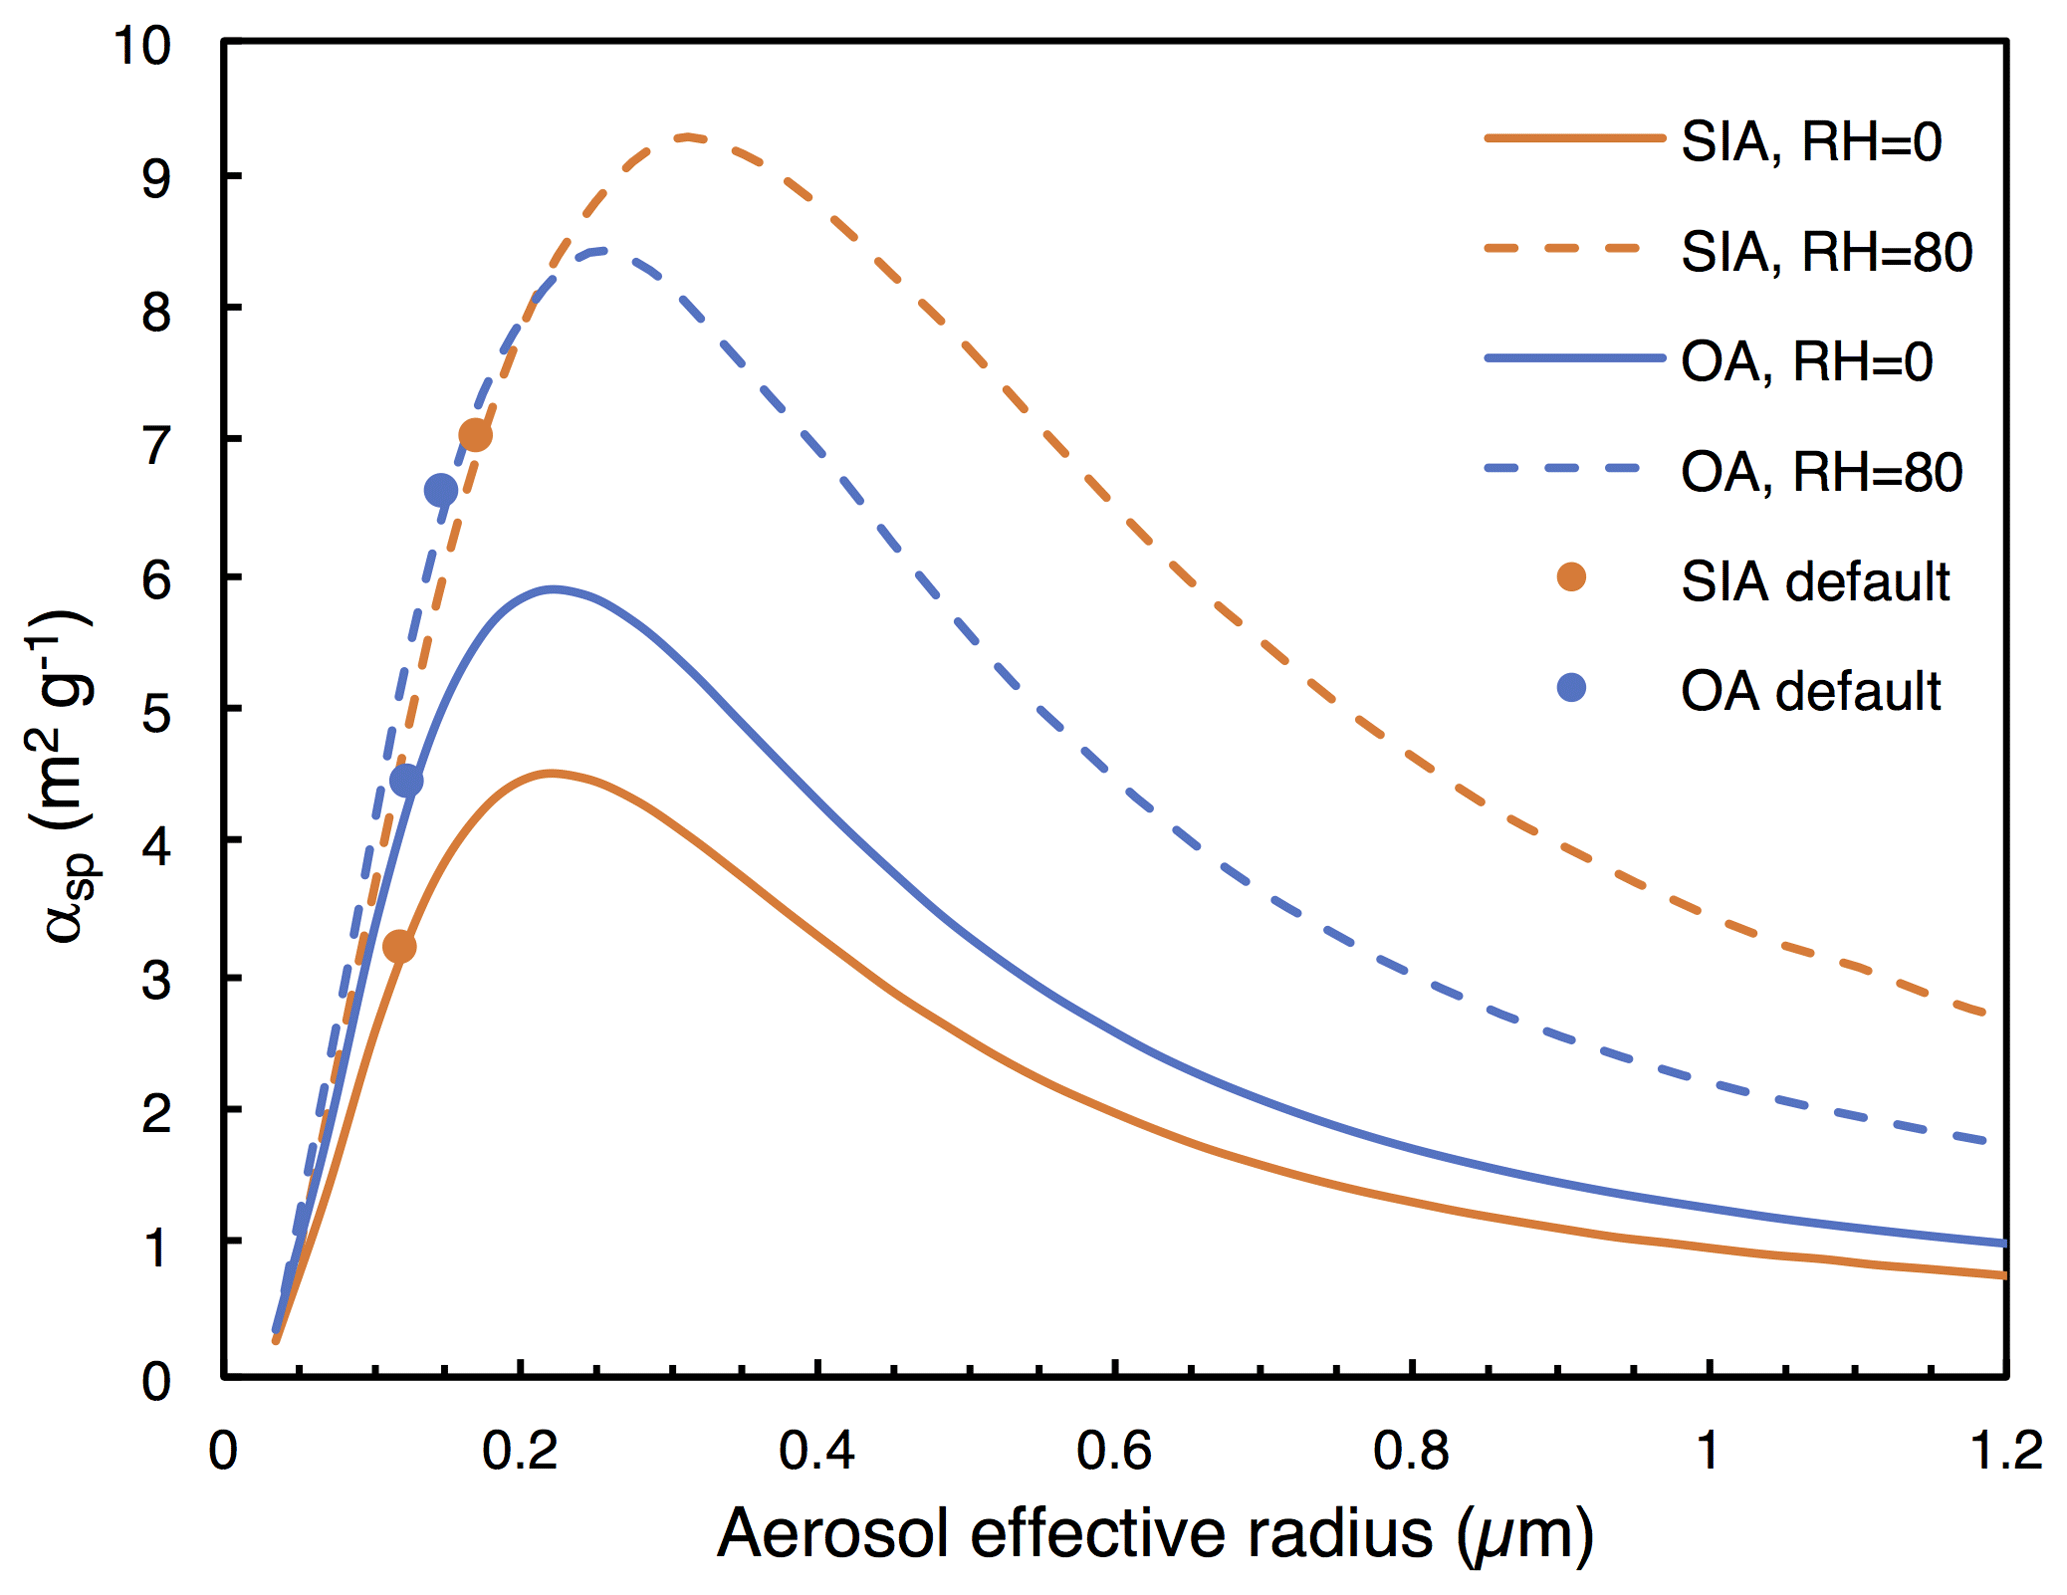
Figure 5Mass scattering efficiency (αsp) at 550 nm as a function of aerosol wet effective radius for organic aerosol and secondary inorganic aerosol. Solid lines show αsp for dry aerosol (RH =0 %); dashed lines show αsp for aqueous aerosols (RH =80 %). Points represent the default size in GEOS-Chem.
The points in Fig. 5 represent the current mass scattering efficiency values of OA and SIA in GEOS-Chem. For dry aerosols, αsp=4.4 m2 g−1 for OA and αsp=3.2 m2 g−1 for SIA. In a review of ground-based estimates of aerosol mass scattering efficiencies, Hand et al. (2007) found dry αsp values of 2.5 m2 g−1 for ammonium sulfate, 2.7 m2 g−1 for ammonium nitrate, and 3.9 m2 g−1 for particulate organic matter. These values suggest that the default optical tables in GEOS-Chem currently overestimate mass scattering efficiency of SIA and OA in dry conditions. This reaffirms the overestimation of αsp in dry conditions evident in panel (a) of Fig. 3. As aerosol size is the strongest determinant of dry mass scattering efficiency, we begin by examining the dry sizes of SIA and OA in GEOS-Chem.
The current dry sizes of SIA and OA in GEOS-Chem were informed by measurements from several aircraft campaigns over eastern North America during the summer of 2004 (Drury et al., 2010) as part of the International Consortium for Atmospheric Research on Transport and Transformation (ICARTT) (Fehsenfeld et al., 2006; Singh et al., 2006). Aerosol surface area and volume distributions fluctuate seasonally in the northeastern U.S., with summer maxima and winter minima (Stanier et al., 2004). We divide our analysis at low RH by season, in an effort to discern a seasonal pattern in the overestimation of αsp.
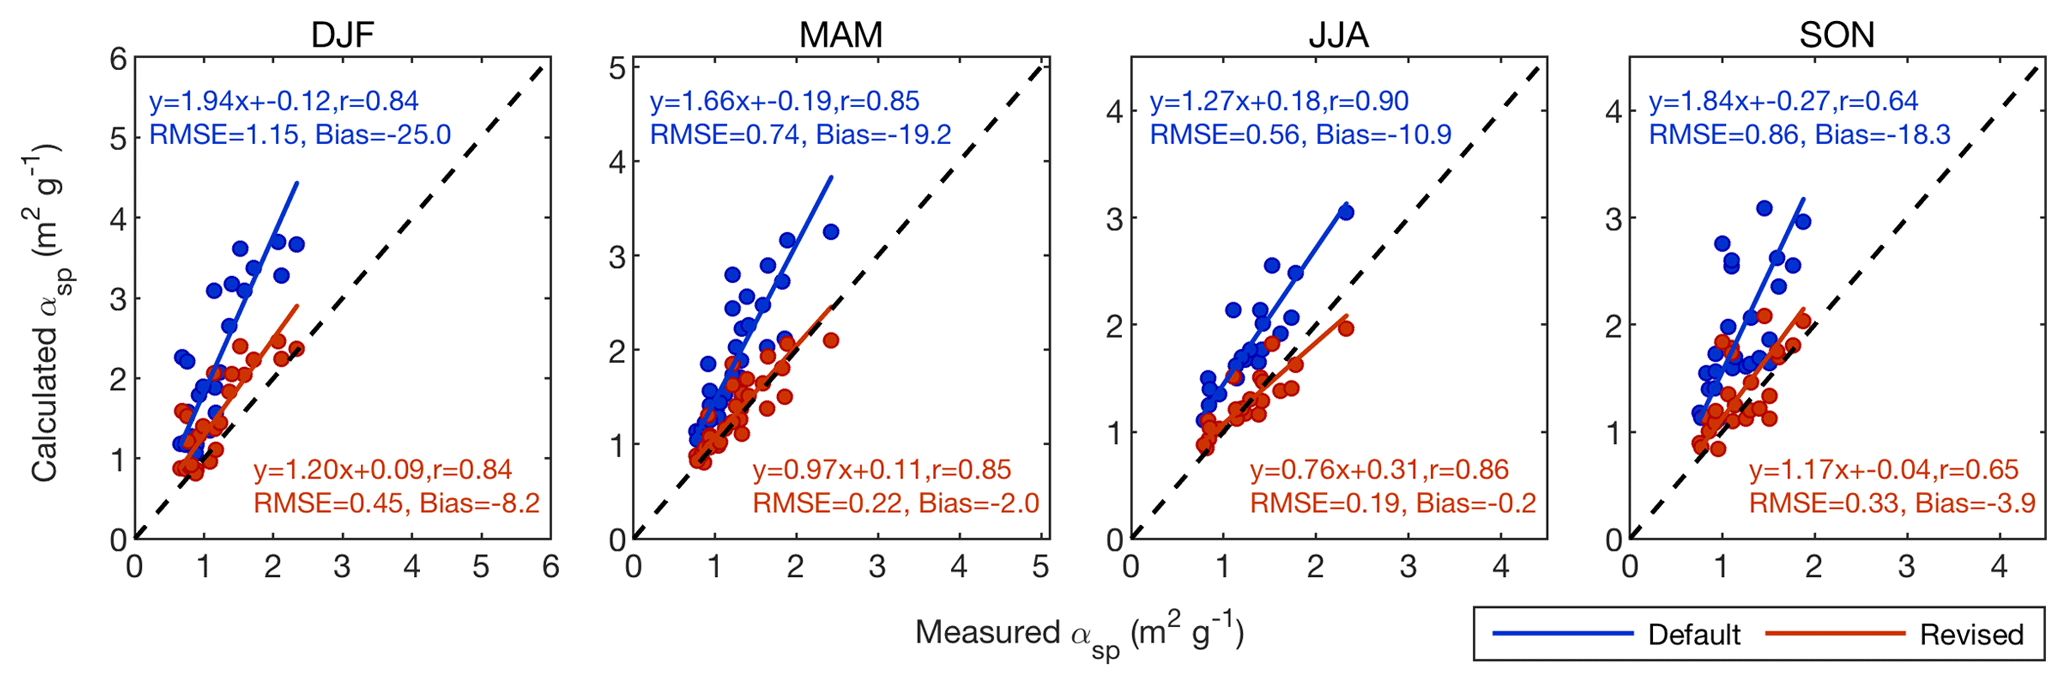
Figure 6Average measured vs. calculated αsp (550 nm) at IMPROVE sites between 2000 and 2010 using GEOS-Chem default and revised optical tables for measurements taken in dry conditions (RH <35 %) in winter, spring, summer, and fall. The 1:1 line is black. Slope, offset, and correlation coefficient are inset.
Figure 6 (blue) shows seasonal measured vs. calculated mass scattering efficiency in dry conditions using default optical tables (Table A1). Estimations of αsp are most accurate in the summer, consistent with the dry sizes chosen by Drury et al. (2010) which were informed by summertime size distribution measurements. The larger overestimation of αsp in all other seasons, most notably in winter, is consistent with the seasonality in aerosol size distributions observed by Stanier et al. (2004).
3.2.1 Efflorescence relative humidity
To address the overestimation of mass scattering efficiency in dry conditions illustrated in Figs. 3 and 6, we begin by accounting for efflorescence transitions in secondary inorganic aerosols. Efflorescence phase transitions are characterized by nucleation of the crystalline phase followed by rapid evaporation of water. Field measurements have found evidence for these transitions (Martin et al., 2008). The efflorescence relative humidity (ERH) of ammonium sulfate reported in several experimental studies ranges from 35 % to 40 % (Ciobanu et al., 2010). Laboratory tests have shown that mixtures of sulfate–nitrate–ammonium particles will undergo efflorescence when the ammonium sulfate fraction is high (Dougle et al., 1998; Martin et al., 2003). This condition is true at most global measurement sites, with the possible exception of Europe, where particles are nitrate rich (Martin et al., 2003).
We therefore define the hygroscopic growth factor for SIA as unity for RH ≤35 %, linearly increasing between 35 % and 40 % RH from unity to GF40 % (calculated by Eq. 5), and following the default (or κ-Kohler) growth curve for RH ≥40 %.
Incorporating an ERH for SIA and consequently inhibiting hygroscopic growth of SIA below 35 % RH significantly reduce the overestimation of mass scattering efficiency in dry conditions. In the case of default hygroscopic growth in GEOS-Chem, the overall dry bias in αsp is reduced from 82 % to 48 %.
3.2.2 Aerosol dry size
To address the remaining overestimation of mass scattering efficiency in dry conditions, we explore different dry sizes of secondary inorganic and organic aerosols. Effective variance may also be important (Chin et al., 2002), but given insufficient information to simultaneously constrain size and variance, we focus on size. Figure 7 shows the slope of the average measured vs. calculated αsp plot for RH <35 % for dry radii ranging from 0.048 to 0.074 µm at intervals of 0.001 µm, assuming SIA and OA have the same dry size. The slope of the best fit line acts as an indicator of the appropriate dry size for each season. Sensitivity tests exploring alternative error metrics (RMSE, MSE) yielded similar results. The slope decreases steadily as dry radius is decreased in all seasons. Using the dry radius which gives a slope of unity, we find that aerosols are largest in summer (r=0.067 µm), smallest in winter (r=0.051 µm), and in between in spring and fall (0.059 and 0.054 µm, respectively). The spring and summer radii are consistent with accumulation-mode size distribution measurements performed by Levin et al. (2009) in the spring and summer of 2006. Averaging the sizes from all four seasons results in an annual representative dry radius of 0.058 µm. This annual radius is smaller than the GEOS-Chem default sizes of SIA and OA that were informed by summertime measurements alone (Drury et al., 2010).

Figure 7Slope of measured vs. calculated αsp plot vs. dry geometric mean aerosol radius, by season. Winter (DJF) is in blue, spring (MAM) in red, summer (JJA) in green, and fall (SON) in orange. The line slope =1 is shown in black. Numbers in the legend represent the dry radius for which the slope =1 for each season.
Figure 6 (red) shows seasonal measured vs. calculated αsp in dry conditions using a new representative annual geometric mean radius of 0.058 µm for SIA and OA. This change in geometric mean radius reduces the overestimation of αsp in all seasons, with the largest improvements in fall (slope decreases from 1.84 to 1.17) and winter (slope decreases from 1.94 to 1.20). Changes in correlation are minor. For the remainder of the analysis, this new dry radius of 0.058 µm is implemented for SIA and OA.
3.2.3 Aerosol hygroscopicity
We now examine the implementation of the widely adopted κ-Kohler hygroscopic growth scheme described in Sect. 2.4. A range of measured κ values for SIA (κs) and OA (κo) exist in the literature. We explore the range of possible κ values, using the slope of the measured vs. calculated αsp plot as an indicator of the appropriate values.
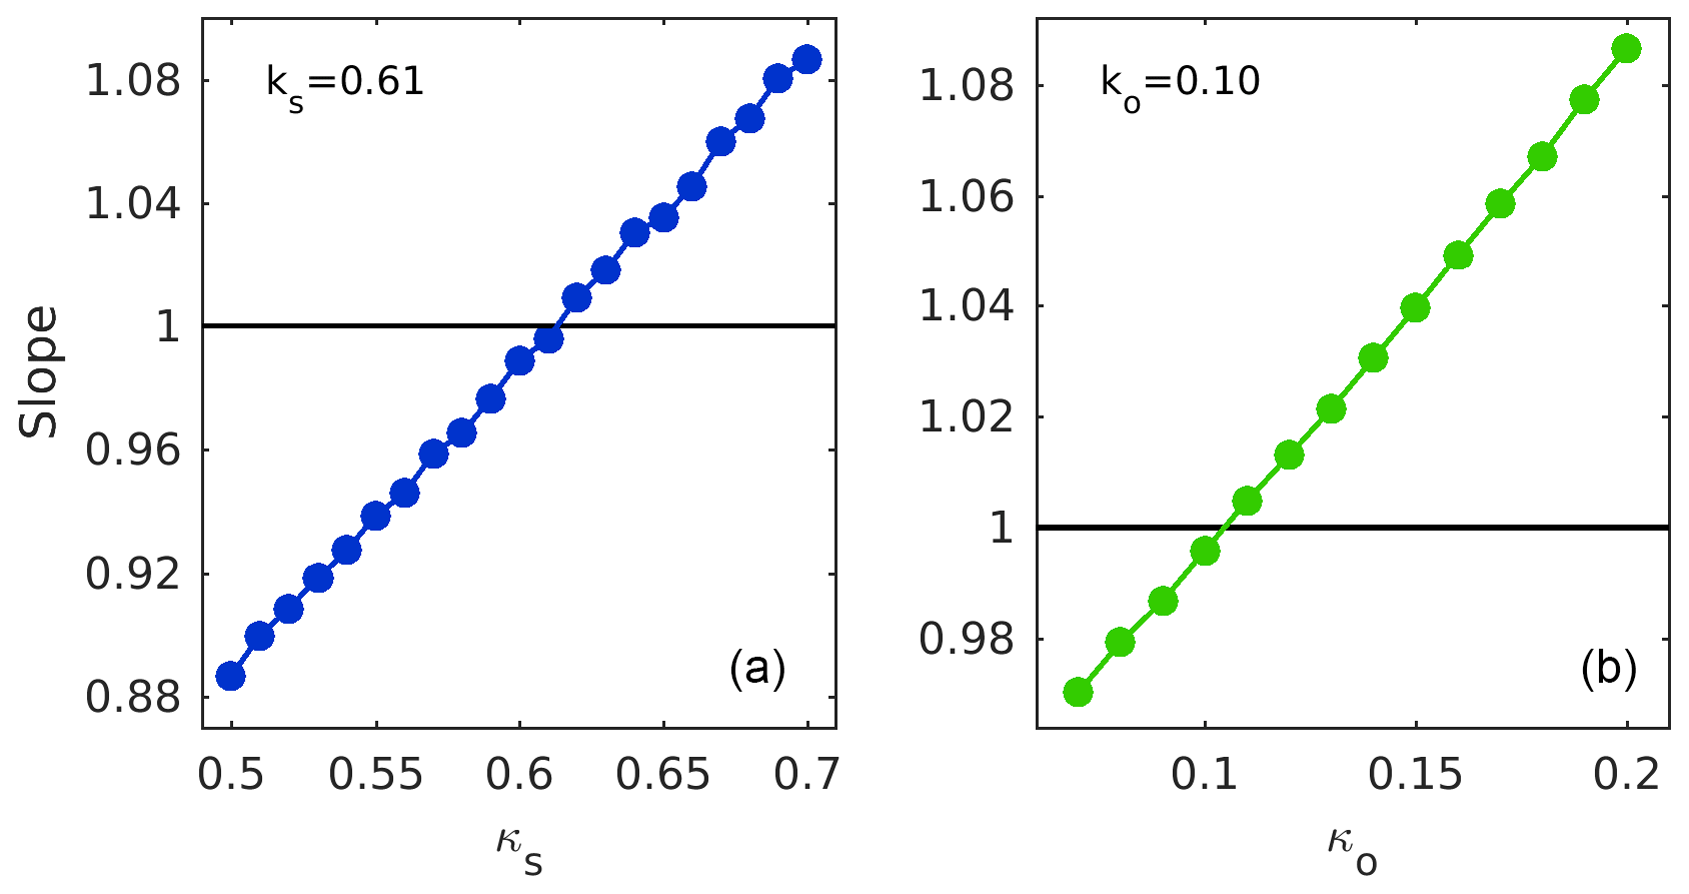
Figure 8Slope of measured vs. calculated αsp plot as a function of the κ of secondary inorganic aerosols (κs, a) and the κ of organic aerosols (κo, b). The line slope =1 is shown in black. κs and κo values for which slope =1 are inset.
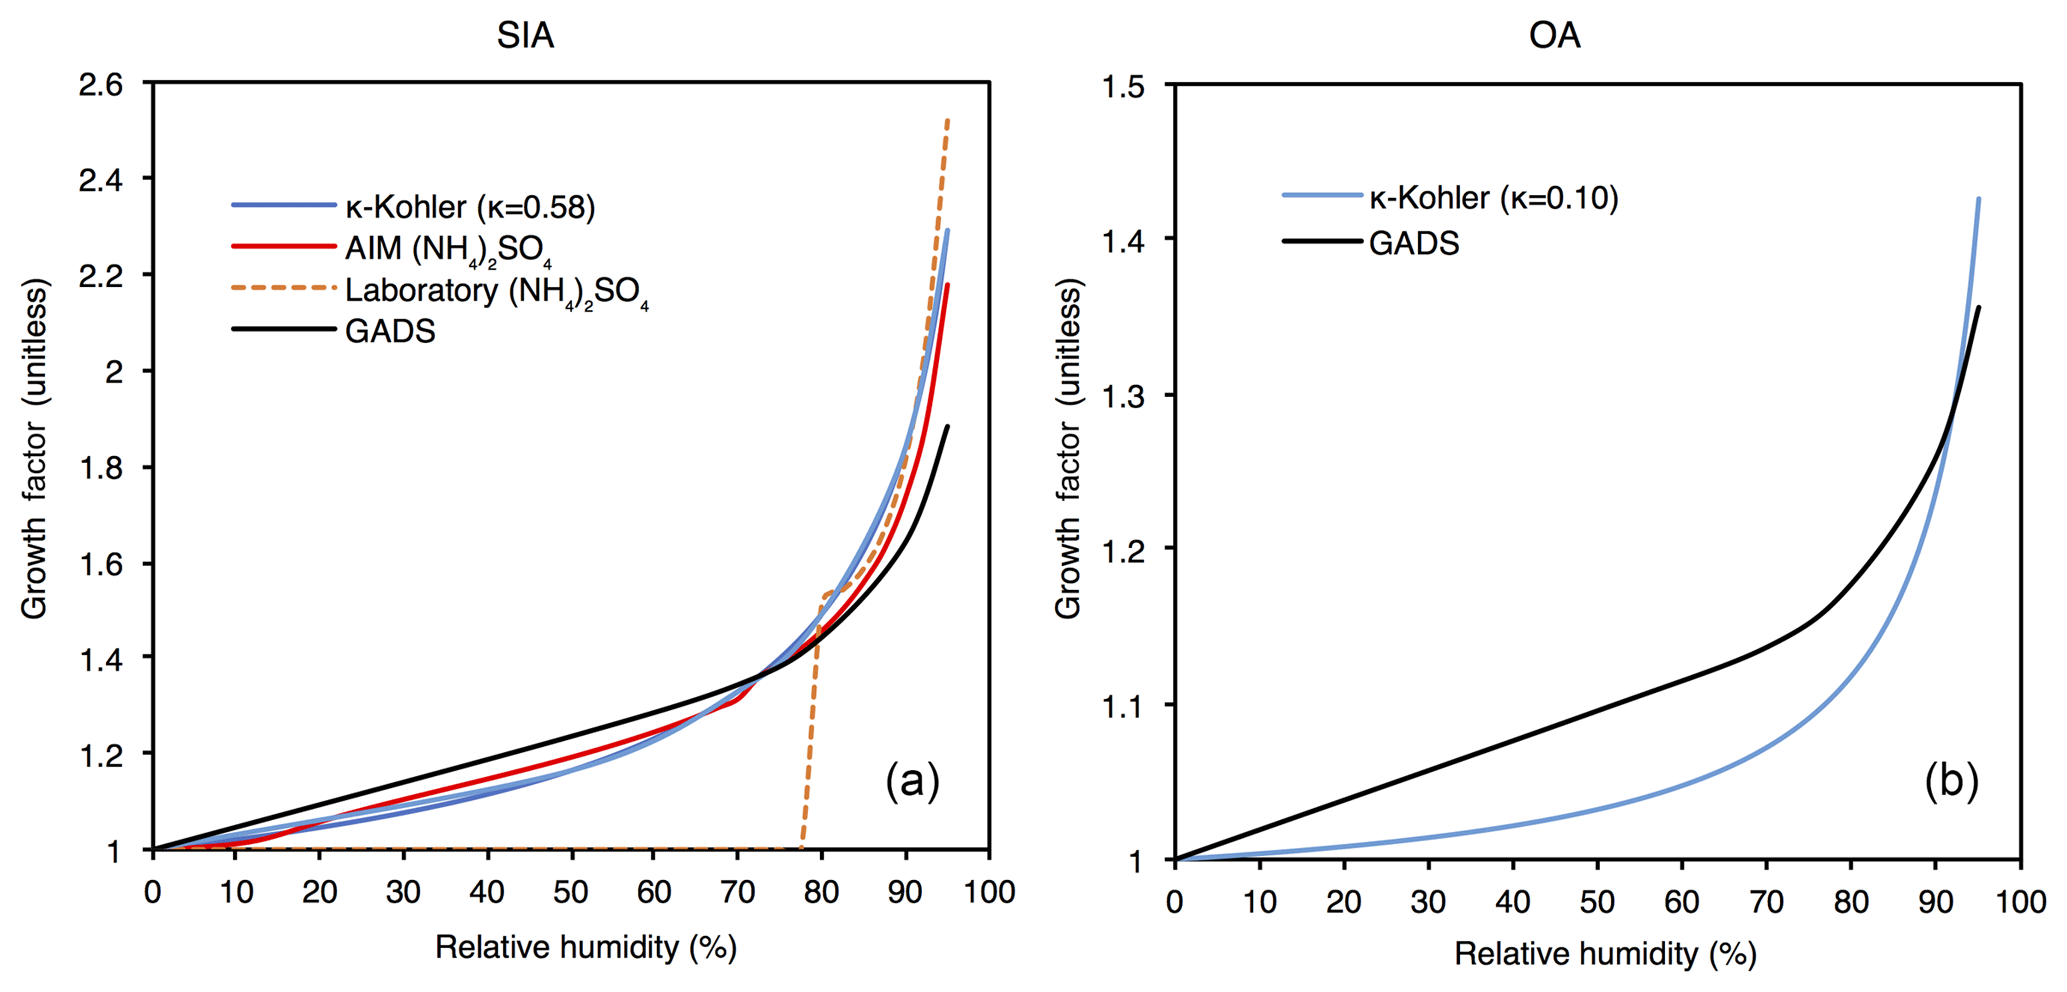
Figure 9Hygroscopic growth factor curves for secondary inorganic aerosols (SIA, a) and organic aerosols (OA, b). GADS (Global Aerosol Data Set) hygroscopic growth from empirical data and κ-Kohler hygroscopic growth are shown for both SIA and OA. For ammonium sulfate, AIM (Aerosol Inorganic Model) hygroscopic growth at T=298 K (Wexler and Clegg, 2002) and laboratory hygroscopic growth with a deliquesence point of RH =80 % (Wise et al., 2003) are also shown.
Figure 8 shows the slope of the measured vs. calculated αsp plot for κ values for SIA (κs) ranging from 0.5 to 0.7 and for OA (κo) ranging from 0.08 to 0.20. Slope increases steadily as κs and κo increase. A slope of unity identifies representative values of κs=0.61 and κo=0.10. These values are in the middle of the range of measured κ values (Duplissy et al., 2011; Hersey et al., 2013; Kreidenweis et al., 2008; Petters and Kreidenweis, 2007; Rickards et al., 2013).
Figure 9 shows the diameter growth factor as a function of relative humidity following κ-Kohler theory, as well as GADS hygroscopic growth for both SIA and OA used in the default GEOS-Chem model. Hygroscopic growth from the Aerosol Inorganic Model (AIM) at T=298 K (Wexler and Clegg, 2002) and laboratory measurements (Wise et al., 2003) are also shown for ammonium sulfate (Snider et al., 2016). The GADS hygroscopic growth schemes used in the default GEOS-Chem simulation are characterized by larger growth at low RH and smaller growth at high RH for both secondary inorganic and organic aerosols. The κ-Kohler scheme exhibits greater consistency with both AIM and laboratory hygroscopic growth for SIA.
Using the revised dry size of 0.058 µm and the κ-Kohler theory of hygroscopic growth, we calculate revised physical and optical properties for SIA and OA over a range of RH values. Table A1 contains geometric mean radius, extinction efficiency, and single scattering albedo for the revised optical tables at eight relative humidity values.
Figure 2 (right) shows the measured vs. calculated mass scattering efficiency using these revised optical tables for SIA and OA. The overestimation of mass scattering efficiency has been eliminated with these revised aerosol properties, with a slope of 1.00 and an offset of 0.09. Correlation remains significant at r=0.96.
Figure 4 (red) shows measured vs. calculated αsp in conditions dominated by different aerosol types using the revised optical tables. The overestimation of αsp in SIA-dominant conditions using the default optical tables has been eliminated, with a slope of 1.03 and a decreased offset (0.70 to 0.1). The large overestimation of αsp that was apparent in OA-dominant conditions has been reduced by a factor of 2. αsp remains accurately estimated at the majority of dust-dominant sites, with the outlier at the Columbia River Gorge site in Washington still skewing the best fit line. The slight overestimation of αsp that was present in the PMcoarse-dominant case using default optical tables has been eliminated using the revised tables (offset 0.33 to 0.03). Slight increases in correlation coefficients are apparent in all cases except for the SIA-dominant case, where it decreased by 0.02.
Figure 3 (red) shows measured vs. calculated αsp using revised optical tables. The overestimation in αsp has been significantly reduced in the low RH case (slope =1.82 to slope =1.09) and in the mid RH case (slope =1.40 to slope =1.01) compared to when default optical tables were used. The slight overestimation in high RH conditions present in the default case has also been reduced, as shown by the decreased offset (0.90 to 0.71).
3.3 Changes in GEOS-Chem-simulated αsp
Here, we examine how these changes to aerosol properties impact both GEOS-Chem simulation of mass scattering efficiency over North America and the fit between modelled and measured αsp at IMPROVE sites. These simulations rely on GEOS-Chem simulations of aerosol composition using GEOS RH fields.
Figure 10 shows the relative and absolute change in mass scattering efficiency when switching from the default to revised optical tables. Continental mean αsp increased by 16 %. Increases in αsp range from 25 % to 45 % in northeastern regions of North America, corresponding to an increase of 1.5–3.5 m2 g−1. These larger changes reflect the higher RH and SIA fractions. Decreases in αsp of up to 15 % or −0.5 m2g −1 are found in the southwest where RH is low and mineral dust dominates.
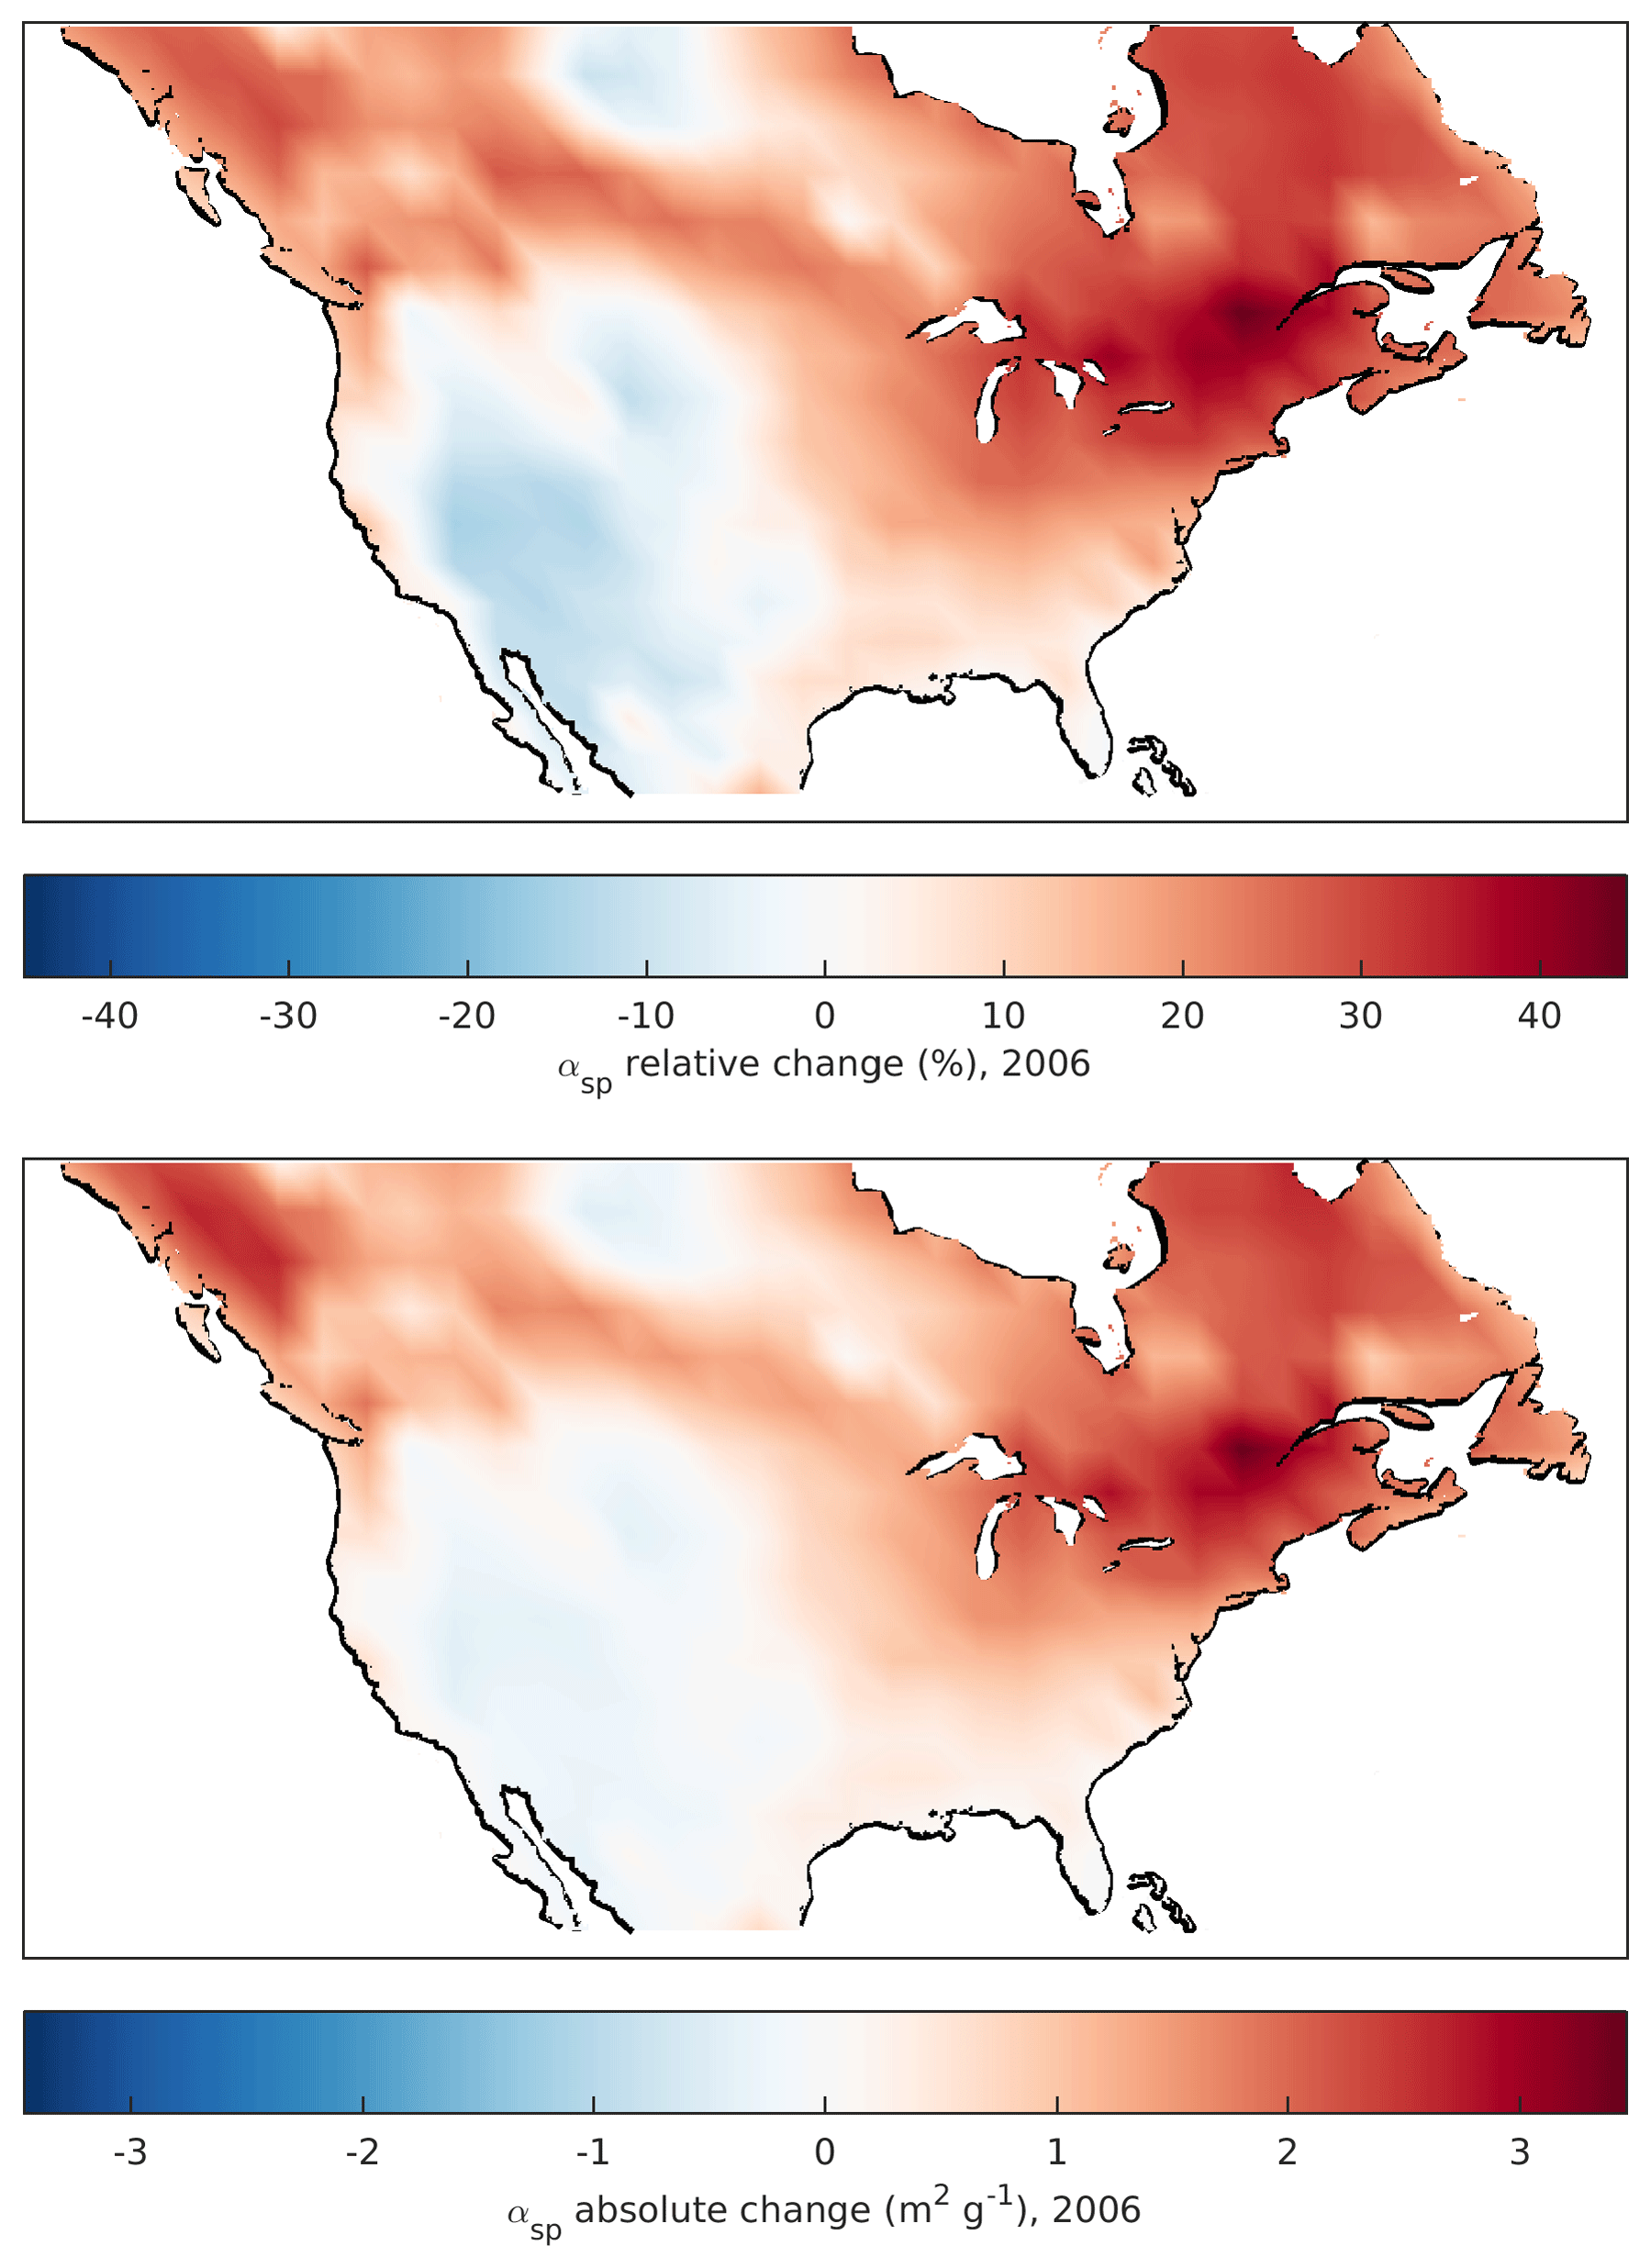
Figure 10Average relative and absolute change in GEOS-Chem mass scattering efficiency over North America for the year 2006 after implementing revised optical tables for secondary inorganic and organic aerosols.
Figure 11 shows GEOS-Chem annual average mass scattering efficiency using default (top) and revised (bottom) optical tables over North America for the year 2006. The overlaying circles represent average measured αsp at IMPROVE network sites for the year 2006, and the outer rings show the coincident simulated αsp for each site. We exclude sites within 1∘ of the coast, where sea salt affects αsp, as well as sites where elevation differs from average gridbox elevation by more than 1500 m. These criteria result in a decrease from 24 to 19 in the number of sites available for the analysis in 2006.
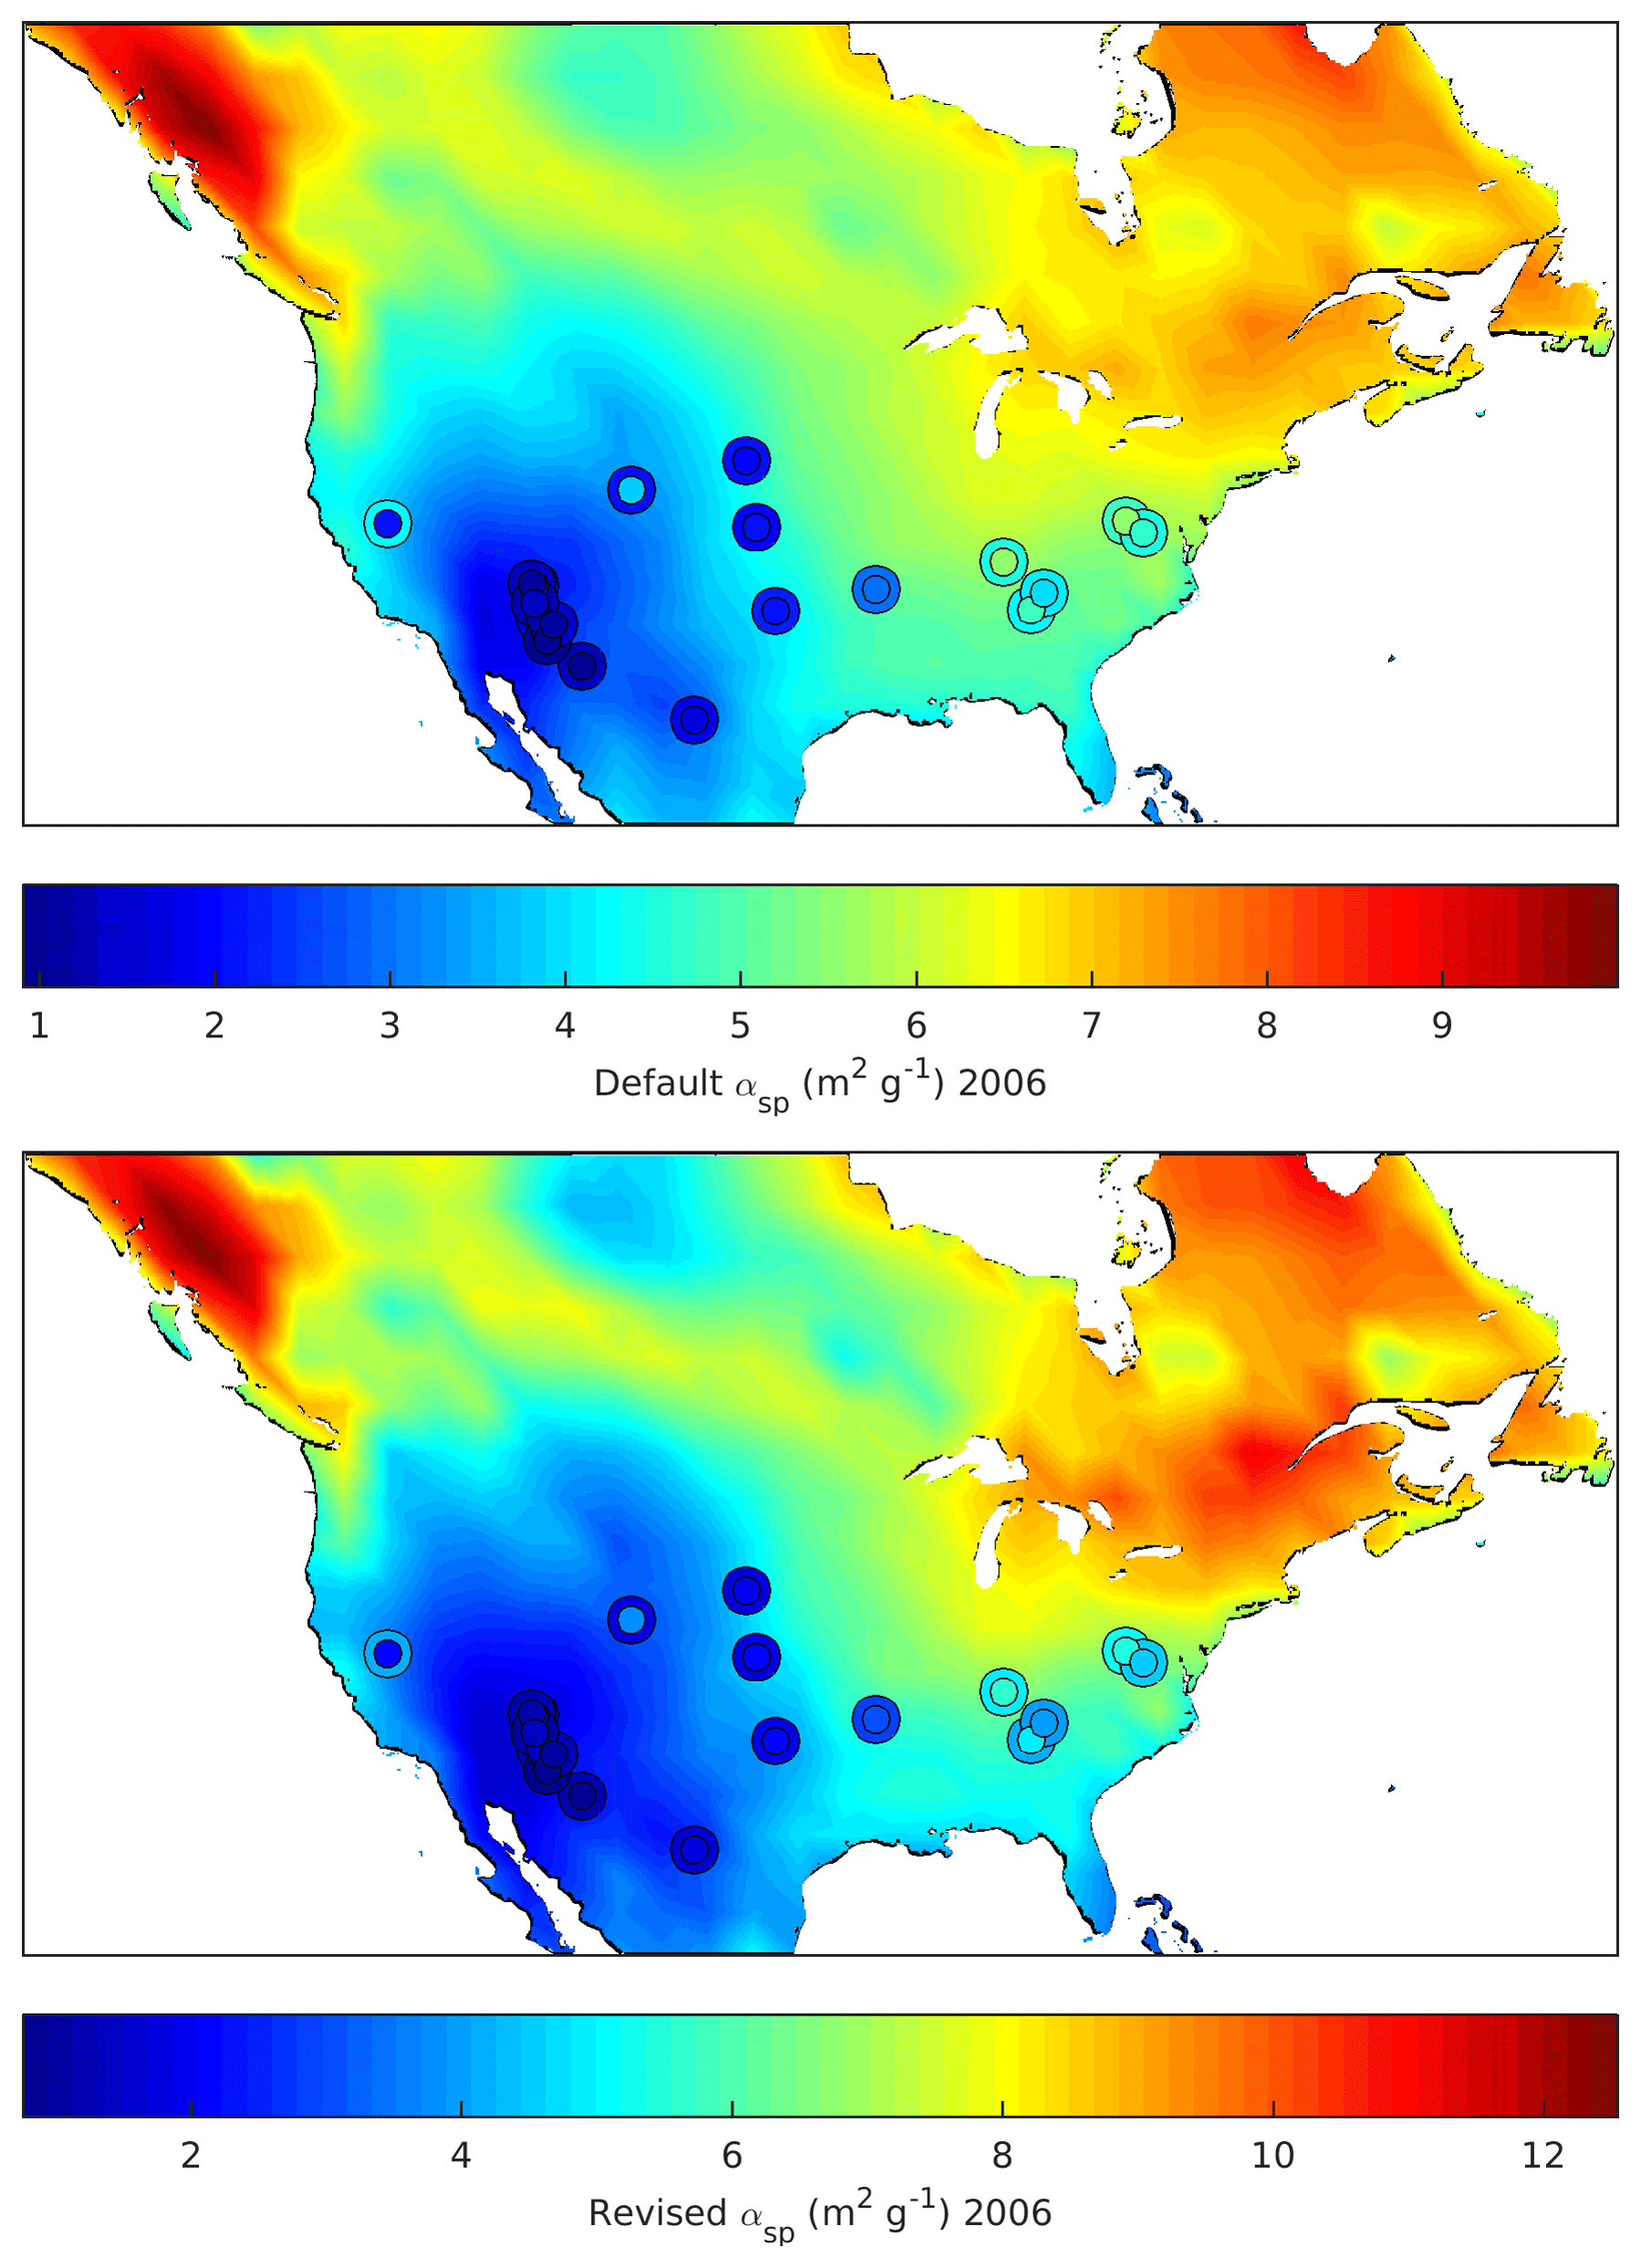
Figure 11GEOS-Chem annual average mass scattering efficiency (at 550 nm) for the year 2006 using default and revised sizes and hygroscopicity for secondary inorganic and organic aerosols. Overlaying inner circles represent annual averages of αsp at IMPROVE network sites for the year 2006. Outer rings represent coincident average simulated αsp.
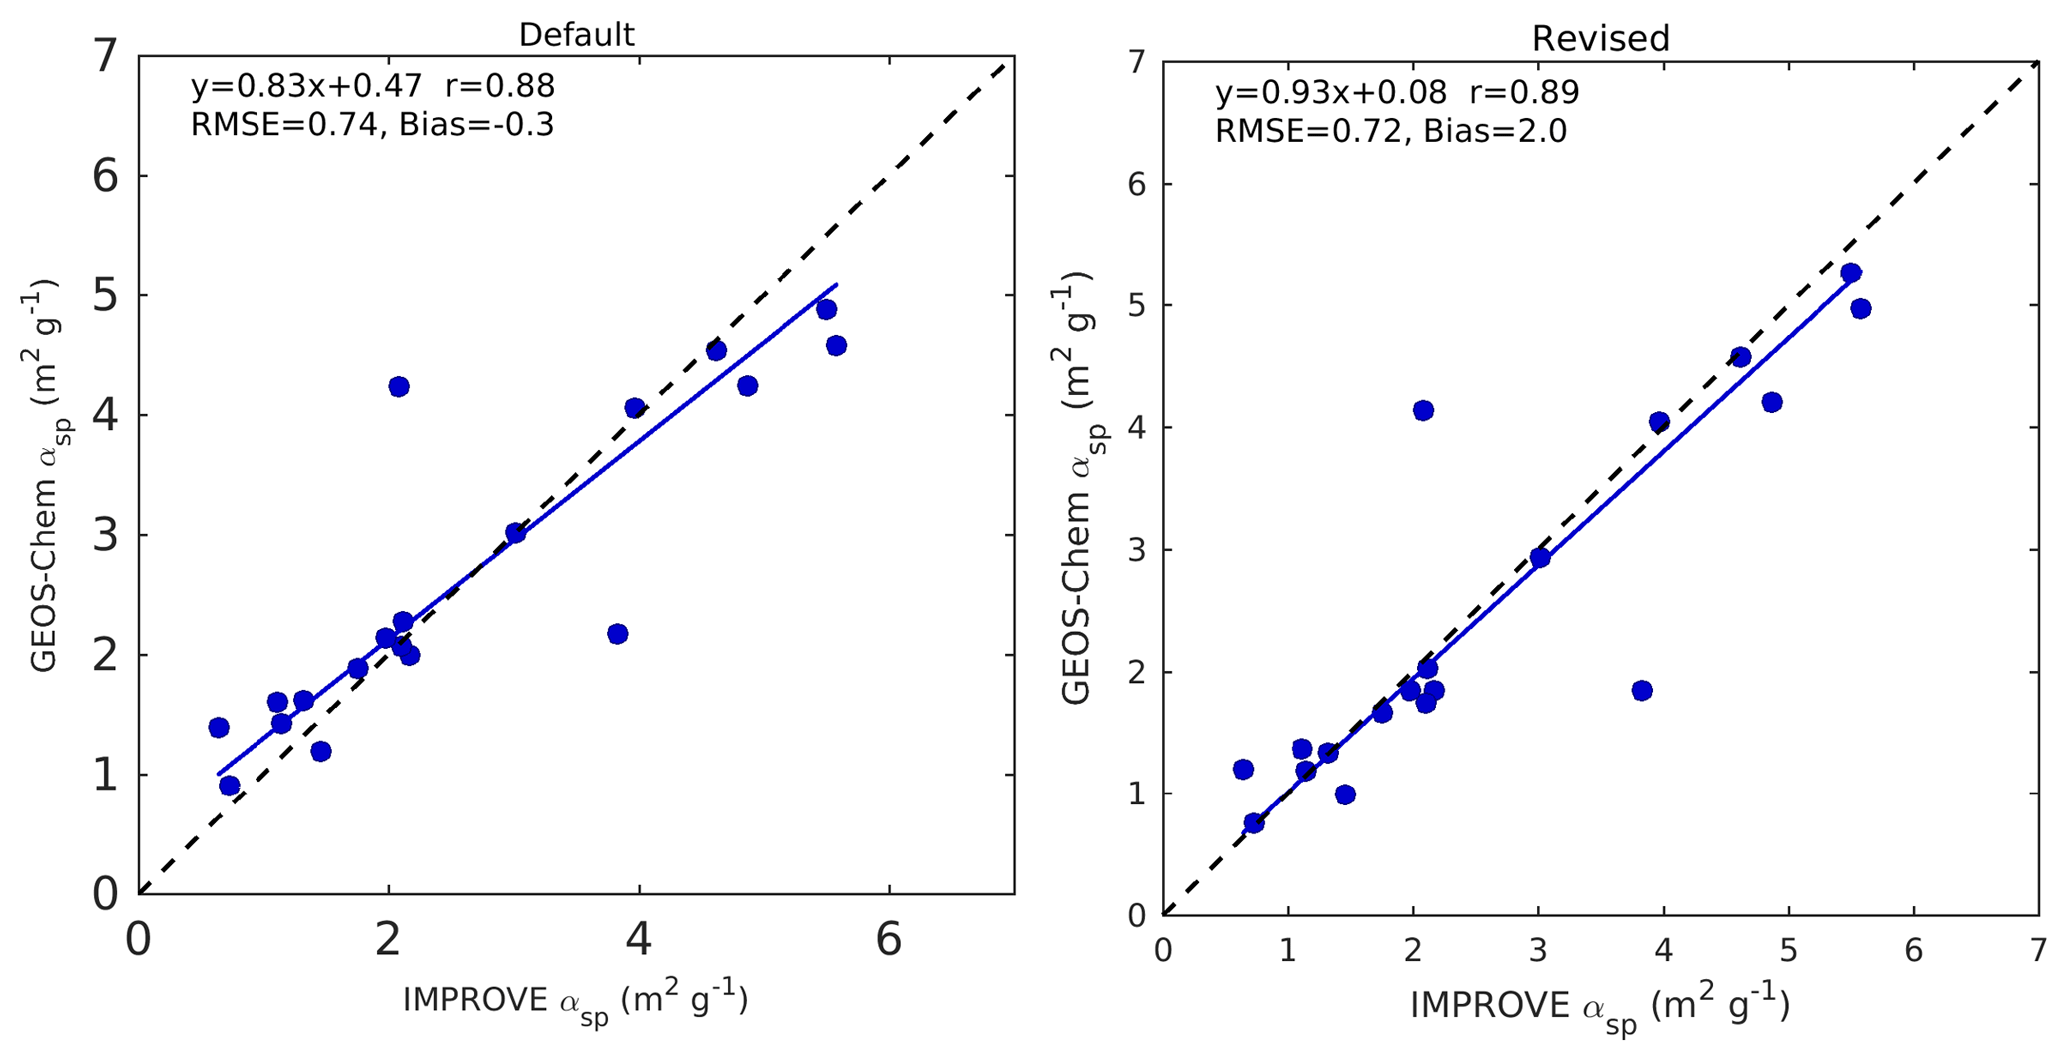
Figure 12Coincident simulated vs. measured average mass scattering efficiency at 550 nm for the year 2006, using default and revised optical tables. Slope, offset, and correlation coefficient are inset.
Using default optical tables, simulated continental mean αsp is 5.4 m2 g−1. A maximum αsp of 10 m2 g −1 occurs in British Columbia, and a minimum αsp of 1.7 m2 g−1 occurs in the southwestern United States. Using revised optical tables, simulated continental mean αsp is 6.3 m2 g−1, with a maximum of 12.5 m2 g−1 in the northwest and a minimum of 1.5 m2 g−1 in the southwest. The elevated mass scattering efficiencies in the northwest can be attributed in part to the high average RH in this region of 83 %.
Figure 12 (left) shows coincident measured vs. simulated mass scattering efficiency at the 19 IMPROVE sites, using default optical tables. Correlation is significant (r=0.88), but a bias in simulated αsp is apparent (slope =0.83). Simulated αsp is notably biased low at sites in the southeastern United States where average αsp is largest, and simulated αsp is notably biased high at sites in the southwestern United States where average mass scattering efficiency is lowest. Sites with the lowest average RH correspond to those with the lowest average mass scattering efficiency and vice versa. The tendency of mass scattering efficiency to be overestimated at low RH reflects the tendency that was originally seen in Fig. 4.
Figure 12 (right) shows coincident measured vs. simulated αsp using revised optical tables. Correlation remains significant (r=0.89), and a decrease in bias is evident from the increase in slope (0.83 to 0.93) and decrease in offset (0.47 to 0.08). Most sites now lie closer to the 1:1 line. The overestimation of simulated αsp in the southwest, where RH is low, has been reduced or eliminated at all sites.
3.4 Comparison with AERONET measurements
Appendix B investigates changes to simulated AOD, and compares measured and simulated AOD at AERONET sites. Although large relative increases upwards of 60 % in average AOD are evident in large parts of northern high latitudes where absolute AOD is small, absolute AOD generally changes by less than 0.1 (Fig. B1). Comparisons with AERONET AOD reveal that the revised optical properties slightly improve the simulation of AOD worldwide (slope decreases from 1.08 to 1.00) despite the large influence of other factors (e.g. ambient aerosol concentrations) upon AOD.
The current representation of mass scattering efficiency in the GEOS-Chem global chemical transport model was evaluated using collocated ground-based measurements of particle mass, speciation, scatter, and relative humidity from the IMPROVE network.
Calculated mass scattering efficiency had a positive bias using default physical and optical properties used in the GEOS-Chem model. This bias was most significant when PM2.5 mass was dominated by secondary inorganic (SIA) or organic aerosols (OA). Mass scattering efficiency in PM2.5 dust and coarse particulate matter dominant conditions was accurately represented at the majority of IMPROVE sites.
Relative humidity played an important role in the severity of the bias in mass scattering efficiency. Mean αsp was overestimated by 82 % in dry conditions (RH <35 %). This bias was largest in the winter (94 %) and smallest in the summer (27 %). Implementing an efflorescence relative humidity for SIA and thus inhibiting hygroscopic growth below 35 % RH decreased the dry bias by 34 %. An annual representative dry geometric mean radius of 0.058 µm for SIA and OA decreased the dry mass scattering efficiency of these aerosols, and subsequently further reduced the bias in dry conditions to 9 %.
κ-Kohler theory was implemented for the hygroscopic growth of SIA and OA, which is characterized by smaller growth factors at low RH and larger growth factors at high RH compared to default growth factors in GEOS-Chem. κ values of 0.61 for SIA and 0.10 for OA eliminated the overall bias in calculated mass scattering efficiency.
These changes to SIA and OA optical tables resulted in a continental mean increase in GEOS-Chem-simulated mass scattering efficiency of 16 %. Northeastern regions of North America exhibited the largest increases (25 %–45 %) due to high RH and SIA fractions, while southwestern regions of the continent exhibited decreases in αsp of up to 15 % due to low RH and high dust fractions. These changes to the GEOS-Chem optical tables improved the fit between measured and simulated mass scattering efficiency at IMPROVE sites, reflected in the changes to the slope (0.83 to 0.93) and the offset (0.47 to 0.08).
Future work should examine the implications of these changes for satellite-derived estimates of fine particulate matter that depend on the relationship of AOD with PM2.5. Future work should also expand analysis of the representation of mass scattering efficiency for other years, and by incorporating measurements from other ground-based measurement networks such as the Surface PARTiculate MAtter network (SPARTAN), which provides measurements of particulate mass, speciation, and scatter in populated regions worldwide (Snider et al., 2015, 2016). Such comparisons may also be useful to evaluate and improve prognostic simulations of aerosol size (Mann et al., 2010; Spracklen et al., 2005; Trivitayanurak et al., 2008; Yu and Luo, 2009). Representation of particle RH history may also be important (Wang et al., 2008).
IMPROVE network data for 2000–2010 can be accessed at http://vista.cira.colostate.edu/Improve/improve-data/ (last access: 3 October 2018). The GEOS-Chem chemical transport model used here is available at http://www.geos-chem.org (last access: 7 September 2017).
bsp and αsp calculations in GEOS-Chem
In GEOS-Chem, surface-level bsp is calculated using model particle mass concentrations and local relative humidity, as well as predefined mass densities and aerosol optical properties for each aerosol component following
where ρd is the dry particle mass density, Rw is the effective radius (defined as the ratio of the third to second moments of an aerosol size distribution), Rd is the dry effective radius, Md is the dry surface-level mass concentration, Qw is the extinction efficiency, and SSAw is the single scattering albedo. Parameters with subscript w indicate values at ambient RH. Species included in this calculation are , , , BC, OM, and fine and coarse dust and sea salt.
Dividing Eq. (A1) by total surface-level PM10 results in the following equation for mass scattering efficiency:
The effective radius, extinction efficiency, and single scattering albedo in Eqs. (A1) and (A2) are obtained from GEOS-Chem optical tables for the ambient RH values measured by IMPROVE. Dry mass density ρd is specified for each aerosol species in GEOS-Chem (Table A2). Md, i and PM10 are obtained from IMPROVE network measurements of aerosol mass and composition. αsp calculated by Eq. (A2) is compared to αsp directly measured by the IMPROVE network.
Mass scattering efficiency is dependent on particle density, refractive index, and particle size. Mass scattering efficiency is typically most dependent on aerosol size, which is dictated by both the dry size distribution chosen to represent a given aerosol species and the hygroscopic growth scheme used to represent aerosol water uptake for hydrophilic species.
A2 Incorporating IMPROVE network measurements
The IMPROVE network measures every 3 days PM2.5 mass and speciation and PM10 mass. The IMPROVE particle sampler consists of four independent modules with separate inlets and pumps. The first three modules (A, B, and C) collect only fine particulate matter (PM2.5), while the fourth module (D) collects both fine and coarse particles (PM10). Module A collects PM2.5 on a Teflon filter, which undergoes gravimetric analysis for total PM2.5 mass and X-ray florescence for elemental concentrations (including Al, Si, Ca, Fe, and Ti). The nylon filter in module B undergoes ion chromatography analysis for , , , and Cl−. Module C contains a quartz filter that is analysed for organic and elemental carbon via thermal optical reflectance. The Teflon filter in module D undergoes gravimetric analysis for PM10 mass (Malm et al., 1994, 2004). Prior to gravimetric analysis, filters A and D undergo equilibration at 30 %–50 % RH and 20–25 ∘C for several minutes (Solomon et al., 2014).
The GEOS-Chem model partitions OM into hydrophilic and hydrophobic fractions, so the same is done for OM measured by IMPROVE to enable isolation of mass scattering efficiency in our comparisons. OM in remote regions tends to be highly oxidized, and oxidation level of organics has been shown to positively correlate with hygroscopicity (Duplissy et al., 2011; Jimenez et al., 2009; Ng et al., 2010). We treat measured OM as 90 % hydrophilic, due to the rural nature of IMPROVE sites. EC is treated as 50 % hydrophilic. As speciation of coarse material is unavailable, we treat all coarse material as crustal in origin, an assumption that may break down at coastal sites. We partition fine and coarse dust measured by the IMPROVE network into the GEOS-Chem size bins using the dust particle size distribution (PSD) described by Zhang et al. (2013).
Table A1Default and revised aerosol size and optical properties for secondary inorganic aerosols (SIA) and organic aerosols (OA) at 550 nm at eight relative humidity values. Columns indicate geometric mean radius (rg), effective radius (reff), extinction efficiency (Q), and single scattering albedo (SSA). κs and κo represent the hygroscopic growth parameters for SIA and OA, respectively.
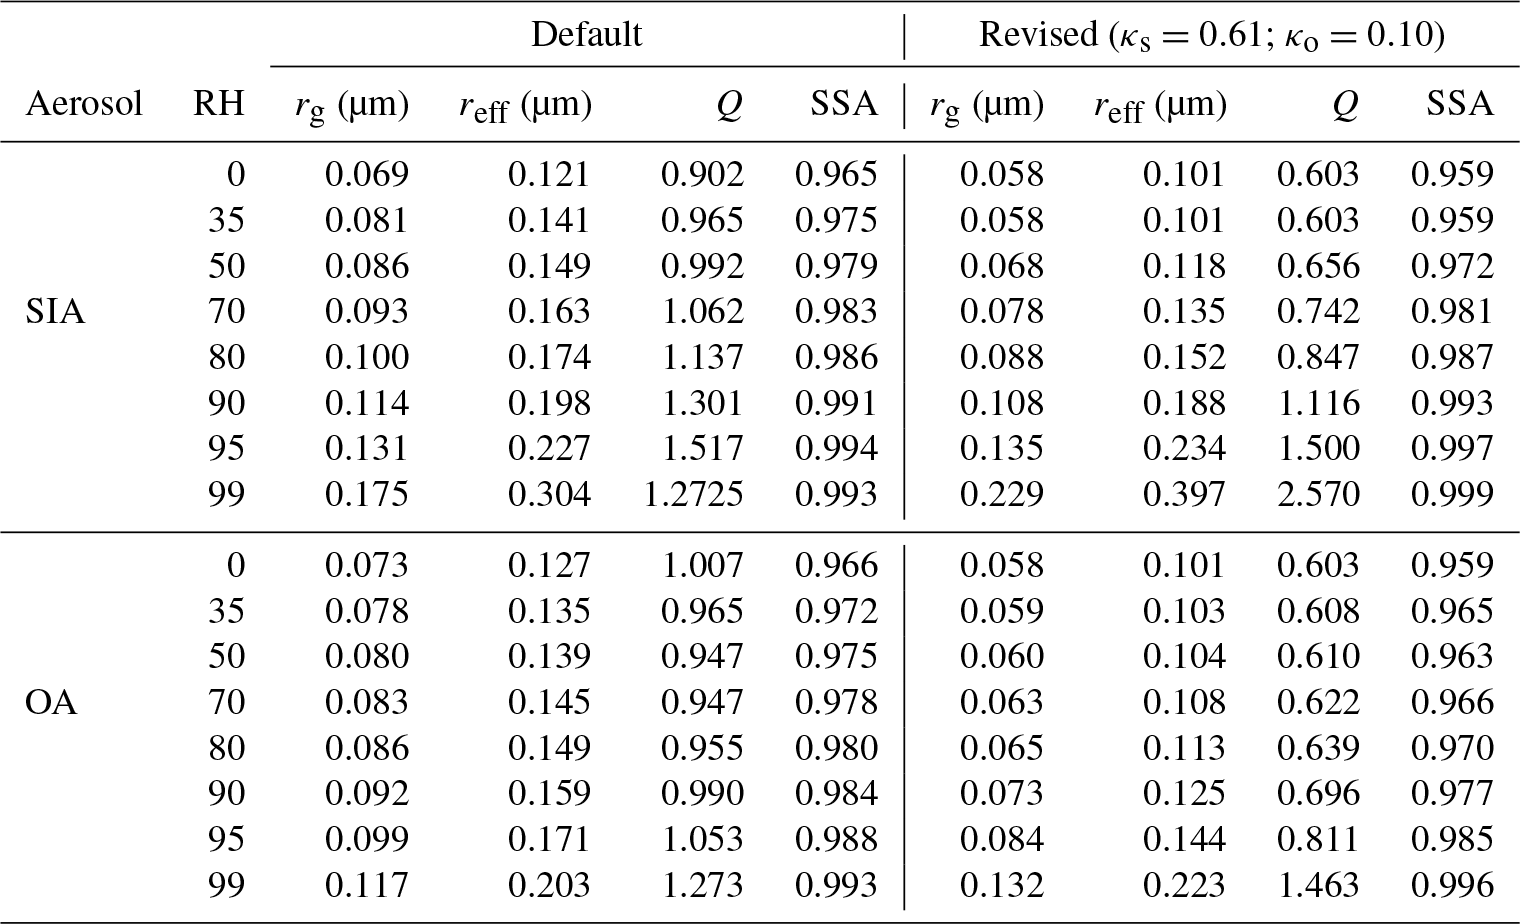
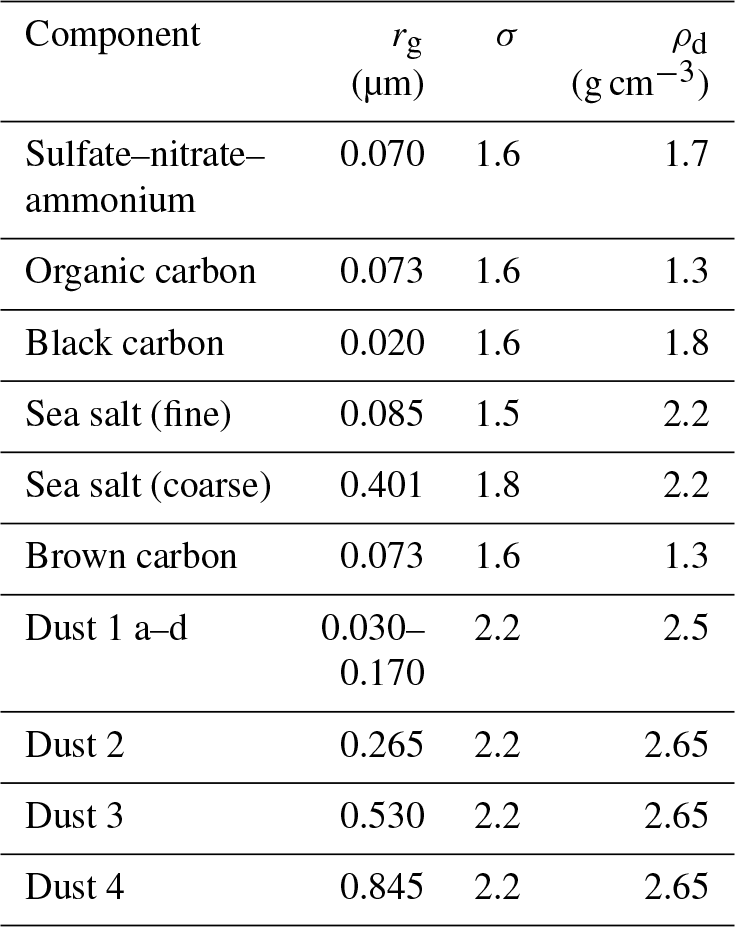
Table A2Current microphysical properties of each aerosol species in GEOS-Chem. rg represents the dry geometric mean radius (µm) and σ the geometric standard deviation of the lognormal size distributions assumed for each species. ρd represents the dry mass densities of each species (g cm−3).
The Aerosol Robotics Network (AERONET) is a long-term network of ground-based sun photometers that provides continuous, cloud-screened measurements of aerosol optical depth (AOD) at several fixed wavelengths in the visible and near infrared (Holben et al., 1998). The calculation of AOD in GEOS-Chem is performed using simulated mass concentrations of aerosol species and mass extinction efficiencies, summed over all vertical layers. Our analysis of mass scattering efficiency can therefore be extended globally by comparing GEOS-Chem-calculated AOD to AOD measured at AERONET sites. During our simulation year of 2006, AERONET consisted of 231 sites across the globe.
Here we examine how the changes to SIA and OA properties impact GEOS-Chem simulated AOD globally. Figure B1 shows the relative (top) and absolute (bottom) changes in AOD. Global mean AOD increases by 19 %. Relative changes in AOD are most pronounced in northern regions where mean relative humidity is high, with increases in simulated AOD ranging from 50 % to 90 %. Decreases in AOD between 0 % and 20 % are present in most of the Southern Hemisphere, in part due to the lower average RH. Absolute changes in AOD show a similar tendency, with slight increases in AOD of up to 0.2 in northern regions, and slight decreases of up of −0.09 in southern regions. An exception to this is seen over parts of China, where AOD increases by 0.5 due to the elevated SIA and OA concentrations.
Figure B2 shows coincident measured (inner circles) and simulated (outer rings) AOD for the year 2006 using default optical tables (top) and revised optical tables (bottom). We exclude sites within 1∘ of the coast, as well as sites where elevation differs from average gridbox elevation by more than 1500 m. We also exclude sites where average PM2.5 is dominated by dust (dust ∕ PM2.5>0.6), to focus on the representation of the optical properties of SIA and OA. Across the globe, we see that AOD is both overestimated and underestimated. AOD is overestimated at most sites in Africa, with the most notable overestimation at the site in Nigeria. AOD is moderately overestimated at sites in Australia. Underestimation of AOD occurs at most sites in South America, as well as at sites in southern North America and southern Asia.
Figure B3 shows coincident measured vs. simulated AOD at AERONET sites for default (left) and revised (right) optical tables. The correlation coefficient (r=0.80 to r=0.78) changes insignificantly, while the slope decreases from 1.08 to 1.00 when switching to the revised optical tables. In summary, the revised optical properties developed for North America slightly improve the representation of AOD at the global scale, despite the large influence of other factors (e.g. ambient aerosol concentrations and composition) upon AOD.
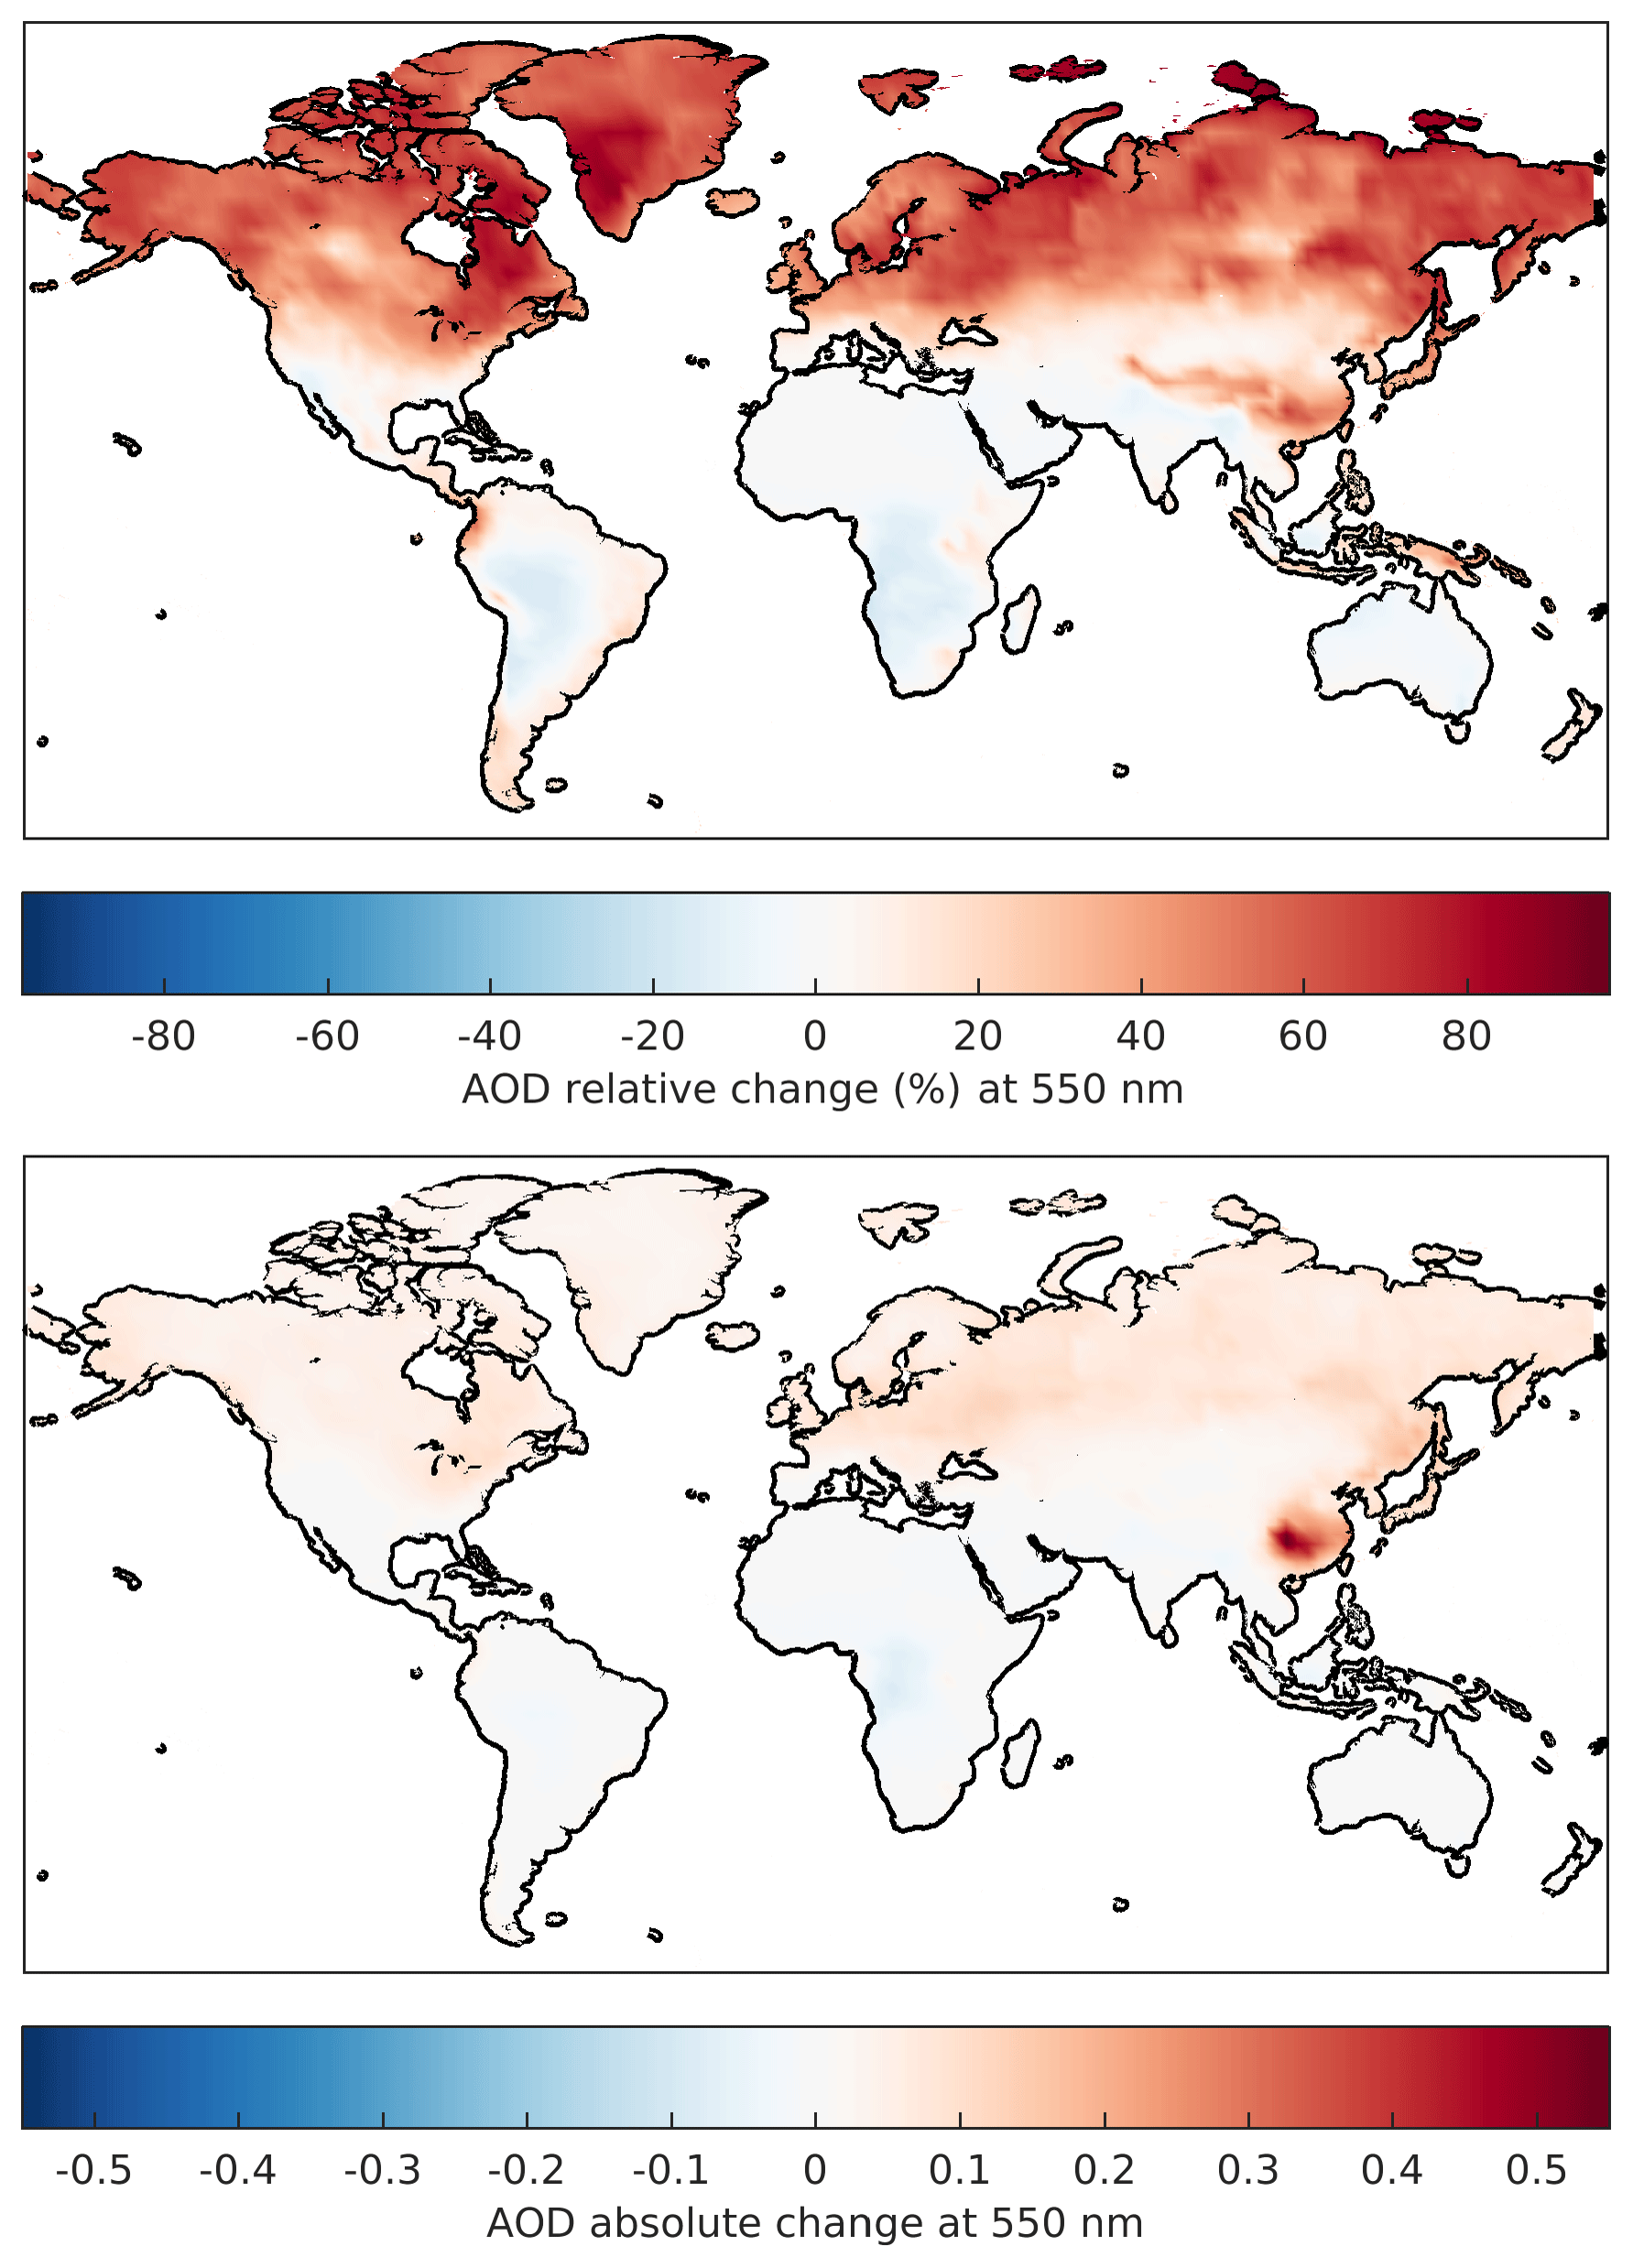
Figure B1Average relative and absolute change in GEOS-Chem aerosol optical depth at 550 nm globally for the year 2006 after implementing revised optical tables for SIA and OA.
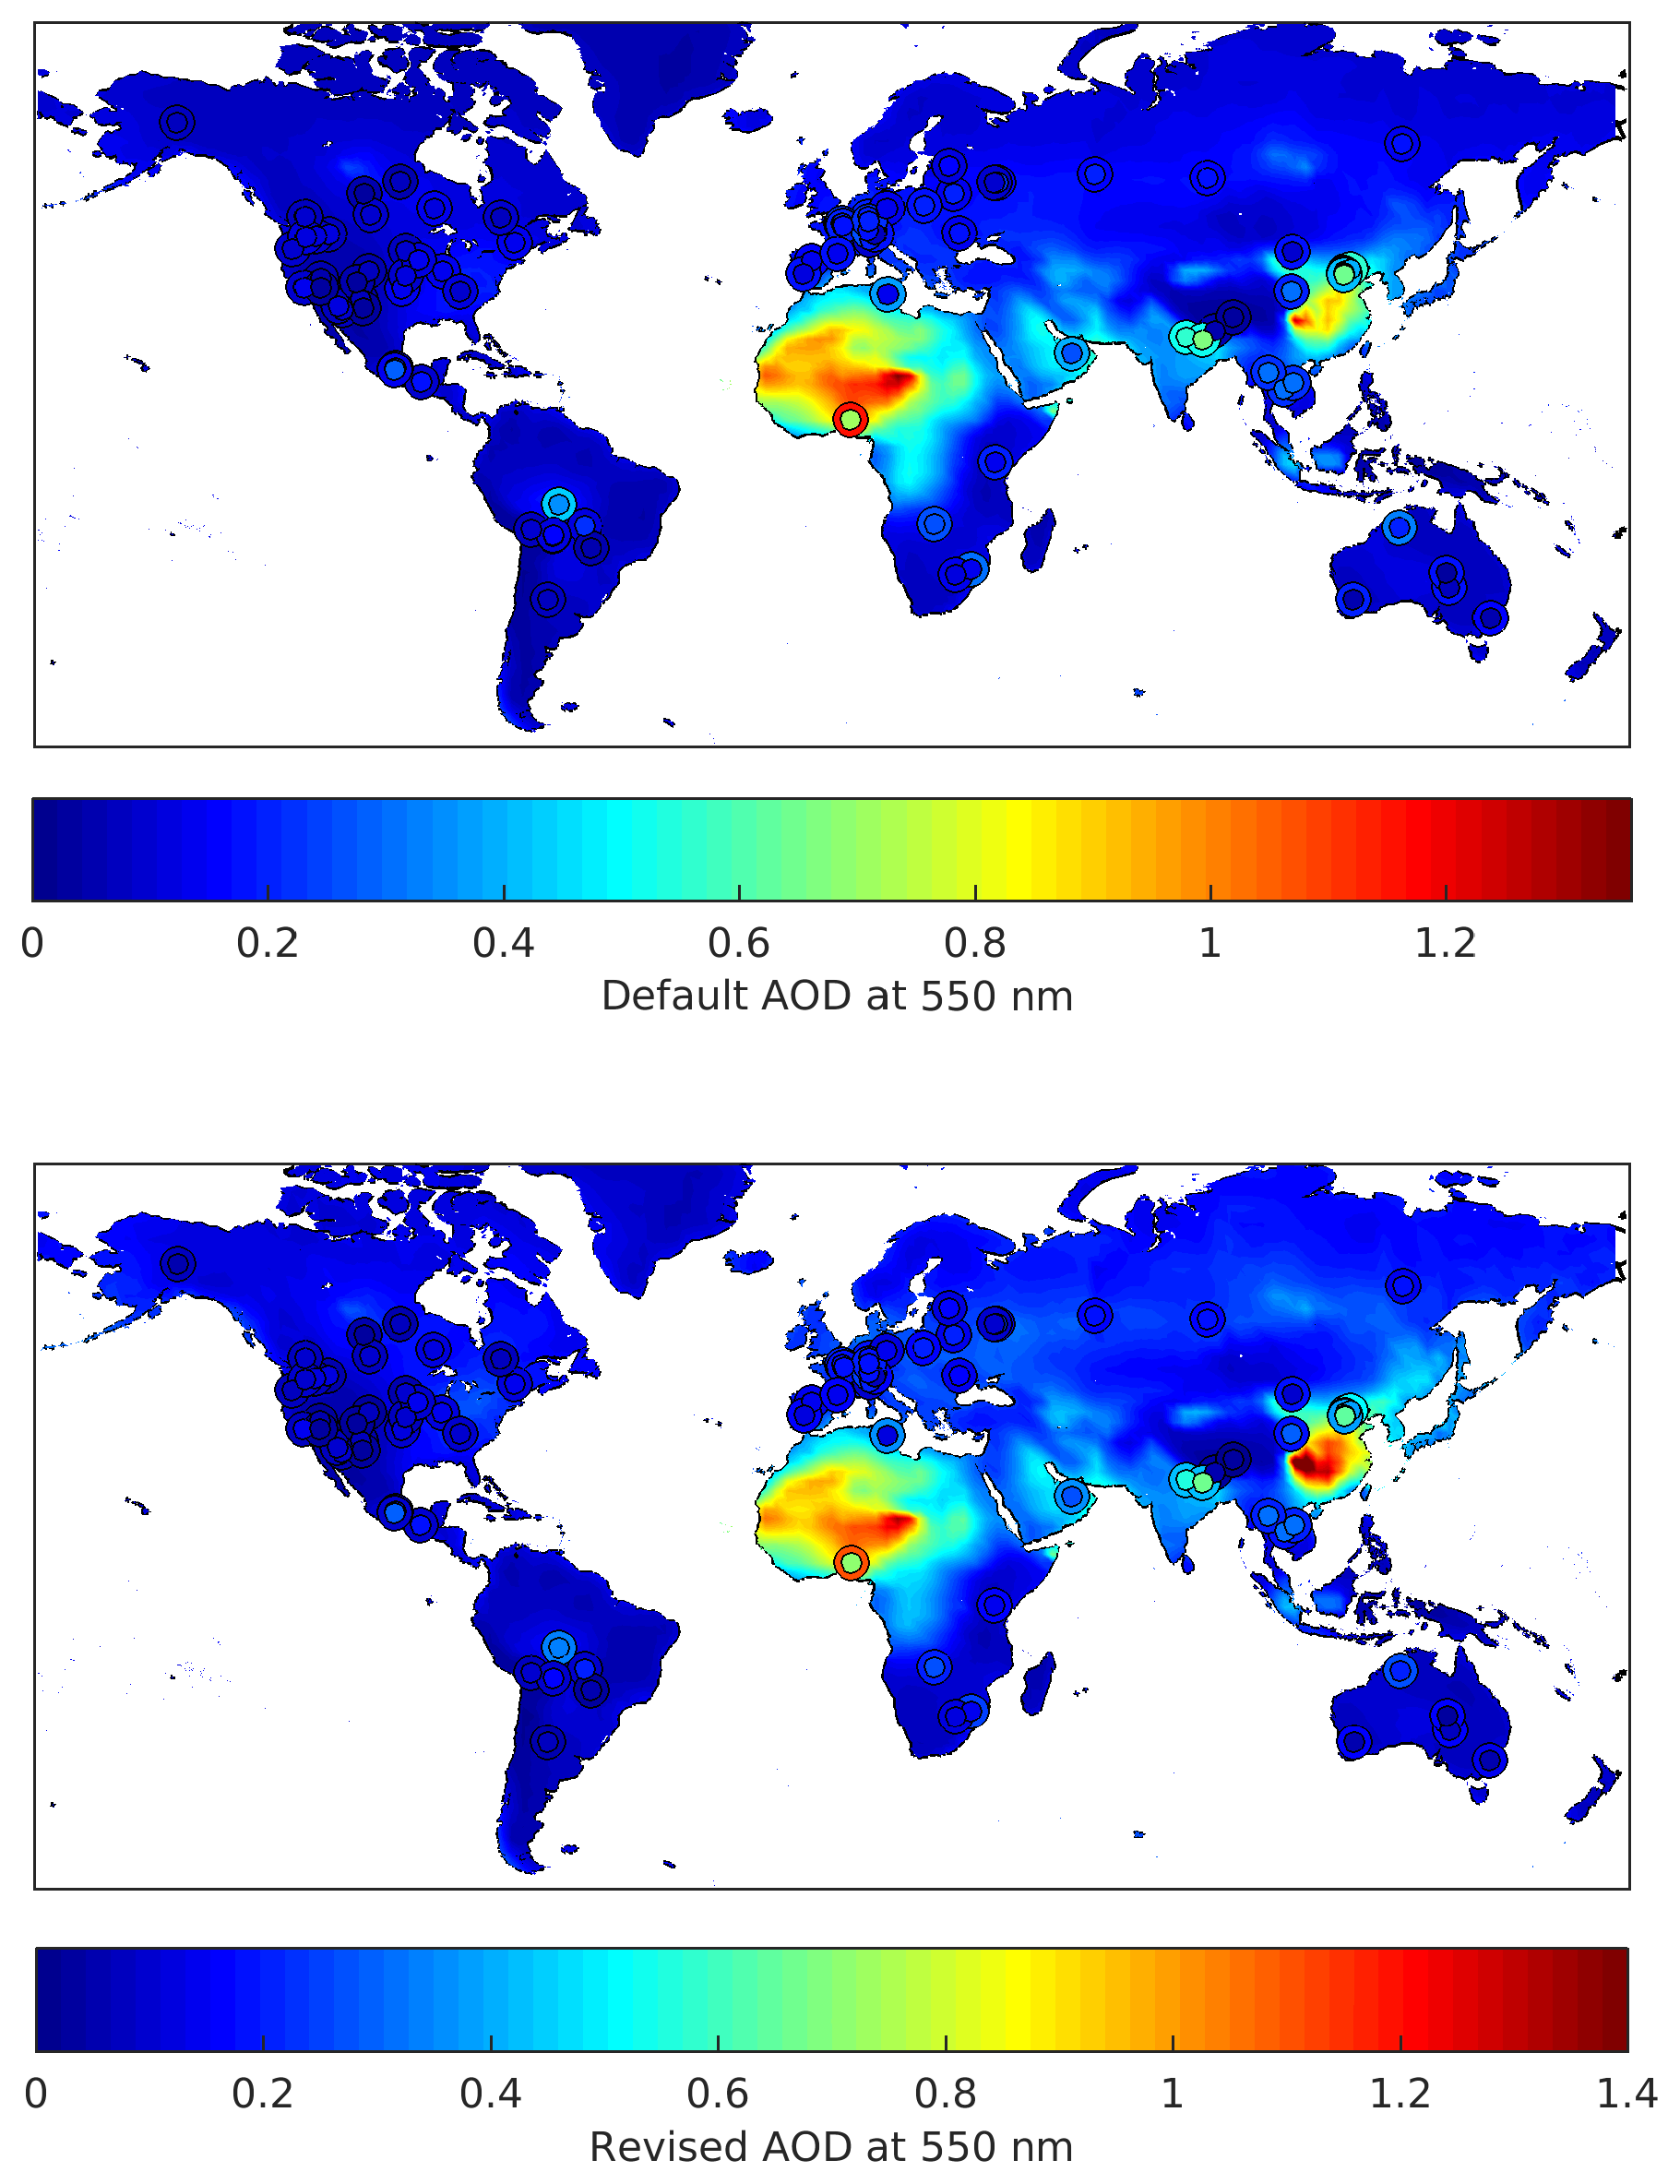
Figure B2Global comparison for the year 2006 of AERONET AOD (inner circles) and GEOS-Chem coincident simulated AOD (outer rings) using default optical tables.

Figure B3Coincident simulated vs. measured AOD at 550 nm at AERONET sites for the year 2006, using default and revised sizes and hygroscopicity. Slope, offset, and correlation coefficient are inset. The 1:1 line is shown in black.
RNCL and RVM conceived the study. RNCL conducted the analysis. RNCL and RVM prepared the paper.
The authors declare that they have no conflict of interest.
Research described in this article was conducted under contract to the Health Effects Institute (HEI), an organization jointly funded by the United States Environmental Protection Agency (EPA) (Assistance Award No. R-82811201) and certain motor vehicle and engine manufacturers. The contents of this article do not necessarily reflect the views of HEI, or its sponsors, nor do they necessarily reflect the views and policies of the EPA or motor vehicle and engine manufacturers.
IMPROVE is a collaborative association of state, tribal, and federal agencies, and international partners. The US Environmental Protection Agency is the primary funding source, with contracting and research support from the National Park Service. The Air Quality Group at the University of California, Davis is the central analytical laboratory, with ion analysis provided by the Research Triangle Institute, and carbon analysis provided by the Desert Research Institute.
We thank Environment and Climate Change Canada for providing nephelometer
data at the site in Egbert, Ontario.
Edited by: Ashu Dastoor
Reviewed by: two anonymous referees
Achakulwisut, P., Shen, L., and Mickley, L. J.: What Controls Springtime Fine Dust Variability in the Western United States? Investigating the 2002–2015 Increase in Fine Dust in the U.S. Southwest, J. Geophys. Res.-Atmos., 122, 12449–12467, https://doi.org/10.1002/2017JD027208, 2017.
Andrews, E., Ogren, J. A., Bonasoni, P., Marinoni, A., Cuevas, E., Rodríguez, S., Sun, J. Y., Jaffe, D. A., Fischer, E. V., Baltensperger, U., Weingartner, E., Coen, M. C., Sharma, S., Macdonald, A. M., Leaitch, W. R., Lin, N. H., Laj, P., Arsov, T., Kalapov, I., Jefferson, A., and Sheridan, P.: Climatology of aerosol radiative properties in the free troposphere, Atmos. Res., 102, 365–393, https://doi.org/10.1016/j.atmosres.2011.08.017, 2011.
Bey, I., Jacob, D. J., Yantosca, R. M., Logan, J. A., Field, B. D., Fiore, A. M., Li, Q.-B., Liu, H.-Y., Mickley, L. J., and Schultz, M. G.: Global Modeling of Tropospheric Chemistry with Assimilated Meteorology: Model Description and Evaluation, J. Geophys. Res., 106, 73–95, https://doi.org/10.1029/2001JD000807, 2001.
Chin, M., Ginoux, P., Kinne, S., Torres, O., Holben, B. N., Duncan, B. N., Martin, R. V., Logan, J. A., Higurashi, A., and Nakajima, T.: Tropospheric Aerosol Optical Thickness from the GOCART Model and Comparisons with Satellite and Sun Photometer Measurements, J. Atmos. Sci., 59, 461–483, https://doi.org/10.1175/1520-0469(2002)059<0461:TAOTFT>2.0.CO;2, 2002.
Ciobanu, V. G., Marcolli, C., Krieger, U. K., Zuend, A., and Peter, T.: Efflorescence of ammonium sulfate and coated ammonium sulfate particles: Evidence for surface nucleation, J. Phys. Chem. A, 114, 9486–9495, https://doi.org/10.1021/jp103541w, 2010.
Collaud Coen, M., Andrews, E., Asmi, A., Baltensperger, U., Bukowiecki, N., Day, D., Fiebig, M., Fjaeraa, A. M., Flentje, H., Hyvärinen, A., Jefferson, A., Jennings, S. G., Kouvarakis, G., Lihavainen, H., Lund Myhre, C., Malm, W. C., Mihapopoulos, N., Molenar, J. V., O'Dowd, C., Ogren, J. A., Schichtel, B. A., Sheridan, P., Virkkula, A., Weingartner, E., Weller, R., and Laj, P.: Aerosol decadal trends – Part 1: In-situ optical measurements at GAW and IMPROVE stations, Atmos. Chem. Phys., 13, 869–894, https://doi.org/10.5194/acp-13-869-2013, 2013.
Dougle, P. G., Veefkind, J. P., and ten Brink, H. M. : Crystallisation of mixtures of ammonium nitrate, ammonium sulphate and soot, J. Aerosol. Sci., 29, 375–386, https://doi.org/10.1016/S0021-8502(97)10003-9, 1998.
Drury, E., Jacob, D. J., Spurr, R. J. D., Wang, J., Shinozuka, Y., Anderson, B. E., Clarke, A. D., Dibb, J., McNaughton, C., and Weber, R.: Synthesis of satellite (MODIS), aircraft (ICARTT), and surface (IMPROVE, EPA-AQS, AERONET) aerosol observations over eastern North America to improve MODIS aerosol retrievals and constrain surface aerosol concentrations and sources, J. Geophys. Res.-Atmos., 115, 1–17, https://doi.org/10.1029/2009JD012629, 2010.
Duplissy, J., DeCarlo, P. F., Dommen, J., Alfarra, M. R., Metzger, A., Barmpadimos, I., Prevot, A. S. H., Weingartner, E., Tritscher, T., Gysel, M., Aiken, A. C., Jimenez, J. L., Canagaratna, M. R., Worsnop, D. R., Collins, D. R., Tomlinson, J., and Baltensperger, U.: Relating hygroscopicity and composition of organic aerosol particulate matter, Atmos. Chem. Phys., 11, 1155–1165, https://doi.org/10.5194/acp-11-1155-2011, 2011.
Dusek, U., Frank, G. P., Massling, A., Zeromskiene, K., Iinuma, Y., Schmid, O., Helas, G., Hennig, T., Wiedensohler, A., and Andreae, M. O.: Water uptake by biomass burning aerosol at sub- and supersaturated conditions: closure studies and implications for the role of organics, Atmos. Chem. Phys., 11, 9519–9532, https://doi.org/10.5194/acp-11-9519-2011, 2011.
Fairlie, D. T., Jacob, D. J., and Park, R. J.: The impact of transpacific transport of mineral dust in the United States, Atmos. Environ., 41, 1251–1266, https://doi.org/10.1016/j.atmosenv.2006.09.048, 2007.
Fairlie, T. D., Jacob, D. J., Dibb, J. E., Alexander, B., Avery, M. A., van Donkelaar, A., and Zhang, L.: Impact of mineral dust on nitrate, sulfate, and ozone in transpacific Asian pollution plumes, Atmos. Chem. Phys., 10, 3999–4012, https://doi.org/10.5194/acp-10-3999-2010, 2010.
Fehsenfeld, F. C., Ancellet, G., Bates, T. S., Goldstein, A. H., Hardesty, R. M., Honrath, R., Law, K. S., Lewis, A. C., Leaitch, R., McKeen, S., Meagher, J., Parrish, D. D., Pszenny, A. A. P., Russell, P. B., Schlager, H., Seinfeld, J., Talbot, R., and Zbinden, R.: International Consortium for Atmospheric Research on Transport and Transformation (ICARTT): North America to Europe – Overview of the 2004 summer field study, J. Geophys. Res.-Atmos., 111, D23S01, https://doi.org/10.1029/2006JD007829, 2006.
Fountoukis, C. and Nenes, A.: ISORROPIA II: a computationally efficient thermodynamic equilibrium model for K+-Ca2+-Mg2+--Na+---Cl−-H2O aerosols, Atmos. Chem. Phys., 7, 4639–4659, https://doi.org/10.5194/acp-7-4639-2007, 2007.
Gebhart, K. A., Copeland, S., and Malm, W. C.: Diurnal and seasonal patterns in light scattering, extinction, and relative humidity, Atmos. Environ., 35, 5177–5191, https://doi.org/10.1016/S1352-2310(01)00319-3, 2001.
Gelaro, R., McCarty, W., Suárez, M. J., Todling, R., Molod, A., Takacs, L., Randles, C. A., Darmenov, A., Bosilovich, M. G., Reichle, R., Wargan, K., Coy, L., Cullather, R., Draper, C., Akella, S., Buchard, V., Conaty, A., da Silva, A. M., Gu, W., Kim, G. K., Koster, R., Lucchesi, R., Merkova, D., Nielsen, J. E., Partyka, G., Pawson, S., Putman, W., Rienecker, M., Schubert, S. D., Sienkiewicz, M., and Zhao, B.: The modern-era retrospective analysis for research and applications, version 2 (MERRA-2), J. Climate, 30, 5419–5454, https://doi.org/10.1175/JCLI-D-16-0758.1, 2017.
Hand, J. L. and Malm, W. C.: Review of aerosol mass scattering efficiencies from ground-based measurements since 1990, J. Geophys. Res.-Atmos., 112, D16203, https://doi.org/10.1029/2007JD008484, 2007.
Hersey, S. P., Craven, J. S., Metcalf, A. R., Lin, J., Lathem, T., Suski, K. J., Cahill, J. F., Duong, H. T., Sorooshian, A., Jonsson, H. H., Shiraiwa, M., Zuend, A., Nenes, A., Prather, K. A., Flagan, R. C., and Seinfeld, J. H.: Composition and hygroscopicity of the Los Angeles Aerosol: CalNex, J. Geophys. Res.-Atmos., 118, 3016–3036, https://doi.org/10.1002/jgrd.50307, 2013.
Holben, B. N., Eck, T. F., Slutsker, I., Tanré, D., Buis, J. P., Setzer, A., Vermote, E., Reagan, J. A., Kaufman, Y. J., Nakajima, T., Lavenu, F., Jankowiak, I., and Smirnov, A.: AERONET – A Federated Instrument Network and Data Archive for Aerosol Characterization, Remote Sens. Environ., 66, 1–16, https://doi.org/10.1016/S0034-4257(98)00031-5, 1998.
Hyslop, N. P. and White, W. H.: An evaluation of interagency monitoring of protected visual environments (IMPROVE) collocated precision and uncertainty estimates, Atmos. Environ., 42, 2691–2705, https://doi.org/10.1016/j.atmosenv.2007.06.053, 2008.
Jaeglé, L., Quinn, P. K., Bates, T. S., Alexander, B., and Lin, J.-T.: Global distribution of sea salt aerosols: new constraints from in situ and remote sensing observations, Atmos. Chem. Phys., 11, 3137–3157, https://doi.org/10.5194/acp-11-3137-2011, 2011.
Jimenez, J. L., Canagaratna, M. R., Donahue, N. M., Prevot, A. S. H., Zhang, Q., Kroll, J. H., Decarlo, P. F., Allan, J. D., Coe, H., Ng, N. L., Aiken, A. C., Docherty, K. S., Ulbrich, I. M., Grieshop, A. P., Robinson, A. L., Duplissy, J., Smith, J. D., Wilson, K. R., Lanz, V. A., Hueglin, C., Sun, Y. L., Tian, J., Laaksonen, A., Raatikainen, T., Rautiainen, J., Vaattovaara, P., Ehn, M., Kulmala, M., Tomlinson, J. M., Collins, D. R., Cubison, M. J., Dunlea, J., Huffman, J. A., Onasch, T. B., Alfarra, M. R., Williams, P. I., Bower, K., Kondo, Y., Schneider, J., Drewnick, F., Borrmann, S., Weimer, S., Demerjian, K., Salcedo, D., Cottrell, L., Griffin, R., Takami, A., Miyoshi, T., Hatakeyama, S., Shimono, A., Sun, J. Y, Zhang, Y. M., Dzepina, K., Kimmel, J. R., Sueper, D., Jayne, J. T., Herndon, S. C., Trimborn, A. M., Williams, L. R., Wood, E. C., Middlebrook, A. M., Kolb, C. E., Baltensperger, U., and Worsnop, D. R.: Evolution of Organic Aerosols in the Atmosphere, Science, 326, 1525–1529, https://doi.org/10.1126/science.1180353, 2009.
Kahn, R. A., Gaitley, B. J., Martonchik, J. V., Diner, D. J., Crean, K. A., and Holben, B.: Multiangle Imaging Spectroradiometer (MISR) global aerosol optical depth validation based on 2 years of coincident Aerosol Robotic Network (AERONET) observations, J. Geophys. Res., 110, D10S04, https://doi.org/10.1029/2004JD004706, 2005.
Kim, P. S., Jacob, D. J., Fisher, J. A., Travis, K., Yu, K., Zhu, L., Yantosca, R. M., Sulprizio, M. P., Jimenez, J. L., Campuzano-Jost, P., Froyd, K. D., Liao, J., Hair, J. W., Fenn, M. A., Butler, C. F., Wagner, N. L., Gordon, T. D., Welti, A., Wennberg, P. O., Crounse, J. D., St. Clair, J. M., Teng, A. P., Millet, D. B., Schwarz, J. P., Markovic, M. Z., and Perring, A. E.: Sources, seasonality, and trends of southeast US aerosol: an integrated analysis of surface, aircraft, and satellite observations with the GEOS-Chem chemical transport model, Atmos. Chem. Phys., 15, 10411–10433, https://doi.org/10.5194/acp-15-10411-2015, 2015.
Koepke, P., Hess M., Schult I., and Shettle E.P.: Global Aerosol Data Set, Report No. 243, Max-Planck-Institut für Meteorologie, Hamburg, ISSN 0937-1060, 1997.
Kreidenweis, S. M., Petters, M. D., and DeMott, P. J.: Single-parameter estimates of aerosol water content, Environ. Res. Lett., 3, 035002, https://doi.org/10.1088/1748-9326/3/3/035002, 2008.
Levin, E. J. T., Kreidenweis, S. M., McMeeking, G. R., Carrico, C. M., Collett, J. L., and Malm, W. C.: Aerosol physical, chemical and optical properties during the Rocky Mountain Airborne Nitrogen and Sulfur study, Atmos. Environ., 43, 1932–1939, https://doi.org/10.1016/j.atmosenv.2008.12.042, 2009.
Li, Y., Henze, D. K., Jack, D., and Kinney, P. L.: The influence of air quality model resolution on health impact assessment for fine particulate matter and its components, Air Qual. Atmos. Hlth., 9, 51–68, https://doi.org/10.1007/s11869-015-0321-z, 2016.
Lowenthal, D. and Kumar, N.: Light scattering from sea-salt aerosols at interagency monitoring of protected visual environments (IMPROVE) sites, J. Air Waste Manage., 56, 636–642, https://doi.org/10.1080/10473289.2006.10464478, 2006.
Malm, C., Sisler, J. F., and Cahill, A.: Spatial and seasonal trends in particle concentration and optical extinction in the United States, J. Geophys. Res., 99, 1347–1370, 1994.
Malm, W. C.: Spatial and monthly trends in speciated fine particle concentration in the United States, J. Geophys. Res., 109, D03306, https://doi.org/10.1029/2003JD003739, 2004.
Malm, W. C. and Kreidenweis, S. M.: The effects of models of aerosol hygroscopicity on the apportionment of extinction, Atmos. Environ., 31, 1965–1976, https://doi.org/10.1016/S1352-2310(96)00355-X, 1997.
Malm, W. C. and Hand, J. L.: An examination of the physical and optical properties of aerosols collected in the IMPROVE program, Atmos. Environ., 41, 3407–3427, https://doi.org/10.1016/j.atmosenv.2006.12.012, 2007.
Mann, G. W., Carslaw, K. S., Spracklen, D. V., Ridley, D. A., Manktelow, P. T., Chipperfield, M. P., Pickering, S. J., and Johnson, C. E.: Description and evaluation of GLOMAP-mode: a modal global aerosol microphysics model for the UKCA composition-climate model, Geosci. Model Dev., 3, 519–551, https://doi.org/10.5194/gmd-3-519-2010, 2010.
Marais, E. A., Jacob, D. J., Jimenez, J. L., Campuzano-Jost, P., Day, D. A., Hu, W., Krechmer, J., Zhu, L., Kim, P. S., Miller, C. C., Fisher, J. A., Travis, K., Yu, K., Hanisco, T. F., Wolfe, G. M., Arkinson, H. L., Pye, H. O. T., Froyd, K. D., Liao, J., and McNeill, V. F.: Aqueous-phase mechanism for secondary organic aerosol formation from isoprene: application to the southeast United States and co-benefit of SO2 emission controls, Atmos. Chem. Phys., 16, 1603–1618, https://doi.org/10.5194/acp-16-1603-2016, 2016.
Martin, R. V.: Global and regional decreases in tropospheric oxidants from photochemical effects of aerosols, J. Geophys. Res., 108, 4097, https://doi.org/10.1029/2002JD002622, 2003.
Martin, S. T., Schlenker, J. C., Malinowski, A., and Hung, H.: Crystallization of atmospheric sulfate-nitrate-ammonium particles, Geophys. Res. Lett., 30, 2102, https://doi.org/10.1029/2003GL017930, 2003.
Martin, S. T., Rosenoern, T., Chen, Q., and Collins, D. R.: Phase changes of ambient particles in the Southern Great Plains of Oklahoma, Geophys. Res. Lett., 35, 1–5, https://doi.org/10.1029/2008GL035650, 2008.
Mishchenko, M. I., Dlugach, J. M., Yanovitskij, E. G., and Zakharova, N. T.: Bidirectional reflectance of flat, optically thick particulate layers: An efficient radiative transfer solution and applications to snow and soil surfaces, J. Quant. Spectrosc. Ra., 63, 409–432, https://doi.org/10.1016/S0022-4073(99)00028-X, 1999.
Molenar, J. V.: Analysis of the Real World Performance of the Optec NGN-2 Ambient Nephelometer, in: Visual Air Quality: Aerosols and Global Radiation Balance, Air & Waste Management Association, Pittsburgh, 243–265, 1997.
Myhre, G., Shindell, D., Bréon, F.-M., Collins, W., Fuglestvedt, J., Huang, J., Koch, D., Lamarque, J.-F., Lee, D., Mendoza, B., Nakajima, T., Robock, A., Stephens, G., Takemura, T., and Zhang, H.: Anthropogenic and Natural Radiative Forcing, in: Climate Change 2013: The Physical Science Basis, Contribution of Working Group I to the Fifth Assessment Report of the Intergovernmental Panel on Climate Change, 659–740, https://doi.org/10.1017/CBO9781107415324.018, 2013.
Ng, N. L., Canagaratna, M. R., Zhang, Q., Jimenez, J. L., Tian, J., Ulbrich, I. M., Kroll, J. H., Docherty, K. S., Chhabra, P. S., Bahreini, R., Murphy, S. M., Seinfeld, J. H., Hildebrandt, L., Donahue, N. M., DeCarlo, P. F., Lanz, V. A., Prévôt, A. S. H., Dinar, E., Rudich, Y., and Worsnop, D. R.: Organic aerosol components observed in Northern Hemispheric datasets from Aerosol Mass Spectrometry, Atmos. Chem. Phys., 10, 4625–4641, https://doi.org/10.5194/acp-10-4625-2010, 2010.
Petters, M. D. and Kreidenweis, S. M.: A single parameter representation of hygroscopic growth and cloud condensation nucleus activity – Part 2: Including solubility, Atmos. Chem. Phys., 8, 6273–6279, https://doi.org/10.5194/acp-8-6273-2008, 2008.
Pandolfi, M., Alados-Arboledas, L., Alastuey, A., Andrade, M., Angelov, C., Artiñano, B., Backman, J., Baltensperger, U., Bonasoni, P., Bukowiecki, N., Collaud Coen, M., Conil, S., Coz, E., Crenn, V., Dudoitis, V., Ealo, M., Eleftheriadis, K., Favez, O., Fetfatzis, P., Fiebig, M., Flentje, H., Ginot, P., Gysel, M., Henzing, B., Hoffer, A., Holubova Smejkalova, A., Kalapov, I., Kalivitis, N., Kouvarakis, G., Kristensson, A., Kulmala, M., Lihavainen, H., Lunder, C., Luoma, K., Lyamani, H., Marinoni, A., Mihalopoulos, N., Moerman, M., Nicolas, J., O'Dowd, C., Petäjä, T., Petit, J.-E., Pichon, J. M., Prokopciuk, N., Putaud, J.-P., Rodríguez, S., Sciare, J., Sellegri, K., Swietlicki, E., Titos, G., Tuch, T., Tunved, P., Ulevicius, V., Vaishya, A., Vana, M., Virkkula, A., Vratolis, S., Weingartner, E., Wiedensohler, A., and Laj, P.: A European aerosol phenomenology – 6: scattering properties of atmospheric aerosol particles from 28 ACTRIS sites, Atmos. Chem. Phys., 18, 7877–7911, https://doi.org/10.5194/acp-18-7877-2018, 2018.
Park, R. J.: Sources of carbonaceous aerosols over the United States and implications for natural visibility, J. Geophys. Res., 108, 4355, https://doi.org/10.1029/2002JD003190, 2003.
Park, R. J., Jacob, D. J., Field, B. D., Yantosca, R. M., and Chin, M.: Natural and transboundary pollution influences on sulfate-nitrate-ammonium aerosols in the United States: Implications for policy, J. Geophys. Res.-Atmos., 109, D15204, https://doi.org/10.1029/2003JD004473, 2004.
Petters, M. D. and Kreidenweis, S. M.: A single parameter representation of hygroscopic growth and cloud condensation nucleus activity, Atmos. Chem. Phys., 7, 1961–1971, https://doi.org/10.5194/acp-7-1961-2007, 2007.
Petters, M. D. and Kreidenweis, S. M.: A single parameter representation of hygroscopic growth and cloud condensation nucleus activity – Part 3: Including surfactant partitioning, Atmos. Chem. Phys., 13, 1081–1091, https://doi.org/10.5194/acp-13-1081-2013, 2013.
Philip, S., Martin, R. V., van Donkelaar, A., Lo, J. W.-H., Wang, Y., Chen, D., Zhang, L., Kasibhatla, P. S., Wang, S., Zhang, Q., Lu, Z., Streets, D. G., Bittman, S., and Macdonald, D. J.: Global Chemical Composition of Ambient Fine Particulate Matter for Exposure Assessment, Environ. Sci. Technol., 48, 13060–13068, https://doi.org/10.1021/es502965b, 2014a.
Philip, S., Martin, R. V., Pierce, J. R., Jimenez, J. L., Zhang, Q., Canagaratna, M. R., Spracklen, D. V., Nowlan, C. R., Lamsal, L. N., Cooper, M. J., and Krotkov, N. A.: Spatially and seasonally resolved estimate of the ratio of organic mass to organic carbon, Atmos. Environ., 87, 34–40, https://doi.org/10.1016/j.atmosenv.2013.11.065, 2014b.
Pye, H. O. T., Liao, H., Wu, S., Mickley, L. J., Jacob, D. J., Henze, D. J., and Seinfeld, J. H.: Effect of changes in climate and emissions on future sulfate-nitrate-ammonium aerosol levels in the United States, J. Geophys. Res.-Atmos., 114, 1–18, https://doi.org/10.1029/2008JD010701, 2009.
Pye, H. O. T., Chan, A. W. H., Barkley, M. P., and Seinfeld, J. H.: Global modeling of organic aerosol: the importance of reactive nitrogen (NOx and NO3), Atmos. Chem. Phys., 10, 11261–11276, https://doi.org/10.5194/acp-10-11261-2010, 2010.
Rickards, A. M. J., Miles, R. E. H., Davies, J. F., Marshall, F. H., and Reid, J. P.: Measurements of the sensitivity of aerosol hygroscopicity and the κ parameter to the O∕C ratio, J. Phys. Chem. A, 117, 14120–14131, https://doi.org/10.1021/jp407991n, 2013.
Ridley, D. A., Heald, C. L., and Ford, B.: North African dust export and deposition: A satellite and model perspective, J. Geophys. Res.-Atmos., 117, 1–21, https://doi.org/10.1029/2011JD016794, 2012.
Ridley, D. A., Heald, C. L., Ridley, K. J., and Kroll, J. H.: Causes and consequences of decreasing atmospheric organic aerosol in the United States, P. Natl. Acad. Sci. USA, 201700387, 115, 290–295, https://doi.org/10.1073/pnas.1700387115, 2017.
Singh, H. B., Brune, W. H., Crawford, J. H., Jacob, D. J., and Russell, P. B.: Overview of the summer 2004 Intercontinental Chemical Transport Experiment-North America (INTEX-A), J. Geophys. Res.-Atmos., 111, 0148–0227, https://doi.org/10.1029/2006JD007905, 2006.
Snider, G., Weagle, C. L., Martin, R. V., van Donkelaar, A., Conrad, K., Cunningham, D., Gordon, C., Zwicker, M., Akoshile, C., Artaxo, P., Anh, N. X., Brook, J., Dong, J., Garland, R. M., Greenwald, R., Griffith, D., He, K., Holben, B. N., Kahn, R., Koren, I., Lagrosas, N., Lestari, P., Ma, Z., Vanderlei Martins, J., Quel, E. J., Rudich, Y., Salam, A., Tripathi, S. N., Yu, C., Zhang, Q., Zhang, Y., Brauer, M., Cohen, A., Gibson, M. D., and Liu, Y.: SPARTAN: a global network to evaluate and enhance satellite-based estimates of ground-level particulate matter for global health applications, Atmos. Meas. Tech., 8, 505–521, https://doi.org/10.5194/amt-8-505-2015, 2015.
Snider, G., Weagle, C. L., Murdymootoo, K. K., Ring, A., Ritchie, Y., Stone, E., Walsh, A., Akoshile, C., Anh, N. X., Balasubramanian, R., Brook, J., Qonitan, F. D., Dong, J., Griffith, D., He, K., Holben, B. N., Kahn, R., Lagrosas, N., Lestari, P., Ma, Z., Misra, A., Norford, L. K., Quel, E. J., Salam, A., Schichtel, B., Segev, L., Tripathi, S., Wang, C., Yu, C., Zhang, Q., Zhang, Y., Brauer, M., Cohen, A., Gibson, M. D., Liu, Y., Martins, J. V., Rudich, Y., and Martin, R. V.: Variation in global chemical composition of PM2.5: emerging results from SPARTAN, Atmos. Chem. Phys., 16, 9629–9653, https://doi.org/10.5194/acp-16-9629-2016, 2016.
Solomon, P. A., Crumpler, D., Flanagan, J. B., Jayanty, R. K. M., Rickman, E. E., and McDade, C. E.: U.S. National PM2.5 Chemical Speciation Monitoring Networks-CSN and IMPROVE: Description of Networks, J. Air Waste Manage., 64, 1410–1438, https://doi.org/10.1080/10962247.2014.956904, 2014.
Spracklen, D. V., Pringle, K. J., Carslaw, K. S., Chipperfield, M. P., and Mann, G. W.: A global off-line model of size-resolved aerosol microphysics: I. Model development and prediction of aerosol properties, Atmos. Chem. Phys., 5, 2227–2252, https://doi.org/10.5194/acp-5-2227-2005, 2005.
Stanier, C. O., Khlystov, A. Y., and Pandis, S. N.: Ambient aerosol size distributions and number concentrations measured during the Pittsburgh Air Quality Study (PAQS), Atmos. Environ., 38, 3275–3284, https://doi.org/10.1016/j.atmosenv.2004.03.020, 2004.
Tao, J., Zhang, L., Ho, K., Zhang, R., Lin, Z., Zhang, Z., Lin, M., Cao, J., Liu, S., and Wang, G.: Impact of PM2.5 chemical compositions on aerosol light scattering in Guangzhou – the largest megacity in South China, Atmos. Res., 135–136, 48–58, https://doi.org/10.1016/j.atmosres.2013.08.015, 2014.
Titos, G., Foyo-Moreno, I., Lyamani, H., Querol, X., Alastuey, A., and Alados-Arboledas, L.: Optical properties and chemical composition of aerosol particles at an urban location: An estimation of the aerosol mass scattering and absorption efficiencies, J. Geophys. Res.-Atmos., 117, 1–12, https://doi.org/10.1029/2011JD016671, 2012.
Trivitayanurak, W., Adams, P. J., Spracklen, D. V., and Carslaw, K. S.: Tropospheric aerosol microphysics simulation with assimilated meteorology: model description and intermodel comparison, Atmos. Chem. Phys., 8, 3149–3168, https://doi.org/10.5194/acp-8-3149-2008, 2008.
van Donkelaar, A., Martin, R. V., Brauer, M., Kahn, R., Levy, R., Verduzco, C., and Villeneuve, P. J.: Global estimates of ambient fine particulate matter concentrations from satellite-based aerosol optical depth: Development and application, Environ. Health Perspect., 118, 847–855, https://doi.org/10.1289/ehp.0901623, 2010.
van Donkelaar, A., Martin, R. V., Spurr, R. J. D., and Burnett, R. T.: High-Resolution Satellite-Derived PM2.5 from Optimal Estimation and Geographically Weighted Regression over North America, Environ. Sci. Technol., 49, 10482–10491, https://doi.org/10.1021/acs.est.5b02076, 2015.
Wang, J., Hoffmann, A. A., Park, R. J., Jacob, D. J., and Martin, S. T.: Global distribution of solid and aqueous sulfafte aerosols: Effect of the hysteresis of particle phase transitions, J. Geophys. Res.-Atmos., 113, 1–11, https://doi.org/10.1029/2007JD009367, 2008.
Wang, Q., Jacob, D. J., Spackman, J. R., Perring, A. E., Schwarz, J. P., Moteki, N., Marais, E. A., Ge, C., Wang, J., and Barrett, S. R. H.: Global budget and radiative forcing of black carbon aerosol: Constraints from pole-to-pole (HIPPO) observations across the Pacific, 119, 195–206, https://doi.org/10.1002/2013JD020824, 2014.
Wexler, A. S. and Clegg, S. L.: Atmospheric aerosol models for systems including the ions H+, , Na+, , , Cl−, Br−, and H2O, J. Geophys. Res., 107, 4207, https://doi.org/10.1029/2001JD000451, 2002.
White, W. H.: On the theoretical and empirical basis for apportioning extinction by aerosols: A critical review, Atmos. Environ., 20, 1659–1672, https://doi.org/10.1016/0004-6981(86)90113-7, 1986.
White, W. H., Macias, E. S., Nininger, R. C., and Schorran, D.: Size-resolved measurements of light scattering by ambient particles in the southwestern U.S.A., Atmos. Environ., 28, 909–921, https://doi.org/10.1016/1352-2310(94)90249-6, 1994.
Wise, M. E.: Hygroscopic growth of ammonium sulfate/dicarboxylic acids, J. Geophys. Res., 108, 4638, https://doi.org/10.1029/2003JD003775, 2003.
Yu, F. and Luo, G.: Simulation of particle size distribution with a global aerosol model: contribution of nucleation to aerosol and CCN number concentrations, Atmos. Chem. Phys., 9, 7691–7710, https://doi.org/10.5194/acp-9-7691-2009, 2009.
Zhang, L., Kok, J. F., Henze, D. K., Li, Q., and Zhao, C.: Improving simulations of fine dust surface concentrations over the western United States by optimizing the particle size distribution, Geophys. Res. Lett., 40, 3270–3275, https://doi.org/10.1002/grl.50591, 2013.