the Creative Commons Attribution 4.0 License.
the Creative Commons Attribution 4.0 License.
 | 08 Jan 2019
Anthropogenic fine particulate matter pollution will be exacerbated in eastern China due to 21st century GHG warming
Huijun Wang
Jianqi Sun
Yangyang Xu
Zhicong Yin
China has experienced a substantial increase in severe haze events over the past several decades, which is primarily attributed to the increased pollutant emissions caused by its rapid economic development. The climate changes observed under the warming scenarios, especially those induced by increases in greenhouse gases (GHGs), are also conducive to the increase in air pollution. However, how the air pollution changes in response to the GHG warming has not been thoroughly elucidated to date. We investigate this change using the century-long large ensemble simulations with the Community Earth System Model 1 (CESM1) with the fixed anthropogenic emissions at the year 2005. Our results show that although the aerosol emission is assumed to be a constant throughout the experiment, anthropogenic air pollution presents positive responses to the GHG-induced warming. The anthropogenic PM2.5 concentration is estimated to increase averaged over eastern China at the end of this century, but varying from regions, with an increase over northwestern part of eastern China and a decrease over southeastern part. Similar changes can be observed for the light air pollution days. However, the severe air pollution days are reported to increase across eastern China at the end of this century, particularly around the Jing–Jin–Ji region. Further research indicates that the increased stagnation days and the decreased light precipitation days are the possible causes of the increase in PM2.5 concentration, as well as the anthropogenic air pollution days. Estimation shows that the effect of climate change induced by the GHG warming can account for 11 %–28 % of the changes in anthropogenic air pollution days over eastern China. Therefore, in the future, more stringent regulations on regional air pollution emissions are needed to balance the effect from climate change.
- Article
(5388 KB) - Full-text XML
-
Supplement
(963 KB) - BibTeX
- EndNote


The extraordinarily rapid development of China has caused extremely high aerosol loading and gaseous pollutant emissions that have enveloped most regions across China in recent decades. The increased pollutant emissions, particularly for the particulate matter finer than 2.5 µm in aerodynamic diameter (PM2.5), generally result in severe haze events and present a major threat to public health (Gao et al., 2017; Tang et al., 2017; Wang, 2018), crop production (Tie et al., 2016), and regional climates (Cao et al., 2016). For example, the annual averaged PM2.5 in Beijing exceeded 75 µg m−3 during 2009–2016 (Fig. 1b), which is more than 3 times the recommended 24 h standard (25 µg m−3) of the World Health Organization (WHO). This degeneration of the air pollution across China, which is similar to that in Beijing, is primarily caused by the integrated effects of high emissions and poor ventilation (Chen and Wang, 2015; Y. Zhang et al., 2016). Many efforts are thus underway to reduce emissions that cause severe haze pollution. However, the question remains as to whether climate change will offset or facilitate these efforts.
Recent studies have documented that the exacerbation of air quality over eastern China was partly modulated by meteorological conditions and climate variability that are generally conducive to the severe haze occurrences (Li et al., 2018; Liao and Chang, 2014; Wang and Chen, 2016; Yang et al., 2016; Zhang et al., 2014; Z. Zhang et al., 2016). Specifically, Wang et al. (2015) revealed that the shrinking Arctic sea ice favours less cyclone activity and a more stable atmosphere conducive to haze formation, which can explain approximately 45 %–67 % of the interannual to interdecadal variability of winter haze days over eastern China. Besides Arctic sea ice, other decadal variability and changes, including a weak East Asian winter monsoon (Jeong et al., 2017; Li et al., 2016; Yin et al., 2015), strong El Niño–Southern Oscillation (Gao and Li, 2015; Zhao et al., 2018), high Pacific decadal oscillation (Zhao et al., 2016), and high Arctic oscillation (Cai et al., 2017), may have contributed. In addition, the increasing winter haze days over eastern China may also be linked to the low boundary layer height (Huang et al., 2018; Wang et al., 2018), weakened northerly winds (Yang et al., 2017a), decreased relative humidity (Ding and Liu, 2014), and increased sea surface temperature (Xiao et al., 2015; Yin and Wang, 2016; Yin et al., 2017).
Global warming generally presents an adverse impact on the haze pollution across China. Simulations of the dynamic downscaling by the regional climate model RegCM4 under the RCP4.5 (Representative Concentration Pathway) scenario have shown that the air environment carrying capacity tends to decrease, and the weak ventilation days tend to increase, in the 21st century across China, suggesting an increase in the haze pollution potential compared to the current state (Han et al., 2017). Furthermore, Cai et al. (2017) projected that the days conducive to severe haze pollution in Beijing would increase by 50 % at the end of the 21st century (2050–2099) under the RCP8.5 scenario compared to the historical period.
These qualitative estimations of the haze pollution response to climate changes are generally derived from the potential changes in the corresponding meteorological conditions indirectly. No studies to date quantitatively assessed the simulated PM directly. How the fine particulate matter pollution changes in response to the global warming in China has not been thoroughly elucidated to date. This study focuses in particular on the anthropogenic PM2.5 loading and its response to the future warming. In this study, the large ensemble simulations from the Community Earth System Model Version 1 (CESM1) throughout the 21st century that are induced by increasing greenhouse gas (GHG) emissions along the trajectory RCP8.5 but retaining the emissions of aerosols and/or their precursors fixed at the year of 2005 level (RCP8.5_FixAerosol2005; Xu and Lamarque, 2018) will be utilized.
2.1 PM2.5 observational datasets
Surface hourly PM2.5 concentration data released since 2013 are taken from the website of the Ministry of Environmental Protection (http://beijingair.sinaapp.com, last access: 3 January 2019), which covers 1602 sites across China. The duration of available datasets varies across sites because of the gradual development of the monitoring network in recent years. In our study region of eastern China (east to 100∘ E), there are 1263 sites remaining after the sites with missing values were removed during 2015–2017. Additionally, surface daily PM2.5 concentrations for the Beijing, Shanghai, Guangzhou, and Chengdu cities that had relatively longer monitoring times are also collected from the US Embassy Beijing (http://www.stateair.net/web/historical/1/1.html, last access: 3 January 2019).
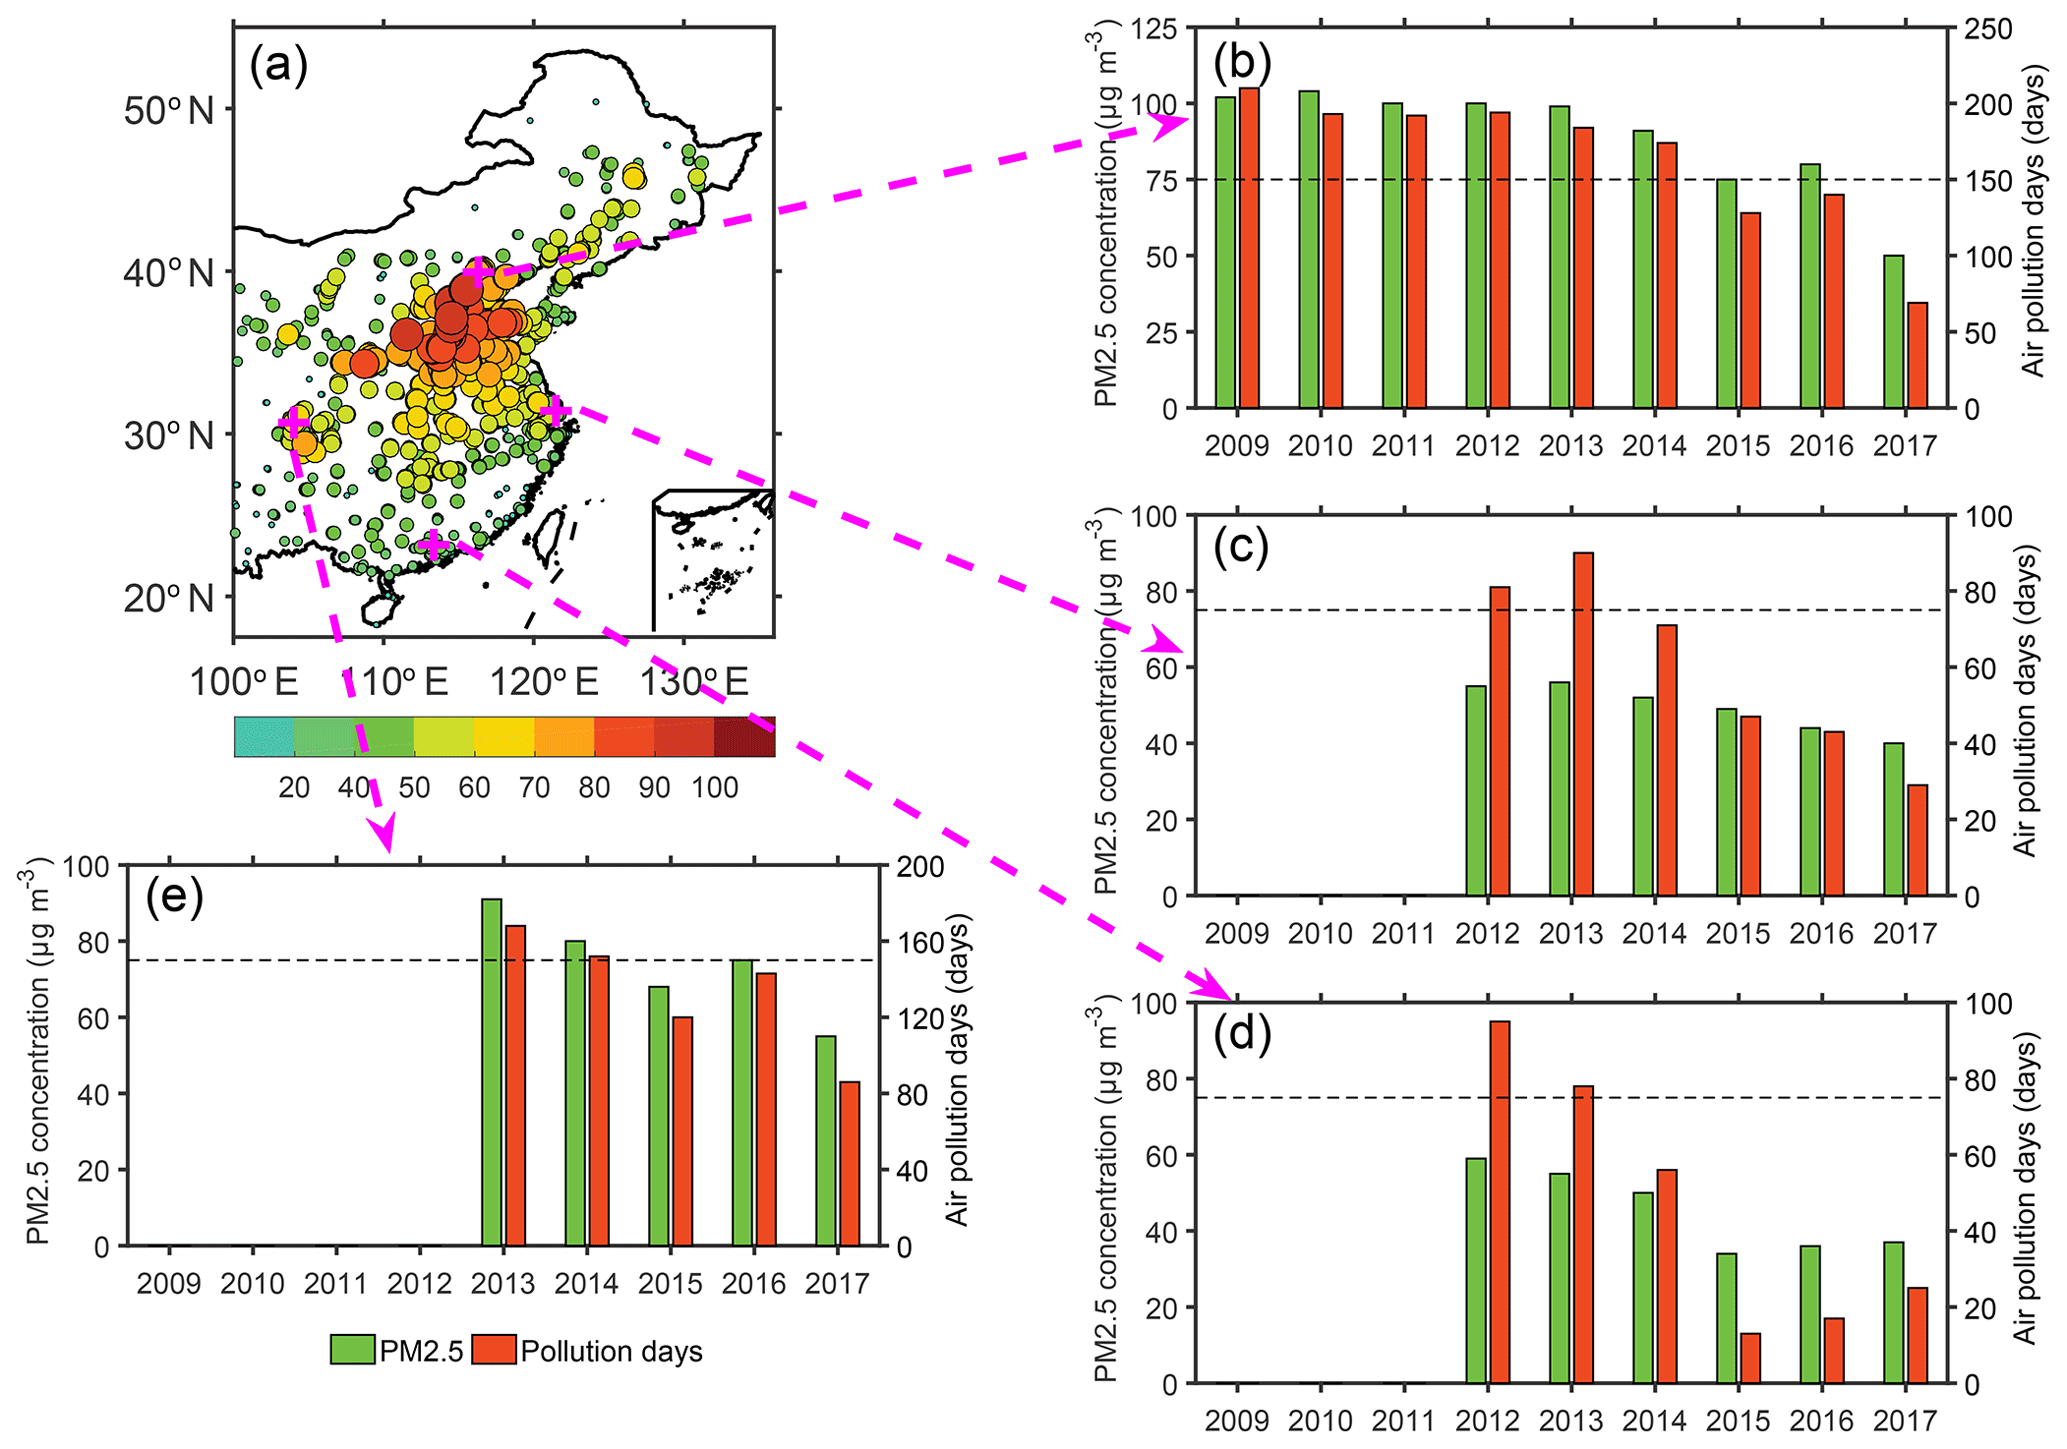
Figure 1Observed PM2.5 pollution conditions over eastern China during the past years. (a) Annual averaged PM2.5 concentration (µg m−3) for the years of 2015–2017. (b) Variations in annual averaged PM2.5 concentration (green bars) in Beijing city and the corresponding number of the severe PM2.5 pollution days (red bars). The severe pollution days are defined as the daily averaged PM2.5 concentration exceeding 75 µg m−3. Panels (c), (d), and (e) are similar to (b), but for the results of Shanghai, Guangzhou, and Chengdu city, respectively.
2.2 CESM1 simulations
The CESM1 is an Earth system model involving the atmosphere, land, ocean, and sea-ice components with a nominal 1∘ by 1∘ horizontal resolution (Hurrell et al., 2013). The RCP8.5_FixAerosol2005 simulations are forced by the RCP8.5 scenario, but all emissions of sulfate (SO4), black carbon (BC), primary organic matter (POM), secondary organic aerosols (SOA; or their precursors), and atmospheric oxidants are fixed at the present-day level (2005). These simulations include 16 ensemble members, differing solely in their atmospheric initial conditions with a tiny random temperature difference (order of 10−14 ∘C; Kay et al., 2015). For comparison, the CESM1 large ensemble consists of 35-member simulations, forced by the RCP8.5 scenario, that are also employed here. Using these relatively large ensembles can substantially reduce the contribution of the natural variability of the climate system to the result estimation (Xu and Lamarque, 2018).
For the aerosol emission in the RCP scenarios database, just its decadal change is considered rather than the emission in a single year (Lamarque et al., 2011). Here, the years of 2006–2015 are considered as the reference period in the RCP8.5_FixAerosol2005 simulations. The differences of the mean climates from the reference period are largely due to the increase in GHG emissions and are not attributed to the decline in aerosol emissions, as specified in RCP8.5. The changes in anthropogenic PM2.5 loadings and anthropogenic air pollution days in our study are thus only a result of the GHG-induced climate change, rather than changes in aerosol emission. Note that just four species of PM2.5 components that show a substantial threat to public health are considered here for analysis, including SO4, BC, POM, and SOA from the CESM1 simulations.
2.3 Definition of the fraction of attributable risk
The influences of the GHG-induced climate changes on the anthropogenic air pollution in China are investigated using the metric of the fraction of attributable risk (FAR), which has been widely used for attribute analyses of extreme climate changes (Chen and Sun, 2017; Stott et al., 2004). FAR is defined as , where P0 is the probability of exceeding a certain threshold during the reference period and P1 is the probability of exceeding the same threshold during a given period. FAR thus presents the quantitative estimations of effects of the GHG-induced climate changes on the anthropogenic air pollution.
2.4 Definition of stagnation days
The changes in the stagnation days that were induced by the increase in GHG emissions are also evaluated in our study to explore the possible impact of climate change on the anthropogenic air pollution. The day is considered to be stagnant when the daily mean near-surface wind speed is less than 3.2 m s−1, the daily mean 500 hPa wind speed is less than 13 m s−1, and the daily accumulated precipitation is less than 1 mm (Horton et al., 2012). Earlier studies suggested that this air stagnation definition might not be applicable for China to represent the air pollution condition under the seasonal scales (Feng et al., 2018; Wang et al., 2018). However, the annual mean stagnation generally presents good agreement with that of air pollution across China (Huang et al., 2017, 2018). The changes in the annual mean states of air stagnation over China at the end of 21st century will thus be discussed in the following.
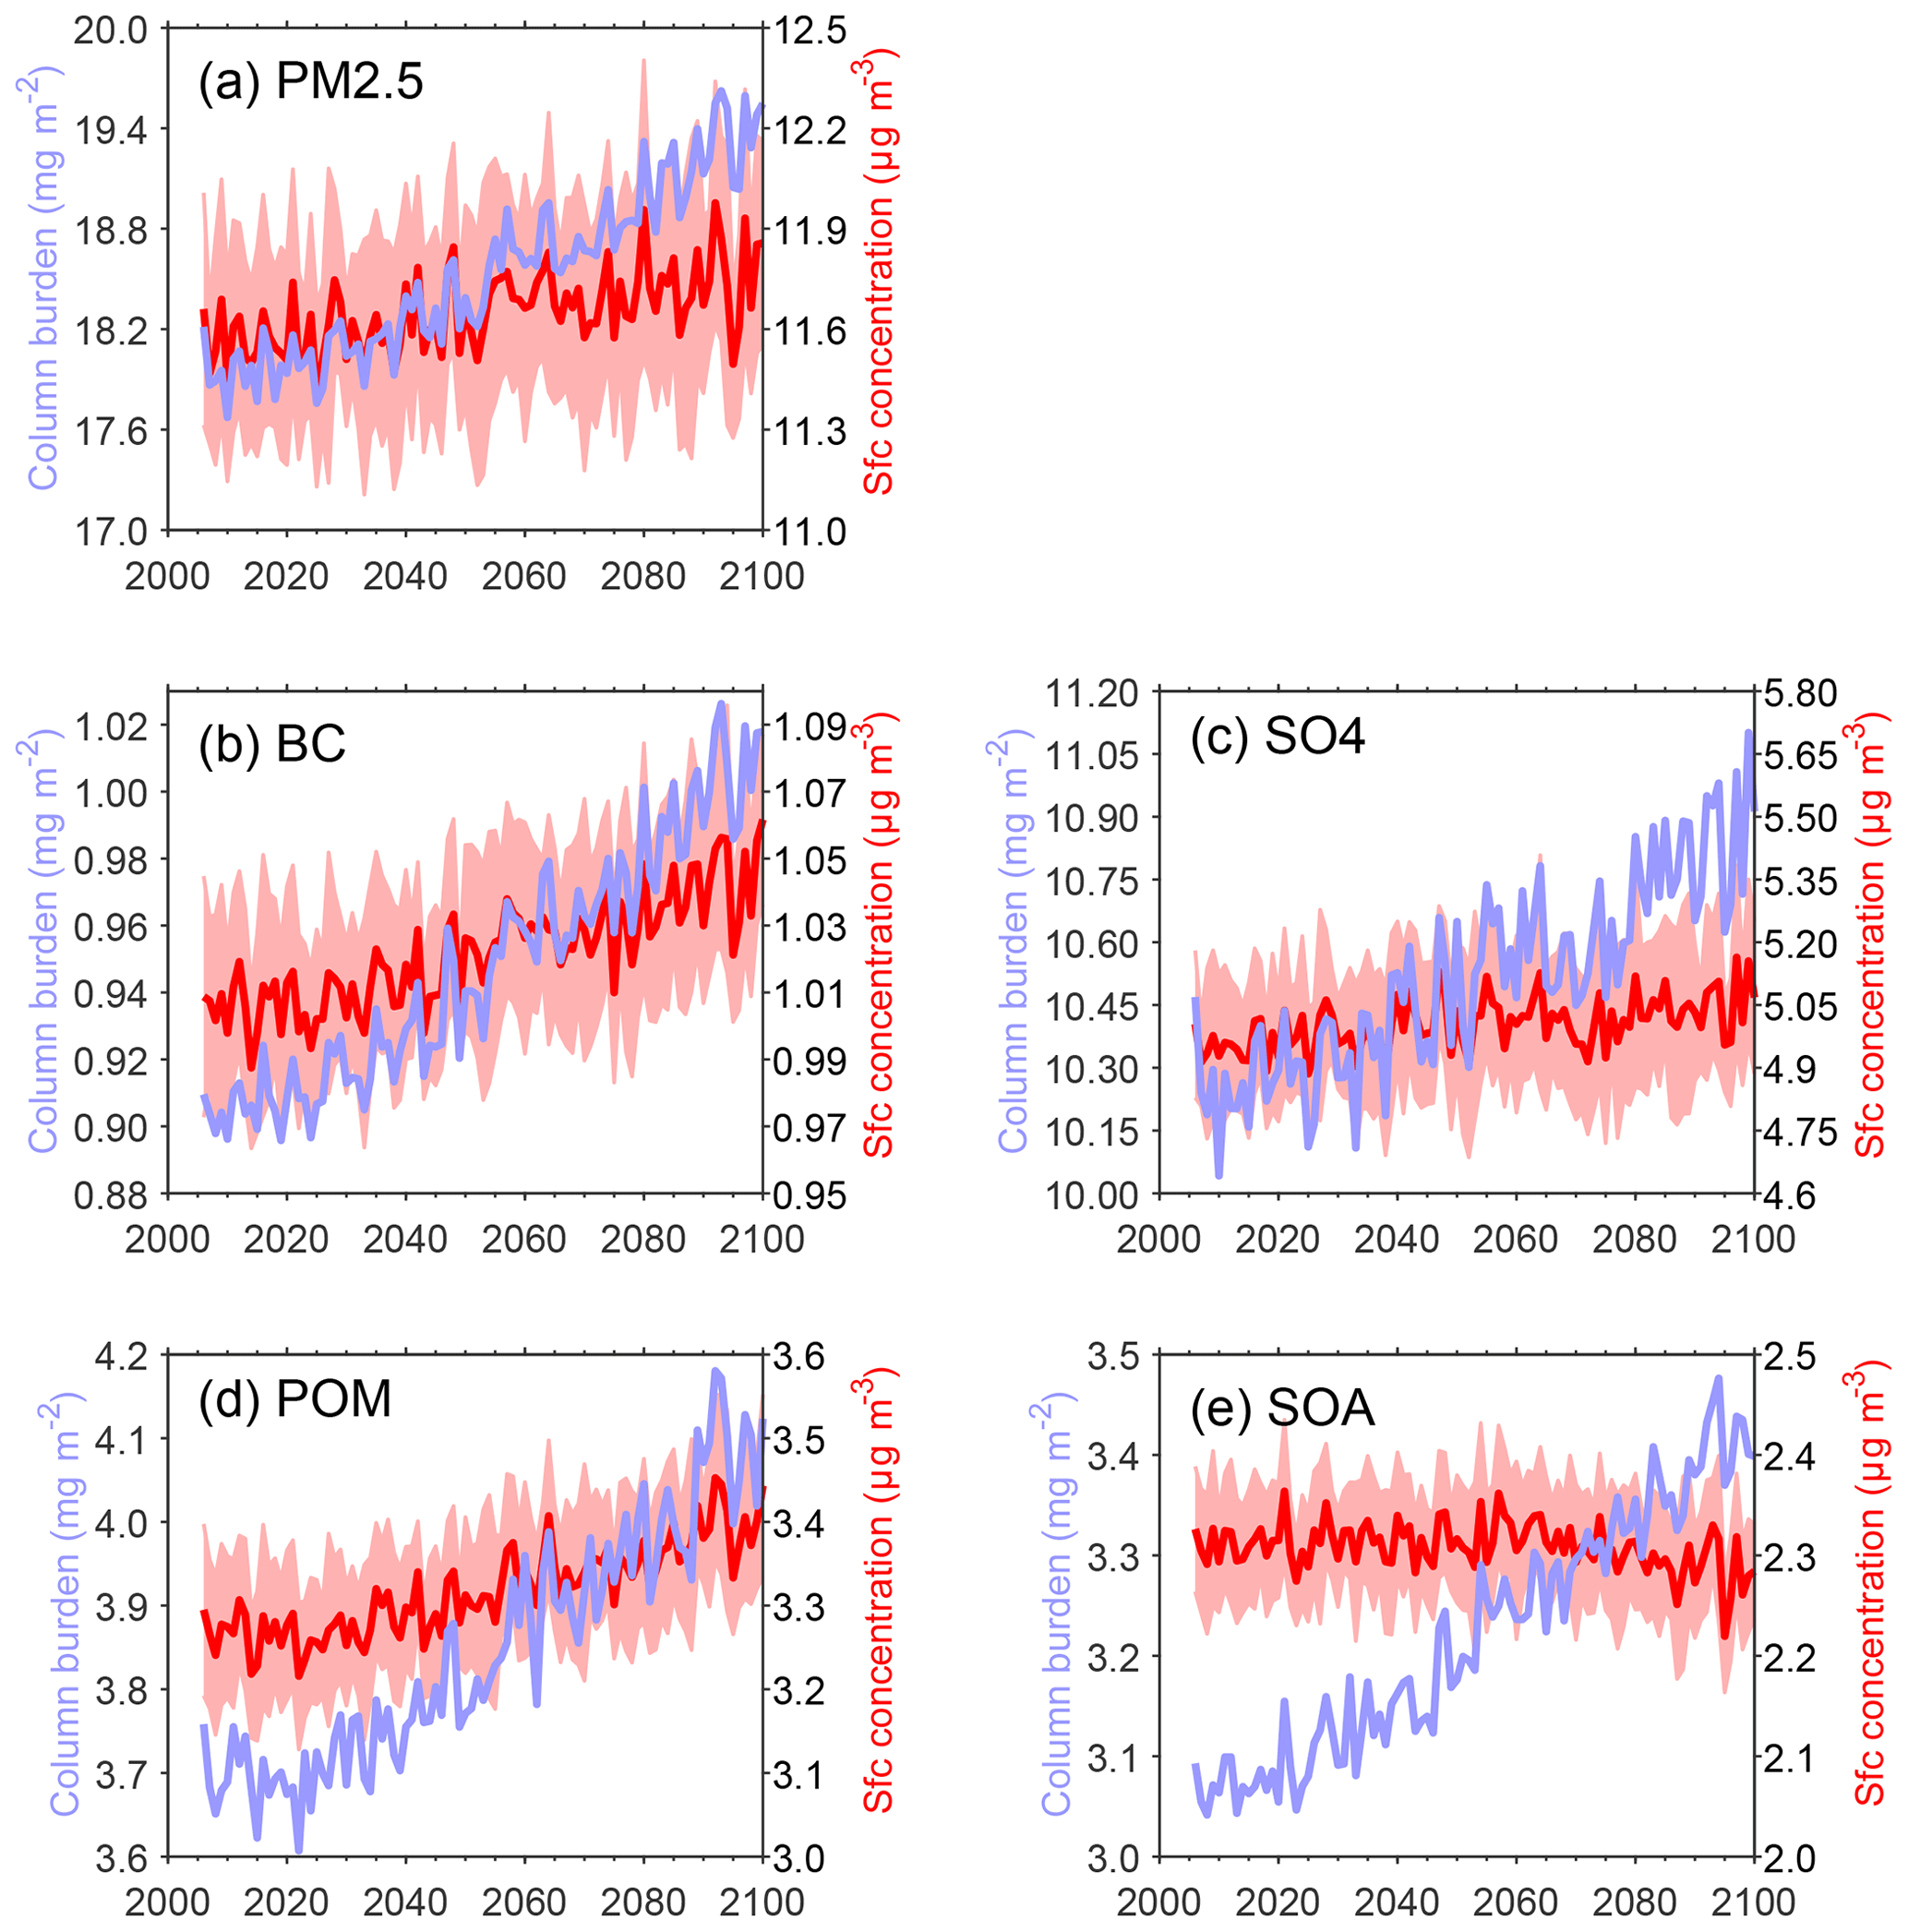
Figure 2Plots of future changes in the total PM2.5 as well as its associated species averaged over eastern China in terms of the surface concentration (µg m−3, right axis in red) and column burden (mg m−2, left axis in blue) from the simulations of the RCP8.5_FixAerosol2005 experiment. (a) PM2.5, (b) BC, (c) SO4, (d) POM, and (e) SOA. Ensemble variance (1σ) for surface concentration is shown in red shading.
3.1 Observational changes in PM2.5 pollution
The days of severe haze pollution increased over the past several decades across eastern China, particularly for the episodes of January 2013, December 2015, and December 2016, when several severe haze alerts were reached. High PM2.5 loading was centralized over the Jing–Jin–Ji (JJJ) region, Shangdong, and Henan provinces, as well as the Sichuan Basin (SCB, Fig. 1a). The annual mean PM2.5 mass concentrations for most sites over these regions exceed 75 µg m−3. According to the statistics, at approximately 95 % of sites the annual mean PM2.5 concentration exceeded the WHO recommended 24 h standard (25 µg m−3) across eastern China, and there are 65 sites centralized by Beijing where the annual mean PM2.5 concentration was larger than 75 µg m−3, which would present the possibility of exposing people to serious health hazards (World Health Organization, 2014).
Regarding the four economic zones of Beijing, Shanghai, Guangzhou, and Chengdu cities in China, serious PM2.5 pollution was reported for recent years, especially for the Beijing and Chengdu regions (Fig. 1). Taking Beijing as an example, the annual mean PM2.5 concentration was stably exceeding 100 µg m−3, and before 2013 severe air pollution was experienced for more than half the year (>75 µg m−3). Since 2013, China's State Council released its Air Pollution Prevention and Control Action Plan, which requires the key regions, including the JJJ, the Yangtze River Delta (YRD), and the Pearl River Delta (PRD) to reduce their atmospheric levels of PM2.5 by 25 %, 20 %, and 15 %, respectively, by the end of year 2017 (State Council, 2013). Considerable effort was made , and the PM2.5 loading and the air pollution days presented sharp decreases in recent years. However, the strict emission policies have substantial costs for the economic development, which cannot meet the current requirement of the rapid development of China. Thus, scientifically quantifying the roles of anthropogenic emissions and climate changes holds great importance for seeking the balance between socioeconomic development and emission reduction.

Figure 3Changes in the anthropogenic PM2.5 pollution days across eastern China from the RCP8.5_FixAerosol2005 experiment. The top panels (a, b) show the changes in light air pollution days (>25 µg m−3) and the bottom panels (c, d) show the results of severe air pollution days (>75 µg m−3). The left panels (a, c) illustrate the annual averaged severe pollution days in 2006–2015 and the right panels (b, d) show changes in the pollution days at the end of the 21st century compared to 2006–2015. Dots in (b) and (d) mean the changes are significant at the 95 % confidence level using Student t test for all years and ensembles. Units: days.
3.2 Simulated changes in anthropogenic PM2.5 pollution
A strong spatial correlation (0.69) is found for the annual mean PM2.5 concentration between the site observation and median ensemble of CESM1 simulations over eastern China (Fig. S1). The high concentrations across eastern China, including the regions centralized by Beijing and Chengdu, are reasonably reproduced. However, a negative bias is obvious. Earlier studies (Li et al., 2016; Yang et al., 2017b, c) have documented that this low bias of aerosol concentration simulated by models is much more complicated in China and the causes mainly involve the uncertainties from aerosol emission amount, emission injection height, lack of nitrate, and aerosol treatment in the model as well as the coarse model resolution.
The median ensemble-mean change in the PM2.5 surface concentration presents strong regional dependence across China, with significantly decreasing trends over the southeastern part of eastern China and significantly increasing trends over the other regions throughout the 21st century (Fig. S2), even though the emissions are constant throughout the experiment. The regional differences in the total PM2.5 changes are mainly due to SO4, which can account for approximately 50 % of the total PM2.5 mass (Xu and Lamarque, 2018). The species of BC and POM are reported to significantly increase in the 21st century across eastern China, although the aerosol emissions were fixed at the level in 2005. Figure 2 presents the simulated PM2.5 loadings from the CESM1, in terms of column burden and surface concentration, that are significantly increasing throughout the 21st century. The increase in the total PM2.5 is approximately 8 % for the column burden and 2 % for the surface concentration at the end of the 21st century (2090–2099) compared to the current state (2006–2015). These increasing trends of PM2.5 loadings are mainly due to the significant increases in the major PM2.5 species, except for SOA, in which the surface concentration presents a slight decrease. Furthermore, the increases in all major PM2.5 species in terms of column burden (BC: 11 %, SO4: 6 %, SOA: 11 %, and POM: 11 %) show stronger than the surface concentration (BC: 4 %, SO4: 2 %, SOA: −1 %, and POM: 4 %).
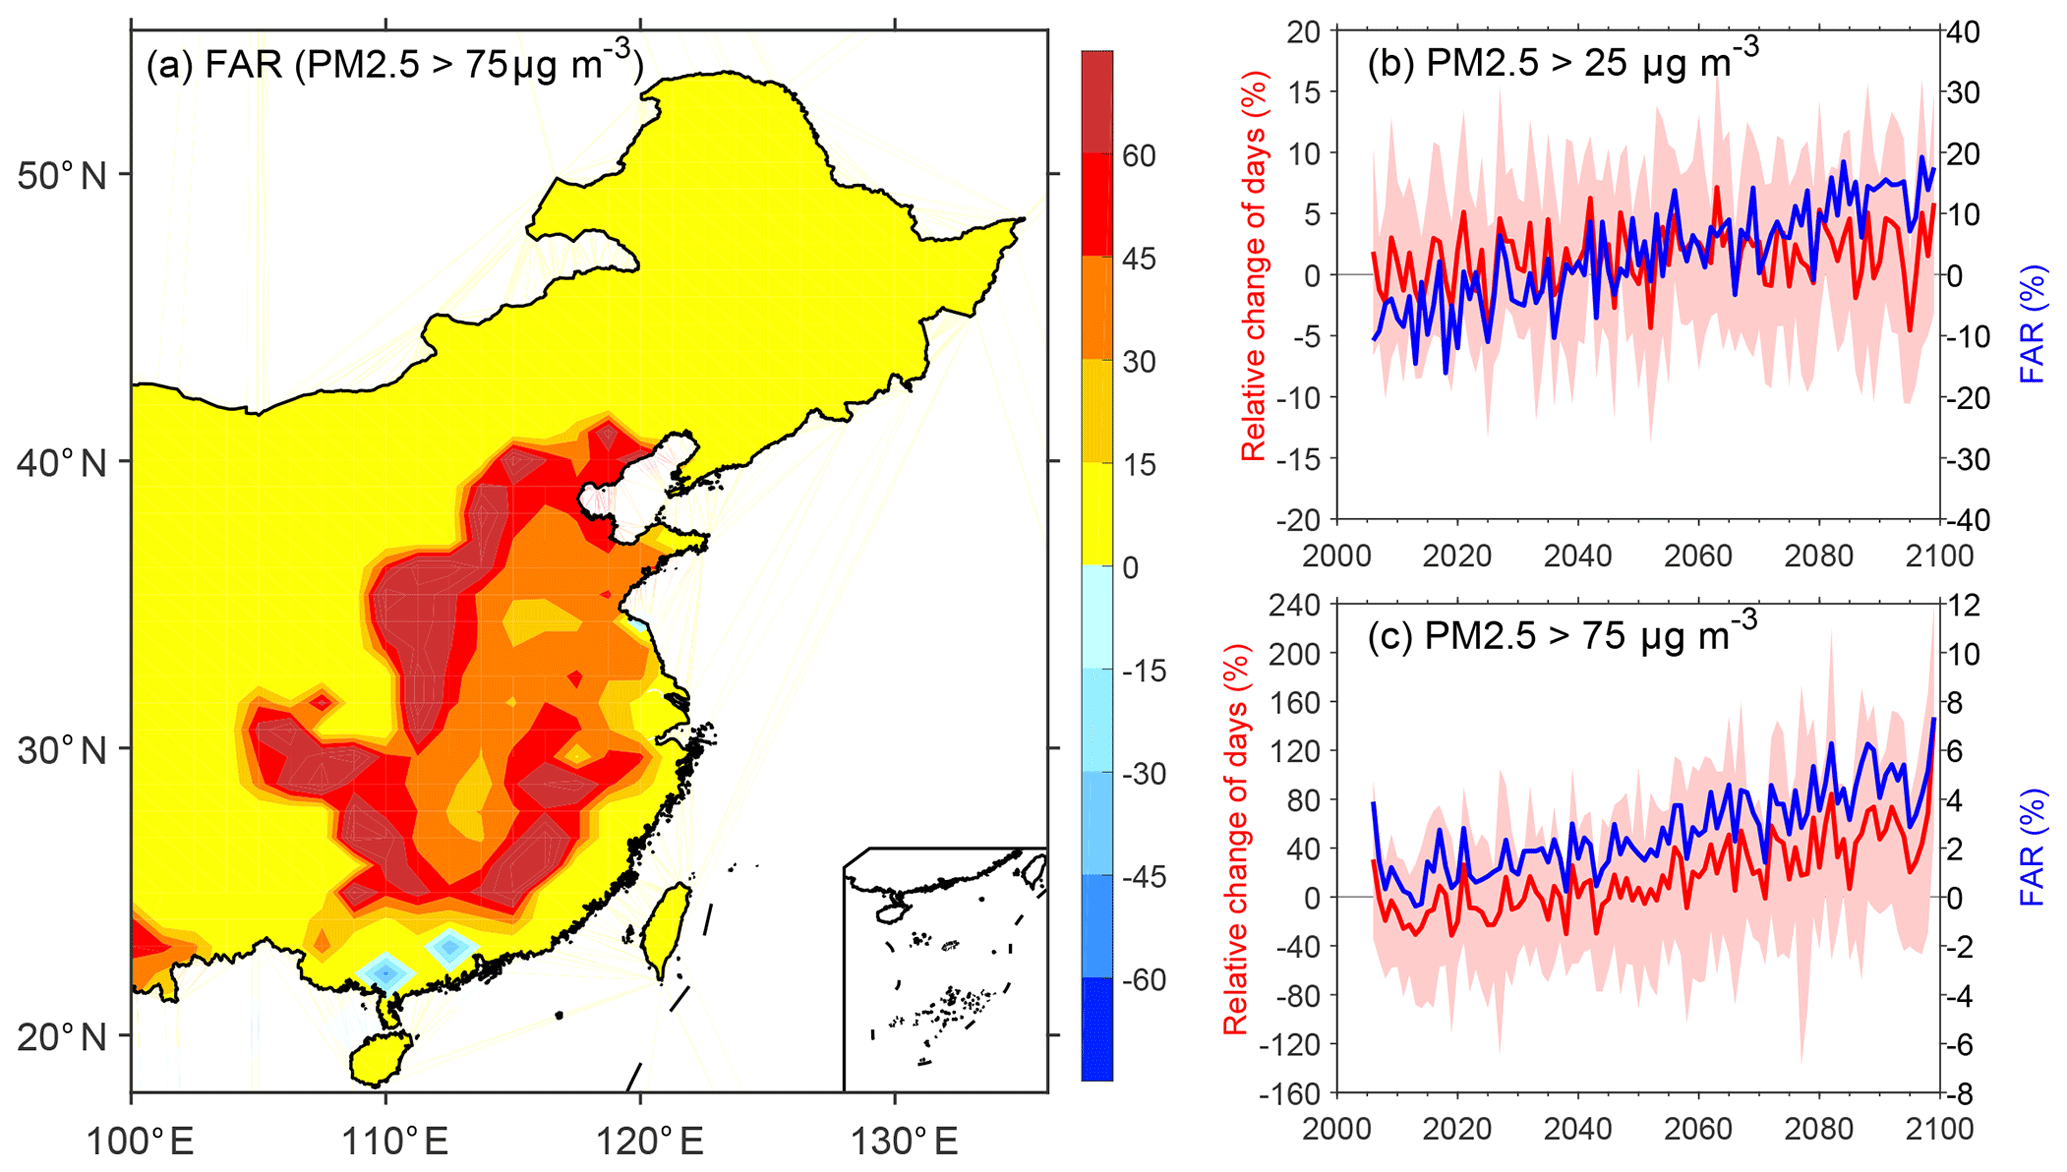
Figure 4Attributable changes in anthropogenic air pollution days to the increased greenhouse gases emissions. (a) Spatial distribution of FAR for the changes in severe PM2.5 pollution (>75 µg m−3) at the end of the 21st century over eastern China. (b) Regional averaged relative changes in air pollution days (left axis in red; >25 µg m−3) and the corresponding variation in FAR (right axis in blue). Ensemble variance (1σ) for the relative changes in pollution days is shown in red shading. (c) is similar to (b), but for the severe PM2.5 pollution days. Units: percentage (%).
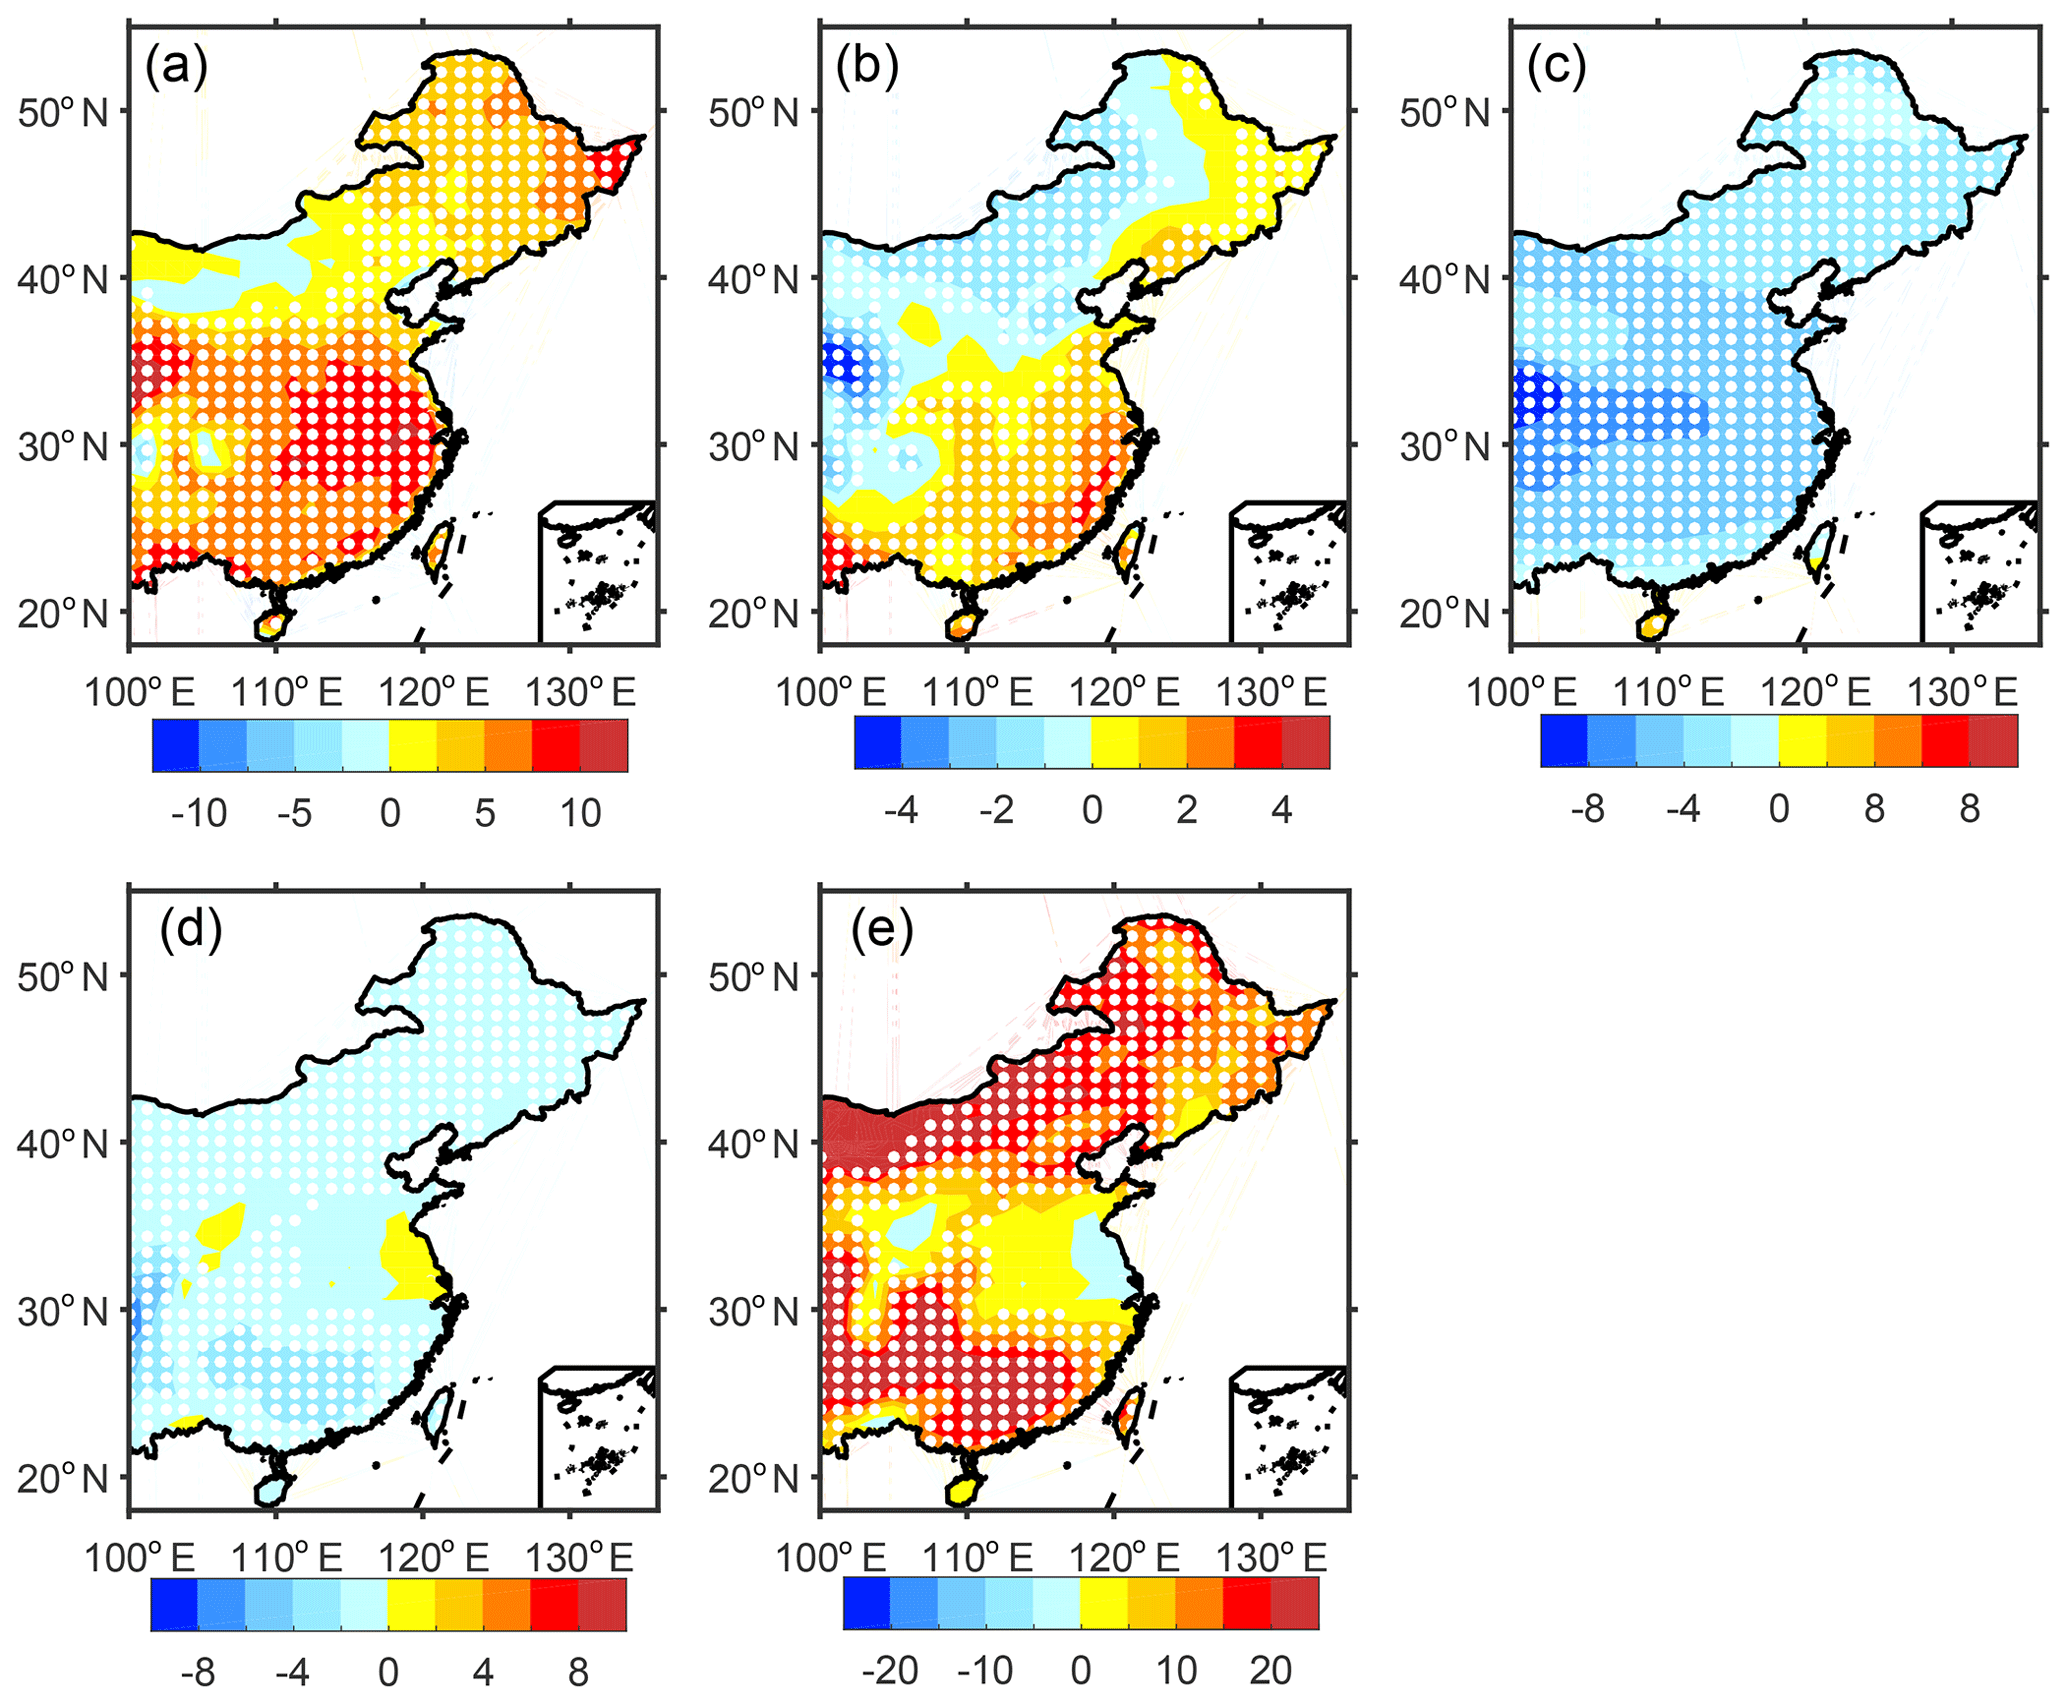
Figure 5Simulated changes in weather conditions of the air pollution across eastern China due to the GHG-induced warming. (a) Changes in the planetary boundary layer height (PBLH) at the end of the 21st century compared to the years of 2006–2015 from the RCP8.5_FixAerosol2005 experiment. Panels (b) and (c) are similar to (a) but for the wind speed at near-surface and 500 hPa levels, respectively. (d) Changes in the light precipitation days (daily accumulated precipitation < 10 mm) at the end of the 21st century compared to the current state. Panel (e) is similar to (d) but for the heavy precipitation days (>10 mm). Dots in the figure mean the changes are significant at the 95 % confidence level using Student t test for all years and ensembles. Units: percentage (%).
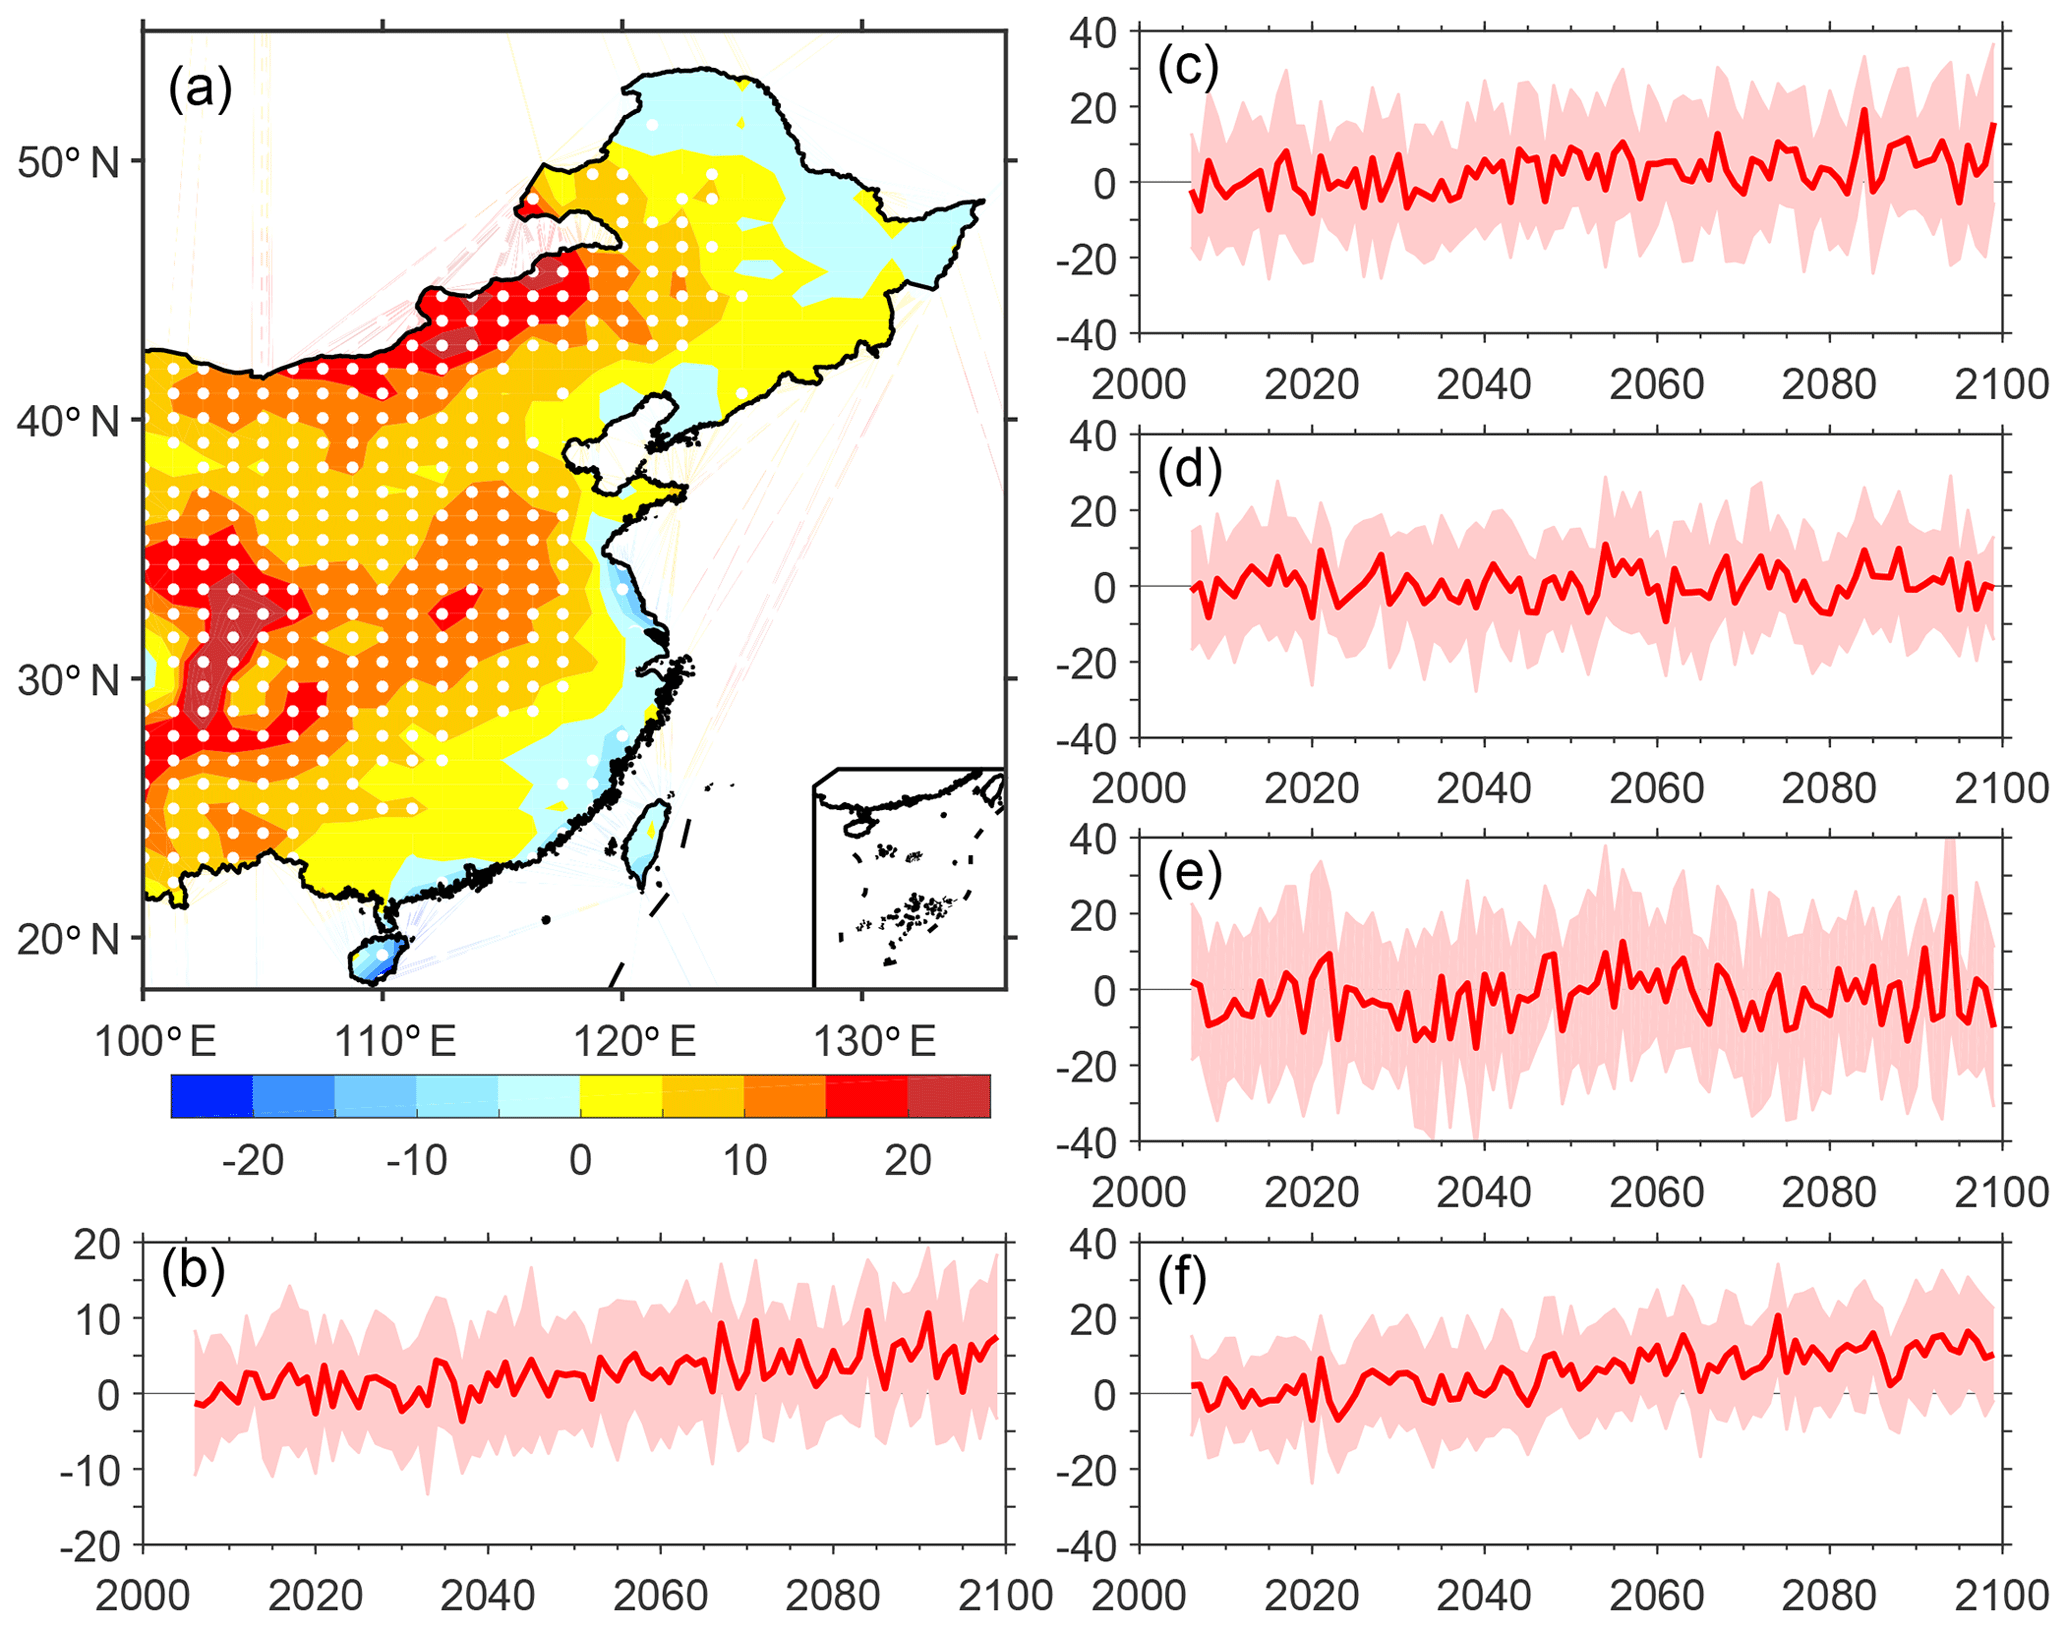
Figure 6Changes in the stagnant conditions across China due to the GHG-induced warming. (a) Distribution of the relative changes in the stagnation days at the end of the 21st century against the current state (2006–2015). Dots mean the changes are significant at the 95 % confidence level using Student t test for all years and ensembles. (b) Variations in the regional averaged stagnation days over eastern China. Ensemble variance (1σ) is shown in red shading. Panels (c), (d), (e), and (f) are similar to (b), but for the results of four Chinese economic zones, i.e. JJJ, YRD, PRD, and SCB. Units: percentage (%).
For comparison, we also evaluated the future changes in PM2.5 concentrations and the associated species along the RCP8.5 forcing trajectory from the large ensemble simulations of CESM1 (figure not shown). Different from changes in aerosol concentrations under the fixed aerosol simulations, the PM2.5 concentrations and the associated species present uniformly decreasing trends across eastern China from the simulations along the RCP8.5 forcing. The decreasing trends in the RCP8.5 simulations are mainly attributed to the prescribed decrease in aerosol forcing in the future in the RCP database (Xu and Lin, 2017). The climate change induced by the GHG-warming might exacerbate the air pollution, but the impacts cannot compensate the prescribed decreasing trend of aerosol concentration.
As mentioned above, the PM2.5 surface concentration in the two economic zones of YRD and PRD present a negative response to the GHG-induced warming, while the corresponding column burden shows significantly increasing trends (Fig. S3). The decreases in the surface concentration over these two zones are primarily contributed by the changes in SO4 and SOA, while there are no obvious trends for BC and POM (Figs. S4–S7). The robust response of the increased surface wind speed and decreased upper-level wind speed to GHG warming can be partly responsible for the changes in the major PM2.5 species in these two zones, which will be further discussed. Over the zones of JJJ and SCB, both the PM2.5 concentrations and the associated major PM2.5 species present the significantly rising trends throughout the 21st century. For the surface concentration, PM2.5 is reported to increase by 3 % and 4 % in the regions of JJJ and SCB, respectively, at the end of the 21st century. The BC is reported to increase by 4 % and 8 % for JJJ and SCB, respectively. The other species, such as SO4 and POM, increase by 4 % and 4 %, respectively, in the JJJ regions and by 2 % and 9 %, respectively, in SCB regions. Relatively stronger responses can be seen in changes in the column burden for all major species (Figs. S4–S7). The increased concentrations of PM2.5 species finally result in significantly increasing trends of the total PM2.5 loading over these two regions, which will present a more direct effect on human health.
The increase in PM2.5 surface concentration throughout the 21st century substantially leads to the significant increase in the light anthropogenic PM2.5 pollution days (PM2.5 > 25 µg m−3) across the northwestern part of eastern China (Fig. 3). Due to the decrease in PM2.5 concentration over the southeastern part of eastern China, the light anthropogenic air pollution days can be expected to decrease in this region. Estimation shows that the number of the light air pollution days would be decreased by approximately 10 days at the end of the 21st century compared to the early period of this century in the region. However, the annual mean light air pollution days are reported to increase on average over eastern China at the end of this century despite the aerosol emission being constant throughout the experiment. In contrast to the light air pollution days, the severe anthropogenic air pollution days (PM2.5 > 75 µg m−3) show a positive response to the GHG-induced warming across eastern China, particularly for the regions around JJJ in which the high PM2.5 concentration was localized (Fig. 3). The severe air pollution days are estimated to increase over this region by more than 2 days at the end of this century when compared to the early period. Considering the underestimation in aerosol concentration by CESM1 in China, the percentile threshold metric is also applied here to estimate the future changes in light (90th) and severe (99th) air pollution days. Similar results can be obtained (Fig. S8).
3.3 Attributable changes due to the GHG warming
Although the aerosol emission was constant throughout the experiment, our study reveals that the PM2.5 loadings and their associated pollution days still present increases throughout the 21st century, primarily resulting from the impact of climate change induced by the GHG warming. One may ask how large a contribution the climate change exerts on the changes in anthropogenic air pollution. To quantitatively address this issue, the framework of the “fraction of attributable risk” that has been widely used for attribute analyses of climate extreme changes (Chen and Sun, 2017; Stott et al., 2004) is employed in this study.
Figure 4 shows the percentage changes in the anthropogenic air pollution days throughout the 21st century over eastern China and their associated FAR variations. The regional averaged anthropogenic air pollution days present an obvious increase in the 21st century as addressed above. Correspondingly, synchronous increasing trends can be found in FAR for both light and severe anthropogenic air pollution days. For the light pollution days, FAR is estimated to be 28 % at the end of the 21st century, implying that approximately 28 % of the pollution days are contributed by the climate change that was induced by the GHG warming. For the severe pollution days, FAR shows a relatively smaller value of approximately 11 %. Furthermore, the high FAR values are mainly located over the regions of high PM2.5 loadings concentrated over eastern China, suggesting considerably stronger effects of climate change in these regions. Note that the FAR values estimated in this research may be underestimated because the GHG-induced warming impact was involved in the selected reference period that resulted in the overestimation of the probability of anthropogenic air pollution days.
3.4 Effects of the changes in meteorological conditions
We further examined the changes in meteorological conditions induced by the GHG warming that exerted effects on air pollution. Our results show that the local boundary layer height presents as higher under the warming scenario (Fig. 5a), which benefits the vertical transport of the air pollutant.
However, a robust negative response of the horizontal advection to the GHG-induced warming across eastern China can be found in the troposphere (Fig. 5b, c), facilitating air pollutant accumulation. The change in surface wind speed in response to the GHG warming is highly similar with the variation in PM2.5 surface concentration, with wind speed increasing in the southeastern part of eastern China and decreasing in the northwestern part. Variations in surface wind speeds are thus mainly responsible for the changes in PM2.5 surface concentration over eastern China. Different responses can be found for the tropospheric upper-level wind speeds, which are reported to substantially decrease. These decreases would directly result in significant increases in the stagnation days over eastern China, particularly over the northern region and SCB (Fig. 6). The decreasing trend of wind speed in the 21st century across China not only exists in CESM1, but also happens in the other global climate models that participated in Coupled Model Intercomparison Project Phase 3 (CMIP3) and CMIP5 (Jiang et al., 2010a; Mclnnes et al., 2011), as well as in regional climate models (Jiang et al., 2010b).
In response to the GHG-induced warming, the stagnation days over eastern China are estimated to increase by 6 % at the end of 21st century compared to the current period. For the specific economic zones, the stagnation days over the SCB and JJJ regions show considerably stronger rising trends, while relatively weaker increases are observed over the YRD and PRD regions. The number of stagnation days is estimated to increase by 13 % and 6 % at the end of the 21st century for the SCB and JJJ regions, respectively. Briefly, though the atmospheric stratification appears to be considerably more unstable in response to the GHG warming, the weakened horizontal advection would substantially increase the stagnation days over eastern China, which provides a beneficial background for the air pollutant accumulation and further increases the occurrence probability of the anthropogenic air pollution events.
Earlier studies have documented a significant increase in total precipitation across China due to the GHG-induced warming (Chen, 2013; Li et al., 2018; Wang et al., 2012), which seems to represent a conflict with the increase in the anthropogenic air pollution days. To resolve this issue, the precipitation changes in terms of light precipitation days (daily accumulated precipitation < 10 mm) and heavy precipitation days (>10 mm) are further examined (Fig. 5d, e). Clearly, the heavy precipitation days present an increase, while the light precipitation days show a decrease, across eastern China in response to the warming. Though the precipitation shifts toward heavy precipitation events, its cleansing impact on air pollutants has not increased because an increase in heavy precipitation days appears to be insufficient to further enhance the wet removal ability (Xu and Lamarque, 2018). In contrast, the decrease in light precipitation days substantially weakens the wet deposition of air pollutants, leading to the increase in the PM2.5 loading, as well as anthropogenic air pollution days. The future changes in precipitation days presented here are robust. Both the increasing trends of heavy precipitation days and the decreasing trends of light precipitation days are also obvious across China, simulated by the CMIP5 models (Chen and Sun, 2013, 2018) as well as the regional climate models (Gao et al., 2012).
The world is projected to experience increased disasters, such as heat waves, flash floods, and storms, due to the continuous global warming induced by the GHG increase. The research question we aim to address in this study is how the GHG warming would affect the anthropogenic PM2.5 pollution across China. Our evaluations show that the anthropogenic PM2.5 loadings, as well as the anthropogenic PM2.5 pollution days, would increase under the global warming conditions, even the aerosol emissions fixed at current levels. More stringent regulations are thus suggested for regional aerosol emissions to maintain the air quality standard as the current state.
The climate changes induced by the GHG warming exert their effects on the anthropogenic air pollution across eastern China via two ways that are of interest in this study. First, the weakened tropospheric wind speed induced by the GHG warming would result in a decrease in the horizontal advection and lead to an increase in the number of stagnation days, facilitating the local accumulation of air pollutants. Second, the number of light precipitation days would decrease due to the GHG-induced warming, although the total precipitation would clearly increase across China. This shift toward more no-rainfall days would further weaken the wet deposition of PM2.5 pollutants. Thus, the increased stagnation days and decreased light precipitation days provide a beneficial background for the occurrence of anthropogenic air pollution. Of course, under the warming scenarios, a large discrepancy exists among the different meteorological processes that benefit the air pollution at the current state, leading to the fuzzy recognition of air pollution change. For example, the boundary layer height shows an increase in response to the GHG warming that may strengthen the vertical dissipation of air pollutants. Thus, more studies are suggested in the future to further understand the mechanisms governing air quality across China.
All the datasets that were used for the analyses in this study are available for the public to download. The dataset of the site-observed surface hourly PM2.5 concentration across China is available at http://beijingair.sinaapp.com/ (last access: 3 January 2019, China National Environmental Monitoring Centre, 2019). The surface daily PM2.5 concentrations for the Beijing, Shanghai, Guangzhou, and Chengdu cities that had relatively longer monitoring times can be downloaded from the website http://www.stateair.net/web/historical/1/1.html (last access: 3 January 2019, US Embassy Beijing, 2019). The CESM1 RCP8.5_FixAerosol2005 simulations are available at https://www.earthsystemgrid.org/dataset/ucar.cgd.ccsm4.output.html (last access: 3 January 2019, Xu et al., 2018).
The supplement related to this article is available online at: https://doi.org/10.5194/acp-19-233-2019-supplement.
HPC and HJW designed the research; HPC analysed the data. All the authors discussed the results and wrote the paper.
The authors declare that they have no conflict of interest.
This work is jointly supported by the National Key Research and Development
Program of China (grant no. 2016YFA0600701), the National Natural Science
Foundation of China (grant no. 41421004), and the CAS-PKU Joint Research
Program.
Edited by: Yun Qian
Reviewed by: two anonymous referees
Cai, W. J., Li, K., Liao, H., Wang, H. J., and Wu, L. X.: Weather conditions conducive to Beijing severe haze more frequent under climate change, Nat. Clim. Change, 7, 257–263, 2017.
Cao, C., Lee, X. H., Liu, S. D., Schultz, N., Xiao, W., Zhang, M., and Zhao, L.: Urban heat islands in China enhanced by haze pollution, Nat. Commun., 7, 12509, https://doi.org/10.1038/ncomms12509, 2016.
Chen, H. P.: Projected change in extreme rainfall events in China by the end of the 21st century using CMIP5 models, Chin. Sci. Bull., 58, 1462–1472, 2013.
Chen, H. P. and Sun, J. Q.: Projected change in East Asian summer monsoon precipitation under RCP scenario, Meteorol. Atmos. Phys., 121, 55–77, 2013.
Chen, H. P. and Sun, J. Q.: Contribution of human influence to increased daily precipitation extremes over China, Geophys. Res. Lett., 44, 2436–2444, 2017.
Chen, H. P. and Sun, J. Q.: Projected changes in climate extremes in China in a 1.5 ∘C warmer world, Int. J. Climatol., 38, 3607–3617, 2018.
Chen, H. P. and Wang, H. J.: Haze days in North China and the associated atmospheric circulations based on daily visibility data from 1960 to 2012, J. Geophys. Res.-Atmos., 120, 5895–5909, 2015.
China National Environmental Monitoring Centre: Site-observed surface hourly PM2.5 concentration across China, available at: http://beijingair.sinaapp.com/, last access: 3 January 2019.
Ding, Y. H. and Liu, Y. J.: Analysis of long-term variations of fog and haze in China in recent 50 years and their relations with atmospheric humidity, Sci. China Earth Sci., 57, 36–46, 2014.
Feng, J., Quan, J., Liao, H., Li, Y., and Zhao, X.: An air stagnation index to qualify extreme haze events in northern China, J. Atmos. Sci., 75, 3489–3505, https://doi.org/10.1175/JAS-D-17-0354.1, 2018.
Gao, H. and Li, X.: Influences of El Niño Southern Oscillation events on haze frequency in eastern China during boreal winters, Int. J. Climatol., 35, 2682–2688, 2015.
Gao, J. H., Woodward, A., Vardoulakis, S., Kovats, S., Wilkinson, P., Li, L. P., Xu, L., Li, J., Yang, J., Li, J., Cao, L., Liu, X. B., Wu, H. X., and Liu, Q. Y.: Haze, public health and mitigation measures in China: A review of the current evidence for further policy response, Sci. Total Environ., 578, 148–157, 2017.
Gao, X. J., Shi, Y., Zhang, D., and Giorgi, F.: Climate change in China in the 21st century as simulated by a high resolution regional climate model, Chin. Sci. Bull., 57, 1188–1195, 2012.
Han, Z., Zhou, B., Xu, Y., Wu, J., and Shi, Y.: Projected changes in haze pollution potential in China: an ensemble of regional climate model simulations, Atmos. Chem. Phys., 17, 10109–10123, https://doi.org/10.5194/acp-17-10109-2017, 2017.
Horton, D. E., Harshvardhan, and Diffenbaugh, N. S.: Response of air stagnation frequency to anthropogenically enhanced radiative forcing, Environ. Res. Lett., 7, 044034, https://doi.org/10.1088/1748-9326/7/4/044034, 2012.
Huang, Q., Cai, X., Song, Y., and Zhu, T.: Air stagnation in China (1985–2014): climatological mean features and trends, Atmos. Chem. Phys., 17, 7793–7805, https://doi.org/10.5194/acp-17-7793-2017, 2017.
Huang, Q., Cai, X., Wang, J., Song, Y., and Zhu, T.: Climatological study of the Boundary-layer air Stagnation Index for China and its relationship with air pollution, Atmos. Chem. Phys., 18, 7573–7593, https://doi.org/10.5194/acp-18-7573-2018, 2018.
Hurrell, J. W., Holland, M. M., Gent, P. R., Ghan, S., Kay, J. E., Kushner, P. J., Lamarque, J. F., Large, W. G., Lawrence, D., Lindsay, K., Lipscomb, W. H., Long, M. C., Mahowald, N., Marsh, D. R., Neale, R. B., Rasch, P., Vavrus, S., Vertenstein, M., Bader, D., Collins, W. D., Hack, J. J., Kiehl, J., and Marshall, S.: The community earth system model: A framework for collaborative research, B. Am. Meteorol. Soc., 94, 1339–1360, 2013.
Jiang, Y., Luo, Y., and Zhao, Z. C.: Projection of wind speed changes in China in the 21st century by climate models, Chin. J. Atmos. Sci., 34, 323–336, 2010a (in Chinese).
Jiang, Y., Luo, Y., Zhao, Z. C., Shi, Y., Xu, Y. L., and Zhu, J. H.: Projections of wind changes for 21st century in China by three regional climate models, Chin. Geogra. Sci., 20, 226–235, 2010b.
Jeong, J. I. and Park, R. J.: Winter monsoon variability and its impact on aerosol concentrations in East Asia, Environ. Pollut., 221, 285–292, 2017.
Kay, J. E., Deser, C., Phillips, A., Mai, A., Hannay, C., Strand, G., Arblaster, J. M., Bates, S. C., Danabasoglu, G., Edwards, J., Holland, M., Kushner, P., Lamarque, J. F., Lawrence, D., Lindsay, K., Middleton, A., Munoz, E., Neale, R., Oleson, K., Polvani, L., and Vertenstein, M.: The community earth system model (CESM) large ensemble project: A community resource for studying climate change in the presence of internal climate variability, B. Am. Meteorol. Soc., 96, 1333–1349, 2015.
Lamarque, J. F., Kyle, P. P., Meinshausen, M., Riahi, K., Smith, S. J., van Vuuren, D. P., Conley, A. J., and Vitt, F.: Global and region evolution of short-lived radiatively-active gases and aerosols in the Representative Concentration Pathway, Clim. Change, 109, 191–212, 2011.
Li, H. X., Chen, H. P., Wang, H. J., and Yu, E. T.: Future precipitation changes over China under 1.5 ∘C and 2.0 ∘C global warming targets by using CORDEX regional climate models, Sci. Total Environ., 640–641, 543–554, 2018.
Li, K., Liao, H., Zhu, J., and Moch, J. M.: Implications of RCP emissions on future PM2.5 air quality and direct radiative forcing over China, J. Geophys. Res.-Atmos., 121, 12985–13008, 2016.
Li, K., Liao, H., Cai, W. J., and Yang, Y.: Attribution of anthropogenic influence on atmospheric patterns conducive to recent most severe haze over eastern China, Geophys. Res. Lett., 45, 2072–2081, 2018.
Li, Q., Zhang, R. H., and Wang, Y.: Interannual variation of the wintertime fog-haze days across central and eastern China and its relation with East Asian winter monsoon, Int. J. Climatol., 36, 346–354, 2016.
Liao, H. and Chang, W. Y.: Integrated assessment of air quality and climate change for policy-making-highlights of IPCC AR5 and research challenges, Natl. Sci. Rev., 1, 176–179, 2014.
Mclnnes, K. L., Erwin, T. A., and Bathols, J. M.: Global climate model projected changes in 10 m wind speed and direction due to anthropogenic climate change, Atmos. Sci. Lett., 12, 325–333, 2011.
State Council: Air pollution prevention and control action plan, Clean Air Alliance of China Rep., 20 pp., http://cleanairchina.org/product/6349.html (last access: 3 January 2019), 2013.
Stott, P. A., Stone, D. A., and Allen, M. R.: Human contribution to the European heatwave of 2003, Nature, 432, 610–614, 2004.
Tang, G. Q., Zhao, P. S., Wang, Y. H., Gao, W. K., Cheng, M. T., Xin, J. Y., Li, X., and Wang, Y. S.: Mortality and air pollution in Beijing: the long-term relationship, Atmos. Environ., 150, 238–243, 2017.
Tie, X. X., Huang, R. J., Dai, W. T., Cao, J. J., Long, X., Su, X. L., Zhao, S. Y., Wang, Q. Y., and Li, G. H.: Effect of heavy haze and aerosol pollution on rice and wheat productions in China, Sci. Rep., 6, 29612, https://doi.org/10.1038/srep29612, 2016.
US Embassy Beijing: Surface daily PM2.5 concentrations for the Beijing, Shanghai, Guangzhou, and Chengdu, US Department of State, available at: http://www.stateair.net/web/historical/1/1.html, last access: 3 January 2019.
Wang, H. J.: On assessing haze attribution and control measures in China, Atmos. Ocean. Sci. Lett., 11, 120–122, 2018.
Wang, H.-J. and Chen, H.-P.: Understanding the recent trend of haze pollution in eastern China: roles of climate change, Atmos. Chem. Phys., 16, 4205–4211, https://doi.org/10.5194/acp-16-4205-2016, 2016.
Wang, H. J., Chen, H. P., and Liu, J. P.: Arctic sea ice decline intensified haze pollution in eastern China, Atmos. Ocean. Sci. Lett., 8, 1–9, 2015.
Wang, H. J., Sun, J. Q., Chen, H. P., Zhu, Y. L., Zhang, Y., Jiang, D. B., Lang, X. M., Fan, K., Yu, E. T., and Yang, S.: Extreme climate in China: facts, simulation and projection, Meteorol. Z., 21, 279–304, 2012.
Wang, X., Dickinson, R., Su, L., Zhou, C., and Wang, K.: PM2.5 pollution in China and how it has been exacerbated by terrain and meteorological conditions, B. Am. Meteorol. Soc., 99, 105–119, 2018.
World Health Organization: Air quality guidelines: Global update 2005, World Health Organization Rep., 496 pp., https://www.who.int/phe/health_topics/outdoorair/outdoorair_aqg/en/ (last access: 3 January 2019), 2014.
Xiao, D., Li, Y., Fan, S. J., Zhang, R. H., Sun, J. R., and Wang, Y.: Plausible influence of Atlantic Ocean SST anomalies on winter haze in China, Theor. Appl. Climatol., 122, 249–257, 2015.
Xu, Y. Y. and Lin, L.: Pattern scaling based projections for precipitation and potential evapotranspiration: sensitivity to composition of GHGs and aerosols forcing, Clim. Change, 140, 635–647, 2017.
Xu, Y. Y. and Lamarque, J. F.: Isolating the meteorological impact of 21st century GHG warming on the removal and atmospheric loading of anthropogenic fine particulate matter pollution at global scale, Earth's Future, 6, 428–440, 2018.
Xu, Y. Y., Lamarque, J. F., and Sanderson, B. M.: The importance of aerosol scenarios in projections of future heat extremes, Clim. Change, 146, 393–406, 2018.
Yang, Y., Liao, H., and Lou, S. J.: Increase in winter haze over eastern China in recent decades: roles of variations in meteorological parameters and anthropogenic emissions, J. Geophys. Res. Atmos., 121, 13050–13065, 2016.
Yang, Y., Russell, L. M., Lou, S. J., Liao, H., Guo, J. P., Liu, Y., Singh, B., and Ghan, S. J.: Dust-wind interactions can intensify aerosol pollution over eastern China, Nat. Commun., 8, 15333, https://doi.org/10.1038/ncomms15333, 2017a.
Yang, Y., Wang, H., Smith, S. J., Ma, P.-L., and Rasch, P. J.: Source attribution of black carbon and its direct radiative forcing in China, Atmos. Chem. Phys., 17, 4319-4336, https://doi.org/10.5194/acp-17-4319-2017, 2017b.
Yang, Y., Wang, H., Smith, S. J., Easter, R., Ma, P.-L., Qian, Y., Yu, H., Li, C., and Rasch, P. J.: Global source attribution of sulfate concentration and direct and indirect radiative forcing, Atmos. Chem. Phys., 17, 8903–8922, https://doi.org/10.5194/acp-17-8903-2017, 2017c.
Yin, Z. C. and Wang, H. J.: The relationship between the subtropical Western Pacific SST and haze over North-Central North China Plain, Int. J. Climatol., 36, 3479–3491, 2016.
Yin, Z., Wang, H., and Chen, H.: Understanding severe winter haze events in the North China Plain in 2014: roles of climate anomalies, Atmos. Chem. Phys., 17, 1641–1651, https://doi.org/10.5194/acp-17-1641-2017, 2017.
Yin, Z. C., Wang, H. J., and Yuan, D. M.: Interdecadal increase of haze in winter over North China and the Huang-huai area and the weakening of the East Asia winter monsoon, Chin. Sci. Bull., 60, 1395–1400, 2015 (in Chinese).
Zhang, R. H., Li., Q., and Zhang, R. N.: Meteorological conditions for the persistent severe fog and haze event over eastern China in January 2013, Sci. China Earth Sci., 57, 26–35, 2014.
Zhang, Y., Ding, A. J., Mao, H. T., Nie, W., Zhou, D. R., Liu, L. X., Huang, X., and Fu, C. B.: Impact of synoptic weather patterns and inter-decadal climate variability on air quality in the North China plain during 1980–2013, Atmos. Environ., 124, 119–128, 2016a.
Zhang, Z., Zhang, X., Gong, D., Kim, S.-J., Mao, R., and Zhao, X.: Possible influence of atmospheric circulations on winter haze pollution in the Beijing–Tianjin–Hebei region, northern China, Atmos. Chem. Phys., 16, 561–571, https://doi.org/10.5194/acp-16-561-2016, 2016b.
Zhao, S., Li, J. P., and Sun, C.: Decadal variability in the occurrence of wintertime haze in central eastern China tied to the Pacific Decadal Oscillation, Sci. Rep., 6, 27424, https://doi.org/10.1038/srep27424, 2016.
Zhao, S. Y., Zhang, H., and Xie, B.: The effects of El Niño-Southern Zhao, S., Zhang, H., and Xie, B.: The effects of El Niño–Southern Oscillation on the winter haze pollution of China, Atmos. Chem. Phys., 18, 1863–1877, https://doi.org/10.5194/acp-18-1863-2018, 2018.