the Creative Commons Attribution 4.0 License.
the Creative Commons Attribution 4.0 License.
 | 20 Feb 2019
Droplet activation behaviour of atmospheric black carbon particles in fog as a function of their size and mixing state
Ghislain Motos
Julia Schmale
Joel C. Corbin
Marco Zanatta
Urs Baltensperger
Among the variety of particle types present in the atmosphere, black carbon (BC), emitted by combustion processes, is uniquely associated with harmful effects to the human body and substantial radiative forcing of the Earth. Pure BC is known to be non-hygroscopic, but its ability to acquire a coating of hygroscopic organic and inorganic material leads to increased diameter and hygroscopicity, facilitating droplet activation. This affects BC radiative forcing through aerosol–cloud interactions (ACIs) and BC life cycle. To gain insights into these processes, we performed a field campaign in winter 2015–2016 in a residential area of Zurich which aimed at establishing relations between the size and mixing state of BC particles and their activation to form droplets in fog. This was achieved by operating a CCN counter (CCNC), a scanning mobility particle sizer (SMPS), a single-particle soot photometer (SP2) and an aerosol chemical speciation monitor (ACSM) behind a combination of a total- and an interstitial-aerosol inlet.
Our results indicate that in the morning hours of weekdays, the enhanced traffic emissions caused peaks in the number fraction of externally mixed BC particles, which do not act as CCN within the CCNC. The very low effective peak supersaturations (SSpeak) occurring in fog (between approximately 0.03 % and 0.06 % during this campaign) restrict droplet activation to a minor fraction of the aerosol burden (around 0.5 % to 1 % of total particle number concentration between 20 and 593 nm) leading to very selective criteria on diameter and chemical composition. We show that bare BC cores are unable to activate to fog droplets at such low SSpeak, while BC particles surrounded by thick coating have very similar activation behaviour to BC-free particles. Using simplified κ-Köhler theory combined with the ZSR mixing rule assuming spherical core–shell particle geometry constrained with single-particle measurements of respective volumes, we found good agreement between the predicted and the directly observed size- and mixing-state-resolved droplet activation behaviour of BC-containing particles in fog. This successful closure demonstrates the predictability of their droplet activation in fog with a simplified theoretical model only requiring size and mixing state information, which can also be applied in a consistent manner in model simulations.
- Article
(5283 KB) - Full-text XML
-
Supplement
(43147 KB) - BibTeX
- EndNote


Black carbon (BC) is formed during the incomplete combustion of fossil and biogenic fuels in anthropogenic sources (e.g. on-road and off-road diesel vehicles, residential heating) and natural sources (natural wildfires and smoldering peat fires). According to a recent study based on emission inventory modelling (Klimont et al., 2017), 75 % of the global atmospheric BC mass in the year 2010 originated from human activities. It should be noted that the authors of this study did not perform any formal uncertainty analysis. Although BC represents a small fraction of the atmospheric particulate matter (typically around 10 % by mass; Putaud et al., 2004 and Lanz et al., 2010 over Europe; Hueglin et al., 2005 in Switzerland), it possesses unique properties that lead to strong impacts on health and climate. Indeed, sufficient evidence has now been brought to link exposure to BC with cardiopulmonary morbidity and mortality (World Health Organization, 2012). Concerning the impacts on climate, BC has been shown to influence the Earth's climate via both aerosol–radiation interactions (ARIs, industrial-era forcing of +0.71 W m−2, 90 % uncertainty range: +0.08 to +1.27 W m−2; Bond et al., 2013) and aerosol–cloud interactions (ACIs, industrial-era forcing of +0.23 W m−2, 90 % uncertainty range: −0.47 to +1.0 W m−2; Bond et al., 2013). The high uncertainties attached to these estimates originate from the low level of confidence in understanding and quantifying the atmospheric processes in which BC is involved, particularly with respect to aerosol–cloud interactions (Bond et al., 2013). The internal mixing of BC with other material is a key factor affecting its radiative forcing, since it has impacts on both ARIs and ACIs of BC. Such internal mixing focuses incident solar radiation to the BC core and results in an increase in its mass-specific absorption (Bond et al., 2006; Lund et al., 2017; Cappa et al., 2012). Throughout this study, we refer to BC mixing state in relation to coatings, i.e. a strong degree of internal mixing is associated with thick coatings whereas externally mixed BC is associated with no or very thin coatings. The atmospheric lifetime of BC is also influenced by its mixing state through nucleation scavenging (Lund et al., 2017). This is of major importance, as an increased lifetime allows for interactions with the solar radiation during a longer time window (Hodnebrog et al., 2014). Lund et al. (2017) modelled the changes of global mean ARI-induced radiative forcing (RFari) when varying the amount of coating required for a particle to pass from the non-hygroscopic mode (unactivated) to the hygroscopic mode (activated to a droplet). They reported changes up to 25 %–50 % of the RFari compared to the baseline simulation. It is therefore of major importance to better assess the dependence of the BC activation behaviour on its size and mixing state.
General definitions of fog include two criteria for suspended water droplets to be called fog: a vicinity to the Earth's surface and a reduction of visibility below 1 km (e.g. Glickman, 2000; National Oceanic and Atmospheric Administration, NOAA, 1995). Fog is a type of cloud which forms upon isobaric processes. The detailed microphysics associated with these processes can be found in Pruppacher and Klett (1980). On a global scale, fog is relatively sparse (total amount of 1 % over both sea and land; Warren et al., 2015) but its spatial coverage is highly variable around the globe, up to an amount of 40 % (Gordon et al., 1994; Lange et al., 2003; Syed et al., 2012).
Depending on the process of formation, different types of fog can be distinguished: radiation fog, advection fog, sea and steam fog, mixing fog, and ice fog. The most common type is radiation fog, which is formed by isobaric infrared cooling of the Earth's surface. The air in contact with the surface is then cooled by conduction, decreasing the temperature of the humid boundary layer air by atmospheric mixing. If the dew point temperature of the air mass is reached, fog forms. The required meteorological conditions are clear skies and wind speed below 0.5–1 m s−1 (Roach et al., 1976; Mason, 1982). Therefore, radiation fog generally occurs after sunset, but can persist all day in winter, if not dissipated by solar radiation. Several field studies have been performed to investigate the physical processes of fog formation and dynamics (Haeffelin et al., 2010) and the evolution of chemical species in the presence of fog (Fuzzi et al., 1992). The cooling of an air parcel below its dew point results in the supersaturation (SS) of water vapour. Droplet activation of an aerosol particle occurs when the SS of the surrounding water vapour exceeds its critical supersaturation (SScrit), thereby forming a cloud or a fog droplet.
BC is most often emitted bare or mixed with only small amounts of other materials; at this stage it hardly undergoes hygroscopic growth at elevated relative humidity (RH) because BC is water-insoluble (Weingartner et al., 1997; Gysel et al., 2003). Several recent chamber and field studies showed that the subsequent acquisition of water-soluble coatings, by condensation and coagulation of organic and inorganic materials, enhances the hygroscopicity of these BC-containing particles and allows droplet activation at atmospherically relevant SS (e.g. Tritscher et al., 2011; Liu et al., 2013; Wittbom et al., 2014). The fate of BC particles in fog has also been studied, mostly by comparing scavenging efficiencies of BC with other species. Hallberg et al. (1992), Noone et al. (1992) and Facchini et al. (1999) showed that elemental carbon (EC) is preferentially found in interstitial particles rather than in fog droplets, while Gundel et al. (1994) found evidence supporting the hypothesis that organic compounds could enhance the incorporation of BC into fog droplets. Results from Collett et al. (2008) indicate that the scavenged fraction of BC is higher for wood smoke emissions than for vehicle exhaust emissions. A single-particle analysis of BC in low-altitude stratocumulus clouds, in which low SSpeak values were retrieved, showed that the activation of BC was made possible by the presence of coatings (Schroder et al., 2015). However, the technical complexity of such measurements did not yet allow for a precise quantification of the activation behaviour of BC as a function of its size and coating thickness (Δcoating).
Few model studies have represented the role of BC in aerosol–cloud/fog interactions (Bond et al., 2013). Although BC can dissipate fog through the semi-direct effect (evaporation of fog droplets due to absorption of solar radiation by BC particles and subsequent droplet evaporation), high concentrations of other CCN were shown to influence fog lifetime in a stronger manner (Maalick et al., 2016). Because these CCN form droplets more efficiently, they lead to increased radiative cooling and decreased droplet removal through sedimentation, thus enhancing fog lifetime. To simulate the cloud properties of ambient particles, the increase in hygroscopicity of BC has to be accurately represented, meaning that the models need realistic mixing-state schemes. Due to the scarcity of instruments that can provide this type of information and to high computational costs, these properties are often modelled in a highly simplified manner. The conversion from hydrophobic to hydrophilic BC (which may lead to droplet activation) was originally considered to happen after a fixed lifetime (Koch et al., 2009). This conversion has recently been treated as a variable depending on, for example, particle concentration in many particle-resolved models (e.g. Riemer et al., 2009). The results from these recent simulations emphasized the importance of accurately simulating the increase in BC hygroscopicity with aging in order to get realistic assessments of the corresponding concentrations and radiative forcing, with crucial implications for specific research questions such as the estimation of the climate impact of BC in highly polluted regions (e.g. eastern Asia; Matsui, 2016) or the transport of BC to the Arctic (Liu et al., 2011).
Significant efforts are needed to reach a better understanding of the evolution of the mixing state of BC after emission, and quantify the links between mixing state and droplet activation. Laboratory studies recently started to address this question (e.g. Dalirian et al., 2018) but very few studies reported ambient measurements. Urban areas contain a variety of BC sources, making them favourable sites to study different mixing states of BC. Furthermore, the occurrence and stability of fog at ground level in these areas facilitates the study of the activation behaviour of BC. In this study, we first focus on the size-dependent mixing state and hygroscopicity of aerosol particles emitted in winter at an urban site, before establishing quantitative links between particle diameter, mixing state and droplet activation of BC-containing particles. Then, we estimate the SScrit of BC-containing particles using a theoretical approach based on a core–shell model and compare the predicted activation behaviour with in situ field measurements of droplet activation in fog. We found agreement between predicted droplet activation of BC, constrained with measured particle size and BC volume fraction, and observed droplet activation in the fog. This finding justifies the simplified description of BC activation in model simulations based on particle size and BC volume fraction using κ-Köhler theory.
2.1 Measurement period and site
The field campaign took place at the Irchel campus of the University of Zurich, located 2.5 km north of the city centre (47∘23′43′′ N, 8∘32′55′′ E) during winter 2015–2016. A satellite picture of the site is shown in Fig. S1 in the Supplement. The data presented here come from measurements performed over the period from 6 November 2015 to 31 January 2016. The instruments used for this campaign ran in an 11.2 m3 air-conditioned stationary trailer.
The Irchel campus is located within a residential area of Zurich; the closest industries or agricultural fields are located 2 km away from the measurement site. One of the most used highways in Switzerland passes eastward and northward of the measurement site (see Fig. S1), the closest point being 2.5 km northeast (96 877 to 142 074 car counts in total in December 2015, depending on the exact location; source: SARTC). Smaller busy roads are found around 200 m northward and westward of the site. In addition, wood burning emissions from domestic heating are also expected to contribute to the anthropogenic aerosol loading at this location during wintertime.
The Swiss plateau is known for a high frequency of fog events occurring during winter. For example, during the period 1901–2012, continuous fog or low stratus presence during a full 24 h period was observed on average 17 days in total in Zurich in the months from September to March (28 days with at least half-day occurrence; Scherrer and Appenzeller, 2014). Thus, due to the high frequency of foggy conditions and the presence of mixed sources, this measurement site was chosen.
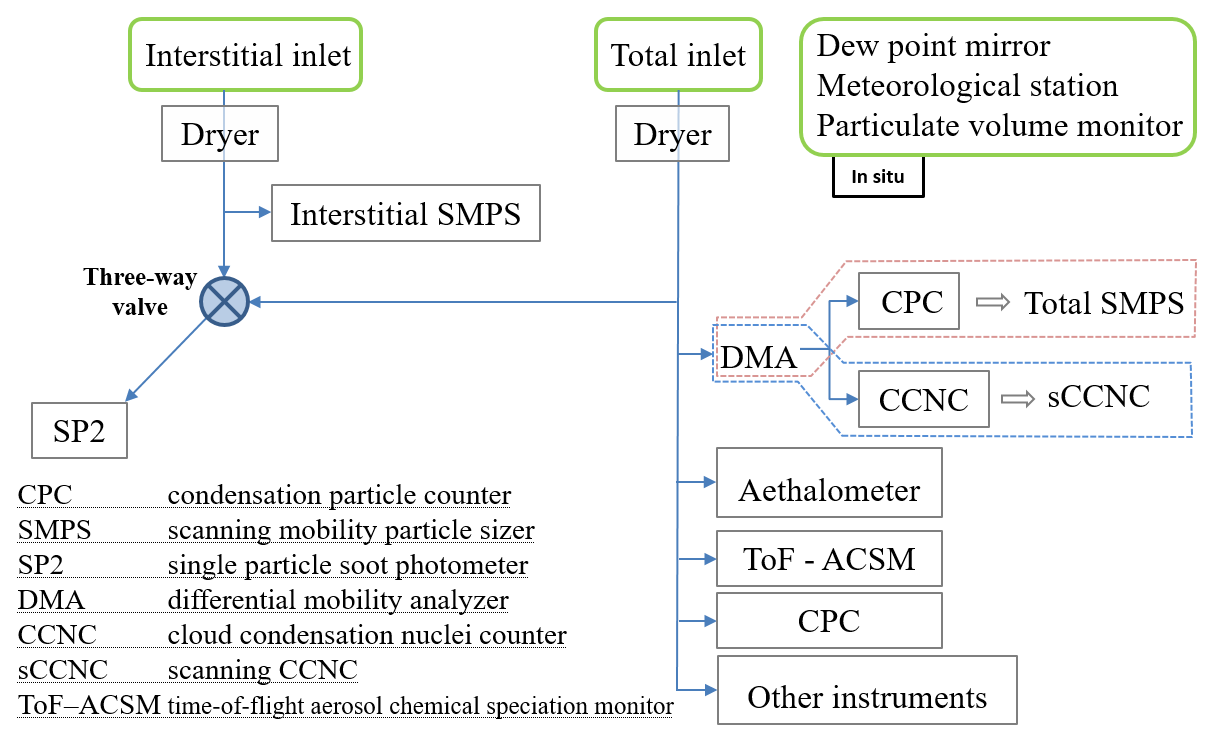
Figure 1Scheme of the instrumental setup. The SMPS is a DMA–CPC assembly and the sCCNC a DMA-CCNC assembly.
2.2 Instrumentation
During this campaign, 2 different inlets and 12 instruments were used (Fig. 1). All aerosol particles, including fog droplets, were sampled through a hood-shaped total inlet with a flow rate of 4.8 L min−1, approximately 3 m above the ground. Hammer et al. (2014b; Supplement) showed that systematic biases in the observed activation cut-off diameter, potentially resulting from incomplete collection efficiency of fog droplets in the total inlet, remain below 10 %. At the same height 1 m away, an interstitial inlet sampled non-activated particles with a flow rate of approximatively 16.7 L min−1. This inlet included an aerodynamic size discriminator removing all large particles and hydrometeors (Very Sharp Cut Cyclone, BGI, Butler, NJ, USA; described in Kenny et al., 2000). Laboratory tests showed small variations in the cut-off diameter (2.2 to 2.4 µm) for flow rates between 15.7 and 17.7 L min−1. This range of cut-off is close to the value of 2.6 µm recommended by Hammer et al. (2014b) for separating hydrated (but non-activated) particles from fog droplets. Setting the cut-off between the diameter modes of non-activated (but hydrated) particles and fog droplets is very important for obtaining reliable results. If it is set too high, activated droplets may enter the interstitial line and the resulting curve of the size-dependent activated fraction of particles gets flattened; if it is set too low, non-activated but large-solution droplets may be removed by the inlet, resulting in an artificially increased activated fraction. Due to the different particle losses in the interstitial and the total lines, scaling factors were calculated using the ratios of the total to the interstitial particle number size distributions over fog-free, sunny periods, during which these size distributions should be identical below the interstitial inlet cut-off diameter. For each fog event, scaling factors were calculated before and after the event, averaged, and then used during the event to correct the particle number size distribution behind the interstitial inlet. For the single-particle soot photometer (SP2), a scaling factor of 1.16, independent of particle diameter, was used until 17 December (on that day, a thin tubing causing a pressure drop was replaced by a thicker one; after that day, the measured scaling factor was 1.03; see Fig. S2a). For the scanning mobility particle sizer instruments, size-dependent scaling factors were calculated for each fog event in order to take into account both the different line losses behind each inlet and the internal measurement errors of each scanning mobility particle sizer (SMPS) (see Fig. S2b).
Aerosols from both inlets were then led inside the trailer by stainless steel tubes and dried with vertically positioned diffusion driers, before being brought to the instruments with electrically conductive tubing. These driers were needed to keep the relative humidity below 40 % inside the measurement lines, as recommended by the World Meteorological Organization's Global Atmosphere Watch (World Meteorological Organization, 2016). The temperature increase from outside (∼0 ∘C) to inside (∼25 ∘C) the trailer also contributed to the drying of the sample air and thus evaporation of fog droplet water. Some evaporation artefacts of other semi-volatile aerosol components cannot be excluded. However, they are not expected to be excessive for particles in the upper accumulation mode size range, based on results by Nessler et al. (2003) for comparable temperature difference but at a different location.
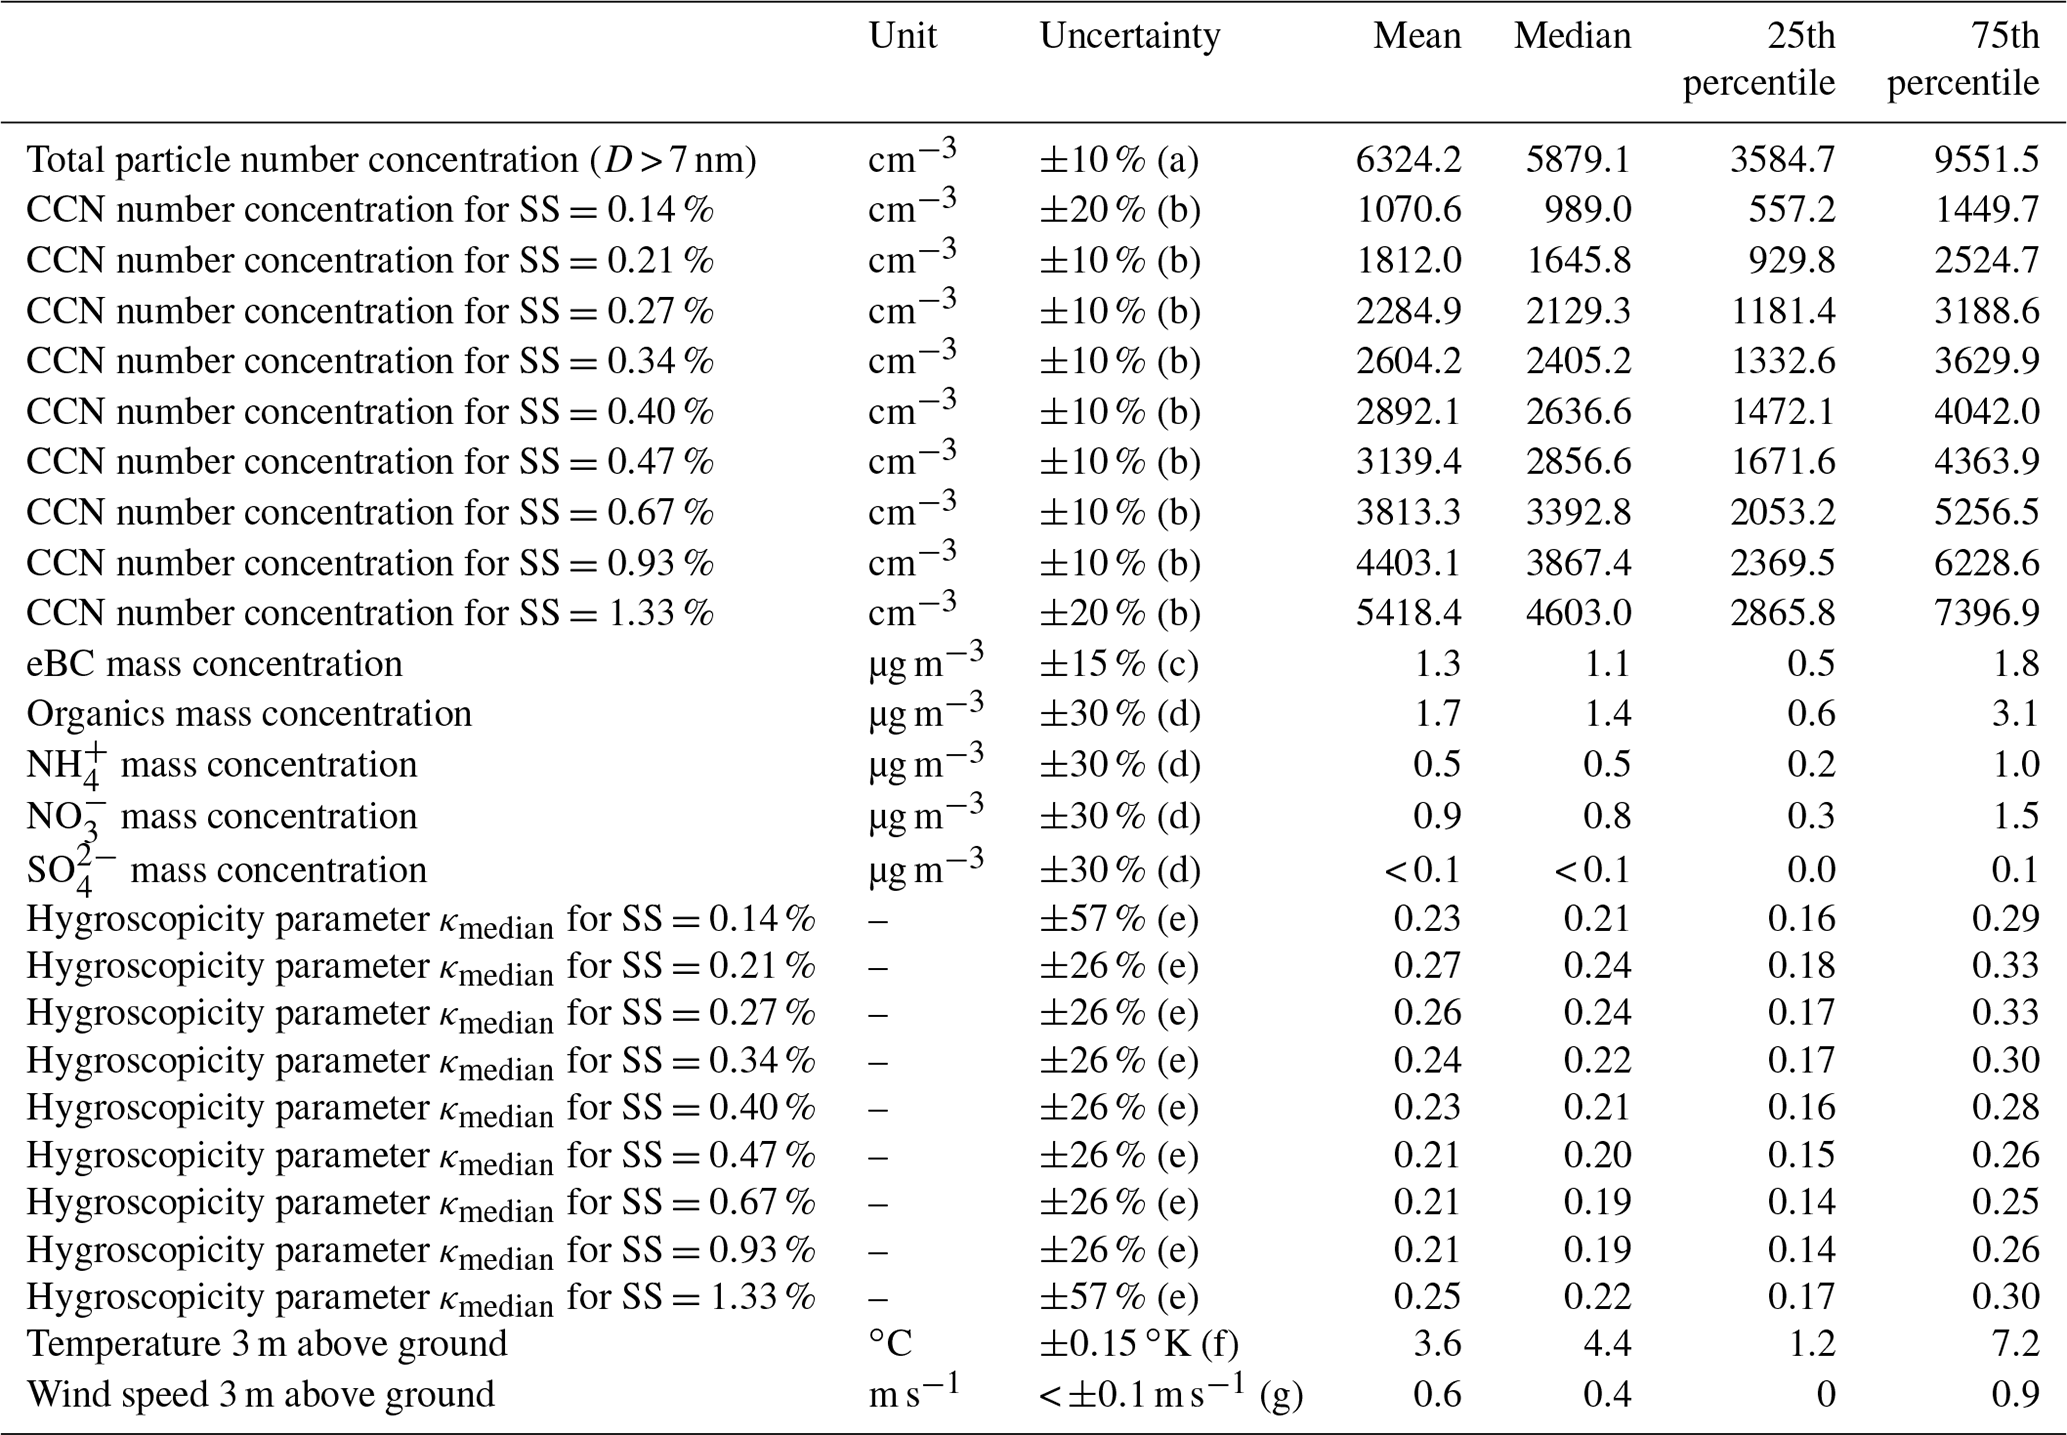
Table 1Statistics of various measured and inferred parameters from data covering the whole campaign. Uncertainties: (a) in the CPC model 3022 according to the ACTRIS standard operation procedures (SOP; http://fp7.actris.eu/Portals/97/deliverables/PU/WP3_D3.13_M24.pdf, last access: 17 January 2019); (b) see Sect. 2.2.1; (c) instrument precision only (see Sect. 2.2.3); (d) based on the studies of Middlebrook et al. (2012) and Budisulistiorini et al. (2014); (e) based on the accuracy of the SS set by the CCNC and the uncertainty in the retrieval of ; (f) reported as accuracy in the instrument manual of Meteolabor AG (http://www.meteolabor.ch/meteo-messgeraete/temperatur/, last access: 17 January 2019); (g) based on the study of Makkonen et al. (2001).
2.2.1 Scanning cloud condensation nuclei number and sCCNC-activated fractions
In order to get size-dependent information on the hygroscopic properties of ambient particles, a scanning cloud condensation nuclei counter (sCCNC) sampled air behind the total inlet. The sCCNC consists of a differential mobility analyzer (DMA, model TSI long, TSI Inc., Shoreview, MN, USA) scanning the particle mobility diameter range from 20 to 593 nm in 5.5 min, after which the monodisperse aerosol is split between a CCNC (model CCN-100, Droplet Measurement Technologies, Longmont, CO, USA; Roberts and Nenes, 2005) and a condensation particle counter (CPC model 3022, TSI Inc., Shoreview, MN, USA). The assembly DMA–CPC can also be used as a scanning mobility particle sizer (SMPS) and provides the particle number size distribution behind the total inlet. The CCNC changes SS every 11 min, covering nine SSs: 0.14 %, 0.21 %, 0.27 %, 0.34 %, 0.40 %, 0.47 %, 0.67 %, 0.93 % and 1.33 %. Scans with unstable temperature in the CCNC chamber were removed from the analysis. The CCNC was calibrated before and after the campaign on 13 August 2015 and 23 March 2016, respectively, using size-selected ammonium sulfate. Both calibration curves agreed within 5 % (relative) with each other and are in good agreement with the instrument history for the range between 0.1 % and 1.0 % SS. This agreement is better than the estimated calibration accuracy of ∼10 %. As discussed later, the CCNC was also operated at SS =1.33 % during the campaign. Higher uncertainty in ±20 % was assigned to this supersaturation to allow for extrapolation uncertainty, which may have caused larger bias for data derived from measurements at this SS. The uncertainties on CCN concentrations measured by the CCNC (Table 1) are based on the study of Rose et al. (2008); they are higher at SS below 0.14 %, following the instructions from the ACTRIS standard operation procedures (http://fp7.actris.eu/Portals/97/deliverables/PU/WP3_D3.13_M24.pdf, last access: 15 January 2019). The sCCNC, which was presented by Moore et al. (2010), was used, for example, in a semi-urban environment by Jurányi et al. (2013) and in a boreal forest by Paramonov et al. (2013) and permits the comparison of particle number size distribution and CCN number size distribution with a time resolution of 5.5 min for a fixed SS. Activated fractions were calculated from these two size distributions after correcting both measurements for multiple charging. They are referred to as sCCNC-activated fractions.
2.2.2 Particle number and size distribution
A second SMPS, which combined the same models of DMA and CPC as the one sampling behind the total inlet, was used behind the interstitial inlet but scanned over a larger mobility diameter range from 19 to 807 nm. The comparison of particle number size distributions behind the total and interstitial inlets allows for the calculation of the dry activation cut-off diameter, as explained in Sect. 2.3.3, which is related to the ambient SS present when the fog formed.
2.2.3 Black carbon
A single-particle soot photometer (Droplet Measurement Technologies, Longmont, CO, USA) upgraded to eight-channel Revision C version was the only instrument switching between the total and interstitial inlet, through an automated three-way valve, with a 20 min alternation. Detailed information about the SP2 can be found in Moteki and Kondo (2007), Schwarz et al. (2006) or Stephens et al. (2003). Briefly, the SP2 carries the aerosol sample flow (0.12 L min−1) through a high-intensity intra-cavity Nd:YAG laser with a wavelength of 1064 nm, making BC particles incandesce (detection by two photomultipliers) until they vaporize. An avalanche photodiode is used to detect elastically scattered light. A second multi-photodiode was used as a split detector, providing information on the position of particles in the laser beam (Gao et al., 2007). The peak intensity of the thermal radiation is proportional to the refractory BC (rBC) mass in the particles, from which the rBC mass equivalent diameter (DrBC with a limit of detection around 50 nm) is inferred assuming spherical shape. The respective lower limits of quantification are ∼0.32 fg translating to ∼70 nm (note that smaller BC cores can also be detected with a detection efficiency of less than unity). At the upper end, BC size distributions are only shown up to 300 nm in diameter, due to insufficient counting statistics at larger sizes.
The peak amplitude of the elastically scattered light is used for optical sizing of BC-free particles from 130 to 380 nm. The SP2 was calibrated before and after the campaign using mobility diameter selected fullerene soot for rBC mass (mobility–mass relationship taken from Gysel et al., 2011) and polystyrene latex spheres (PSL, 269 nm) for the scattering detector. The laser monitor did not indicate a laser power drift and the calibration coefficient for the scattering detector varied by less than 2 % between the two calibrations; therefore a constant calibration coefficient was applied for the whole campaign. Calibrated scattering cross section measurements of BC-free particles were converted to optical diameters (Dopt) assuming spherical particles with a refractive index of 1.50+0i at 1064 nm. With this choice, the particle number size distributions measured by the SMPS and the SP2 agree well in the overlapping size range (not shown) and optical sizing is only weakly sensitive to the applied refractive index (Taylor et al., 2015).
The presence of different types of detectors in the SP2 provides an opportunity to obtain information on the BC mixing state on a single-particle level. When an internally mixed BC-containing particle enters the laser beam, it heats up and the coating evaporates resulting in a reduction of the scattering cross section, followed by further heating of the remaining BC core until the BC boiling point is reached and the BC core starts evaporating. The peak incandescent signal occurs when the BC boiling point is reached. As laser intensity increases and scattering cross section decreases when the particle enters the laser beam, the peak scattering signal can either occur a few microseconds before peak incandescence when coating evaporation begins or at peak incandescence when BC core evaporation begins. The time difference between scattering and incandescence peak signals, commonly referred to as the delay time, can be used for a binary distinction between BC particles with thick coatings (> 70 % coating by volume according to unpublished data from our laboratory) and BC particles with moderate or no coating at all (Moteki et al., 2007).
A second, more quantitative method to determine Δcoating was proposed by Gao et al. (2007): the leading-edge-only (LEO) fit. As BC-containing particles evaporate due to strong heating, their scattering cross section is less than the original value by the time they reach the centre of the laser beam where the peak scattering signal would occur for BC-free (i.e. non-evaporating) particles, thus disqualifying measured peak scattering amplitude for optical sizing. However, knowing the particle position in the laser beam from the split detector signal makes it possible to use the unperturbed leading edge scattering signal, i.e. before evaporation onset, for particle optical sizing. Scattering cross sections measured for BC-containing particles were converted to Dopt assuming a coated sphere morphology with BC core volume constrained from the rBC mass measurement and assuming refractive indices of 2.00+1.00i and 1.50+0i for BC core and coating, respectively. Details of the data analysis approach are provided in Laborde et al. (2012a, b). By subtracting the rBC mass equivalent core radius from the optical radius of the unperturbed particle, we obtain Δcoating. For the data analysis of the present work, we used the leading edge scattering signal at 3 % of the maximal laser intensity. This method could only be used for BC-containing and BC-free particles with an overall optical diameter between around 260 to 500 nm.
An Aethalometer (model AE 33, Magee Scientific, Berkeley, CA, USA) was placed behind the total inlet. This instrument measures the attenuation of light, at seven different wavelengths from 370 to 950 nm, passing through a filter that gets continuously loaded with ambient aerosols. The near-infrared channel at a wavelength of 880 nm was used for extracting the equivalent black carbon (eBC) mass concentration from the measured attenuation coefficient (e.g. Weingartner et al., 2003). The eBC mass concentrations reported by the instrument firmware were used without adjustment (i.e. default mass attenuation coefficient and no loading compensation). The term “eBC” is used following the recommendation by Petzold et al. (2013) in order to express that the accuracy of the inferred eBC mass concentration depends on the accuracy of the measured attenuation coefficient (e.g. shadowing effects) and accuracy of the mass attenuation cross section assumed to convert from the attenuation coefficient to the eBC mass concentration. The Environmental Technology Verification Report for the Aethalometer reported an instrument precision of ±15 % (https://www.epa.gov/etv/pubs/01_vr_aderson_aeth.pdf, last access: 15 January 2019). However, the uncertainty in Aethalometer data, largely dominated by the estimation of the mass-specific attenuation coefficient, can reach values as high as 50 %. The spectral dependence of the aerosol light absorption is commonly expressed with the absorption Ångström exponent (AAE), which we determined from the Aethalometer measurements at 470 and 880 nm. The AAE calculated in this manner can be used for black carbon source apportionment, if traffic and wood burning are the main sources and if the AAE of either source is well known (Zotter et al., 2017, and references therein).
2.2.4 Aerosol chemical composition
To get information on the chemical composition and the mass of the non-refractory submicron bulk aerosol, a time-of-flight aerosol chemical speciation monitor (ToF-ACSM; Fröhlich et al., 2013), an instrument based on the aerosol mass spectrometer technology (AMS, Aerodyne Research Inc., Billerica, MA, USA), sampled air behind the total inlet. Six calibrations were performed, including pre- and post-campaign, and standard data analysis procedures using the Tofwerk “IgorDAQ” software package (Tofwerk AG, Thun, BE, Switzerland) were applied (Fröhlich et al., 2013).
2.2.5 Cloud microphysics
Three instruments were installed on the roof of the trailer, approximately 3 m above the ground: a dew point mirror, a particulate volume monitor and a meteorological station. The dew point mirror (DPM; mirror-type dew point hygrometer VTP37 Airport, Meteolabor AG, Wetzikon, Switzerland) provided relative humidity data with a resolution of 0.1 % by measuring both the ambient temperature and the dew point temperature. This instrument is designed to measure the dew point corresponding to the total condensed and gaseous water content. Accordingly, it indicates the presence of fog when the dew point exceeds ambient temperature due to the presence of liquid water. A particulate volume monitor (PVM; Gerber, 1991), which detects the light scattering by the fog droplets in the forward direction, provided a second independent measurement of the liquid water content (LWC). A meteorology station provided data of temperature, pressure, wind speed and direction, precipitation rate, and solar flux.
2.3 Data analysis and theory
2.3.1 Fog type and definition of a fog event
The PVM and DPM were used to indicate the presence of fog. Visibility was not measured during this campaign. The LWC derived from PVM and the DPM measurements agreed within ±25 % during the campaign. We used a minimum LWC of 100 mg m−3 measured by the PVM during at least 1 h as the threshold to define fog events. Note that the LWC was not used to infer fog peak supersaturation (see Sect. 2.3.5).
Table 2Details of the four analysed fog events. Uncertainties in brackets are provided as relative errors. Uncertainties in the input parameters ( or and κmedian) were propagated using the Monte Carlo method to obtain uncertainties for SSpeak. The temperature was not varied in these simulations as it has a second-order influence on droplet activation compared to or and κmedian.
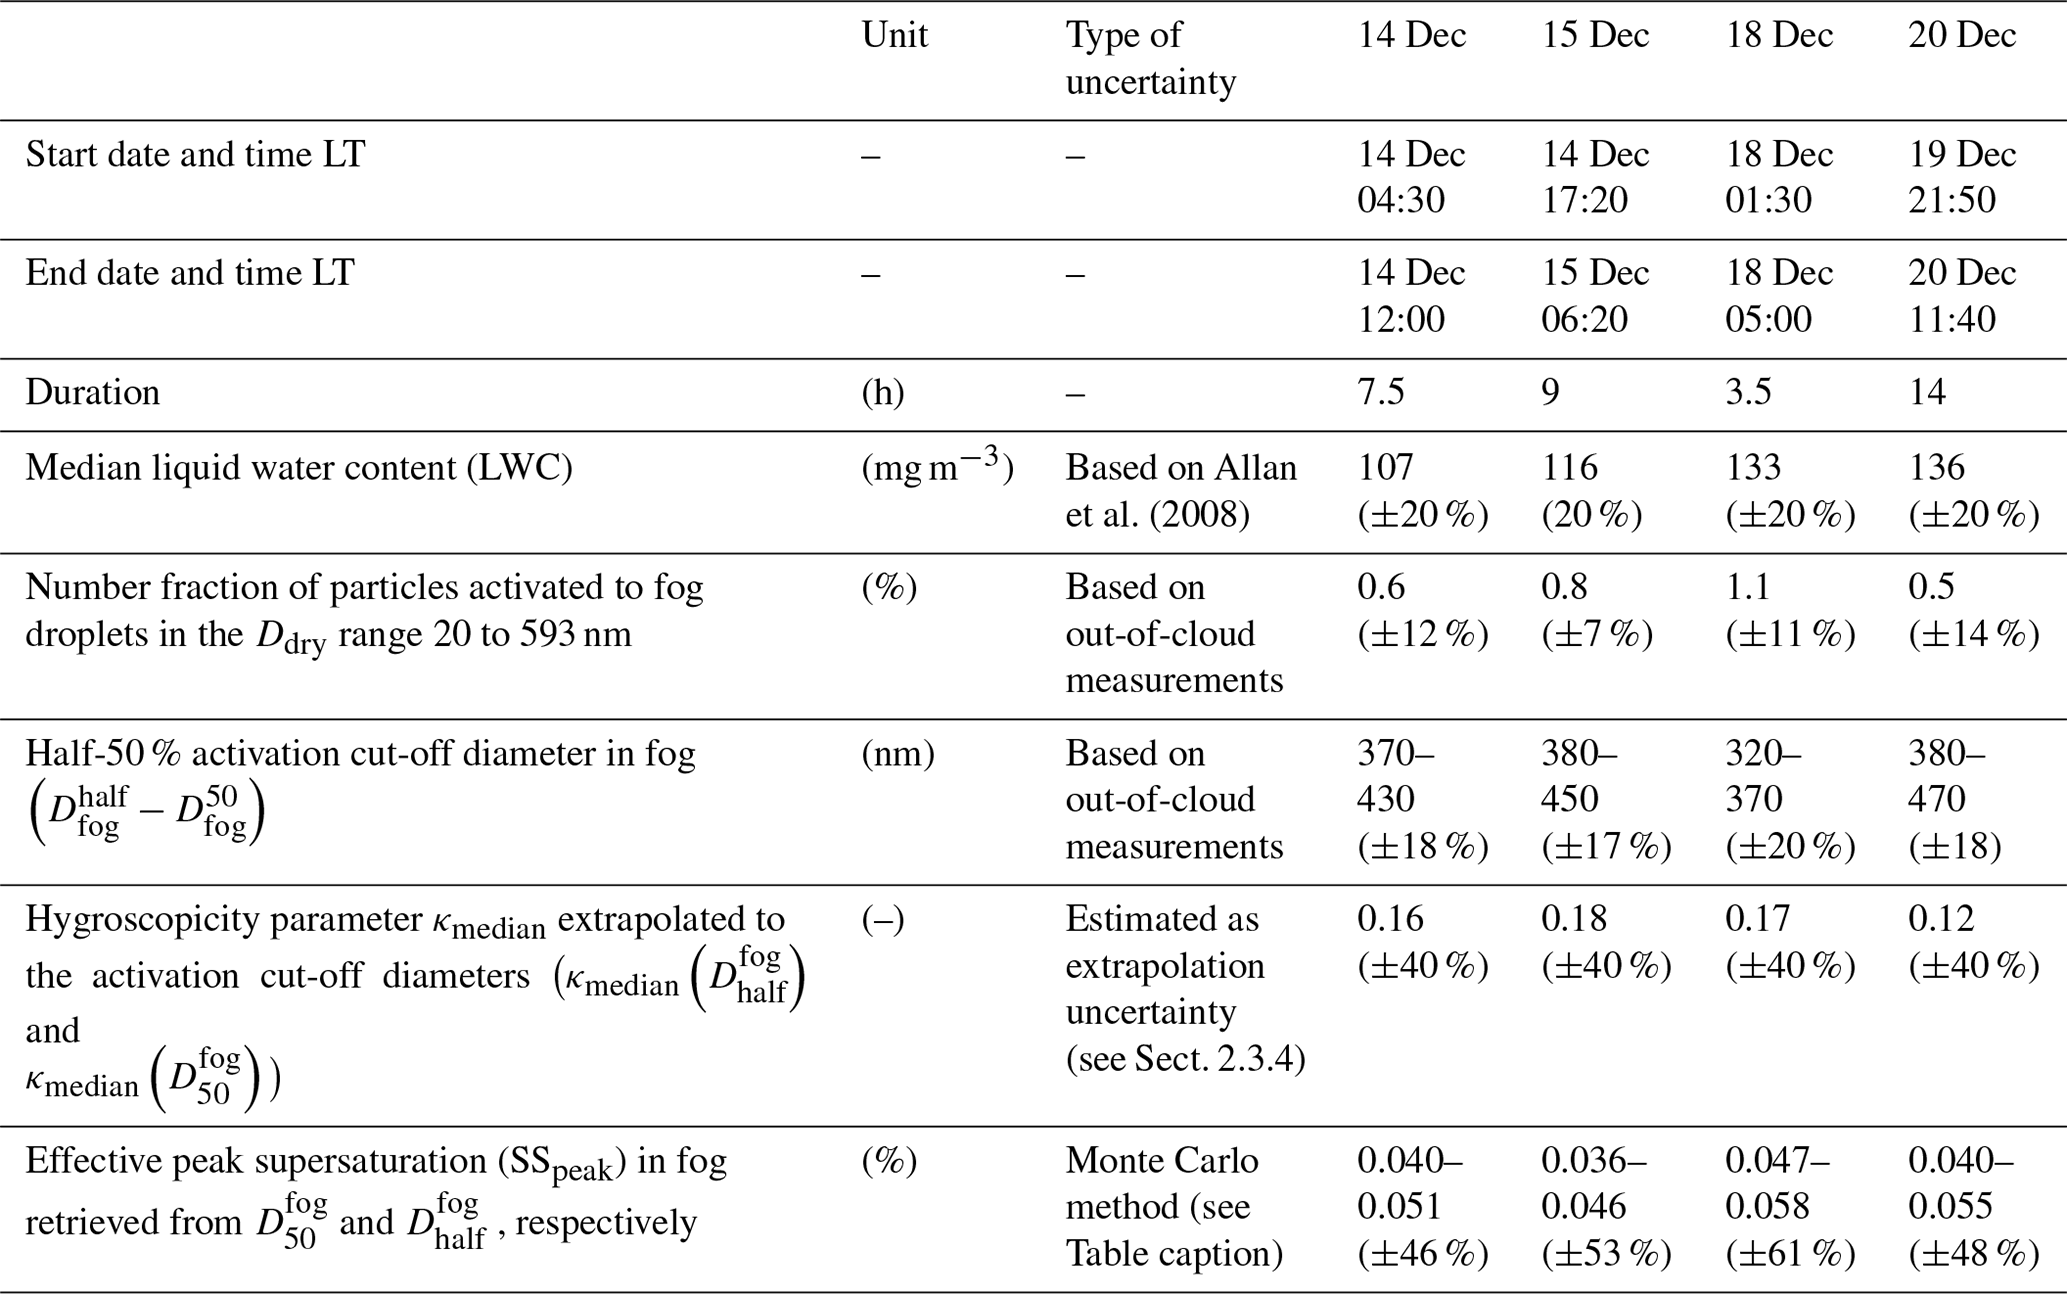
Throughout the field campaign, four fog events were retained in the analysis of the present study, all of them between 14 and 20 December 2015 (Table 2). They occurred principally during night-time (see Table 2) with low wind speed (Fig. 4). Thus, even though no classification of fog types was carried out during the campaign, it is highly probable that we only experienced radiation fogs. Other events were either too short, discontinuous, or suffered from a lack of instrumental data.
2.3.2 κ-Köhler theory and the ZSR rule
The Köhler theory (Köhler, 1936) combines the Kelvin and Raoult effects to describe the equilibrium saturation vapour pressure (RHeq) over a solution droplet. In the framework of the present study, this theory is the base for various calculations establishing a relationship between particle dry diameter (Ddry), chemical composition and SScrit for CCN activation. Petters and Kreidenweis (2007) proposed a simple semi-empirical parameterization of the Raoult effect in which the κ value is the single free parameter to describe particle hygroscopicity. The equilibrium supersaturation over the solution can then be expressed as follows:
where D is the solution droplet diameter, Ddry is the dry particle diameter, σs∕a is the surface tension of the solution–air interface (considered as pure water in our calculations), Mw and ρw are the molar mass and the density of water respectively, R is the universal gas constant, and T is the absolute temperature.
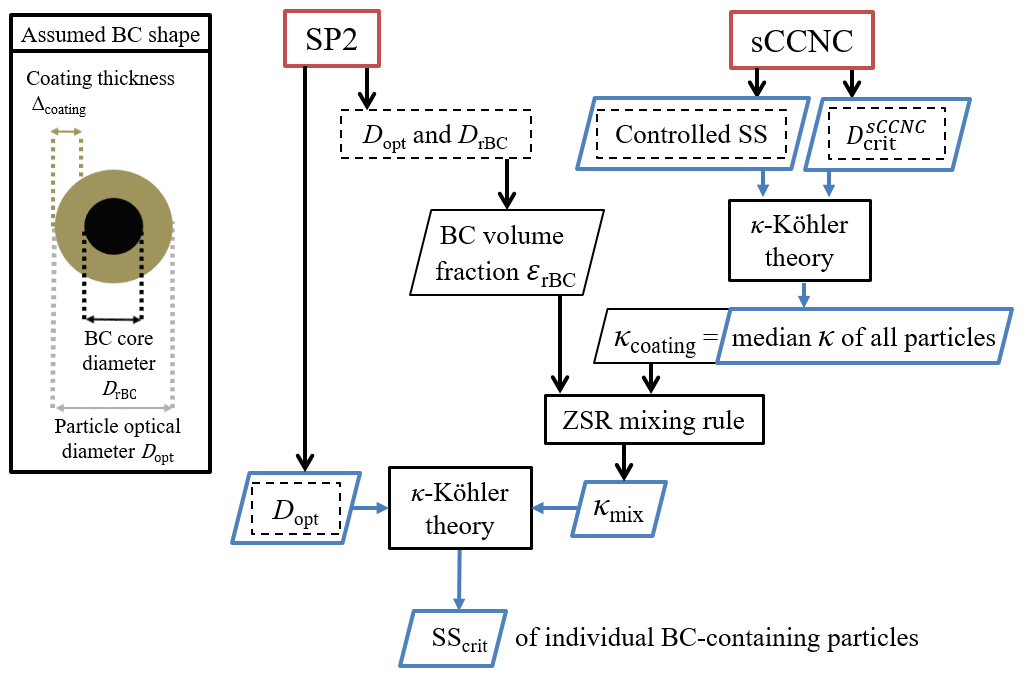
Figure 2Approach used to retrieve the SScrit of individual BC-containing particles. Red rectangles show the instruments providing the basic input parameters shown in dashed black rectangles. Blue parallelograms depict the input and output parameters of the κ-Köhler theory. Values of κcoating for individual particles are assumed to be equal to the ensemble median κ of all particles at a given size (κmedian) as derived from the sCCNC and the total SMPS data (see Sect. 2.3.4). Coated sphere morphology is assumed for both interpreting SP2 scattering signals and in the κ-Köhler theory.
Knowledge of two out of three parameters in the relationship SS allows calculating the third component by numerically solving Eq. (1). We made use of this relationship to infer the SScrit of individual BC-free as well as of BC-containing particles from their dry size and the κ value determined with the SP2 and other instruments (Fig. 2). The SP2 provides a measurement of both rBC core mass equivalent diameter (DrBC) and particle optical diameter (Dopt), which makes it possible to calculate the BC volume fraction (εrBC) for each particle falling within the relevant detection limits:
The optical particle diameter can also be expressed with DrBC and Δcoating. The rBC volume fraction is required to calculate κmix, the κ value of internally mixed particles, which is equal to the volume fraction weighted mean of the κ values of all species or component classes present in the particle (Petters and Kreidenweis, 2007), under the assumption that the Zdanovski–Stokes–Robinson (ZSR) mixing rule (Stokes and Robinson, 1966) applies for the hygroscopic growth. We treated our particles as two-component mixtures considering an insoluble BC core (κ=0) and a soluble coating to which we assigned the size-resolved median κ value () obtained from sCCNC measurements: κmedian was retrieved from the diameter at which 50 % activation is reached for a certain SS applied in the CCNC (see Sect. 2.3.4). Figure 7, which will be discussed later, indicates that κmedian is virtually not affected by variations in the number fraction of locally emitted BC particles. Instead, κmedian is representative of the hygroscopicity of the background aerosol, which has a very small BC mass fraction (e.g. Hueglin et al., 2005), and was therefore chosen as an approximation for the coating hygroscopicity. κmix then becomes
Combining Eqs. (1) and (3) makes it possible to estimate SScrit of individual BC-containing particles by applying Köhler theory and the ZSR rule to SP2 and sCCNC data providing particle size (DrBC and Δcoating), BC volume fraction εrBC and coating hygroscopicity (κcoating). These calculations are simplified in so far as spherical core–shell morphology is assumed for inferring the particle optical diameter from SP2 raw signals and for the κ-Köhler theory.
2.3.3 Retrieval of activation cut-off diameters in fog
The size-resolved activated fraction is generally defined as the number fraction of particles at a certain Ddry that formed an activated droplet. The combination of total and interstitial inlets in fog makes it possible to assess the activation of the ambient aerosol to fog droplets (Hammer et al., 2014b): under the assumption that only fog droplets were removed by the interstitial inlet, the difference between the total and interstitial particle number size distribution reflects the dry size distribution of particles that were activated. Dividing the dry size distribution of activated particles by the total size distribution provides the size-resolved activated fraction spectrum. To emphasize that this activated fraction results from instruments which measure atmospheric activation, we refer to fog-activated fraction. By contrast, we use the terms sCCNC-activated fraction and to refer to the potential activation measured at controlled SS in the sCCNC. The 50 % activation cut-off diameter () is defined as the dry particle diameter at which the fog-activated fraction reaches 50 %, whereas the half-rise activation diameter () is defined as the diameter at which half of the maximum fog-activated fraction (i.e. half of the activation plateau) is reached. If the activation plateau at large particle diameters levels off at a maximum fog-activated fraction of 100 %, then equals .
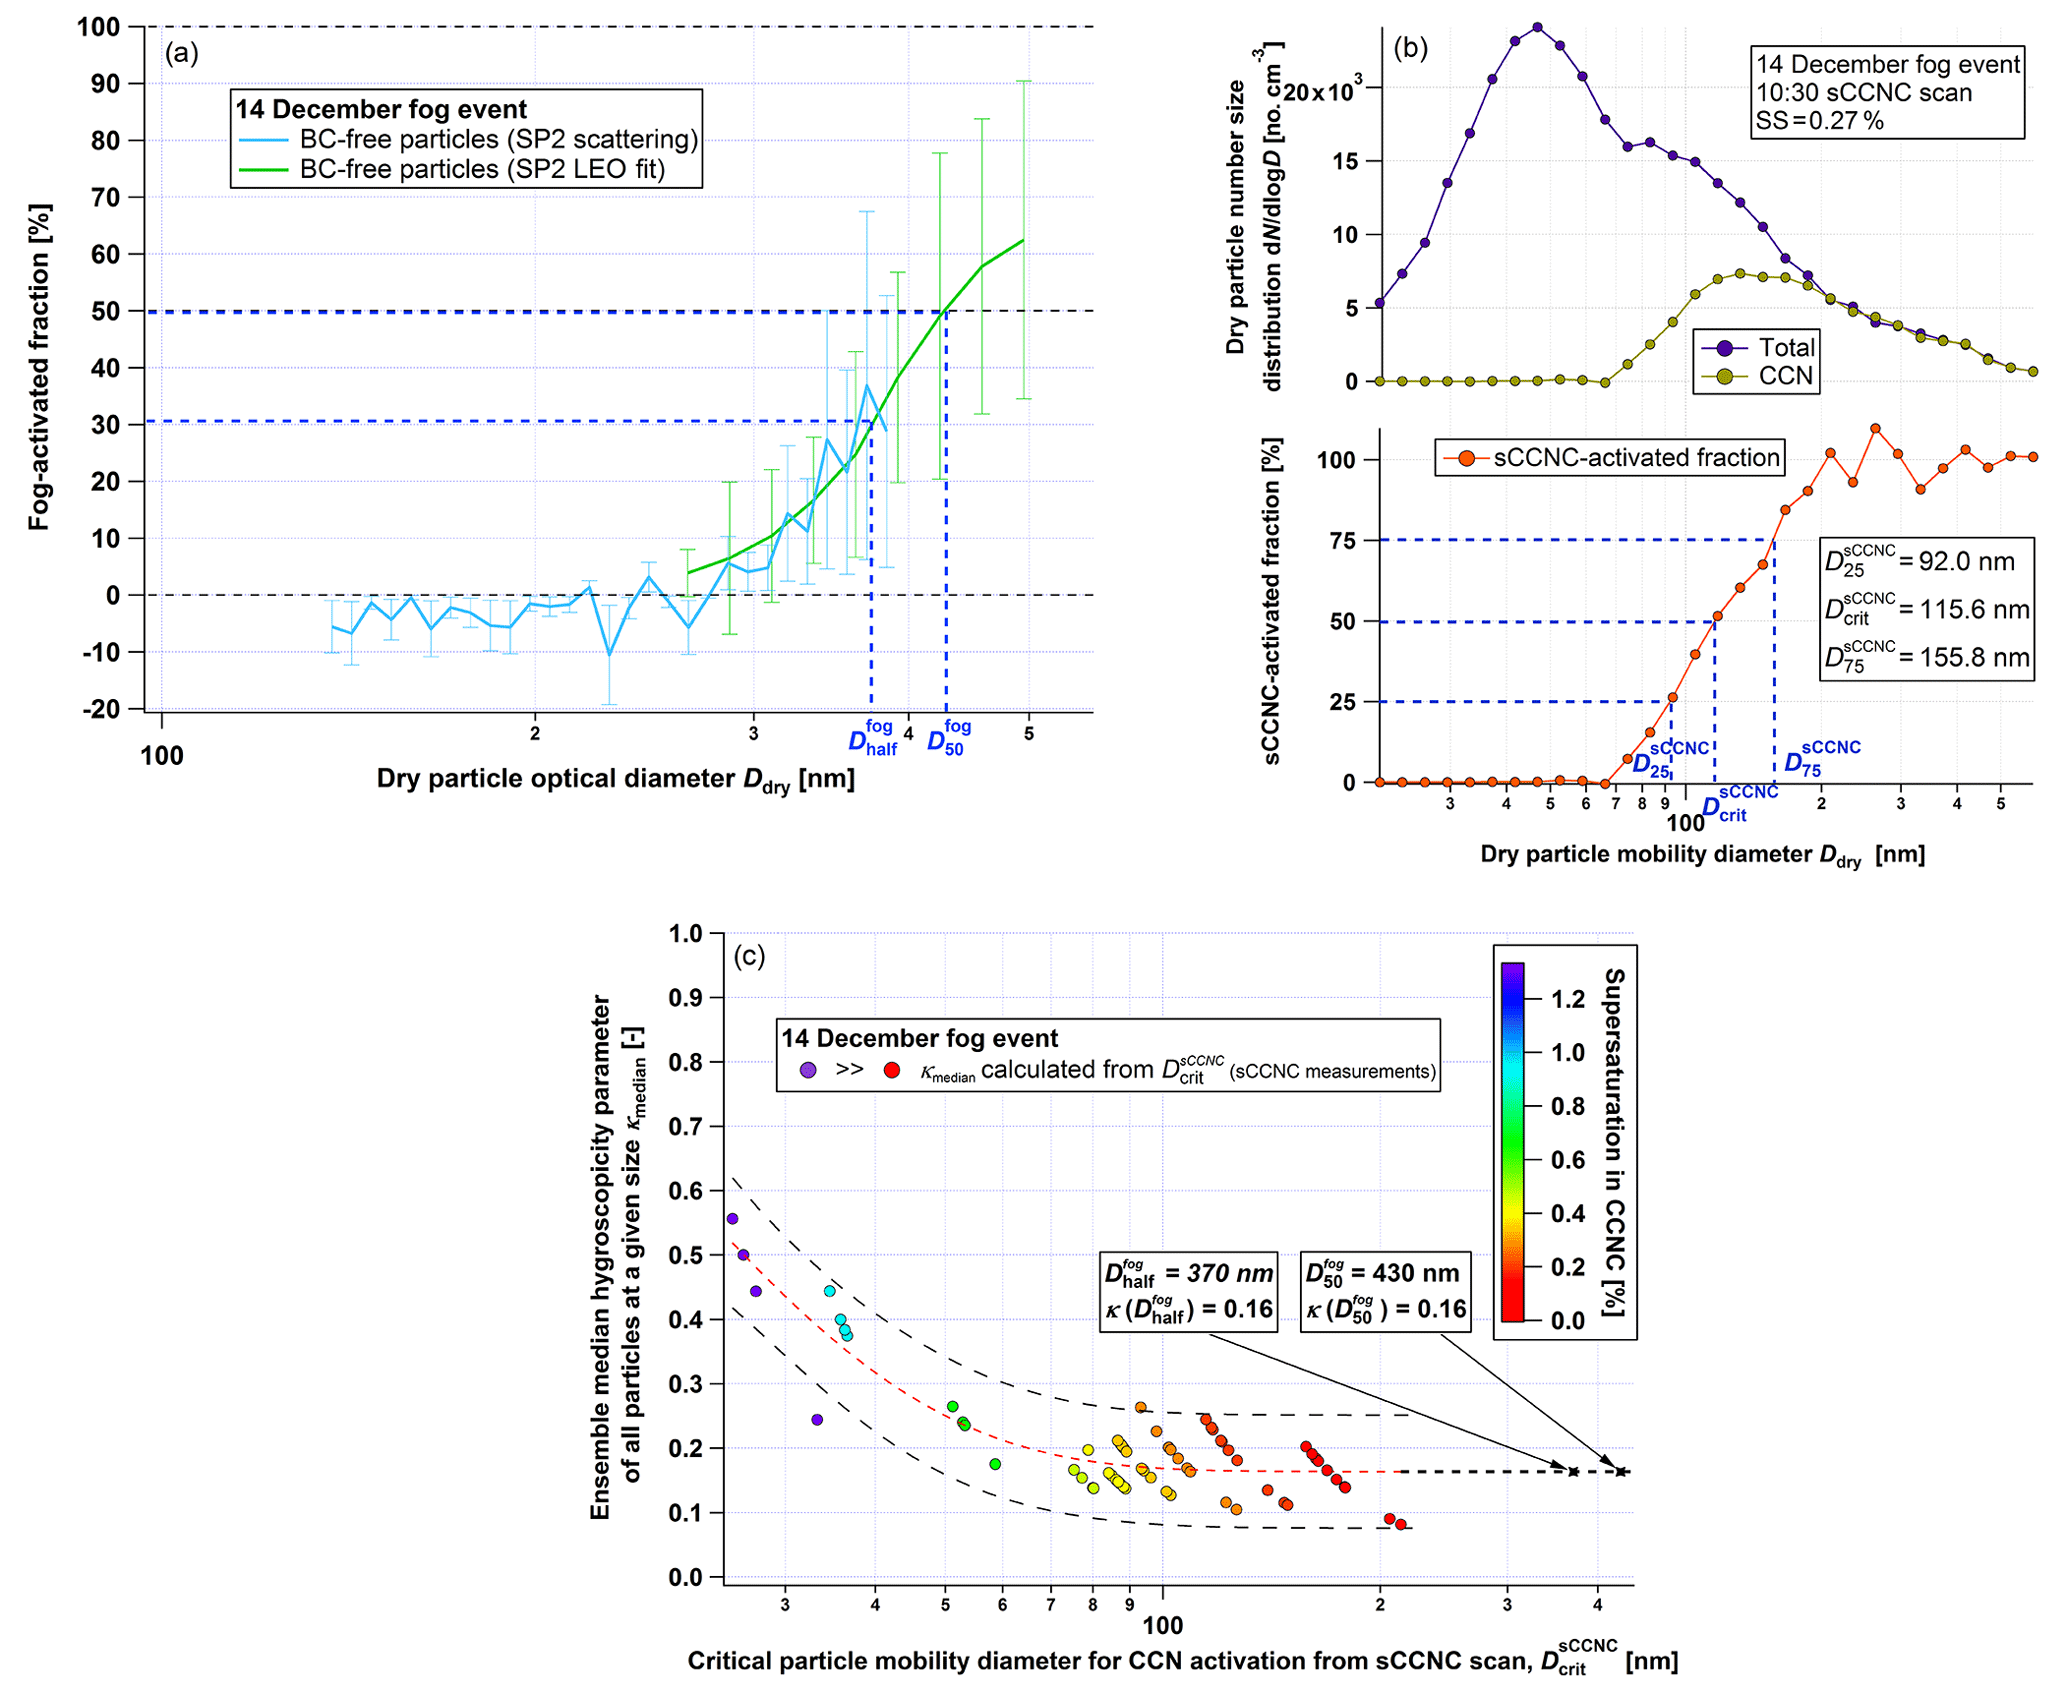
Figure 3Example data from the 14 December fog event. (a) sCCNC-activated fraction spectrum including and from SP2 measurements. and along with κmedian values from sCCNC measurements are used to obtain two estimates of fog SSpeak. (b) Total particle and CCN number size distribution from sCCNC measurement and corresponding sCCNC-activated fraction spectrum at a fixed SS used to infer and the corresponding κmedian value. The normalized difference between the 75 % and 25 % activation cut-off diameters, (, is used as an indicator of aerosol mixing state. (c) κmedian values calculated from individual retrieved from the sCCNC scans plotted against on the abscissa. The points are coloured by the SS applied in the sCCNC. The red line indicates an exponential fit surrounded by 95 % confidence intervals which reflect temporal variability during the fog event. The two black crosses affixed on the dashed line indicate an extrapolation of κmedian to corresponding to and . Note: the peculiar size dependence of the κ value, which exhibits increasing hygroscopicity with decreasing particle size, has been observed during the fog events and also a few other fog-free nights covered in this study (see Fig. 4). However, this feature at the small size end is not relevant for fog droplet activation nor is it representative of the campaign averaged data (see Table 1).
Activated fractions were independently calculated using two different types of particle number size distribution measurements behind each inlet: from the SMPS instruments and from the SP2. Results from both types of instruments agreed in general and showed distinct fog droplet activation at the largest particle diameters, while smaller particles remained interstitial. However, the signal-to-noise ratio in the fog-activated fraction spectra from the SMPS measurements was poorer than for the SP2-derived fog-activated fraction spectra. For this reason, the values of and mentioned hereafter are extracted from the fog-activated fractions calculated with the SP2 number size distributions, specifically considering BC-free particles only (Fig. 3a). As the fog events lasted at least 3.5 h each (Table 2), the average particle number size distributions measured over an entire event have a high statistical significance.
2.3.4 Retrieval of κmedian value from sCCNC measurements
Using the sCCNC setup (Fig. 1) provides simultaneous measurements of the CCN as well as total particle number size distributions, and dividing the former by the latter results in the CCN-activated fraction spectrum (Fig. 3b). The diameter at which CCN activation reaches 50 % for the SS applied in the sCCNC is commonly defined as the sCCNC-critical activation diameter, . Below, we will also refer to the diameter at which CCN activation reaches 25 % and 75 % as and . The median κ value, κmedian, for particles with dry diameter of the sampled aerosol is calculated from measured by considering the SS applied in the CCNC and using κ-Köhler theory (Eq. 1; surface tension of the droplets is assumed to be equal to that of water and the temperature at activation is assumed to be equal to the sample flow temperature in the CCNC). As an example, Fig. 3c shows all κmedian observed during the 14 December fog event as a function of . Note that all κmedian inferred from measurements at identical SS fall on a common line rather than being randomly scattered because κmedian and are unambiguously related through the κ-Köhler theory for constant SS.
Observed varied from < 20 to > 200 nm due to applying different SS and due to temporal variations in the aerosol hygroscopicity (Fig. 3c). Reaching larger was not possible because the CCNC can only measure at SS greater than ∼0.1 %. As fog formation occurs at lower SS, knowledge of the κ value for around 300 to 500 nm is required for interpreting the fog observations. Therefore, we extrapolated the size-resolved κmedian data to and , which are the estimated activation cut-off diameters for fog droplet formation, as illustrated in Fig. 3c. As discussed later and shown in Fig. 3c, κmedian is essentially independent of size for diameters between around 80 and 200 nm (between 75 and 178 nm for the 14 December event shown in the figure). The uncertainty in κmedian extrapolated to the activation cut-off diameters, and , is dominated by extrapolation errors, which are estimated to be potentially as large as 40 %.
2.3.5 Retrieval of effective peak supersaturation in fog
The highest SS encountered by the activated particles in the fog during a sufficiently long time, which made them grow across their fog-critical diameter to become a stable cloud or fog droplet, is defined as the effective peak supersaturation (SSpeak; Hammer et al., 2014a). We use the SSpeak when indirectly inferring it by comparing observed dry particle cut-off diameter for droplet activation in the fog with the Ddry-to-SScrit relationship from CCN counter (CCNC) measurements.
Inferring SSpeak during a fog event is made possible by combining the value of the activation diameters (Sect. 2.3.3) and the hygroscopicity of particles activated to fog droplets (Sect. 2.3.4), using the κ-Köhler theory (Sect. 2.3.2). Two different values of SSpeak corresponding to the two different activation diameters were calculated, as it is unknown which one of the two diameters is closer to the actual cut-off (lacking measurements in the size range where the activation plateau is reached). The temperature at which particles activate was assumed to be the measured ambient temperature at 3 m above the ground.
3.1 Overview of particle concentration, hygroscopicity results and scavenged fractions of BC
Continuous measurements of particle and species concentrations from 6 November 2015 to 31 January 2016 gave the opportunity to observe the type of aerosol present at the campaign site in winter (see Table 1). The median total particle number concentration was 5879 cm−3 (interquartile range, IQR =5967 cm−3), with lower concentrations at night which often dropped below 2000 cm−3, and peaks reaching more than 20 000 cm−3 for more than an hour in the morning rush hour period. The particle number size distribution was generally unimodal, centred between 40 and 120 nm. The median eBC mass concentration was 1.1 µg m−3 (IQR =1.3 µg m−3), with higher and more variable values during weekdays (1.3 µg m−3; IQR =1.4 µg m−3) than weekend days (0.8 µg m−3; IQR =1.0 µg m−3). These eBC mass concentrations are close to the average values reported during wintertime for other locations in large urban areas like London (1.3 µg m−3; Liu et al., 2014), Las Vegas (1.8 µg m−3; Brown et al., 2016) and Fresno in California (1.05 µg m−3; Collier et al., 2018), thus representing typical urban wintertime burdens. The ACSM measured a median organic mass concentration of 1.4 µg m−3 (IQR =2.4 µg m−3), higher than any inorganic species (nitrate: 0.8 µg m−3, IQR =1.2 µg m−3; ammonium: 0.5 µg m−3, IQR =0.8 µg m−3; sulfate: 0.1 µg m−3, IQR =0.1 µg m−3 and only traces of chloride). Finally, the wind speed was generally low (median of 0.4 m s−1, IQR =0.9 m s−1) with no wind speed higher than 5 m s−1, and the temperature varied between −7.8 and 14.3 ∘C, with a median of 4.4 ∘C (IQR =5.9 ∘C).
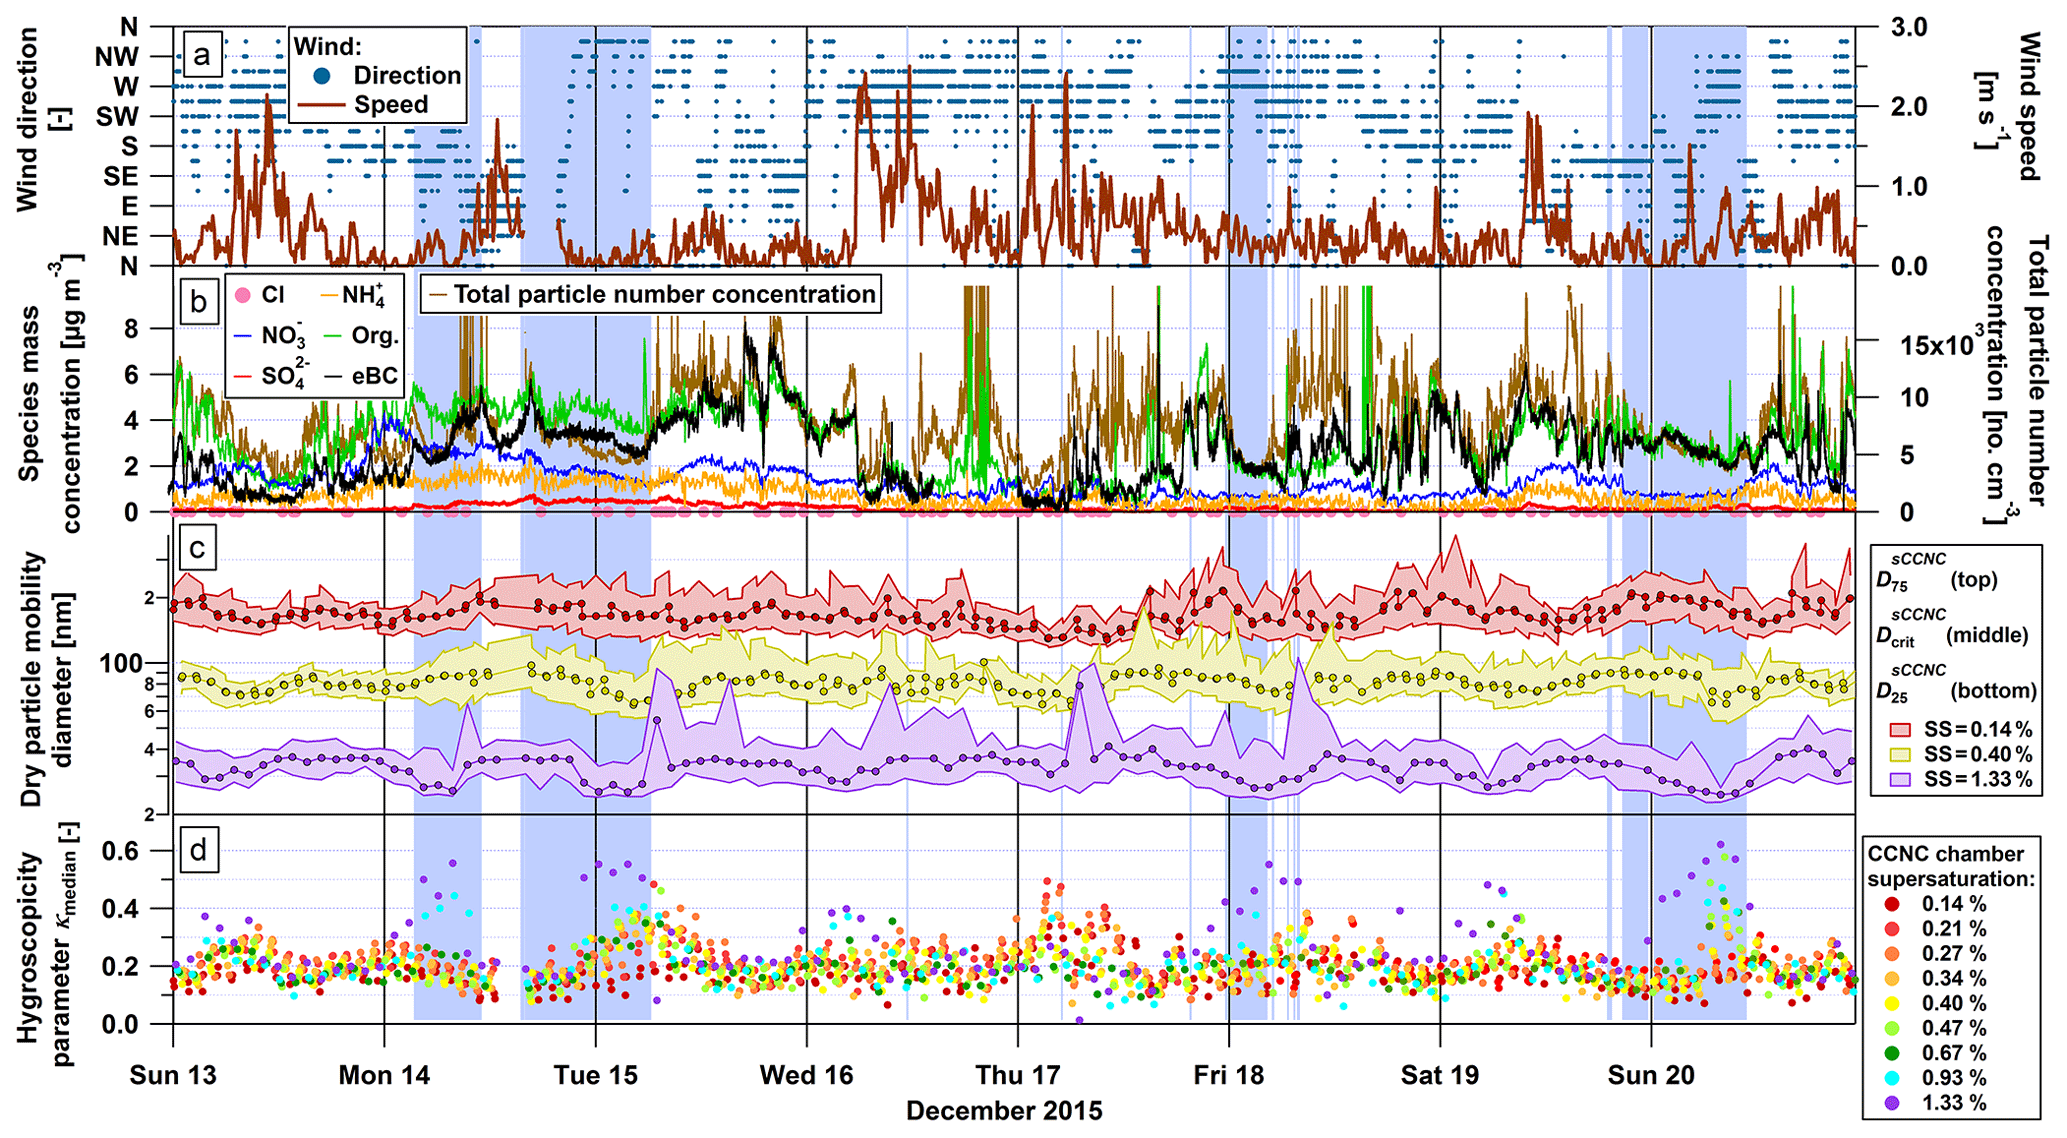
Figure 4Time series of various parameters during the period of the analysed fog events (blue shadings): (a) wind speed and direction; (b) mass concentrations of organics, inorganic species, eBC as well as total particle number concentration (D > 7 nm); (c) dry particle mobility diameters corresponding to 25 %, 50 % () and 75 % sCCNC-activated fraction at the SS applied in the sCCNC; (d) retrieved κmedian value for each sCCNC scan. Note that the measurements at different SS are representative of different particle sizes (see panel c). Thus, the dependence of the κmedian values shown in panel (d) primarily reflects the size dependence of particle hygroscopicity.
Figure 4 gives an overview of wind and hygroscopicity parameters as well as mass concentrations of organic and inorganic particulate matter during the period covering the four analysed fog events. A clear cause of the reduction in the concentration of any type of particles is occurrence of a medium (or high) wind speed, causing a dilution effect (Zhu et al., 2002), e.g. in the morning hours of 16 December (Fig. 4a–b).
The mobility diameters corresponding to sCCNC-activated fractions of 25 %, 50 % and 75 % derived from sCCNC measurements are plotted in Fig. 4c for the three example supersaturations. The dry diameter at 50 % sCCNC-activation (referred to as sCCNC-critical diameter ) provides information on the median particle hygroscopicity: for a fixed SS, particles activate at a lower diameter if they are highly hygroscopic, thus resulting in lower , and vice versa. As κmedian is directly calculated from sCCNC-derived , the time series of κmedian values gives the same type of information but makes the results from all nine SSs set in the CCNC directly comparable. The particle hygroscopicity at all SSs except the highest one (SS =1.33 %) was quite low (Fig. 4d), which also applies for the whole campaign with κmedian between 0.19 and 0.24 depending on the SS (Table 1). This indicates a dominant contribution of compounds exhibiting little or no hygroscopic growth such as organics and black carbon, possibly emitted by traffic or wood burning. Dominant contribution of non-hygroscopic or only moderately hygroscopic matter (BC, organics) opposed to only minor contribution of hygroscopic inorganic ions is indeed confirmed by the ACSM composition measurements (Fig. S3 and Table 1). Observed aerosol hygroscopicity was in the range of values reported in the literature for field studies in continental sites influenced by traffic in winter: Paris (France): 0.09 to 0.17 (Hammer et al., 2014b) and 0.08 to 0.24 (Jurányi et al., 2013); Mexico City: 0.2 to 0.3 (airborne measurements by Shinozuka et al., 2009); and the Pearl River Delta region in China: 0.18 to 0.22 (Jiang et al., 2016).
Mean aerosol hygroscopicity increased with increasing particle size (Table 1), a feature which is often observed for atmospheric aerosols (Swietlicki et al., 2008). Note that the aforementioned trend of κmedian with particle size is broken for the data from measurements at lowest and highest supersaturations; however, this minor deviation from the trend at either end is likely an artefact caused by systematic bias within the specified calibration uncertainties at these two extreme supersaturations.
A closer look at the time series shown in Fig. 4d reveals some interesting features. Sometimes, particle hygroscopicity inferred from the measurements at the highest SS drops considerably during the morning rush hour, as will be discussed in more detail in the following section. Exactly the opposite effect, i.e. strongly increased particle hygroscopicity up to κmedian=0.6 at the highest SS (most of the time representative of 25 to 40 nm particles), is often observed between around 01:00 and 10:00 LT. This increase in κmedian could also be seen, though to a lesser extent at SS =0.93 %, and at times even down to medium to low SS. The diurnal patterns of κmedian averaged over the whole campaign, shown in Fig. S4, also reveal increased hygroscopicity in the second half of the night of the smaller particles (high SS), compared to the minimum which occurs in the afternoon. This shows that these episodes are, while not occurring every night, still relevant for aerosol hygroscopicity on a time-averaged basis. Having said this, the campaign average variability of κmedian in terms of IQR is largely independent of SS (particle size), indicating that the variations in aerosol composition, occurring due to e.g. variations in air mass type or source contributions that are independent of time-of-day, dominate over the systematic but small diurnal pattern.
The cause of the night-time increase in hygroscopicity at smaller particle sizes was not identified, but a probable explanation is the acquisition of ammonium nitrate. An increase in ammonium nitrate volume fraction by condensation would more efficiently proceed for smaller particles, due to their higher surface-to-volume ratio, thereby increasing their hygroscopicity. The fact that the retrieved κmedian value increased up to 0.6 (uncertainty: ±20 %), thereby almost reaching the κ value of ammonium nitrate (∼0.67 for 0.3 % < SS< 1 %; Petters and Kreidenweis, 2007), supports this hypothesis.
The scavenged mass fractions of BC and the total aerosol, i.e. the mass fraction incorporated into fog droplets, were calculated using the SP2 and the two SMPS assemblies, respectively. The scavenged mass fraction varied between 6 % and 12 % for BC during the four fog events, and between 15 % and 20 % for the total aerosol. These results are in close agreement with the fog studies of Hallberg et al. (1992), who reported 6 % for elemental carbon and 18 % for sulfate, and somewhat lower than the scavenged fractions of 26 % for EC and 38 %–94 % for various inorganic species as reported by Gundel et al. (1994).
3.2 Influence of traffic on aerosol population, mixing state and hygroscopicity
Previous studies enumerated the diversity of aerosol types that are present in European cities (e.g. Putaud et al., 2010), with seasonally variable source contributions to organic carbon (OC) and EC (Szidat et al., 2006; Gelencsér et al., 2007): although EC mostly originates from fossil fuel combustion in summer, biomass-burning emissions from residential heating have been reported to represent a significant fraction of EC emissions in winter.
By plotting diurnal cycles of particle number in different diameter ranges and eBC concentrations (Fig. S5a, b), we could identify periods with high concentrations from around 08:00 to 12:00 LT during weekdays, peaking from 08:00 to 10:00 LT. This time window is hereafter referred to as rush hour, as it generally corresponds to the times when people commute to work during weekdays. Based on the diurnal cycles of particle and BC concentrations and two different indicators of the source of carbonaceous aerosol (the absorption Ångström exponent and the organics-to-eBC mass ratio), we conclude that these concentration peaks were caused by traffic emissions rather than wood burning, which is the second most common source of BC in Zurich (Zotter et al., 2017; additional discussion attached to Fig. S5).
BC particles freshly emitted from traffic sources are typically less hygroscopic than background aerosols. Therefore, it is expected that the rush hour peak in traffic contribution is also reflected in aerosol mixing state with respect to hygroscopicity, e.g. in data such as these provided by the sCCNC. If all particles sampled were internally mixed, the resulting size-dependent sCCNC-activated fraction would be a step function (slightly inclined because of finite instrumental resolution), with all particles larger than a certain mobility diameter activating and all smaller particles remaining in the interstitial phase (Moore et al., 2010). In contrast, if the sCCNC-activated fraction curve was broadened, i.e. if CCN activation was gradually occurring over a wider range of mobility diameters, this would indicate an increased degree of chemical heterogeneity (external mixing). Following the approach of Jurányi et al. (2013), we use the normalized difference between the 75 % and 25 % activation diameters at a fixed SS as an indicator of the degree of external mixing state regarding sCCNC-derived particle hygroscopicity in the size range around (see Fig. 3b for the retrieval of and ). Figure 4c shows, mostly seen for the highest SSs, that the periods with the highest degree of external mixing were the rush hours (around 08:00 to 10:00 LT) of the weekdays, confirming the above statement that freshly emitted traffic emissions are indeed a significant source of small externally mixed and poorly hygroscopic particles. While the non-hygroscopic particles from fresh traffic emissions usually affect only, even increases for the highest SSs in the most extreme cases, e.g. during the rush hours of 15 and 17 December (Fig. 4c). During the rush hours of 16 December 2015, the absence of a clear peak of external mixing can probably be explained by the occurrence of high wind speed, which causes efficient dilution of the fresh emissions with background aerosol.
A more comprehensive analysis of the impact of different aerosol sources on aerosol mixing state is done by means of diurnal patterns of the indicator of mixing state variability for four different SSs (Fig. 5). The mixing state indicator values at 0.14 % SS, corresponding to mobility diameter of approximately 120 to 220 nm, were quite low and exhibited virtually no diurnal variation, and the difference between weekdays and weekend days was almost inexistent. This indicates that the background aerosol consisted for the most part of large, internally mixed particles. However, with increasing SS, i.e. with decreasing particle mobility diameter, a peak of externally mixed particles resulting in higher mixing state indicator values gradually appeared in the morning rush hours of weekdays. This shows that the diurnal pattern, already seen in Fig. 4 for 5 consecutive days, occurs frequently such that it is reflected in the campaign averaged data too. This rush hour peak in the degree of external mixing is most pronounced and significant for SS =0.67 % and 1.33 %, i.e. in the mobility diameter range below 100 nm, representing the typical diameter range of traffic-emitted particles (Laborde et al., 2013; Schwarz et al., 2008). The size dependence of the relative contributions of local and background aerosol was already highlighted by Baltensperger et al. (2002), who measured the particle hygroscopicity in summer in Milan and concluded that particles in the range 50 to 200 nm were mostly externally mixed.
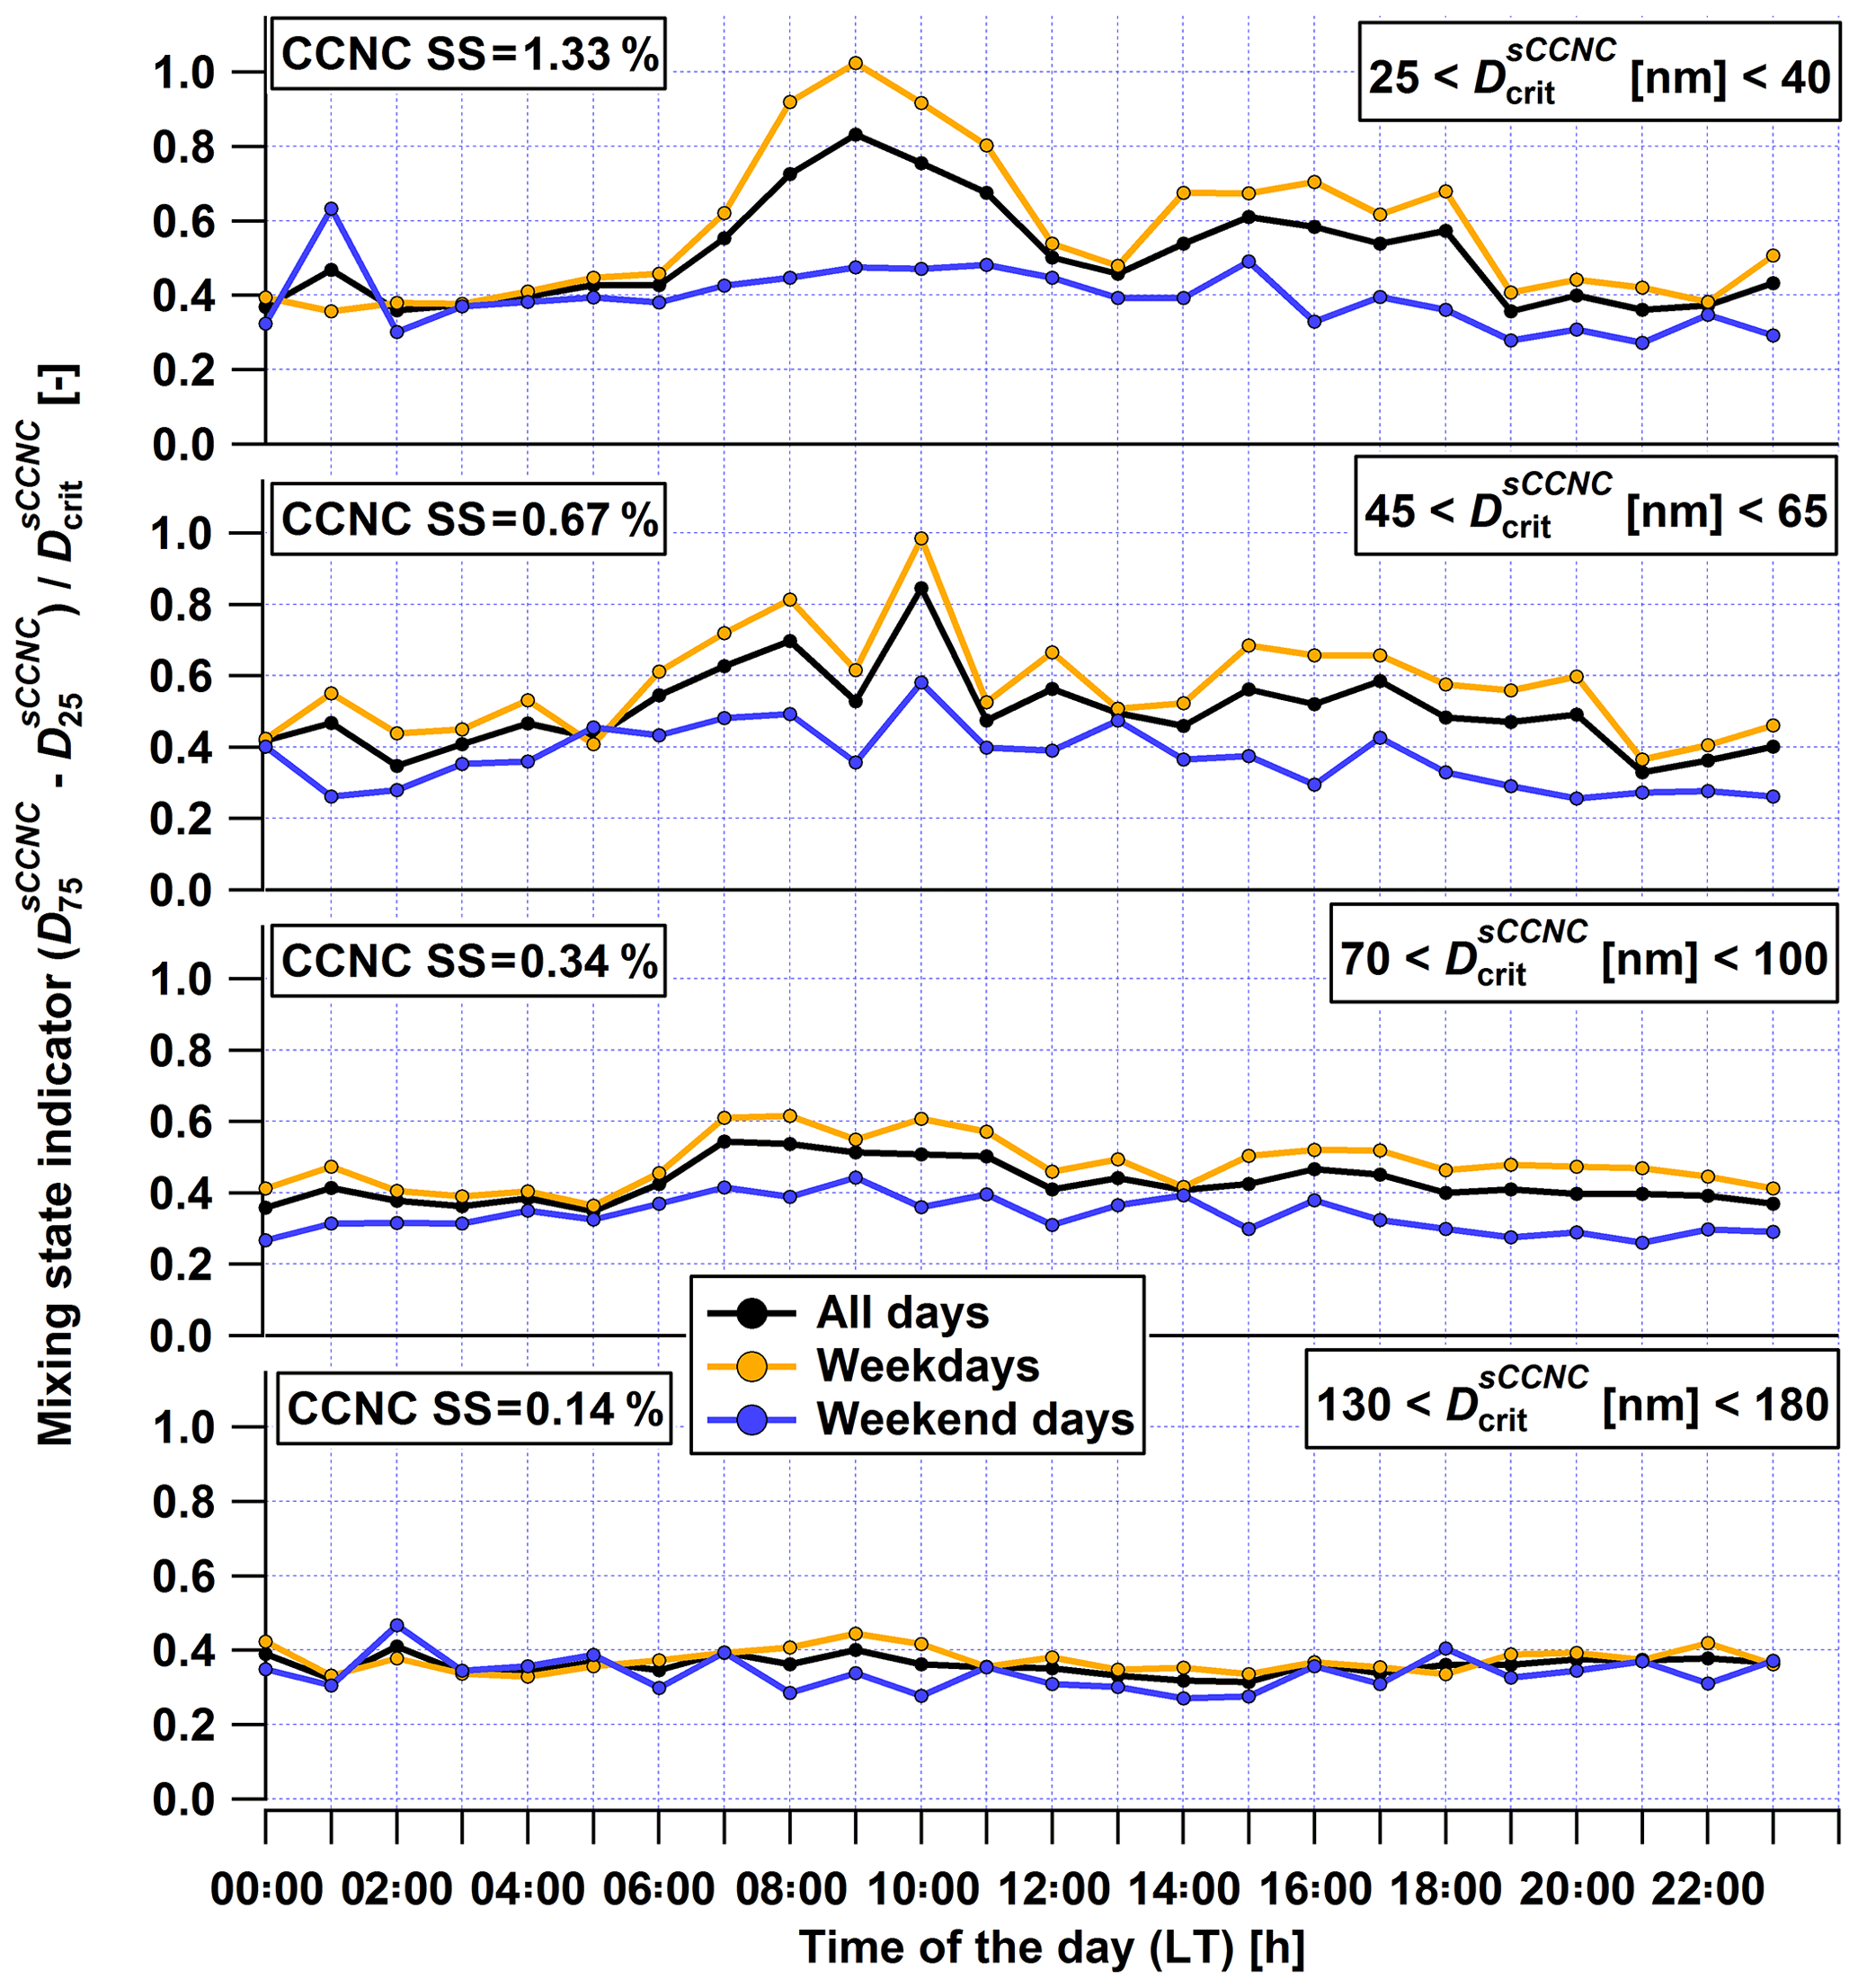
Figure 5Diurnal patterns of from sCCNC measurements as an indicator of the particle mixing state, averaged during the whole campaign (the larger the value the more externally mixed with respect to hygroscopicity). Results at four different SS are separately averaged over the whole campaign including all days, weekdays only or weekend days only. The approximate ranges of corresponding to the respective SS are indicated on each panel.
Previous field studies already reported the variability of the mixing state and hygroscopic properties of particles depending on their source and air mass age: Subramanian et al. (2010) reported a higher degree of external mixing for BC (i.e. thinner coatings) sampled over the city of Mexico than for older background air masses; Cubison et al. (2008) showed that the primary hydrophobic aerosol mass was no longer a significant component of the aerosol mass 1 to 2 days after emission, mainly because of condensation of secondary species.
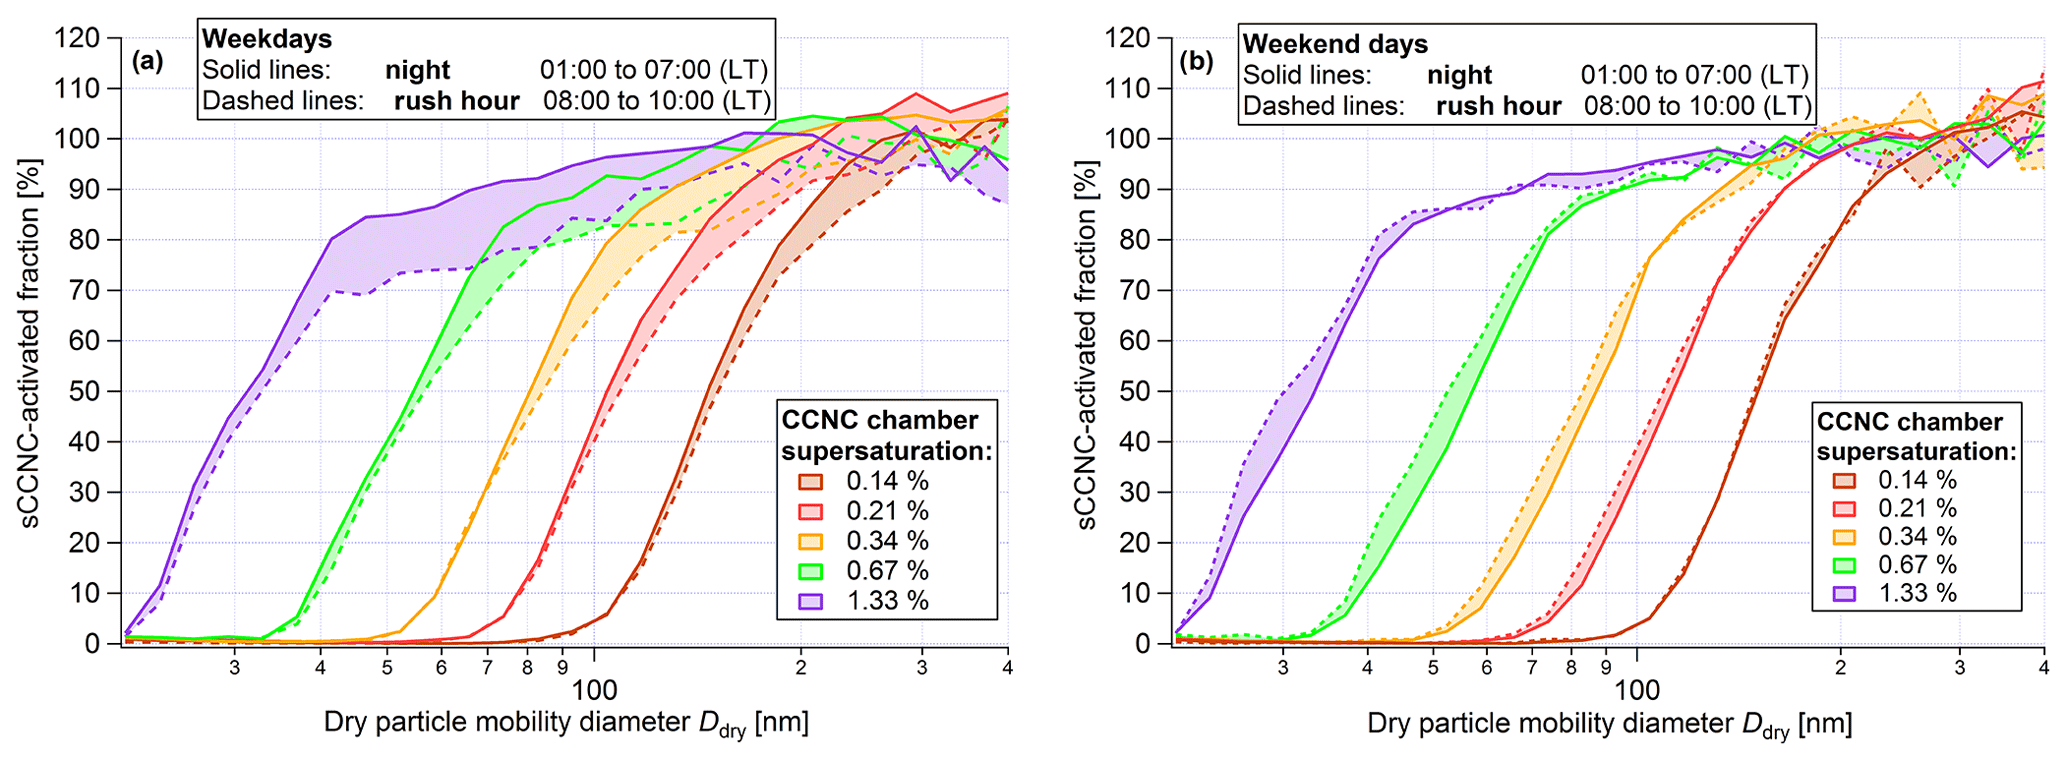
Figure 6Averaged sCCNC-activated fraction spectra (from sCCNC measurements). The data set of the whole campaign is temporarily split by (a) weekdays versus (b) weekend days, and also by night-time versus morning rush hour.
The influence of traffic and wood burning emissions on sCCNC-activated fraction spectra is further investigated with Fig. 6, in which the data set of the whole campaign is temporarily split and separately averaged for high traffic and low wood burning influence on the one hand (rush hour from 08:00 to 10:00 LT) and low traffic and high wood burning influence on the other hand (night-time from 01:00 to 07:00 LT), according to the diurnal patterns shown in Fig. S5. This split is separately done for weekdays and weekend days. The CCN properties of the most hygroscopic fraction of the aerosol, which is dominated by contributions from the background aerosol and shows up in the range of sCCNC-activated fractions between 0 % to around 60 % or more, do not significantly differ between high traffic influence and high wood burning influence, nor between weekdays and weekends. By contrast, systematic variations are found for the less hygroscopic aerosol fraction. On weekdays (Fig. 6a), the sCCNC-activated fraction decreased by around 10 % to 15 % in the mobility diameter range in which the sCCNC-activated fraction is greater than ∼60 %, when comparing the traffic-dominated periods with the wood-burning-dominated periods. Furthermore, complete activation is hardly reached during traffic-dominated periods, which is also the case at the highest SSs and largest mobility diameters covered. By contrast, complete activation is reached for particles greater than around 200 nm in mobility diameter during wood-burning-dominated times. On weekends, the relative contribution of wood burning to BC is higher than at any time on weekdays, based on AAE shown in Fig. S5c, due to substantially less traffic emissions. Consequently, the difference in sCCNC-activated fraction spectra between the rush hour and night-time windows largely disappears (Fig. 6b), and all averaged sCCNC-activated fraction spectra become equal to the night-time sCCNC-activated fraction spectra during weekdays. These observations show that the fresh BC particles from traffic emissions are very poor CCN, whereas BC-containing particles from wood burning are at least moderately efficient CCN. This is explained by the facts that traffic emits almost pure BC, whereas BC from wood burning is to some extent internally mixed with co-emitted organics. This interpretation is consistent with the diurnal pattern of the organics to eBC mass ratio shown in Fig. S5d. It is also consistent with previous urban measurements in Paris, where Laborde et al. (2013) showed the same difference in BC mixing state and hygroscopic growth between these two BC sources, and where Jurányi et al. (2013) showed, using a mixing-state resolved hygroscopicity–CCN closure approach, that the difference in hygroscopic growth results in a corresponding difference of CCN activity as expected from Köhler theory. Moreover, the largest traffic effect, i.e. decrease in sCCNC-activated fraction, occurred for small particles in the mobility diameter range of 40 to 110 nm corresponding to the size range previously shown to include the majority of BC particles emitted in an urban environment (Schwarz et al., 2008). The traffic effect was much less pronounced at larger mobility diameters (200 to 400 nm), also consistent with findings by Laborde et al. (2013) in Paris.
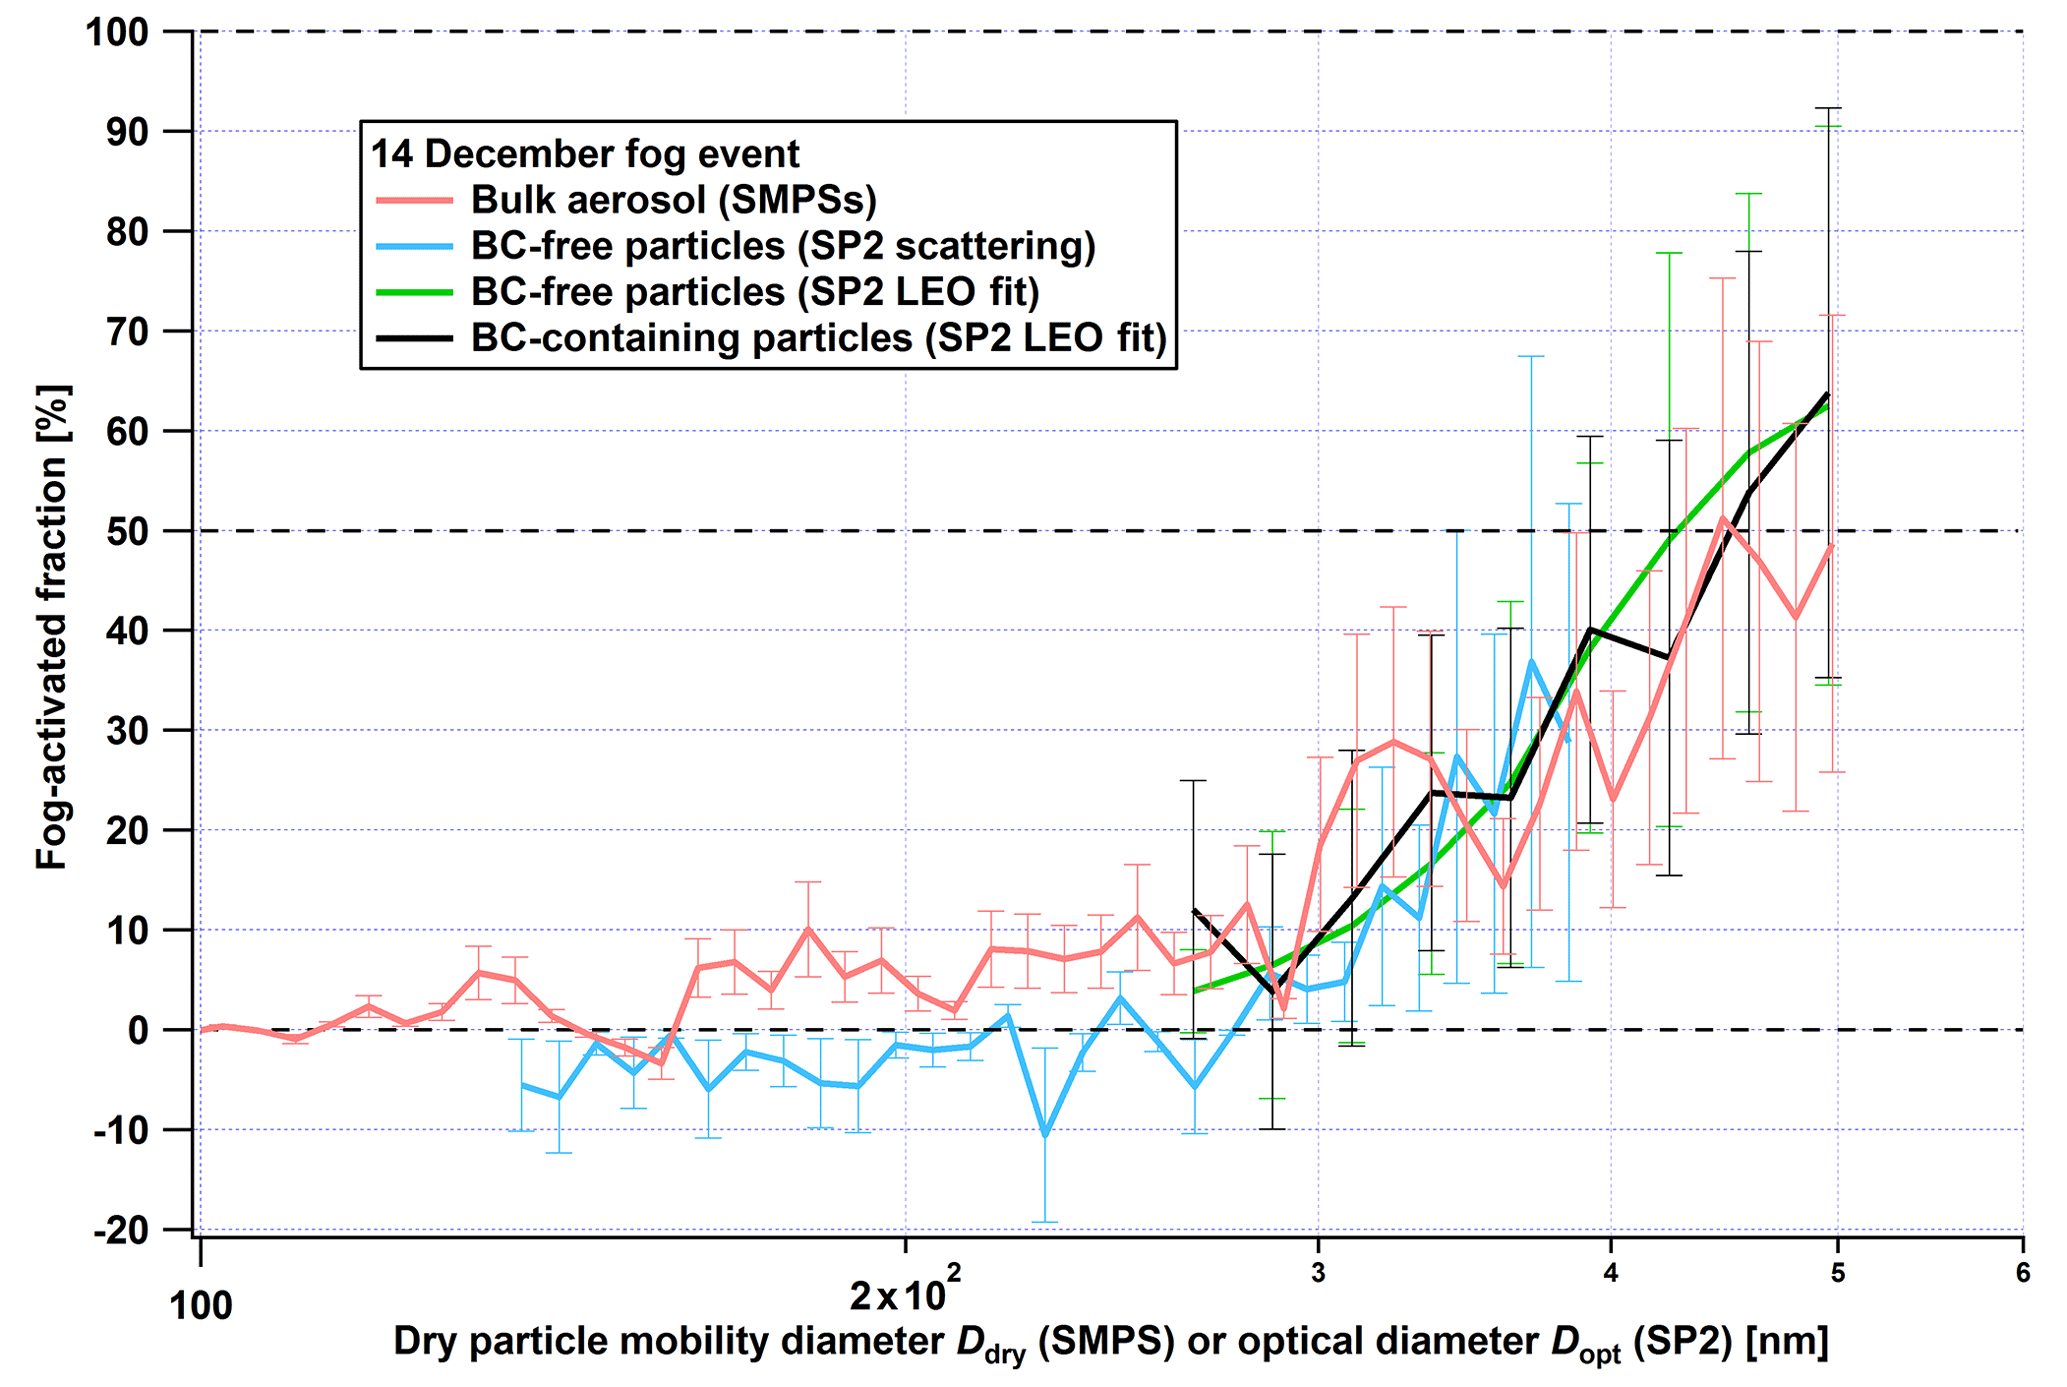
Figure 7Fog-activated fraction of the bulk aerosol (from total and interstitial SMPS, red line), BC-containing particles (using SP2 LEO fit, black line) and BC-free particles (using SP2 scattering signal: light blue line; SP2 LEO fit: green line) as a function of the dry particle mobility diameter (for SMPS data) and optical diameter (for SP2 data) during the 14 December fog event. The 1σ uncertainties in the BC-containing particle data are Poisson-based with respect to the BC core number size distribution; the other ones are dominated by the level of (dis-)agreement of the interstitial and total measurements, which was determined during out-of-cloud periods and propagated through the calculation of the fog-activated fraction.
3.3 Activation cut-off diameters and , and effective peak supersaturation SSpeak during fog events
The combination of total and interstitial inlets was used to determine the number fraction of particles that were activated to fog droplets as a function of particle optical diameter. A comparison of the fog-activated fraction spectrum of the bulk aerosol inferred from SMPS particle number size distributions with the fog-activated fraction spectrum of BC-free particles (which represent the majority of particles except for rush hour times) inferred from SP2 measurements is shown in Fig. 7 for the 14 December fog event (and in Fig. S8a–c for the other three fog events). The reasonable agreement between the SMPS-derived and SP2-derived fog-activated fractions suggests that the sizing of these three instruments (SP2 and both SMPSs) is correct and that activation cut-off diameters inferred from SP2 data of BC-free particles are equivalent to those derived from SMPS data (which was done in previous studies, discussed below). Furthermore, the use of the LEO fit derived results, which is the only option for BC-containing particles, is validated by the good agreement between the fog-activated fractions of BC-free particles derived from the standard scattering signal analysis and from the LEO fit analysis.
Half and 50 % activation cut-off dry diameters ( and ; see Sect. 2.3.3 for definitions) were extracted from the fog-activated fraction spectrum of BC-free particles for each fog event and are shown in Fig. 3a. The median hygroscopicity parameter inferred from sCCNC measurements was extrapolated to the cut-off diameter range as shown in Fig. 3c. The cut-off diameter and corresponding κmedian are then used as inputs to the κ-Köhler theory to retrieve the fog SSpeak as described in detail in Sect. 2.3.5. Table 2 lists the times and duration of the four fog events analysed in the present work, as well as measured LWC, number fraction of particles activated to fog droplets, and , κmedian extrapolated to the size range of and , and SSpeak. Fog events occurred only when the wind speed was lower than approximately 1 m s−1 (Fig. 4a). The impact of wind on fog occurrence was clearly observed in the afternoon of the 14 December fog event: the fog dissipates when the wind speed increased, and a new fog event started when the wind speed decreased again.
Using SMPS measurements behind the total and interstitial inlets, we calculated the fraction of particles activating to fog droplets and confirmed that they represent a very small subset of the aerosol population. Only for the 18 December fog event was the fraction of activated particles in the mobility diameter range between 20 and 593 nm higher than 1 %. This fraction depends on various parameters such as SSpeak and particle number size distribution shape; therefore it may vary significantly for other locations and periods.
All four fog events were rather similar in terms of LWC, activation cut-off diameter and SSpeak; and lay in the range 320 to 380 and 370 to 470 nm, respectively (see Table 2). This is in very good agreement with the results from Hammer et al. (2014b), who measured a median activation cut-off diameter between 364 and 450 nm during fog events in Paris (they found similar and but calculated the lower and upper limits with two different methods). The κmedian of the particles activated to fog droplets were also very close for the first three events (0.16 to 0.18) but lower for the last one (20 December; κmedian=0.12).
Two values of SSpeak are given for each fog event in Table 2; the lower value was retrieved from , the higher from . SSpeak ranged from 0.036 % during the 15 December fog event to 0.058 % during the event of 18 December. This is in very good agreement with a previous fog study by Hammer et al. (2014b) in Paris during wintertime, who reported SSpeak of 0.031 to 0.046 % over 16 fog events. The low SSpeak values in fog are also comparable to the 0.05 % SSpeak estimated by Schroder et al. (2015) for two low-altitude stratocumulus clouds at the Californian Pacific coast. However, the droplet formation process in these clouds differed in so far as was lower (239 and 241 nm) because the κ value was higher (0.50 and 0.41; derived from an aerosol mass spectrometer, AMS). Similarly, in low-altitude shallow layer or stratus clouds, Pruppacher et al. (1998) estimated an effective SSpeak of approximately 0.05 % and Leaitch et al. (1996) reported a maximum threshold value of 0.1 %. Modelling results from Ming and Russell (2004), who simulated a fog event, are also very close to ours; they predicted a maximum SSpeak of 0.030 % and a maximum LWC of 150 mg m−3 in the simulation. However, cumulus clouds present much higher SSpeak due to the high updraft velocities and variations in pressure during their formation; previous studies by Pruppacher et al. (1998) and Hammer et al. (2014a) reported ranges of 0.25 % to 0.7 % and 0.37 % to 0.5 %, respectively. LWC values in convective clouds can also reach much higher values than in fog; Hammer et al. (2014a) and Reid et al. (1999) measured values up to 700 and 2000 mg m−3, respectively.
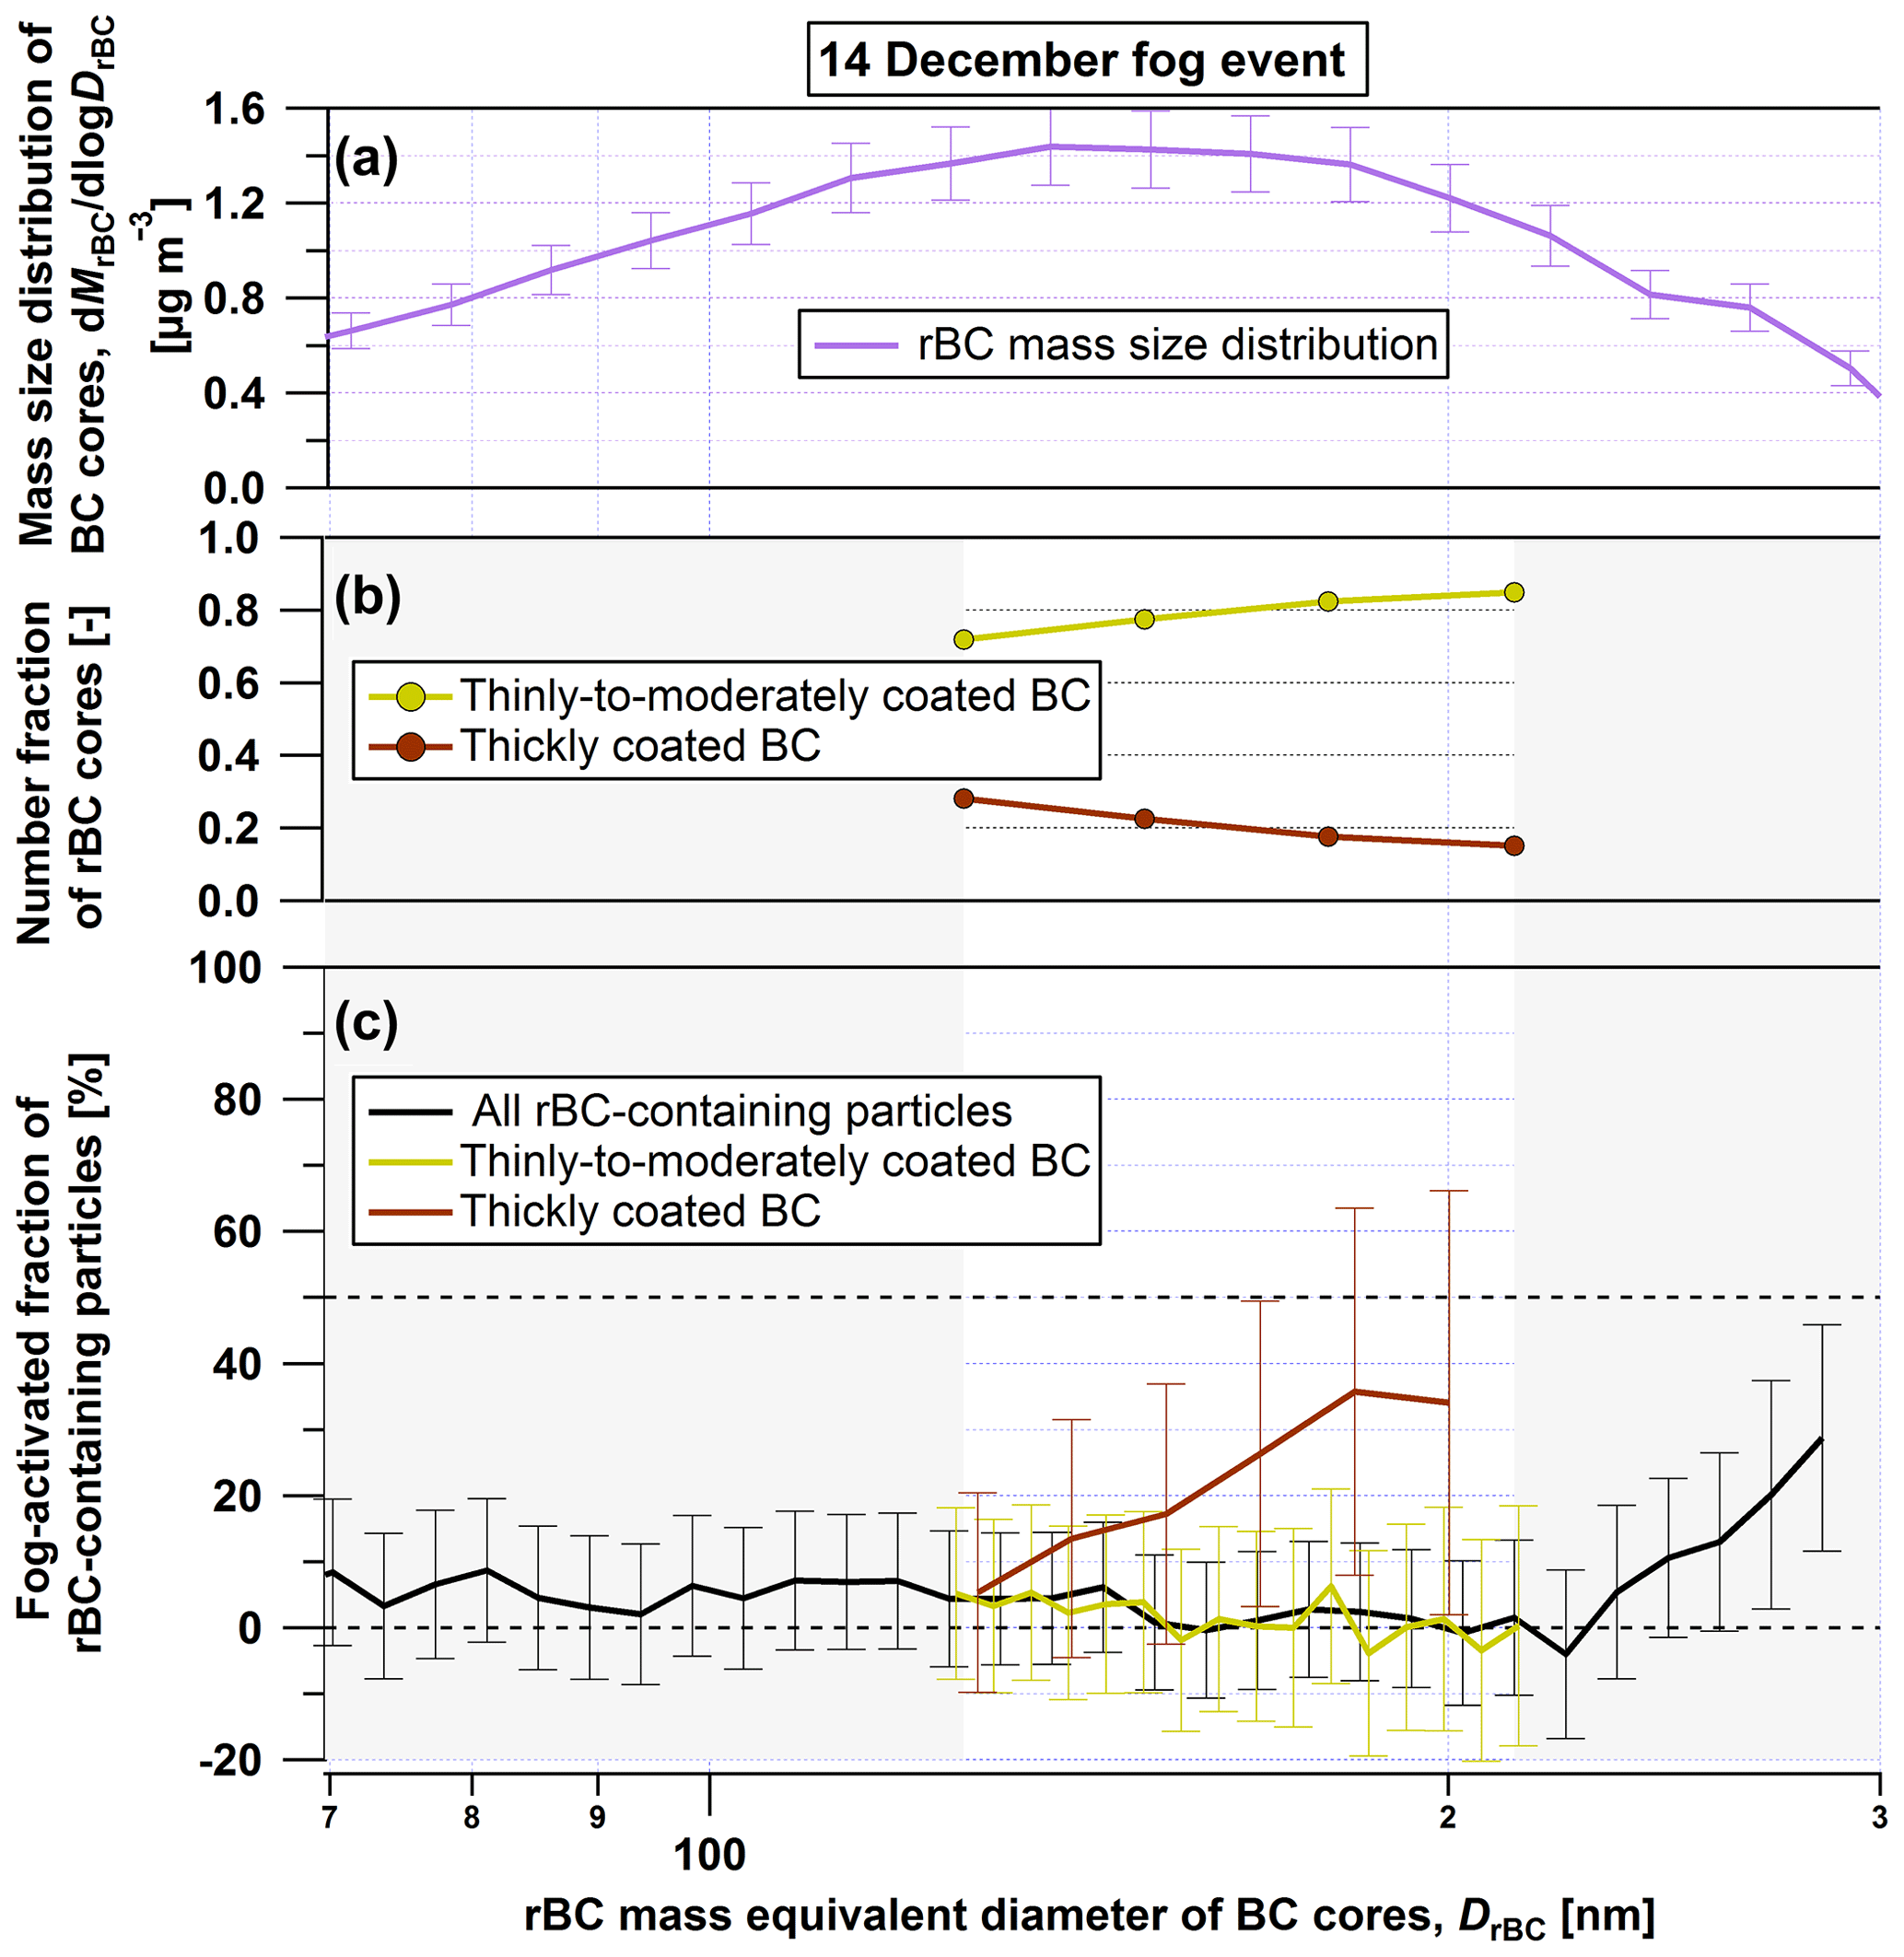
Figure 8BC-containing particle properties and behaviour during the December 14 fog event as a function of rBC mass equivalent diameter of the BC cores: (a) rBC mass size distribution (total inlet), (b) number fractions of BC-containing particles split in two mixing state classes (total inlet), (c) fraction of BC-containing particles activated to fog droplets (based on alternating measurements behind the interstitial and total inlets). The two mixing state classes shown in panels (b) and (c) are distinguished by either thick or thin-to-moderate coatings based on the delay-time method applied to the SP2 raw data. The 1σ uncertainties in panel (c) are Poisson-based counting statistics for the rBC core number size distributions propagated through the equation of the fog-activated fraction. The mixing-state-resolved data are only shown for the mass equivalent diameter range 127 nm < DrBC < 212 nm, in which detection limits of the SP2 do not introduce any systematic bias. The most thickly coated particles which caused saturation of the scattering signal were included in the subset of BC particles with thick coatings.
3.4 Size-dependent activation of BC-containing particles to fog droplets
Because of the very low SSpeak in fog, only large particles activate to droplets. During the four fog events investigated in this study, the minimum particle mobility diameter for activation was roughly 210–300 nm, as shown in Figs. 7 and S8a–c. As the largest BC cores were also about this size (Fig. S7), bare BC cores could not activate to droplets anyway because of being smaller than the activation cut-off diameter for hygroscopic particles.
Figures 7 and S8 show that the droplet activation behaviour of BC-containing particles was very similar to the one of BC-free particles; the presence of BC within the particles did not significantly alter their activation behaviour compared to BC-free particles. This somewhat surprising result can be explained by the fact that for particles with equal overall diameter, the dominant fraction of BC cores is thickly coated, as explained in the Supplement and shown in Fig. S6.
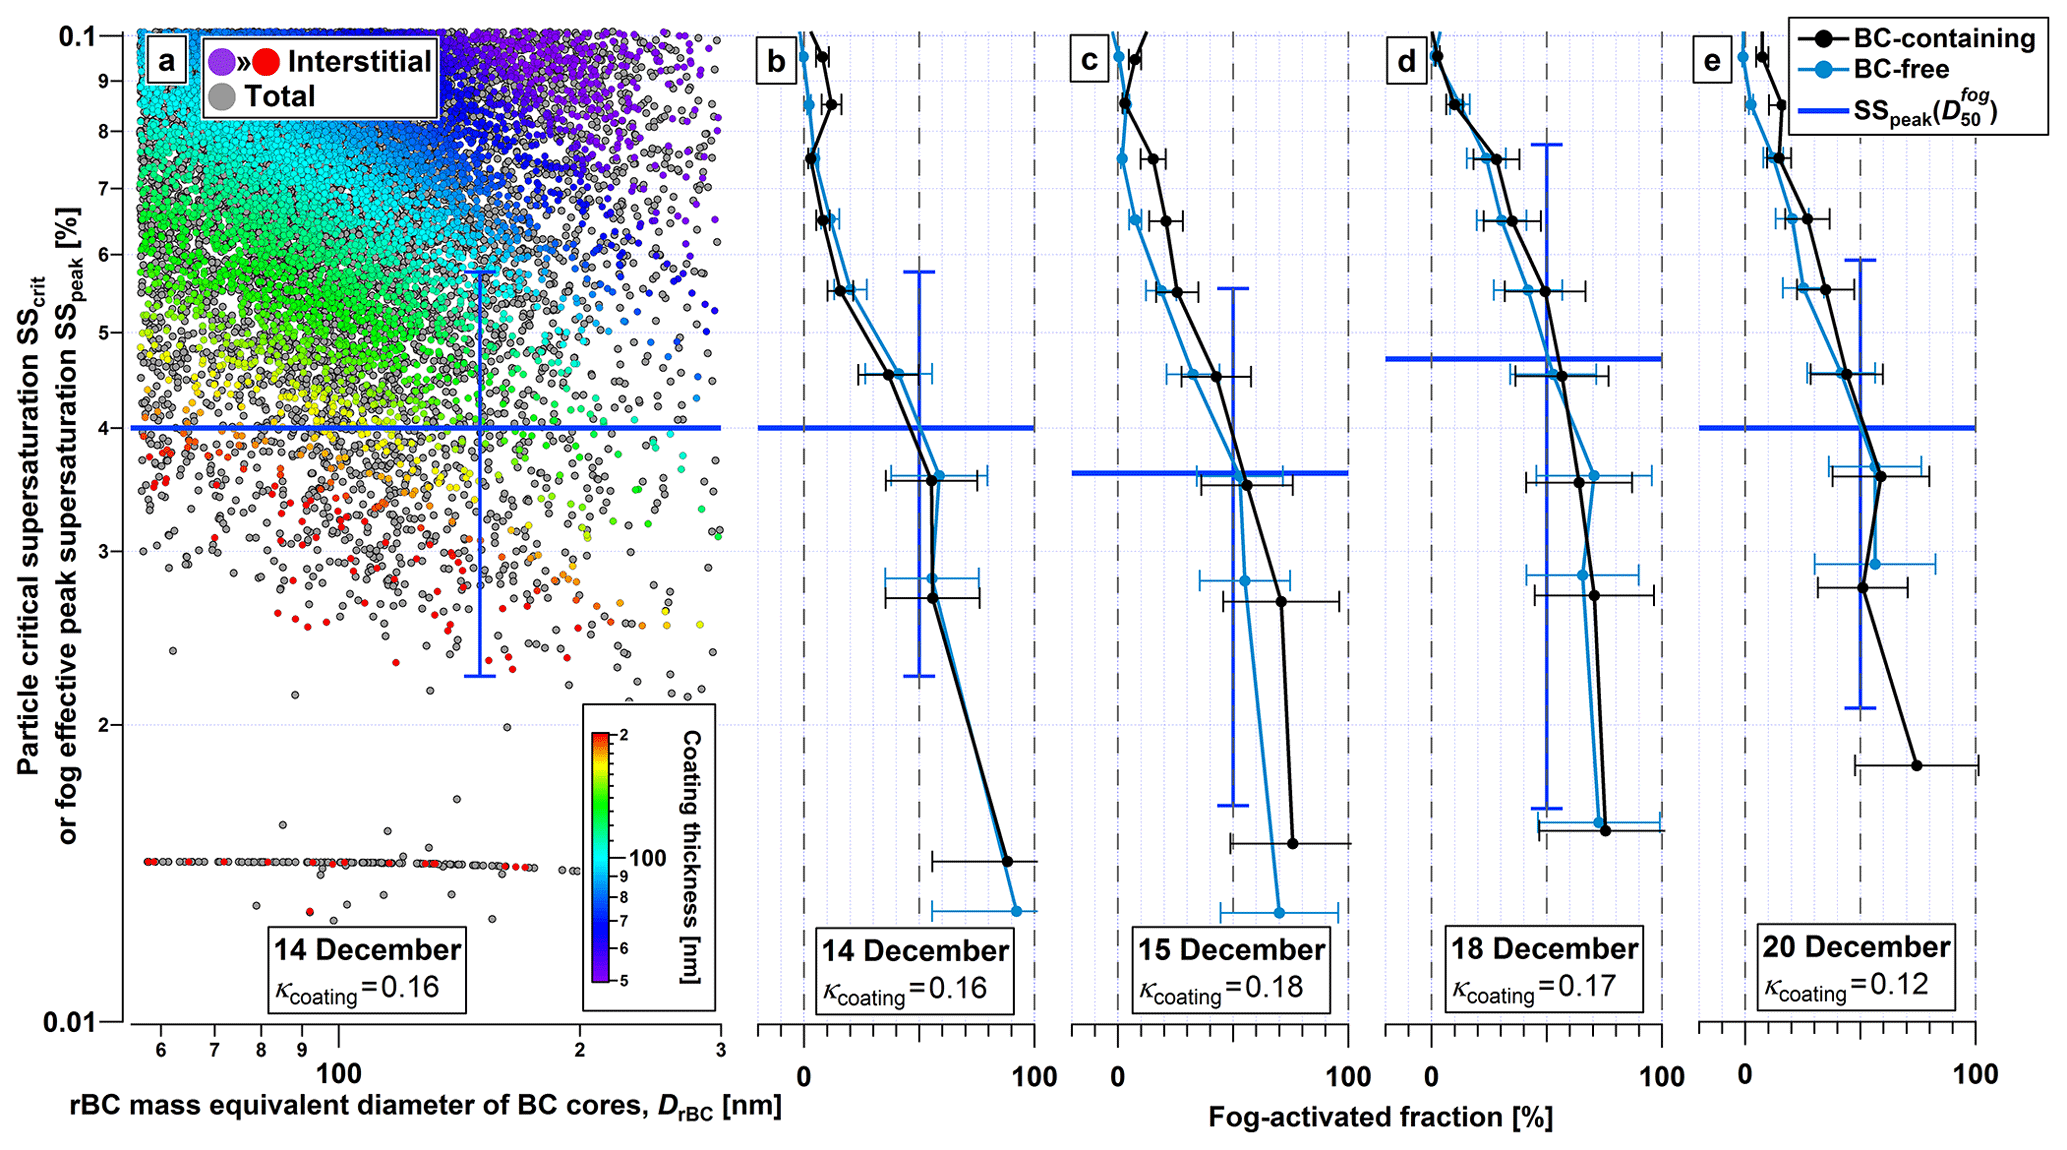
Figure 9(a) SScrit of individual particles sampled behind the total inlet (grey dots) and interstitial inlet (dots coloured by Δcoating) as a function of their DrBC during the 14 December fog event. The distinct band of data points appearing with an SScrit of 0.015 % corresponds to BC-containing particles which caused saturation of the scattering detector even in the leading edge range of the signal, making it impossible to accurately determine SScrit. As these particles are known to have lower SScrit than the most thickly coated particles which did not cause signal saturation, they are assigned a “randomly chosen” low value for SScrit and included in the figure. (b), (c), (d), (e) Fog-activated fractions of BC-containing (black lines) and BC-free (light blue lines) particles per class of 0.01 % SS for the 14, 15, 18 and 20 December fog events, respectively. The horizontal error bars associated with the activated fractions represent Poisson-based statistical uncertainties. The horizontal blue lines show the SSpeak for each fog event retrieved using (with the method and uncertainty explained in Sect. 2.3.5).
The activation of BC-containing particles to fog droplets as a function of BC core mass equivalent diameter, derived from the SP2 data behind the total and interstitial inlets, is shown in Fig. 8 for the 14 December fog event. The same analysis was performed for the 15, 18 and 20 December fog events; results were very similar; they are therefore not shown here. The BC core mass size distribution measured behind the total inlet peaked at a diameter around 140 nm (Fig. 8a). In the range 127 nm < DrBC < 212 nm, which overlaps with the peak of the mass size distribution, it is possible to split all BC-containing particles into the two sub-classes of BC particles with “no to moderate coating” or “thick coating” using the delay-time method (see Sect. 2.2.3). When comparing particles with equal BC core size (Fig. 8b), only around 15 % to 25 % had thick coating, whereas 75 % to 85 % had no or moderate coatings only. This corresponds to expectations for a site with substantial influence from fresh traffic emissions. Within the size limits of the delay-time method, the fog-activated fraction of all BC cores shown in Fig. 8c was close to zero and, within experimental uncertainty, also identical to the fog-activated fraction of BC cores with thin-to-moderate coatings because the BC particle population was dominated by this subclass (Fig. 8b). The BC cores associated with core diameter DrBC below 212 nm and a thin-to-moderate coating remained smaller than the minimum overall particle diameter required for activation: according to Fig. 7, this diameter was around 280 nm during the 14 December event, even for BC-free (water-soluble) particles. By contrast, the fog-activated fraction of thickly coated BC particles gradually increased with BC core diameter and reached around 40 % at DrBC=210 nm. This is explained by the fact that the substantial coating increases both the size and soluble volume fraction of these BC-containing particles such that some of them have a size bigger than the fog droplet activation threshold. In the size range DrBC > 212 nm, the fog-activated fraction of all BC particles also starts increasing because the threshold coating thickness to cross the activation threshold becomes smaller with increasing core size. These results demonstrate in a qualitative manner how acquisition of coatings makes the BC particles better nuclei for fog droplets by increasing the overall particle size and solubility.
Besides activation of BC-containing particles to droplets, coagulation between BC-containing particles and existing fog droplets could also potentially explain the presence of BC in fog droplets: the probability of coagulation between two particles is increased when the difference between their respective diameters increases, so small BC-containing particles may potentially coagulate with fog droplets. However, Fig. 8c clearly shows that droplet activation of BC-containing particles is the mechanism that explains the incorporation of BC cores into fog droplets in the present study: if coagulation between BC particles and fog droplets was giving a dominant contribution, then the fog-activated fraction of BC particles would exhibit much less size and coating dependence and would rather exhibit opposite trends. In other words, as coagulation scavenging efficiency decreases with increasing particle size (as shown by Ohata et al., 2016, for example), the BC core size and coating thickness dependence of coagulation scavenging would be opposite to the observed relationship. By contrast, the observation is consistent with expectations for nucleation scavenging.
3.5 Linking mixing state of BC, fog-critical supersaturation and droplet activation
The fog-critical supersaturation of individual BC-containing particles was calculated using the κ-Köhler theory and particle properties constrained with SP2 and sCCNC data: the former providing particle size and BC volume fraction, the latter providing coating hygroscopicity (see Sect. 2.3.2; Eqs., 1 and 3). Figure 9a shows these SScrit arranged by BC core size (abscissa) of all individual BC-containing particles as inferred from the 14 December fog event data as an example: data points from BC particles sampled behind the interstitial inlet are coloured by coating thickness, those sampled behind the total inlet are shown as grey dots. The fog effective peak supersaturation (SSpeak), retrieved from using the method described in Sect. 2.3.5, is marked with a blue horizontal line. Theoretically, every BC-containing particle whose SScrit is below the fog SSpeak should activate to a fog droplet (i.e. no data point from the interstitial inlet should appear below the blue line), whereas those particles with SScrit greater than the fog SSpeak should remain interstitial (i.e. equal number of data points for interstitial and total inlets above the blue line). The ratio of interstitial to total BC particle number indeed decreases below the blue line. However, some BC particles with SScrit < SSpeak are still detected behind the interstitial inlet, which can be explained by several facts: first, the fog SSpeak is not perfectly constant during the event; second, the input parameters for calculating SScrit are tainted with random measurement noise on a single-particle level; third, there are potential shortcomings in the κ-Köhler theory such as variations in particle shape being neglected.
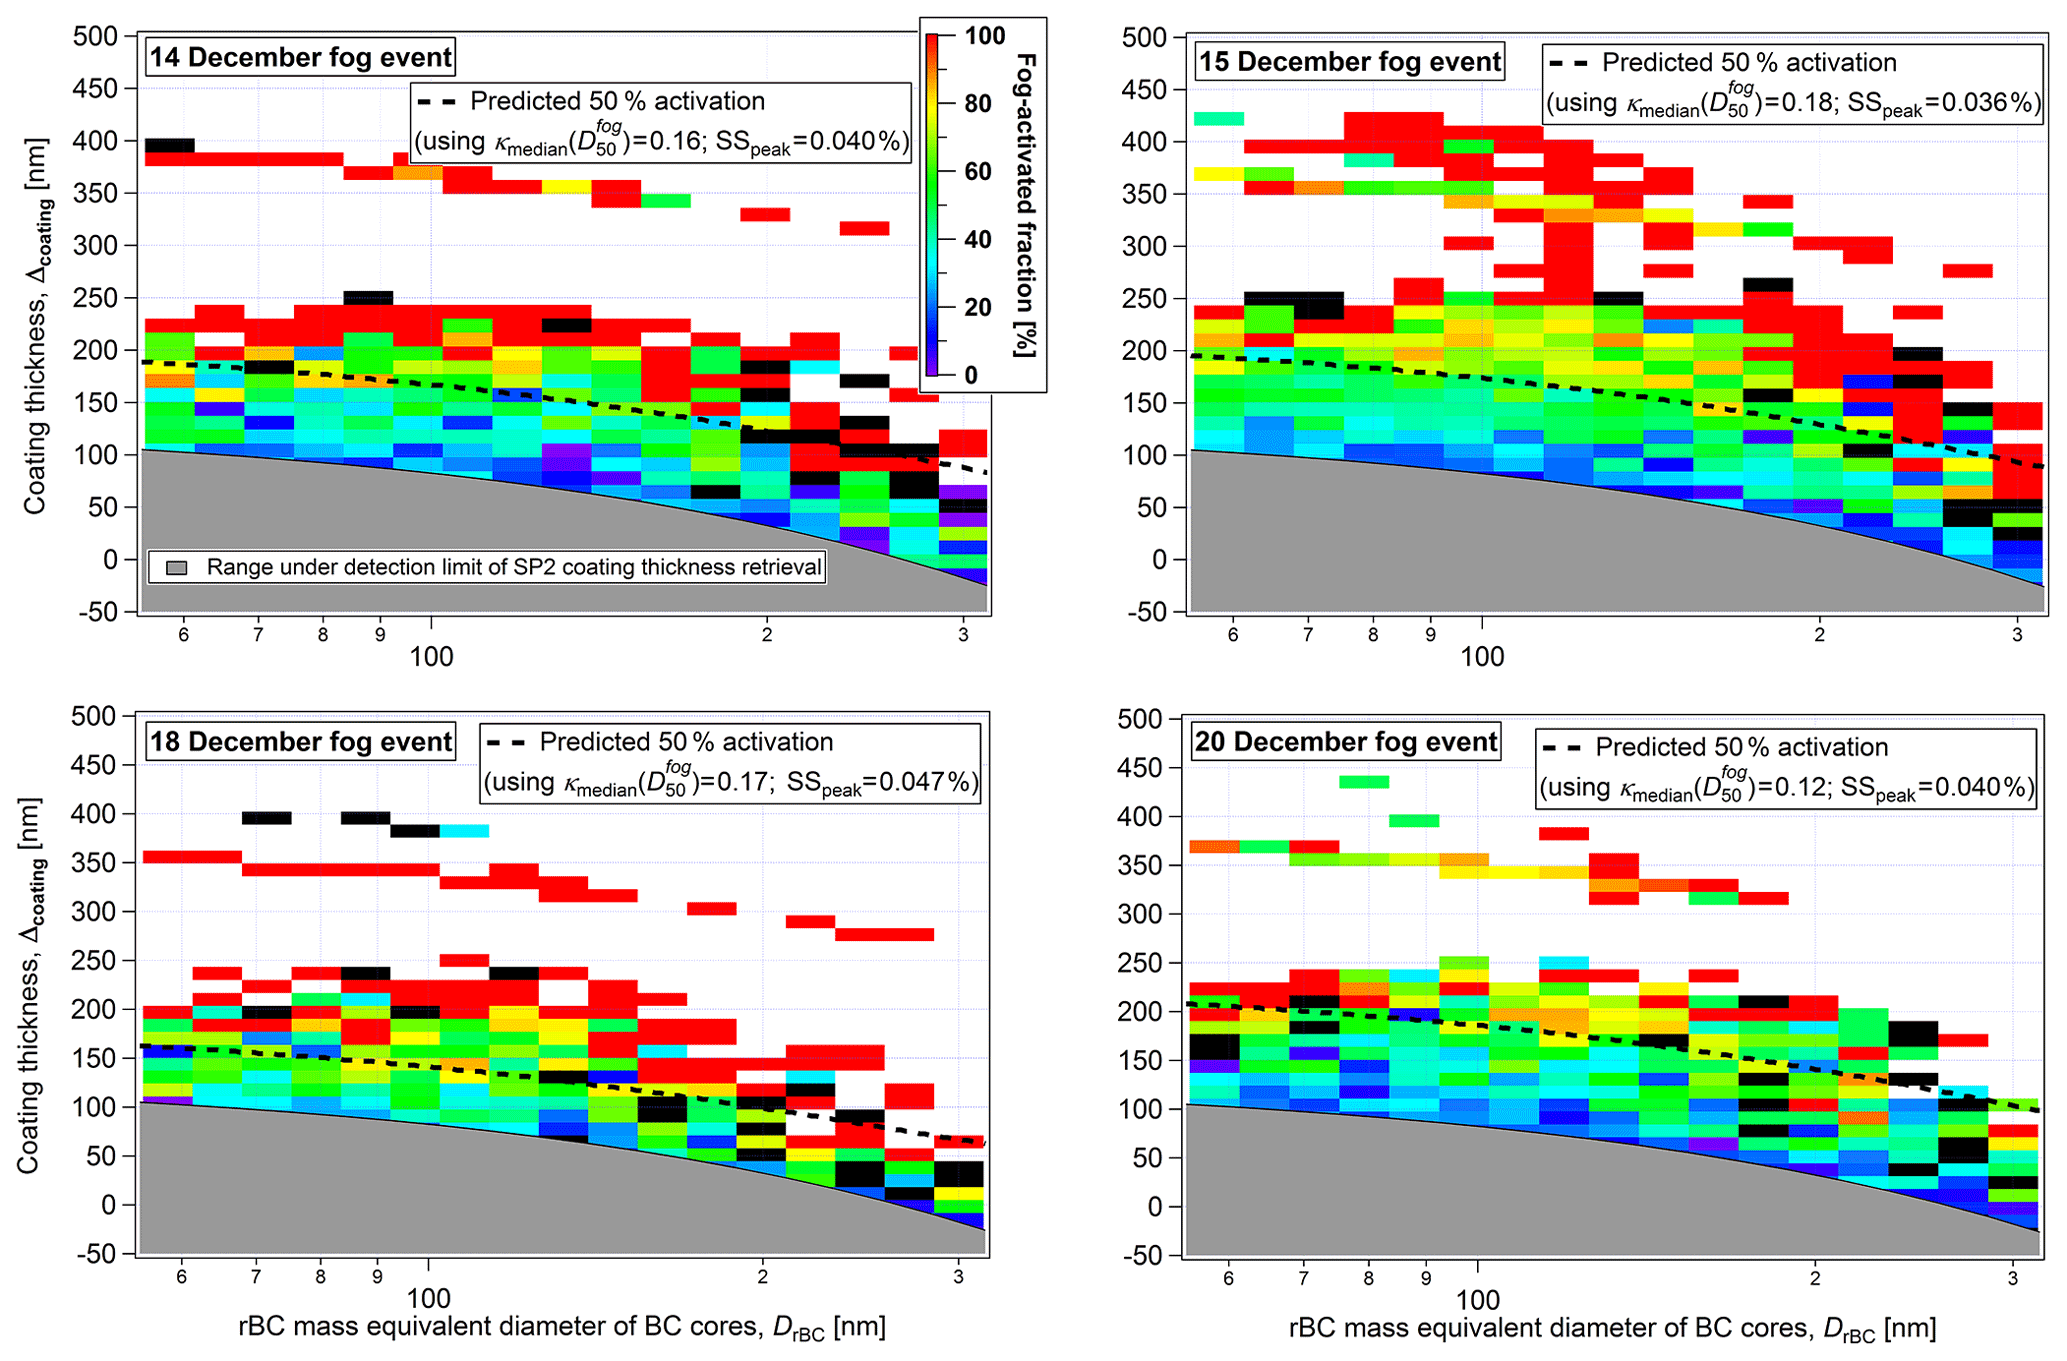
Figure 10Fog-activated fraction of BC cores (colour scale for the four panels), i.e. number fraction of BC particles that formed a fog droplet according to the measurements behind the interstitial and total inlets, as a function of BC core mass equivalent diameter (DrBC) and coating thickness (Δcoating), separately shown for all four fog events. The dashed line shows the pairs of core size and coating thickness for which the fog-activated fraction is expected to be 50 % according to predictions based on the ZSR rule and κ-Köhler theory. Black pixels in the image indicate 2-D bins for which no particle was found in the total inlet data while at least one particle appeared in the interstitial inlet data, thus leading to a negative fog-activated fraction. The grey shadings mask the range that is below the detection limit of the SP2, i.e. Dopt below around 210 nm. The distinct band of data points at Δcoating> ∼300 nm appears for the same reason as the band at SScrit=0.015 % in Fig. 9a; see corresponding caption for explanation.
In order to achieve a more quantitative closure between expected and observed activation of BC-containing particles to fog droplets, the single-particle data, as shown in Fig. 9a for one example fog event, were aggregated into SS bins (ΔSScrit=0.01 %) and averaged over all core sizes. The same was done for each fog event and resulting activation curves are shown in Fig. 9b–e.
For each fog event in Fig. 9, 50 % fog-activated fraction is reached at an SScrit very close to the SSpeak derived from . This agreement confirms that observed activation of BC particles in the fog matches the expected droplet activation behaviour of BC-containing particles as theoretically predicted from independently measured BC-particle properties (size, BC volume fraction and coating hygroscopicity). This demonstrates that closure is successfully achieved, i.e. SP2-based characterization of BC-containing particle properties combined with κ-Köhler theory is sufficient to accurately describe the activation behaviour of BC-containing particles in fog, despite the fact that both of them are based on the simplifying assumption of spherical core–shell morphology. It is important to note that the closure for the activation of BC-containing particles is insensitive to changes in κcoating as changing κcoating has two compensating effects (see Fig. S9 and corresponding discussion in the Supplement).
Figure 9b–e also contains the fog-activated fraction of BC-free particles detected by the SP2, for which SScrit was calculated using κ-Köhler theory with κmedian and optical diameter from the SP2. The 50 % activation is by definition reached by those particles with SScrit equal to SSpeak inferred from (small deviations are explained by binning the fog-activated fraction data in supersaturation rather than diameter space). The fact that the activation curves of BC-containing particles in Fig. 9b–e agree well with the activation curves of BC-free particles implies the following: the activation of BC-containing particles to fog droplets can be described in an identical way to the activation of BC-free particles by using the ZSR rule to calculate a κ value that accounts for the volume fraction of insoluble BC. This is an alternative but equivalent view of how closure is achieved for the activation of BC to fog droplets.
To our knowledge, Schroder et al. (2015) performed the only other similar closure between critical supersaturation of atmospheric BC-containing particles and retrieved peak supersaturation of real clouds, low-altitude stratocumulus in their case. They selectively sampled cloud droplets using a counterflow virtual impactor (CVI) and a total inlet and calculated the SScrit of particles and cloud SSpeak in a very similar way to in the present study (extracting DrBC and Δcoating from SP2 measurements and κmedian from AMS measurements; and using the ZSR mixing rule together with the κ-Köhler theory). However, while reporting general agreement between the range of predicted particle SScrit and calculated cloud SSpeak, they could not achieve an unequivocal closure as they could only determine lower limit values for Δcoating because of technical issues with the SP2.
The activation curves shown in Fig. 9b–e are, despite being based on single-particle data, averages over all BC-containing particles with equal SScrit, i.e. over particles with different combinations of BC core and coating thickness. In order to assess the role of BC core size and coating thickness for fog droplet activation in more detail, the fog-activated fraction inferred from measurements behind the interstitial and total inlets is shown in Fig. 10 as a function of BC core mass equivalent diameter and coating thickness measured by the SP2. This figure quantifies the coating thickness that was necessary for a BC core of a certain size to make it activate to a fog droplet at the SSpeak prevalent in the fog event under investigation. For a fixed BC core diameter, the fog-activated fraction generally increases from zero (blue colour) to 100 % (red colour) for increasing coating thickness, i.e. along vertical lines across the images. As expected and already qualitatively shown in Fig. 8, BC cores with thin to moderate coatings remained interstitial, with the threshold coating thickness for 20 % fog-activated fraction (blue colour) increasing from Δcoating≈20–50 nm to Δcoating≈80–120 nm for BC core diameters of 300 and 60 nm, respectively. Equivalently, the threshold coating thickness required for 100 % fog-activated fraction (red colour) also increases with decreasing BC core diameter, as particle size favours droplet activation (McFiggans et al., 2006). The dashed lines in Fig. 10 represent pairs of DrBC and Δcoating that would theoretically give to a particle an SScrit equal to the estimation of SSpeak (calculated using ) during the related fog event. This theoretical activation limit differs between fog events due to variations in SSpeak and κcoating. Generally, the agreement between the theoretically expected threshold and the observed 50 % fog-activated fraction (green colour) is good across all BC core diameters and fog events, which means that closure is achieved for all BC core sizes covered by the measurement. Systematic deviations may possibly be present for the largest core sizes, where the activation threshold is at highest BC volume fractions and where considering interactions between the BC core and the first layers of water surrounding it might become important. However, these differences are minor, counting statistics in this range are too poor, and simplifying assumptions in the data processing are too numerous to justify the use of more sophisticated theoretical calculations. The overall good agreement validates the simplified theoretical description as explained in Sect. 2.3.2 and confirms that, within uncertainties, the fate of a BC particle in fog can be predicted if DrBC, Δcoating and SSpeak are known. Several mixing-state-resolved modelling studies simulated scavenged fractions based on the estimation of the critical supersaturation using the Köhler theory combined with the ZSR mixing rule (e.g. Matsui, 2016; Ching et al., 2018). The present study suggests that such modelling approaches are valid, at least for fog with low peak supersaturation, and encourages future use of them.
Dalirian et al. (2018) conducted a laboratory study during which they atomized BC particles from aqueous solutions and then coated them with organics by using a tube furnace. They showed that the size and mixing state dependence of CCN activation of artificially produced BC with variable coatings agrees well with theoretical predictions. Our study shows that their findings from the laboratory also hold for the behaviour of atmospheric BC during fog formation, thus justifying the application of theories based on the Köhler theory and the ZSR mixing rule, or of parametrizations of activation thresholds for BC particles derived from such theories for example, in atmospheric model simulations.
During winter 2015–2016 a field campaign was performed at the Irchel university campus in Zurich in order to investigate the size-dependent activation of BC at different mixing states. We distinguished fresh BC-containing particles from emissions in the vicinity of the measurement site (heavily used roads, residential heating) and aged, background BC-containing particles, and found, based on the sCCNC-activated fraction spectrum, evidence of a high degree of external mixing during the morning rush hours due to a substantial number fraction of non-hygroscopic particles from fresh traffic emissions.
The half-activation cut-off diameter for activation of BC-free particles to form fog droplets varied between 320 and 380 nm during four fog events, which translates to very small overall activated number fractions in the range of ∼1 %. Fog peak supersaturations, which were inferred by combining this activation cut-off with CCNC-derived particle hygroscopicity, were found to be between 0.036 % and 0.047 %, consistent with previous literature.
The activation of BC-containing particles to fog droplets was also quantified. The majority of BC-containing particles remained interstitial (as with the large majority of BC-free particles); only those with substantial coatings were activated as the coating decreases their critical supersaturation by increasing size and solubility. The threshold coating thickness required for activation was shown to decrease with BC core size, as expected. Quantitative closure between measured and predicted activation of BC-containing particles to fog droplets was successfully achieved. Predictions are based on the Köhler theory combined with the ZSR mixing rule constrained with independently measured BC particle properties on a single-particle level. This confirms that the activation behaviour of atmospheric BC can be accurately predicted, within experimental uncertainty, with the knowledge of BC core diameter, coating thickness and coating hygroscopicity, while neglecting particle shape effects. When coupling such simplified theoretical descriptions with aging schemes in particle-resolved models, these results may help to reach a more realistic representation of the life cycle of BC in the atmosphere and to narrow the uncertainties associated with estimates of its radiative forcing.
Data used in this article are available in the Supplement.
The supplement related to this article is available online at: https://doi.org/10.5194/acp-19-2183-2019-supplement.
MG acquired the funding and conceptualized the study. The experiment was designed by MG and JS. MG supervised the study together with JS and UB. GM and JS organized and implemented the field campaign. JCC and MZ contributed to instrument preparation and calibration. GM analysed and validated the experimental data with support from JS, JCC, MZ and MG. GM prepared the paper and all co-authors contributed to interpretation of the results as well as paper review and editing.
The authors declare that they have no conflict of interest.
This article is part of the special issue “BACCHUS – Impact of Biogenic versus Anthropogenic emissions on Clouds and Climate: towards a Holistic UnderStanding (ACP/AMT/GMD inter-journal SI)”. It is not associated with a conference.
We would like to thank the University of Zurich for providing access to the
Irchel campus as a measurement site and the group led by Ulrike Lohmann ETH
Zurich for lending us a CCNC. This work is supported by the ERC under grant
ERC-CoG-615922-BLACARAT and the EU FP7 project BACCHUS (grant
no. 603445).
Edited by: Hinrich
Grothe
Reviewed by: three anonymous referees
Allan, J. D., Baumgardner, D., Raga, G. B., Mayol-Bracero, O. L., Morales-García, F., García-García, F., Montero-Martínez, G., Borrmann, S., Schneider, J., Mertes, S., Walter, S., Gysel, M., Dusek, U., Frank, G. P., and Krämer, M.: Clouds and aerosols in Puerto Rico – a new evaluation, Atmos. Chem. Phys., 8, 1293–1309, https://doi.org/10.5194/acp-8-1293-2008, 2008.
Baltensperger, U., Streit, N., Weingartner, E., Nyeki, S., Prévôt, A. S. H., Dingenen, R. V., Virkkula, A., Putaud, J.-P., Even, A., Brink, H. ten, Blatter, A., Neftel, A., and Gäggeler, H. W.: Urban and rural aerosol characterization of summer smog events during the PIPAPO field campaign in Milan, Italy, J. Geophys. Res.-Atmos., 107, LOP6-1–LOP6-14, https://doi.org/10.1029/2001JD001292, 2002.
Bond, T. C., Habib, G., and Bergstrom, R. W.: Limitations in the enhancement of visible light absorption due to mixing state, J. Geophys. Res., 111, D20211, https://doi.org/10.1029/2006JD007315, 2006.
Bond, T. C., Doherty, S. J., Fahey, D. W., Forster, P. M., Berntsen, T., DeAngelo, B. J., Flanner, M. G., Ghan, S., Kärcher, B., Koch, D., Kinne, S., Kondo, Y., Quinn, P. K., Sarofim, M. C., Schultz, M. G., Schulz, M., Venkataraman, C., Zhang, H., Zhang, S., Bellouin, N., Guttikunda, S. K., Hopke, P. K., Jacobson, M. Z., Kaiser, J. W., Klimont, Z., Lohmann, U., Schwarz, J. P., Shindell, D., Storelvmo, T., Warren, S. G., and Zender, C. S.: Bounding the role of black carbon in the climate system: A scientific assessment, J. Geophys. Res.-Atmos., 118, 5380–5552, https://doi.org/10.1002/jgrd.50171, 2013.
Brown, S., Lee, T., Roberts, P., and Collett, J.: Wintertime residential biomass burning in Las Vegas, Nevada; marker components and apportionment methods, Atmosphere, 7, 58, https://doi.org/10.3390/atmos7040058, 2016.
Budisulistiorini, S. H., Canagaratna, M. R., Croteau, P. L., Baumann, K., Edgerton, E. S., Kollman, M. S., Ng, N. L., Verma, V., Shaw, S. L., Knipping, E. M., Worsnop, D. R., Jayne, J. T., Weber, R. J., and Surratt, J. D.: Intercomparison of an Aerosol Chemical Speciation Monitor (ACSM) with ambient fine aerosol measurements in downtown Atlanta, Georgia, Atmos. Meas. Tech., 7, 1929–1941, https://doi.org/10.5194/amt-7-1929-2014, 2014.
Cappa, C. D., Onasch, T. B., Massoli, P., Worsnop, D. R., Bates, T. S., Cross, E. S., Davidovits, P., Hakala, J., Hayden, K. L., Jobson, B. T., Kolesar, K. R., Lack, D. A., Lerner, B. M., Li, S.-M., Mellon, D., Nuaaman, I., Olfert, J. S., Petäjä, T., Quinn, P. K., Song, C., Subramanian, R., Williams, E. J., and Zaveri, R. A.: Radiative absorption enhancements due to the mixing state of atmospheric black carbon, Science, 337, 1078–1081, https://doi.org/10.1126/science.1223447, 2012.
Ching, J., West, M., and Riemer, N.: Quantifying impacts of aerosol mixing state on nucleation-scavenging of black carbon aerosol particles, Atmosphere, 9, 17, https://doi.org/10.3390/atmos9010017, 2018.
Collett, J. L., Herckes, P., Youngster, S., and Lee, T.: Processing of atmospheric organic matter by California radiation fogs, Atmos. Res., 87, 232–241, https://doi.org/10.1016/j.atmosres.2007.11.005, 2008.
Collier, S., Williams, L. R., Onasch, T. B., Cappa, C. D., Zhang, X., Russell, L. M., Chen, C.-L., Sanchez, K. J., Worsnop, D. R., and Zhang, Q.: Influence of emissions and aqueous processing on particles containing black carbon in a polluted urban environment: insights from a soot particle-aerosol mass spectrometer, J. Geophys. Res.-Atmos., 123, 6648–6666, https://doi.org/10.1002/2017JD027851, 2018.
Cubison, M. J., Ervens, B., Feingold, G., Docherty, K. S., Ulbrich, I. M., Shields, L., Prather, K., Hering, S., and Jimenez, J. L.: The influence of chemical composition and mixing state of Los Angeles urban aerosol on CCN number and cloud properties, Atmos. Chem. Phys., 8, 5649–5667, https://doi.org/10.5194/acp-8-5649-2008, 2008.
Dalirian, M., Ylisirniö, A., Buchholz, A., Schlesinger, D., Ström, J., Virtanen, A., and Riipinen, I.: Cloud droplet activation of black carbon particles coated with organic compounds of varying solubility, Atmos. Chem. Phys., 18, 12477–12489, https://doi.org/10.5194/acp-18-12477-2018, 2018.
Facchini, M. C., Fuzzi, S., Zappoli, S., Andracchio, A., Gelencsér, A., Kiss, G., Krivácsy, Z., Mészáros, E., Hansson, H.-C., and Alsberg, T.: Partitioning of the organic aerosol component between fog droplets and interstitial air, J. Geophys. Res.-Atmos., 104, 26821–26832, 1999.
Fröhlich, R., Cubison, M. J., Slowik, J. G., Bukowiecki, N., Prévôt, A. S. H., Baltensperger, U., Schneider, J., Kimmel, J. R., Gonin, M., Rohner, U., Worsnop, D. R., and Jayne, J. T.: The ToF-ACSM: a portable aerosol chemical speciation monitor with TOFMS detection, Atmos. Meas. Tech., 6, 3225–3241, https://doi.org/10.5194/amt-6-3225-2013, 2013.
Fuzzi, S., Facchini, M. C., Orsi, G., and Ferri, D.: Seasonal trend of fog water chemical composition in the Po Valley, Environ. Pollut., 75, 75–80, 1992.
Gao, R. S., Schwarz, J. P., Kelly, K. K., Fahey, D. W., Watts, L. A., Thompson, T. L., Spackman, J. R., Slowik, J. G., Cross, E. S., Han, J.-H., Davidovits, P., Onasch, T. B., and Worsnop, D. R.: A novel method for estimating light-scattering properties of soot aerosols using a modified single-particle soot photometer, Aerosol Sci. Tech., 41, 125–135, https://doi.org/10.1080/02786820601118398, 2007.
Gelencsér, A., May, B., Simpson, D., Sánchez-Ochoa, A., Kasper-Giebl, A., Puxbaum, H., Caseiro, A., Pio, C., and Legrand, M.: Source apportionment of PM2.5 organic aerosol over Europe: primary/secondary, natural/anthropogenic, and fossil/biogenic origin, J. Geophys. Res., 112, D23S04, https://doi.org/10.1029/2006JD008094, 2007.
Gerber, H.: Supersaturation and droplet spectral evolution in fog, J. Atmos. Sci., 48, 2569–2588, https://doi.org/10.1175/1520-0469(1991)048<2569:SADSEI>2.0.CO;2, 1991.
Glickman, T. S.: Glossary of meteorology, American Meteorological Society, ISBN 9781878220349, 850 pp., The University of Chicago Press, 2000.
Gordon, C. A., Herrera, R., and Hutchinson, T. C.: Studies of fog events at two cloud forests near Caracas, Venezuela-I. Frequency and duration of fog, Atmos. Environ., 28, 317–322, 1994.
Gundel, L. A., Benner, W. H., and Hansen, A. D. A.: Chemical composition of fog water and interstitial aerosol in Berkeley, California, Atmos. Environ., 28, 2715–2725, 1994.
Gysel, M., Nyeki, S., Weingartner, E., Baltensperger, U., Giebl, H., Hitzenberger, R., Petzold, A., and Wilson, C. W.: Properties of jet engine combustion particles during the PartEmis experiment: hygroscopicity at subsaturated conditions, Geophys. Res. Lett., 30, 1566, https://doi.org/10.1029/2003GL016896, 2003.
Gysel, M., Laborde, M., Olfert, J. S., Subramanian, R., and Gröhn, A. J.: Effective density of Aquadag and fullerene soot black carbon reference materials used for SP2 calibration, Atmos. Meas. Tech., 4, 2851–2858, https://doi.org/10.5194/amt-4-2851-2011, 2011.
Haeffelin, M., Bergot, T., Elias, T., Tardif, R., Carrer, D., Chazette, P., Colomb, M., Drobinski, P., Dupont, E., and Dupont, J.-C.: PARISFOG: shedding new light on fog physical processes, B. Am. Meteorol. Soc., 91, 767–783, 2010.
Hallberg, A., Ogren, J. A., Noone, K. J., Heintzenberg, J., Berner, A., Solly, I., Kruisz, C., Reischl, G., Fuzzi, S., Facchini, M. C., Hansson, H.-C., Wiedensohler, A., and Svenningsson, I. B.: Phase partitioning for different aerosol species in fog, Tellus B, 44, 545–555, https://doi.org/10.1034/j.1600-0889.1992.t01-2-00008.x, 1992.
Hammer, E., Bukowiecki, N., Gysel, M., Jurányi, Z., Hoyle, C. R., Vogt, R., Baltensperger, U., and Weingartner, E.: Investigation of the effective peak supersaturation for liquid-phase clouds at the high-alpine site Jungfraujoch, Switzerland (3580 m a.s.l.), Atmos. Chem. Phys., 14, 1123–1139, https://doi.org/10.5194/acp-14-1123-2014, 2014a.
Hammer, E., Gysel, M., Roberts, G. C., Elias, T., Hofer, J., Hoyle, C. R., Bukowiecki, N., Dupont, J.-C., Burnet, F., Baltensperger, U., and Weingartner, E.: Size-dependent particle activation properties in fog during the ParisFog 2012/13 field campaign, Atmos. Chem. Phys., 14, 10517–10533, https://doi.org/10.5194/acp-14-10517-2014, 2014b.
Hodnebrog, Ø., Myhre, G., and Samset, B. H.: How shorter black carbon lifetime alters its climate effect, Nat. Commun., 5, 5065, https://doi.org/10.1038/ncomms6065, 2014.
Hueglin, C., Gehrig, R., Baltensperger, U., Gysel, M., Monn, C., and Vonmont, H.: Chemical characterisation of PM2.5, PM10 and coarse particles at urban, near-city and rural sites in Switzerland, Atmos. Environ., 39, 637–651, https://doi.org/10.1016/j.atmosenv.2004.10.027, 2005.
Jiang, R., Tan, H., Tang, L., Cai, M., Yin, Y., Li, F., Liu, L., Xu, H., Chan, P. W., Deng, X., and Wu, D.: Comparison of aerosol hygroscopicity and mixing state between winter and summer seasons in Pearl River Delta region, China, Atmos. Res., 169, 160–170, https://doi.org/10.1016/j.atmosres.2015.09.031, 2016.
Jurányi, Z., Tritscher, T., Gysel, M., Laborde, M., Gomes, L., Roberts, G., Baltensperger, U., and Weingartner, E.: Hygroscopic mixing state of urban aerosol derived from size-resolved cloud condensation nuclei measurements during the MEGAPOLI campaign in Paris, Atmos. Chem. Phys., 13, 6431–6446, https://doi.org/10.5194/acp-13-6431-2013, 2013.
Kenny, L. C., Gussman, R., and Meyer, M.: Development of a sharp-cut cyclone for ambient aerosol monitoring applications, Aerosol Sci. Tech., 32, 338–358, https://doi.org/10.1080/027868200303669, 2000.
Klimont, Z., Kupiainen, K., Heyes, C., Purohit, P., Cofala, J., Rafaj, P., Borken-Kleefeld, J., and Schöpp, W.: Global anthropogenic emissions of particulate matter including black carbon, Atmos. Chem. Phys., 17, 8681–8723, https://doi.org/10.5194/acp-17-8681-2017, 2017.
Koch, D., Schulz, M., Kinne, S., McNaughton, C., Spackman, J. R., Balkanski, Y., Bauer, S., Berntsen, T., Bond, T. C., Boucher, O., Chin, M., Clarke, A., De Luca, N., Dentener, F., Diehl, T., Dubovik, O., Easter, R., Fahey, D. W., Feichter, J., Fillmore, D., Freitag, S., Ghan, S., Ginoux, P., Gong, S., Horowitz, L., Iversen, T., Kirkevåg, A., Klimont, Z., Kondo, Y., Krol, M., Liu, X., Miller, R., Montanaro, V., Moteki, N., Myhre, G., Penner, J. E., Perlwitz, J., Pitari, G., Reddy, S., Sahu, L., Sakamoto, H., Schuster, G., Schwarz, J. P., Seland, Ø., Stier, P., Takegawa, N., Takemura, T., Textor, C., van Aardenne, J. A., and Zhao, Y.: Evaluation of black carbon estimations in global aerosol models, Atmos. Chem. Phys., 9, 9001–9026, https://doi.org/10.5194/acp-9-9001-2009, 2009.
Köhler, H.: The nucleus in and the growth of hygroscopic droplets, T. Faraday Soc., 32, 1152–1161, https://doi.org/10.1039/TF9363201152, 1936.
Laborde, M., Mertes, P., Zieger, P., Dommen, J., Baltensperger, U., and Gysel, M.: Sensitivity of the Single Particle Soot Photometer to different black carbon types, Atmos. Meas. Tech., 5, 1031–1043, https://doi.org/10.5194/amt-5-1031-2012, 2012a.
Laborde, M., Schnaiter, M., Linke, C., Saathoff, H., Naumann, K.-H., Möhler, O., Berlenz, S., Wagner, U., Taylor, J. W., Liu, D., Flynn, M., Allan, J. D., Coe, H., Heimerl, K., Dahlkötter, F., Weinzierl, B., Wollny, A. G., Zanatta, M., Cozic, J., Laj, P., Hitzenberger, R., Schwarz, J. P., and Gysel, M.: Single Particle Soot Photometer intercomparison at the AIDA chamber, Atmos. Meas. Tech., 5, 3077–3097, https://doi.org/10.5194/amt-5-3077-2012, 2012b.
Laborde, M., Crippa, M., Tritscher, T., Jurányi, Z., Decarlo, P. F., Temime-Roussel, B., Marchand, N., Eckhardt, S., Stohl, A., Baltensperger, U., Prévôt, A. S. H., Weingartner, E., and Gysel, M.: Black carbon physical properties and mixing state in the European megacity Paris, Atmos. Chem. Phys., 13, 5831–5856, https://doi.org/10.5194/acp-13-5831-2013, 2013.
Lange, C. A., Matschullat, J., Zimmermann, F., Sterzik, G., and Wienhaus, O.: Fog frequency and chemical composition of fog water – a relevant contribution to atmospheric deposition in the eastern Erzgebirge, Germany, Atmos. Environ., 37, 3731–3739, https://doi.org/10.1016/S1352-2310(03)00350-9, 2003.
Lanz, V. A., Prévôt, A. S. H., Alfarra, M. R., Weimer, S., Mohr, C., DeCarlo, P. F., Gianini, M. F. D., Hueglin, C., Schneider, J., Favez, O., D'Anna, B., George, C., and Baltensperger, U.: Characterization of aerosol chemical composition with aerosol mass spectrometry in Central Europe: an overview, Atmos. Chem. Phys., 10, 10453–10471, https://doi.org/10.5194/acp-10-10453-2010, 2010.
Leaitch, W. R., Banic, C. M., Isaac, G. A., Couture, M. D., Liu, P. S. K., Gultepe, I., Li, S.-M., Kleinman, L., Daum, P. H., and MacPherson, J. I.: Physical and chemical observations in marine stratus during the 1993 North Atlantic Regional Experiment: Factors controlling cloud droplet number concentrations, J. Geophys. Res., 101, 29, https://doi.org/10.1029/96JD01228, 1996.
Liu, D., Allan, J., Whitehead, J., Young, D., Flynn, M., Coe, H., McFiggans, G., Fleming, Z. L., and Bandy, B.: Ambient black carbon particle hygroscopic properties controlled by mixing state and composition, Atmos. Chem. Phys., 13, 2015–2029, https://doi.org/10.5194/acp-13-2015-2013, 2013.
Liu, D., Allan, J. D., Young, D. E., Coe, H., Beddows, D., Fleming, Z. L., Flynn, M. J., Gallagher, M. W., Harrison, R. M., Lee, J., Prevot, A. S. H., Taylor, J. W., Yin, J., Williams, P. I., and Zotter, P.: Size distribution, mixing state and source apportionment of black carbon aerosol in London during wintertime, Atmos. Chem. Phys., 14, 10061–10084, https://doi.org/10.5194/acp-14-10061-2014, 2014.
Liu, J., Fan, S., Horowitz, L. W., and Levy, H.: Evaluation of factors controlling long-range transport of black carbon to the Arctic, J. Geophys. Res., 116, D04307, https://doi.org/10.1029/2010JD015145, 2011.
Lund, M. T., Berntsen, T. K., and Samset, B. H.: Sensitivity of black carbon concentrations and climate impact to aging and scavenging in OsloCTM2–M7, Atmos. Chem. Phys., 17, 6003–6022, https://doi.org/10.5194/acp-17-6003-2017, 2017.
Maalick, Z., Kühn, T., Korhonen, H., Kokkola, H., Laaksonen, A., and Romakkaniemi, S.: Effect of aerosol concentration and absorbing aerosol on the radiation fog life cycle, Atmos. Environ., 133, 26–33, https://doi.org/10.1016/j.atmosenv.2016.03.018, 2016.
Makkonen, L., Lehtonen, P., and Helle, L.: Anemometry in Icing Conditions, J. Atmos. Ocean. Tech., 18, 1457–1469, https://doi.org/10.1175/1520-0426(2001)018<1457:AIIC>2.0.CO;2, 2001.
Mason, J.: The Physics of radiation fog, J. Meteorol. Soc. Jpn., 60, 486–499, https://doi.org/10.2151/jmsj1965.60.1_486, 1982.
Matsui, H.: Black carbon simulations using a size- and mixing-state-resolved three-dimensional model: 2. Aging timescale and its impact over East Asia: Size- and Mixing-State-Resolved BC Simulation 2, J. Geophys. Res.-Atmos., 121, 1808–1821, https://doi.org/10.1002/2015JD023999, 2016.
McFiggans, G., Artaxo, P., Baltensperger, U., Coe, H., Facchini, M. C., Feingold, G., Fuzzi, S., Gysel, M., Laaksonen, A., Lohmann, U., Mentel, T. F., Murphy, D. M., O'Dowd, C. D., Snider, J. R., and Weingartner, E.: The effect of physical and chemical aerosol properties on warm cloud droplet activation, Atmos. Chem. Phys., 6, 2593–2649, https://doi.org/10.5194/acp-6-2593-2006, 2006.
Middlebrook, A. M., Bahreini, R., Jimenez, J. L., and Canagaratna, M. R.: Evaluation of Composition-Dependent Collection Efficiencies for the Aerodyne Aerosol Mass Spectrometer using Field Data, Aerosol Sci. Tech., 46, 258–271, https://doi.org/10.1080/02786826.2011.620041, 2012.
Ming, Y. and Russell, L. M.: Organic aerosol effects on fog droplet spectra, J. Geophys. Res., 109, D10206, https://doi.org/10.1029/2003JD004427, 2004.
Moore, R. H., Nenes, A., and Medina, J.: Scanning mobility CCN analysis – a method for fast measurements of size-resolved CCN distributions and activation kinetics, Aerosol Sci. Tech., 44, 861–871, https://doi.org/10.1080/02786826.2010.498715, 2010.
Moteki, N. and Kondo, Y.: Effects of mixing state on black carbon measurements by laser-induced incandescence, Aerosol Sci. Tech., 41, 398–417, https://doi.org/10.1080/02786820701199728, 2007.
Moteki, N., Kondo, Y., Miyazaki, Y., Takegawa, N., Komazaki, Y., Kurata, G., Shirai, T., Blake, D. R., Miyakawa, T., and Koike, M.: Evolution of mixing state of black carbon particles: aircraft measurements over the western Pacific in March 2004, Geophys. Res. Lett., 34, L11803, https://doi.org/10.1029/2006GL028943, 2007.
Nessler, R., Bukowiecki, N., Henning, S., Weingartner, E., Calpini, B., and Baltensperger, U.: Simultaneous dry and ambient measurements of aerosol size distributions at the Jungfraujoch, Tellus B, 55, 808–819, https://doi.org/10.3402/tellusb.v55i3.16371, 2003.
NOAA: National oceanic and atmospheric administration (NOAA), surface observations and reports, Office of the federal coordinator for meteorological services and supporting research Federal meteorological handbook number 1, FCM-H1-1995 Washington, DC, available at: http://marrella.meteor.wisc.edu/aos452/fmh1.pdf (last access: 8 November 2018), 1995.
Noone, K. J., Ogren, J. A., Hallberg, A., Heintzenberg, J., Ström, J., Hansson, H.-C., Svenningsson, B., Wiedensohler, A., Fuzzi, S., Facchini, M. C., Arends, B. G., and Berner, A.: Changes in aerosol size- and phase distributions due to physical and chemical processes in fog, Tellus B, 44, 489–504, https://doi.org/10.1034/j.1600-0889.1992.t01-4-00004.x, 1992.
Ohata, S., Moteki, N., Mori, T., Koike, M., and Kondo, Y.: A key process controlling the wet removal of aerosols: new observational evidence, Sci. Rep. UK, 6, 34113, https://doi.org/10.1038/srep34113, 2016.
Paramonov, M., Aalto, P. P., Asmi, A., Prisle, N., Kerminen, V.-M., Kulmala, M., and Petäjä, T.: The analysis of size-segregated cloud condensation nuclei counter (CCNC) data and its implications for cloud droplet activation, Atmos. Chem. Phys., 13, 10285–10301, https://doi.org/10.5194/acp-13-10285-2013, 2013.
Petters, M. D. and Kreidenweis, S. M.: A single parameter representation of hygroscopic growth and cloud condensation nucleus activity, Atmos. Chem. Phys., 7, 1961–1971, https://doi.org/10.5194/acp-7-1961-2007, 2007.
Petzold, A., Ogren, J. A., Fiebig, M., Laj, P., Li, S.-M., Baltensperger, U., Holzer-Popp, T., Kinne, S., Pappalardo, G., Sugimoto, N., Wehrli, C., Wiedensohler, A., and Zhang, X.-Y.: Recommendations for reporting “black carbon” measurements, Atmos. Chem. Phys., 13, 8365–8379, https://doi.org/10.5194/acp-13-8365-2013, 2013.
Pruppacher, H. R. and Klett, J. D.: Microphysics of clouds and precipitation, Nature, 284, 88, https://doi.org/10.1038/284088b0, 1980.
Pruppacher, H. R., Klett, J. D., and Wang, P. K.: Microphysics of clouds and precipitation, Aerosol Sci. Tech., 28, 381–382, https://doi.org/10.1080/02786829808965531, 1998.
Putaud, J.-P., Raes, F., Van Dingenen, R., Brüggemann, E., Facchini, M.-C., Decesari, S., Fuzzi, S., Gehrig, R., Hüglin, C., Laj, P., Lorbeer, G., Maenhaut, W., Mihalopoulos, N., Müller, K., Querol, X., Rodriguez, S., Schneider, J., Spindler, G., Brink, H. ten, Tørseth, K., and Wiedensohler, A.: A European aerosol phenomenology – 2: chemical characteristics of particulate matter at kerbside, urban, rural and background sites in Europe, Atmos. Environ., 38, 2579–2595, https://doi.org/10.1016/j.atmosenv.2004.01.041, 2004.
Putaud, J.-P., Van Dingenen, R., Alastuey, A., Bauer, H., Birmili, W., Cyrys, J., Flentje, H., Fuzzi, S., Gehrig, R., Hansson, H. C., Harrison, R. M., Herrmann, H., Hitzenberger, R., Hüglin, C., Jones, A. M., Kasper-Giebl, A., Kiss, G., Kousa, A., Kuhlbusch, T. A. J., Löschau, G., Maenhaut, W., Molnar, A., Moreno, T., Pekkanen, J., Perrino, C., Pitz, M., Puxbaum, H., Querol, X., Rodriguez, S., Salma, I., Schwarz, J., Smolik, J., Schneider, J., Spindler, G., ten Brink, H., Tursic, J., Viana, M., Wiedensohler, A., and Raes, F.: A European aerosol phenomenology – 3: Physical and chemical characteristics of particulate matter from 60 rural, urban, and kerbside sites across Europe, Atmos. Environ., 44, 1308–1320, https://doi.org/10.1016/j.atmosenv.2009.12.011, 2010.
Reid, J. S., Hobbs, P. V., Rangno, A. L., and Hegg, D. A.: Relationships between cloud droplet effective radius, liquid water content, and droplet concentration for warm clouds in Brazil embedded in biomass smoke, J. Geophys. Res., 104, 6145–6153, https://doi.org/10.1029/1998JD200119, 1999.
Riemer, N., West, M., Zaveri, R. A., and Easter, R. C.: Simulating the evolution of soot mixing state with a particle-resolved aerosol model, J. Geophys. Res., 114, D09202, https://doi.org/10.1029/2008JD011073, 2009.
Roach, W. T., Brown, R., Caughey, S. J., Garland, J. A., and Readings, C. J.: The physics of radiation fog: I – a field study, Q. J. Roy. Meteor. Soc., 102, 313–333, https://doi.org/10.1002/qj.49710243204, 1976.
Roberts, G. C. and Nenes, A.: A continuous-flow streamwise thermal-gradient CCN chamber for atmospheric measurements, Aerosol Sci. Tech., 39, 206–221, https://doi.org/10.1080/027868290913988, 2005.
Rose, D., Gunthe, S. S., Mikhailov, E., Frank, G. P., Dusek, U., Andreae, M. O., and Pöschl, U.: Calibration and measurement uncertainties of a continuous-flow cloud condensation nuclei counter (DMT-CCNC): CCN activation of ammonium sulfate and sodium chloride aerosol particles in theory and experiment, Atmos. Chem. Phys., 8, 1153–1179, https://doi.org/10.5194/acp-8-1153-2008, 2008.
SARTC: Swiss automatic road traffic counts (SARTC); Federal Roads Office (FEDRO), available at: https://www.astra.admin.ch/astra/en/home/documentation/traffic-data/data-and-publication/swiss-automatic-road-traffic-counts–sartc-.html, last access: 8 May 2015.
Scherrer, S. C. and Appenzeller, C.: Fog and low stratus over the Swiss Plateau – a climatological study: fog and low stratus over the Swiss Plateau, Int. J. Climatol., 34, 678–686, https://doi.org/10.1002/joc.3714, 2014.
Schroder, J. C., Hanna, S. J., Modini, R. L., Corrigan, A. L., Kreidenwies, S. M., Macdonald, A. M., Noone, K. J., Russell, L. M., Leaitch, W. R., and Bertram, A. K.: Size-resolved observations of refractory black carbon particles in cloud droplets at a marine boundary layer site, Atmos. Chem. Phys., 15, 1367–1383, https://doi.org/10.5194/acp-15-1367-2015, 2015.
Schwarz, J. P., Gao, R. S., Fahey, D. W., Thomson, D. S., Watts, L. A., Wilson, J. C., Reeves, J. M., Darbeheshti, M., Baumgardner, D. G., Kok, G. L., Chung, S. H., Schulz, M., Hendricks, J., Lauer, A., Kärcher, B., Slowik, J. G., Rosenlof, K. H., Thompson, T. L., Langford, A. O., Loewenstein, M., and Aikin, K. C.: Single-particle measurements of midlatitude black carbon and light-scattering aerosols from the boundary layer to the lower stratosphere, J. Geophys. Res., 111, D16207, https://doi.org/10.1029/2006JD007076, 2006.
Schwarz, J. P., Gao, R. S., Spackman, J. R., Watts, L. A., Thomson, D. S., Fahey, D. W., Ryerson, T. B., Peischl, J., Holloway, J. S., Trainer, M., Frost, G. J., Baynard, T., Lack, D. A., de Gouw, J. A., Warneke, C., and Del Negro, L. A.: Measurement of the mixing state, mass, and optical size of individual black carbon particles in urban and biomass burning emissions, Geophys. Res. Lett., 35, L13810, https://doi.org/10.1029/2008GL033968, 2008.
Shinozuka, Y., Clarke, A. D., DeCarlo, P. F., Jimenez, J. L., Dunlea, E. J., Roberts, G. C., Tomlinson, J. M., Collins, D. R., Howell, S. G., Kapustin, V. N., McNaughton, C. S., and Zhou, J.: Aerosol optical properties relevant to regional remote sensing of CCN activity and links to their organic mass fraction: airborne observations over Central Mexico and the US West Coast during MILAGRO/INTEX-B, Atmos. Chem. Phys., 9, 6727–6742, https://doi.org/10.5194/acp-9-6727-2009, 2009.
Stephens, M., Turner, N., and Sandberg, J.: Particle identification by laser-induced incandescence in a solid-state laser cavity, Appl. Optics, 42, 3726–3736, https://doi.org/10.1364/AO.42.003726, 2003.
Stokes, R. H. and Robinson, R. A.: Interactions in aqueous nonelectrolyte solutions. I. Solute-solvent equilibria, J. Phys. Chem., 70, 2126–2131, https://doi.org/10.1021/j100879a010, 1966.
Subramanian, R., Kok, G. L., Baumgardner, D., Clarke, A., Shinozuka, Y., Campos, T. L., Heizer, C. G., Stephens, B. B., de Foy, B., Voss, P. B., and Zaveri, R. A.: Black carbon over Mexico: the effect of atmospheric transport on mixing state, mass absorption cross-section, and BC/CO ratios, Atmos. Chem. Phys., 10, 219–237, https://doi.org/10.5194/acp-10-219-2010, 2010.
Swietlicki, E., Hansson, H.-C., Hämeri, K., Svenningsson, B., Massling, A., Mcfiggans, G., Mcmurry, P. H., Petäjä, T., Tunved, P., Gysel, M., Topping, D., Weingartner, E., Baltensperger, U., Rissler, J., Wiedensohler, A., and Kulmala, M.: Hygroscopic properties of submicrometer atmospheric aerosol particles measured with H-TDMA instruments in various environments – a review, Tellus B, 60, 432–469, https://doi.org/10.1111/j.1600-0889.2008.00350.x, 2008.
Syed, F. S., Körnich, H., and Tjernström, M.: On the fog variability over south Asia, Clim. Dynam., 39, 2993–3005, https://doi.org/10.1007/s00382-012-1414-0, 2012.
Szidat, S., Jenk, T. M., Synal, H.-A., Kalberer, M., Wacker, L., Hajdas, I., Kasper-Giebl, A., and Baltensperger, U.: Contributions of fossil fuel, biomass-burning, and biogenic emissions to carbonaceous aerosols in Zurich as traced by 14C, J. Geophys. Res., 111, D07206, https://doi.org/10.1029/2005JD006590, 2006.
Taylor, J. W., Allan, J. D., Liu, D., Flynn, M., Weber, R., Zhang, X., Lefer, B. L., Grossberg, N., Flynn, J., and Coe, H.: Assessment of the sensitivity of core ∕ shell parameters derived using the single-particle soot photometer to density and refractive index, Atmos. Meas. Tech., 8, 1701–1718, https://doi.org/10.5194/amt-8-1701-2015, 2015.
Tritscher, T., Jurányi, Z., Martin, M., Chirico, R., Gysel, M., Heringa, M. F., DeCarlo, P. F., Sierau, B., Prévôt, A. S. H., Weingartner, E., and Baltensperger, U.: Changes of hygroscopicity and morphology during ageing of diesel soot, Environ. Res. Lett., 6, 034026, https://doi.org/10.1088/1748-9326/6/3/034026, 2011.
Warren, S., Eastman, R., and Hahn, C. J.: Clouds and fog | climatology, in: Encyclopedia of Atmospheric Sciences (Second Edition), edited by: North, G. R., Pyle, J., and Zhang, F., 161–169, Academic Press, Oxford, 2015.
Weingartner, E., Burtscher, H., and Baltensperger, U.: Hygroscopic properties of carbon and diesel soot particles, Atmos. Environ., 31, 2311–2327, https://doi.org/10.1016/S1352-2310(97)00023-X, 1997.
Weingartner, E., Saathoff, H., Schnaiter, M., Streit, N., Bitnar, B., and Baltensperger, U.: Absorption of light by soot particles: determination of the absorption coefficient by means of aethalometers, J. Aerosol Sci., 34, 1445–1463, https://doi.org/10.1016/S0021-8502(03)00359-8, 2003.
Wittbom, C., Eriksson, A. C., Rissler, J., Carlsson, J. E., Roldin, P., Nordin, E. Z., Nilsson, P. T., Swietlicki, E., Pagels, J. H., and Svenningsson, B.: Cloud droplet activity changes of soot aerosol upon smog chamber ageing, Atmos. Chem. Phys., 14, 9831–9854, https://doi.org/10.5194/acp-14-9831-2014, 2014.
World Health Organization: Health effects of black carbon, WHO Regional Office for Europe, Copenhagen, 2012.
World Meteorological Organization: WMO/GAW aerosol measurement procedures: guidelines and recommendations, 2016.
Zhu, Y., Hinds, W. C., Kim, S., and Sioutas, C.: Concentration and size distribution of ultrafine particles near a major highway, J. Air Waste Manage., 52, 1032–1042, https://doi.org/10.1080/10473289.2002.10470842, 2002.
Zotter, P., Herich, H., Gysel, M., El-Haddad, I., Zhang, Y., Mocnik, G., Hüglin, C., Baltensperger, U., Szidat, S., and Prévôt, A. S. H.: Evaluation of the absorption Ångström exponents for traffic and wood burning in the Aethalometer-based source apportionment using radiocarbon measurements of ambient aerosol, Atmos. Chem. Phys., 17, 4229–4249, https://doi.org/10.5194/acp-17-4229-2017, 2017.
coatingmade of hydrophilic material during atmospheric aging. The predictability of this process using theory was successfully tested.