the Creative Commons Attribution 4.0 License.
the Creative Commons Attribution 4.0 License.
 | 13 Feb 2019
Upper tropospheric CH4 and CO affected by the South Asian summer monsoon during the Oxidation Mechanism Observations mission
Laura Tomsche
Andrea Pozzer
Narendra Ojha
Uwe Parchatka
Jos Lelieveld
Horst Fischer
The Asian monsoon anticyclone (AMA) is annual phenomenon in the northern hemispheric upper troposphere and lower stratosphere. It is part of the South Asian summer monsoon system, and it has a clearly observable signature due to the vertical transport of polluted air masses from the surface to the upper troposphere by monsoon convection. We performed in situ measurements of carbon monoxide (CO) and methane (CH4) in the region of monsoon outflow and in background air in the upper troposphere (Mediterranean, Arabian Peninsula, and Arabian Sea) using optical absorption spectroscopy on board the High Altitude and LOng range (HALO) research aircraft during the OMO (Oxidation Mechanism Observations) mission in summer 2015. We identified the transport pathways and the origin of the trace gases with back trajectories, which were calculated using the Lagrangian particle dispersion model FLEXPART, and we compared the in situ data with simulations of the atmospheric chemistry general circulation model EMAC. CH4 and CO mixing ratios were found to be enhanced within the AMA, the in situ data increased by 72.1 and 20.1 ppbv on average, respectively, and originated in the South Asian region (Indo-Gangetic Plain, northeastern India, Bangladesh, and the Bay of Bengal). It appears that CH4 is an ideal monsoon tracer in the upper troposphere due to its extended lifetime and the strong South Asian emissions. Furthermore, we used the measurements and model results to study the dynamics of the AMA over several weeks during the monsoon season, with an emphasis on the southern and western areas in the upper troposphere. We distinguished four AMA modes based on different meteorological conditions. On one occasion we observed that under the influence of dwindling flow the transport barrier between the anticyclone and its surroundings weakened, expelling air masses from the AMA. The trace gases exhibited a distinct AMA fingerprint; we also found that CH4 accumulated over the course of the OMO campaign.
- Article
(10065 KB) - Full-text XML
-
Supplement
(11029 KB) - BibTeX
- EndNote


The Asian monsoon anticyclone (AMA) is an annual, large-scale weather phenomenon in the upper troposphere and lower stratosphere during the boreal summer. It is enclosed by the westerly subtropical jet in the north and the easterly jet in the south and extends over southern Asia and the Middle East up to the Mediterranean. It is formed by diabatic heating in the South Asian monsoon region (Gill, 1980; Hoskins and Rodwell, 1995). The anticyclone is a strong and nearly closed circulation system, which is variable with respect to strength and location (Hsu and Plumb, 2000; Popovic and Plumb, 2001; Garny and Randel, 2013; Ploeger et al., 2015). The strong winds at its edges act as transport barrier for chemical constituents in the upper troposphere. Stratospheric tracers, such as ozone, generally show lower concentrations inside the AMA compared with outside of the system (Randel and Park, 2006; Park et al., 2008). Tropospheric tracers, like CO and CH4, are uplifted to the upper troposphere by the strong monsoon convection. These chemical constituents can be trapped in the anticyclone, change the atmospheric chemistry in the upper troposphere and lower stratosphere, and clearly signify the monsoon influence (Park et al., 2007). The signature of the anticyclone has been identified from different measurement platforms, including satellites and aircraft. Airborne measurements are rare and limited in time and space but resolve small scales. For example, the in-service airborne projects CARIBIC (Civil Aircraft for the Regular Investigation of the atmosphere Based on an Instrument Container; e.g. Schuck et al., 2012; Rauthe-Schöch et al., 2016) and IAGOS-MOZAIC (IAGOS – In-service Aircraft for a Global Observing System) and MOZAIC (Measurements of OZone by Airbus In-service aircraft); Dethof et al., 1999; Barret et al., 2016) reported trace gas measurements in the Asian monsoon region. In addition, aircraft campaigns investigated the Asian monsoon during the MINOS campaign (Lelieveld et al., 2002; Scheeren et al., 2003), the Earth System Model Validation (ESMVal) campaign (Gottschaldt et al., 2017), and the Transport and Composition in the Upper Troposphere and Lowermost Stratosphere (TACTS) campaign (Vogel et al., 2014). In contrast, satellite data cover a larger spatial area and can be used for long-term measurements; however, satellites are limited to their overpass tracks and have a coarse resolution. The obscured view due to clouds during the South Asian monsoon additionally restricts the satellite view (e.g. Ojha et al., 2016), which requires long-term averaging in time and should be complemented by in situ measurements. Satellite data for different trace gases, such as H2O (Park et al., 2004; Randel and Park, 2006), CO (Li et al., 2005; Park et al., 2008), and CH4 (Park et al., 2004), show the vertical and horizontal extent of the AMA and are generally in agreement with model simulations (e.g. Bergman et al., 2013; Nützel et al., 2016; Pan et al., 2016). To improve model outputs and satellite data retrievals, airborne measurements are necessary.
A more physically motivated criterion to distinguish between the AMA and its surroundings in the upper troposphere is the potential vorticity (PV; e.g. Garny and Randel, 2013; Ploeger et al., 2015). In the anticyclone, PV values on isentropic surfaces are lower than outside. Therefore, a maximum in the PV gradient can be used to identify the horizontal transport barrier associated with the AMA. However, applying the PV criterion is not straightforward as PV values in the AMA increase during the monsoon season and decrease from the extra-tropics towards the tropics, which limits its usefulness. Nevertheless, it is quite helpful in combination with trace gas distributions from in situ and satellite measurements.
During the MINOS aircraft campaign the outflow of the AMA was investigated over the eastern Mediterranean Basin (Lelieveld et al., 2002; Scheeren et al., 2003), while during the Earth System Model Validation (ESMVal) campaign a single flight was performed from Male, in the Maldives, to Larnaca, Cyprus, in September 2012 that intersected the AMA at an altitude of 150 hPa (Gottschaldt et al., 2017). In situ airborne measurements in the region of the Mediterranean, the Arabian Peninsula, and the Arabian Sea during the monsoon season are still limited, even though the AMA impacts these regions either by its extent or via outflow. Here we present results from an aircraft mission, which focuses on the AMA between the Indian Ocean and the Mediterranean. The OMO (Oxidation Mechanism Observations) measurement campaign took place in July/August 2015, with the High Altitude and LOng range (HALO) research aircraft performing flights at altitudes between 11 and 15 km over the above-mentioned regions to investigate the dynamics and atmospheric chemistry in the upper troposphere over 5 weeks during the monsoon season.
The present study focuses on the measurements of CH4 and CO, which document long-distance transport of air pollution, as these species have extended lifetimes of 8–9 years (for CH4; Lelieveld et al., 2016) and 2–3 months (for CO; Xiao et al., 2007). Therefore, these trace gases can be used to identify emission sources from the surface as they are co-emitted with other pollutants; they have both natural and anthropogenic sources. Major CO sources are anthropogenic and are emitted via combustion processes of fossil fuel, biomass, and domestic fuel. Its natural sources are mainly from vegetation and oceans, but these are minor (Pandis and Seinfeld, 2006). CH4 is also emitted from the combustion of fossil fuel and biomass (Khalil, 2000). Further sources are rice cultivation and ruminants, in addition to swamps and flood areas. With respect to wetlands, the uncertainty in CH4 emissions is still a large concern in atmospheric chemical transport models (Bloom et al., 2017, and references there in). In South Asia anthropogenic emissions are increasing due to the growing population and economic development (Ohara et al., 2007; Rauthe-Schöch et al., 2016). The observations of CH4 and CO show zonal and meridional concentration gradients as well as vertical gradients in the upper troposphere, allowing for the investigation of the extent of the AMA. In order to differentiate background from AMA-influenced air masses, we derived a CH4 based threshold. Furthermore, we compared our observations with EMAC model simulations, which extend the view on the trace gas distribution from a regional (along the flight tracks) to a global scale. To study the transport pathways we calculated back trajectories with the Lagrangian particle dispersion model FLEXPART along the flight tracks. Using FLEXPART we gained a more detailed insight into the dynamics of these pathways. We compared the back trajectories with observations of CH4 and CO to distinguish between different transport pathways. Thus, we also studied the origin of emissions within South Asia. Finally, we investigated the variability of the AMA over several weeks as the anticyclone changes its position, extent, and strength due to the monsoon dynamics.
2.1 OMO campaign
The Oxidation Mechanism Observation (OMO) aircraft measurement campaign focused on the self-cleaning capacity of the atmosphere in connection with the Indian summer monsoon. The mission took place in July/August 2015 with flight tracks in the upper troposphere (10–15 km) over the Mediterranean, the Arabian Peninsula, and the Indian Ocean (Fig. 1). In South Asia the pollution emissions are growing and during the monsoon season they are uplifted into the upper troposphere. The pollutants are partly removed by wet deposition or transformation into soluble gases, or they are involved in air chemistry and transported downwind of the sources. For a broad analysis of the efficiency of the self-cleaning mechanism a large variety of chemical compounds, including CH4, CO, OH, HO2, NOy, SO2, RO2, H2O2, and total peroxides, were measured during the multi-institutional campaign, involving the Max Planck Institute for Chemistry (Mainz), the Research Centre Jülich, the German Aerospace Centre, the Research Centre Karlsruhe, and the universities of Bremen, Heidelberg, and Wuppertal. The main focuses were the oxidation processes and free radical chemistry, the efficiency of convective cloud transport and wet deposition, and the long-distance transport of air pollution and the associated impacts on air quality and climate change. The OMO mission comprised 111 flight hours during 17 flights. HALO was based alternately at Paphos (Cyprus) and on Gan (in the Maldives) with refuelling stops at the Bahrain airport. Further information about OMO can be found in Lelieveld et al. (2018) and on the following website: http://www.halo.dlr.de/science/missions/omo/omo.html (last access: 29 January 2019).
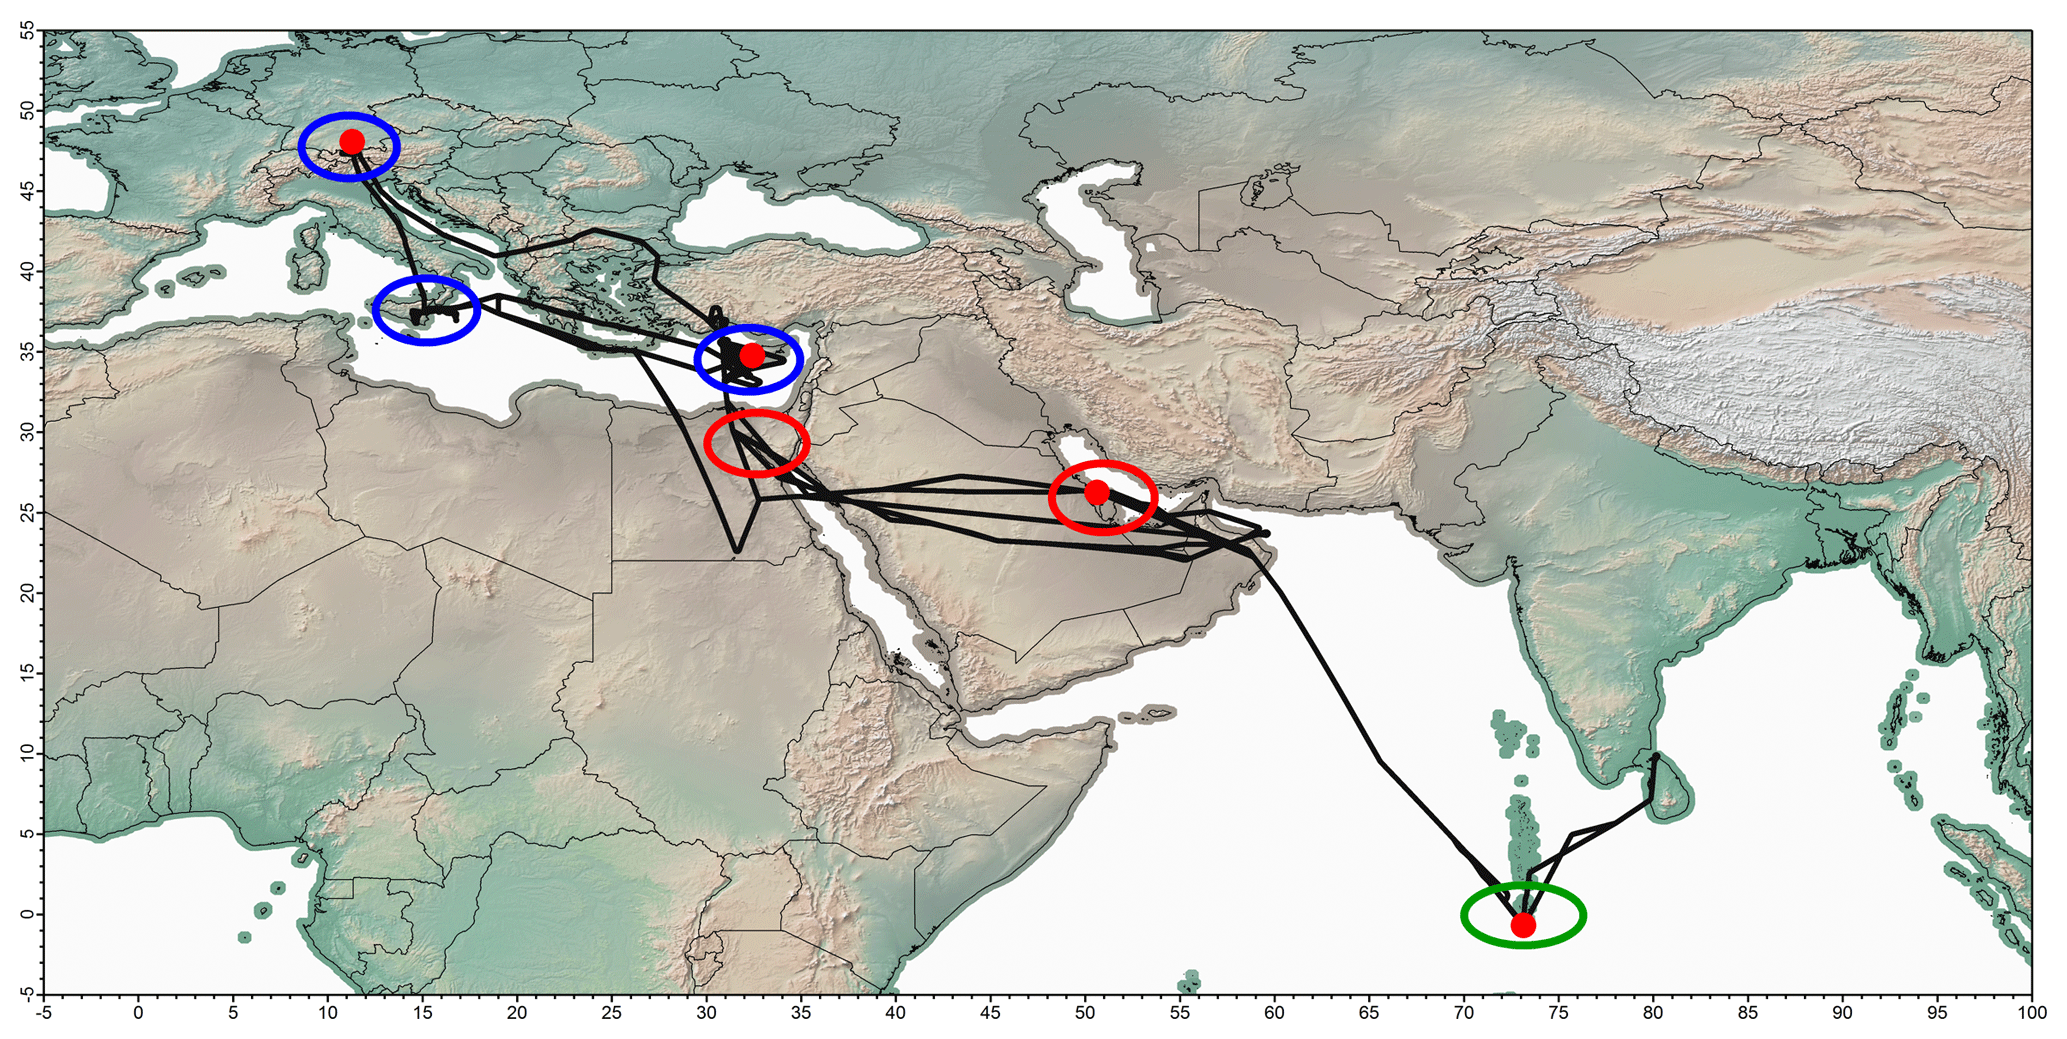
Figure 1An overview of the flight tracks during OMO showing all four airports (red dots): Oberpfaffenhofen (Germany), Paphos (Cyprus), Bahrain, and Gan (Maldives). Additionally, the regions of the northern hemispheric background (blue), the AMA (red), and the southern hemispheric background (green) profiles are marked.
2.2 Trace gas measurements
We employed the TRISTAR instrument (Tracer In Situ TDLAS for Atmospheric Research – where TDLAS stands for Tunable Diode Laser Absorption Spectrometry), which is an infrared (IR)-quantum cascade laser absorption spectrometer for airborne measurements of trace gases (CO, CH4, and HCHO) on board HALO; the instrument has a compact and robust design, consisting of an optical set-up and the instrument electronics. TRISTAR has been described in more detail in previous publications (Schiller et al., 2008 and references therein; Tadic et al., 2017). The electronic portion of the instrument, including the laser controller, data acquisition, etc., is integrated into the upper section of half a 19 rack. Mounted on the top of the rack is the optical set-up consisting of a liquid nitrogen cryostat, which houses three infrared quantum cascade lasers for CO, CH4, and HCHO and two cryogenic photovoltaic mercury–cadmium–telluride detectors, a double corner cube multi-pass cell according to White (1976), and several mirrors to reflect and collimate the beam. The optical unit is fixed on shock mounts for protection against vibrations. The trace gases are detected sequentially via pneumatically driven pop-up mirrors.
A detailed description of the electronic set-up is given in Schiller et al. (2008). With a 66 ms saw-tooth current ramp, the laser emission is scanned across a rotational–vibrational absorption line of the target species. In addition, the frequency of the laser is modulated via its injection current with a sinusoidal shaped 20 kHz frequency. At the detector the signal is demodulated at 40 kHz by a lock-in amplifier. For CO and CH4 two measurement modes are used: ambient air and in-flight calibration. The in-flight calibrations are realized with a secondary standard from pressurized bottles (6 L bottle, Auer GmbH, Germany), calibrated against certified reference gases. CO is calibrated against a reference gas (121.44±1.46 ppbv), which is calibrated against a secondary standard (155.8±0.45 ppbv). The latter was measured against a dilution gas (10 ppm ±1 %) from Empa (Swiss Federal Laboratories for Materials Science and Technology) referring to a NIST (National Institute for Science and Technology) standard. CH4 is calibrated against a working standard based on the NOAA 2004 scale by Dlugokencky et al. (2005) and has an uncertainty of ±0.3 ppbv relating to the CMDL83 standard (Dlugokencky et al., 2005). Furthermore the in situ CO and CH4 data are drift corrected by interpolation between regular in-flight calibrations (Tadic et al., 2017).
Under the assumption of a Gaussian error propagation, the total uncertainty consists of the statistical error (noise and drift correction) and the systematical error (calibration to reference gases). The total campaign average uncertainties are 5.1 % and 0.275 % for CO and CH4, respectively. During OMO the CO accuracy degraded, due to problems with the CO laser in the second half of the mission. A detailed overview of the total uncertainties for all the flights is presented in Table S1 in the Supplement.
2.3 FLEXPART back trajectories
The origin of the air masses was derived using the Lagrangian particle dispersion model FLEXPART version 9.2 beta (Stohl et al., 1998). The model is driven by ECMWF (European Centre for Medium-Range Forecasts) operational data with a horizontal resolution of 1∘ × 1∘ and a vertical resolution of 137 levels between 1013.25 and 0.01 hPa. The temporal resolution is 3 h, with analyses at 00:00, 06:00, 12:00, and 18:00 UTC and forecasts for 03:00, 09:00, 15:00, and 21:00 UTC. FLEXPART accounts for turbulence using the mean wind plus turbulent fluctuations and the mesoscale wind fluctuations (Stohl et al., 2010). The planetary boundary layer (PBL) height is parameterized following the concept of Vogelezang and Holtslag (1996) using the critical Richardson number (Stohl et al., 2010). Vertical transport is calculated using the Langevin equation (Thomson, 1987), which takes the turbulent vertical wind and its standard deviation into account. It also includes a decrease in the air density with height. Additional moist convection is parameterized according to Emanuel and Zivkovic-Rothman (1999). Their parameterization builds on temperature and humidity fields to provide mass flux information (Stohl et al., 2005). Trajectories are started every 10 min along the flight tracks for air parcels, neglecting loss processes due to deposition or chemical reactions. The trajectories are calculated 10 days back in time for 10 000 parcels that are initialized per release point (size: 1∘ × 1∘ × 500 m and 1 h). The model output is a dispersion field, which consists of several parameters, i.e. geographical position, PBL height, and temperature, for each parcel per 3 h interval. The amount of data can be condensed via cluster analyses according to Stohl et al. (2002). These cluster trajectories are called centroid trajectories; they are comparable to traditional trajectories, but include the contributions of turbulence and convection via the centroid of all particles per time step.
2.4 EMAC model data
The ECHAM/MESSy Atmospheric Chemistry (EMAC) model consists of the general circulation model ECHAM5 (fifth generation of the European Center HAMburg model, Roeckner et al., 2006) and the Modular Earth Submodel System (MESSy, Jöckel et al., 2005, 2010), which extends the model to a fully coupled chemistry climate model. The horizontal resolution applied is 2.8∘ × 2.8∘, and the vertical resolution is determined by 90 layers on a hybrid pressure grid between the surface and 0.01 hPa. The EMAC model was not run in an offline chemistry transport model mode, as the radiation calculations were based on simulated green house gas concentrations. The model was weakly nudged towards ECMWF ERA-Interim data (Jeuken et al., 1996) and therefore reproduced very similar dynamics to the ECMWF model (although not binary identical). The simulation is an extension of simulation RC1SD-base-10 (Jöckel et al., 2016) in order to cover the full OMO campaign. Few changes to the original simulation have been applied (i.e. increased South Asia SO2 emissions and reduced lightning NOx), as described in Lelieveld et al. (2018). Although the simulation is a continuation of a well evaluated experiment, the simulation was run from 1 March 2015 to give the SO2 and NOx time to balance to the new emissions (i.e. 4-month spin-up time). Only the data from July/August 2015, which cover the field campaign are actually used. The EMAC model is a hydrostatic model and the convective transport is parameterized (Tost et al., 2006; Ouwersloot et al., 2015). Indication of the vertical transport time in EMAC can be found in Krol et al. (2018), where a comparison with model of similar complexity is also shown. The emissions are based on the Representative Concentration Pathways (RCP) 8.5 for anthropogenic activity (Van Vuuren et al., 2011) and the Global Fire Emissions Database (GFED) v3.1 for biomass burning emission of 2015 (van der Werf et al., 2010). For methane additional sources of both wetlands in the Amazon and North American shale gas drilling were added to simulate the methane trend since 2007 (Zimmermann et al., 2018).
We used two different model outputs. One is the output from the SD4 submodel, which was developed by Jöckel et al. (2010) for simulations along moving platforms, such as ships or aircraft. The data collection takes place in four dimensions (space and time) and the data are interpolated online; thus, no information is lost due to interpolation after the simulation. The data along the flight track have a time resolution of 12 min (i.e. the model time step), and are compared to the in situ data for CO and CH4, averaged over 12 min. The second model output is given as three-dimensional daily mean data for different parameters, like CO, CH4, and the wind field. With these data the position of the AMA can be identified on different pressure levels, as well as its vertical extent, via vertical profiles. Additionally, the identification of emission sources at the surface is possible.
2.5 Satellite data
Cloud-top pressure information is used as a proxy for convection. We compared the location of the convective clouds with the location of the uplift of the back trajectories simulated by FLEXPART. The cloud-top pressure data are collected from the MODIS instrument on-board the Aqua satellite, via measured radiances in the spectral absorption bands at 15 µm for CO2 (Menzel et al., 2008). In general, the atmosphere becomes more opaque with increasing wavelength due to the absorption of CO2 between 13.3 and 15 µm. Thus, the measured radiances in these spectral bands are sensitive to different pressure levels. The cloud-top pressure is determined by the ratio of two pairs of adjacent wavelengths in the infrared. For Aqua MODIS the ratios of 14.24 ∕ 13.94, 13.94 ∕ 13.64, and 13.64 ∕ 13.34 µm are used for high, midlevel, and low-level clouds, respectively. The data are derived from the Level-3 MODIS Atmosphere Daily Global Product data (MYD08D3, Platnick, 2015), which are available from the following NASA website: (https://ladsweb.modaps.eosdis.nasa.gov/, last access: 6 April 2017). The resolution of the data is 1∘ × 1∘ for daily means.
3.1 CH4 and CO profiles
Vertical profiles were flown over Oberpfaffenhofen (Germany), Paphos (Cyprus), Etna (Italy), Egypt, Bahrain, and Gan (Maldives) (marked in Fig. 1). As observed, the CO and CH4 profiles measured during OMO indicate different altitude distributions depending on the geographical location and partly also on the meteorological situation, especially for Paphos and Egypt. Profiles over Egypt were measured when the AMA extended over this region. Profiles over Paphos were sampled during periods when the AMA was and was not positioned over Cyprus. Here profiles over Paphos, Etna, and Oberpaffenhofen are used to derive a Northern Hemisphere (NH) background, profiles over Egypt and Bahrain are used to derive altitude dependent information under monsoon influence (AMA profiles), and profiles over Gan are used to derive a Southern Hemisphere (SH) background (Fig. 2). Average profiles were calculated in 500 m bins, starting above 4 km to avoid boundary layer effects. Inspection of the CH4 AMA profile indicates a significant enhancement in the upper troposphere between 9 and 12.5 km corresponding to pressure levels between 300 and 170 hPa. Park et al. (2007) used CO observations from satellites and wind fields to identify monsoon-influenced air masses inside the AMA at a similar pressure range (200–100 hPa). The average CH4 mixing ratio of the AMA profile between 9 and 12.5 km is 1919.0±17.2 ppbv, while the average CH4 mixing ratio for the NH background is 1863.4±14.0 ppbv, which is comparable to CH4 mixing ratios below 9 km measured for the AMA profile (1876.5±8.7 ppbv). The average CH4 mixing ratio for the SH background is 1778.3±19.5 ppbv, which is significantly lower than either the NH background or the AMA profiles. While the NH background shows only a small increase in CH4 above 11 km, the SH background profile steadily increases with height. Gan is located at the Equator; thus, the region influenced by the Southern Hemisphere during boreal summer when the Intertropical Convergence Zone (ITCZ) is shifted to the north (Waliser and Gautier, 1993). As most of the methane sources are in the Northern Hemisphere north of the ITCZ, the profile over Gan represents the SH background to some extent. The observed CH4 increase with height can be explained by the global circulation. In the boundary layer CH4 mixing ratios are influenced by turbulent mixing close to emission sources or by horizontal advection in remote locations (Saito et al., 2013). At the surface the air on Gan is influenced by wind from southern directions with low CH4 mixing ratios originating from the southern Indian Ocean. High altitude advection leads to inter-hemispheric transport (Saito et al., 2013); this in turn results in the transfer of higher CH4 mixing ratios from the NH into the SH, which have been convectively uplifted from the boundary layer. The observed difference in the CH4 background between the NH and the SH is 85.1 ppbv, which agrees with an inter-hemispheric gradient of 86–90 ppbv for the period from 2007 to 2010 given in Bergamaschi et al. (2013).
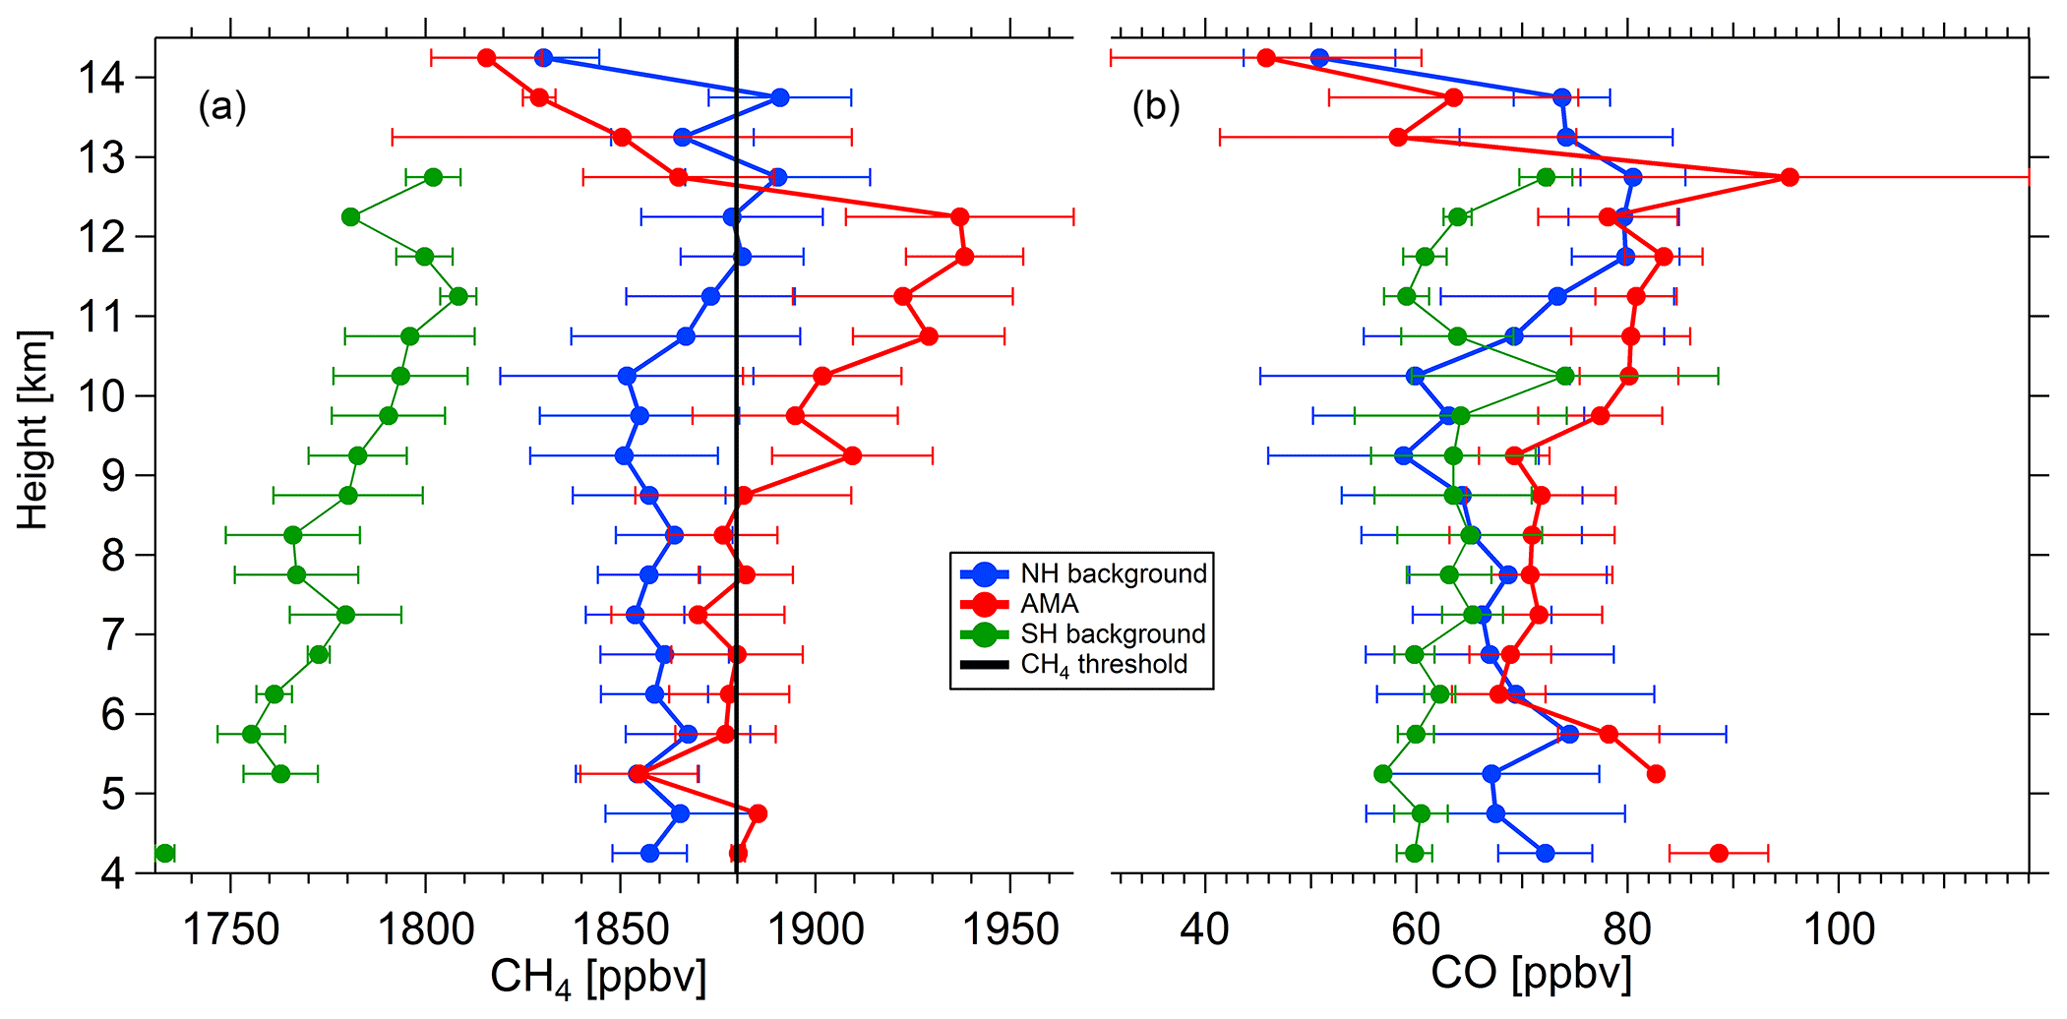
Figure 2Average profiles for the Northern Hemisphere (NH) background, the AMA, and the Southern Hemisphere (SH) background for CH4 (a) and CO (b); profile locations are presented in Fig. 1. The CH4 threshold (1879.8 ppbv) is indicated by the black line.
The measured mean CO profiles for the AMA (74.2±10.9 ppbv), the NH background (68.8±7.3 ppbv), and the SH background (63.2±4.3 ppbv) are rather similar and agree within the standard deviations. Nevertheless, in the upper troposphere the AMA profile indicates a slight increase of CO mixing ratios relative to the background. Enhanced CO and CH4 mixing ratios in the upper troposphere over the eastern Mediterranean in summer 2001, associated with air masses influenced by the monsoon, were also observed during the MINOS aircraft campaign (Lelieveld et al., 2002; Scheeren et al., 2003). This is consistent with the observed upper tropospheric increase of CO and CH4 in the NH background profiles, which are found during ascents and descents over Paphos but not over Oberpfaffenhofen. In general, our observation of enhanced CO mixing ratios under monsoon influence are consistent with Park et al. (2008), who showed that satellite-based averaged CO profiles exhibit increased CO mixing ratios in the upper troposphere inside the AMA (around 100 ppbv at 10–15 km) in comparison to air outside the AMA (65–90 ppbv at 10–15 km).
To differentiate between air masses inside and outside of the AMA various approaches have been used in the literature. Often potential vorticity (PV) is used for this purpose (e.g. Randel and Park, 2006; Garny and Randel, 2013 or Ploeger et al., 2015). Ploeger et al. (2015) calculated PV from reanalysis data to determine a transport barrier isolating the AMA. In the restricted area of interest low PV values are found inside the anticyclone while higher PV values represent the background. A more direct approach is the use of a CO threshold (Park et al., 2008). Based on satellite data, Park et al. (2008) found that CO mixing ratios < 60 ppbv represent background air while CO mixing ratios > 60 ppbv represent air inside the AMA at 16.5 km. In our study the monsoon influence in the upper troposphere is most obvious in the CH4 profile, whereas CO is less suitable due to its larger atmospheric variability associated with its shorter lifetime (Junge, 1974) and the instrumental problems experienced (for CO) during the second half of the campaign. Therefore, a methane threshold was derived to signify monsoon-influenced air masses from the NH background profile. To avoid boundary layer effects and the above-mentioned slight increase in the NH background profile above 11 km due to a small contribution of monsoon-influenced air above the eastern Mediterranean, only data between 4 and 10 km were used, yielding an average CH4 mixing ratio for the background of 1859.4±10.2 ppbv, which is slightly lower than the above-mentioned mixing ratio covering the whole altitude range. The CH4 threshold is then defined as this average plus twice the standard deviation:
In situ CH4 mixing ratios that exceed this threshold are assumed to be influenced by the South Asian monsoon and are therefore representative of the AMA – in the following these mixing ratios are denoted as being AMA-influenced. While CH4 mixing ratios in the upper troposphere are generally smaller than this threshold in the NH background profile, CH4 mixing ratios in the AMA profile significantly exceed this threshold above 9 km (Fig. 2). Further evaluation depends on the CH4 threshold and thus the results are sensitive to it. Nevertheless, other compounds measured during OMO also showed the isolation of the anticyclone in the upper troposphere (Lelieveld et al., 2018) which confirms the possibility of utilizing this value to divide the air mass origin between the inside and outside of the AMA. With a change in the absolute value, the region that is supposed to be AMA-influenced will either be larger or smaller; thus, the edge of the anticyclone would be differently defined but the whole dynamical process would not change significantly.
3.2 Case study: flight 19
To illustrate the connection between enhanced CH4 mixing ratios, monsoon convection, and South Asian pollution sources at the surface we performed a case study on flight 19 data (13 August 2015). The flight took place over the Arabian Peninsula. After take-off from Paphos, HALO headed towards Oman before returning back to Paphos. Enhanced mixing ratios for CO and CH4 were measured between 10:00 and 11:00 UTC (Fig. 3). Over Oman at a pressure level of 175 hPa mixing ratios for CO and CH4 increased from background levels of 74.3±10.6 and 1846.7±16.1 ppbv to 99.5±14.3 and 1905.2±13.9 ppbv, respectively. According to the classification defined in Sect. 3.1 CH4 mixing ratios reached values well above the threshold which indicates that air masses influenced by the monsoon were probed. Elevated mixing ratios were still observed after a flight level change (200 hPa). Accordingly, both flight levels were within the altitude range of the AMA confinement of 200–100 hPa reported by Randel and Park (2006). Within the AMA the average increase relative to background is around 25 ppbv for CO and around 58 ppbv for CH4. The increase in CH4 is rather sharp, indicating a rather well-defined edge of the AMA, as has been reported in previous studies (e.g. Park et al., 2008).

Figure 3Flight 19 (13 August 2015) in situ CH4 and CO data and EMAC results along the flight track, as well as the flight altitude. The AMA is colour-coded by CH4 > 1879.8 ppbv.
For the MINOS campaign over the eastern Mediterranean, Scheeren et al. (2003) distinguished between air masses that originated over South Asia and those over North America/the North Atlantic, corresponding to our classification of AMA air masses and the NH background, respectively. Note that Scheeren's South Asia air mass would be incorporated in our background, due to its location over the eastern Mediterranean. Scheeren et al. (2003) reported in situ trace gas measurements for the 6–13 km altitude range. Mean CO mixing ratios were 74±12 ppbv for air masses with a North American/North Atlantic origin and 102±4 ppbv for air masses with a South Asian origin, resulting in a difference of 28 ppbv. The relative difference in CH4 observed by Scheeren was 63 ppbv (North America/North Atlantic: 1819±26 ppbv; South Asia: 1882±21 ppbv). The enhancements observed during MINOS are similar to those observed during OMO flight 19, although absolute mixing ratios in particular for CH4 are higher, as global CH4 concentrations have been increasing since summer 2001 (Zimmermann et al., 2018). Furthermore, similar increases in CO and CH4 mixing ratios, caused by an outflow event of the AMA, were documented over northern Europe during a TACTS flight by Vogel et al. (2014). They reported enhancements of approximately 25 ppbv for CO (background: 15–25 ppbv; outflow air: 40–50 ppbv) and 65 ppbv for CH4 (background: 1700–1750 ppbv; outflow air: 1770–1810 ppbv). The absolute values for CO and CH4 are lower in comparison to the present study. The transport time was about 5 weeks so the air mass of the outflow event could be mixed with background air. The background itself has a different characteristic, as the flight during TACTS took place in the lower stratosphere and flight 19 took place in the upper troposphere.
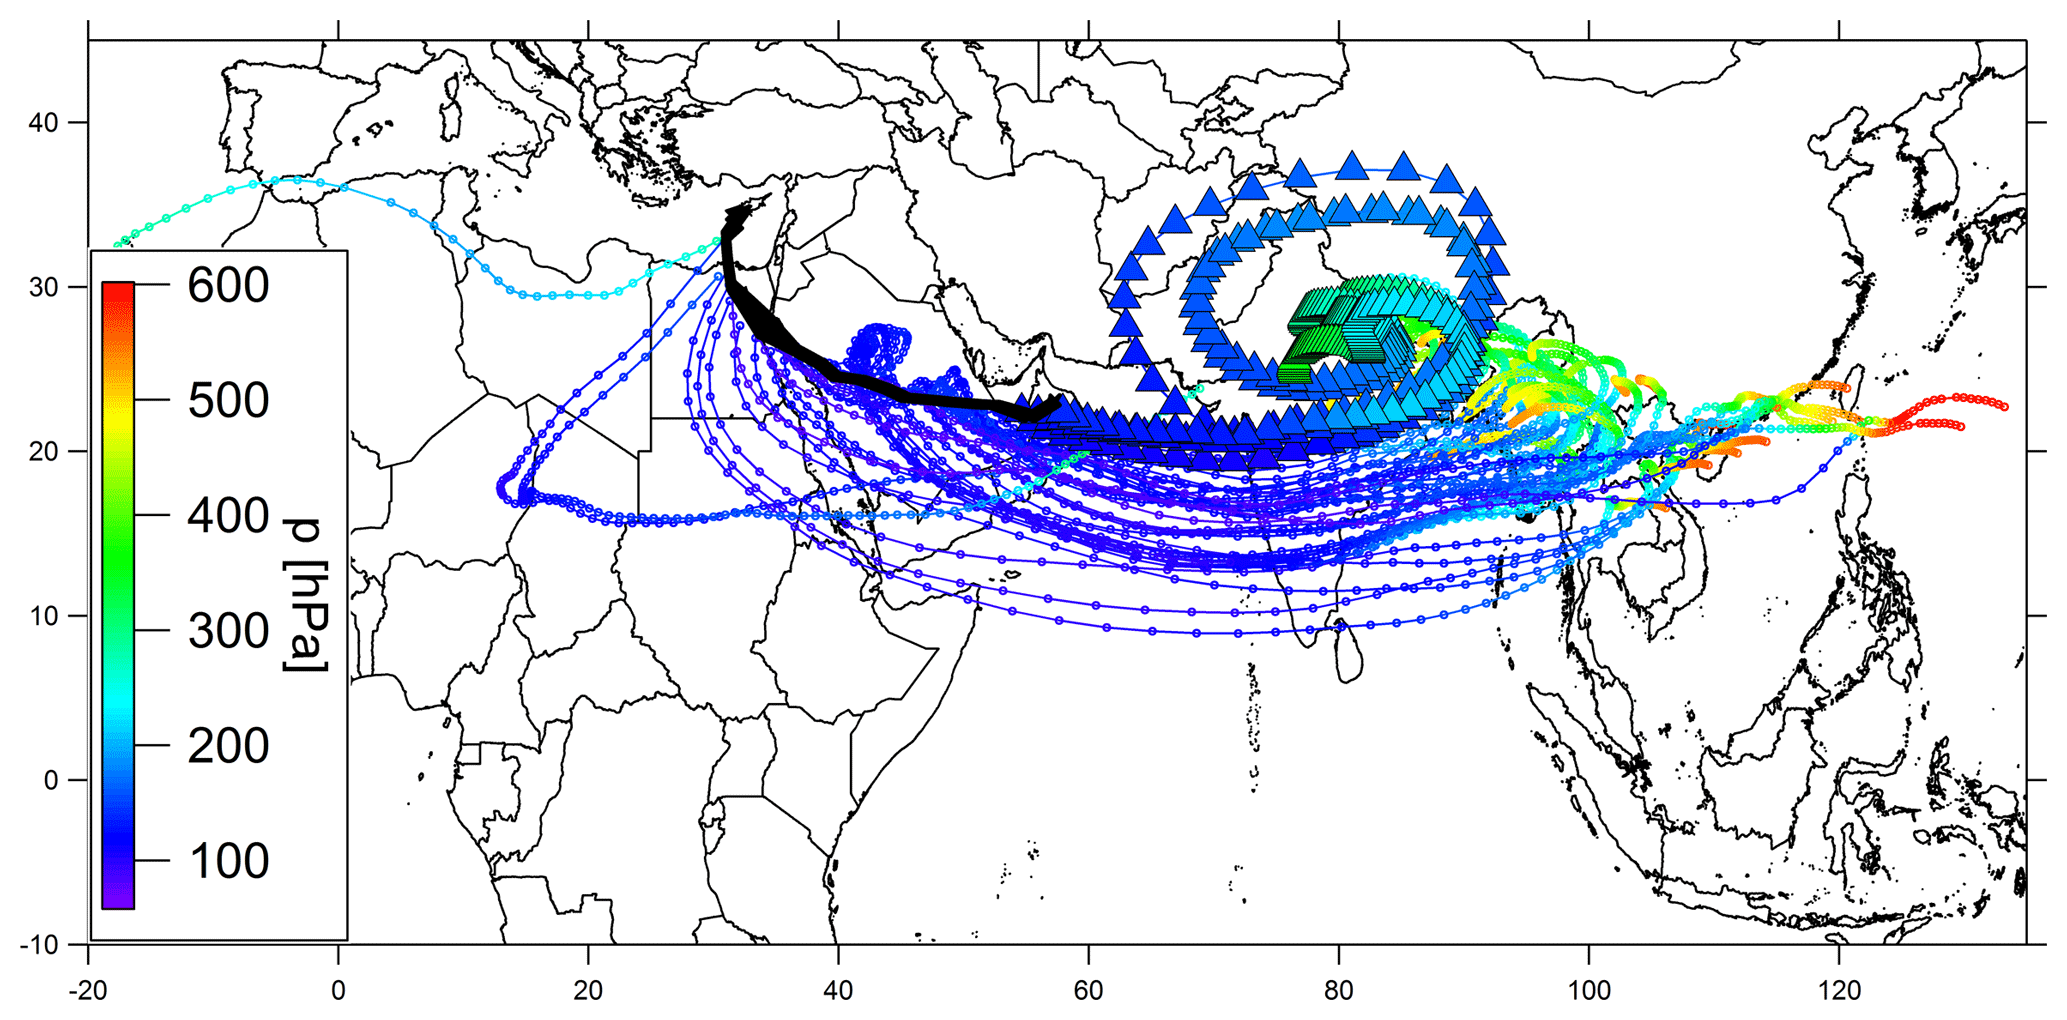
Figure 4Centroid trajectories for flight 19 (13 August 2015) with colour-coded altitude. Triangles represent back trajectories for CH4 mixing ratios above the CH4 threshold, and circles represent back trajectories for CH4 mixing ratios below the CH4 threshold.
Using FLEXPART, 10-day centroid back trajectories along the flight track were calculated. An analysis indicates that, in general, enhanced CH4 mixing ratios are associated with an air mass origin inside the AMA, while lower CH4 mixing ratios are associated with background air (Fig. 4). In particular, the back trajectories starting at release points with the highest CH4 mixing ratios measured along the flight track (Fig. 7) were confined in the AMA for several days with their origin over northern India and Bangladesh. Between 5 and 10 days prior to observations the back trajectories are found in the boundary layer or the lower troposphere, before they are uplifted into the upper troposphere by deep convection (> 200 hPa) (Fig. 5). This finding is in good agreement with Bergman et al. (2013), who calculated trajectory transit times of 2–22 days from the surface to the 200 hPa level in the region of the Tibetan Plateau and India/Southeast Asia. After the convective injection into the upper troposphere the air masses in this case study are advected at the southern edge of the AMA, following the tropical easterly jet towards the measurement region over the Arabian Peninsula. The transport distance of an air parcel in the upper troposphere depends on its origin and takes 1–6 days in the present study depending on the area of convective transport (northern India, Bangladesh, the Bay of Bengal). During MINOS, Scheeren et al. (2003) found a longer transport time for polluted air masses ranging from 7 to 10 days from the South Asian source region towards the eastern Mediterranean, which also represents a longer transport pathway. During ESMVal the long-range transport in the upper troposphere from the eastern part of the AMA towards the Arabian Peninsula along the southern fringe of the AMA took 2–4 days, and the majority of the trajectories were circulating around the AMA within 10 days prior to the observation (Gottschaldt et al., 2017).

Figure 5Centroid trajectories for flight 19 (13 August 2015) with colour-coded transport time. Triangles represent back trajectories for CH4 mixing ratios above the CH4 threshold, and circles represent back trajectories for CH4 mixing ratios below the CH4 threshold.
By comparing the back trajectories with satellite images of daily mean cloud-top pressure it was possible to identify regions with strong convection (here with cloud-top pressure below 200 hPa) that were intercepted by the trajectories during their uplifting phase (illustrated in Fig. 6). Matches were generally found over the Bay of Bengal, the Indo-Gangetic Plain, Bangladesh, the northeastern region of India, and Myanmar. During the days when the back trajectories passed over central India, convection also occurred in this area, but the cloud-top pressure was at a lower altitude than the height of the trajectories. Thus, the influence from central India seems to be negligible for this particular flight. Convective cloud-top information for estimating the influence of convection on the transport pathways of trajectories have already been applied in previous studies, such as Scheeren et al. (2003) and Gottschaldt et al. (2017). These studies found the strongest convection occurring in the same area as mentioned above.
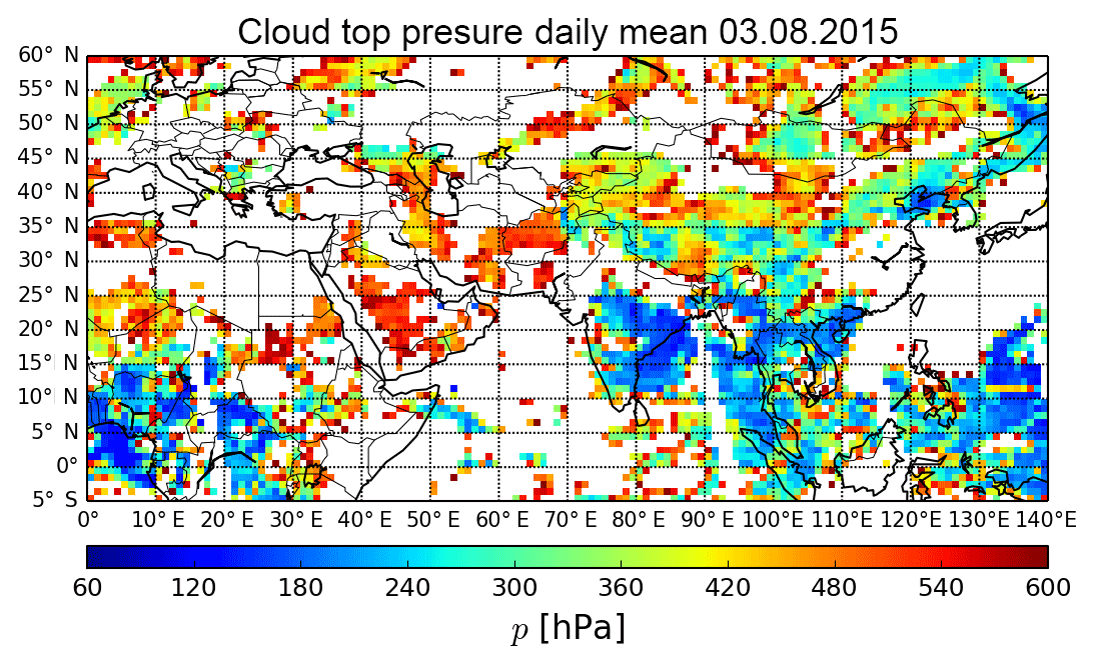
Figure 6Satellite-derived cloud-top pressure 10 days prior (3 August 2015) to flight 19. Pressure below 250 hPa represents strong convection.
To compare observations with model simulations, Fig. 3 shows time series for CO and CH4. For flight 19, EMAC model simulation results for CO and CH4 agree well with observations (CO: 2.1±8.7 ppbv; CH4: 11.9±21.7 ppbv), reproducing observed trends in mixing ratios for both species, although the model has a rather course resolution of 2.8∘ × 2.8∘. In general, the model tends to underestimate the enhanced CH4 mixing ratios – in particular for AMA-influenced regions – and overestimates CO. A comparison for all flights during the OMO mission yields a model overestimation of 4.6±11.8 ppbv for CO and an underestimation of 7.0±32.8 ppbv for CH4 (see Sect. 3.4). A comparison between in situ CO and EMAC simulations for the ESMVal flight showed good agreement with a negative bias of the simulated CO, which was about 10 ppbv in regions of strong CO gradients, otherwise it was smaller (Gottschaldt et al., 2017). As the trace gas mixing ratios and trends are generally well reproduced by the EMAC model, it will be extensively used for further interpretation of the measurements in the remainder of this paper.
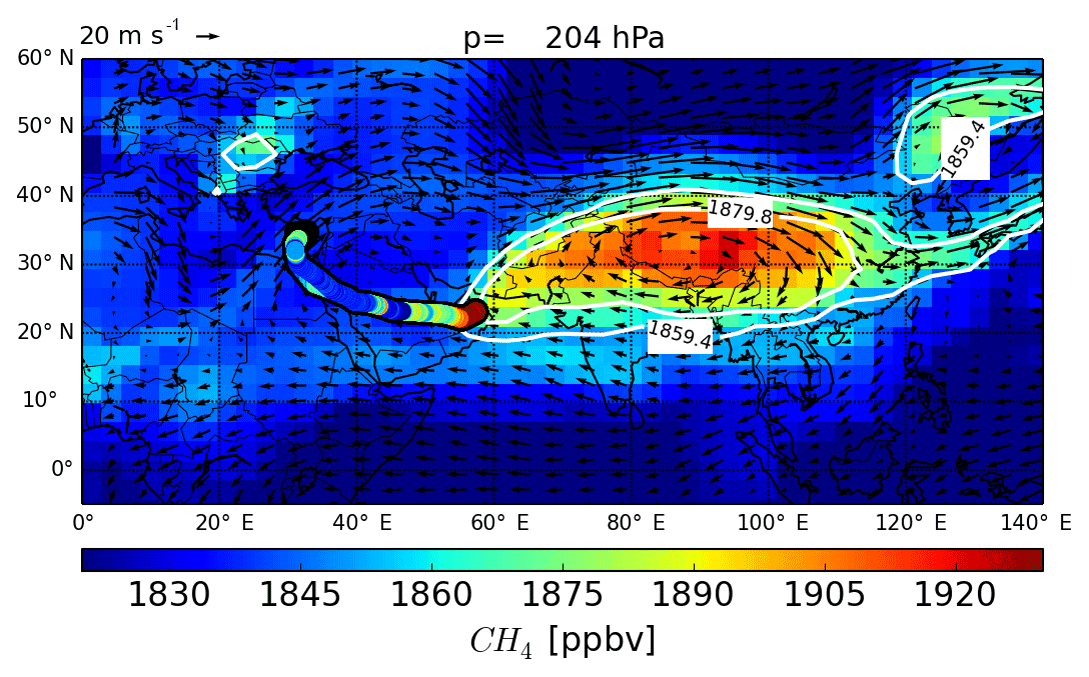
Figure 7EMAC modelled CH4 and wind field; daily means at 204 hPa, and in situ CH4 (above 300 hPa) along the flight track for flight 19 (13 August 2015). White contours represent the CH4 threshold and background values according to Sect. 3.1.

Figure 8EMAC modelled CO and wind field; daily mean at 204 hPa, and in situ CO (above 300 hPa) along the flight track for flight 19 (13 August 2015). White contours represent the CH4 threshold and background values according to Sect. 3.1.
The position of the AMA can be determined from horizontal transects of EMAC daily means of trace gas distributions and meteorological data at a pressure level of 204 hPa (Figs. 7, 8). Here the anticyclone is identified by the wind field and corresponding CO and CH4 fields. Enhanced trace gas mixing ratios are found to be confined within the anticyclone due to the strong isolation caused by the anticyclonic circulation (Park et al., 2008). On 13 August 2015, the AMA extended from the eastern part of the Arabian Peninsula to the eastern part of China and from the northern part of the Bay of Bengal to the Gobi Desert. Its centre was located over the Tibetan Plateau, which is consistent with the climatological mean position of the AMA as documented by Nützel et al. (2016). The simulated mixing ratios inside the anticyclone increase from around 90 ppbv (CO) and 1860 ppbv (CH4) at the fringes of the anticyclone to values inside the AMA of above 150 and 1920 ppbv for CO and CH4, respectively. Mixing ratios in background air over the Mediterranean are around 65 ppbv for CO and 1840 ppbv for CH4 and thus below those simulated inside the AMA. Enhanced mixing ratios in the AMA have also been reported in previous studies, e.g. increased CH4 mixing ratios in satellite data over the summer monsoon region by Park et al. (2004) and Xiong et al. (2009), or enhanced CO values from satellite measurements in the monsoon region by Li et al. (2005). The latter study reported CO mixing ratios of up to 133 ppbv at a pressure level of 147 hPa over the monsoon region, which fits with our slightly higher simulated CO values at a lower pressure level, if we assume that CO mixing ratios decrease with height (Park et al., 2008).
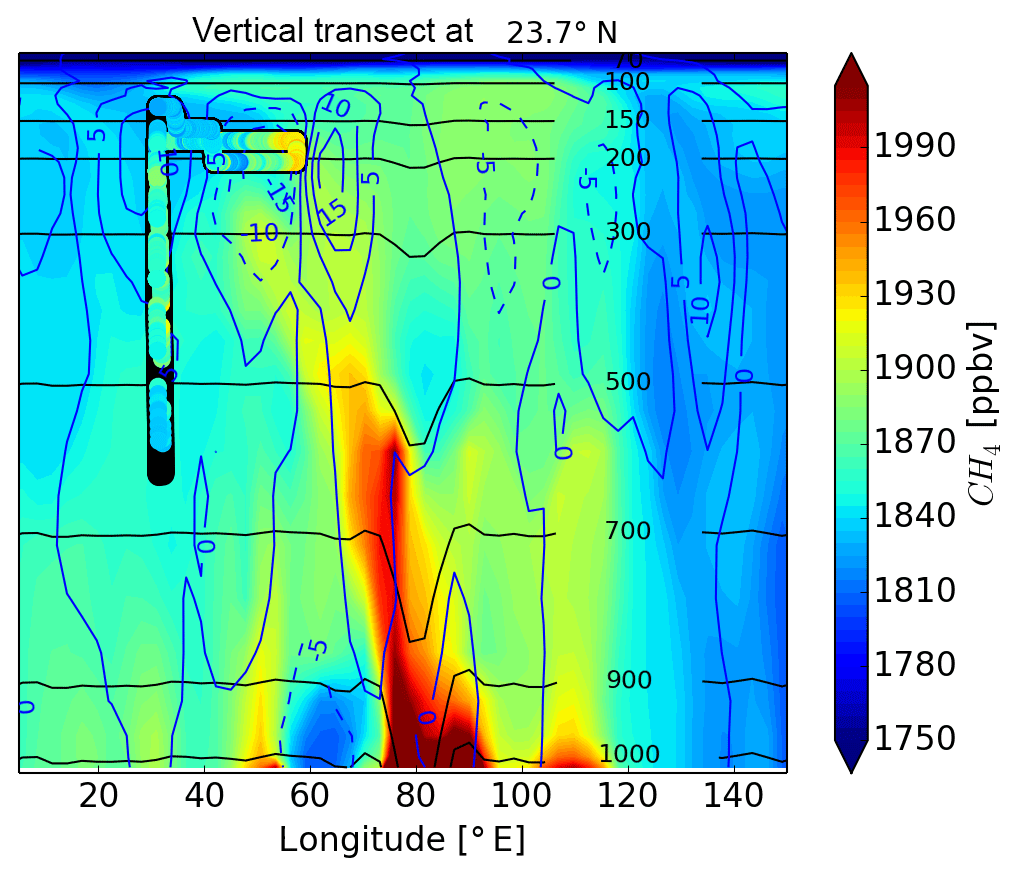
Figure 9EMAC modelled CH4; daily mean transect along 23.7∘ N, and measured CH4 along the aircraft track for flight 19. Additional EMAC pressure (black lines in hPa) and EMAC northward wind component (blue lines in m s−1; southward wind dashed lines).
As the 200 hPa level is representative for the dominant flight altitude, the in situ observations along the flight track can also be compared to the simulated two-dimensional fields. Further, we assume that the 200 hPa level is where most of the convective outflow takes place, and therefore pollution levels are expected to be highest (Park et al., 2009). Figures 7 and 8 show that OMO flight 19 only scratches the western edge of the AMA. Measured CH4 mixing ratios are higher inside the AMA than the simulated mixing ratios. This is in line with the above-mentioned CH4 underestimation by the model. In the model simulations the anticyclone shows a more distinct signal in CH4 compared to CO, as the edge in CH4 is well defined, with mixing ratios dropping off significantly outside the anticyclone. In contrast, the CO pattern is more diffuse. The simulated CO pattern, especially the enhanced values over Oman, fits well to the observed CO mixing ratios along the flight track. The EMAC model underestimates CH4 and CO in the upper troposphere. As shown by Krol et al. (2018), EMAC seems to have a weaker transport of surface tracers than other models. There are two potential reasons for this, but it is difficult to distinguish them. First, the vertical velocity may be too slow, which would mean that the convective updraught is not effective enough, or second, the numerical diffusion implied by the coarse resolution may restrict the updraught too much. Nevertheless, we would like to note that for the comparison of CO with the model, the results are in line with other literature studies at resolutions such as this (e.g. Barret et al., 2016). Additional vertical transects along 23.7∘ N latitude and 56.2∘ E longitude on 13 August 2015 complete the picture of the AMA with respect to its extent. In a vertical CH4 transect along 23.7∘ N (Fig. 9) it is obvious that the flight only touches the western edge of the anticyclone in the upper troposphere and that the majority of the flight took place outside the anticyclone. According to the model simulation, convective uplift of CH4 takes place between 75 and 95∘ E, which corresponds to India and the Bay of Bengal. Moreover, the upward transport of polluted air masses is only simulated in a rather restricted area, analogous to a chimney, as reported by Bergman et al. (2013). This area was also the preferred location for convection 10 days prior to the flight as reported above. Rauthe-Schöch et al. (2016) reported a similar longitudinal position for convection between 80 and 100∘ E in summer 2008 for CARIBIC flights over India. In the vertical transect along 56.2∘ E (Fig. 10) CH4 mixing ratios show an increase at the surface from the Equator towards higher northern latitudes. In the upper troposphere the AMA is located approximately between 15 and 30∘ N, which fits well with the location of the AMA in summer 2008 identified by enhanced CH4 mixing ratios observed during a CARIBIC flight between 10 and 40∘ N (Baker et al., 2012). In vertical transects at longitudes between 75 and 95∘ E (not shown) the convection can be determined to occur between 20 and 35∘ N, which reflects the Indo-Gangetic Plain area, the Tibetan Plateau, Bangladesh, and the northeastern part of India. In the vertical transects for CO (not shown) the same patterns are found, although they are less pronounced than CH4. In a CO latitudinal transect along 23.7∘ N the enhanced mixing ratios range from around 90 ppbv inside the anticyclone to over 400 ppbv at the surface, whereas CH4 mixing ratios scale from around 1850 ppbv inside the anticyclone to surface values above 2250 ppbv (Fig. 9).
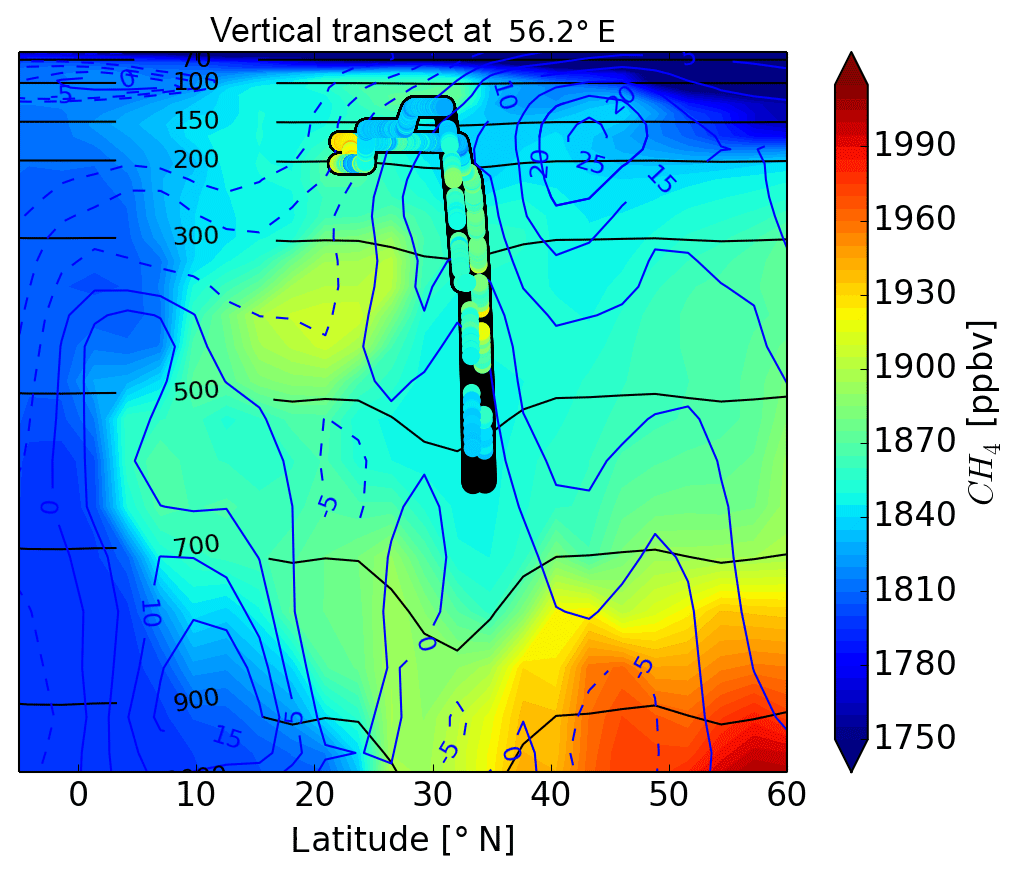
Figure 10EMAC calculated CH4; daily mean transect along 56.2∘ E, and measured CH4 along the aircraft track for flight 19. Additional EMAC pressure (black lines in hPa) and EMAC eastward wind component (blue lines in m s−1; westward wind dashed lines).
3.3 Emission source region
Emission source regions are identified by combining the FLEXPART single particle information with EMAC daily means for CO and CH4 mixing ratios in the PBL. With FLEXPART the last boundary contact can be determined as a footprint of parcels, which started from release points with enhanced methane, i.e. CH4 mixing ratios > threshold. The last boundary layer contact of a parcel is determined if its height position is within ±5 % of the PBL height (in metres above ground level). These parcels are sorted depending on their geographical position and then summed-up in each grid cell (1∘ × 1∘), yielding a number of parcels per grid cell in the PBL. For flight 19 (13 August 2015) the footprint of the last PBL contact approximately 10 days prior to the parcel release shows the highest values over Bangladesh and the northeastern part of India (Fig. 11). The last boundary layer contact is assumed to be a useful indicator for the area where parcels are uplifted by convection and subsequently injected into the AMA.
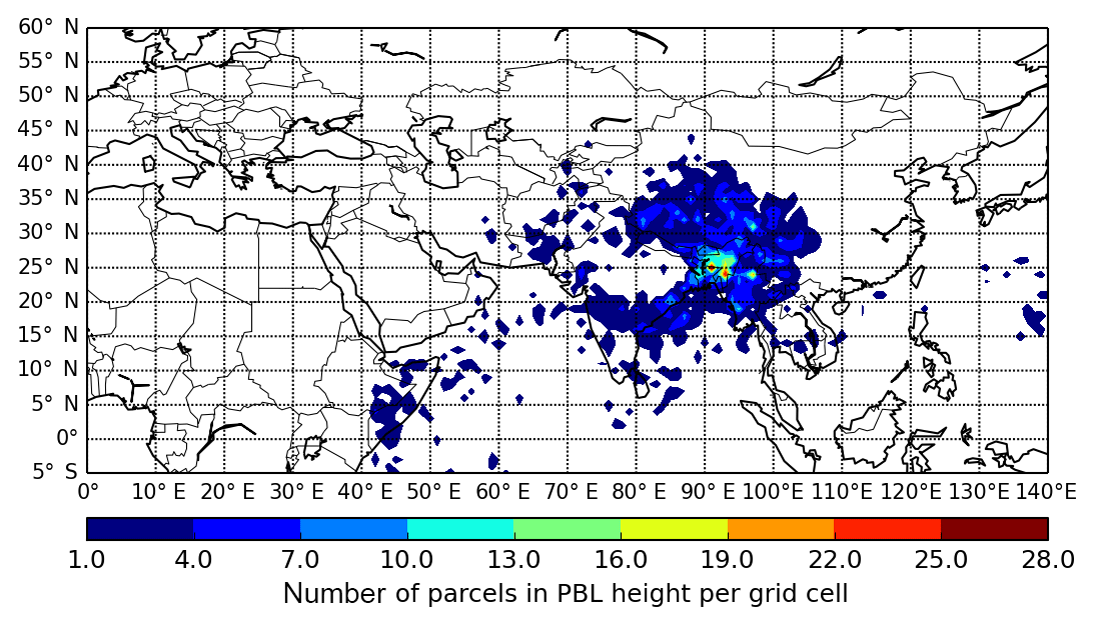
Figure 11Last boundary layer contact of parcels from trajectories, which start along the flight track at locations with CH4 mixing ratios above the threshold, before they were transported to the track of flight 19 (10 days prior to flight).
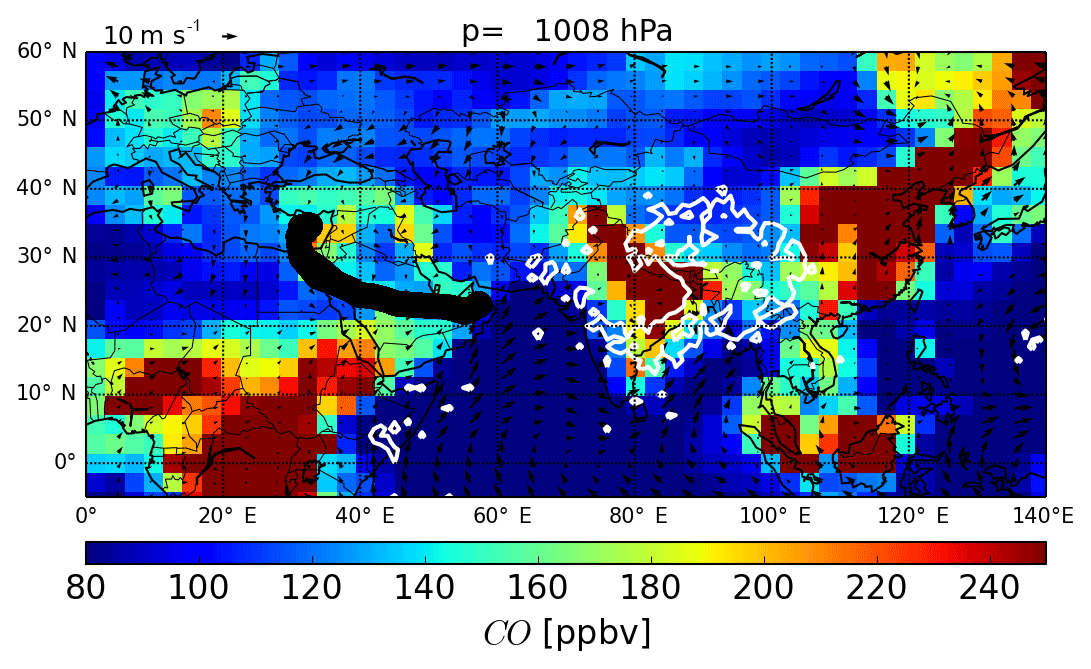
Figure 12EMAC calculated CO; daily mean at the surface (1008 hPa, 3 August 2015) as an indicator for surface emissions (10 days prior to measurement) and the flight track of flight 19 (black). Additionally, the footprint of the last boundary layer contact is shown as white contour line from Fig. 11.
To identify emission sources, EMAC daily mean trace gas mixing ratios at a pressure level of 1008 hPa (assumed to be the surface) are presented. The CH4 mixing ratios in Fig. 12 exhibit the highest values on the Indo-Gangetic Plain and in Bangladesh, spreading southward along the east coast of India and towards Myanmar. Peak values reach up to 2600 ppbv. Figure 13 shows that CO has the highest mixing ratios in the same region as CH4, with peak values up to 400 ppbv. A comparison with Fig. 11 indicates that high CO and CH4 mixing ratios are co-located with the areas of convection, leading to an updraught of polluted air masses to the upper troposphere. In the footprint (Fig. 11), the east coast of Africa, the Indian Ocean, and the Pacific region indicate a minor influence, but they do not correspond to enhanced mixing ratios in EMAC daily mean CH4 or CO. Thus, they are assumed not to contribute to the pollution of the air masses in the AMA. The EMAC daily mean data also indicate polluted areas along the east coast of China. This area is not reflected in the parcel footprint, which indicates that the southeastern part of China is only a minor contributor to the pollution of the AMA on this particular flight. Note that some convection in the daily mean cloud-top pressure maps occur approximately 10 days prior to the observation over eastern China, confirming that Chinese emissions could have a minor contribution on the composition of the AMA.
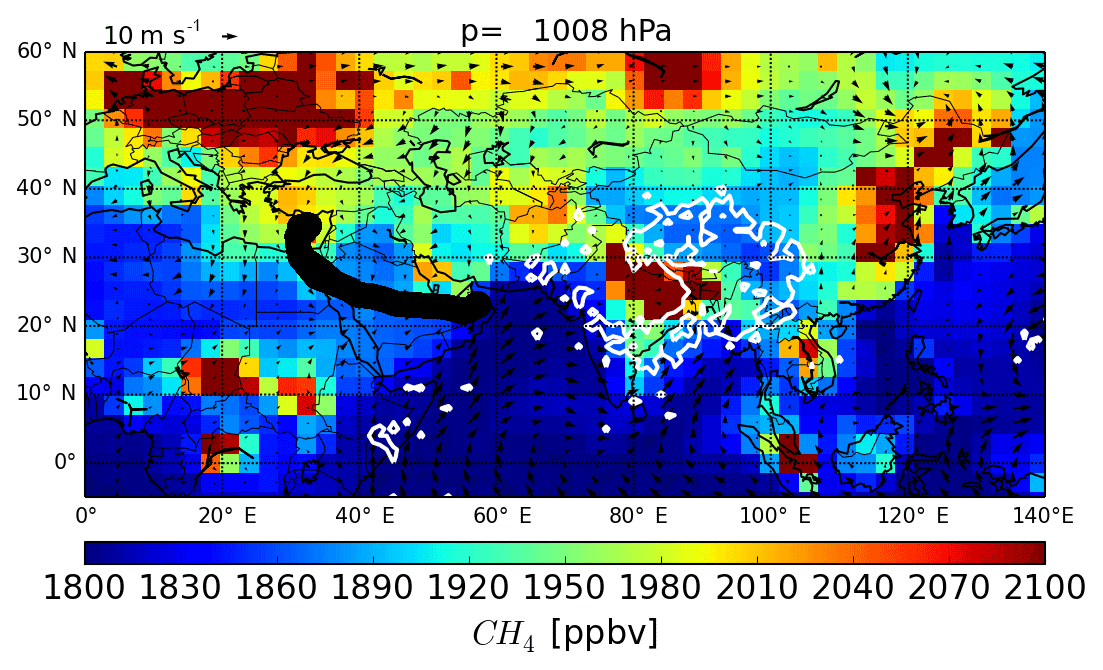
Figure 13EMAC calculated CH4; daily mean at the surface (1008 hPa, 3 August 2015) as an indicator for surface emissions (10 days prior to measurements), and the track of flight 19 (black). Additionally, the footprint of the last boundary layer contact is shown as white contour line from Fig. 11.
The above-mentioned peak values at the surface for CO and CH4 over southern Asia can be related to different emission sources. The regions including the Indo-Gangetic Plain and Bangladesh are densely populated areas with an increasing population trend in combination with strong economic development (Ohara et al., 2007; Rauthe-Schöch et al., 2016). Potential CO sources are biomass, fossil, and domestic fuel combustion as well as the oxidation of CH4 and volatile organic compounds (Pandis and Seinfeld, 2006). CH4 is emitted by rice cultivation, wetlands, domestic ruminants, biomass burning, fossil fuels, waste decomposition (Khalil, 2000), and flood plains, especially if they are polluted by urban waste and sewage (Baker et al., 2012). The latter has its maximum emission during the monsoon due to the influence of rain. At the same time, rice has its primary growing period in the wet season; hence, CH4 emissions have a seasonal cycle and are strongest during the monsoon, contributing significantly to the CH4 emissions (Baker et al., 2012). The simultaneous appearance of a CH4 emission maximum and strong convection leads to a more pronounced chemical signature in the AMA for CH4 than for CO. The CO emission sources do not experience such a strong seasonal dependency. This again emphasizes the use of the CH4 threshold to differentiate between AMA-influenced and background air masses.
Bangladesh and the northeastern part of India are also mentioned in the study of Pan et al. (2016) as favourable uplifting regions, which agrees with the main areas of the footprint determined in this study. The marked source regions were also identified by Park et al. (2009), as they reported the origin of upper tropospheric CO to be mainly from India and Southeast Asia, and by Pan et al. (2016) who identified northeast India, the southern flank of the Tibetan Plateau, Nepal, and north of the Bay of Bengal as being the most favourable spots for CO uplifting. Rauthe-Schöch et al. (2016) identified similar source regions using FLEXPART 10 day back trajectories for CARIBIC flight tracks over the South Asian monsoon region. They used geographical positions of back trajectory points below 5 km, thus not only the boundary layer as used here, and documented air originating from India, Indo-Gangetic Plain, Bay of Bengal, mainland of Southeast Asia, and the western part of the Arabian Sea. Consequently, their source region covers a larger area than the source region identified for flight 19. Bergman et al. (2013) demonstrated that trajectories from eastern China only have a minor influence on the AMA at the 200 hPa level, which supports our footprint analysis as it does not show any boundary layer influence from the eastern coast of China.
3.4 The AMA during OMO
Similar analyses to that of flight 19 are discussed in detail in the Supplement for the other OMO flights, including time series, back trajectories, and model results. Here we extend the analysis of the OMO results by analysing CO and CH4 mixing ratios between 300 and 140 hPa from all research flights. In Table 1 observations and model data are separated by the CH4 threshold into monsoon-affected and background periods. Observed CO mixing ratios increased by about 20.1 ppbv under monsoon influence, whereas CH4 mixing ratios were enhanced by about 72.1 ppbv. EMAC SD4 CO and CH4 also indicate increased mixing ratios along the flight tracks within the AMA, but this is not as strong as for the observations (14.7 ppbv for CO and 24.0 ppbv for CH4).
Table 1CH4 and CO averages and standard deviations for in situ measured and EMAC data, both for background and monsoon-influenced air masses according to the CH4 threshold for altitudes between 300 and 140 hPa.
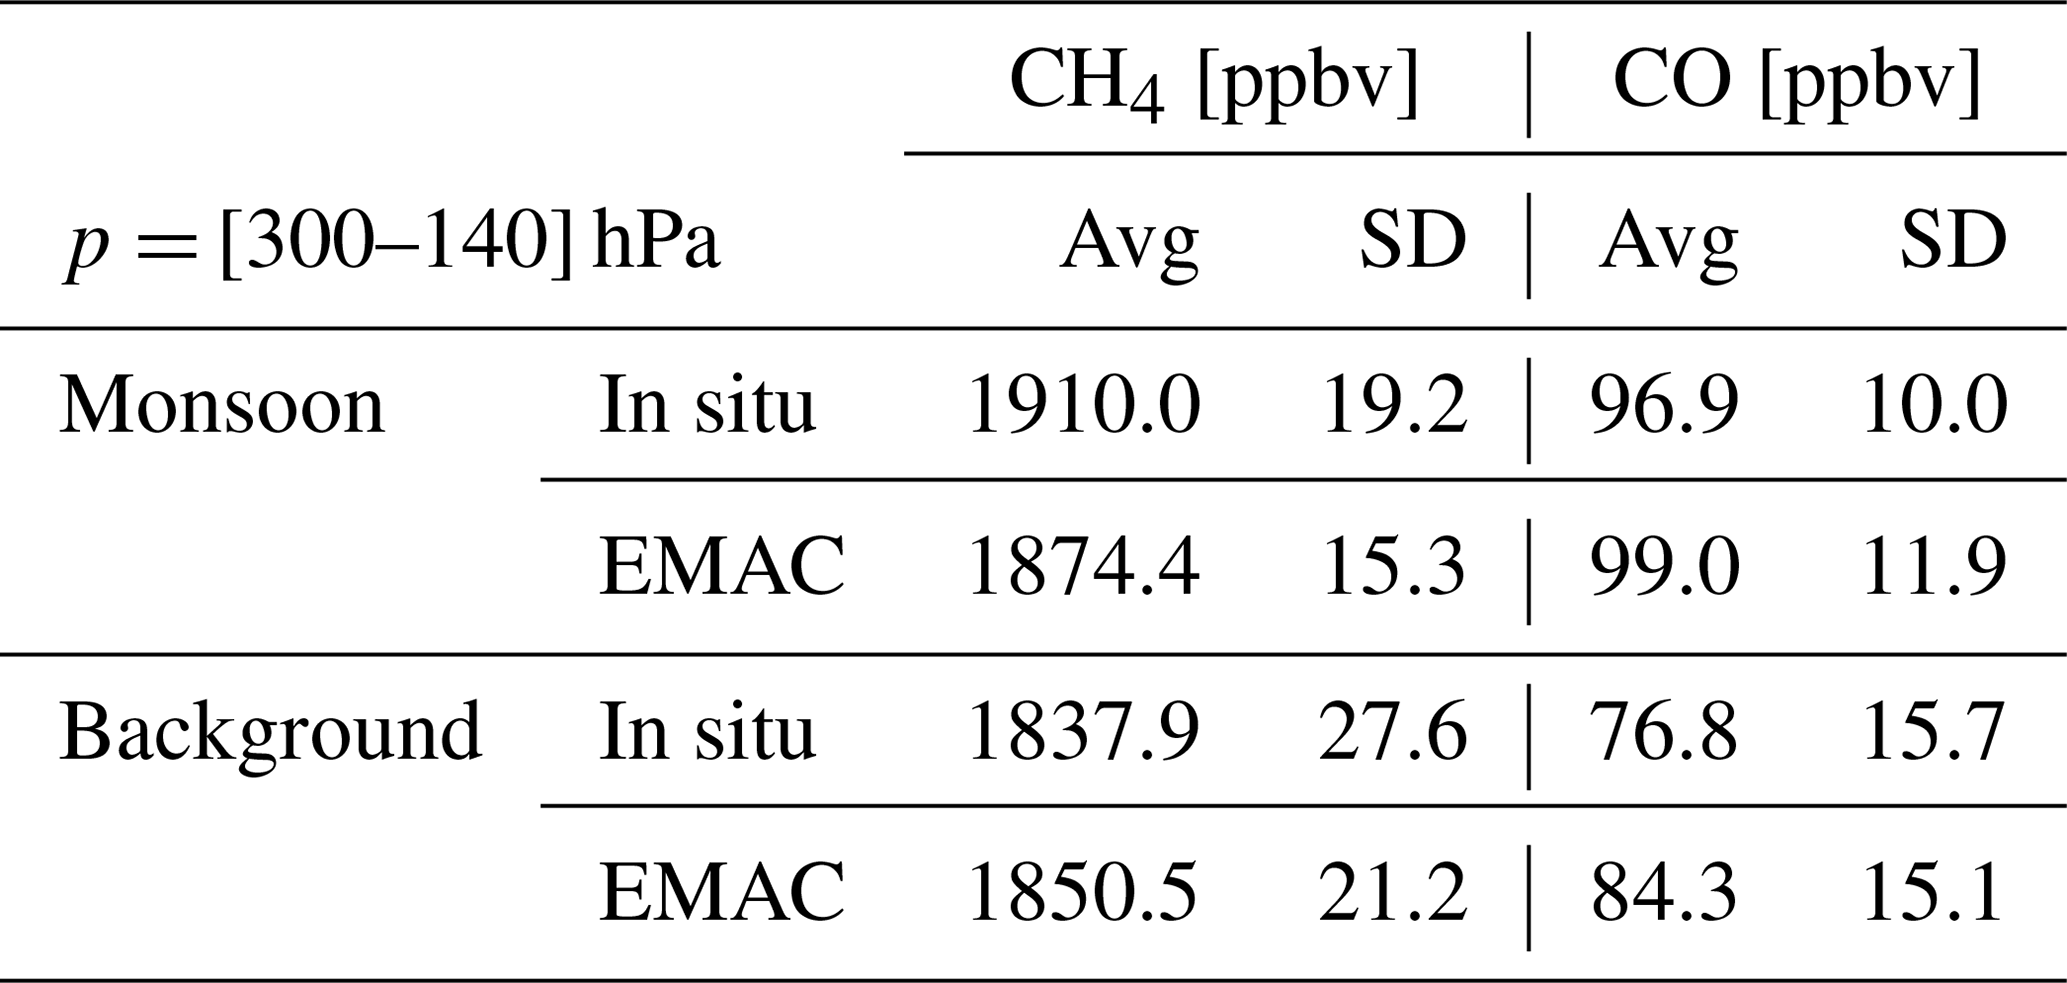
The observed increase in CH4 inside the AMA by ∼70 ppbv is in good agreement with the reported increase of 30–80 ppbv (at 8–12.5 km) between the pre-monsoon and monsoon seasons reported by Schuck et al. (2012). Xiong et al. (2009) reported a CH4 increase of up to 100 ppbv from June to September (for 2003–2007) at 300 hPa. Both studies are based on data observed over India, thus much closer to the AMA centre, which might explain the difference in absolute values. Moreover, they mirror seasonal variations by comparing pre-monsoon and monsoon conditions; thus, they are not necessarily representative for background conditions as determined during OMO.
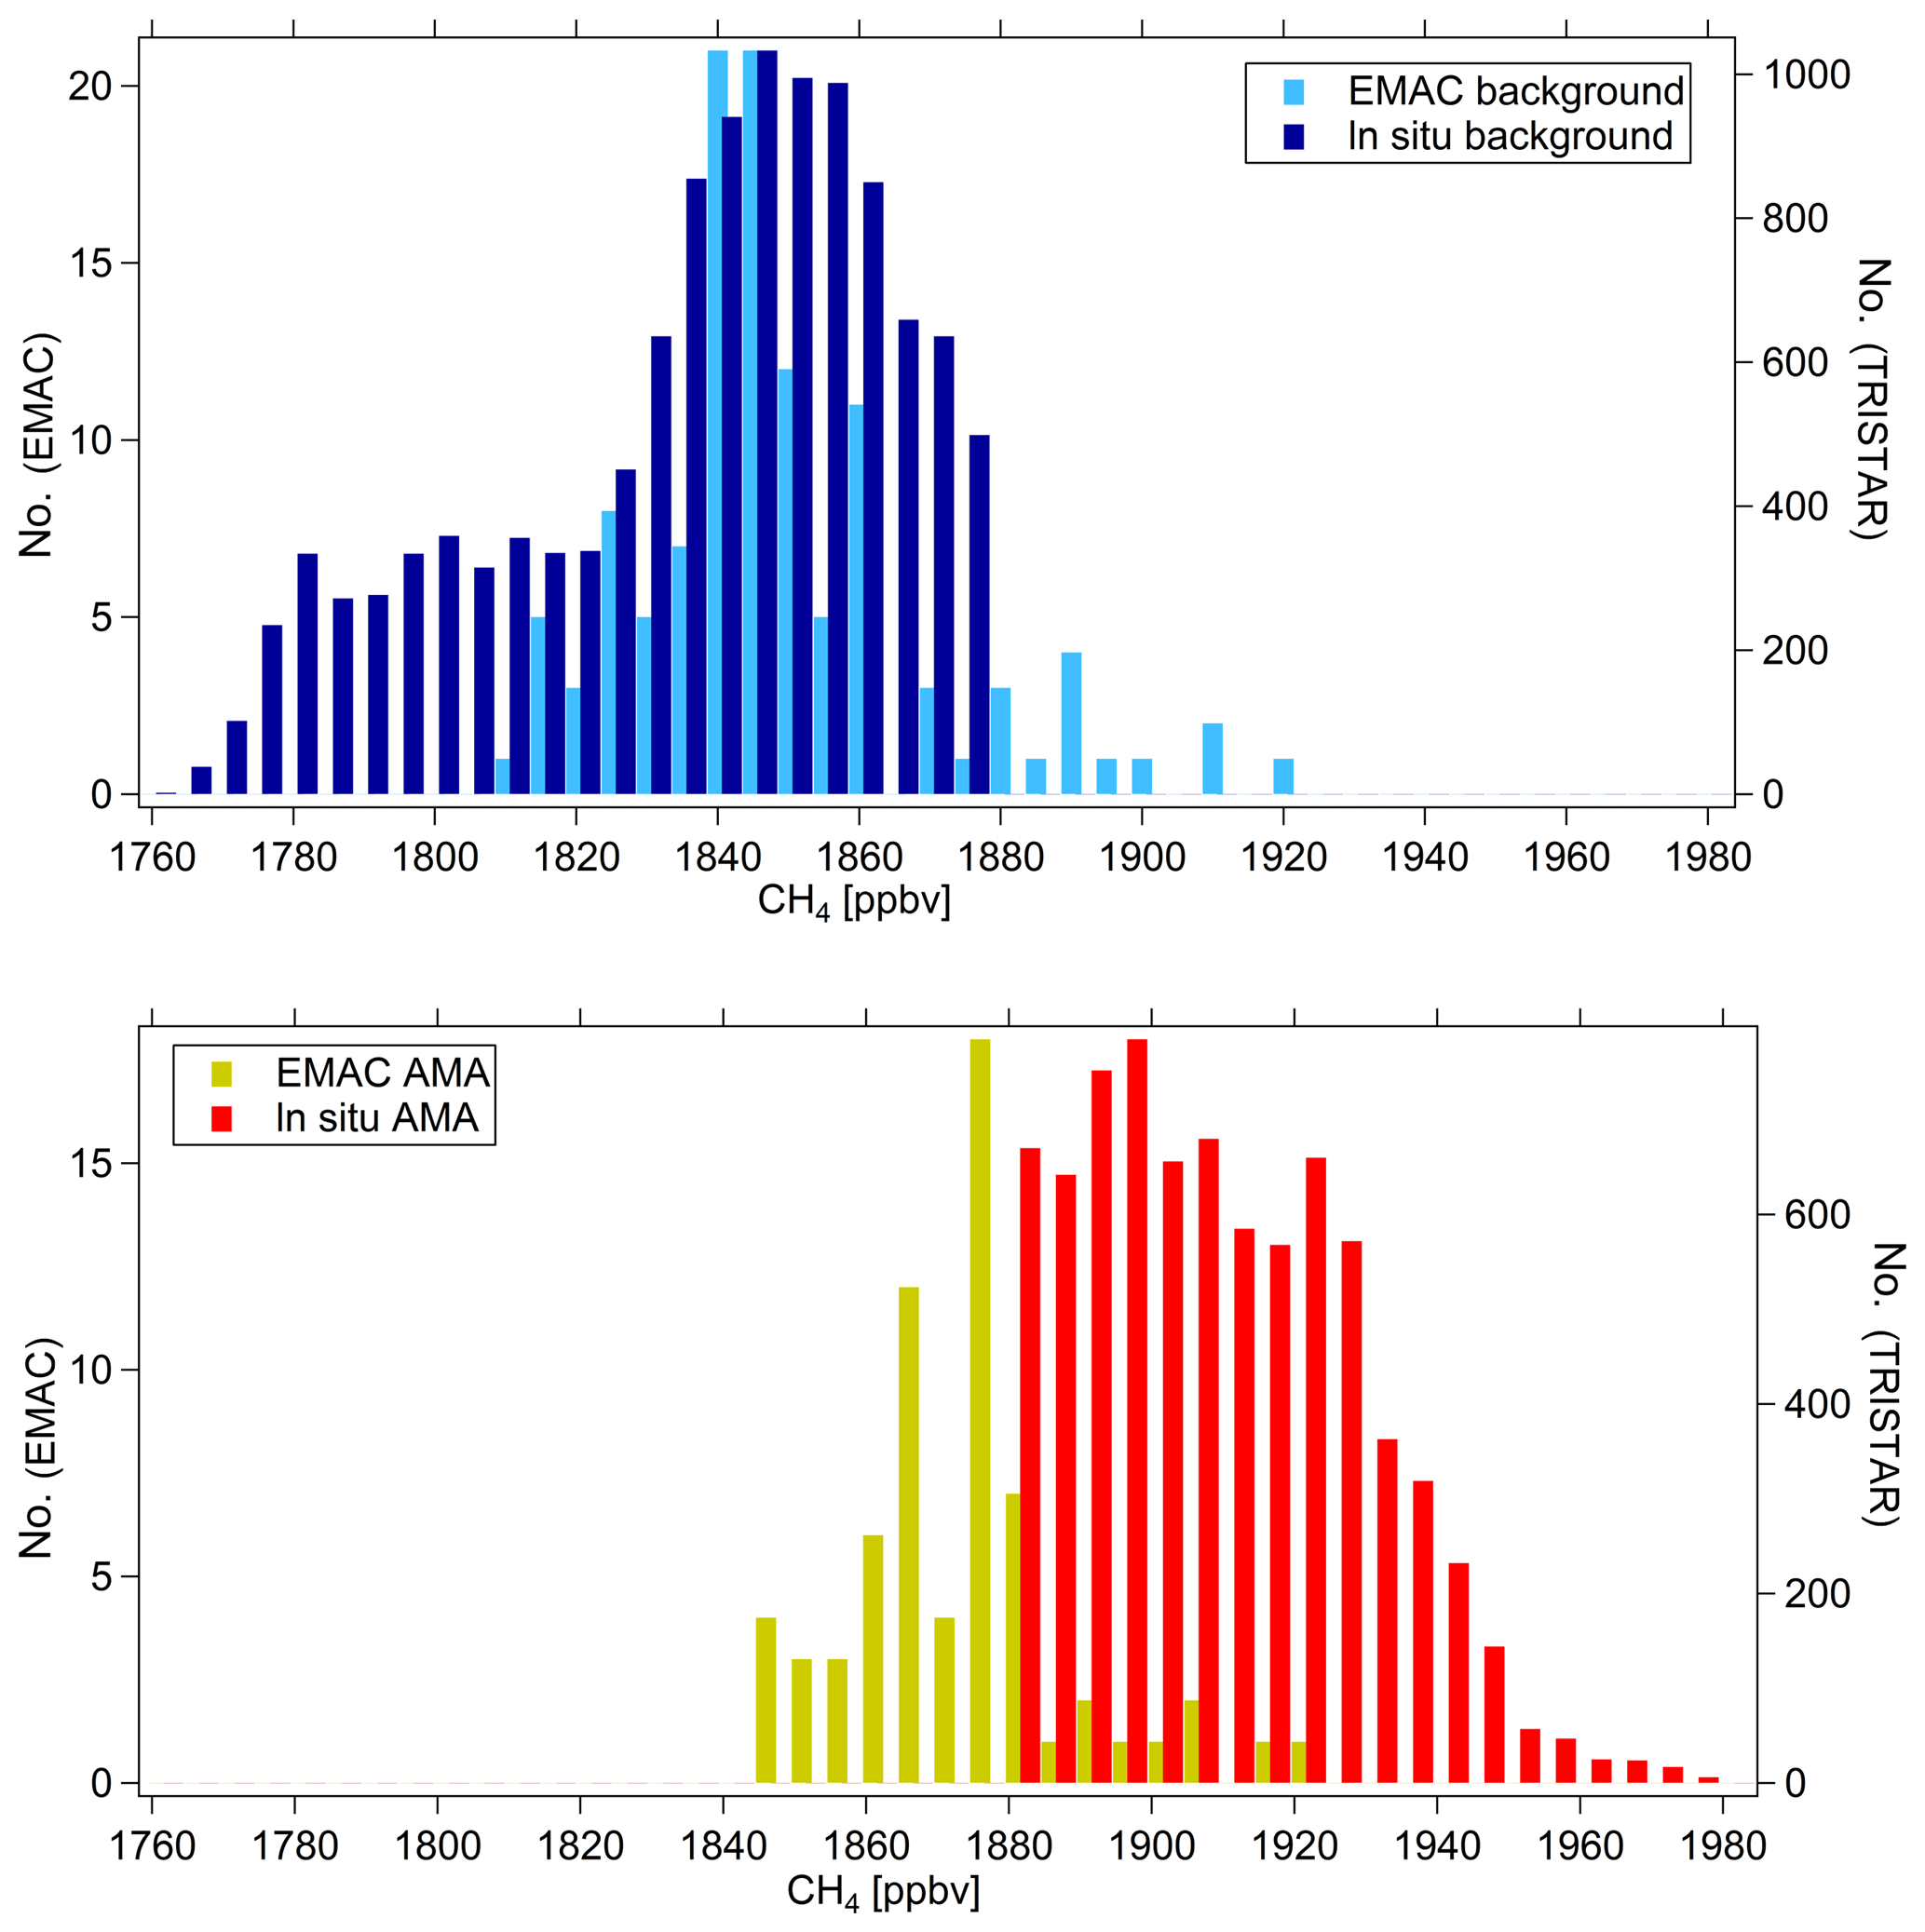
Figure 14Histogram for in situ measured and EMAC modelled CH4 within the 300–140 hPa altitude range, for both background and AMA air.
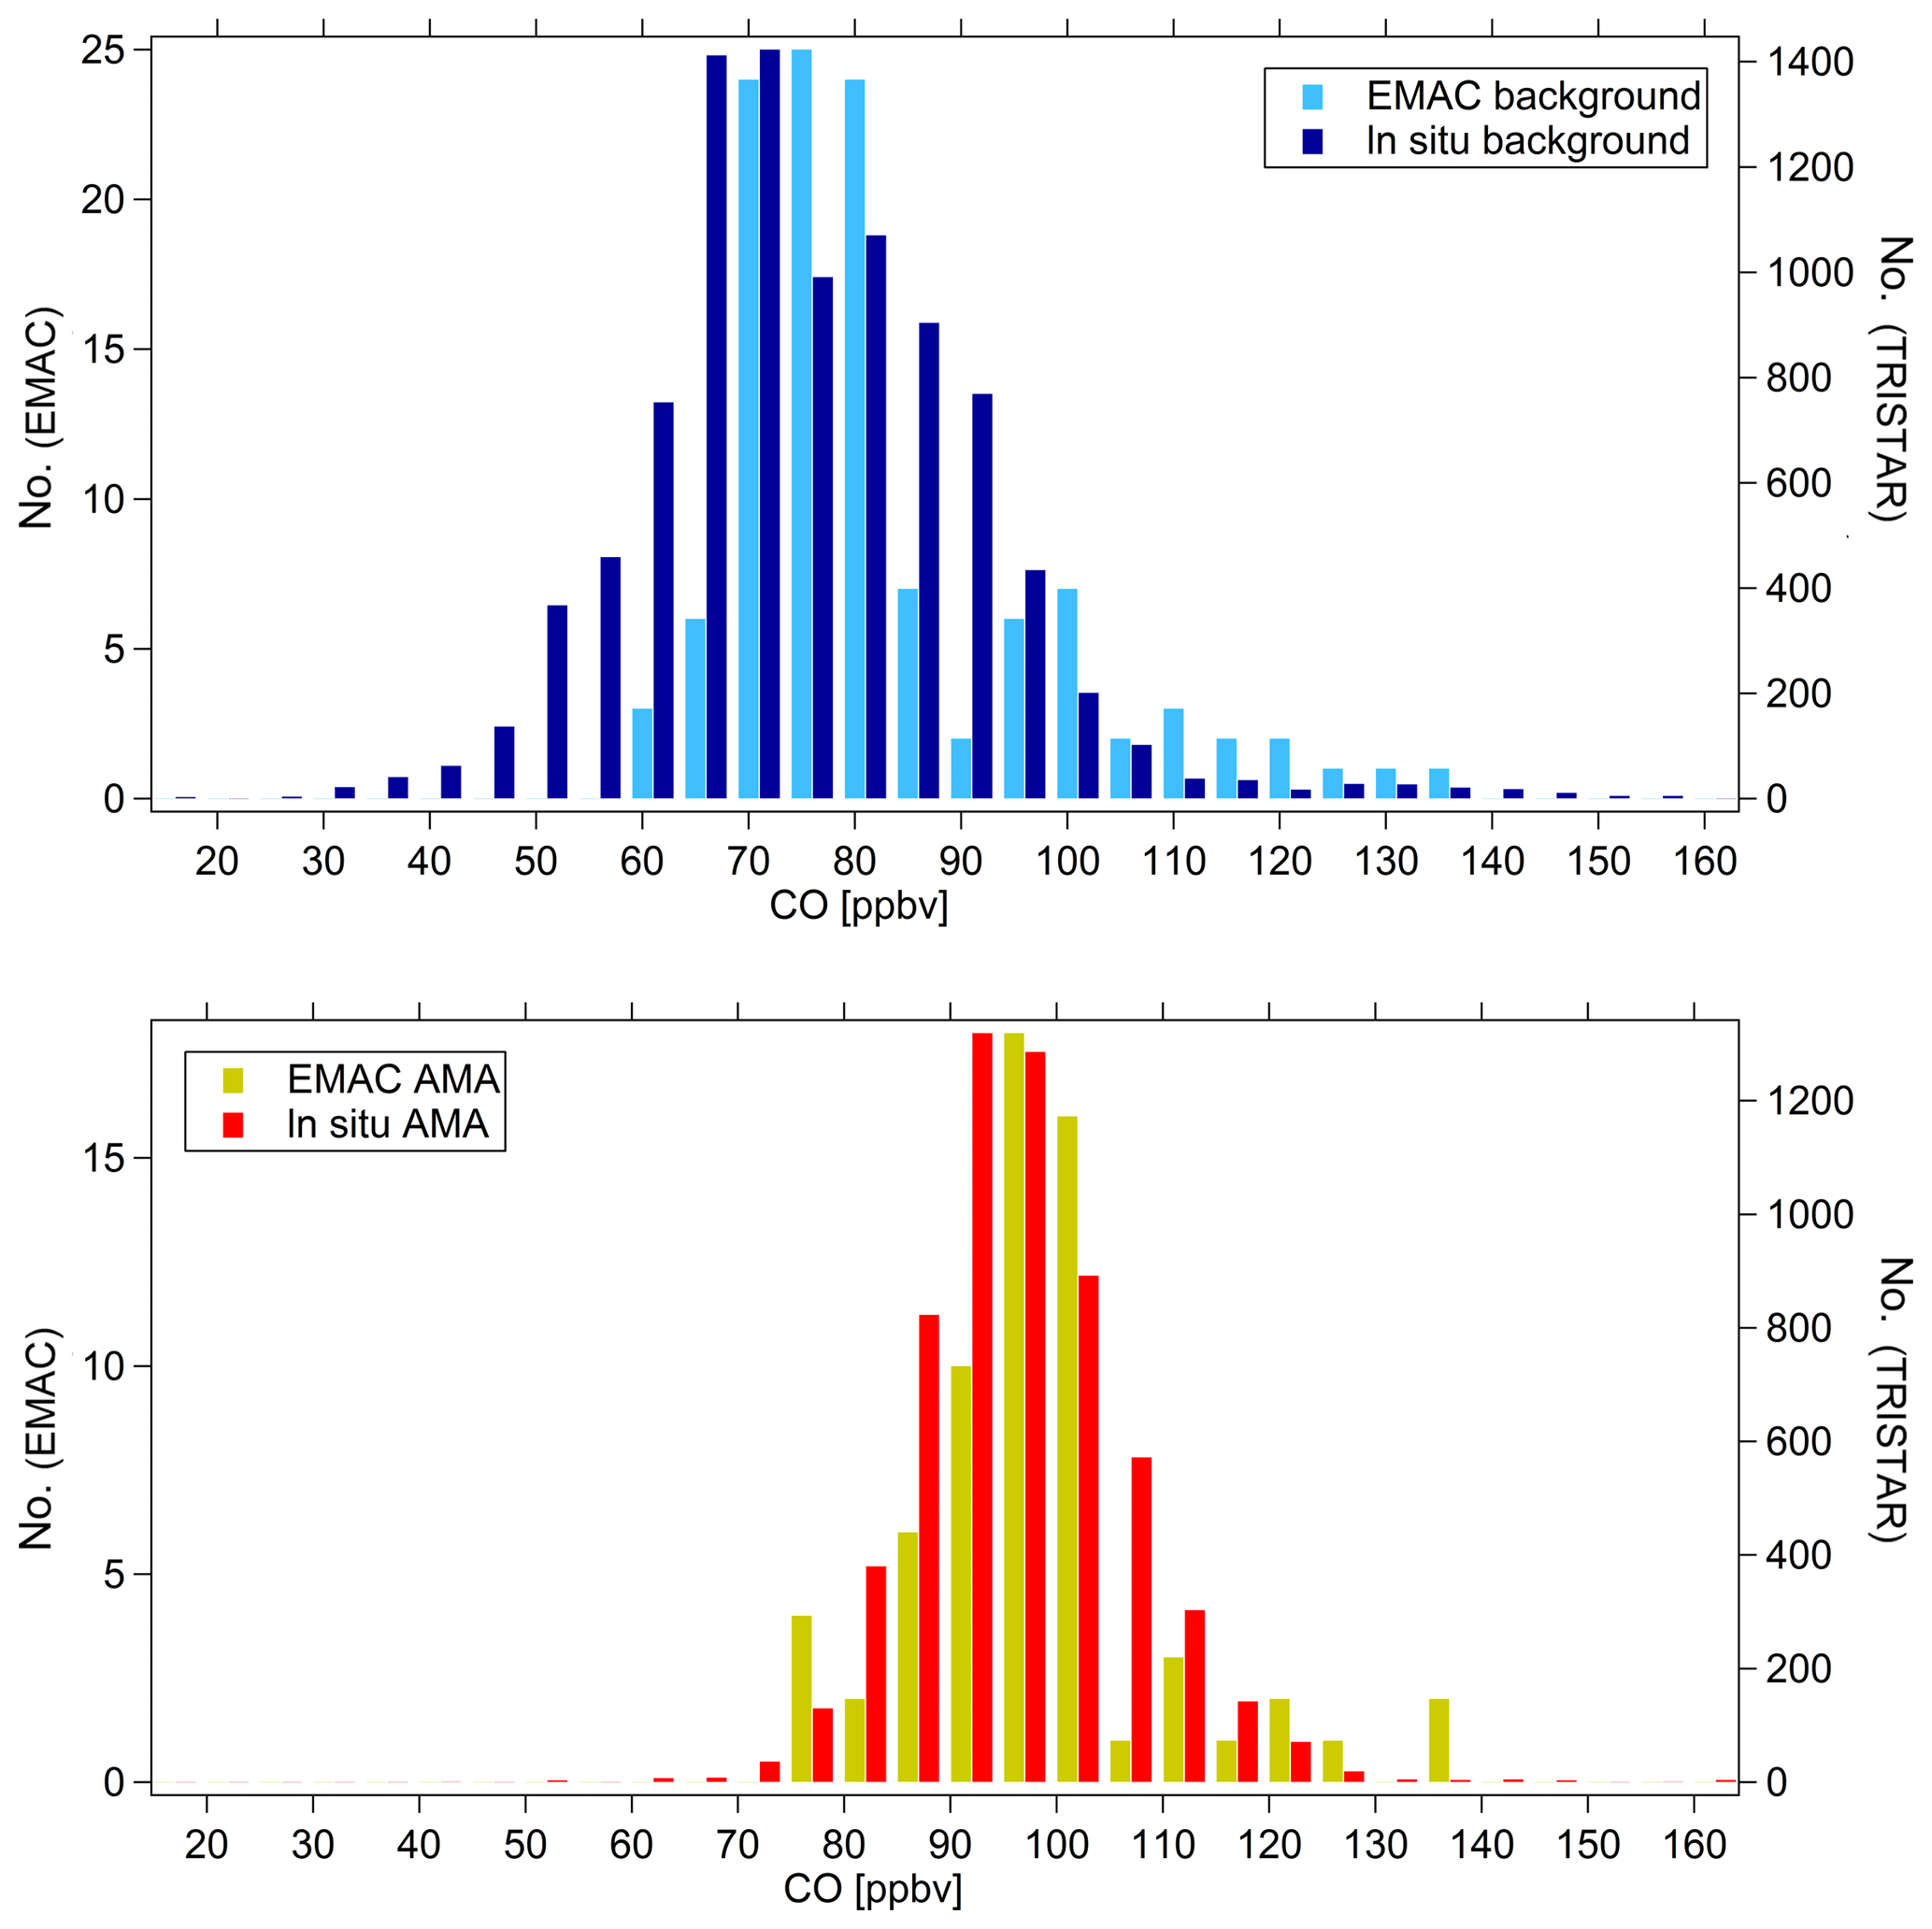
Figure 15Histogram for in situ measured and EMAC modelled CO within the 300–140 hPa altitude range, for both background and AMA air.
In Figs. 14 and 15, the respective histograms for CH4 and CO mixing ratios are shown for observations and model data at altitudes between 300 and 140 hPa separated into values above (AMA) and below (background) the CH4 threshold. The CO observations and model data have similar distributions for background as well as AMA conditions. Average CO mixing ratios for observations and model data for AMA and background conditions agree within their 1σ-standard deviations (Table 1). The CH4 mixing ratio average from the model for background conditions also agrees with the observations within their combined standard deviations, whereas the difference of the AMA CH4 averages between the model and the observations is more pronounced. Observed CH4 averages for the background and the AMA can be clearly distinguished, which is mostly due to the CH4 threshold itself, which subdivides the data into two regimes. The distribution of the in situ CH4 background data consists of two modes. The mode with low mixing ratios is associated with the SH background, and consists of observations over the Indian Ocean from or towards Gan. In the Southern Hemisphere the CH4 mixing ratios range from 1760 to 1820 ppbv. The second mode represents the NH background with mixing ratios in the range from 1820 to 1880 ppbv, comprised of observations over the Mediterranean and partly over the Arabian Peninsula. In comparison, the simulated CH4 background distribution lacks the SH mode. EMAC also underestimates the AMA CH4 mixing ratios. Accordingly, the CH4 enhancement of the model is smaller than in the observations. AMA-influenced air masses show a broad distribution of CH4 mixing ratios with values ranging from 1880 to 1980 ppbv. During the OMO campaign the position of the anticyclone changed repeatedly; thus, observations were made at varying distances between the aircraft and the centre of the anticyclone (see Sect. 3.5). As expected, this leads to variations in the observed CH4 mixing ratios for air masses influenced by the AMA. Furthermore, changes in the location of deep convection, the strength of the updraught, or differences in emission sources also lead to variability in the observed CH4 mixing ratios (see Sect. 3.5). While the observed background conditions for both NH and SH each cover a range of approximately 60 ppbv, the AMA mixing ratios vary by about 100 ppbv.
3.5 AMA modes
Over the course of the OMO campaign the occurrence, position, and extent of the AMA varied. The AMA pattern can be subdivided into four meteorological situations, which can be identified in the EMAC daily means for CH4 and the wind pattern at a pressure level of 204 hPa. The first mode (Fig. 16) is composed of two distinct anticyclones, which slowly move eastward between 21 July and 1 August 2015. On 21 July a western anticyclone is positioned over the eastern Mediterranean. Its centre subsequently shifts towards the east. The eastern anticyclone with its centre around 70∘ E shifts eastward towards the Tibetan Plateau. The second mode (Fig. 17) which consists of a single anticyclone is found during the period from 6 to 10 August 2015. This mode has its centre over the Kashmir region (∼70–80∘ E), which corresponds to the climatic mean location of the AMA centre (Zhang et al., 2002) and is called the central mode. The third, single anticyclone mode (Fig. 18) has its centre over the Tibetan Plateau (∼82.5–92.5∘ E) and was observed between 11 and 18 August 2015 (and is referred to as the Tibetan mode; Zhang et al., 2002). In the following (20 to 27 August 2015) the anticyclone of the Tibetan mode moves westward and divides into two anticyclones (Fig. 19). Here the westward movement of the AMA leads to instabilities in the circulation (Popovic and Plumb, 2001) so that a second anticyclone can break-off the main feature (Hsu and Plumb, 2000). The western anticyclone now has its centre above the Middle East, and the eastern anticyclone has its centre over the Tibetan Plateau.
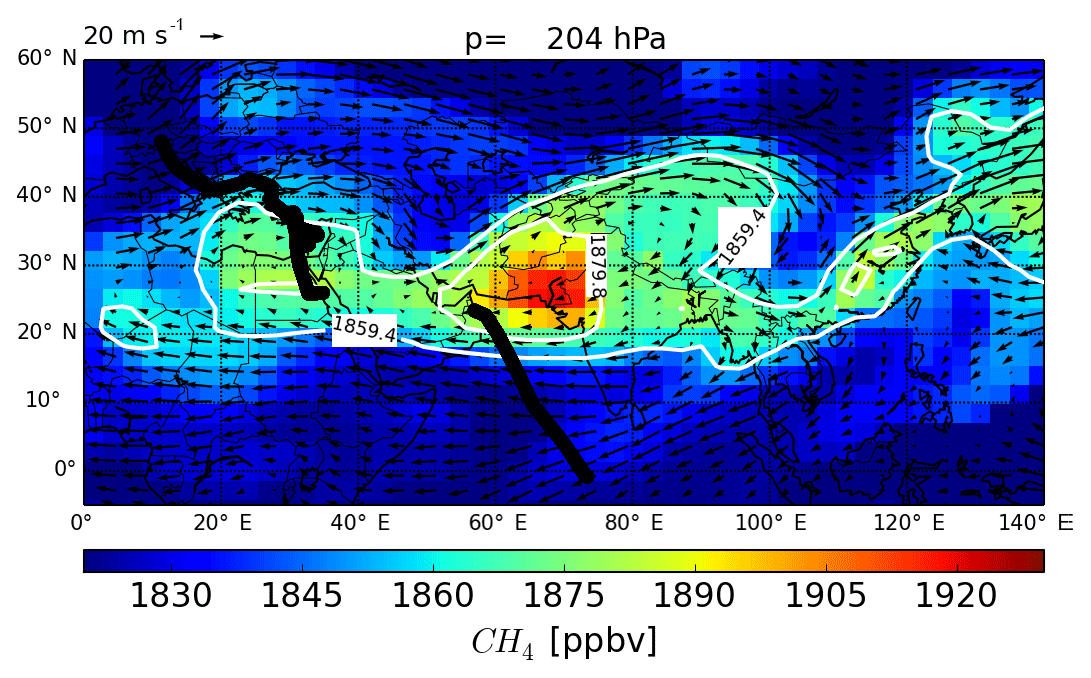
Figure 16Double anticyclone mode illustrated with wind field and CH4 EMAC daily means at 204 hPa (25 July 2015) and the associated flight tracks. White contours represent the CH4 threshold and background values according to Sect. 3.1.
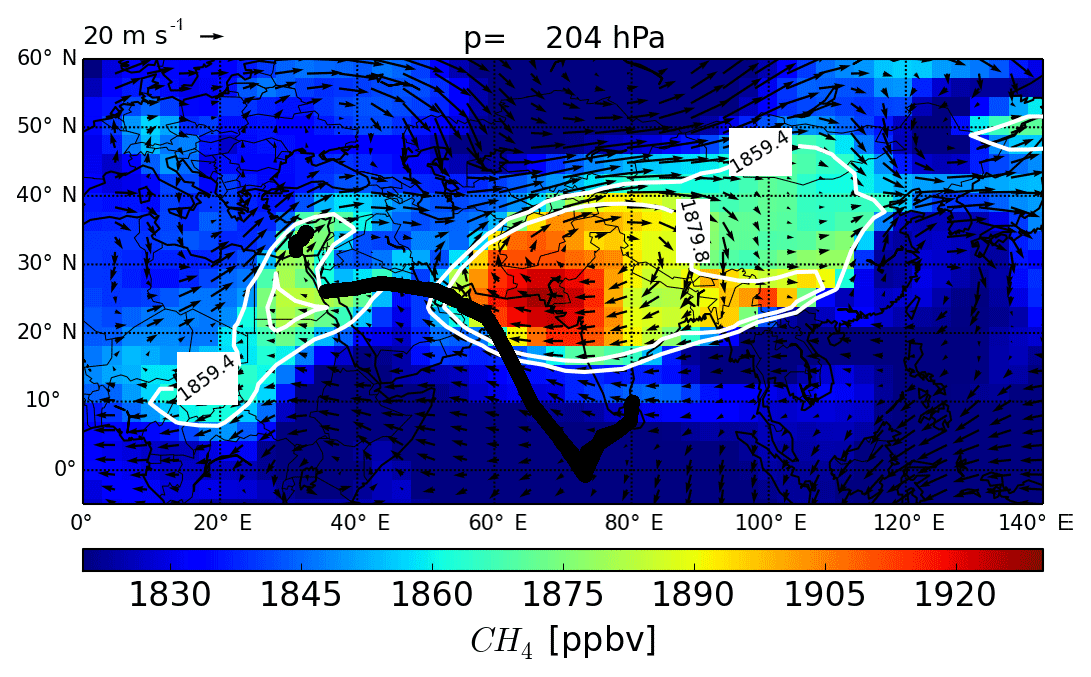
Figure 17Central anticyclone mode illustrated with wind field and CH4 EMAC daily means at 204 hPa (9 August 2015) and the associated flight tracks. White contours represent the CH4 threshold and background values according to Sect. 3.1.
During OMO the time period between the reoccurrence of the two distinct anticyclones is around 20 days. A 10–20 day cycle of westward propagation of the anticyclone including splitting into two anticyclones has been reported by Krishnamurti and Ardanuy (1980) and has been shown to lead to a succession of rainy and dry periods in India during the monsoon season. Zhang et al. (2002) presented a bimodality of the AMA with a centre position of the anticyclone over the Iranian or the Tibetan plateaus. During OMO we found both positions, which is in line with the assumption of bimodality. In contrast, Nützel et al. (2016) reported different centre positions of the AMA in several models, although most of them did not simulate a preferred bimodality. Regarding the eastern anticyclones during the double anticyclones modes, the positions were in between the Iranian and Tibetan plateaus (first mode); in the fourth mode they were over the Tibetan Plateau. Consequently, they do not support a preferred bimodality. In Zhang et al. (2002) and Nützel et al. (2016) the Iranian and the Tibetan mode are further distinguished by parameters, such as diabatic heating, rain patterns, or areas of convection, which are outside the scope of the present study. Here the focus is on the dynamics with respect to the trace gas distributions. The subdivision into four modes represents the dynamics of the AMA over the course of the campaign.
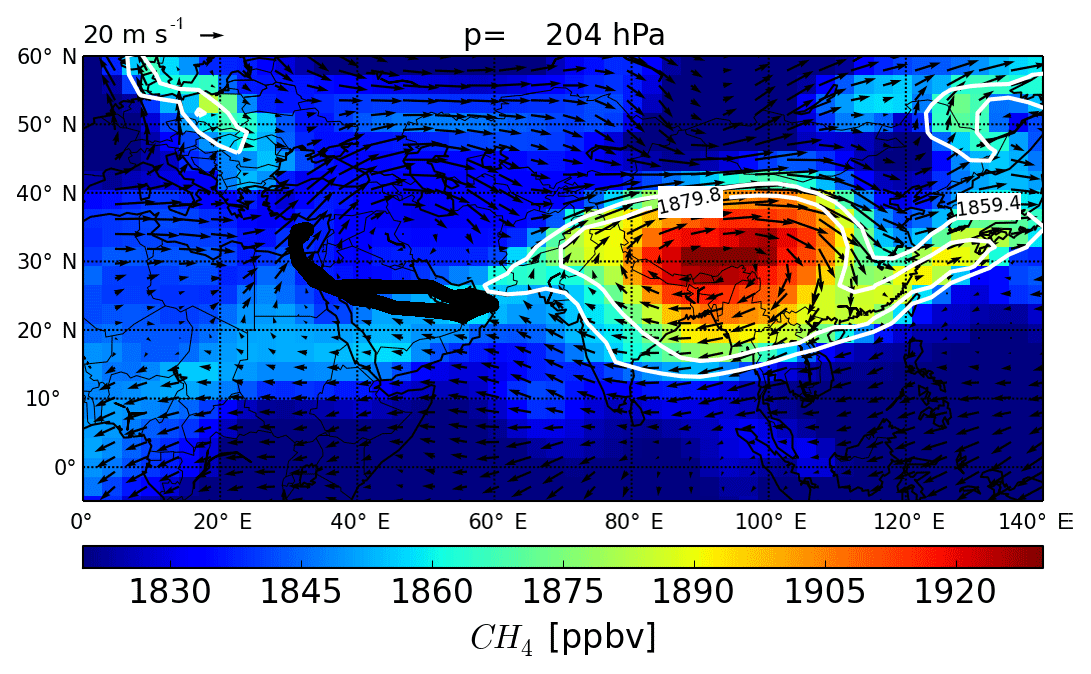
Figure 18Tibetan anticyclone mode illustrated with wind field and CH4 EMAC daily means at 204 hPa (15 August 2015) and the associated flight tracks. White contours represent the CH4 threshold and background values according to Sect. 3.1.
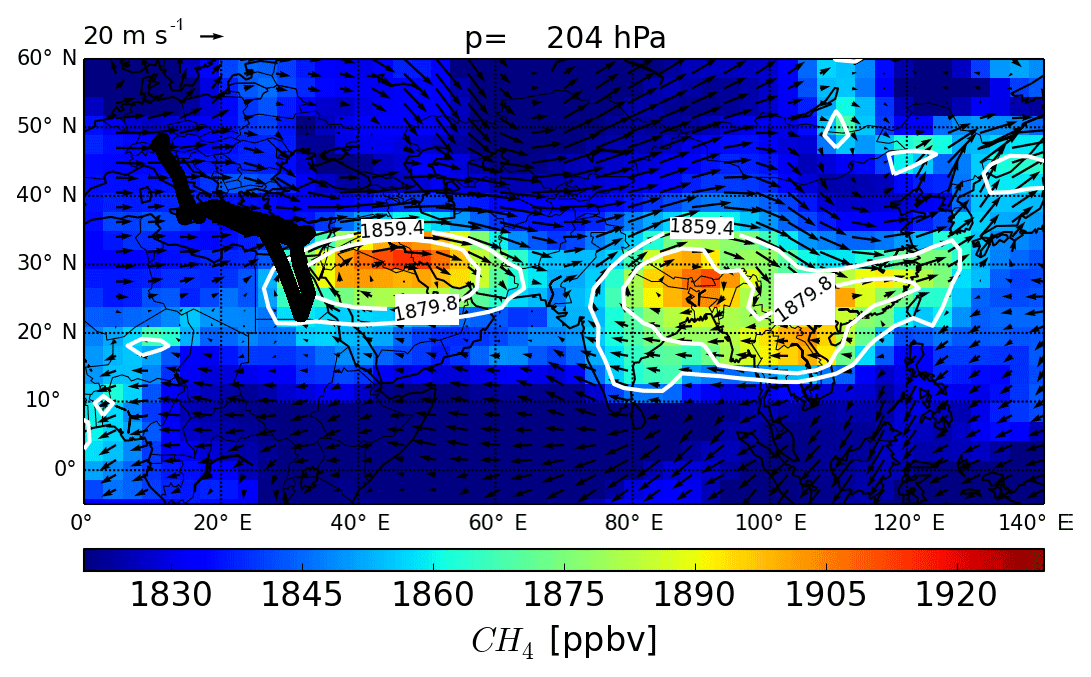
Figure 19Double anticyclone mode illustrated with wind field and CH4 EMAC daily means at 204 hPa (25 August 2015) and the associated flight tracks. White contours represent the CH4 threshold and background values according to Sect. 3.1.
Different trace gas levels between these four modes can also be identified in the CH4 and CO observations by subdividing the observations into AMA-influenced and background values at altitudes between 300 and 140 hPa (Table 2). The lowest CH4 mixing ratios in background air are observed during the central mode, as HALO was mostly flying at low latitudes over the Indian Ocean during this time. These flights were influenced by Southern Hemisphere air masses due to the ITCZ shift to the north during boreal summer. Especially over India, the position of the ITCZ is generally between 5 and 30∘ N in summer (Lawrence and Lelieveld, 2010). For the other three AMA modes the CH4 background values are comparable, representing northern hemispheric background conditions. Their mixing ratios also reflect the CH4 mixing ratio derived for the NH background profile (1859.4 ppbv) in Sec. 3.1.
Table 2In situ CO and CH4 for the four different anticyclone situations. Differentiation between AMA and background for each flight between 300 and 140 hPa.
CO mixing ratios in background air masses show hardly any difference between the Northern Hemisphere and the Southern Hemisphere in the upper troposphere. This is consistent with airborne observations during the Indian winter monsoon (January 1999) over the northern part of the Indian Ocean during the INDOEX campaign (Gouw et al., 2001). While no significant CO gradient was observed in the upper troposphere, a pronounced north–south gradient of 3.9±1.9 ppbv deg−1 latitude was observed below 3 km (Gouw et al., 2001).
Differences in CH4 and CO mixing ratios for AMA-influenced air masses during OMO can be explained by the relative distance between the position of HALO and the position of the centre of the AMA. With increasing distance from the centre of the anticyclone, mixing ratios tend to decrease. The distribution of the trace gases in the upper troposphere depends on the dynamics of the monsoon, as the position and strength of the convection change during the wet season (Randel and Park, 2006). For example, if convection takes place over the Bay of Bengal, less polluted air is uplifted. In contrast, if the convection is directly over densely populated regions, e.g. Bangladesh, which are more polluted, convection transports the pollutants to the upper troposphere. At the same time, the strength of the convection changes within the monsoon due to differences in thermal heating between the relatively cold ocean and the hot land (Dethof et al., 1999).
During OMO, the CH4 mixing ratios for AMA-influenced air masses varied temporally from mode to mode. The different mixing ratios do not follow a simple system (Table 2), and cannot be fully explained by the relative distance from the AMA centre. Although the distances to the respective anticyclone centres were shortest during the two anticyclones modes, the observed CH4 mixing ratios were both lowest and highest. In these cases, only the western AMA was probed above the eastern Mediterranean or the Middle East, because the flight tracks were in the same region. In contrast, the CH4 mixing ratios for the two single AMA modes represented levels in between the minimum and the maximum CH4 mixing ratios. In fact, CH4 mixing ratios influenced by the monsoon increased from the first mode to the fourth. The increase in average CH4 is even more pronounced if we only include flights 22 and 23 in the fourth mode, as the flight track of flight 24 over the Mediterranean was not at all impacted by the AMA. Thus, the average CH4 mixing ratio for the last mode becomes 1927.1 ppbv, which indicates an even stronger CH4 increase over the course of the OMO campaign. The CH4 enhancement can most likely be explained by a combination of the position of the convection, the temporal development of the AMA, and the accumulation of emissions in time. A strengthening of the convection and/or a shift of the convection towards areas with larger emission sources would lead to higher CH4 mixing ratios in the upper troposphere. A temporal increase in emissions, as described for CH4 in Sect. 3.3, also induces an increase of CH4 in the AMA as reported by Xiong et al. (2009). They observed an enhancement of CH4 in the upper troposphere during the monsoon season, starting with pre-monsoon conditions around June, and increasing toward the end of the monsoon season (September). Accordingly, the strong AMA circulation traps the polluted air masses, and the degree of pollution increases during the monsoon season.
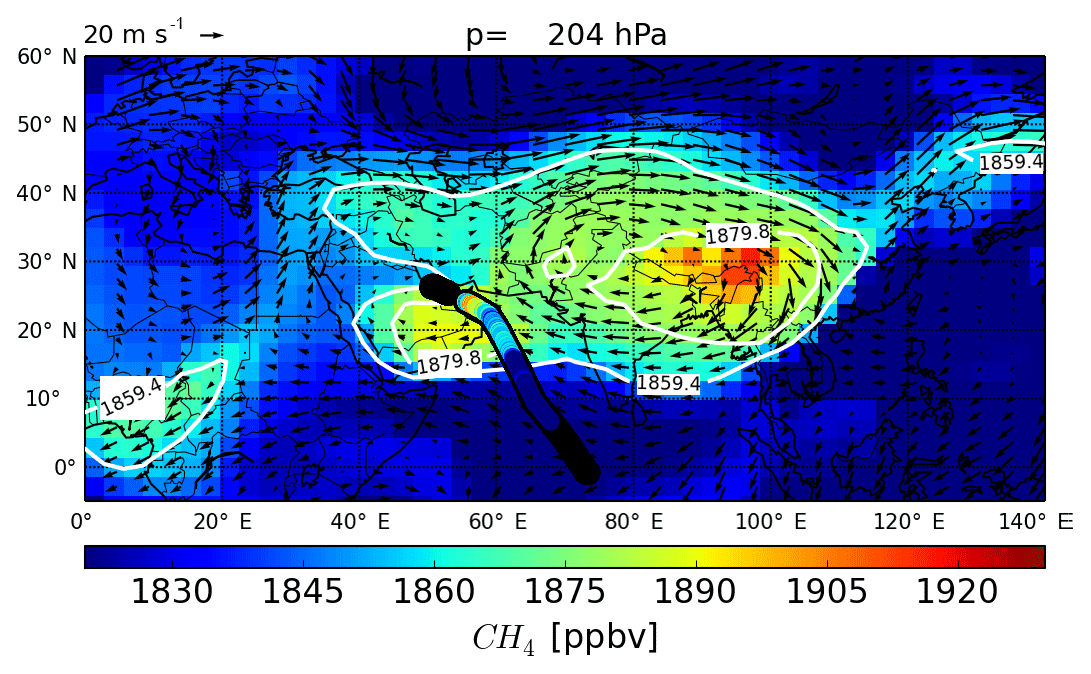
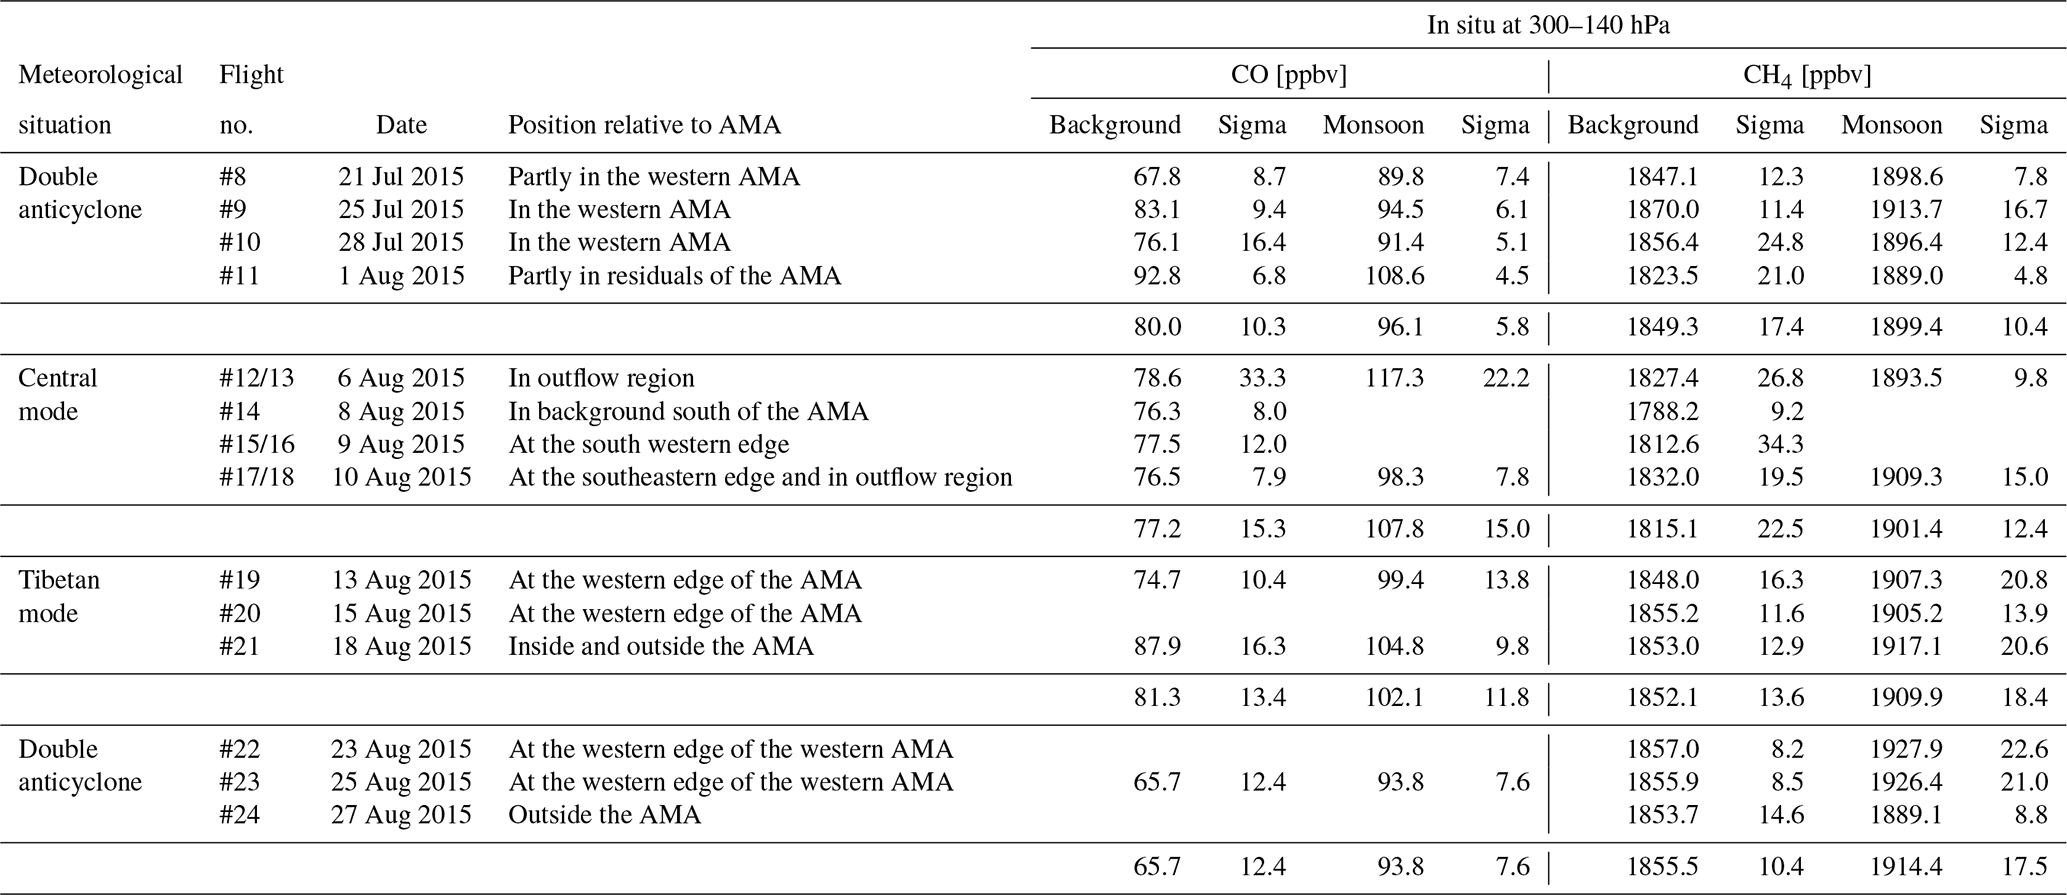
Figure 20EMAC calculated CH4 and wind field; daily means at 204 hPa, and in situ CH4 (above 300 hPa) along the aircraft track for flight 12/13 (6 August 2015). White contours represent the CH4 threshold and background values according to Sect. 3.1. The enhanced CH4 values over Oman represent the outflow.
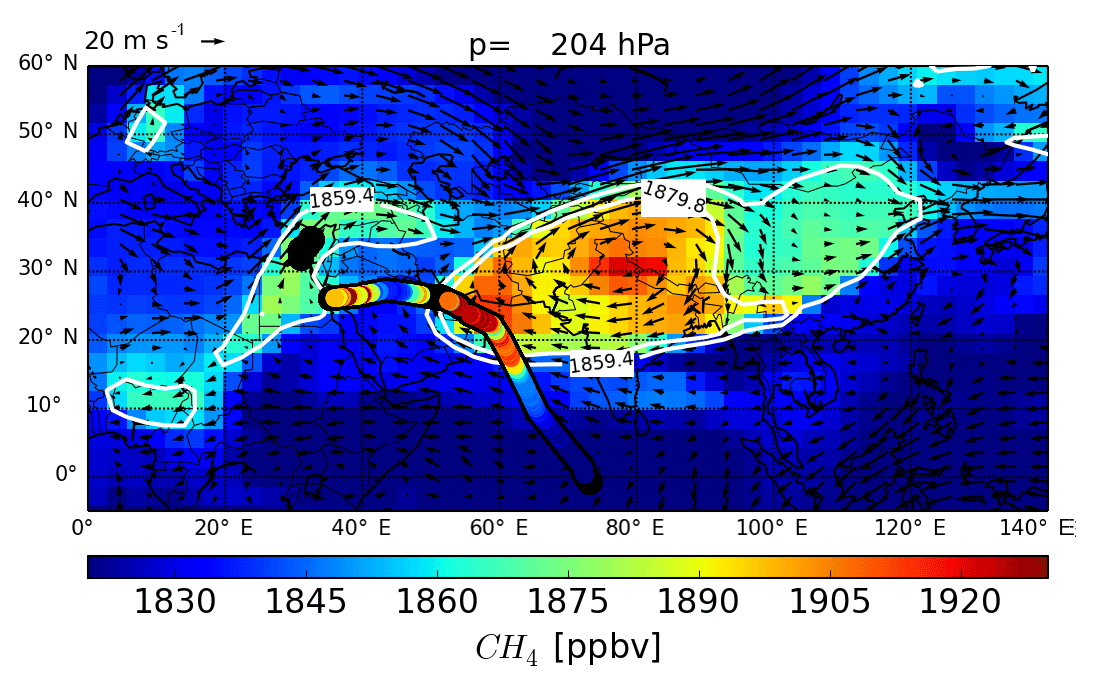
Figure 21EMAC calculated CH4 and wind field; daily means at 204 hPa, and in situ measured CH4 (above 300 hPa) along the aircraft track for flight 17/18 (10 August 2015). White contours represent the CH4 threshold and background values according to Sect. 3.1. The enhanced CH4 values over the Red Sea represent the outflow.
The CH4 mixing ratios in the EMAC data at 204 hPa show similar distributions to the observations along the flight tracks, indicating that the simulations of the AMA position agrees with the observations. Note that the model may not resolve small-scale features due to its coarse resolution, which will lead to deviations between the simulated and the observed trace gas distribution, in particular close to the fringe of the AMA. In Sect. 3.6 we will describe a case study where the model successfully captures the weakening of the transport barrier and subsequent outflow of air masses from the AMA.
3.6 Outflow event from the AMA
Besides the different modes mentioned above, an outflow event was detected during OMO. In the EMAC data at 204 hPa an air mass with enhanced CH4 mixing ratios started to move from Bangladesh westwards on 2 August 2015. During the previous days, convection took place over Bangladesh and injected polluted air masses into the upper troposphere. The convection can also be identified in the cloud-top pressure data that show high clouds over Bangladesh. The air mass was further transported at the southern edge of the AMA following the tropical jet towards the west.
On 3/4 August, a disturbance in the subtropical jet caused an instability in the AMA circulation which led to a weakening of the wind field – especially in the southwestern part of the AMA. The slow AMA circulation was associated with a weakened transport barrier, which offers the possibility that air masses inside the AMA were split off. As the observed air mass was already at the fringe of the AMA circulation and thus transported into the region of the weak wind field, it left the AMA on 5 August. Afterwards the circulation of the AMA strengthened again. The air mass that left the AMA was probed by HALO over Oman on 6 August (Fig. 20). In the following days the westward transport of the air mass continued over the Arabian Peninsula following a southwesterly flow on 8 August. During its advection the originally compact air mass was stretched and transported northeastwards. On 10 August (Fig. 21) it was located above the Red Sea and then moved further northeastward, to be reintegrated into the AMA circulation at the northwestern edge of the AMA in close proximity to the subtropical jet.
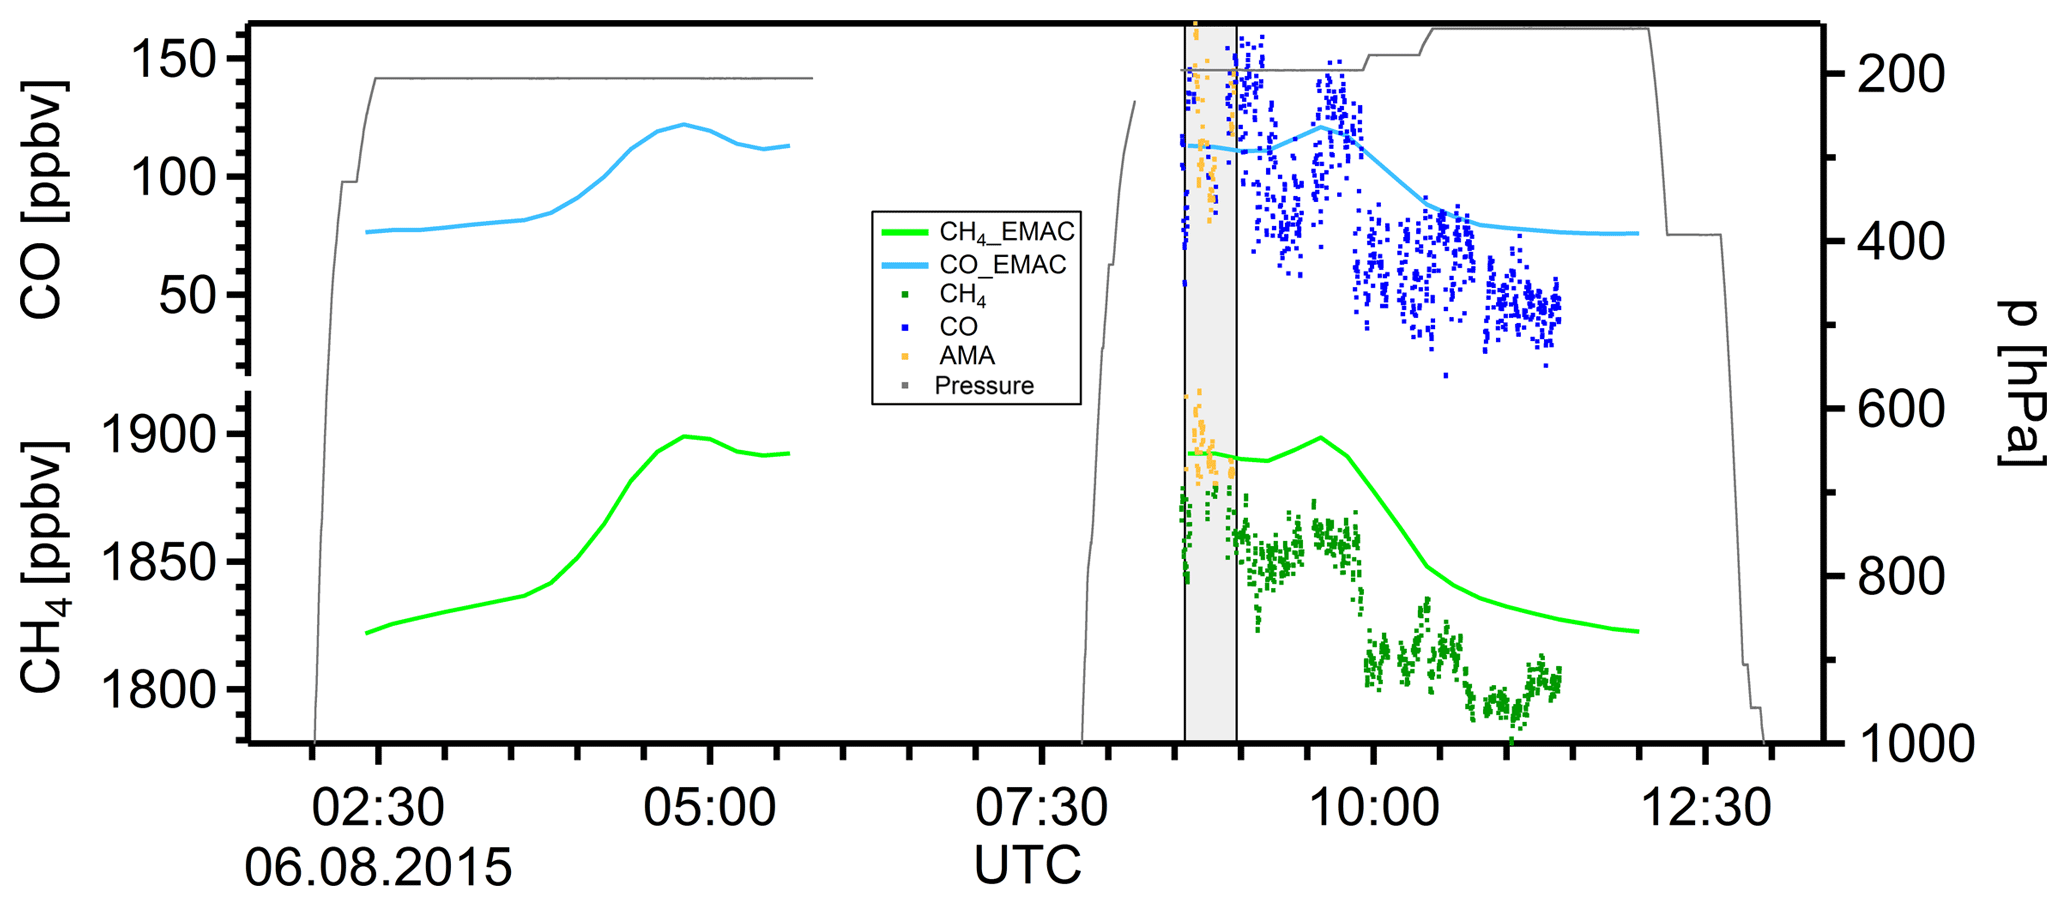
Figure 22Flight 12/13 (6 August 2015) in situ CH4 and CO data and EMAC results along the flight track, as well as the flight altitude. The AMA is colour-coded by CH4 > 1879.8 ppbv.
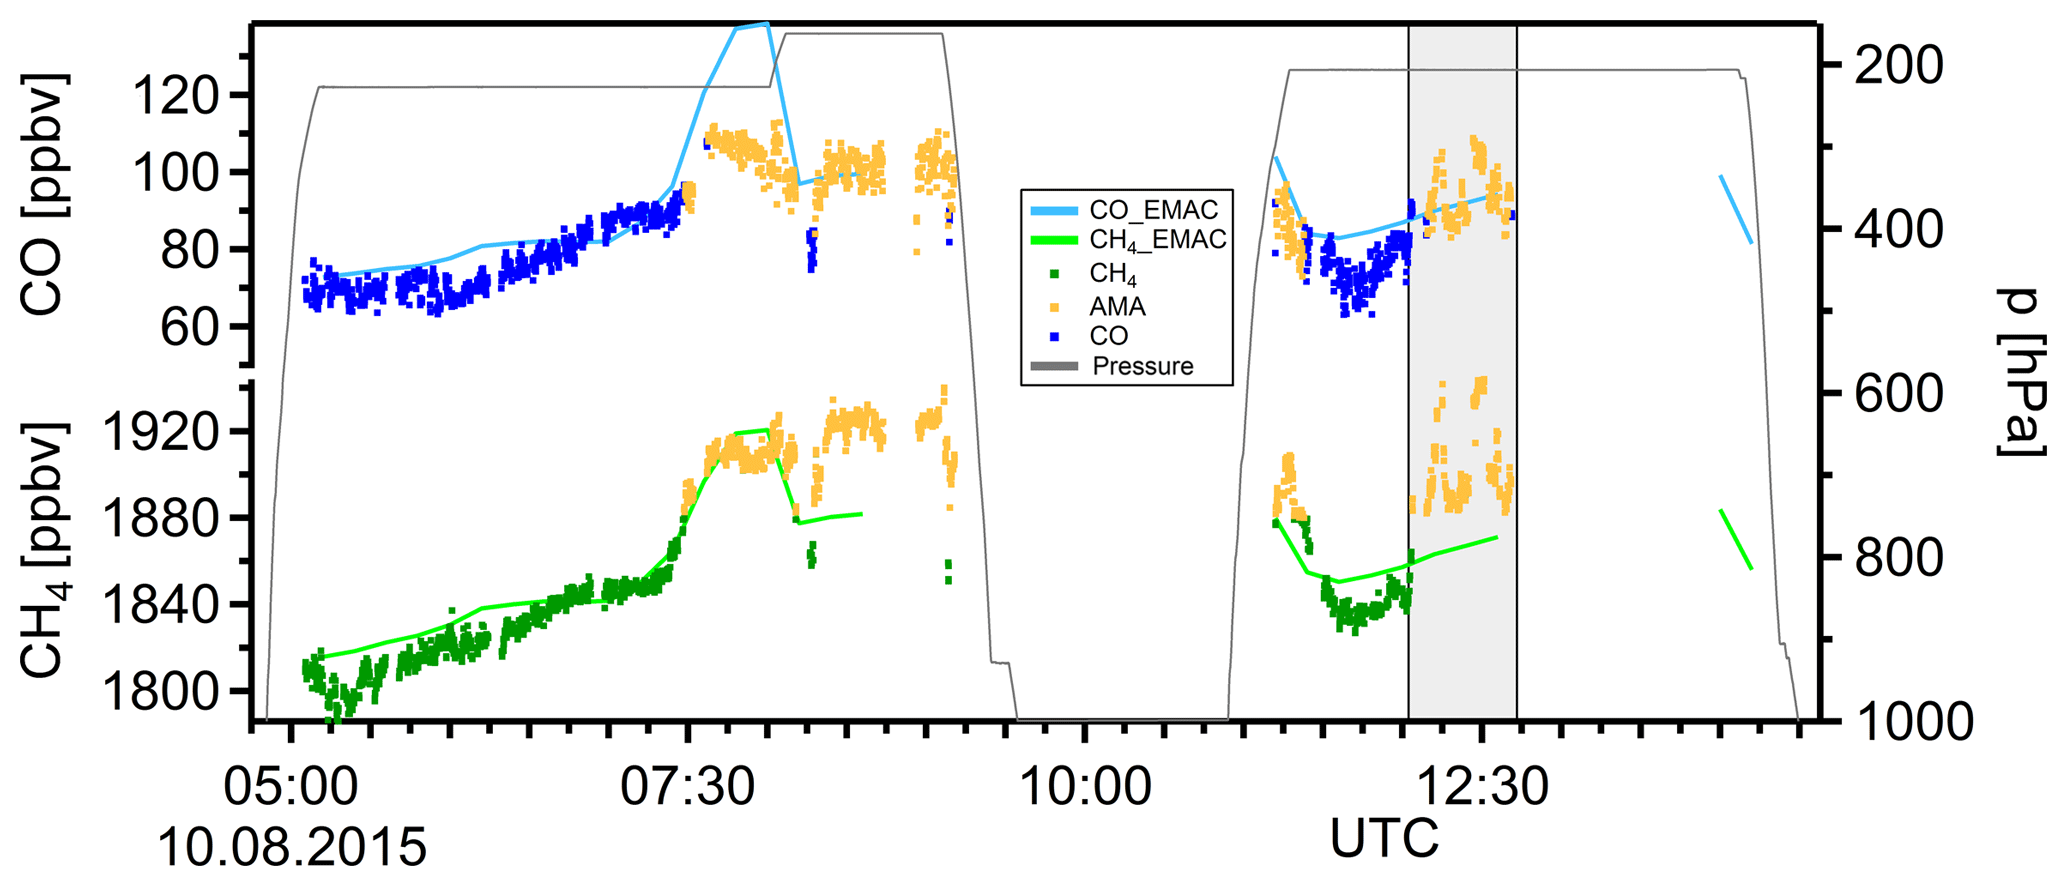
Figure 23Flight 17/18 (10 August 2015) in situ CH4 and CO data and EMAC results along the flight track, as well as the flight altitude. The AMA is colour-coded by CH4 > 1879.8 ppbv.
We measured the expelled air mass outside the AMA during two consecutive flights in a quasi-Lagrangian experiment. On 6 August (flight 12/13, Fig. 20) HALO probed the expulsion with enhanced CO and CH4 over Oman. In the air mass CO and CH4 mixing ratios increased to 117.3±22.2 and 1893.5±9.8 ppbv, respectively (background: CO ppbv and CH4 ppbv), which can be seen in Fig. 22. The second probing of this air mass took place on 10 August (flight 17/18, Fig. 21) over the Red Sea, yielding mixing ratios of 94.2±6.8 (CO) and 1903.7±19.2 ppbv (CH4). This corresponds to the increase at around 12:00–13:00 UTC in Fig. 23. The CO and CH4 mixing ratios observed during both flights agree well within their standard deviations, with the small (but insignificant) differences probably caused by different flight levels (flight 12/13: 11.9 km and flight 17/18: 12.4 km). Note that the standard deviation for CO during flight 12/13 is larger than that during flight 17/18 due to technical problems with the CO instrument. Comparing the EMAC simulations with the in situ data along the flight tracks (Figs. 22 and 23), the trends for the outflow agree. The EMAC average mixing ratios for CO and CH4 are 112.2±1.2 and 1891.7±1.2 ppbv, respectively, for flight 12/13 and 90.8±3.1 and 1864.6±5.9 ppbv for flight 17/18. Thus, these values also agree within their standard deviation except for CH4 in flight 17/18, where the outflow is underestimated by the model.
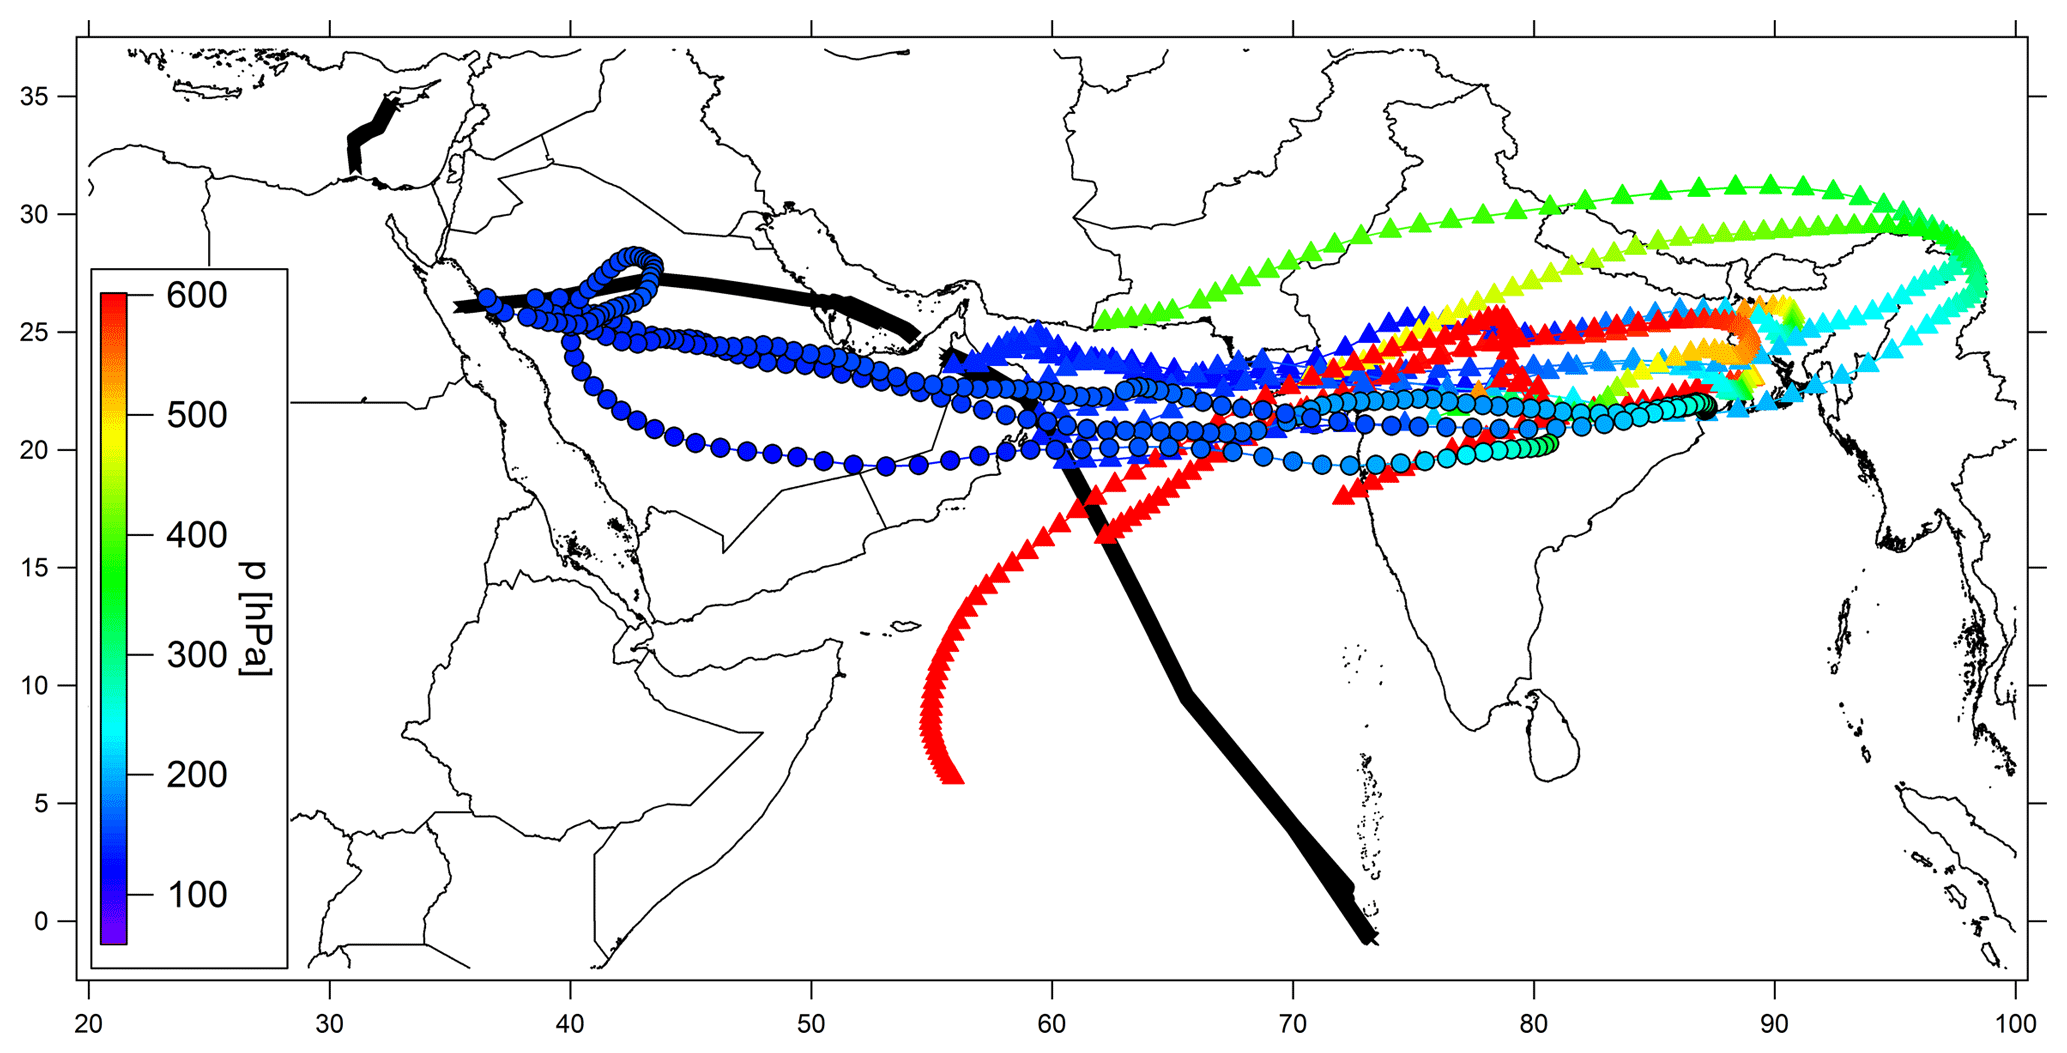
Figure 24Centroid back trajectories for enhanced CH4 mixing ratios during flight 12/13 (triangles) and flight 17/18 (circles) with colour-coded height.
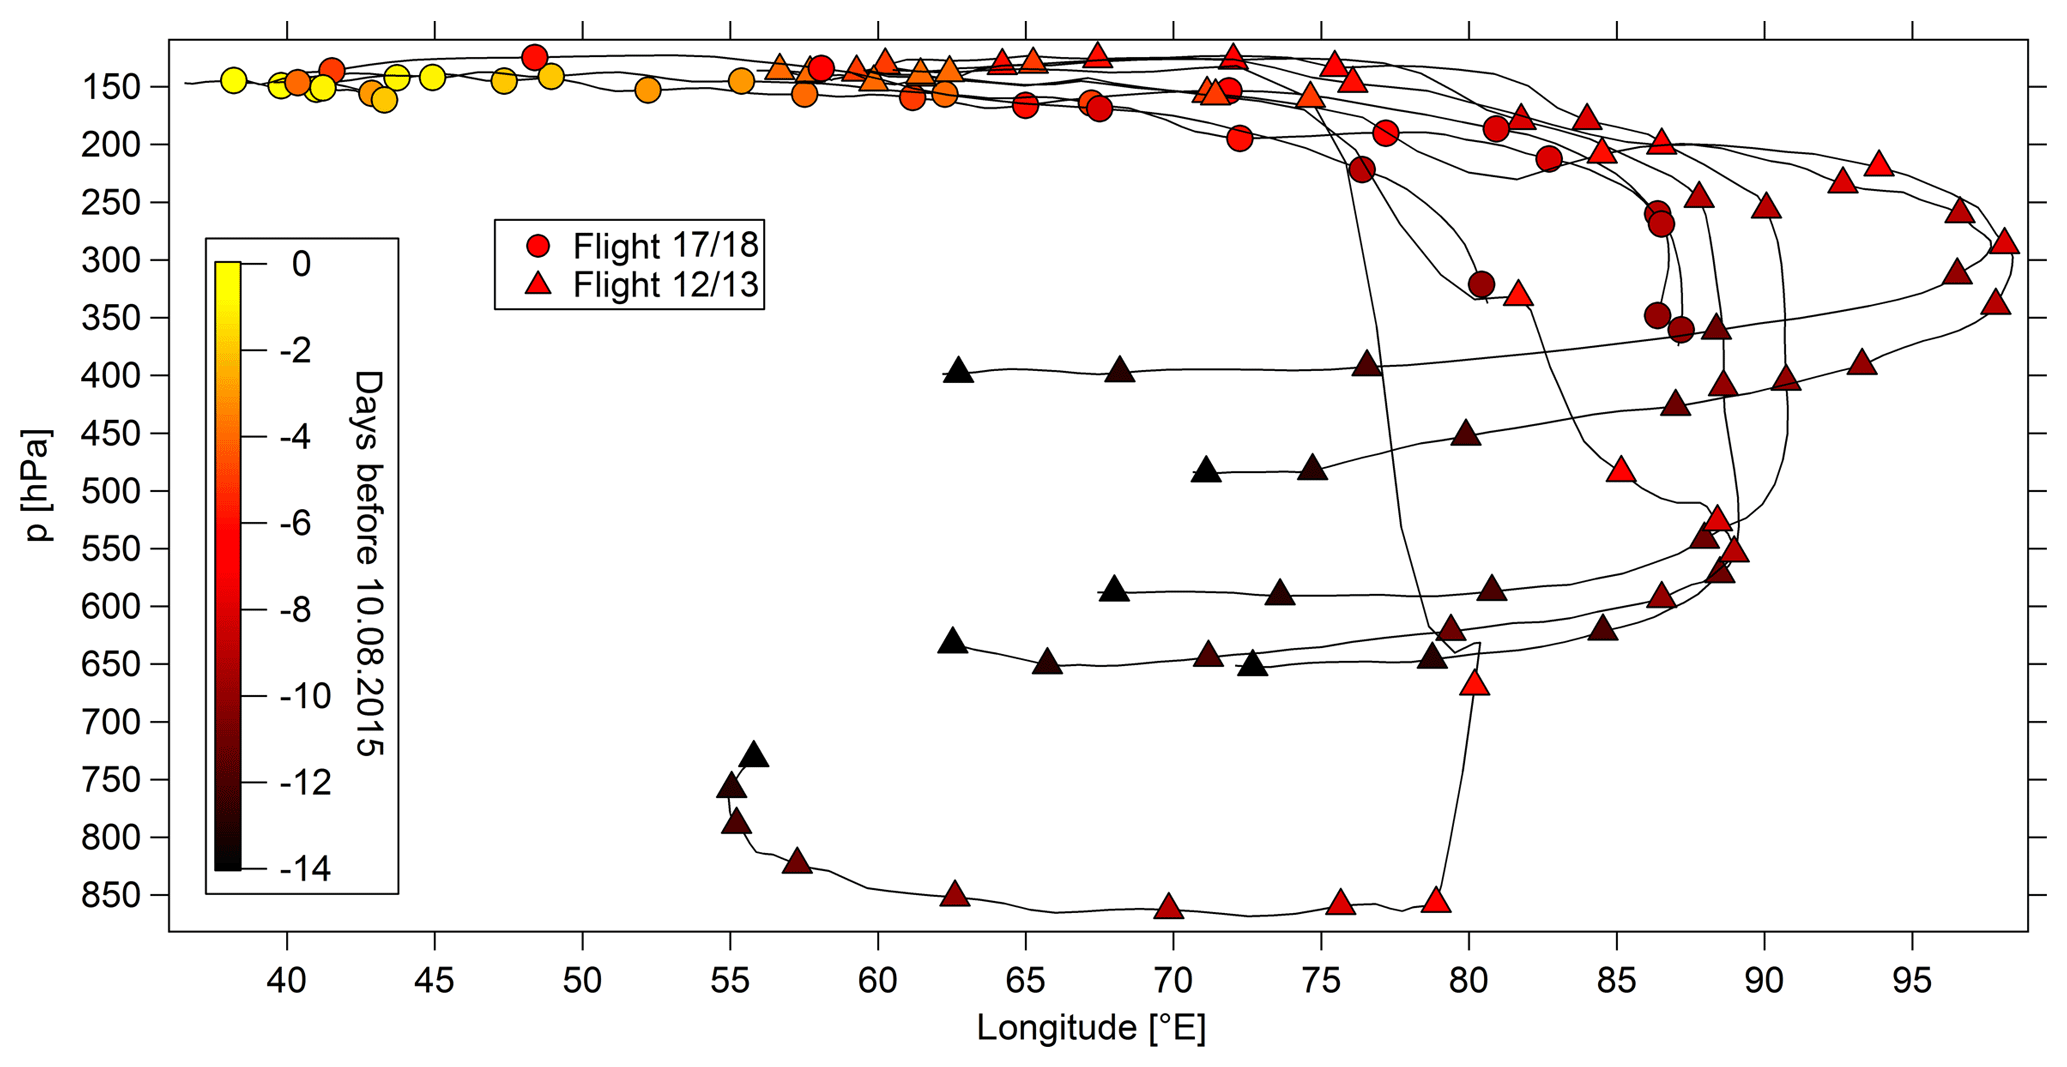
Figure 25Centroid back trajectories for enhanced CH4 mixing ratios during flight 12/13 (triangles) and flight 17/18 (circles) with colour-coded days before the release on 10 August 2015.
To check if the expelled air masses probed during the two flights were connected in a Lagrangian sense, we use centroid back trajectories. In Fig. 24 the 10-day back trajectories for the enhanced CH4 values, associated with the locations of the previously mentioned outflow event (Figs. 20 and 21), are shown for flights 12/13 and 17/18. The trajectories have their origin in the lower troposphere (below ∼550 hPa) over the Arabian Sea and the Indian subcontinent. In the area of Bangladesh, the trajectories are convectively uplifted to the upper troposphere. From there they follow the tropical jet west, towards Oman and the Red Sea. The trajectories fit well to the simulated movement of the air mass with the enhanced CH4 values. Besides the similar geographical and altitude position of the trajectories of both flights, the positions also agree in time, which means that the back trajectories of flight 17/18, released on 10 August, needed 4 days between their release points and crossing the release points of flight 12/13. This travel duration is exactly the time between the two flights. Therefore, in Fig. 25 the trajectories are colour-coded by time, starting from 10 August (day zero) and counting backward in time. The trajectories are uplifted in the same period and exceed the 300 hPa level around −9 days. Subsequently, the trajectories of both flights travel westwards together in the same latitudinal band. On 6 August (−4 days), when the trajectories of flight 12/13 are released, they reach Oman and the release points of flight 12/13. Thus, the trajectories for both flights coincide in time and space. Therefore, they complete the picture of the outflow observed in the simulations and confirm the in situ measurement analysis.
Beside outflow events at the western edge of the AMA, as documented here, they are also possible at the eastern edge of the AMA as described in Vogel et al. (2014). During TACTS they probed an air mass with enhanced CO and CH4 mixing ratios over northern Europe in the lower stratosphere. They used back trajectories to analyse the transport pathways of the expelled air mass. The air mass was injected at the southeastern edge of the AMA, streamed clockwise around the AMA, and flowed out of the AMA in the northeast due to eastward eddy shedding. Afterwards the air was transported eastward by the subtropical jet. After approximately 5 weeks the expelled air mass reached the flight track over northern Europe.
The AMA is a circulation system in the upper troposphere and lower stratosphere, which appears over Asia during boreal summer. The anticyclone is coupled to deep convection (Hoskins and Rodwell, 1995), which pumps up polluted air masses. The relatively strong anticyclonic circulation traps the pollutants inside the AMA and constitutes a clear chemical signature. The emissions have predominant sources in South Asia, and are growing due to population increase and economic development. It is not fully understood how the pollutants influence the chemical composition in the AMA, or in the upper troposphere on a global scale. We especially lack information about the transport pathways of the boundary layer air masses into the AMA and how they escape the anticyclone. In the present work, we address the transport pathways, including the following: the convective transport from the boundary layer into the upper troposphere; the circulation in the AMA; the transport at and across the edges of the AMA, associated with outflow events; and further transport in the upper troposphere partly in connection with the jet streams. The OMO aircraft campaign took place in July/August 2015 in the upper troposphere over the Mediterranean, the Arabian Peninsula, and the Arabian Sea to investigate the AMA and regions west and south of the AMA. On board HALO the trace gases CO and CH4 were measured using the TRISTAR IR-absorption spectrometer. Both trace gases exhibit enhancements in the mixing ratios when influenced by the monsoon. To support our analysis, FLEXPART back trajectories and EMAC model simulations were used. In this study we focused on the dynamics with respect to trace constituents and their transport pathways into and in the AMA in addition to their origin. In view of the flight tracks in the west of the AMA, the focus is on westward transport pathways. To investigate the long-range transport of relatively long-lived species, CO and CH4 are suitable.
The AMA extends vertically from the upper troposphere into the stratosphere. It could be clearly distinguished in the observed CH4 AMA profile at altitudes of 9–12.5 km, while the NH and SH background profiles show no or minor influence. In the observed CO profiles and the simulated CH4 and CO profiles the signature is not as clear as in the observed CH4 profiles. With the help of the observed CH4 background profile, we calculated a CH4 threshold of 1879.8 ppbv to distinguish between background and AMA-influenced air masses. Over the course of OMO the mixing ratios of CO grew by about 20.1 ppbv due to the influence of the monsoon. The increase in the CH4 mixing ratios was about 72.1 ppbv between background and AMA-influenced air. Furthermore, CH4 had less background variability than CO, and the CH4 emissions exhibited a seasonality with a maximum during the monsoon season. Consequently, CH4 is an ideal monsoon tracer. In a case study of flight 19 the increase in the trace gas mixing ratios of CO and CH4 can be unambiguously associated with the AMA. Back trajectories indicate transport pathways from the source regions in South Asia towards the measurement region for release points with enhanced CH4 values. Source regions include the Indo-Gangetic Plain, northeast India, Bangladesh, and the Bay of Bengal. These regions are densely populated with agricultural, urban, and industrial emissions. Due to convection, mainly over the same region, the polluted air was uplifted and then transported by the easterly jet towards the measurement region. The transport time was approximately 10 days. The mode of the anticyclone changed during OMO according to Zhang et al. (2002): it began with a double anticyclone mode, transformed to a central mode, shifted to a Tibetan mode, and then split again into two anticyclones. The position of the anticyclone is visible in the EMAC simulations, but can also be identified in the observations. Moreover, the observed CH4 mixing ratios influenced by the AMA indicate strengthening in the convection or in the emissions or a combination of both as well as an accumulation in time over the course of OMO due to a continuous increase. Additionally, the transport of an air mass with enhanced trace gas mixing ratios out of the AMA towards the west was observed.
In conclusion, the AMA has a distinct fingerprint in the upper troposphere, which was most prominent in observed CH4, with enhanced mixing ratios inside the AMA circulation owing to the strong CH4 emissions during the monsoon season. The AMA influences the region between the eastern Mediterranean and East Asia through its extent, position, and due to outflow events. We demonstrated the pathways of trace gas from the source regions into and within the AMA. The outflow of polluted air masses from the AMA, by overcoming the transport barrier during weakening circulation, represents how emissions can be further distributed in the upper troposphere and, therefore, may influence the upper troposphere at a global scale. Consequently, surface emissions alter the chemical composition of the upper troposphere, leading to changes in the atmospheric chemistry, which can influence radiative heating and cooling rates of different trace gases in the upper troposphere. Further investigations will be needed concerning the composition and trace gas chemistry and aerosols in the AMA. In the present study the focus was on long-range transport, whereas with the inclusion of shorter lived chemical constituents a further understanding of the chemical composition can be gained, as in Bourtsoukidis et al. (2017). It would also be helpful to extend the measurements further to the east, e.g. over India and the Bay of Bengal region.
The data are uploaded to the HALO database (https://halo-db.pa.op.dlr.de/, last access: 11 January 2019) (Lelieveld, 2015).
The supplement related to this article is available online at: https://doi.org/10.5194/acp-19-1915-2019-supplement.
LT wrote the original draft of the paper and evaluated the data in close cooperation with HF. AP and NO were responsible for the EMAC model simulations. JL was one of the principal investigators of the OMO mission. UP and LT performed the experimental work presented. All authors were involved in the review and editing of the paper.
The authors declare that they have no conflict of interest.
We would like to thank all of the participants of the OMO mission, the German
Aerospace Center (DLR), and EDT Offshore Ltd in Cyprus for their
cooperation during the mission. We also thank Angelika Heil for help with
the ECMWF data for the FLEXPART calculations.
The article processing charges for this open-access
publication were covered by the Max Planck Society.
Edited by: Jens-Uwe Grooß
Reviewed by: two anonymous referees
Baker, A. K., Schuck, T. J., Brenninkmeijer, C. A., Rauthe-Schöch, A., Slemr, F., Velthoven, P. F., and Lelieveld, J.: Estimating the contribution of monsoon-related biogenic production to methane emissions from South Asia using CARIBIC observations, Geophys. Res. Lett., 39, L10813, https://doi.org/10.1029/2012gl051756, 2012.
Barret, B., Sauvage, B., Bennouna, Y., and Le Flochmoen, E.: Upper-tropospheric CO and O3 budget during the Asian summer monsoon, Atmos. Chem. Phys., 16, 9129–9147, https://doi.org/10.5194/acp-16-9129-2016, 2016.
Bergamaschi, P., Houweling, S., Segers, A., Krol, M., Frankenberg, C., Scheepmaker, R., Dlugokencky, E., Wofsy, S., Kort, E., and Sweeney, C.: Atmospheric CH4 in the first decade of the 21st century: Inverse modeling analysis using SCIAMACHY satellite retrievals and NOAA surface measurements, J. Geophys. Res.-Atmos., 118, 7350–7369, 2013.
Bergman, J. W., Fierli, F., Jensen, E. J., Honomichl, S., and Pan, L. L.: Boundary layer sources for the Asian anticyclone: Regional contributions to a vertical conduit, J. Geophys. Res.-Atmos., 118, 2560–2575, 2013.
Bloom, A. A., Bowman, K. W., Lee, M., Turner, A. J., Schroeder, R., Worden, J. R., Weidner, R., McDonald, K. C., and Jacob, D. J.: A global wetland methane emissions and uncertainty dataset for atmospheric chemical transport models (WetCHARTs version 1.0), Geosci. Model Dev., 10, 2141–2156, https://doi.org/10.5194/gmd-10-2141-2017, 2017.
Bourtsoukidis, E., Helleis, F., Tomsche, L., Fischer, H., Hofmann, R., Lelieveld, J., and Williams, J.: An aircraft gas chromatograph–mass spectrometer System for Organic Fast Identification Analysis (SOFIA): design, performance and a case study of Asian monsoon pollution outflow, Atmos. Meas. Tech., 10, 5089–5105, https://doi.org/10.5194/amt-10-5089-2017, 2017.
Dethof, A., O'neill, A., Slingo, J., and Smit, H.: A mechanism for moistening the lower stratosphere involving the Asian summer monsoon, Q. J. Roy. Meteor. Soc., 125, 1079–1106, 1999.
Dlugokencky, E. J., Myers, R. C., Lang, P. M., Masarie, K. A., Crotwell, A. M., Thoning, K. W., Hall, B. D., Elkins, J. W., and Steele, L. P.: Conversion of NOAA atmospheric dry air CH4 mole fractions to a gravimetrically prepared standard scale, J. Geophys. Res.-Atmos., 110, D18306, https://doi.org/10.1029/2005jd006035, 2005.
Emanuel, K. A. and Zivkovic-Rothman, M.: Development and evaluation of a convection scheme for use in climate models, J. Atmos. Sci., 56, 1766–1782, https://doi.org/10.1175/1520-0469(1999)056<1766:Daeoac>2.0.Co;2, 1999.
Garny, H. and Randel, W.: Dynamic variability of the Asian monsoon anticyclone observed in potential vorticity and correlations with tracer distributions, J. Geophys. Res.-Atmos., 118, 13421–13433, https://doi.org/10.1002/2013jd020908, 2013.
Gill, A. E.: Some simple solutions for heat-induced tropical circulation, Q. J. Roy. Meteor. Soc., 106, 447–462, https://doi.org/10.1256/smsqj.44904, 1980.
Gottschaldt, K.-D., Schlager, H., Baumann, R., Bozem, H., Eyring, V., Hoor, P., Jöckel, P., Jurkat, T., Voigt, C., Zahn, A., and Ziereis, H.: Trace gas composition in the Asian summer monsoon anticyclone: a case study based on aircraft observations and model simulations, Atmos. Chem. Phys., 17, 6091–6111, https://doi.org/10.5194/acp-17-6091-2017, 2017.
Gouw, J., Warneke, C., Scheeren, H., Veen, C., Bolder, M., Scheele, M., Williams, J., Wong, S., Lange, L., and Fischer, H.: Overview of the trace gas measurements on board the Citation aircraft during the intensive field phase of INDOEX, J. Geophys. Res.-Atmos., 106, 28453–28467, 2001.
Hoskins, B. J. and Rodwell, M. J.: A model of the Asian summer monsoon. Part I: The global scale, J. Atmos. Sci., 52, 1329–1340, 1995.
Hsu, C. J. and Plumb, R. A.: Nonaxisymmetric thermally driven circulations and upper-tropospheric monsoon dynamics, J. Atmos. Sci., 57, 1255–1276, 2000.
Jeuken, A., Siegmund, P., Heijboer, L., Feichter, J., and Bengtsson, L.: On the potential of assimilating meteorological analyses in a global climate model for the purpose of model validation, J. Geophys. Res.-Atmos., 101, 16939–16950, 1996.
Jöckel, P., Sander, R., Kerkweg, A., Tost, H., and Lelieveld, J.: Technical Note: The Modular Earth Submodel System (MESSy) – a new approach towards Earth System Modeling, Atmos. Chem. Phys., 5, 433–444, https://doi.org/10.5194/acp-5-433-2005, 2005.
Jöckel, P., Kerkweg, A., Pozzer, A., Sander, R., Tost, H., Riede, H., Baumgaertner, A., Gromov, S., and Kern, B.: Development cycle 2 of the Modular Earth Submodel System (MESSy2), Geosci. Model Dev., 3, 717–752, https://doi.org/10.5194/gmd-3-717-2010, 2010.
Jöckel, P., Tost, H., Pozzer, A., Kunze, M., Kirner, O., Brenninkmeijer, C. A. M., Brinkop, S., Cai, D. S., Dyroff, C., Eckstein, J., Frank, F., Garny, H., Gottschaldt, K.-D., Graf, P., Grewe, V., Kerkweg, A., Kern, B., Matthes, S., Mertens, M., Meul, S., Neumaier, M., Nützel, M., Oberländer-Hayn, S., Ruhnke, R., Runde, T., Sander, R., Scharffe, D., and Zahn, A.: Earth System Chemistry integrated Modelling (ESCiMo) with the Modular Earth Submodel System (MESSy) version 2.51, Geosci. Model Dev., 9, 1153–1200, https://doi.org/10.5194/gmd-9-1153-2016, 2016.
Junge, C. E.: Residence time and variability of tropospheric trace gases, Tellus, 26, 477–488, 1974.
Khalil, M. A. K.: Atmospheric methane: an introduction, in: Atmospheric Methane, Springer, Berlin, Heidelberg, Germany, 1–8, 2000.
Krishnamurti, T. and Ardanuy, P.: The 10 to 20-day westward propagating mode and “Breaks in the Monsoons”, Tellus, 32, 15–26, 1980.
Krol, M., de Bruine, M., Killaars, L., Ouwersloot, H., Pozzer, A., Yin, Y., Chevallier, F., Bousquet, P., Patra, P., Belikov, D., Maksyutov, S., Dhomse, S., Feng, W., and Chipperfield, M. P.: Age of air as a diagnostic for transport timescales in global models, Geosci. Model Dev., 11, 3109–3130, https://doi.org/10.5194/gmd-11-3109-2018, 2018.
Lawrence, M. G. and Lelieveld, J.: Atmospheric pollutant outflow from southern Asia: a review, Atmos. Chem. Phys., 10, 11017–11096, https://doi.org/10.5194/acp-10-11017-2010, 2010.
Lelieveld, J., Berresheim, H., Borrmann, S., Crutzen, P., Dentener, F., Fischer, H., Feichter, J., Flatau, P., Heland, J., and Holzinger, R.: Global air pollution crossroads over the Mediterranean, Science, 298, 794–799, 2002.
Lelieveld, J., Harder, H., and Dorf, M.: OMO data on HALO database, available at: https://halo-db.pa.op.dlr.de/ (last access: 11 January 2019), 2015.
Lelieveld, J., Gromov, S., Pozzer, A., and Taraborrelli, D.: Global tropospheric hydroxyl distribution, budget and reactivity, Atmos. Chem. Phys., 16, 12477–12493, https://doi.org/10.5194/acp-16-12477-2016, 2016.
Lelieveld, J., Bourtsoukidis, E., Brühl, C., Fischer, H., Fuchs, H., Harder, H., Hofzumahaus, A., Holland, F., Marno, D., and Neumaier, M.: The South Asian monsoon – Pollution pump and purifier, Science, 6399, 270–273, https://doi.org/10.1126/science.aar2501, 2018.
Li, Q., Jiang, J. H., Wu, D. L., Read, W. G., Livesey, N. J., Waters, J. W., Zhang, Y., Wang, B., Filipiak, M. J., and Davis, C. P.: Convective outflow of South Asian pollution: A global CTM simulation compared with EOS MLS observations, Geophys. Res. Lett., 32, L14826, https://doi.org/10.1029/2005GL022762, 2005.
Menzel, W. P., Frey, R. A., Zhang, H., Wylie, D. P., Moeller, C. C., Holz, R. E., Maddux, B., Baum, B. A., Strabala, K. I., and Gumley, L. E.: MODIS global cloud-top pressure and amount estimation: Algorithm description and results, J. Appl. Meteorol. Clim., 47, 1175–1198, 2008.
Nützel, M., Dameris, M., and Garny, H.: Movement, drivers and bimodality of the South Asian High, Atmos. Chem. Phys., 16, 14755–14774, https://doi.org/10.5194/acp-16-14755-2016, 2016.
Ohara, T., Akimoto, H., Kurokawa, J., Horii, N., Yamaji, K., Yan, X., and Hayasaka, T.: An Asian emission inventory of anthropogenic emission sources for the period 1980–2020, Atmos. Chem. Phys., 7, 4419–4444, https://doi.org/10.5194/acp-7-4419-2007, 2007.
Ojha, N., Pozzer, A., Rauthe-Schöch, A., Baker, A. K., Yoon, J., Brenninkmeijer, C. A. M., and Lelieveld, J.: Ozone and carbon monoxide over India during the summer monsoon: regional emissions and transport, Atmos. Chem. Phys., 16, 3013–3032, https://doi.org/10.5194/acp-16-3013-2016, 2016.
Ouwersloot, H. G., Pozzer, A., Steil, B., Tost, H., and Lelieveld, J.: Revision of the convective transport module CVTRANS 2.4 in the EMAC atmospheric chemistry–climate model, Geosci. Model Dev., 8, 2435–2445, https://doi.org/10.5194/gmd-8-2435-2015, 2015.
Pan, L. L., Honomichl, S. B., Kinnison, D. E., Abalos, M., Randel, W. J., Bergman, J. W., and Bian, J.: Transport of chemical tracers from the boundary layer to stratosphere associated with the dynamics of the Asian summer monsoon, J. Geophys. Res.-Atmos., 121, 14159–14174, https://doi.org/10.1002/2016jd025616, 2016.
Pandis, S. N. and Seinfeld, J. H.: Atmospheric chemistry and physics: From air pollution to climate change, Wiley, Hoboken, New Jersey, USA, 41–42, 2006.
Park, M., Randel, W. J., Kinnison, D. E., Garcia, R. R., and Choi, W.: Seasonal variation of methane, water vapor, and nitrogen oxides near the tropopause: Satellite observations and model simulations, J. Geophys. Res.-Atmos., 109, D03302, https://doi.org/10.1029/2003jd003706, 2004.
Park, M., Randel, W. J., Gettelman, A., Massie, S. T., and Jiang, J. H.: Transport above the Asian summer monsoon anticyclone inferred from Aura Microwave Limb Sounder tracers, J. Geophys. Res.-Atmos., 112, D16309, https://doi.org/10.1029/2006jd008294, 2007.
Park, M., Randel, W. J., Emmons, L. K., Bernath, P. F., Walker, K. A., and Boone, C. D.: Chemical isolation in the Asian monsoon anticyclone observed in Atmospheric Chemistry Experiment (ACE-FTS) data, Atmos. Chem. Phys., 8, 757–764, https://doi.org/10.5194/acp-8-757-2008, 2008.
Park, M., Randel, W. J., Emmons, L. K., and Livesey, N. J.: Transport pathways of carbon monoxide in the Asian summer monsoon diagnosed from Model of Ozone and Related Tracers (MOZART), J. Geophys. Res.-Atmos., 114, D08303, https://doi.org/10.1029/2008jd010621, 2009.
Platnick, S.: MODIS Atmosphere L3 Daily Product, NASA MODIS Adaptive Processing System, Goddard Space Flight Center, USA, https://doi.org/10.5067/MODIS/MYD08_D3.006, 2015.
Ploeger, F., Gottschling, C., Griessbach, S., Grooß, J.-U., Guenther, G., Konopka, P., Müller, R., Riese, M., Stroh, F., Tao, M., Ungermann, J., Vogel, B., and von Hobe, M.: A potential vorticity-based determination of the transport barrier in the Asian summer monsoon anticyclone, Atmos. Chem. Phys., 15, 13145–13159, https://doi.org/10.5194/acp-15-13145-2015, 2015.
Popovic, J. M. and Plumb, R. A.: Eddy shedding from the upper-tropospheric Asian monsoon anticyclone, J. Atmos. Sci., 58, 93–104, 2001.
Randel, W. J. and Park, M.: Deep convective influence on the Asian summer monsoon anticyclone and associated tracer variability observed with Atmospheric Infrared Sounder (AIRS), J. Geophys. Res.-Atmos., 111, D12314, https://doi.org/10.1029/2005jd006490, 2006.
Rauthe-Schöch, A., Baker, A. K., Schuck, T. J., Brenninkmeijer, C. A. M., Zahn, A., Hermann, M., Stratmann, G., Ziereis, H., van Velthoven, P. F. J., and Lelieveld, J.: Trapping, chemistry, and export of trace gases in the South Asian summer monsoon observed during CARIBIC flights in 2008, Atmos. Chem. Phys., 16, 3609–3629, https://doi.org/10.5194/acp-16-3609-2016, 2016.
Roeckner, E., Brokopf, R., Esch, M., Giorgetta, M., Hagemann, S., Kornblueh, L., Manzini, E., Schlese, U., and Schulzweida, U.: Sensitivity of simulated climate to horizontal and vertical resolution in the ECHAM5 atmosphere model, J. Climate, 19, 3771–3791, 2006.
Saito, R., Patra, P. K., Sweeney, C., Machida, T., Krol, M., Houweling, S., Bousquet, P., Agusti-Panareda, A., Belikov, D., and Bergmann, D.: TransCom model simulations of methane: Comparison of vertical profiles with aircraft measurements, J. Geophys. Res.-Atmos., 118, 3891–3904, 2013.
Scheeren, H. A., Lelieveld, J., Roelofs, G. J., Williams, J., Fischer, H., de Reus, M., de Gouw, J. A., Warneke, C., Holzinger, R., Schlager, H., Klüpfel, T., Bolder, M., van der Veen, C., and Lawrence, M.: The impact of monsoon outflow from India and Southeast Asia in the upper troposphere over the eastern Mediterranean, Atmos. Chem. Phys., 3, 1589–1608, https://doi.org/10.5194/acp-3-1589-2003, 2003.
Schiller, C. L., Bozem, H., Gurk, C., Parchatka, U., Konigstedt, R., Harris, G. W., Lelieveld, J., and Fischer, H.: Applications of quantum cascade lasers for sensitive trace gas measurements of CO, CH4, N2O and HCHO, Appl. Phys. B-Lasers O., 92, 419–430, https://doi.org/10.1007/s00340-008-3125-0, 2008.
Schuck, T., Ishijima, K., Patra, P., Baker, A., Machida, T., Matsueda, H., Sawa, Y., Umezawa, T., Brenninkmeijer, C., and Lelieveld, J.: Distribution of methane in the tropical upper troposphere measured by CARIBIC and CONTRAIL aircraft, J. Geophys. Res.-Atmos., 117, D19304, https://doi.org/10.1029/2012jd018199, 2012.
Stohl, A., Hittenberger, M., and Wotawa, G.: Validation of the Lagrangian particle dispersion model FLEXPART against large-scale tracer experiment data, Atmos. Environ., 32, 4245–4264, https://doi.org/10.1016/S1352-2310(98)00184-8, 1998.
Stohl, A., Eckhardt, S., Forster, C., James, P., Spichtinger, N., and Seibert, P.: A replacement for simple back trajectory calculations in the interpretation of atmospheric trace substance measurements, Atmos. Environ., 36, 4635–4648, https://doi.org/10.1016/S1352-2310(02)00416-8, 2002.
Stohl, A., Forster, C., Frank, A., Seibert, P., and Wotawa, G.: Technical note: The Lagrangian particle dispersion model FLEXPART version 6.2, Atmos. Chem. Phys., 5, 2461–2474, https://doi.org/10.5194/acp-5-2461-2005, 2005.
Stohl, A., Sodemann, H., Eckhardt, S., Frank, A., Seibert, P., and Wotawa, G.: The Lagrangian particle dispersion model FLEXPART version 8.2., Norwegian Institute of Air Research, Kjeller, Norway, 2010.
Tadic, I., Parchatka, U., Konigstedt, R., and Fischer, H.: In-flight stability of quantum cascade laser-based infrared absorption spectroscopy measurements of atmospheric carbon monoxide, Appl. Phys. B-Lasers O., 123, 146, https://doi.org/10.1007/s00340-017-6721-z, 2017.
Thomson, D.: Criteria for the selection of stochastic models of particle trajectories in turbulent flows, J. Fluid Mech., 180, 529–556, 1987.
Tost, H., Jöckel, P., and Lelieveld, J.: Influence of different convection parameterisations in a GCM, Atmos. Chem. Phys., 6, 5475–5493, https://doi.org/10.5194/acp-6-5475-2006, 2006.
van der Werf, G. R., Randerson, J. T., Giglio, L., Collatz, G. J., Mu, M., Kasibhatla, P. S., Morton, D. C., DeFries, R. S., Jin, Y., and van Leeuwen, T. T.: Global fire emissions and the contribution of deforestation, savanna, forest, agricultural, and peat fires (1997–2009), Atmos. Chem. Phys., 10, 11707–11735, https://doi.org/10.5194/acp-10-11707-2010, 2010.
Van Vuuren, D. P., Edmonds, J., Kainuma, M., Riahi, K., Thomson, A., Hibbard, K., Hurtt, G. C., Kram, T., Krey, V., and Lamarque, J.-F.: The representative concentration pathways: an overview, Clim. Change, 109, 1–2, https://doi.org/10.1007/s10584-011-0148-z, 2011.
Vogel, B., Günther, G., Müller, R., Grooß, J.-U., Hoor, P., Krämer, M., Müller, S., Zahn, A., and Riese, M.: Fast transport from Southeast Asia boundary layer sources to northern Europe: rapid uplift in typhoons and eastward eddy shedding of the Asian monsoon anticyclone, Atmos. Chem. Phys., 14, 12745–12762, https://doi.org/10.5194/acp-14-12745-2014, 2014.
Vogelezang, D. H. P. and Holtslag, A. A. M.: Evaluation and model impacts of alternative boundary-layer height formulations, Bound.-Lay. Meteorol., 81, 245–269, https://doi.org/10.1007/Bf02430331, 1996.
Waliser, D. E. and Gautier, C.: A satellite-derived climatology of the ITCZ, J. Climate, 6, 2162–2174, 1993.
White, J. U.: Very Long Optical Paths in Air, J. Opt. Soc. Am., 66, 411–416, https://doi.org/10.1364/Josa.66.000411, 1976.
Xiao, Y., Jacob, D. J., and Turquety, S.: Atmospheric acetylene and its relationship with CO as an indicator of air mass age, J. Geophys. Res.-Atmos., 112, D12305, https://doi.org/10.1029/2006jd008268, 2007.
Xiong, X., Houweling, S., Wei, J., Maddy, E., Sun, F., and Barnet, C.: Methane plume over south Asia during the monsoon season: satellite observation and model simulation, Atmos. Chem. Phys., 9, 783–794, https://doi.org/10.5194/acp-9-783-2009, 2009.
Zhang, Q., Wu, G., and Qian, Y.: The bimodality of the 100 hPa South Asia High and its relationship to the climate anomaly over East Asia in summer, J. Meteorol. Soc. Jpn., 80, 733–744, 2002.
Zimmermann, P. H., Brenninkmeijer, C. A. M., Pozzer, A., Jöckel, P., Zahn, A., Houweling, S., and Lelieveld, J.: Model simulations of atmospheric methane and their evaluation using AGAGE/NOAA surface- and IAGOS-CARIBIC aircraft observations, 1997–2014, Atmos. Chem. Phys. Discuss., https://doi.org/10.5194/acp-2017-1212, in review, 2018.