the Creative Commons Attribution 4.0 License.
the Creative Commons Attribution 4.0 License.
 | 08 Feb 2019
Biomass-burning smoke heights over the Amazon observed from space
Laura Gonzalez-Alonso
Maria Val Martin
Ralph A. Kahn
We characterise the vertical distribution of biomass-burning emissions across the Amazon during the biomass-burning season (July–November) with an extensive climatology of smoke plumes derived from MISR and MODIS (2005–2012) and CALIOP (2006–2012) observations. Smoke plume heights exhibit substantial variability, spanning a few hundred metres up to 6 km above the terrain. However, the majority of the smoke is located at altitudes below 2.5 km. About 60 % of smoke plumes are observed in drought years, 40 %–50 % at the peak month of the burning season (September) and 94 % over tropical forest and savanna regions, with respect to the total number of smoke plume observations. At the time of the MISR observations (10:00–11:00 LT), the highest plumes are detected over grassland fires (with an averaged maximum plume height of ∼1100 m) and the lowest plumes occur over tropical forest fires (∼800 m). A similar pattern is found later in the day (14:00–15:00 LT) with CALIOP, although at higher altitudes (2300 m grassland vs. 2000 m tropical forest), as CALIOP typically detects smoke at higher altitudes due to its later overpass time, associated with a deeper planetary boundary layer, possibly more energetic fires, and greater sensitivity to thin aerosol layers. On average, 3 %–20 % of the fires inject smoke into the free troposphere; this percentage tends to increase toward the end of the burning season (November: 15 %–40 %). We find a well-defined seasonal cycle between MISR plume heights, MODIS fire radiative power and atmospheric stability across the main biomes of the Amazon, with higher smoke plumes, more intense fires and reduced atmospheric stability conditions toward the end of the burning season. Lower smoke plume heights are detected during drought (800 m) compared to non-drought (1100 m) conditions, in particular over tropical forest and savanna fires. Drought conditions favour understory fires over tropical forest, which tend to produce smouldering combustion and low smoke injection heights. Droughts also seem to favour deeper boundary layers and the percentage of smoke plumes that reach the free troposphere is lower during these dry conditions. Consistent with previous studies, the MISR mid-visible aerosol optical depth demonstrates that smoke makes a significant contribution to the total aerosol loading over the Amazon, which in combination with lower injection heights in drought periods has important implications for air quality. This work highlights the importance of biome type, fire properties and atmospheric and drought conditions for plume dynamics and smoke loading. In addition, our study demonstrates the value of combining observations of MISR and CALIOP constraints on the vertical distribution of smoke from biomass burning over the Amazon.
- Article
(4472 KB) - Full-text XML
-
Supplement
(10718 KB) - BibTeX
- EndNote


Fires burn across the Amazon region every year, releasing large amounts of trace gases and aerosols into the atmosphere (e.g. Andreae and Merlet, 2001). The majority of these fires are of anthropogenic origin: for deforestation, preparation of agriculture fields, conversion of cropland to pasture or road and city expansion (Cochrane, 2003). Between 1976 and 2010, deforestation fires destroyed more than 15 % of the original Amazonian forest (Aragao et al., 2014). Most of these fires burn in the so-called arc of deforestation, along the eastern and southern borders of the Amazon forest, during the dry season (typically from July to November) (Malhi et al., 2008). However, significant variability exists, caused by changes in meteorology, drought and land-management policies (e.g. Nepstad et al., 2006; Van der Werf et al., 2010; Alencar et al., 2011). Amazon fires can contribute up to about 15 % of the total global biomass-burning emissions (Van der Werf et al., 2010). These emissions have important implications for air quality, atmospheric composition, climate and ecosystem health (e.g. Ramanathan et al., 2001; Johnston et al., 2012; Pacifico et al., 2015). For example, air pollution from deforestation fires is estimated to cause on average about 3000 premature deaths per year across South America (Reddington et al., 2015) and may decrease the net primary productivity in the Amazon forest as a result of increases in surface ozone (Pacifico et al., 2015).
Fires are also an important source of buoyancy locally, which in combination with other atmospheric properties determines the vertical distribution of fire emissions in the atmosphere near the fire source (i.e. injection height). The altitude at which smoke is injected is critical, as it determines the lifetime of the pollutant, its downwind transport dispersion pathway and the magnitude of its environmental impact (e.g. Jian and Fu, 2014; Archer-Nicholls et al., 2015; Paugam et al., 2016; Zhu et al., 2018). Space-borne observations have been used to study smoke injection heights across the world. Using Multi-angle Imaging SpectroRadiometer (MISR) stereo-height retrievals, smoke plume heights have been assessed across North America (Kahn et al., 2008; Val Martin et al., 2010), Indonesia (Tosca et al., 2011), Australia (Mims et al., 2010), south-eastern Asia (Jian and Fu, 2014) and Europe (Sofiev et al., 2013). For example, Val Martin et al. (2010), using a 5-year climatology of smoke fire plumes and smoke clouds observed by MISR across North America, showed that wildfire smoke can reach altitudes from a few hundred metres above the ground to about 5 km, and that 5 %–30 % of the smoke plumes are injected into the free troposphere (FT), depending on the biome and year. Related work also demonstrated the important effect that fire radiative power, i.e. a proxy of fire intensity, and atmospheric conditions have on the initial rise of fire emissions (Freitas et al., 2007; Kahn et al., 2007; Val Martin et al., 2012). Tosca et al. (2011) reported that less than 4 % of smoke plumes reach the free troposphere, based on a MISR 8-year climatology from tropical forest and peatland fires over Borneo and Sumatra and found that the greatest plume heights were recorded during an El Niño year over Borneo.
Smoke plume heights have also been determined using space-borne lidar observations from CALIOP (Labonne et al., 2007; Huang et al., 2015), aerosol index from the TOMS and OMI instruments (Guan et al., 2010), and CO observations from TES and MSL (Gonzi and Palmer, 2010). Huang et al. (2015) used a multi-year record of CALIOP vertical aerosol distributions to study smoke and dust layer heights over six high-aerosol-loading regions across the globe. Specifically over the Amazon, they found that on a broad scale, smoke layers are typically located above boundary layer clouds, at altitudes of 1.6–2.5 km. Consistent with the smoke altitudes detected by CALIOP, an analysis of injection heights using CO observations from TES and MLS estimated that about 17 % of fire plumes over South America reached the free troposphere in 2006 (Gonzi and Palmer, 2010).
Numerous studies have sought to understand the impact of biomass burning in the Amazon, on local to hemispheric scales. In particular, during the past decade, several aircraft campaigns have been designed to study the effect of biomass burning on greenhouse gases, aerosols loading, clouds, regional weather and/or climate over the Amazon (e.g. BARCA (Andreae et al., 2012), SAMBBA (Allan et al., 2014) and GoAmazon (Martin et al., 2016)). For example, modelling studies during SAMBBA showed the importance of the vertical representation of aerosols from biomass burning over the region (Archer-Nicholls et al., 2015), as biomass burning can modify local weather (Kolusu et al., 2015) and regional climate (Thornhill et al., 2018). Based on lidar observations taken in six research flights during SAMBBA (16–29 September 2014), Marenco et al. (2016) reported the presence of two distinct smoke aerosol layers, a fresh smoke layer extending from the surface to an altitude of 1–1.5 km, and an elevated and persistent layer of aged smoke at 4–6 km. During the 2008 dry biomass season, continuous raman lidar measurements of optical properties taken in Manaus (2.5∘ S, 60∘ W) also detected biomass-burning layers at 3–5 km heights, although most of the smoke was confined below 2 km (Baars et al., 2012). Whilst the results from these aircraft and in situ lidar observations are significant, there are no analyses yet that seek to quantify the long-term average vertical distribution of smoke from fires across the Amazon and to identify the key factors that control plume rise over this region.
Here we present an 8-year climatology of smoke plume heights over the Amazon, derived from observations by the MISR and CALIOP instruments on board the NASA Terra and CALIPSO satellites, respectively. These data are analysed in combination with measurements of fire radiative power (FRP) from NASA Moderate Resolution Imaging Spectroradiometer (MODIS) instruments, assimilated meteorological observations from MERRA-2 and drought condition indicators from the MODIS drought severity index (DSI). The objectives of this work are to characterise the magnitude and variability of smoke heights from biomass burning across the Amazon and to assess the influence of biome type, fire intensity, local atmospheric conditions and regional drought on smoke vertical distribution as well as aerosol loading.
We use a combination of remote-sensing data from multiple sources to build a comprehensive climatology of smoke plume heights and characterise the vertical distribution of smoke across the Amazon. We provide below a summary of main datasets and tools used in the analysis and compile their main features in Table S1 of the Supplement.
2.1 MINX overview
The MISR INteractive eXplorer (MINX) software is an application written in Interactive Data Language (IDL) that is used to analyse the physical properties of smoke plumes and to study plume dynamics (Nelson et al., 2013). MINX can use MODIS thermal anomalies to locate active fires, and MINX then computes the smoke plume or cloud heights from MISR stereo imagery. MINX also collects particle property results from the MISR standard aerosol retrieval algorithm (Martonchik et al., 2009). MODIS and MISR are both aboard the NASA Terra satellite, which crosses the equator in the descending node at around 10:30 local time. These instruments allow temporally and spatially coincident detection of active fires and their associated smoke plumes (Kahn et al., 2008).
MODIS has a cross-track swath of 2330 km that provides global coverage every 1 to 2 days. The instrument has 36 spectral channels with wavelengths between 0.4 and 14.2 µm, and detects thermal anomalies at 1 km spatial resolution (at nadir) under cloud-free conditions. MODIS reports fire radiate power based on a detection algorithm that uses brightness temperature differences in the 4 and the 11 µm channels (Giglio et al., 2003); this FRP parameter is used as an indicator of fire location and qualitative intensity. We use MODIS Collection 6 (Table S1 in the Supplement). We note that MINX provides FRP values in MW, although they are actually in MW per 1 km pixel, which corresponds to W m−2, except toward the edges of the swath.
MISR has nine push-broom cameras placed at viewing angles spanning −70.5 to 70.5 relative to nadir in the satellite along-track direction (Diner et al., 1998). The cameras each provide imagery in four spectral bands (446, 558, 672 and 867 nm), which makes it possible to distinguish aerosol types qualitatively (Kahn and Gaitley, 2015) and surface structure from the change in reflectance with view angle. This passive stereoscopic imagery method produces cloud and aerosol plume heights, along with cloud-tracked winds aloft. MISR has a swath of 380 km common to all cameras, so global coverage is obtained every 9 days at the Equator and every 2 days at the poles (Diner et al., 1998). The MISR standard stereo-height product provides vertical resolution of 275–500 m and a horizontal resolution of 1.1 km (Moroney et al., 2002; Muller et al., 2002).
MINX has a graphical user interface that displays the nine MISR multi-angle images. They can be visualised one by one or as an animated loop, providing a 3-D view of the plume that can help to assess its structure and dynamical behaviour. In addition, MODIS thermal anomalies can be superimposed, which helps identify the locations of smoke sources from active fires. A user needs to digitise the boundaries of the plume, starting at the source point, and to indicate the direction of smoke transport. The MINX stereoscopic algorithm also calculates wind speed from the displacement of plume contrast elements, which is used subsequently to compute wind-corrected heights, accounting for displacement due to the proper motion of the plume elements between camera views. As with the MISR standard stereo-height product, MINX automatically retrieves smoke plume heights and wind speed at a horizontal resolution of 1.1 km and vertical resolution of 250–500 m, but with greater accuracy for the plume itself due to the user inputs (Nelson et al., 2013). MINX plume heights are reported above the geoid, which correspond to the level of maximum spatial contrast in the multi-angle imagery, typically near the plume top, but actually offer a distribution of heights in most cases, because aerosol plumes are rarely uniform (Flower and Kahn, 2017). Additionally, MINX provides local terrain height from a digital elevation map (DEM) product. Here we report heights above the terrain by taking account of the DEM values. Further information from the MISR standard aerosol product about aerosol amount and type is collected and reported, along with FRP from MODIS (Nelson et al., 2013). MINX has been successfully used to investigate fire smoke plume heights over many regions across the world (e.g. Kahn et al., 2008; Val Martin et al., 2010; Tosca et al., 2011; Jian and Fu, 2014).
There are several limitations to the MISR-MINX approach that must be considered when studying smoke plume heights. For example, MISR obtains global coverage only about once per week, and the Terra overpass time in the late morning does not coincide with the typical, late-afternoon peak of fire intensity. MODIS does not observe FRP under cloud and dense smoke, and the MINX operator must decide whether to include any pyrocumulus clouds in the plume-height retrieval. These are the key limitations: they and others are discussed further in the literature (e.g. Kahn et al., 2007; Val Martin et al., 2010; Nelson et al., 2013). In addition, three MINX versions were used to generate the data in this study, which might introduce an additional bias. MINXv2 and v3 included only MISR red-band plume height retrievals, whereas MINXv4 considers both red- and blue-band images. Over land, digitalisation with the blue band usually provides higher-quality retrievals, especially for optically thin plumes over bright surfaces. In contrast, the red band provides higher vertical resolution over dark surfaces and sometimes performs better for optically dense smoke layers (Nelson et al., 2013). We take these limitations into account throughout our analysis.
2.2 MINX smoke plume database
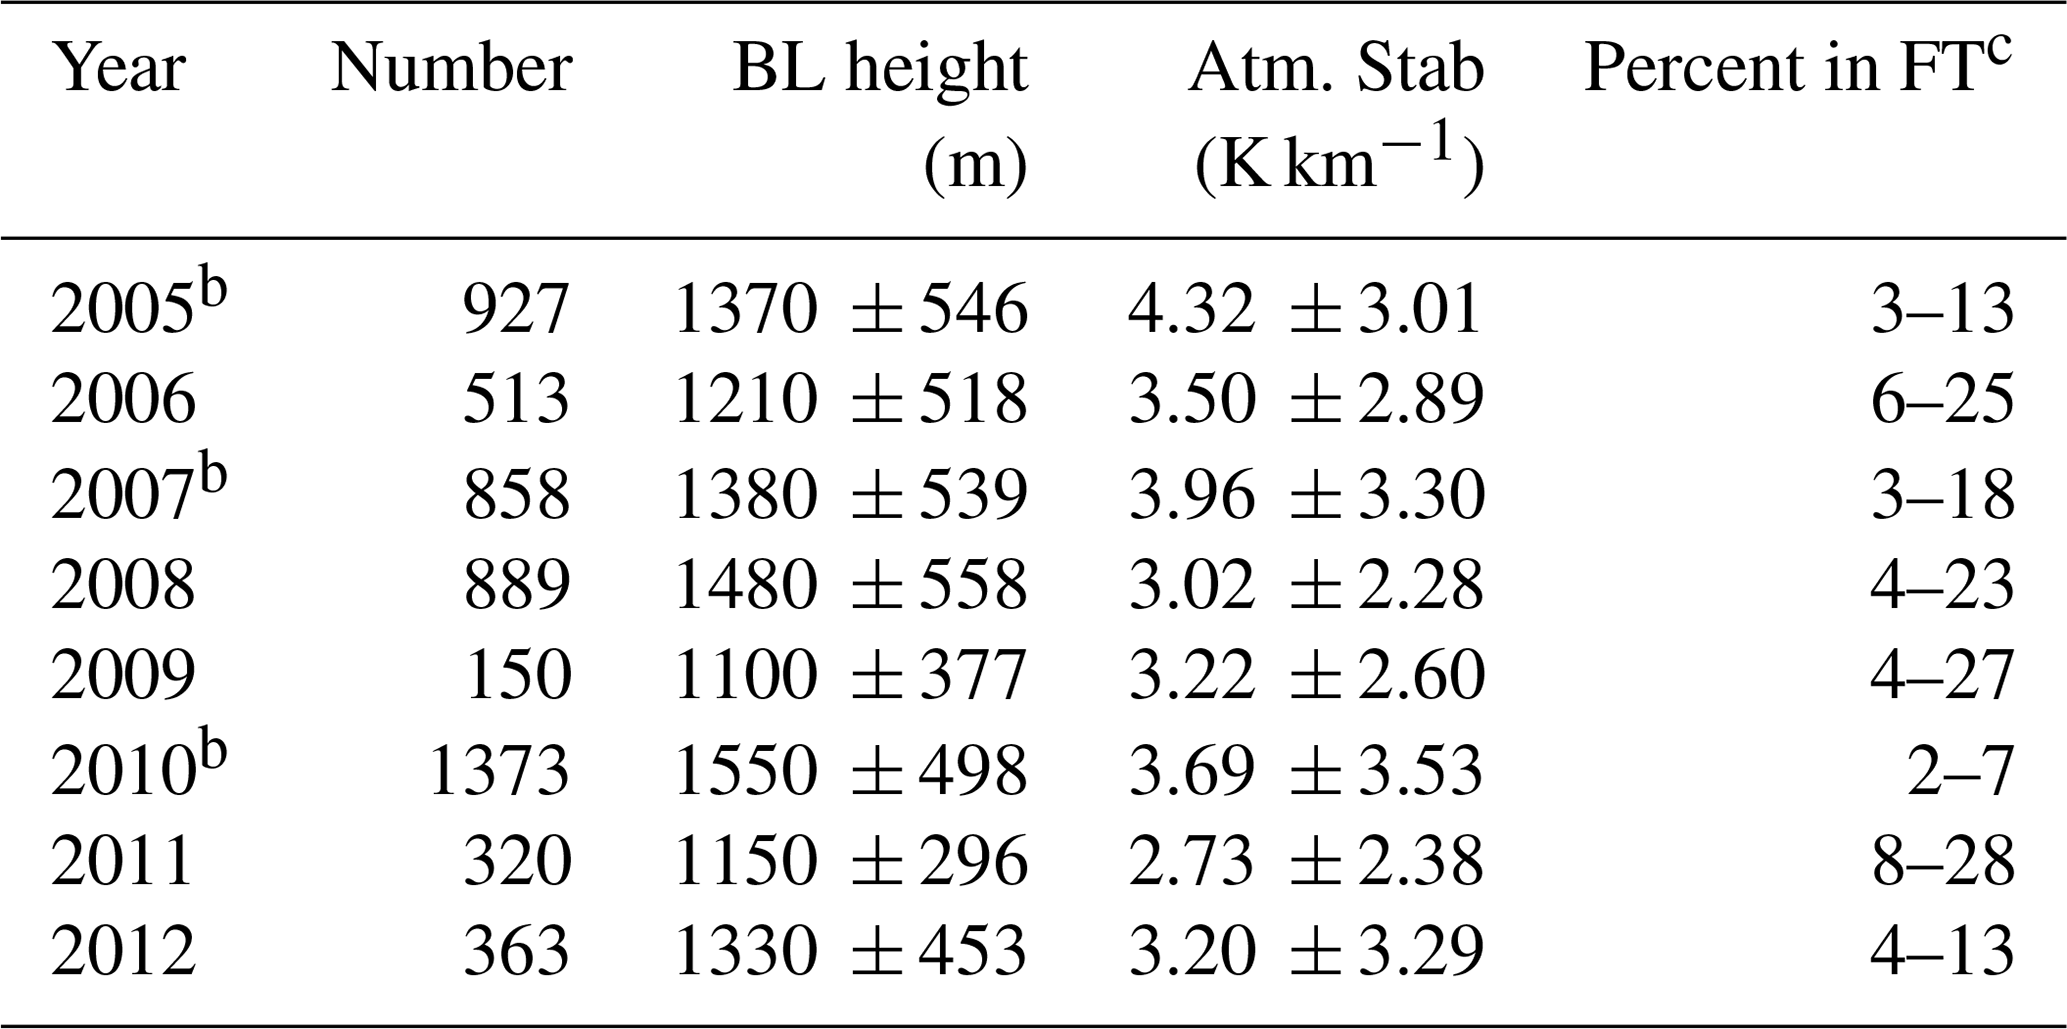
We limited our study to the burning season (July–November) for the period of 2005–2012. Using MINX, we developed a climatology of plume heights across the Amazon, consisting of 10 858 smoke plumes in the region (25∘ S–5∘ N latitude and 80–40∘ W longitude). Over this domain, the NASA Terra satellite overpass is every 4–8 days at 10:00–11:00 local time. Table 1 summarises the number of smoke plumes in each year and the digitising source. The climatology includes a combination of smoke plumes extracted from different projects and created with different versions of MINX (v2–4): plumes for August–September in the years 2006 and 2007 are from the MISR Plume Height Project (Nelson et al., 2013); plumes in the year 2008 are from the global digitalisation effort made for the AeroCom project (MPHP2 and Val Martin et al., 2018); and the 5 remaining years and additional months are digitised as a part of the current project.
Table 1Summary of MISR smoke plumes over the Amazon domain (2005–2012).
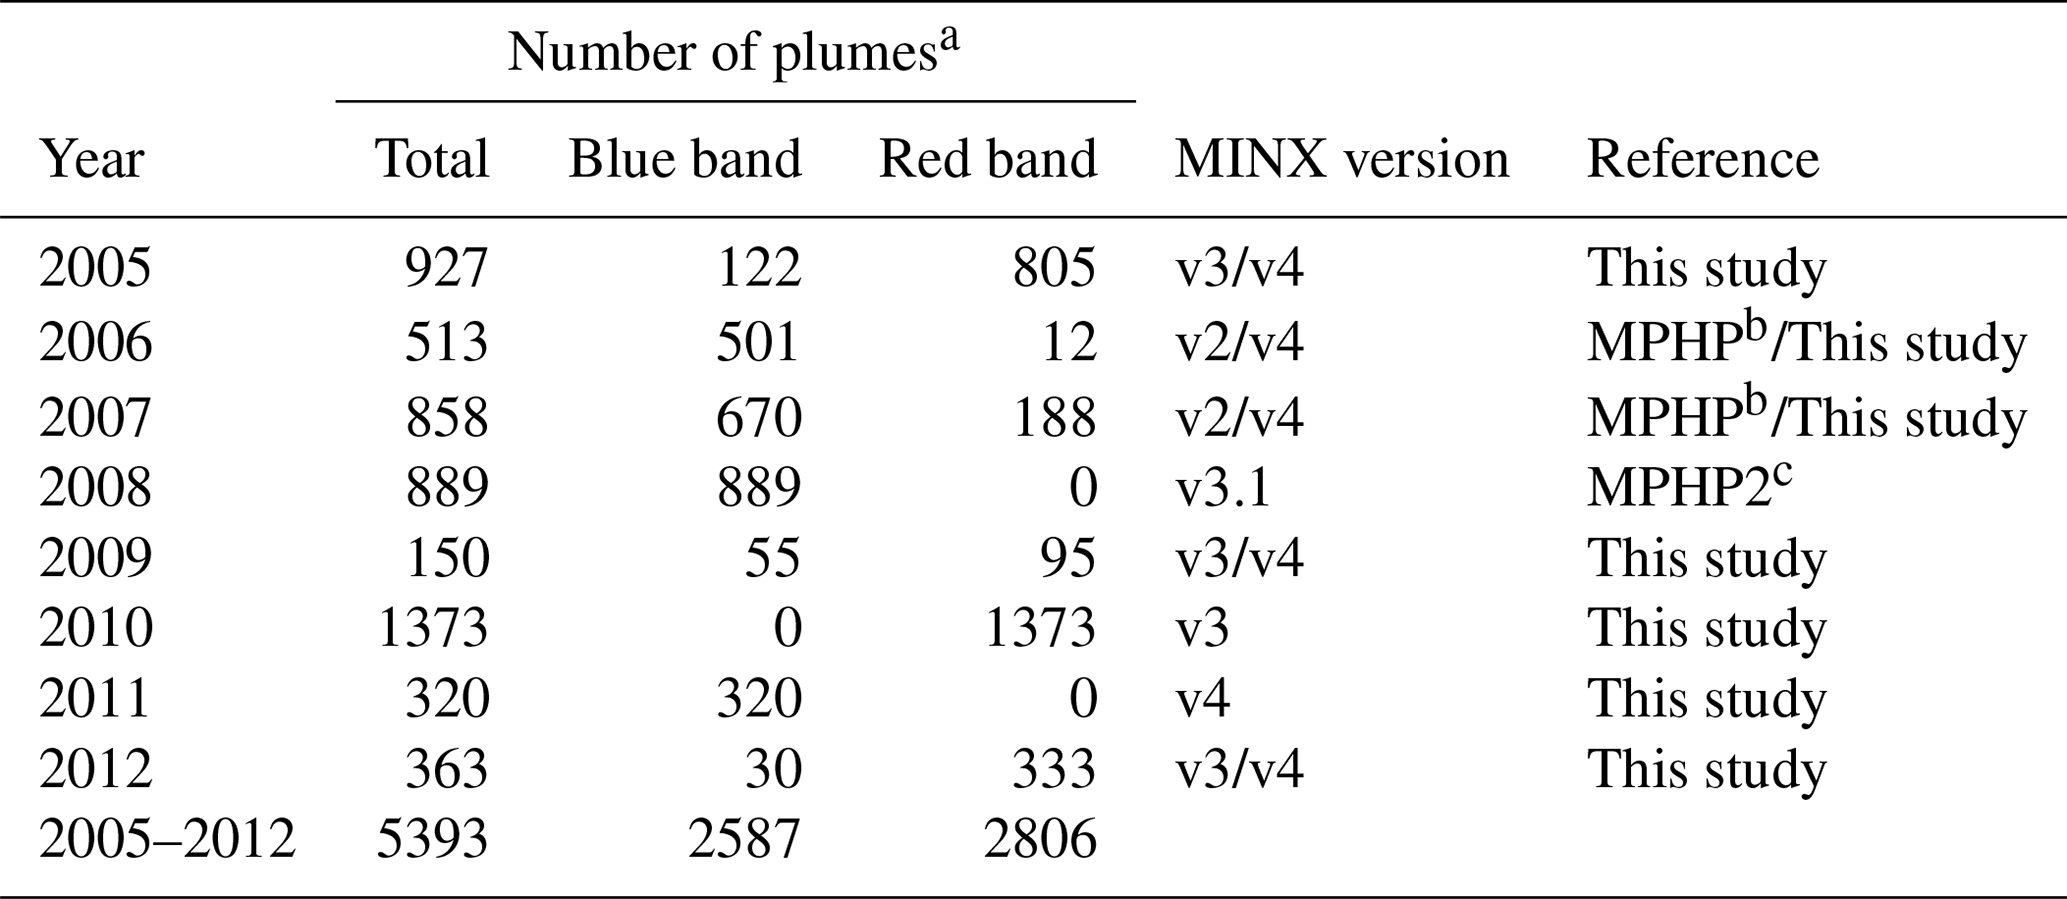
a Total number of plumes and number of plumes digitised with blue- or red-band retrievals. b MISR Plume Height Project; data from https://misr.jpl.nasa.gov/getData/accessData/MISRPlumeHeight/ (last access: 4 February 2019). c MISR Plume Height Project2; data from https://misr.jpl.nasa.gov/getData/accessData/MisrMinxPlumes2/ (last access: 4 February 2019).
MINX computes several plume heights that describe the altitude that smoke reaches in the atmosphere. In this work, we use the best-estimate maximum and median smoke plume heights, which represent the distribution of stereo heights obtained at the level of maximum spatial contrast over the plume area (Nelson et al., 2013). In addition, as in previous studies, we remove smoke plumes with poor-quality retrieval flags. This screening leaves a total of 5393 plumes, about 56 % of the original database, with 77 % and 23 % plumes digitised in the red and blue bands, respectively. Our final dataset includes plumes digitised in years with intense fire activity associated with severe drought conditions (e.g. 2005, 2007 and 2010) (Chen et al., 2011), in years with low fire intensity and considerable precipitation (2009 and 2011) (Marengo et al., 2013) and in 1 year when land-management policy measures limited deforestation (2006) (Nepstad et al., 2006). Thus, our climatology is intended to capture smoke plume variability under diverse conditions.
As mentioned in Sect. 2.1, the MISR colour band image used by the MINX algorithm to compute smoke plume heights influences the quality of the plume height and wind speed retrievals. A large majority of the fires detected across our domain have optically thin smoke plumes. Thus, blue-band plume retrievals are more successful, with about 60 % of the smoke plumes receiving good- or fair-quality flags compared to 36 % for the red-band retrievals. In our dataset overall, most of the plumes were digitised from red-band images, as it was the default option for MINX v2–3. However, whenever both band retrievals are available for a plume, the blue band is preferred in this study. The choice of the band colour for the retrievals does not significantly affect the results presented here, as the difference in heights for smoke plumes digitised with both bands is negligible (∼60 m), lower than the ±250 m MINX uncertainty.
2.3 Land cover unit data
We use the MODIS Level 3 land cover product MCD12Q1 (Friedl et al., 2010) to determine the type of land cover associated with each of our fire smoke plumes. This product contains 17 International Geosphere-Biosphere Programme (IGBP) land cover classes, at a horizontal resolution of 500 m and annual temporal resolution, from 2001 to the present day. It is available from the Land Processes Distributed Active Archive Center (https://e4ftl01.cr.usgs.gov/MOTA/MCD12Q1.051/, last access: 4 February 2019). We merge land cover classes having similar characteristics into four land types representing the main biomes across the Amazon: tropical forest, savanna, grassland and crops.
2.4 Atmospheric conditions
To assess the role of atmospheric conditions on the final elevation of smoke plumes across the Amazon, we analyse data from the second Modern Era Retrospective-analysis for Research and Applications (MERRA-2) reanalysis model simulation (Bosilovich et al., 2015). We focus on the height of the planetary boundary layer (PBL) and the atmospheric stability at the location of our fires. As in previous studies (e.g. Kahn et al., 2007; Val Martin et al., 2010), we define the atmospheric stability as the vertical gradient of potential temperature. We use data from MERRA-2 at a horizontal resolution of 0.625∘ longitude by 0.5∘ latitude, with 42 vertical pressure levels between the surface and 0.01 hPa. MERRA-2 provides hourly PBL height above ground level and potential temperature profiles every 6 h (0:00, 06:00, 12:00 and 18:00 UT), so we linearly interpolate these data to the time and location of each fire plume origin.
2.5 Drought conditions
To determine the presence and magnitude of droughts over the Amazon during our study period, we use the MODIS drought severity index (DSI). The DSI is a global drought index derived by combining the MODIS16 Evapotranspiration (e.g. Mu et al., 2007) and the MODIS13 vegetation index (NDVI) data products (Huete et al., 2002). DSI provides drought conditions on a global scale for all vegetated areas at 8-day and annual temporal resolutions and 0.5 or 0.05∘ horizontal spatial resolution for 2000–2011 (Mu et al., 2013). In this work, we use the 8-day temporal resolution DSI and interpolate the data to the time and location of our fire smoke plumes. Following Mu et al. (2013), we further define drought conditions as “extreme severe” (DSI ), “mild moderate” ( DSI ), “normal” ( DSI >0.29) and “wetter than normal” (DSI ≥0.29).
2.6 CALIOP observations
We also use extinction profiles derived from the CALIOP instrument to provide an independent assessment of the vertical smoke distribution across the Amazon. CALIOP is a space-borne two-wavelength polarisation lidar (532 and 1064 nm) that flies aboard the CALIPSO satellite (Winker et al., 2013). CALIPSO was launched in 2006 into a sun-synchronous polar orbit of 705 km altitude as a part of the A-Train constellation, with an orbit repeat cycle of 16 days. CALIOP collects backscatter and depolarisation data that constrain the vertical structure and some properties of aerosols and clouds around the globe (Vaughan et al., 2004; Liu et al., 2009). In addition, CALIOP provides a characterisation of the aerosol type (i.e. dust, polluted dust, marine, clean continental, pollution and biomass burning) based on an externally determined surface type along with measured depolarisation ratios, integrated backscatter altitude and colour ratio (Omar et al., 2009). This aerosol-type classification can be used to indicate the likely sources that contribute to aerosol mass loading at specific locations and times at which the instrument has coverage.
We use CALIOP Level 2 version 4 day and night data (CAL_LID_L2_05kmAPro-Standard-V4-10) over the Amazon for the July to November burning season, from 2006 to 2012. In this work, we filter the data following Ford and Heald (2012). This filtering approach uses cloud-aerosol distinction scores, extinction uncertainty values, atmospheric volume descriptors, extinction quality control flags and total column optical depths, and assumes that extinction observations classified as “clear air” have zero aerosol extinction (rather than the fill value). CALIOP daytime retrievals can be biased low due to the noise from scattered solar radiation (Winker et al., 2009; Rogers et al., 2011). However, we analyse both day (i.e. early afternoon, ∼ 13:30 LT equator crossing time) and night profiles to identify any differences in smoke heights, as well as to allow a better comparison with the MISR smoke plumes, which are retrieved during late morning.
The CALIOP swath is ∼100 m wide, so sampling is effectively a curtain. To obtain a climatology of CALIOP smoke plumes as in MISR, we developed an approach to identify individual smoke plumes in the CALIOP data. We first grid all CALIOP aerosol extinction profiles classified as smoke (day and night) at a horizontal resolution of over the Amazon region, and a vertical resolution of 250 m, from the surface to 12 km. We chose this horizontal resolution to optimise computer processing time. Within each grid cell, we then determine the vertical distribution of smoke extinction. We define the maximum smoke plume height in each grid cell as the maximum altitude reached by the extinction classified as smoke. Similarly to the MINX definition of median plume height, we consider the median of the CALIOP vertical extinction distribution as the height at which most of the smoke is probably concentrated. Smoke does tend to concentrate either in the PBL or in thin layers in the FT (Kahn et al., 2007; Val Martin et al., 2010).
To ensure we do not introduce a bias into the CALIOP plume heights due to the horizontal resolution, we also retrieved the smoke plumes for the 2007 burning season at a horizontal resolution of and find no significant differences. For this subset, our method returns 131 plumes, with an average altitude of 3.65 km for the maximum plume heights, whereas the method returns 149 plumes, with an average altitude of 3.74 km.
To identify CALIOP smoke plumes associated with active fires, we select only those CALIOP-derived grid cells that contain at least two MODIS Collection 6 fire pixels (Giglio et al., 2003) at 80 % confidence level or higher, at the time of CALIOP overpass. We also use the mean terrain elevation across each grid cell to reference the maximum and median heights to ground level, as CALIOP provides observations above sea level. We estimate the mean terrain elevation using terrain elevation from the CALIOP digital elevation map. Figure 1 shows an example of our approach for the CALIOP observation of 25 September 2010 at 06:25 UTC. For this example, we identify a CALIOP smoke plume with 2 km median and 4.5 km maximum height above ground level. A total of 2460 plumes are characterised with our approach over the Amazon for the months of July to November from 2006 to 2012; about 65 % of these plumes are linked to active fires with some confidence (i.e. having a clear connection to a MODIS fire pixel), and we only consider those in our analysis, a total of 1600 plumes.
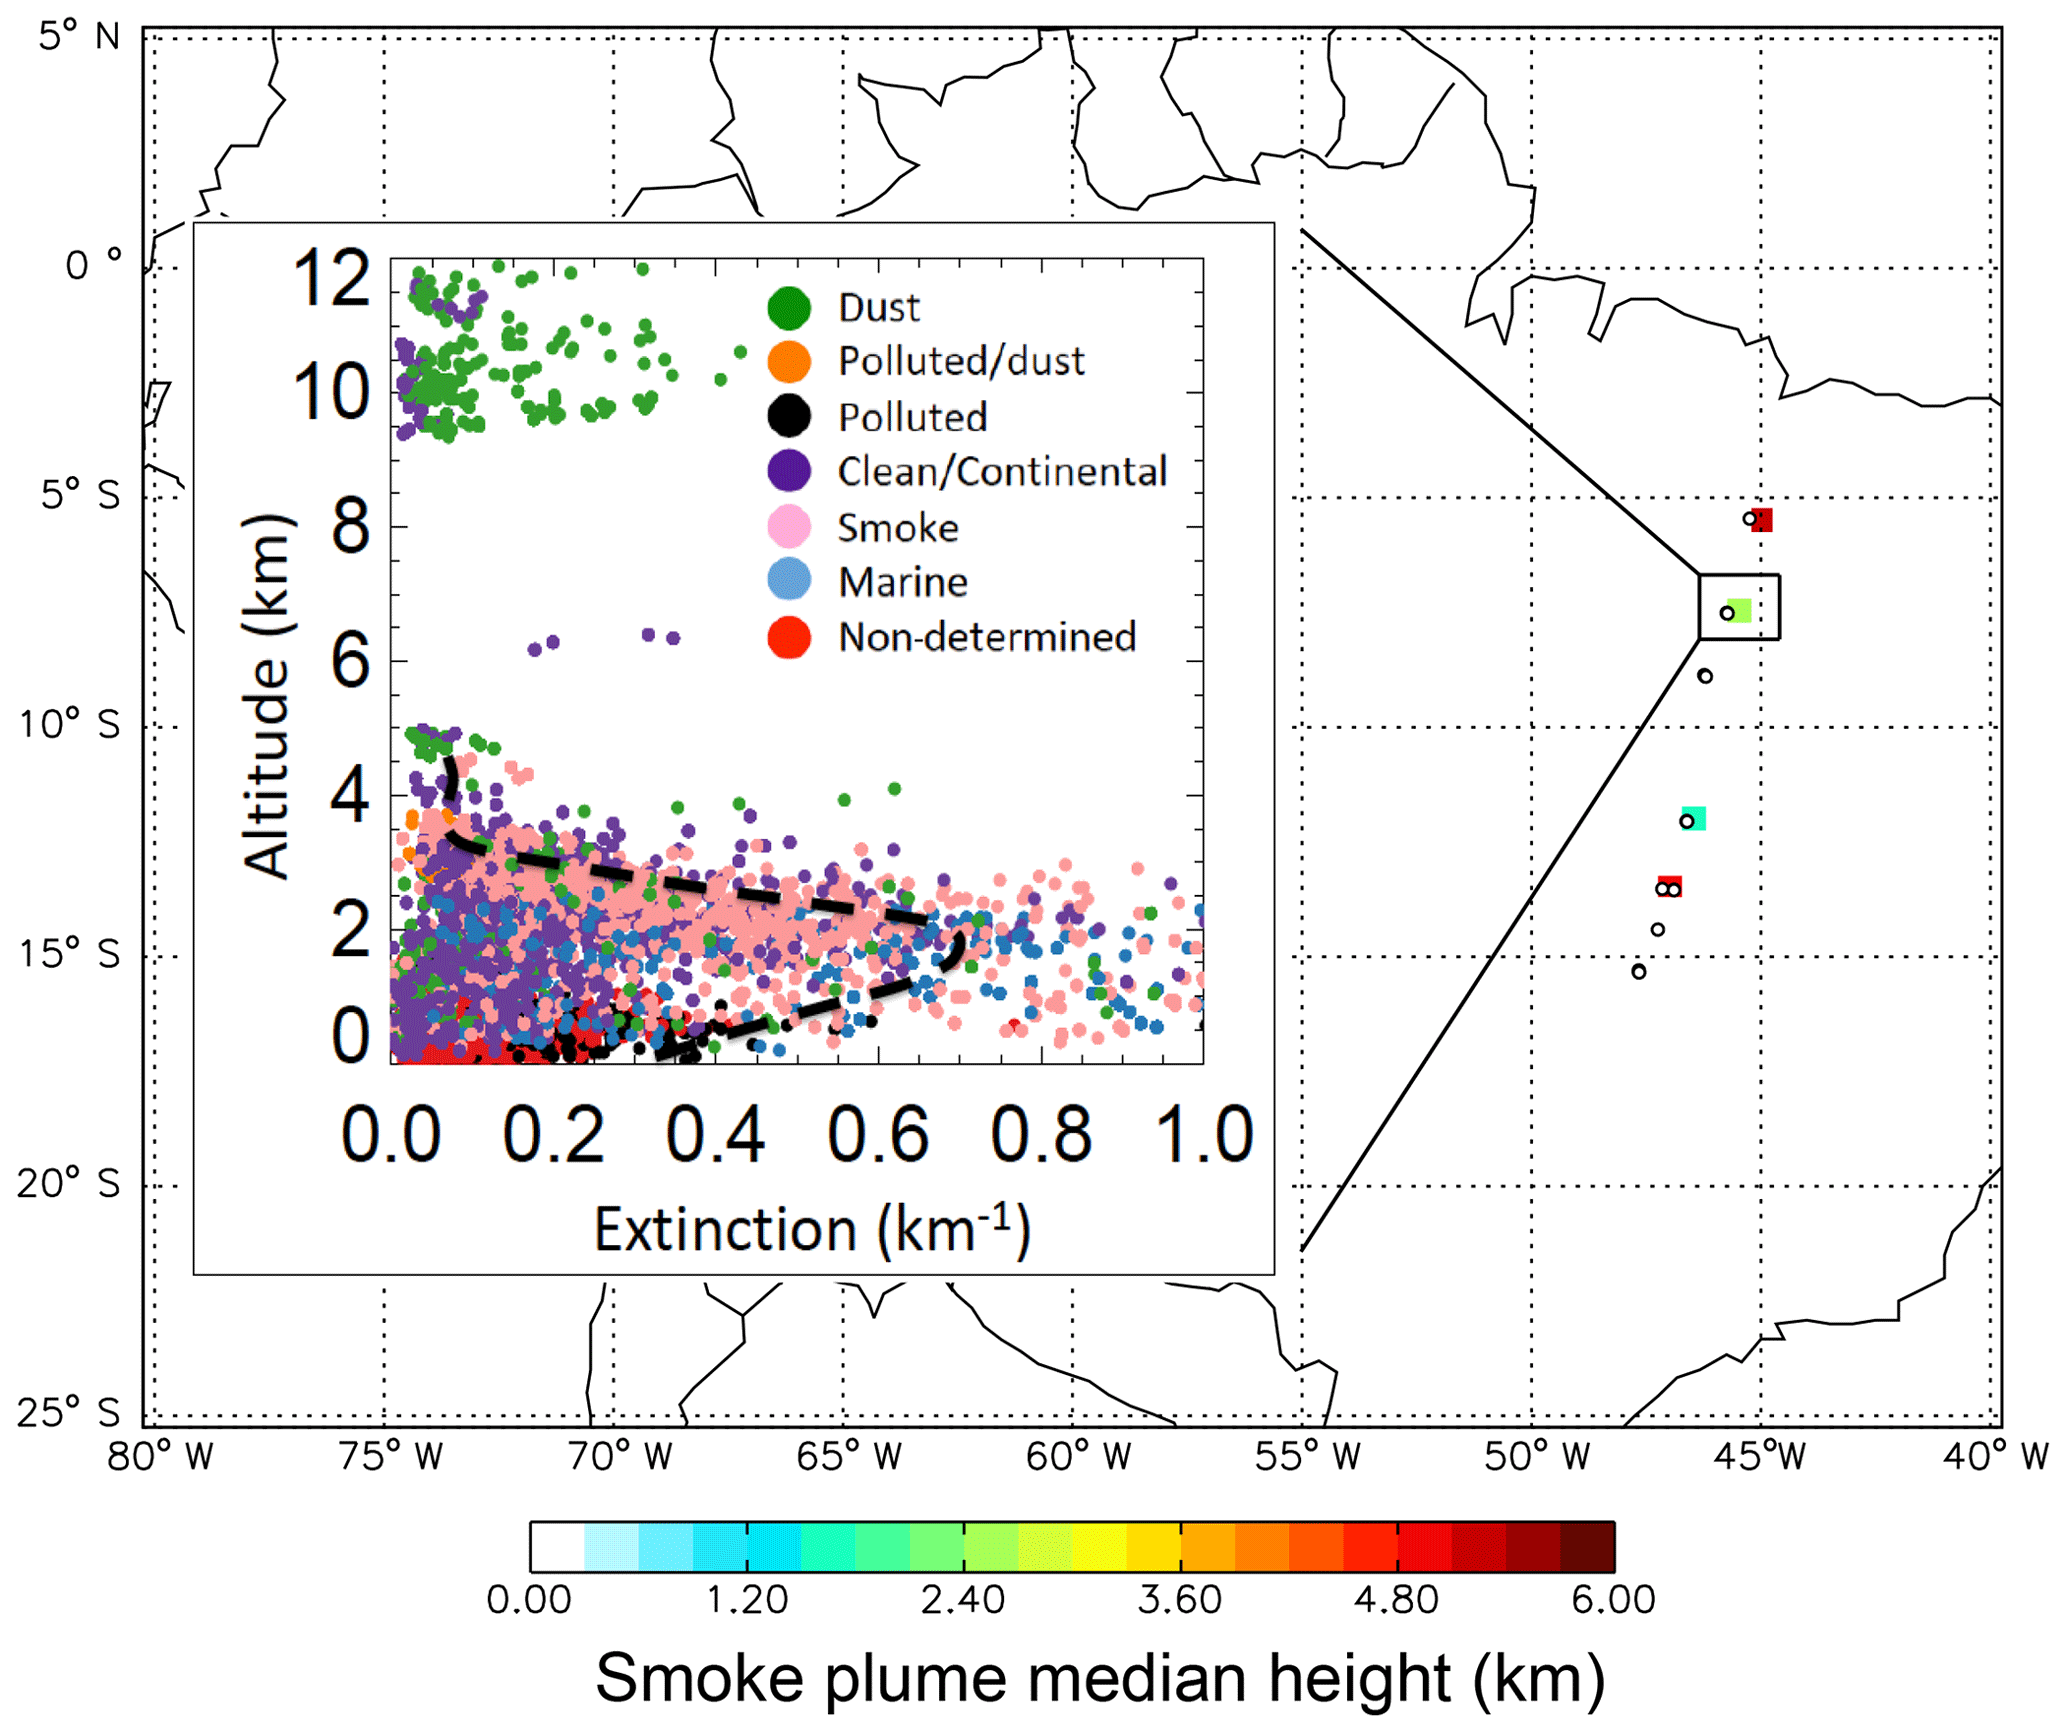
Figure 1Example of the approach followed for the CALIOP smoke plume characterisation. The map shows estimated smoke plume median heights (gridded at 0.5×0.5 horizontal resolution) for 25 September 2010 at 06:25 UTC. MODIS active-fire pixels associated with the CALIOP smoke plumes are represented with open circles. The insert displays the vertical distribution of aerosol extinction for a specific smoke plume in the map, with extinction values coloured by classified aerosol types. Dashed black line represents the averaged extinction profile for the aerosols classified as smoke (pink dots). In this profile, the CALIOP smoke plume has a median height of ∼2 km (green colour in the smoke plume median height scale) and a maximum height of 4.5 km above the terrain.
Previous studies used other CALIOP products to determine the vertical distribution of smoke plumes. The level 2 aerosol layer product is commonly used to analyse smoke plume heights from CALIOP, as it reports the top and base heights of aerosol layers. Tosca et al. (2011) used their smoke layer top altitudes and extinction coefficient profiles over Borneo for September–October 2006. Using the CALIOP Level 1 attenuated backscatter profiles at 532 nm, Amiridis et al. (2010) estimated smoke injection heights from agricultural fires over Europe. They selected only those profiles of constant attenuated backscatter coefficient with height, without strong convection, and that were collocated with MODIS active-fire pixels from the Aqua satellite. Recently, Huang et al. (2015) used 6 years of the CALIOP Level 2 vertical feature mask (VFM) data and aerosol layer products over six regions to investigate the most probable height (MPH) of dust and smoke layers. They used two approaches to obtain MPH: one based on the probability distribution of the vertical profiles of occurrence frequency (OF) (i.e. ratio of number of samples classified as dust or smoke by the VFM to the total samples per grid) and the other as the probability distribution of the aerosol optical depth (AOD) vertical profiles. So MPH_OF and MPH_AOD correspond to the altitude with the largest OF and mid-visible AOD for a certain type of aerosol. Our definition of CALIOP median plume height is most similar to their MPH_AOD. However, Huang et al. (2015) analysed vertical profiles over large-scale regions (e.g. the entire Amazon or Sahara), whereas in the current work, we analysed and then aggregated the heights for individual smoke plumes.
Our initial objective was to compare the CALIOP with the MISR plumes to assess the diurnal smoke evolution, as CALIOP has a later sampling time than MISR over the Amazon (14:00–15:00 vs. 10:00–11:00 LT). However, despite our effort to develop a comprehensive CALIOP climatology, none of the CALIOP plumes coincide with the MISR plumes. As previous studies discuss (e.g. Kahn et al., 2008; Tosca et al., 2011), CALIOP and MISR, in addition to having different sampling times, also have different swath widths (380 km vs. 70 m). These differences make it difficult to observe the same fire on the same day, but they make CALIOP and MISR observations complementary: MISR provides late-morning near-source constraints on aerosol plume vertical distribution, whereas CALIOP in general offers more regional constrains, later in the day (Kahn et al., 2008). Some differences between the products are thus expected.
3.1 Smoke plume height observations
Figure 2 maps the biomes of the Amazon region for which the MISR plume climatology was developed. Figure 3 presents the time series of the smoke plume heights for the biomass-burning seasons (July–November) during the 2005–2012 study years. We also include a statistical summary of the number of plumes within the time series by year, month, biome and drought conditions in Fig. S1 in the Supplement. The largest number of plumes is recorded in 2010, with about 25 % of the total plumes in the database, whereas the smallest is in 2009 (3 %). These 2 years are the driest and the wettest in the climatology, respectively. Most of the plumes were observed in August and September (85 %), at the peak of the burning season in most vegetated locations, in the dominant biomes of savanna (48 %) and tropical forest (46 %), and during dry conditions (76 %). We find important interannual variability in the type of fires, with fires over tropical forest dominant in 2005 (65 %) and 2010 (47 %), 2 of the 3 drought years in our database as shown in Sect. 3.4 below and the majority of fires in savanna (54–65 %) for the other years. We note that a large fraction of the plumes were observed in 2008 (17 %), even though it was not a drought year. The majority of plumes in the 2008 record are digitised with blue-band retrievals (Table 1), which produce higher-quality results in many situations, especially for optically thin plumes over land surfaces.
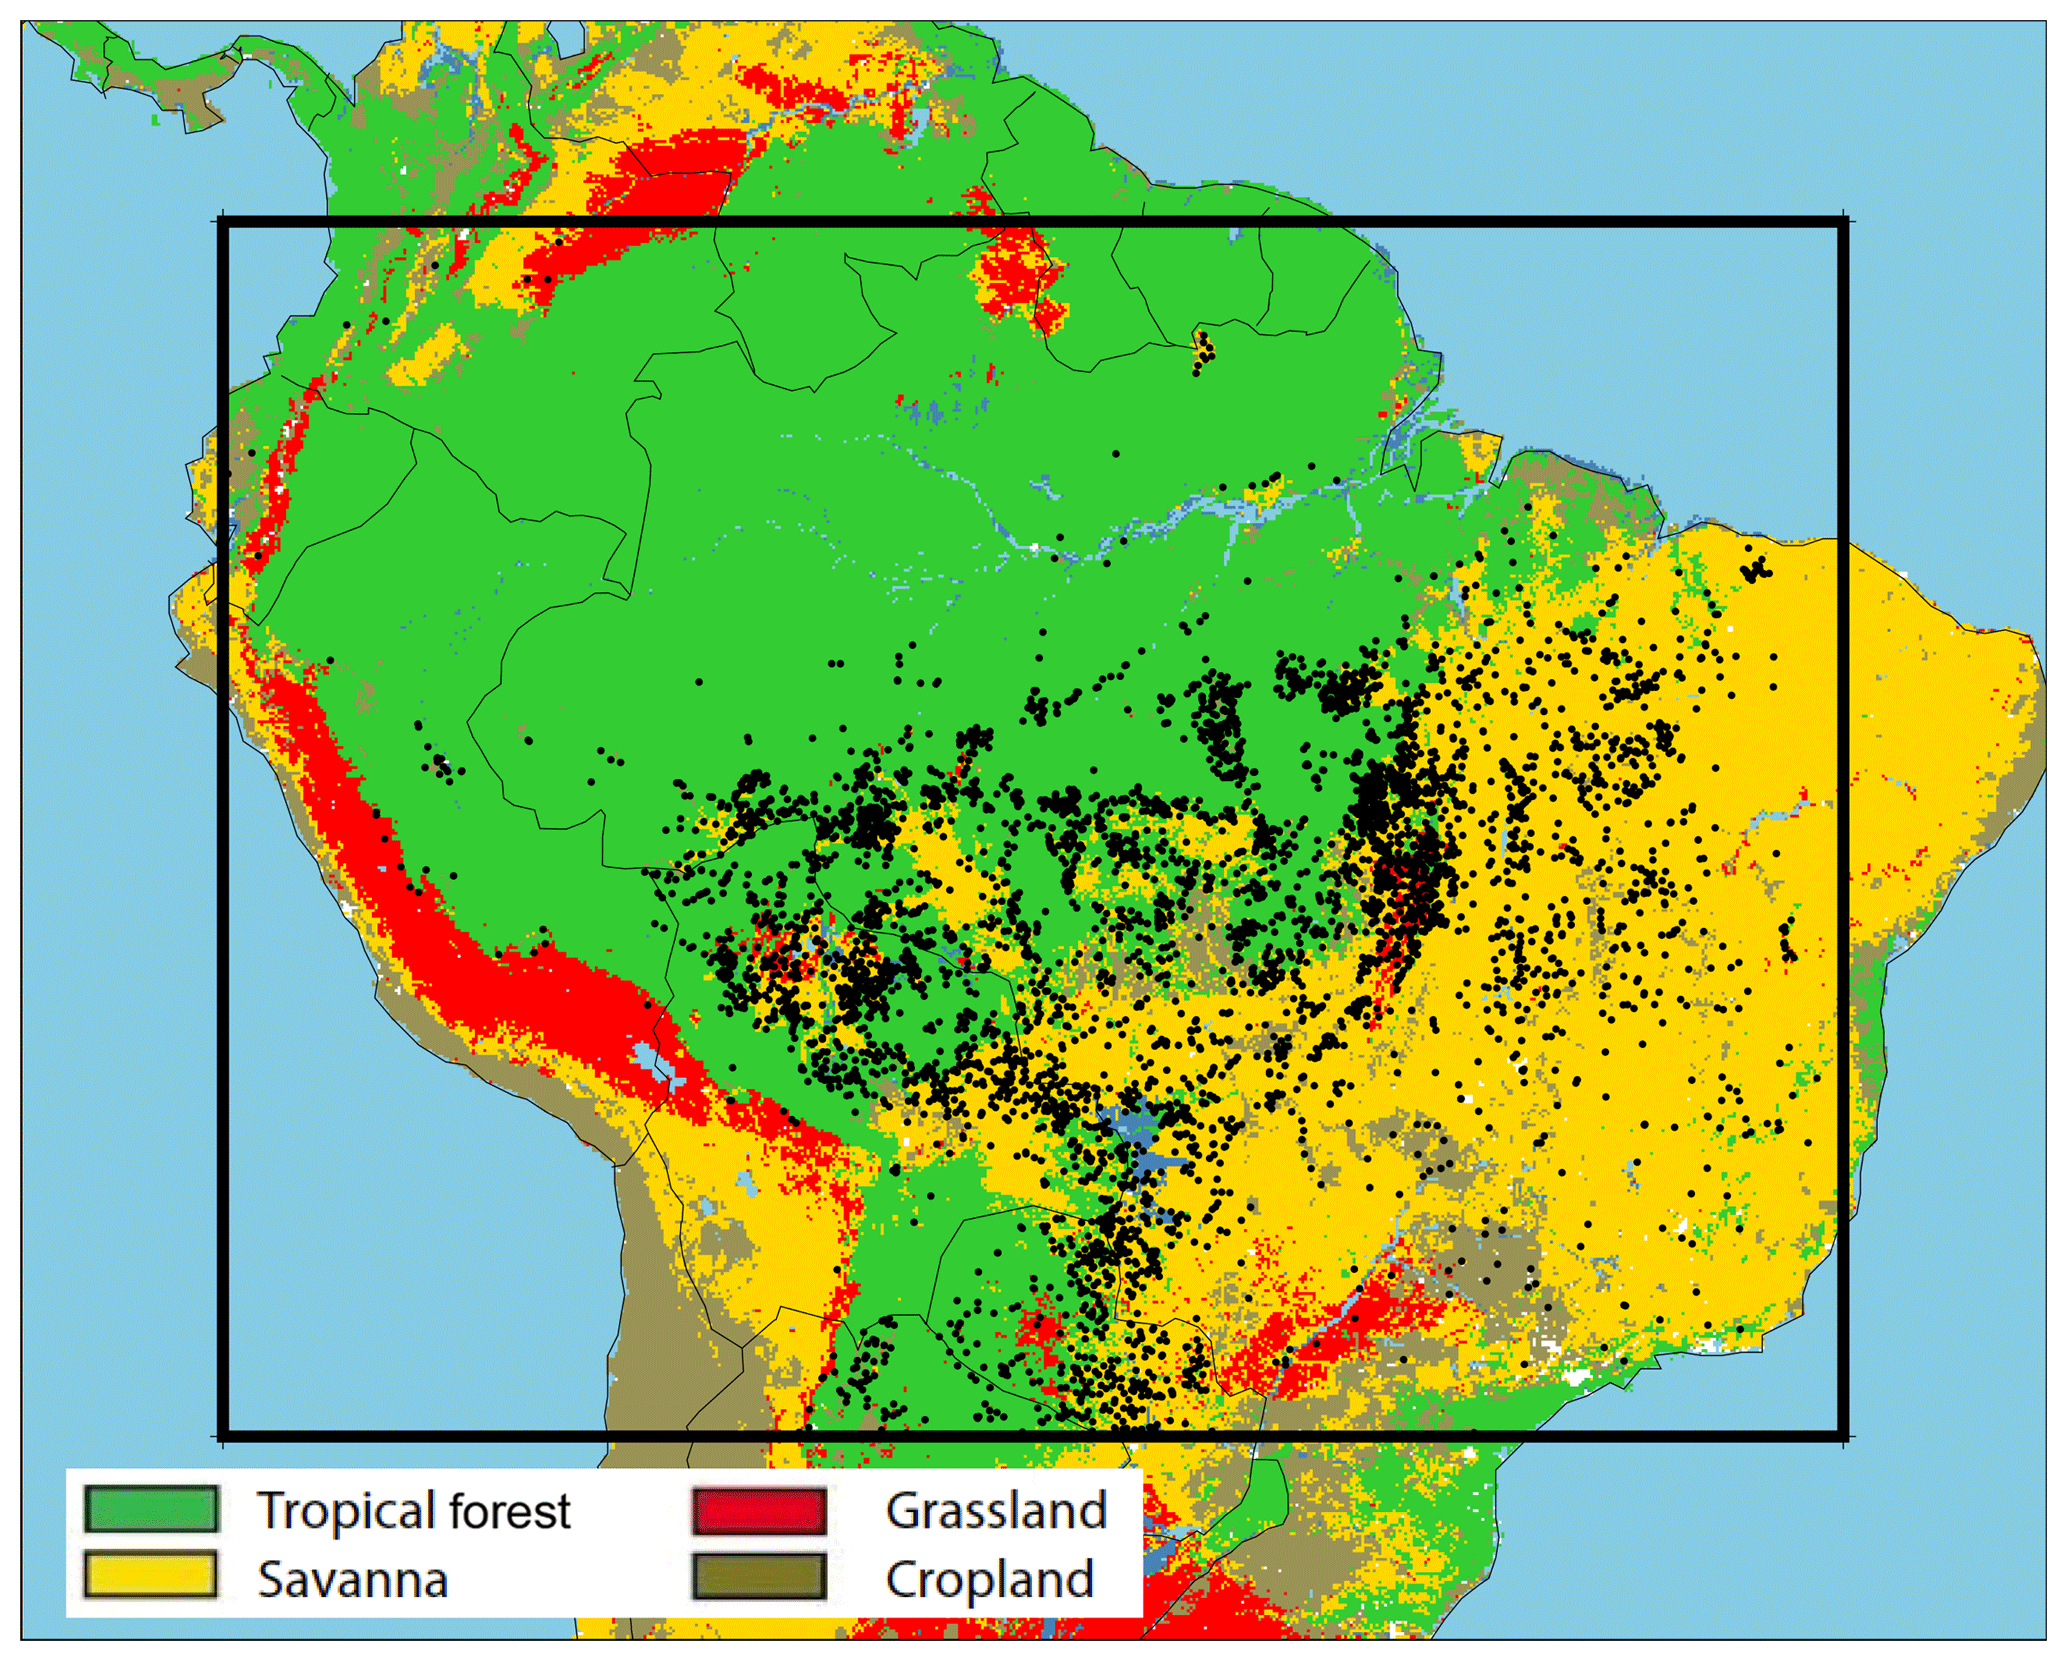
Figure 2Locations of the MISR plumes analysed (black dots) over the four main biomes considered in the study. The black square represents the Amazon domain.
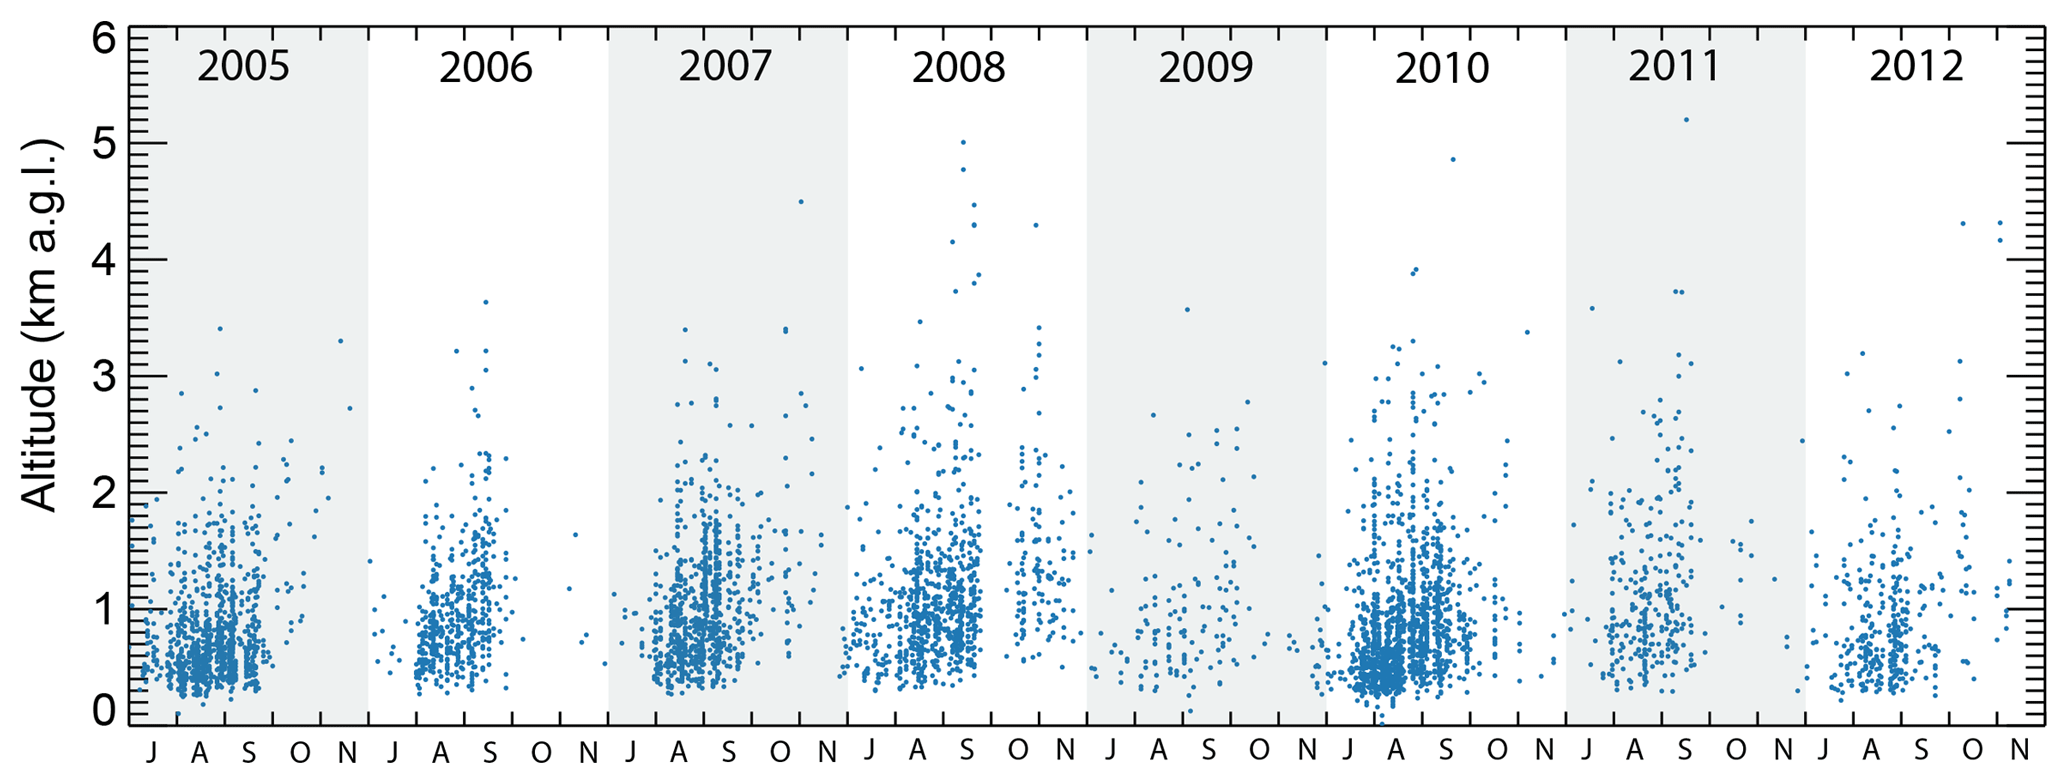
Figure 3Time series of the 2005–2012 MISR Amazon smoke-plume-height climatology, covering the July–November burning season for each year. Each blue dot represents the maximum smoke height above ground level (agl) for one plume.
Throughout the study period, we find significant variability in smoke plume height, with altitudes ranging from a few metres (essentially near-surface) to 5 km, depending on the biome (Fig. 3). Smoke plumes over cropland fires are scarce compared to the other fire types, as these fires are small and tend to be underdetected by MISR (Nelson et al., 2013). We summarise the statistical parameters of the smoke plumes for all observations except the cropland cases in Table 2. Over the Amazon, the vertical distribution of smoke varies by biome. Statistically, the highest smoke altitudes averaged by biome are detected over grasslands, with median and maximum heights of 794 and 1120 m, respectively, whereas the lowest heights are detected over tropical forest (601 and 845 m, respectively). In all the biomes, more than 85 % of the smoke is located at altitudes below 2 km (Fig. S2 in the Supplement).
Similar altitudes and distributions have been found across comparable fires in other parts of the world. For example, altitudes between 700 and 750 m were detected over the tropical forest in central America and Indonesia (Val Martin et al., 2010; Tosca et al., 2011). In contrast, smoke plume heights over the Amazon are substantially lower than smoke plumes observed over the boreal biomes (960–1040 m) (Kahn et al., 2008; Val Martin et al., 2010). There are several factors that influence smoke altitudes and contribute to the differences between biomes, such as fire intensity, availability of fuel, combustion efficiency, atmospheric stability and entrainment (e.g. Lavoué et al., 2000; Trentmann et al., 2006; Luderer et al., 2006; Kahn et al., 2007, 2008; Val Martin et al., 2012). We assess some of these factors for our Amazon dataset next.
3.2 Effect of atmospheric and fire conditions on smoke plumes
We explore the relationship between smoke plume height, fire characteristics (i.e. MODIS FRP and AOD) and atmospheric conditions derived in the vicinity of the fires throughout the burning season, across the major biomes in the Amazon except cropland. For atmospheric conditions, we focus both on how smoke plume height relates to boundary layer height and on the effect of atmospheric stability on plume rise. We consider atmospheric stability conditions above our fires as the average of the atmospheric stability over the atmospheric column (K km−1; Sect. 2.4) from the surface, at the origin of the fire, to the maximum altitude that smoke reached in the atmosphere. We add a buffer of 10 % to the maximum altitude to account for any potential influence that the atmosphere above the plume might have over the column. We include a summary of these main parameters in Table 2.
Table 2Statistical summary for main smoke plume parameters and atmospheric conditionsa. Atm stab is atmospheric stability.
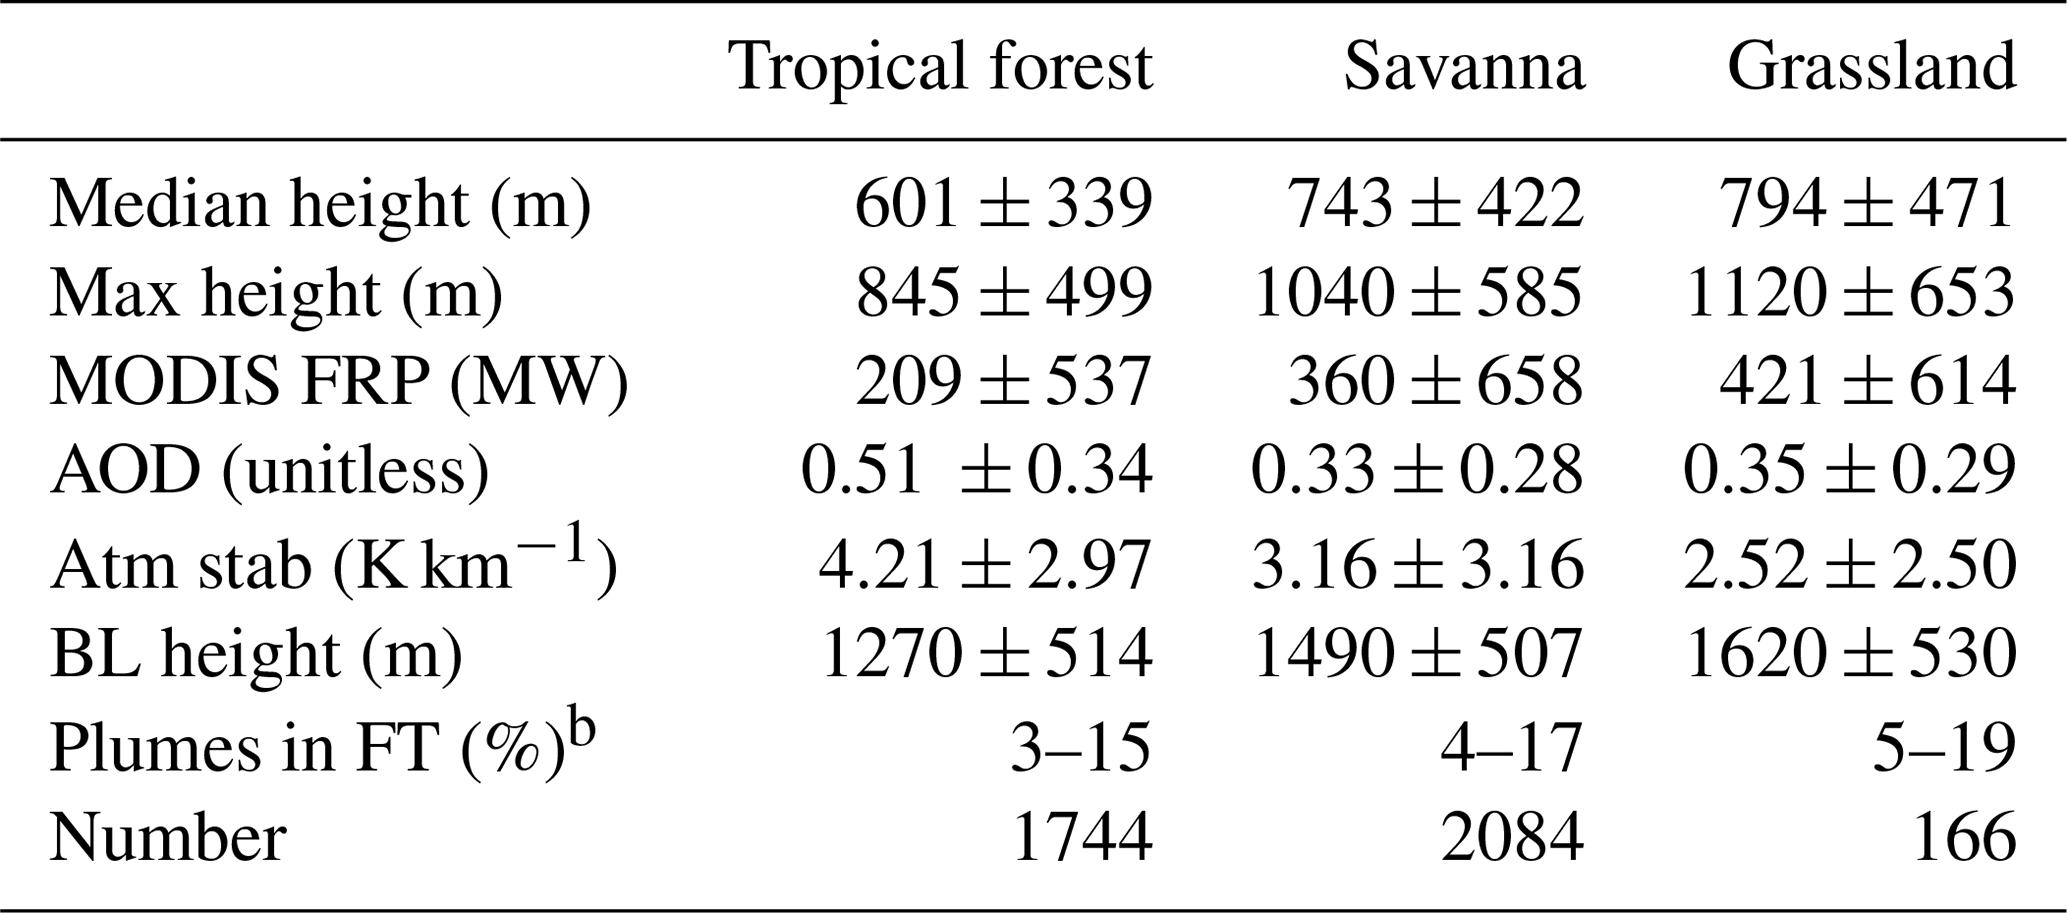
a Reported the average ± SD and number of observations.
b Reported range from more
and less conservative
definitions of plume in the FT (see text for explanation).
Consistent with previous studies (e.g. Val Martin et al., 2010, 2012; Sofiev et al., 2009; Amiridis et al., 2010), we find that the highest-altitude smoke plumes tend to be associated with highest MODIS FRP values, though there is significant variability in the relationship in all the biomes (r2=0.2; Fig. S3 in the Supplement). Smoke plumes detected over tropical forest fires have the lowest FRP (209 MW) and largest AOD values (0.51) (Table 2). The other two main biomes (savanna and grassland) have FRP and AOD values similar to each other (360–421 MW and 0.33–0.35, respectively). Tropical forest has deeper root systems, which allow fires to access deeper soil layers (Nepstad et al., 2008) that can maintain higher moisture content and lower oxygen availability than other biomes, such as grasslands. High fuel moisture content and low oxygen availability favour smouldering rather than flaming fires, which in turn tends to produce greater smoke emission but lower radiant emissivity (Kauffman et al., 1995). Therefore, the low FRP and high AOD in tropical forest fires are consistent with these conditions, in which smouldering fires predominate, whereas high FRP and low AOD are typical with drier, less dense fuels, e.g. savanna and grassland, that tend to produce flaming fires (Giglio et al., 2006). In addition, high smoke opacity and tree canopy obscuring the fire-emitted 4-micron radiance as viewed by MODIS, as well as low radiant emissivity, rather than just low radiative total fire intensity, probably contribute to these differences (Kahn et al., 2008).
The atmospheric stability structure affects the vertical motion of smoke and is a key factor in plume rise, either enhancing or suppressing the lifting. Some studies have shown the important role that atmospheric stability plays in plume rise (e.g. Kahn et al., 2007, 2008; Val Martin et al., 2010; Amiridis et al., 2010), and the quantitative representation of this factor still remains an open question in plume-rise model parameterisations. For instance, Val Martin et al. (2012) showed that, in North America, fires that inject smoke to high altitudes tend to be associated with higher FRP and weaker atmospheric stability conditions than those that inject smoke at low altitudes, in which smoke tends to be trapped within the boundary layer. Similar results were found for agricultural fires over eastern Europe (Amiridis et al., 2010).
To analyse the influence of atmospheric stability over Amazon fires qualitatively, we divide our plume dataset into two groups that we define as having weak and strong atmospheric stability conditions based on MERRA-2 reanalysis. Over the Amazon, and at the locations and times studied, atmospheric stability ranges from −3 to 23 K km−1. We designate atmospheric stability <2 K km−1 as “weak” and atmospheric stability >4 K km−1 as “strong”. Each group contains about 30 % of plumes in the database. Figure 4 shows the vertical distribution of smoke stereo-height retrievals for the plumes classified under weak and strong atmospheric stability conditions. Our comparison supports previous observations that plumes under weak atmospheric conditions tend to inject smoke to higher altitudes than those encountering strong stability, with maximum plume heights of 1150 and 654 m, respectively. A similar pattern is found for the median plume heights (821 and 482 m, respectively). Weak atmospheric stability conditions are also associated with deeper PBLs (∼1500 m) than strong stability conditions (∼1200 m) (not shown).
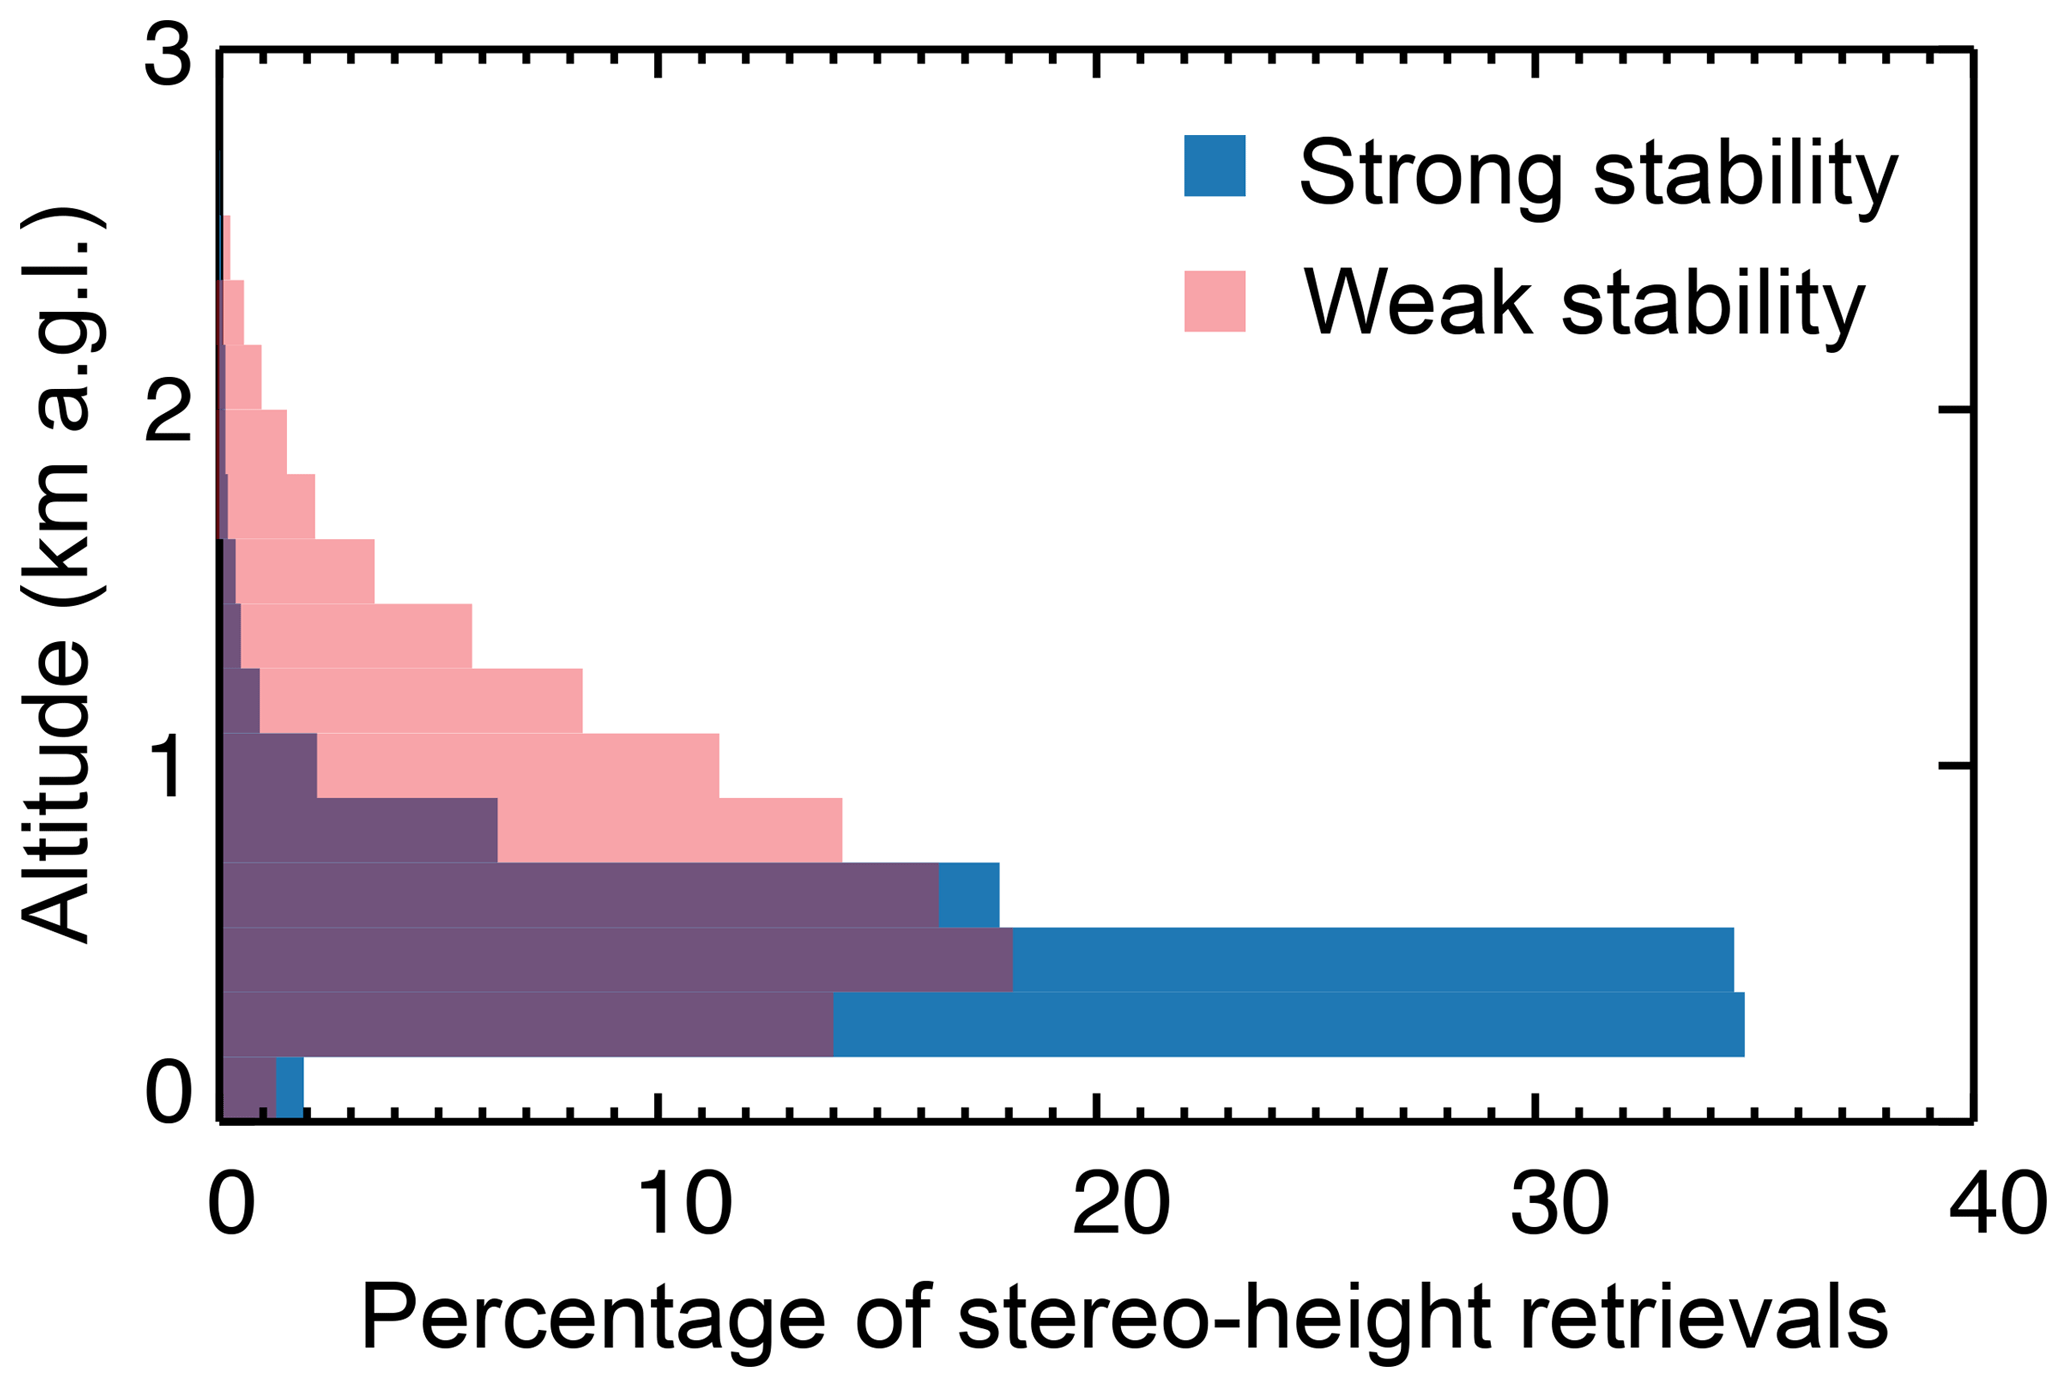
Figure 4Vertical distribution of MISR stereo-height retrievals for all the plumes analysed, under strong (blue) and weak (red) atmospheric stability conditions.
Atmospheric conditions also correlate with biome type. We find that tropical forest fires tend to be associated with more stable atmospheric conditions than grassland fires (4.2 vs. 2.5 K km−1). Shallower PBLs are also observed over tropical forest (1270 m) compared to grassland (1620 m). Tropical forests typically have higher relative humidity conditions and more constant temperatures than grasslands, which favours more stable conditions and lower PBL heights (Fisch et al., 2004). We note that our dataset was fully acquired at Terra overpass time, which occurs between about 10:00–11:00 LT. This might produce a bias toward the more stable atmospheric conditions that occur preferentially during the morning; later in the afternoon convection tends to become more important (Itterly et al., 2016).
3.3 Seasonality of smoke plumes heights
Figure 5 shows the seasonal cycle of maximum plume height with FRP, AOD and atmospheric conditions over the major Amazon biomes. We further disaggregate these observations by biome, season and dry or wet years in Table S2 in the Supplement. For these biomes, we find minimum plume heights of 600–750 m in July and maximum plume heights of 900–1400 m in October and November. Similarly, over tropical forest and grassland, MODIS FRP values follow the plume-height patterns, with maximum values toward the end of the burning season (180–200 MW) compared to the early season (90 MW). For savanna fires, MODIS FRP remains mostly constant throughout the season (∼150–200 MW). Savannas are known to be fire-adapted, and combustion efficiency typically remains constant throughout the season (Van der Werf et al., 2010). All these patterns are similar in wet and dry years, although larger MODIS FRP values are observed over savanna and grassland fires in dry years (Table S2).

Figure 5Seasonal cycle of MISR smoke plume maximum height above the terrain (black circles), MODIS FRP (red diamonds), PBL heights (black triangles), atmospheric stability (blue diamonds) and MISR AOD (green diamonds). Monthly median values are shown for tropical forest, savanna and grassland biomes. Vertical bars indicate the 10th and 90th percentiles. Distributions with fewer than 10 observations are omitted and all years are included.
Some previous studies show the seasonal peak in MODIS FRP over the Amazon earlier, in August–September (Tang and Arellano, 2017). However, their work relies on the maximum MODIS FRP detected by the Terra and Aqua satellites (4 times a day) over the Amazon, whereas our seasonality shows the monthly median MODIS FRP observed by Terra, collocated with the MISR smoke plume observations (once a day). In addition, the MISR swath is substantially narrower than MODIS (380 vs. 2330 km), and many fires detected by MODIS are not observed by MISR. Our seasonality thus captures the fire intensity that drives the smoke plumes detected specifically by MISR, i.e. only at about 10:30 local time, and the seasonal differences provide at least some indication of possible bias introduced by the MISR sampling of fires.
In contrast to the seasonality of plume heights and fire intensity, the peak monthly AOD occurs in September across the major biomes, with a median AOD of 0.6 in tropical forest and 0.3 in savanna and grasslands compared to AOD values of 0.04–0.1 in July and November. Over the Amazon, total AOD correlates well with the number of fires, and both tend to peak during September each year (Mishra et al., 2015). Baars et al. (2012) reported optical depths in the polluted biomass-burning season (July–November) to be 6 times larger (on average) than in the pristine wet season (December–June), with highest values in September and October, for a site in the central Amazon near Manaus. In our dataset, September, together with August, are the months in which the largest number of plumes were detected (Fig. S1 in the Supplement). However, our monthly statistics might be influenced by the number of observations in each month. For example, the number of fires in August is driven by the year 2010, in which an unusually large number of fires were observed compared to the other August months. In addition, the large monthly median values in November are based on the lowest number of plumes (Fig. S1 in the Supplement), although the few fires detected by MISR for those months were large and intense.
Boundary layer heights and atmospheric stability conditions may also vary by biome and throughout the season, influencing plume-rise spatial and temporal distributions. On a seasonal basis, the PBL height does not follow a clear cycle in any of our biomes, but higher PBL heights are observed over grassland fires (Table 2) and across all the biomes during dry years (Table S2). More stable atmospheric conditions are found at the beginning (3.6 K km−1 in July) compared to the end of the burning season (1.9 K km−1 in November).
Previous studies have shown that a substantial fraction of smoke is injected above the boundary layer (i.e. into the FT), although this fraction varies depending on biome and fire type. For tropical fires over central America and Indonesia, smoke from about 4–6 % of fires is reported to reach the FT (Val Martin et al., 2010; Tosca et al., 2011). This fraction is larger for boreal fires (>16 %), where fires are more intense and the BL is typically lower than in tropical regions (Val Martin et al., 2010; Val Martin et al., 2018; Kahn et al., 2008). Following these studies, we consider that smoke reaches the FT when the median height of the plume is at least 500 m above the PBL height. This is a conservative definition that takes into account uncertainties in MINX and MERRA (e.g. Kahn et al., 2008; Val Martin et al., 2010; Tosca et al., 2011). Because fires over the Amazon tend to be smaller in size than those in boreal forests, we also consider a less conservative definition. We assume a plume is injected into the FT when the maximum plume height is at least 250 m above the PBL height. We understand that this is an upper limit, but it provides a bracket to our results. We include the percentage of the smoke plumes injected into the FT for both definitions in Table 2, and present the seasonality of these percentages in Fig. 6. Our analysis shows that fires at the end of the burning season are more likely to inject smoke in the FT, with 15 %–40 % in November vs. 2 %–10 % in July and 5 %–22 % at the peak of the burning season (August–September). This pattern seems to be related to a combination of more intense fires and less stable atmospheric conditions. We find no influence of the monthly PBL depth variability, although deeper PBL heights are found across the Amazon in drier conditions (i.e. over grassland fires and/or dry years). Interestingly, our analysis also shows a slightly larger percentage of fires injecting smoke into the FT over grassland (5 %–19 %) compared to tropical forest (3 %–15 %). As mentioned above, grassland fires are associated with high PBL heights but also with large FRP values, suggesting that these fires are energetic enough to produce the buoyancy needed for the smoke to reach the FT.
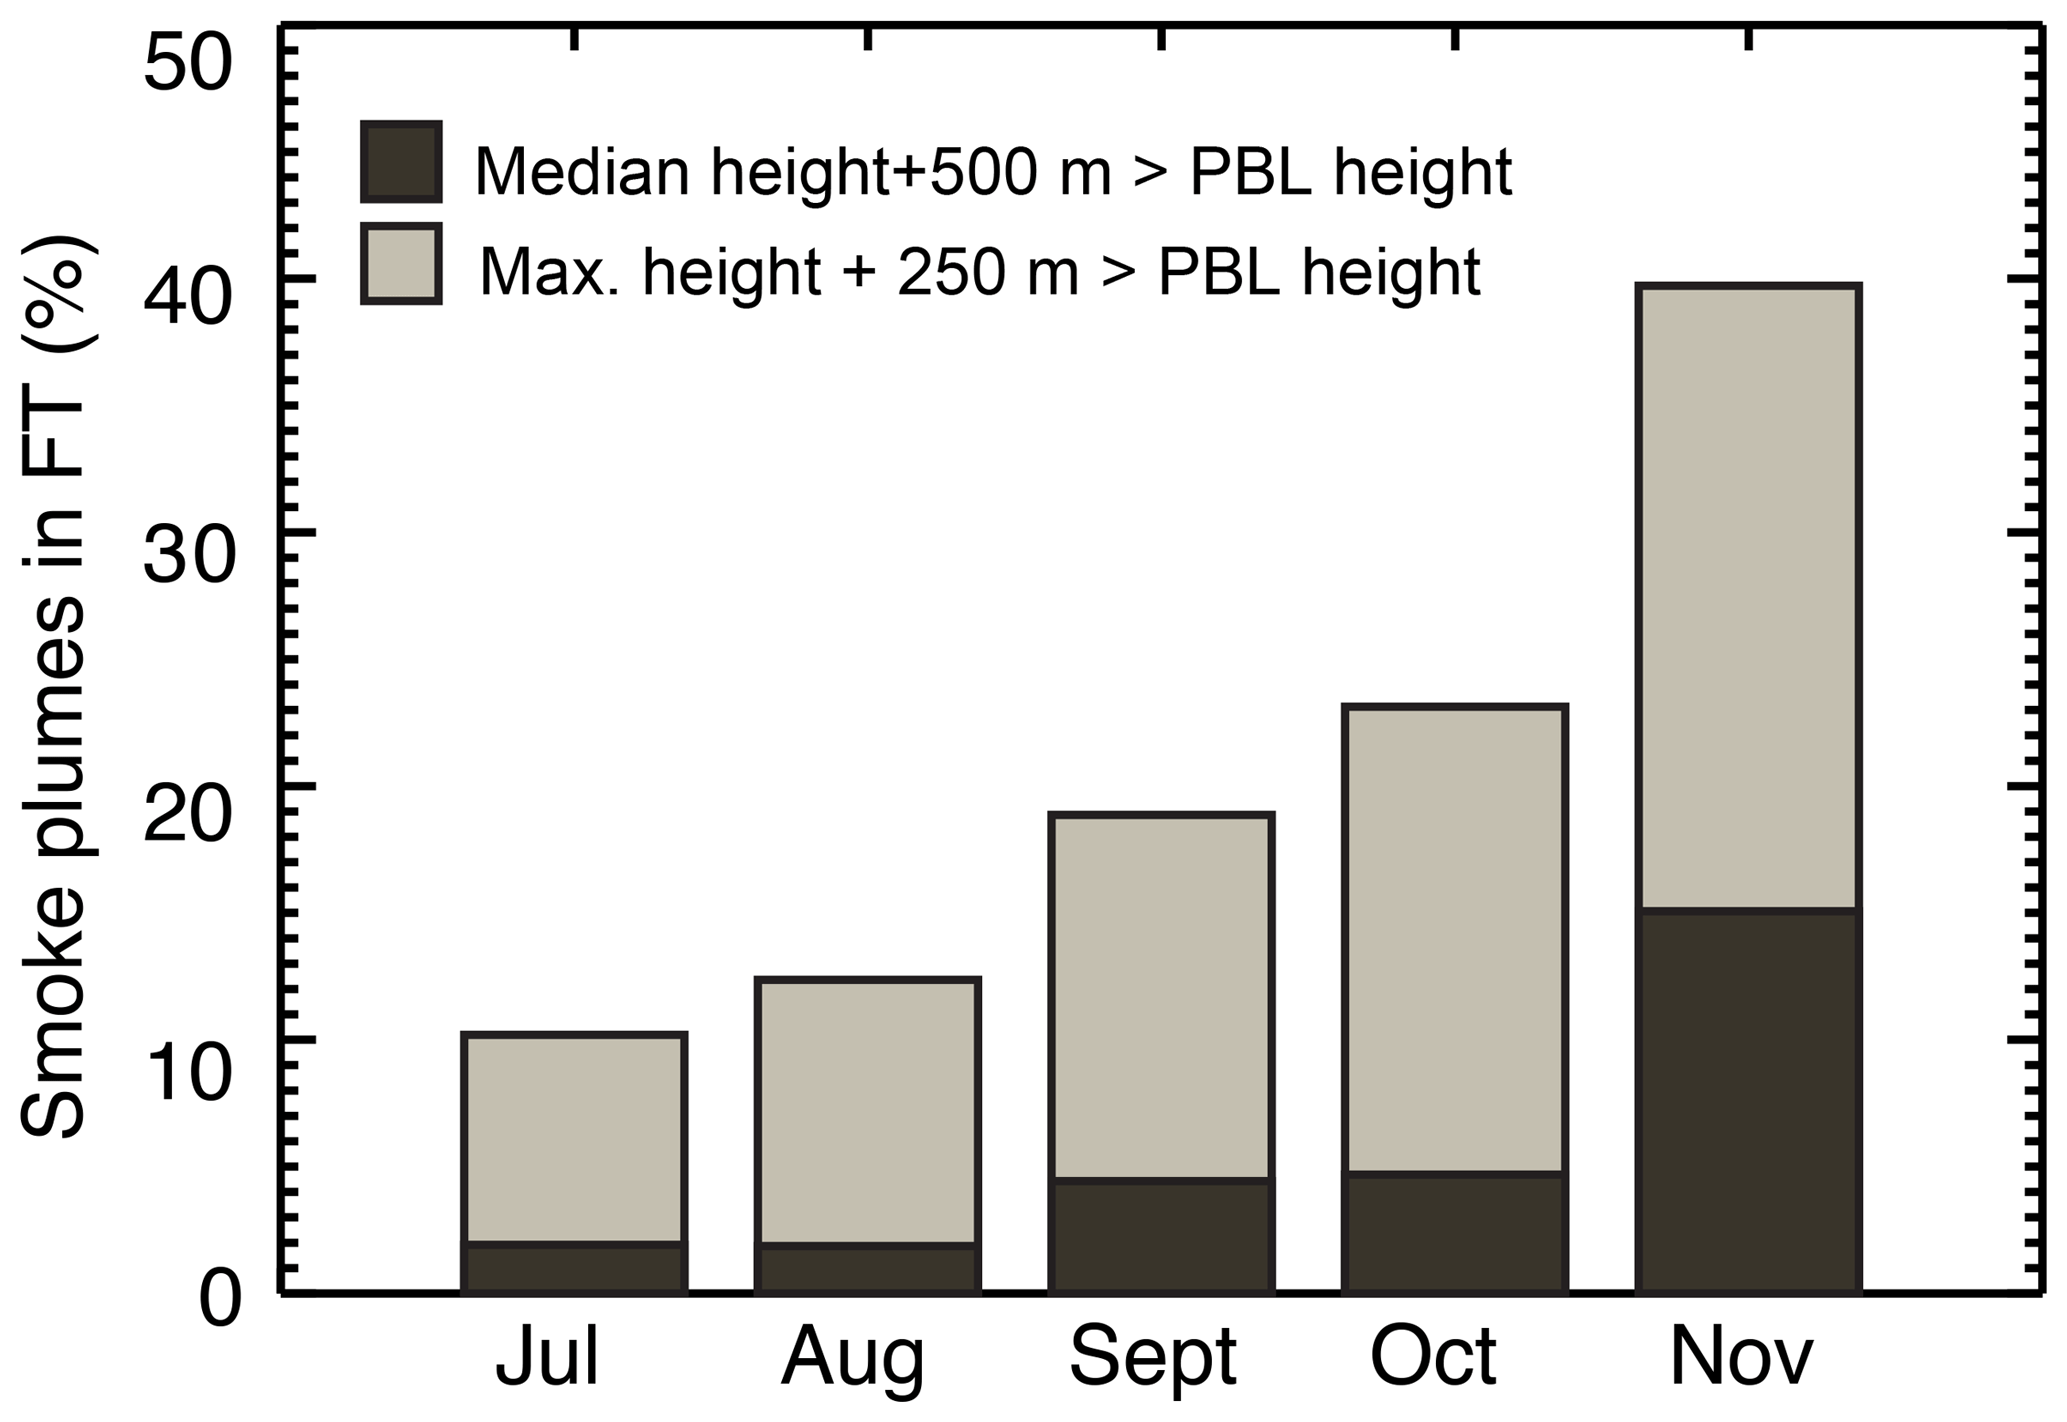
Figure 6Seasonal variation of Amazon plume injection above the PBL (percent). Bar plots indicate the average of (median plume − PBL height) > 0.5 km (dark grey) and (maximum plume − PBL height) > 0.25 km (light grey) (see text for explanation).
3.4 Interannual variability of smoke plumes and drought conditions
We use MODIS DSI to assess the effect of drought conditions on smoke plume rise and the extent that these conditions control the interannual variability of smoke plumes across the region. We present the interannual variability of MISR plume heights, MODIS FRP and MISR AOD in Fig. 7, and summarise the annual averages of MODIS DSI, atmospheric stability, PBL height and percentage of smoke plumes in the FT in Table 3. In addition, we include the annual relationship of MISR plume heights, MODIS FRP and MISR AOD with MODIS DSI, and the percentage of plumes in the FT per drought level in Fig. 8. In our dataset, 76 % of plumes are recorded under extreme–mild drought conditions vs. 7 % plumes in wet conditions, as discussed in Sect. 3.1. During drought years (2005, 2007 and 2010), smoke plumes register the lowest MODIS DSI annual averages values (−0.89, −0.91 and −1.50, respectively) compared to the other years in the climatology (−0.63 to 0.18). Note that DSI is higher in wetter years.

Figure 7Interannual variability of MISR maximum plume heights above the terrain, MODIS FRP and MISR AOD, for the aggregate of tropical forest, savanna and grassland. Bar plots indicate the distribution of the data for each year. The medians (red circles) and the means (black squares) are shown along with the central 67 % (box) and the central 90 % (thin black whiskers). The number of observations (in black) and the median values (in red) included in each distribution are given at the top of the plot. Drought years are in pink and non-drought years are in light blue. The same data, stratified by biome type, are plotted in Fig. S4 in the Supplement.
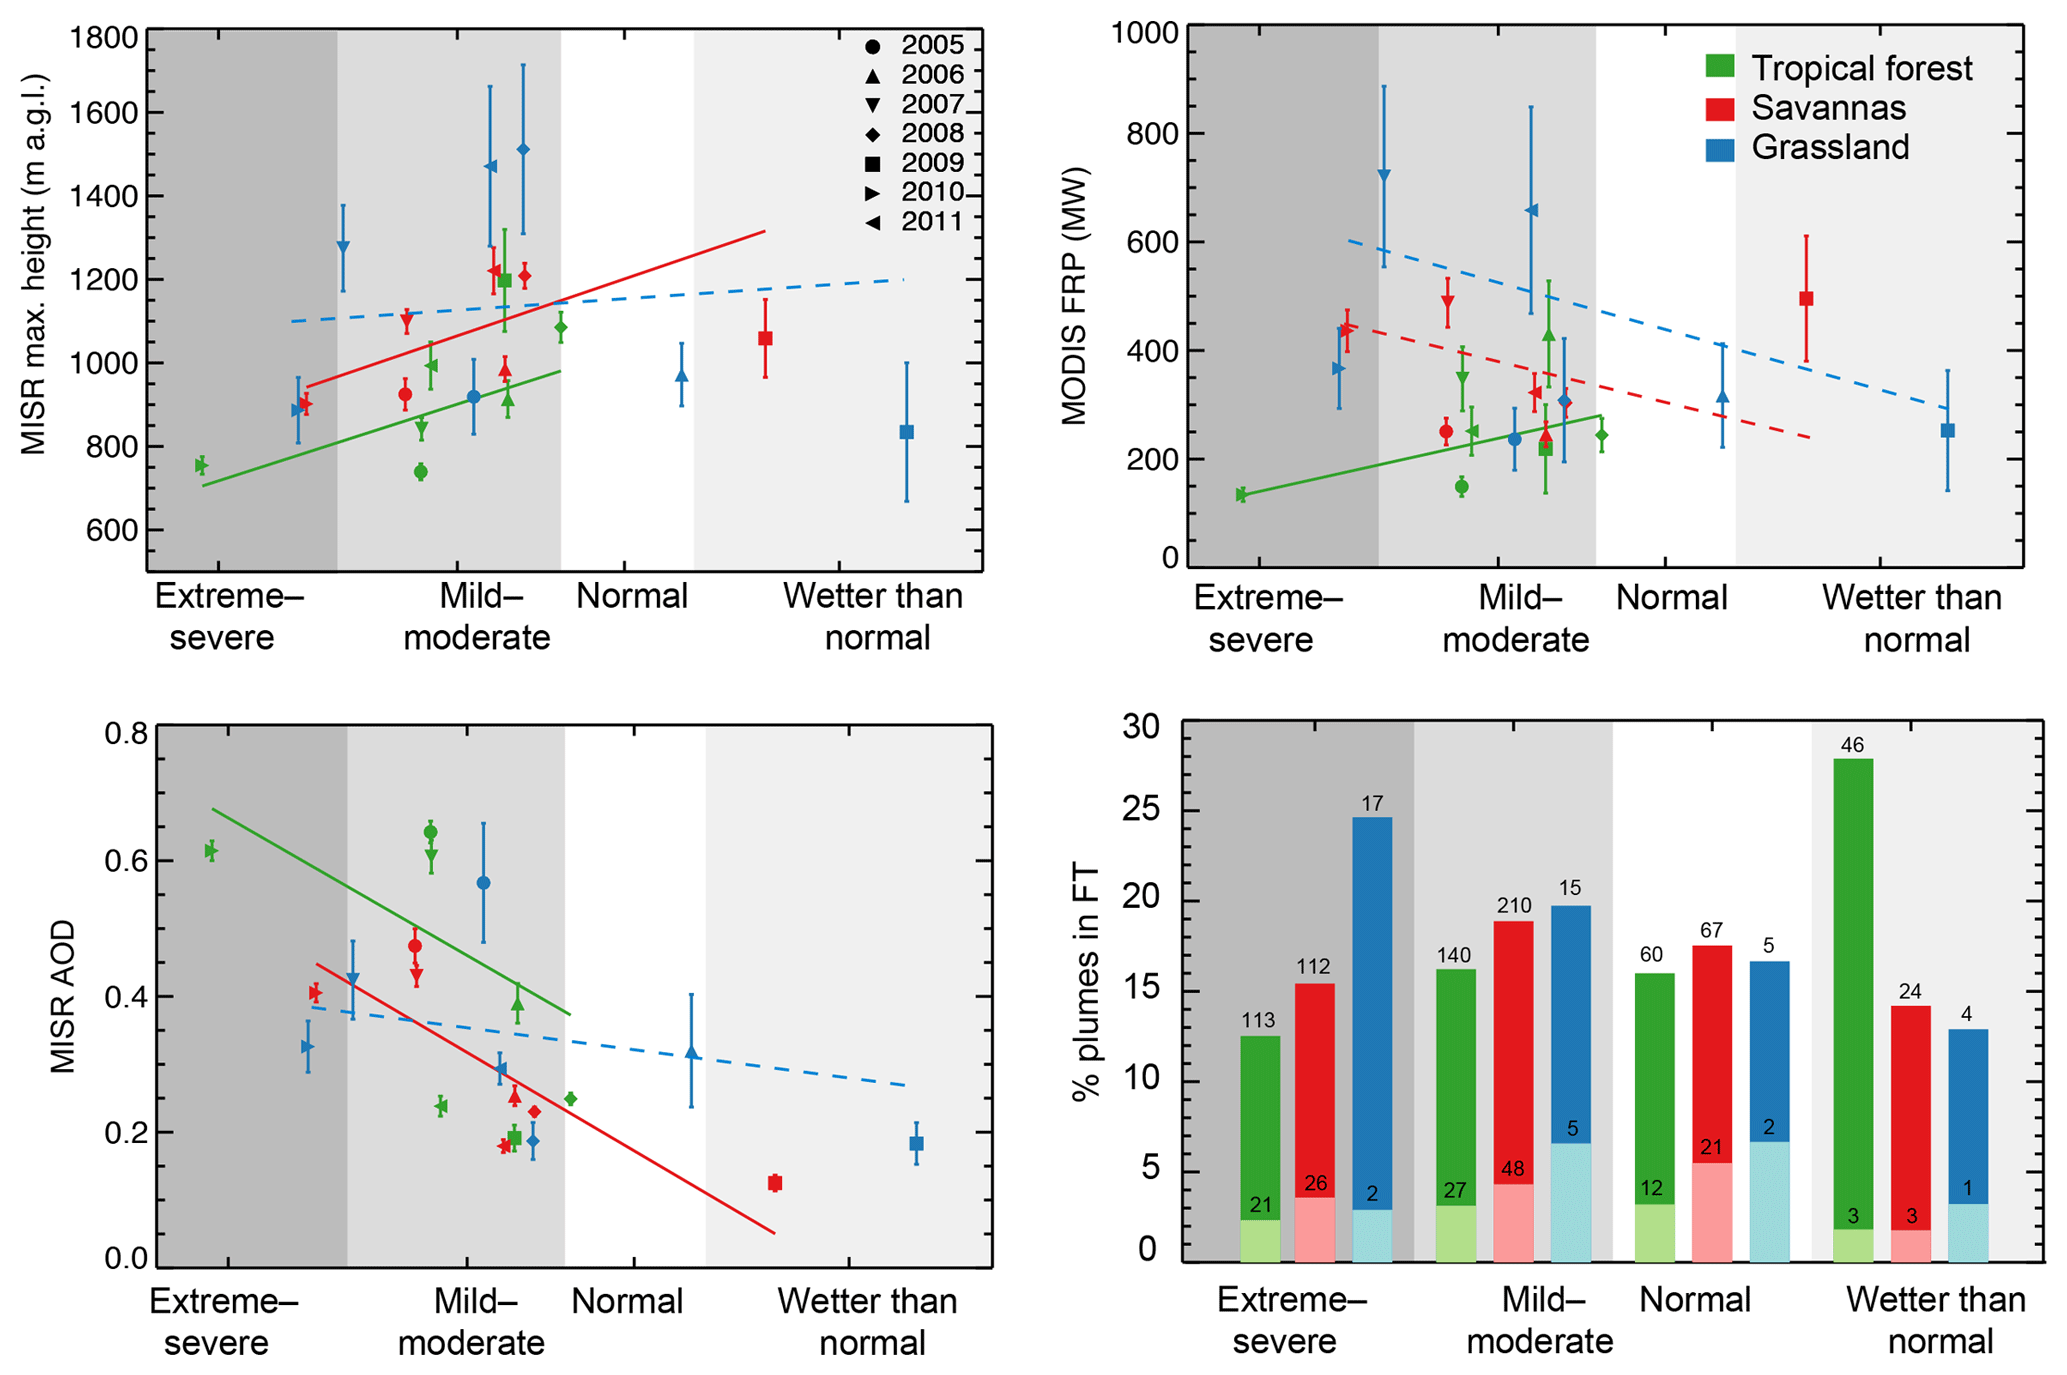
Figure 8Relationship between MODIS DSI at the location of the plumes and MISR maximum plume height, MODIS FRP and MISR AOD annually averaged, for tropical forest (green), savanna (blue) and grassland (red). Symbols represent the annual average and bars the standard error of the mean. Regression lines are weighted by the number of plumes in each year; relationships with absolute r<0.4 are plotted in dashed lines. Also included is the percentage of smoke plumes in the FT in each biome and by drought condition. Bar plots indicate the average of (median plume − PBL height) > 0.5 km (light colour) and (maximum plume − PBL height) > 0.25 km (dark colour), based on MERRA-2 PBL heights (see text for explanation).
Table 3Summary of the main atmospheric parameters calculated at the location of the plumes per yeara.
a Reported the average ± SD. b Drought years. c Reported as percentage of plumes where (median plume − PBL height) > 0.5 km and maximum plume–BL height > 0.25 km (see text for explanation).
We find a significant positive relationship between MISR maximum plume heights and MODIS DSI (r=0.7; p<0.01) in tropical forest and savanna fires, with higher maximum plume heights in normal and/or wetter-than-normal (1000–1100 m) severe drought conditions (750–900 m) (Fig. 8). Consistently, on an annual basis, these two biomes show the lowest smoke plume heights during dry years (Fig. S4 in the Supplement). Smoke plume heights in grassland fires, however, do not show any strong relationship with DSI (r=0.1) or clear interannual variability driven by droughts (Fig. S4). In general, lowest median smoke heights are observed in our dataset during the drought years of 2005 and 2010 (Fig. 7), which are driven by tropical forest observations as it is the dominant biome (Fig. S1).
The relationship between MODIS FRP and drought levels over the Amazon is not straightforward on an annual basis as we do not observe any clear interannual variability of FRP driven by drought in Fig. 7. However, our analysis shows some patterns when we subdivide the data by biome (Figs. 8 and S4 in the Supplement). For example, we find a significant positive relationship between MODIS FRP and DSI (r=0.6; p<0.01) in tropical forest, with lower FRP in extreme dry than normal–wet conditions (170 vs. ∼250 MW; Fig. 8). Contrariwise, savanna and grassland fires have higher FRP in extreme and mild dry than in wet conditions (∼500 vs. 250 MW), although the relationship is weak (; p<0.01). As mentioned above, interpretation of FRP can be complicated by factors such as overlying smoke opacity and fire emissivity (Kahn et al., 2008).
The relationship between smoke plume height, FRP and drought conditions over the Amazon is somewhat complex. Drought conditions over the Amazon increase fuel flammability and the number of fires, but do not necessarily increase smoke elevation. Drought also decreases fuel load, i.e. fuel available to burn, especially over grassland. Tang and Arellano (2017) reported that drought in the Amazon favours understory fires for tropical forest, which are dominated by smouldering combustion and are linked to low-altitude smoke plumes. In addition, spatial changes in drought location can influence the type of biome affected and hence the type of fire regime in a given year. For example, the drought in 2005 was located at the north-eastern and central regions, and the large majority of the plumes recorded by MISR (65 %; Fig. S1) were from tropical forest fires, i.e. related to smouldering and fires that inject smoke to lower altitudes. In 2007, drought shifted to the south-eastern region, and the majority of the plumes (60 %; Fig. S1) were from savanna and grassland fires associated with more flaming burning conditions, i.e. higher FRP and smoke plume altitudes. Our analysis supports this observation. In 2005, a drought year, the smallest MODIS FRP (150 MW) and lowest smoke plume heights (750 m) were recorded over tropical forest (Fig. 8), whereas in 2007, another drought year, larger FRP (500 and 750 MW) associated with higher smoke plume heights (1100 and 1300 m) was recorded over savanna and grassland fires, respectively.
In addition to the influence of drought in controlling the type of fires, drought can also affect atmospheric conditions. We find that during drought years, PBL heights tend to be about 200 m deeper than in wet years (Table 3). However, on an annual basis, atmospheric stability does not vary significantly, with values of ∼3–4 K km−1, across the Amazon for the averaged biomass-burning season (Table 3). We also observe that a lower percentage of fires inject smoke plumes into the FT in drought compared to non-drought years (2 %–18 % vs. 4 %–28 %; Table 3). On a biome basis, tropical forest fires inject a larger percentage of smoke plumes into the FT in wet than extreme–dry conditions (27 % vs. 12 %, Fig. 8), and shallower PBL heights may partially explain the larger percentage of MISR plumes detected in the FT during non-drought years. Contrariwise, grassland fires, although with fewer observations, inject more smoke plumes into the FT during extreme dry than wet conditions (25 % vs. 13 %, Fig. 8). These fires are associated with high FRP values in dry conditions and this extra fire energy may be enough to produce the buoyancy needed to lift smoke directly into the FT, regardless of the PBL height. Note that in Fig. 8 (right bottom), we present the data only subdivided by MODIS DSI and biome, regardless of the year, as in the rest of the panels in Fig. 8.
Consistent with previous studies that have shown significant positive relationships between drought conditions and aerosol loading (e.g. Reddington et al., 2015; Tang and Arellano, 2017), we find a significant relationship between MISR AOD and MODIS DSI on an annual basis in tropical forest and savanna fires ( and p<0.01; Fig. 8). Years with drier conditions have almost a factor of 3 greater AOD compared with years with wet conditions. Larger aerosol loading in drought periods is likely due to increases in the number and size of fires (e.g. Aragao et al., 2014) and subsequent increases in aerosol emissions. In addition, MISR AOD shows significant interannual variability, with the largest AOD values recorded in 2005, 2007 and 2010 (0.4–0.6; Fig. 7), and in particular over tropical forest fires (0.6, Fig. S4 in the Supplement). Our results suggest that fires during drought periods might significantly degrade regional air quality, as they are associated with low smoke altitude and high aerosol loading.
3.5 CALIOP smoke plume observations
To further investigate smoke rise over the Amazon, we develop a climatology of smoke plume heights using CALIOP extinction profiles (Sect. 2.6). We identify a total of 1600 CALIOP smoke plumes linked to active fires from July to November 2006–2012 (Fig. S5 in the Supplement). Although the CALIOP climatology is one-third of the size of the MISR climatology, these datasets agree well with respect to the temporal and spatial distributions. Similarly to MISR, the largest number of plumes correspond to the years 2007 and 2010 (22 % and 29 %), whereas the lowest records are in 2009 and 2011 (4 % and 7 %). Most of the CALIOP plumes are also recorded at the peak of the biomass-burning season (September; 51 %) and over savanna and tropical forest (37 % and 57 %, respectively) compared to grassland.
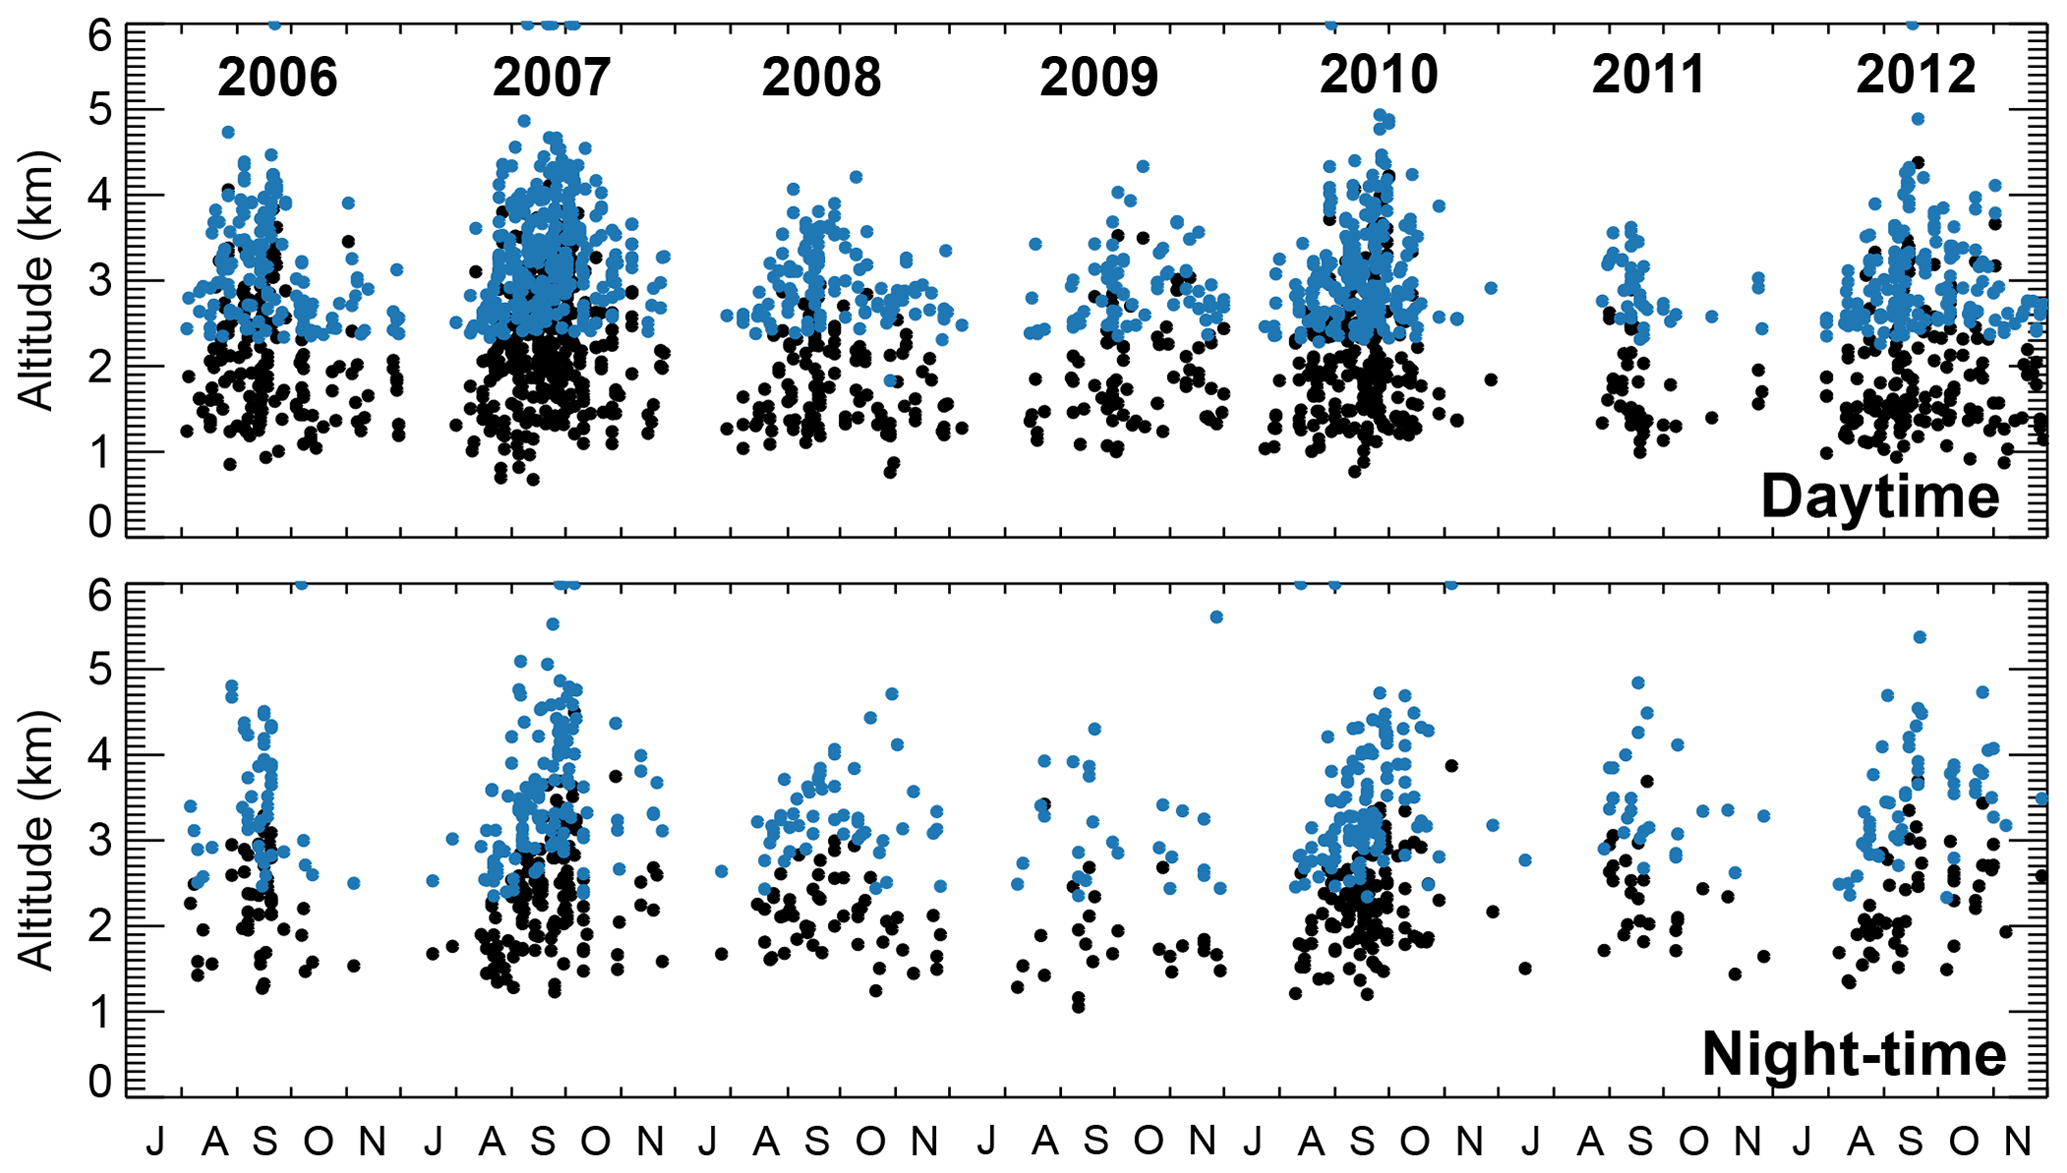
Figure 9Time series of the CALIOP smoke plumes (2006–2012) for daytime and nighttime observations. Each dot represents the maximum (blue) and median (black) smoke plume height above the terrain. Eighteen points for which the CALIOP height exceeds 6 km are plotted at the top of the charts.
Figure 9 displays the time series of derived median and maximum heights, for daytime and night-time observations. We include both daytime and night-time CALIOP observations to assess any day–night differences in smoke plume rise. Similarly to the MISR climatology, we find large variability in the CALIOP smoke plume heights; the median heights range from 0.8 to 4.4 km (daytime) and 1.1 to 4.5 km (night-time). Maximum smoke plume heights are obviously higher, typically spanning 1.8–5 km (daytime) and 2.4–5.8 km (night-time). About 18 maximum plume height observations fell above 6 km (shown saturated at 6 km in Fig. 9). Here we examine the vertical distribution of aerosol plumes individually. Ten cases show high-altitude smoke (>6 km) in a layer that extends through the column to near-surface (Fig. S6 in the Supplement, right panel), implying that smoke from the active fire below was lifted by fire-induced buoyancy, atmospheric processes and/or both. The remaining cases show that high-altitude smoke was disconnected from the surface smoke layer (Fig. S6, left panel), and we suggest that this smoke could be residual smoke from older fires, smoke transported from the source and concentrated in an elevated layer, aerosol that was wrongly classified as smoke by the CALIOP algorithm, and/or the result of CALIOP not being able to detect lower-level aerosol due to thick smoke aloft or the presence of clouds in the column. We include these observations in our analysis, but note that they represent only 1 % of the total observations within the climatology and do not significantly impact the overall statistics shown here.

Figure 10Average CALIOP and MISR plume heights per biome, time of the season and dry or wet years. The burning season is divided into early (July–August–September) and later (October–November) periods, and dry years (2007, 2010) and wet years (2006, 2008, 2009, 2011). Bars represent MISR plume heights (grey) and combined daytime and night-time CALIOP plume heights (red).
Figure 10 summarises the median and maximum heights for the CALIOP smoke plumes per biome, season and wet or dry years. Night-time plume heights are on average ∼ 250 m higher than daytime plume heights (Fig. 9). Differences between daytime and night-time CALIOP observations have been attributed in the past to a low bias in the daytime retrievals due to noise from scattered solar radiation (e.g. Winker et al., 2009; Huang et al., 2015). Therefore, our observed difference in daytime and night-time CALIOP plume heights might result from differences in data quality rather than reflecting smoke diurnal variability. We combine daytime and night-time CALIOP observations in Fig. 10 and include the MISR plume heights for comparison. Average CALIOP median plume heights range from 2.1 km (tropical forest and savanna) to 2.3 km (grassland). Maximum plume heights are similar across all biomes (∼3.2 km). Similarly to MISR, CALIOP detects higher smoke plumes during the late burning season (2.1 and 3.3 km for the median and maximum plume heights, respectively) than the early season (1.9 and 3.0 km). In contrast, CALIOP observes smoke at higher altitudes during dry (2.2 and 3.4 km) than wet years (2.0 and 3.2 km). As discussed above, for the time and location of the MISR observations, a deeper PBL is observed in dry compared to wet years. Likewise, PBL heights at the CALIOP smoke plumes are 2.4 and 2.6 km in wet and dry years, respectively, and thus a deeper PBL during drought conditions explains the higher altitudes observed by CALIOP under drier conditions.
Smoke plume height values over the Amazon similar to ours were reported in other studies of CALIOP (Huang et al., 2015) and surface-based lidar measurements (Baars et al., 2012). Using the CALIOP vertical feature mask and AOD profiles, Huang et al. (2015) reported an average for the most probable smoke height of 1.6–2.5 km for September fires. Their definition is comparable to our CALIOP median plume height, which produced a value of 2.3±0.7 km for the September months. Over Manaus in 2008, Baars et al. (2012) reported biomass-burning layers at 3–5 km elevation, with most of the smoke trapped below 2 km. Other CALIOP smoke plume heights have been reported over eastern Europe (1.7–6 km) and several regions and biomes across Asia (0.8–5.3 km)(Amiridis et al., 2010; Labonne et al., 2007; Tosca et al., 2011; Vadrevu et al., 2015).
In our study, CALIOP observes smoke at systematically higher altitudes than MISR, with median plume heights up to 1.4 km higher (2.2 km for the maximum plume heights). However, CALIOP still shows that the majority of the smoke is located at altitudes below 2.5 km above ground, consistent with previous observations from lidar measurements (Baars et al., 2012). Differences between MISR and CALIOP smoke plume heights are consistent with deeper PBL heights at the time of the CALIOP observation, as PBL is expected to grow further later in the day, and fires might also increase in intensity. We find that PBL height at the location and time of the CALIOP daytime smoke plumes is on average about 1.4 km higher than for MISR smoke plumes, specifically 2.7 km for CALIOP and 1.3 km for MISR.
Tosca et al. (2011) found similar differences between CALIOP and MISR (1–2.8 km) in peatland fires over south-eastern Asia. In addition, CALIOP height retrievals are more sensitive to thin aerosol layers than MISR stereo analysis, so CALIOP is more likely to detect low-density smoke at the plume top (Kahn et al., 2008): this would include smoke that might have been lifted later in the day by convection, air mass advection or fire buoyancy (Kahn et al., 2008; Tosca et al., 2011). Although we only select CALIOP plumes that are directly linked to active fires with some confidence, fires can burn for several days (and even weeks); in particular, deforestation fires can leave residual smoke layers over the region for many days or even weeks. As such, our CALIOP plume heights may include low-density smoke at higher altitudes, possibly from old fires.
Some previous studies with MISR smoke plume height have also analysed the altitude of smoke clouds, that is, dispersed smoke not easily associated with a particular fire (Val Martin et al., 2010; Tosca et al., 2011). Smoke clouds tend to occur at higher altitudes than smoke plumes; they typically represent fire plumes at a later stage of evolution. Over Borneo peatland fires, Tosca et al. (2011) show that MISR smoke clouds and CALIOP smoke plumes had similar altitudes during their period of study. The analysis of smoke clouds over the Amazon may support the expectation that plume heights tend to grow even larger than observed by MISR later in the afternoon. In addition, transported smoke is more likely to have stayed aloft longer than near-source smoke and would therefore have more opportunity to mix upward.
A climatology of smoke plumes from MISR and CALIOP observations is used to characterise the magnitude and variability of smoke altitude across the Amazon during eight biomass-burning seasons. Biome type, fire and smoke properties (FRP and AOD), atmospheric conditions (PBL height and atmospheric stability) and regional drought state are included in the analysis to explore the degree to which each contributes to the observed variability.
Analysis of the smoke plume climatology shows large differences in smoke-plume elevation over the main biomes in the Amazon, with heights ranging a few hundred metres to 5.2 km above ground level. Smoke from plumes observed by MISR (10:00–11:00 LT) is mainly concentrated at altitudes below 1.5 km. As expected, smoke plume elevations are higher in our CALIOP climatology, ranging from 0.8 to 6 km during the daytime (14:00–15:00 LT), although the majority are concentrated below 2.5 km. We find that CALIOP smoke plume heights are about 1.4–2.2 km higher than MISR smoke plumes due to a deeper PBL later in the day, possibly more energetic afternoon fires and CALIOP's greater sensitivity to very thin aerosol layers (Kahn et al., 2008; Flower and Kahn, 2017). Thus, our CALIOP plume climatology includes fresh smoke from active fires and low-density smoke at higher altitudes, some of which might be from old fires. Our results show that over the Amazon, and similarly to other fire regions studied previously, on average, smoke plume heights tend to increase later in the afternoon due to greater near-surface convection, greater fire intensity and possibly self-lofting. Direct injection of smoke to altitudes higher than 6 km (middle-to-upper troposphere) did not seem to be significant over the Amazon during our study period.
For our main biomes in the Amazon, smoke plume heights are substantially lower over moist tropical forest fires (0.8 km, maximum plume height definition) than grassland fires (1.1 km), although grassland fire smoke plumes represent a small fraction (4 %) of cases in the climatology. The MISR and CALIOP Amazon plume climatologies show a well-defined plume height seasonal cycle in the main biomes, with larger heights toward the end of the burning season. Using MODIS FRP and MERRA-2-estimated atmospheric stability conditions, we determine that higher smoke-plume elevations in October–November are the result of the combination of more intense fires and a less stable atmosphere. Less than 5 % of the fires inject smoke into the FT (i.e. median plume–PBL height > 500 m) using a conservative criterion, although an additional 15–19 % of the fires may inject some smoke based on a looser criterion (i.e. maximum plume–PBL height >250 m). This fraction increases throughout the burning season, with about 15 %–40 % of the fires injecting smoke above the FT in November.
Previous studies have shown a direct connection between drought, large-scale climate processes (e.g. ENSO) and the number of fire occurrences (e.g. Alencar et al., 2006; Inness et al., 2015). We find a negative relationship between MISR plume heights and drought conditions in tropical forest fires, as wet years show smoke plume altitudes 300 m higher than dry years. Tang and Arellano (2017) reported that drought conditions over the Amazon favour understory fires, for which smouldering combustion dominates, favouring lower smoke injection heights. In addition to low-altitude smoke, we find that drought conditions are also related to deeper PBL heights, which can reduce the frequency with which smoke is able to reach the FT.
A relationship between fire intensity (as approximated by FRP) and drought conditions is not clear in our study. We detect the highest FRP values in grassland fires during dry periods and the lowest FRP values for tropical forest fires under similar dry conditions but without a significant relationship between FRP and DSI, nor any interannual variability of FRP driven by droughts. This lack of relationship may be due to the different locations of drought in different years, the types of fire recorded by MISR in a given year, and/or the low performance of MODIS FRP under dense smoke conditions.
Consistent with previous observations, we find larger MISR AOD during drought compared to non-drought periods. Our analysis confirms the important effect that biomass burning has on smoke aerosol loading over the region, from the surface to the lower free troposphere. Strong land management policies that control fires over the Amazon may become crucial as increases in drought frequency are projected in a future climate (Malhi et al., 2008); this would have important consequences for fire activity and thus air quality.
A variety of smoke injection height schemes are used to represent fire emissions over the Amazon, from fire emissions injected below 3 km (Reddington et al., 2016) or into the model-defined PBL (Zhu et al., 2018) to complex plume-rise models, in which a significant fraction of emissions are in some conditions injected above 6 km (Freitas et al., 2007). Recent efforts have shown the value of using MISR-derived smoke plume heights to initialise model fire emission injection (Vernon et al., 2018; Zhu et al., 2018). Over the Amazon, Zhu et al. (2018) show that a new injection scheme based on MISR plume-height observations, which included vertical smoke profiles used in this study (Val Martin et al., 2018), provide a better representation of CO observations over the region. With a very narrow swath but sensitivity to subvisible aerosol, CALIOP tends to sample aerosol layers downwind, providing information complementary to the near-source mapping offered by MISR (Kahn et al., 2008). Thus, observations from both CALIOP and MISR provide a way to study smoke plume heights across the Amazon during the biomass-burning season. Ultimately, this information will help improve the representation of biomass burning emissions in Earth system atmospheric models and should aid our understanding of the feedbacks between drought, terrestrial ecosystems and atmospheric composition over the region.
A next step in our work includes the evaluation of the influence of smoke plume height on the atmospheric composition over the Southern Hemisphere based on insights from the analysis of the smoke plume climatology across the Amazon and further application of this approach to other geographic regions.
The MISR plume height climatology has been submitted to NASA JPL and will be available within the MISR Plume Height Project (https://misr.jpl.nasa.gov/getData/accessData/MisrMinxPlumes2 (last access: 4 February 2019) or can be directly requested from the principal investigator, Maria Val Martin (m.valmartin@sheffield.ac.uk). MINX software is available at the NASA GitHub (https://github.com/nasa/MINX, last access: 4 February 2019).
The supplement related to this article is available online at: https://doi.org/10.5194/acp-19-1685-2019-supplement.
LGA carried out the study, analysed the data and drafted the paper. MVM was the principal investigator of this study and supervised LGA's analysis and writing. RAK contributed to the interpretation of results and advised on writing the paper.
The authors declare that they have no conflict of interest.
This work is supported by the NASA award number NNX14AN47G. Laura
Gonzalez-Alonso's PhD programme was supported by the UK EPSRC and The University
of Sheffield Chemical and Biological Engineering Department. Maria Val Martin
was partially supported by the Leverhulme Trust through a Leverhulme Research
Centre Award (RC-2015-029). The work of Ralph A. Kahn is supported in part by NASA
Climate and Radiation Research and Analysis Programme under Hal Maring, the
NASA Atmospheric Composition Modeling and Analysis Programme under Richard
Eckman, and the NASA Earth Observing System MISR project. We thank the
University of Sheffield OnCampus Placement Programme for funding two summer
students who contributed to the digitising effort.
Edited by: Yafang Cheng
Reviewed by: three anonymous referees
Alencar, A., Nepstad, D., and Diaz, M. C. V.: Forest understory fire in the Brazilian Amazon in ENSO and non-ENSO years: area burned and committed carbon emissions, Earth Interact., 10, 1–17, 2006. a
Alencar, A., Asner, G. P., Knapp, D., and Zarin, D.: Temporal variability of forest fires in eastern Amazonia, Ecol. Appl., 21, 2397–2412, 2011. a
Allan, J. D., Morgan, W. T., Darbyshire, E., Flynn, M. J., Williams, P. I., Oram, D. E., Artaxo, P., Brito, J., Lee, J. D., and Coe, H.: Airborne observations of IEPOX-derived isoprene SOA in the Amazon during SAMBBA, Atmos. Chem. Phys., 14, 11393–11407, https://doi.org/10.5194/acp-14-11393-2014, 2014. a
Amiridis, V., Giannakaki, E., Balis, D. S., Gerasopoulos, E., Pytharoulis, I., Zanis, P., Kazadzis, S., Melas, D., and Zerefos, C.: Smoke injection heights from agricultural burning in Eastern Europe as seen by CALIPSO, Atmos. Chem. Phys., 10, 11567–11576, https://doi.org/10.5194/acp-10-11567-2010, 2010. a, b, c, d, e
Andreae, M. O., Artaxo, P., Beck, V., Bela, M., Freitas, S., Gerbig, C., Longo, K., Munger, J. W., Wiedemann, K. T., and Wofsy, S. C.: Carbon monoxide and related trace gases and aerosols over the Amazon Basin during the wet and dry seasons, Atmos. Chem. Phys., 12, 6041–6065, https://doi.org/10.5194/acp-12-6041-2012, 2012. a
Andreae, M. O. and Merlet, P.: Emission of trace gases and aerosols from biomass burning, Global Biogeochem. Cy., 15, 955–966, 2001. a
Aragao, L. E., Poulter, B., Barlow, J. B., Anderson, L. O., Malhi, Y., Saatchi, S., Phillips, O. L., and Gloor, E.: Environmental change and the carbon balance of Amazonian forests, Biol. Rev., 89, 913–931, 2014. a, b
Archer-Nicholls, S., Lowe, D., Darbyshire, E., Morgan, W. T., Bela, M. M., Pereira, G., Trembath, J., Kaiser, J. W., Longo, K. M., Freitas, S. R., Coe, H., and McFiggans, G.: Characterising Brazilian biomass burning emissions using WRF-Chem with MOSAIC sectional aerosol, Geosci. Model Dev., 8, 549–577, https://doi.org/10.5194/gmd-8-549-2015, 2015. a, b
Baars, H., Ansmann, A., Althausen, D., Engelmann, R., Heese, B., Müller, D., Artaxo, P., Paixao, M., Pauliquevis, T., and Souza, R.: Aerosol profiling with lidar in the Amazon Basin during the wet and dry season, J. Geophys. Res.-Atmos., 117, https://doi.org/10.1289/ehp.1104422, 2012. a, b, c, d, e
Bosilovich, M., Lucchesi, R., and Suarez, M.: MERRA-2: File specification, 2015. a
Chen, Y., Randerson, J. T., Morton, D. C., DeFries, R. S., Collatz, G. J., Kasibhatla, P. S., Giglio, L., Jin, Y., and Marlier, M. E.: Forecasting fire season severity in South America using sea surface temperature anomalies, Science, 334, 787–791, 2011. a
Cochrane, M. A.: Fire science for rainforests, Nature, 421, 913–919, 2003. a
Diner, D. J., Beckert, J. C., Reilly, T. H., Bruegge, C. J., Conel, J. E., Kahn, R. A., Martonchik, J. V., Ackerman, T. P., Davies, R., Gerstl, S. A., Gordon, H. R., Muller, J.-P. , Myneni, R. B., Sellers, P. J., Pinty, B., and Verstraete, M. M.: Multi-angle Imaging SpectroRadiometer (MISR) instrument description and experiment overview, IEEE T. Geosci. Remote, 36, 1072–1087, 1998. a, b
Fisch, G., Tota, J., Machado, L., Silva Dias, M. D., da F. Lyra, R., Nobre, C., Dolman, A., and Gash, J.: The convective boundary layer over pasture and forest in Amazonia, Theor. Appl. Climatol., 78, 47–59, 2004. a
Flower, V. J. and Kahn, R. A.: Assessing the altitude and dispersion of volcanic plumes using MISR multi-angle imaging from space: Sixteen years of volcanic activity in the Kamchatka Peninsula, Russia, J. Volcanol. Geoth. Res., 337, 1–15, 2017. a, b
Ford, B. and Heald, C. L.: An A-train and model perspective on the vertical distribution of aerosols and CO in the Northern Hemisphere, J. Geophys. Res.-Atmos., 117, https://doi.org/10.1029/2011JD016977, 2012. a
Freitas, S. R., Longo, K. M., Chatfield, R., Latham, D., Silva Dias, M. A. F., Andreae, M. O., Prins, E., Santos, J. C., Gielow, R., and Carvalho Jr., J. A.: Including the sub-grid scale plume rise of vegetation fires in low resolution atmospheric transport models, Atmos. Chem. Phys., 7, 3385–3398, https://doi.org/10.5194/acp-7-3385-2007, 2007. a, b
Friedl, M., Zhang, X., and Strahler, A.: Characterizing global land cover type and seasonal land cover dynamics at moderate spatial resolution with MODIS data, in: Land Remote sensing and global environmental change, 709–724, Springer, New York, 2010. a
Giglio, L., Descloitres, J., Justice, C. O., and Kaufman, Y. J.: An enhanced contextual fire detection algorithm for MODIS, Remote Sens. Environ., 87, 273–282, 2003. a, b
Giglio, L., van der Werf, G. R., Randerson, J. T., Collatz, G. J., and Kasibhatla, P.: Global estimation of burned area using MODIS active fire observations, Atmos. Chem. Phys., 6, 957–974, https://doi.org/10.5194/acp-6-957-2006, 2006. a
Gonzi, S. and Palmer, P. I.: Vertical transport of surface fire emissions observed from space, J. Geophys. Res.-Atmos., 115, https://doi.org/10.1029/2009JD012053, 2010. a, b
Guan, H., Esswein, R., Lopez, J., Bergstrom, R., Warnock, A., Follette-Cook, M., Fromm, M., and Iraci, L. T.: A multi-decadal history of biomass burning plume heights identified using aerosol index measurements, Atmos. Chem. Phys., 10, 6461–6469, https://doi.org/10.5194/acp-10-6461-2010, 2010. a
Huang, J., Guo, J., Wang, F., Liu, Z., Jeong, M.-J., Yu, H., and Zhang, Z.: CALIPSO inferred most probable heights of global dust and smoke layers, J. Geophys. Res.-Atmos., 120, 5085–5100, 2015. a, b, c, d, e, f, g
Huete, A., Didan, K., Miura, T., Rodriguez, E. P., Gao, X., and Ferreira, L. G.: Overview of the radiometric and biophysical performance of the MODIS vegetation indices, Remote Sens. Environ., 83, 195–213, 2002. a
Inness, A., Benedetti, A., Flemming, J., Huijnen, V., Kaiser, J. W., Parrington, M., and Remy, S.: The ENSO signal in atmospheric composition fields: emission-driven versus dynamically induced changes, Atmos. Chem. Phys., 15, 9083–9097, https://doi.org/10.5194/acp-15-9083-2015, 2015. a
Itterly, K. F., Taylor, P. C., Dodson, J. B., and Tawfik, A. B.: On the sensitivity of the diurnal cycle in the Amazon to convective intensity, J. Geophys. Res.-Atmos., 121, 8186–8208, 2016. a
Jian, Y. and Fu, T.-M.: Injection heights of springtime biomass-burning plumes over peninsular Southeast Asia and their impacts on long-range pollutant transport, Atmos. Chem. Phys., 14, 3977–3989, https://doi.org/10.5194/acp-14-3977-2014, 2014. a, b, c
Johnston, F. H., Henderson, S. B., Chen, Y., Randerson, J. T., Marlier, M., DeFries, R. S., Kinney, P., Bowman, D. M., and Brauer, M.: Estimated global mortality attributable to smoke from landscape fires, Environ. Health Perspect., 120, 695, https://doi.org/10.1289/ehp.1104422, 2012. a
Kahn, R. A. and Gaitley, B. J.: An analysis of global aerosol type as retrieved by MISR, J. Geophys. Res.-Atmos., 120, 4248–4281, 2015. a
Kahn, R. A., Li, W.-H., Moroney, C., Diner, D. J., Martonchik, J. V., and Fishbein, E.: Aerosol source plume physical characteristics from space-based multiangle imaging, J. Geophys. Res.-Atmos., 112, https://doi.org/10.1029/2006JD007647, 2007. a, b, c, d, e, f
Kahn, R. A., Chen, Y., Nelson, D. L., Leung, F.-Y., Li, Q., Diner, D. J., and Logan, J. A.: Wildfire smoke injection heights: Two perspectives from space, Geophys. Res. Lett., 35, https://doi.org/10.1029/2007GL032165, 2008. a, b, c, d, e, f, g, h, i, j, k, l, m, n, o, p
Kauffman, J. B., Cummings, D., Ward, D., and Babbitt, R.: Fire in the Brazilian Amazon: 1. Biomass, nutrient pools, and losses in slashed primary forests, Oecologia, 104, 397–408, 1995. a
Kolusu, S. R., Marsham, J. H., Mulcahy, J., Johnson, B., Dunning, C., Bush, M., and Spracklen, D. V.: Impacts of Amazonia biomass burning aerosols assessed from short-range weather forecasts, Atmos. Chem. Phys., 15, 12251–12266, https://doi.org/10.5194/acp-15-12251-2015, 2015. a
Labonne, M., Bréon, F.-M., and Chevallier, F.: Injection height of biomass burning aerosols as seen from a spaceborne lidar, Geophys. Res. Lett., 34, https://doi.org/10.1029/2007GL029311, 2007. a, b
Lavoué, D., Liousse, C., Cachier, H., Stocks, B. J., and Goldammer, J. G.: Modeling of carbonaceous particles emitted by boreal and temperate wildfires at northern latitudes, J. Geophys. Res.-Atmos., 105, 26871–26890, 2000. a
Liu, Z., Vaughan, M., Winker, D., Kittaka, C., Getzewich, B., Kuehn, R., Omar, A., Powell, K., Trepte, C., and Hostetler, C.: The CALIPSO lidar cloud and aerosol discrimination: Version 2 algorithm and initial assessment of performance, J. Atmos. Ocean. Tech., 26, 1198–1213, 2009. a
Luderer, G., Trentmann, J., Winterrath, T., Textor, C., Herzog, M., Graf, H. F., and Andreae, M. O.: Modeling of biomass smoke injection into the lower stratosphere by a large forest fire (Part II): sensitivity studies, Atmos. Chem. Phys., 6, 5261–5277, https://doi.org/10.5194/acp-6-5261-2006, 2006. a
Malhi, Y., Roberts, J. T., Betts, R. A., Killeen, T. J., Li, W., and Nobre, C. A.: Climate change, deforestation, and the fate of the Amazon, Science, 319, 169–172, 2008. a, b
Marenco, F., Johnson, B., Langridge, J. M., Mulcahy, J., Benedetti, A., Remy, S., Jones, L., Szpek, K., Haywood, J., Longo, K., and Artaxo, P.: On the vertical distribution of smoke in the Amazonian atmosphere during the dry season, Atmos. Chem. Phys., 16, 2155–2174, https://doi.org/10.5194/acp-16-2155-2016, 2016. a
Marengo, J. A., Alves, L. M., Soares, W. R., Rodriguez, D. A., Camargo, H., Riveros, M. P., and Pabló, A. D.: Two contrasting severe seasonal extremes in tropical South America in 2012: flood in Amazonia and drought in northeast Brazil, J. Climate, 26, 9137–9154, 2013. a
Martin, S. T., Artaxo, P., Machado, L. A. T., Manzi, A. O., Souza, R. A. F., Schumacher, C., Wang, J., Andreae, M. O., Barbosa, H. M. J., Fan, J., Fisch, G., Goldstein, A. H., Guenther, A., Jimenez, J. L., Pöschl, U., Silva Dias, M. A., Smith, J. N., and Wendisch, M.: Introduction: Observations and Modeling of the Green Ocean Amazon (GoAmazon2014/5), Atmos. Chem. Phys., 16, 4785–4797, https://doi.org/10.5194/acp-16-4785-2016, 2016. a
Martonchik, J. V., Kahn, R. A., and Diner, D. J.: Retrieval of aerosol properties over land using MISR observations, in: Satellite Aerosol Remote Sensing Over Land, pp. 267–293, Springer, Berlin, Heidelberg, 2009. a
Mims, S. R., Kahn, R. A., Moroney, C. M., Gaitley, B. J., Nelson, D. L., and Garay, M. J.: MISR stereo heights of grassland fire smoke plumes in Australia, IEEE T. Geosci. Remote, 48, 25–35, 2010. a
Mishra, A. K., Lehahn, Y., Rudich, Y., and Koren, I.: Co-variability of smoke and fire in the Amazon Basin, Atmos. Environ., 109, 97–104, 2015. a
Moroney, C., Davies, R., and Muller, J.-P.: Operational retrieval of cloud-top heights using MISR data, IEEE T. Geosci. Remote, 40, 1532–1540, 2002. a
Mu, Q., Heinsch, F. A., Zhao, M., and Running, S. W.: Development of a global evapotranspiration algorithm based on MODIS and global meteorology data, Remote Sens. Environ., 111, 519–536, 2007. a
Mu, Q., Zhao, M., and Running, S. W.: MODIS Global Terrestrial Evapotranspiration (ET) Product (NASA MOD16A2/A3), Algorithm Theoretical Basis Document, Collection, 5, 2013. a, b
Muller, J.-P., Mandanayake, A., Moroney, C., Davies, R., Diner, D. J., and Paradise, S.: MISR stereoscopic image matchers: Techniques and results, IEEE T. Geosci. Remote, 40, 1547–1559, 2002. a
Nelson, D. L., Garay, M. J., Kahn, R. A., and Dunst, B. A.: Stereoscopic height and wind retrievals for aerosol plumes with the MISR INteractive eXplorer (MINX), Remote Sensing, 5, 4593–4628, 2013. a, b, c, d, e, f, g, h
Nepstad, D., Schwartzman, S., Bamberger, B., Santilli, M., Ray, D., Schlesinger, P., Lefebvre, P., Alencar, A., Prinz, E., Fiske, G., and Rolla, A.: Inhibition of Amazon deforestation and fire by parks and indigenous lands, Conserv. Biol., 20, 65–73, 2006. a, b
Nepstad, D. C., Stickler, C. M., Soares-Filho, B., and Merry, F.: Interactions among Amazon land use, forests and climate: prospects for a near-term forest tipping point, Philos. T. R. Soc. B., 363, 1737–1746, 2008. a
Omar, A. H., Winker, D. M., Vaughan, M. A., Hu, Y., Trepte, C. R., Ferrare, R. A., Lee, K.-P., Hostetler, C. A., Kittaka, C., Rogers, R. R., and Kuehn R. E.: The CALIPSO automated aerosol classification and lidar ratio selection algorithm, J. Atmos. Ocean. Tech., 26, 1994–2014, 2009. a
Pacifico, F., Folberth, G. A., Sitch, S., Haywood, J. M., Rizzo, L. V., Malavelle, F. F., and Artaxo, P.: Biomass burning related ozone damage on vegetation over the Amazon forest: a model sensitivity study, Atmos. Chem. Phys., 15, 2791–2804, https://doi.org/10.5194/acp-15-2791-2015, 2015. a, b
Paugam, R., Wooster, M., Freitas, S., and Val Martin, M.: A review of approaches to estimate wildfire plume injection height within large-scale atmospheric chemical transport models, Atmos. Chem. Phys., 16, 907–925, https://doi.org/10.5194/acp-16-907-2016, 2016. a
Ramanathan, V., Crutzen, P., Kiehl, J., and Rosenfeld, D.: Aerosols, climate, and the hydrological cycle, Science, 294, 2119–2124, 2001. a
Reddington, C., Butt, E., Ridley, D., Artaxo, P., Morgan, W., Coe, H., and Spracklen, D.: Air quality and human health improvements from reductions in deforestation-related fire in Brazil, Nat. Geosci., 8, 768–771, 2015. a, b
Reddington, C. L., Spracklen, D. V., Artaxo, P., Ridley, D. A., Rizzo, L. V., and Arana, A.: Analysis of particulate emissions from tropical biomass burning using a global aerosol model and long-term surface observations, Atmos. Chem. Phys., 16, 11083–11106, https://doi.org/10.5194/acp-16-11083-2016, 2016. a
Rogers, R. R., Hostetler, C. A., Hair, J. W., Ferrare, R. A., Liu, Z., Obland, M. D., Harper, D. B., Cook, A. L., Powell, K. A., Vaughan, M. A., and Winker, D. M.: Assessment of the CALIPSO Lidar 532 nm attenuated backscatter calibration using the NASA LaRC airborne High Spectral Resolution Lidar, Atmos. Chem. Phys., 11, 1295–1311, https://doi.org/10.5194/acp-11-1295-2011, 2011. a
Sofiev, M., Vankevich, R., Lotjonen, M., Prank, M., Petukhov, V., Ermakova, T., Koskinen, J., and Kukkonen, J.: An operational system for the assimilation of the satellite information on wild-land fires for the needs of air quality modelling and forecasting, Atmos. Chem. Phys., 9, 6833–6847, https://doi.org/10.5194/acp-9-6833-2009, 2009. a
Sofiev, M., Vankevich, R., Ermakova, T., and Hakkarainen, J.: Global mapping of maximum emission heights and resulting vertical profiles of wildfire emissions, Atmos. Chem. Phys., 13, 7039–7052, https://doi.org/10.5194/acp-13-7039-2013, 2013. a
Tang, W. and Arellano, A.: Investigating dominant characteristics of fires across the Amazon during 2005–2014 through satellite data synthesis of combustion signatures, J. Geophys. Res.-Atmos., 122, 1224–1245, 2017. a, b, c, d
Thornhill, G. D., Ryder, C. L., Highwood, E. J., Shaffrey, L. C., and Johnson, B. T.: The effect of South American biomass burning aerosol emissions on the regional climate, Atmos. Chem. Phys., 18, 5321–5342, https://doi.org/10.5194/acp-18-5321-2018, 2018. a
Tosca, M., Randerson, J., Zender, C., Nelson, D., Diner, D., and Logan, J.: Dynamics of fire plumes and smoke clouds associated with peat and deforestation fires in Indonesia, J. Geophys. Res.-Atmos., 116, https://doi.org/10.1029/2010JD015148, 2011. a, b, c, d, e, f, g, h, i, j, k, l, m
Trentmann, J., Luderer, G., Winterrath, T., Fromm, M. D., Servranckx, R., Textor, C., Herzog, M., Graf, H.-F., and Andreae, M. O.: Modeling of biomass smoke injection into the lower stratosphere by a large forest fire (Part I): reference simulation, Atmos. Chem. Phys., 6, 5247–5260, https://doi.org/10.5194/acp-6-5247-2006, 2006. a
Vadrevu, K. P., Lasko, K., Giglio, L., and Justice, C.: Vegetation fires, absorbing aerosols and smoke plume characteristics in diverse biomass burning regions of Asia, Environ. Res. Lett., 10, 105003, https://doi.org/10.1088/1748-9326/10/10/105003, 2015. a
Val Martin, M., Logan, J. A., Kahn, R. A., Leung, F.-Y., Nelson, D. L., and Diner, D. J.: Smoke injection heights from fires in North America: analysis of 5 years of satellite observations, Atmos. Chem. Phys., 10, 1491–1510, https://doi.org/10.5194/acp-10-1491-2010, 2010. a, b, c, d, e, f, g, h, i, j, k, l, m, n
Val Martin, M., Kahn, R. A., Logan, J. A., Paugam, R., Wooster, M., and Ichoku, C.: Space-based observational constraints for 1-D fire smoke plume-rise models, J. Geophys. Res.-Atmos., 117, https://doi.org/10.1029/2012JD018370, 2012. a, b, c, d
Val Martin, M., Kahn, R., and Tosca, M.: A Global Analysis of Wildfire Smoke Injection Heights Derived from Space-Based Multi-Angle Imaging, Remote Sens., 10, 1609, https://doi.org/10.3390/rs10101609, 2018. a, b, c
van der Werf, G. R., Randerson, J. T., Giglio, L., Collatz, G. J., Mu, M., Kasibhatla, P. S., Morton, D. C., DeFries, R. S., Jin, Y., and van Leeuwen, T. T.: Global fire emissions and the contribution of deforestation, savanna, forest, agricultural, and peat fires (1997–2009), Atmos. Chem. Phys., 10, 11707–11735, https://doi.org/10.5194/acp-10-11707-2010, 2010. a, b, c
Vaughan, M. A., Young, S. A., Winker, D. M., Powell, K. A., Omar, A. H., Liu, Z., Hu, Y., and Hostetler, C. A.: Fully automated analysis of space-based lidar data: An overview of the CALIPSO retrieval algorithms and data products, Proc. SPIE, 5575, https://doi.org/10.1117/12.572024, 2004. a
Vernon, C. J., Bolt, R., Canty, T., and Kahn, R. A.: The impact of MISR-derived injection height initialization on wildfire and volcanic plume dispersion in the HYSPLIT model, Atmos. Meas. Tech., 11, 6289–6307, https://doi.org/10.5194/amt-11-6289-2018, 2018. a
Winker, D. M., Tackett, J. L., Getzewich, B. J., Liu, Z., Vaughan, M. A., and Rogers, R. R.: The global 3-D distribution of tropospheric aerosols as characterized by CALIOP, Atmos. Chem. Phys., 13, 3345–3361, https://doi.org/10.5194/acp-13-3345-2013, 2013. a
Winker, D. M., Vaughan, M. A., Omar, A., Hu, Y., Powell, K. A., Liu, Z., Hunt, W. H., and Young, S. A.: Overview of the CALIPSO mission and CALIOP data processing algorithms, J. Atmos. Ocean. Tech., 26, 2310–2323, 2009. a, b
Zhu, L., Val Martin, M., Gatti, L. V., Kahn, R., Hecobian, A., and Fischer, E. V.: Development and implementation of a new biomass burning emissions injection height scheme (BBEIH v1.0) for the GEOS-Chem model (v9-01-01), Geosci. Model Dev., 11, 4103–4116, https://doi.org/10.5194/gmd-11-4103-2018, 2018. a, b, c, d