the Creative Commons Attribution 4.0 License.
the Creative Commons Attribution 4.0 License.
 | 08 Feb 2019
Physical properties of secondary photochemical aerosol from OH oxidation of a cyclic siloxane
Nathan J. Janechek
Rachel F. Marek
Nathan Bryngelson
Ashish Singh
Robert L. Bullard
William H. Brune
Charles O. Stanier
Cyclic volatile methyl siloxanes (cVMS) are high-production chemicals present in many personal care products. They are volatile, hydrophobic, and relatively long-lived due to slow oxidation kinetics. Evidence from chamber and ambient studies indicates that oxidation products may be found in the condensed aerosol phase. In this work, we use an oxidation flow reactor to produce ∼100 µg m−3 of organosilicon aerosol from OH oxidation of decamethylcyclopentasiloxane (D5) with aerosol mass fractions (i.e., yields) of 0.2–0.5. The aerosols were assessed for concentration, size distribution, morphology, sensitivity to seed aerosol, hygroscopicity, volatility and chemical composition through a combination of aerosol size distribution measurement, tandem differential mobility analysis, and electron microscopy. Similar aerosols were produced when vapor from solid antiperspirant was used as the reaction precursor. Aerosol yield was sensitive to chamber OH and to seed aerosol, suggesting sensitivity of lower-volatility species and recovered yields to oxidation conditions and chamber operation. The D5 oxidation aerosol products were relatively non-hygroscopic, with an average hygroscopicity kappa of ∼0.01, and nearly non-volatile up to 190 ∘C temperature. Parameters for exploratory treatment as a semi-volatile organic aerosol in atmospheric models are provided.
- Article
(2917 KB) - Full-text XML
-
Supplement
(1612 KB) - BibTeX
- EndNote


Cyclic volatile methyl siloxanes (cVMS) are high-production chemicals (OECD Environment Directorate, 2004) present in many personal care products such as lotions, hair conditioners, and antiperspirants (Horii and Kannan, 2008; Wang et al., 2009; Lu et al., 2011; Dudzina et al., 2014; Capela et al., 2016). Cyclic siloxanes are volatile (Lei et al., 2010), relatively unreactive, and hydrophobic molecules (Varaprath et al., 1996) composed of a Si–O ring backbone with two methyl groups bonded to each Si. The most prevalent cVMS in personal care products is decamethylcyclopentasiloxane (D5) (Horii and Kannan, 2008; Dudzina et al., 2014; Lu et al., 2011; Wang et al., 2009). Cyclic siloxanes are readily released into the environment, primarily into the atmosphere (Mackay et al., 2015) by personal care product usage (Tang et al., 2015; Gouin et al., 2013; Montemayor et al., 2013; Coggon et al., 2018). Once in the atmosphere, the primary environmental fate for cVMS is oxidation. The principle sink is reaction with the hydroxyl radical (OH) and the characteristic atmospheric lifetime is ∼5–10 days (Atkinson, 1991). Concentration measurements (McLachlan et al., 2010; Genualdi et al., 2011; Yucuis et al., 2013; Ahrens et al., 2014; Companioni-Damas et al., 2014; Tang et al., 2015; Coggon et al., 2018), urban flux measurements (Karl et al., 2018), and modeling studies (McLachlan et al., 2010; MacLeod et al., 2011; Xu and Wania, 2013; Janechek et al., 2017) show cVMS are ubiquitous. Maximum concentrations occur in indoor spaces and automobile cabin air, up to 380 µg m−3 (Coggon et al., 2018), with outdoor urban locations up to 0.65 µg m−3 (Buser et al., 2013).
Cyclic siloxanes have undergone continuing regulatory scrutiny (ECHA, 2018) for environmental impacts such as persistence, bioaccumulation, and toxicity but have entirely focused on the parent (e.g., D5) compounds, and have not considered oxidation products (Environment Canada and Health Canada, 2008a, b, c; Brooke et al., 2009a, b, c; ECHA, 2015). However, numerous studies have reported particle formation from cVMS oxidation, with a direct link in lab studies or inferred in ambient studies (Bzdek et al., 2014). Chamber studies have shown that a range of non-volatile and semi-volatile oxidation products form upon reaction with OH that can form secondary aerosol (Latimer et al., 1998; Sommerlade et al., 1993; Chandramouli and Kamens, 2001; Wu and Johnston, 2016, 2017). Wu and Johnston (2017) studied the molecular composition and formation pathways of aerosol-phase D5 oxidation products at aerosol loadings of 1–12 µg m−3 and identified three main types of species: monomer (substituted D5), dimer, and ring-opened oxidation products.
Janechek et al. (2017) atmospheric modeling at 36 km resolution provided the first spatial distribution and potential loadings of the oxidation products, of which some fraction likely form aerosol species. Peak oxidized D5 (o-D5) occurs downwind of urban areas with a monthly average concentration of 9 ng m−3. Cyclic siloxane oxidation may represent an important source of ambient secondary aerosols with health and climate implications due to potential high loadings and widespread use of the precursor compounds. Personal care products are increasingly recognized as relevant sources of urban air pollution in developed cities (McDonald et al., 2018; Karl et al., 2018), are likely underrepresented in official inventories, and lead to poorly characterized ozone and secondary organic aerosol production.
To improve the community's ability to understand the health and climate impacts of secondary organic silicon particle formation, additional physical and chemical details on the particles are required. In this work, aerosols are produced using an oxidation flow reactor (OFR), which is a photochemical flow-through reactor. OFRs are small (liter-sized) reactors that use very high oxidation conditions to oxidize reactants (Kang et al., 2007, 2011; Lambe et al., 2011a). Advantages of using OFRs include the ability to quickly test a range of aging conditions, reach high oxidant exposures (multi-day exposure) in minutes, and deploy easily for ambient measurements. Additionally, OFRs have been successfully used to generate secondary organic aerosol (SOA) for measurement of hygroscopicity and for the impact of oxidative aging on cloud condensation nuclei (CCN) activity (Lambe et al., 2011a, b; Palm et al., 2018).
In this work, we generated and characterized secondary aerosol from oxidation of D5 and personal care product precursors using an OFR. This study characterized the particles for concentration, size, morphology, and energy-dispersive X-ray spectroscopy elemental composition. Aerosol mass formation (yield) was quantified and sensitivity of precursor concentration, oxidant exposure, residence time, and seed aerosol was studied. Particle hygroscopicity or cloud seed formation potential was characterized by measurement of the hygroscopicity kappa parameter (κ), which is a measure of the particle water uptake (Petters and Kreidenweis, 2007). Additionally, particle volatility was assessed by exposing generated aerosols to high temperatures. Finally, aerosol formation by thermal degradation of the parent compound was explored to account for potential aerosol production after contact of D5 with heated surfaces.
Fifteen experiments were performed (Table S1 in the Supplement) which contained five experiments to test aerosol yield sensitivity to system parameters, an experiment to test sensitivity to seed aerosols, two D5 gas quantification quality control tests, three tests with generation of aerosol from the off-gassing of personal care products, two hygroscopicity measurements, aerosol volatility measurement, and thermal aerosol production of parent D5. The quality control tests were breakthrough testing of D5 on the collection cartridge and verification that photo oxidation was the cause of D5 depletion.
2.1 Aerosol generation and characterization
A 13.3 L potential aerosol mass (PAM) OFR chamber (Kang et al., 2007, 2011; Lambe et al., 2011a) was used to oxidize vapor-phase D5. The OFR was run in the OFR185 mode (Peng et al., 2015) where O3 and OH are generated in situ by photolysis of oxygen and water. The chamber is designed to operate at very high oxidation conditions yet still maintain atmospherically relevant ratios of OH∕O3 and HO2∕OH (Kang et al., 2007). All characterization and sampling were performed on the centerline exhaust, while the 1 or 3 L min−1 ring flow (with more exposure to the reactor wall) was discarded as shown in Fig. 1. Compressed air (3.5 or 5 L min−1) was passed through activated carbon and HEPA filters, and humidified to 25 %–40 % relative humidity (RH) (Sigma-Aldrich Optima or Barnstead Nanopure filtered ultrapure reagent grade water). All experiments were performed under ambient conditions of 22 ∘C, but the chamber was likely warmer (∼24 ∘C, Li et al., 2015) due to the lamps. No temperature correction due to potential OFR heating was employed in this work however. D5 was introduced into the flow by diffusion from a temperature-controlled Teflon tubing leg filled with liquid D5 (Sigma-Aldrich, purity 97 %) controlled using a water bath.
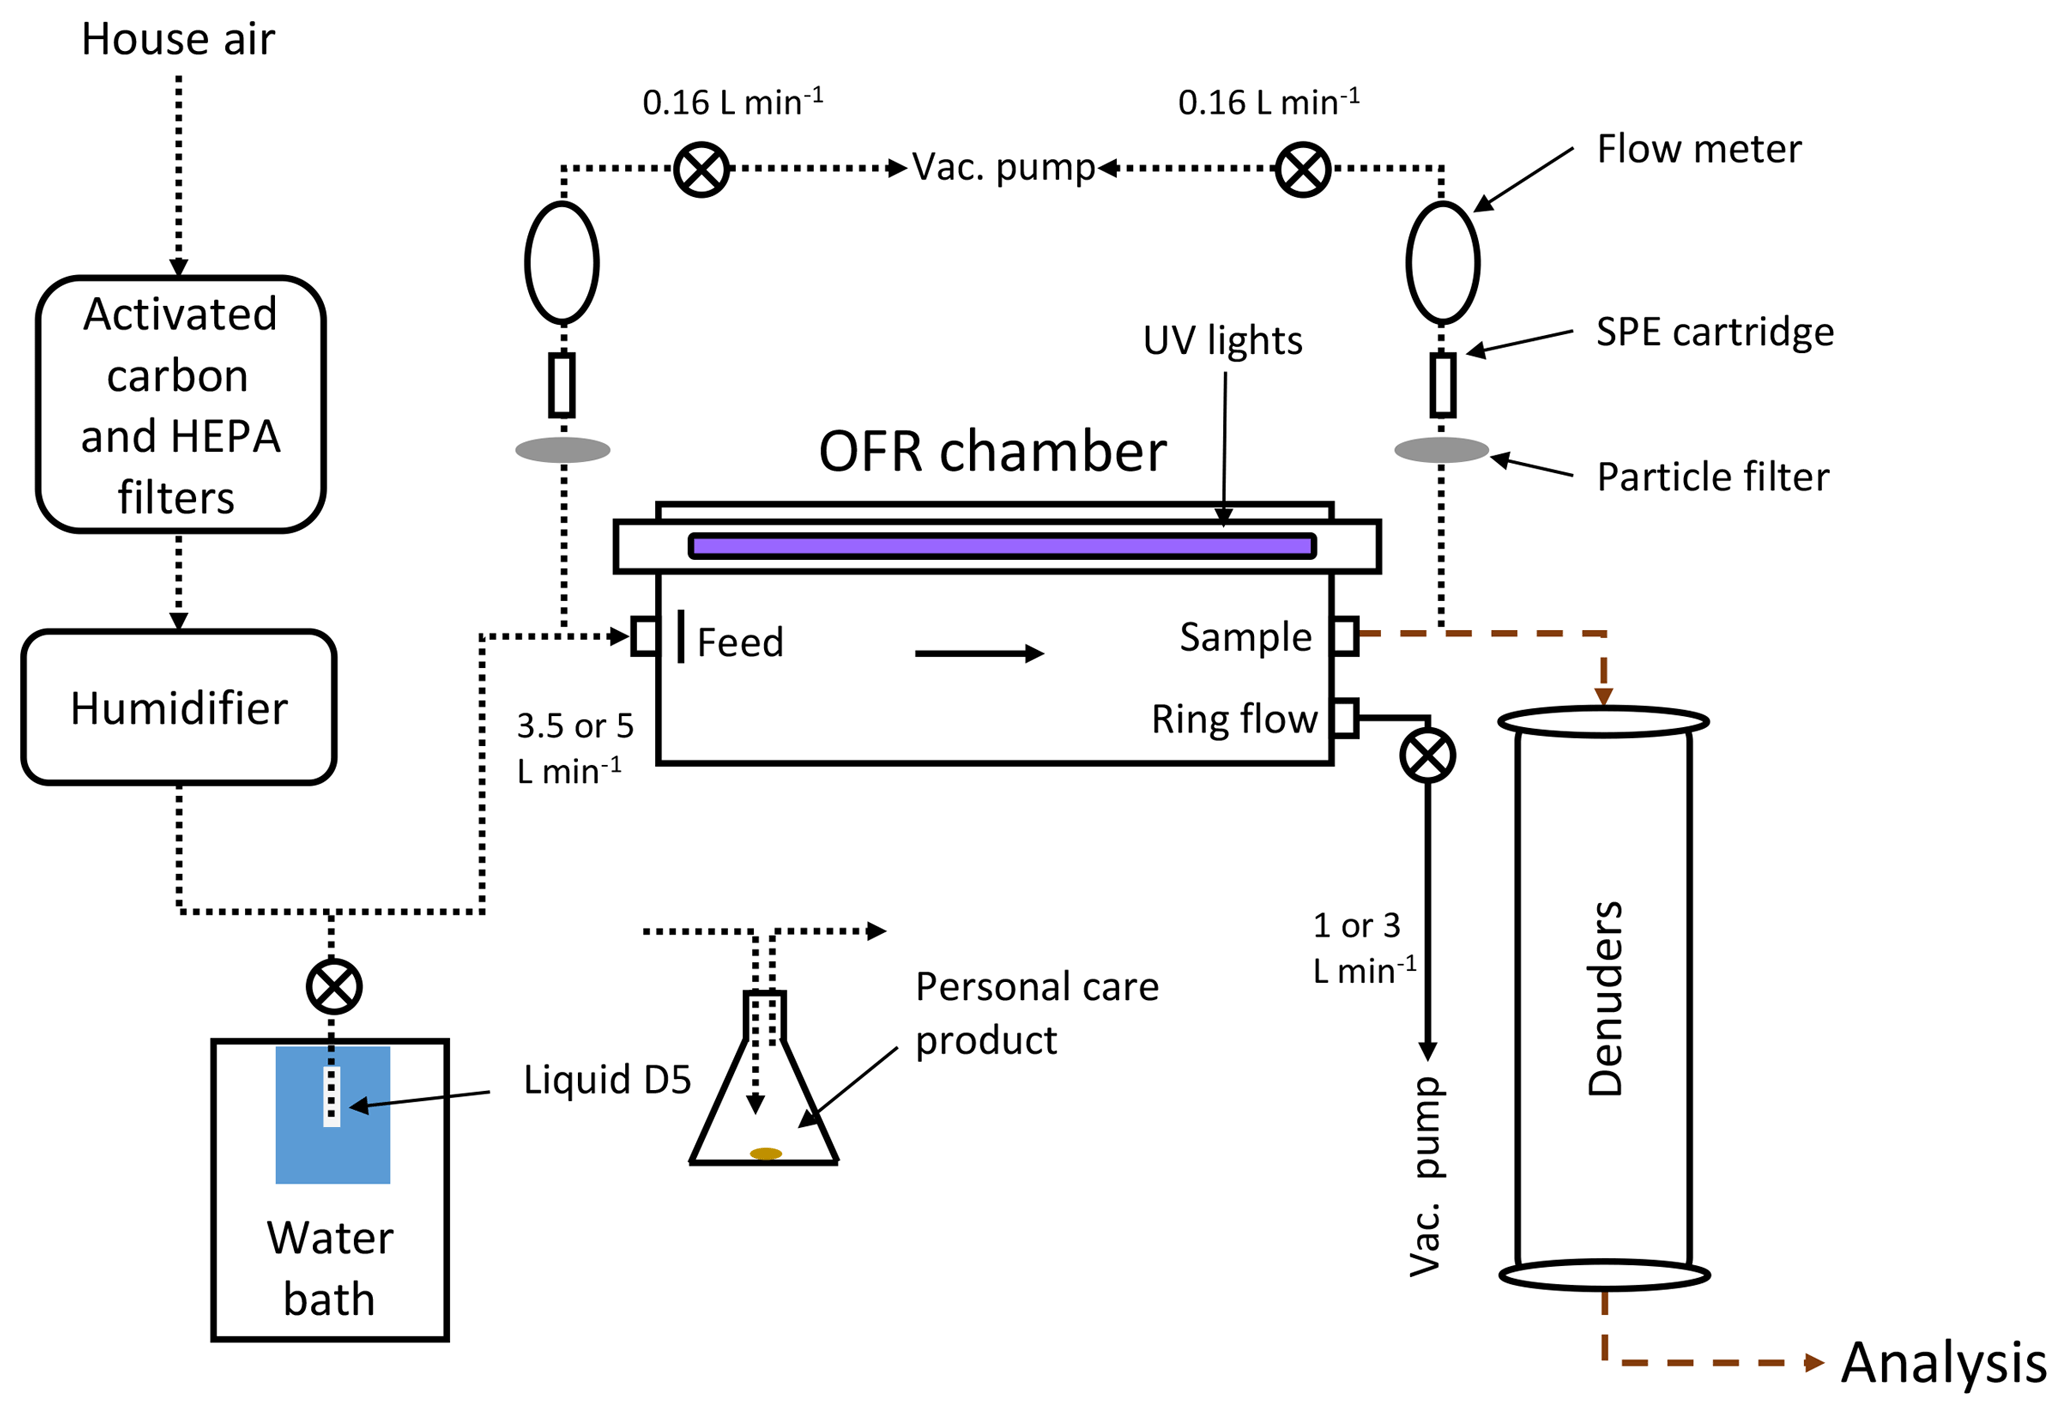
Figure 1Flow diagram for generation of aerosols in the OFR. Aerosols were analyzed by SMPS, TPS100, V-TDMA, and DMT-CCN instruments. Delivery of the precursor gas was either by diffusion of liquid D5 controlled by a water bath or flowing air past a personal care product placed in an Erlenmeyer flask. Short dashed lines in the diagram indicate Teflon tubing, long dashed lines represent copper tubing, and solid lines represent conductive silicon tubing.
Alternatively, precursor gases were introduced to the system flowing air (5 L min−1, unheated) past personal care products in an Erlenmeyer flask. Results from antiperspirant containing cyclopentasiloxane and leave-in conditioner containing cyclomethicone are reported herein. Cyclopentasiloxane is the industry name for D5, while cyclomethicone is the general term used for cyclic volatile methyl siloxanes. Prior to introduction to the system, the chamber was cleaned for ∼24 h with the lights on and no precursor gas. Chamber and supply air were periodically assessed for cleanliness through checks of aerosol production under humidification and lamp irradiation, and generated concentrations of 400 cm−3 (number) and 0.001 µg m−3 (mass), well below the levels produced during D5 oxidation experiments.
To remove organic gases and high concentrations of O3 from the OFR effluent, two annular denuders using activated carbon (Fisher Scientific, 6×14 mesh size) and Carulite 200 (manganese dioxide/copper oxide catalyst, Carus Corp.) were used. The activated carbon denuder dimensions were 25 cm outside diameter (OD) and 20 cm inside diameter (ID) by 125 cm, while the Carulite denuder had dimensions of 14 cm OD and 1 cm ID by 70 cm. The denuders were packed with material between the OD and ID. Teflon tubing was used upstream of the reactor and copper downstream. Silicon conductive tubing was minimized to limit silicon introduction from sources other than the main reagent.
Aerosols were measured using a TSI 3936L85 SMPS (TSI 3785 CPC, TSI 3080 classifier, TSI 3081 long column DMA, and TSI 3077 Kr-85 2mCi neutralizer). Mass concentration was estimated from the SMPS measured volume concentration assumed for spherical particles using a liquid D5 density of 0.959 g cm−3. Aerosol sampling covered 9.7–422 nm with a sheath flow of 6 L min−1 and aerosol flow of 1 L min−1. SMPS measurements were corrected for size-specific particle losses from gravitational settling, diffusion, and turbulent inertial deposition caused by tubing, bends, and constrictions (Willeke and Baron, 1993).
Particles were collected on a carbon film nickel transmission electron microcopy (TEM) grid (SPI 200 mesh) for microscopy and elemental analysis using an RJ Lee Group, Inc. Thermophoretic Personal Sampler (TPS100, RJ Lee Group) (Leith et al., 2014). The TPS100 samples was were collected using hot and cold surface temperatures of 110 and 25 ∘C, respectively, a flow rate of 0.005 L min−1, and a 25 min sampling time. The TPS100 samples were analyzed using a field emission scanning electron microscope (FESEM) with scanning transmission electron microscopy (STEM) capabilities (Hitachi S-5500). The FESEM was equipped with an energy dispersive X-ray spectroscopy (EDS) system incorporating a 30 mm2 silicon drift detector (Bruker Quantax) for collection of elemental composition.
2.2 Yield
Five experiments were run to test the sensitivity of aerosol yield to residence time (flowrate), OH exposure (UV light intensity and RH), and reactant concentration (D5 water bath temperature). The influence of seed aerosols was quantified separately using 50 nm ammonium sulfate aerosols.
Experiments included a ∼20 h equilibration period followed by an analysis period (∼1.7 h) where the D5 gas concentration was quantified upstream and downstream of the OFR. Gas samples were collected on solid-phase extraction (SPE) cartridges. Immediately following D5 gas collection, the precursor gas was switched to SO2, allowing calculation of OH exposure. SO2 with the OFR lights on was measured (Teledyne 100E) for an average of 4.6 h, followed by 3.3 h with the lights off. In this work, SO2 loadings were 5–28 times higher than D5. We recognize that for the best estimate of OH exposure, similar concentrations are desired due to the potential for OH suppression in the chamber (Li et al., 2015; Peng et al., 2015, 2016). The aerosol yield was calculated from the SMPS particle loss-corrected mass concentration and the reacted D5 gas measurements (aerosol mass/reacted D5 gas concentration).
2.2.1 OH exposure quantification
OFR OH exposure was quantified using two methods, comparison of SO2 gas concentrations with and without UV light, and aerosol production from SO2 oxidation as measured by SMPS. Reference SO2 gas (5 ppm in N2) was diluted using mass flow controllers with the volumetric flow verified using a bubble flow meter (Sensidyne Gilian Gilibrator-2). The SO2 monitor was calibrated following the calibration procedure provided by the manufacturer (slope = 1.400, offset = 41.4 mV). The monitor calibration was checked using 337 and 981 ppb SO2 reference gas with the measured monitor concentration within 1.8 % and 1.4 %, respectively.
The main method of OH exposure quantification used in the analysis was by the measurement of reacted SO2 in the OFR (Eq. 1). The initial SO2 gas concentration (450–1200 ppb) was measured at the OFR exit without UV illumination. The final gas concentration (6–190 ppb) was measured similarly, but with UV illumination. All analyzed gas concentrations were the last 20 min average for each respective period after equilibrating for 2–5 h. In Eq. (1) [OH] ⋅ t represents the OH exposure (molec s cm−3), [SO2] and [SO2]0 the final and initial gas concentrations, respectively, and the OH rate constant. The SO2 oxidation rate constant used was cm3 molec−1 s−1 (Davis et al., 1979):
Alternatively, the OH exposure was also estimated using aerosol production from SO2 oxidation. This method assumes complete aerosol conversion of SO2 oxidation. SMPS mass concentrations were calculated using the SMPS size range (9.7–422 nm), assuming spherical particles of sulfuric acid density (1.84 g cm−3). OH exposure was calculated using Eq. (2), where [SMPS] represents the measured SO2 oxidation aerosol mass concentration (1300–4200 µg m−3) and [SO2]0 the SO2 gas concentration at the OFR inlet. All aerosol measurements were analyzed for the same 20 min period used for the SO2 gas analysis:
2.2.2 D5 gas measurement
The reacted D5 concentration was calculated by the difference of upstream and downstream concentration measurements. Duplicate 20 min samples were taken at 0.16 L min−1, with flowrate monitored by a mass flowmeter (TSI 4100) calibrated to a bubble flowmeter (Sensidyne Gilian Gilibrator-2). Samples passed through a particle filter (Millipore Millex-FG 0.20 µm filter, CAT SLFG05010) followed by a SPE cartridge (10 mg isolute ENV+ with 1 mL capacity, Biotage AB) (Kierkegaard and McLachlan, 2010; Yucuis et al., 2013). The upstream and downstream gas sampling lines were constantly sampled at 0.16 L min−1 to maintain system flows and pressures, regardless of whether or not active sampling on sorbent was taking place.
2.2.3 Method for extraction and instrument analysis of D5 in sample cartridges
During D5 gas-phase measurement and analysis, personal care products that contained cyclic siloxanes were avoided by laboratory personnel. Glassware was combusted overnight at 450 ∘C, and then all supplies including glassware were triple rinsed with methanol, acetone, and hexane immediately prior to use. Solvents were pesticide grade from Fisher Scientific. Cartridges were cleaned by soaking in hexane overnight followed by washing three times each with dichloromethane and hexane. Each cartridge was wrapped in triple-rinsed aluminum foil, sealed in a triple-rinsed amber jar with a PTFE-lined screw cap, and kept in a clean media fridge until deployment. Following deployment each sample was re-wrapped in its aluminum foil, returned to its jar, and transferred to the lab for immediate extraction and analysis.
Sample cartridges were eluted with 1.5 mL hexane into gas chromatography (GC) vials. Sample extracts were spiked with 50 ng PCB 30 (2,4,6-trichlorobiphenyl, Cambridge Isotope Laboratories) immediately prior to instrument analysis as the internal quantification standard. D5 for the calibration standard was purchased from Moravek Biochemicals. Samples were analyzed using an HP 6890 Series GC with an HP 5973 MSD equipped with an Agilent DB-5 column (30 m × 0.25 mm ID, and 1.0 µm film thickness) in select ion monitoring mode. Instrument parameters are in Table S2 in the Supplement.
Sufficient elution volume was tested by collecting a second cartridge elution of 1.5 mL for the sample with the highest anticipated concentration, and a cartridge breakthrough test was also performed. Quality control was assessed through a blank spike test, duplicates, and additional blanks (field, instrument, and method). Values reported herein are not blank corrected. See additional information on these in the Supplement. Non-reactive losses of D5 in the sampling lines and reactor were examined in an experiment without reactor UV illumination. In duplicate testing the sample mass changed by less than 2 % between upstream and downstream sampling points.
2.2.4 Seed aerosol experiment
Seed aerosol influence on yield was quantified using monodisperse 50 nm ammonium sulfate aerosol (∼ 1000 cm−3, 0.2 µg m−3) prepared from atomized and dried ammonium sulfate solution (TSI 3076 atomizer, TSI 3062 dryer) with electrical mobility classification. To maintain system pressures between seed and non-seed conditions, seed aerosol entered through a tube with pressure drop equivalent to a HEPA filter, or was filtered through the HEPA filter. The seed influence was tested at a total chamber flow rate of 3.5 L min−1, 25 % RH, and 80 % light intensity. Conditions cycled through D5 only (24 h), D5 + seed (24 h), D5 only (12 h), D5 + seed (12 h), and seed only (12 h).
2.3 Hygroscopicity
Hygroscopicity κ parameters were determined by measuring water supersaturation levels required to grow D5 SOA into cloud droplets. A Droplet Measurement Technologies cloud condensation nuclei (CCN) counter, CCN-2 (single column, SN 10/05/0024), was used to generate supersaturation conditions and detect activated (grown) particles (Roberts and Nenes, 2005). A CPC (TSI 3785) sampled a side stream before the CCN counter as a measure of the incoming particles. The thermal gradient (ΔT) was varied from 0.4 to 24 K through up to 11 steps. Thermal gradients were mapped to supersaturations using monodisperse ammonium sulfate as a calibration aerosol, with theoretical supersaturations calculated using the AP3 Kohler model (Rose et al., 2008). Additional details are provided in the Supplement. The ΔT required for activation of any D5 SOA aerosol was fitted to experimental activation fractions (f, the ratio of CCN and CPC particle counts) using a Gaussian cumulative distribution function.
Eight different monodisperse diameters were tested, ranging from 30 to 200 nm. These were produced using a TSI 3080 classifier, TSI long column 3081 DMA, and TSI 3077 neutralizer with sheath air set to 10 L min−1. Tubing lengths were the same from the DMA to the CCN counter, and the DMA to the CPC, minimizing the effects of differential particle loss. The CCN counter was operated with the recommended total flow of ∼0.5 L min−1 and a 10:1 sheath-to-sample flow ratio. Ammonium sulfate (Fisher Scientific, purity ≥99 %) calibration aerosols were generated using a solution of 1 g L−1 prepared in DI water (TSI 3076 atomizer, syringe pump ∼15 mL h−1, TSI 3062 diffusional dryer) followed by dilution to 2000–3000 cm−3. D5 SOA was generated using the OFR with a total chamber flow of 5 L min−1, 30 % RH, D5 water bath at 70 ∘C, ring flow at 3 L min−1, and 100 % light intensity. The oxidized D5 aerosol stream was not diluted as concentrations were similar to the diluted ammonium sulfate.
The Gaussian cumulative distribution function in Eq. (3) was used to fit the measured activation fractions to three parameters (a is the activation threshold, b the activation ΔT, and c the sharpness of the inflection point) which represents the average hygroscopicity κa of CCN active particles (Rose et al., 2010). A lower hygroscopicity parameter, κt, was determined from a two-parameter (b and c, a=0.5) fit representing the effective hygroscopicity of both active and inactive CCN particles. The two-parameter method is best used when CCN inactive and active particles are externally mixed and for comparison to H-TDMA data (Rose et al., 2010). In cases of homogeneous internally mixed aerosols and unbiased particle count measurement, κa and κt should be equal. Deviations in f≠1 can be used to estimate the fraction of CCN-inactive particles (Rose et al., 2010):
The measured diameter and activation supersaturation pairs were used to determine the effective hygroscopicity parameter κ using Eq. (4), the Kappa–Kohler equation. Here s is the supersaturation ratio, Dwet is the wet particle diameter which is unknown, D is the dry particle diameter taken as the classifier size-selected particle diameter, σsol is the surface tension assumed for pure water, Mw is the molecular weight of water, and ρw is the density of water. Since the surface tension of pure water is assumed rather than the solution properties (due to the lack of physical properties on the D5 oxidization products), this is the effective hygroscopicity parameter (Rose et al., 2010; Petters and Kreidenweis, 2007). Equation (4) is solved iteratively by guessing an initial κ, finding the Dwet that corresponds to the peak supersaturation from the Kohler curve, and using the Dwet term found along with the measured supersaturation to solve for a new κ guess which is then substituted into Eq. (4) to find a new Dwet. Iteration was stopped when Dwet and κ converged to the experimental supersaturation
Fluid properties and temperature for Eq. (4) used the instrument's T1 measurement, the growth tube entrance temperature.
2.4 Volatility
D5 SOA was generated as described in Sect. 2.3 and then evaporated in a volatility tandem differential mobility analyzer (V-TDMA), previously described in Singh (2015). The V-TDMA featured a 2 s residence time, 1 m length stainless steel heated and bypass tubes (0.77 cm ID), and a 1 L min−1 flowrate. Test aerosols were size selected using electrical classification (TSI 3085) prior to the V-TDMA. Volatility was assessed by comparison of the diameters of unheated and heated aerosol modes, at five temperatures (50, 80, 110, 150, and 190 ∘C) and six sizes (10, 20, 30, 50, 80, and 110 nm). These tests were conducted with average aerosol concentrations of cm−3 and –18 µg m−3 (Table S7 in the Supplement). In total, 156 samples were collected over 7 h, or two to four replicates at each diameter–temperature combination. Due to some of the very small size changes observed, a continuous number size distribution mode was fit from the discrete SMPS distribution.
2.5 Thermal aerosol production
Vapor-phase D5 (estimated mixing ratio of 270 ppm) was generated by bubbling particle-free air through liquid D5 using a gas bubbler at 20 ∘C followed by a HEPA filter to remove droplets. The vapor D5 was heated up to 550 ∘C using the V-TDMA system or a stainless steel tube placed in a tube furnace. Both tubes had a residence time of 2 s and the resulting effluent was measured by SMPS to determine whether particle formation occurred.
3.1 OFR chemistry
Due to high OH concentrations and higher energy UV light in OFRs, the applicability of generated aerosols under these conditions has been evaluated by comparing aerosol yield (aerosol mass produced/mass of reacted gas precursor) and aerosol composition to well-established environmental chambers. Previous work has generally concluded that SOA yield and chemical composition are comparable between OFRs and environmental chambers (Kang et al., 2007, 2011; Lambe et al., 2011a, b, 2015; Bruns et al., 2015; Chhabra et al., 2015; Palm et al., 2018). Lambe et al. (2015) reported aerosol composition was independent of the oxidation technique (OFR vs. environmental chamber) for similar OH exposures. Slight differences in SOA yield have been reported, with OFR yields both higher (Kang et al., 2007) and lower (Lambe et al., 2011a, 2015; Bruns et al., 2015). Possible differences in yields have been discussed, including uncertainty (Bruns et al., 2015), non-identical reactor conditions (Kang et al., 2007; Lambe et al., 2015; Bruns et al., 2015), fragmentation at high oxidant conditions (Kroll et al., 2009; Lambe et al., 2012), and differences in wall losses (Lambe et al., 2011a; Bruns et al., 2015). Wall losses are important to consider for both environmental and OFR chambers when performing yield measurements (Krechmer et al., 2016; Pagonis et al., 2017; Palm et al., 2016).
OFRs can be erroneously operated under conditions that favor non-OH reactions depending on the chamber conditions. A number of studies have been performed to model the reactor chemistry and develop best operating conditions so that reaction with OH is favored and atmospherically relevant (Li et al., 2015; Peng et al., 2015, 2016). Best operating conditions were recommended based on studying the relative influence of 185 and 254 nm photolysis, reaction by ozone (O3), and O(1D) and O(3P) radicals. Additionally, Palm et al. (2016) developed a model to correct for non-aerosol condensation pathways of low-volatility vapor in the chamber. These alternative pathways are condensation to the chamber walls, fragmentation to non-condensable vapors, and residence times not long enough for condensation to occur. If attention is paid to these OFR chamber issues, atmospherically relevant oxidation conditions can be produced.
The OFR chamber conditions tested in this work were evaluated for non-atmospherically relevant chemistry using the OFR Exposure Estimator (v3.1) tool (Lambe and Jimenez, 2018). The OFR Exposure Estimator tool was developed using a plug-flow kinetic box model to study the importance of 185 and 254 nm photolysis, and O(1D), O(3P), and O3 chemistry relative to OH (Li et al., 2015; Peng et al., 2015, 2016). Organic radical species have not been assessed in the tool. HO2 radicals are an important component in OFR chemistry, as well as in the atmosphere, but generally are negligible for volatile organic compound (VOC) oxidation due to low reaction rates relative to OH (Peng et al., 2016). In order to ensure the OFR is run under conditions favoring OH reaction, Peng et al. (2016) recommended an external OH reactivity (OHRext) < 30 s−1, H2O mixing ratio > 0.8 %, and 185 nm UV flux > 1 × 10¹² photons cm−2 s−1. OHRext refers to the product of the gas concentration and the OH rate constant. All experimental conditions used in our OFR experiments were evaluated using the OFR Exposure Estimator tool and fall in the regime with OH chemistry favored. The regime for the personal care product oxidation (Sect. 3.3) could not be determined due to the lack of an estimate of gas concentration. However, the personal care concentrations could be up to 20 times greater than the D5 concentrations used and still fall in the OH-favored regime. Chamber conditions for the 12 scenarios had a water mixing ratio of 0.81 %–1.5 % (25 %–45 % RH), OHRext 0.5–26 s−1, and 185 nm photon flux as estimated from Li et al. (2015) 6.5–8.6 × 10¹³ photons cm−2 s−1.
3.2 Yield
SMPS aerosol concentrations were corrected to account for particle losses caused by the denuders and tubing downstream of the OFR. Particle loss correction increased the number concentration by 7 %–11 % and mass by 3 %–5 %, and decreased the number distribution mode slightly. Upstream and downstream SO2 gas concentrations matched within 9 % without OFR illumination, indicating SO2 was not lost to surfaces or leaks. Calculated OH exposure based on SO2 oxidation varied from 1.60 to 5.12 × 10¹² molec s cm−3, which is equivalent to 12 to 40 days of atmospheric aging assuming an OH concentration of 1.5 × 10⁶ molec cm−3 (Palm et al., 2016). Measured OH exposures were 4–5 times lower than OH exposure predicted from the OFR Exposure Estimator tool in Sect. 3.1. A likely source of uncertainty in the predicted OH exposure is UV light intensity which was estimated from the intensity output from a similar OFR reported in Li et al. (2015). Despite using the same lamp model, light intensity likely varies due to age-related reduction or production differences. Previous evaluation of the predicted OH exposures found values to be within a factor of 3 for 90 % of SO2-derived OH estimates (Li et al., 2015).
The SO2 gas-phase-derived OH exposures were evaluated compared to the estimate derived from SO2 oxidation aerosol measurements. Generally, there was good agreement between the two methods. The aerosol-derived estimate of OH exposure agreed within a factor of 3.6 for experiment 1 and a factor of 1.0–1.8 for the remaining experiments, which used higher SO2 concentrations due to low unreacted SO2 concentrations in the first trial. Generally, the aerosol-derived OH estimates were lower than the estimates from SO2 gas reactive consumption. One explanation for lower SO2-derived OH exposure is the potential for loss of sulfate aerosol in the OFR (Lambe et al., 2011a).
In extending the OH exposure estimates measured from SO2 oxidization and applying them to the D5 conditions, one must be careful to consider the external OH reactivity differences due to OH suppression (Peng et al., 2015, 2016; Li et al., 2015). Under the given experimental conditions, SO2 external OH reactivity loadings were 5–28 times higher than D5 loadings, and therefore OH exposure conditions would be anticipated to be higher for D5 experiments. The OFR Exposure Estimator tool predicts that under the given experimental conditions, D5 OH exposure may be 1.5–2 times higher than those reported from SO2 measurements. While this does not change the conclusions drawn from this work, the uncertainty in OH exposure should be acknowledged.
D5 gas concentrations (Fig. S4 in the Supplement) upstream of the chamber ranged from 290 to 740 µg m−3, and downstream from 9 to 24 µg m−3. This suggests the reactor consumed nearly all of the precursor gas. Gas measurements had good reproducibility between duplicate samples, and between replicate conditions (trials 2 and 4). Additionally, gas concentrations varied as expected with respect to dilution flows and to the water bath temperature that was driving D5 evaporation into the system.
A typical yield experiment is shown in Fig. 2. Experiments included a ∼20 h settling period for the system to attain a steady state. This was followed by a ∼2 h sampling period during which four gas samples were taken to determine D5 SOA yields. Similar to Kang et al. (2007), the settling period often had an initial maxima in mass and number during the first few hours. After the yield determination period, SO2 was used to determine OH exposure. Aerosol fluctuations tended to be more stable for the 3.5 L min−1 tests than 5 L min−1. During the analysis period, aerosol concentrations were reasonably stable in time, with temporal variability (expressed as relative percent difference at 3.5 L min−1) of 9 %–11 % and 9 %–13 % for number and mass concentrations, respectively. At the higher 5 L min−1 flow, variability increased to 18 %–26 % (number) and 8 %–32 % (mass). We suspect variability in the D5 injection rate as a primary cause of variability in the SMPS-detected aerosols from the OFR. Table 1 contains aerosol statistics for the analysis periods.
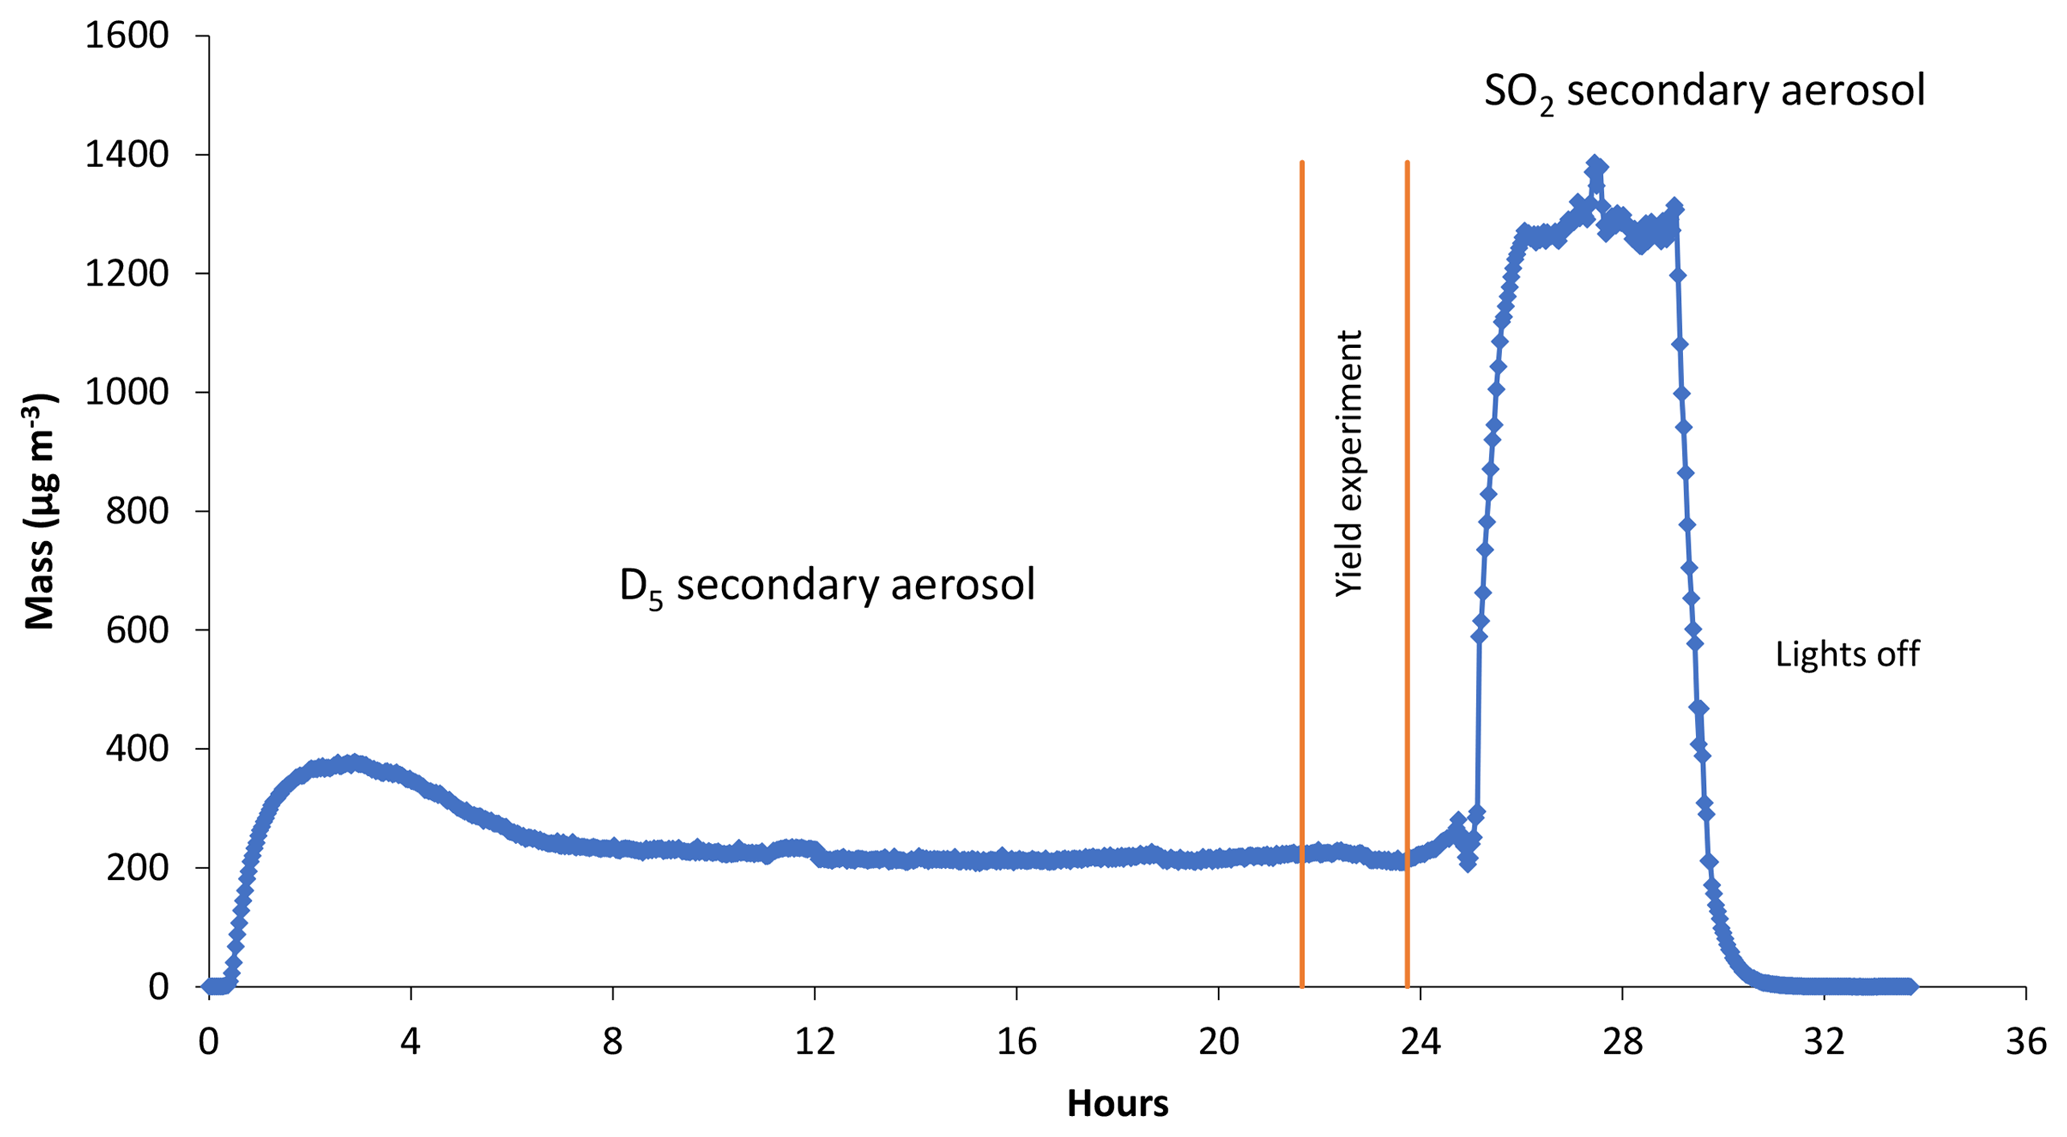
Figure 2SMPS time series of a typical yield experiment. An equilibration period was run for ∼20 h prior to measuring the D5 gas concentration upstream and downstream of the OFR (yield experiment period ∼1.7 h). Aerosol measurements used for yield analysis were from the yield experiment period. After the yield experiment period, the precursor gas was switched to SO2 for OH quantification. An SO2 monitor was used to measure SO2 downstream of the chamber with and without the OFR lights on.
Table 1Summary of the yield trials. D5 reacted gas concentration represents the average of the upstream minus the average of the downstream measurements. Number, mass, and mode represent the average SMPS aerosol values for the yield experiment period. Equivalent age represents the atmospheric aging assuming an OH concentration of 1.5 × 10⁶ molec cm−3.

Yields varied between 0.22 and 0.50, corresponding to aerosol concentrations of 68–220 µg m−3. Yield was generally invariant of reacted D5, increased monotonically with OH exposure, and generally increased with aerosol mass (Fig. 3). Reactive organic gas (ΔROG) did not increase with OH exposure since OH was in excess and D5 was limiting. OH exposure had a strong effect on yield, which is consistent with chemical changes to the products with greater OH exposure. Increasing aerosol yield with higher OH exposure has been observed in OFR studies with other reactants, but yield typically reaches a maximum above which fragmentation reactions likely decrease yield (Lambe et al., 2011a, 2012, 2015). No yield maximum with respect to OH exposure was observed. Wu and Johnston (2017) reported aerosol yields of 0.08–0.16 at aerosol loadings of 1.2–12 µg m−3 (at constant OH), with yields increasing with reacted D5 and aerosol loadings. Wu and Johnston (2017) caution that their yields are based on estimated rather than measured D5 consumption. Our data point for trial 4 (yield of 0.5) is higher than the others, which were in the 0.22–0.3 range. While the experimental conditions of trial 4 were unique (high RH, high light intensity, low flow, and long residence time) and consistent with a potentially high yield, we note that we did not perform additional experiments which would replicate or invalidate this finding; we further note that variability (in time) of mass was approximately up to 13 % (by mass) at low flow and 32 % (by mass) at high flow.

Figure 3Measured D5 oxidation aerosol yield as a function of (a) ROG (reacted D5), (b) equivalent age assuming an OH concentration of 1.5 × 10⁶ molec cm−3, and (c) aerosol mass. Data points are color coded according to OH exposure.
Wu and Johnston (2017) suggest the aerosol composition is highly dependent on aerosol mass loading with less volatile ring-opened species at low loadings and, as particles grow, composition shifts to dimer formation and semi-volatile monomer species. This implies that at the high loadings observed in this work, aerosol composition is likely dominated by semi-volatile monomer species and non-volatile dimer species. In the context of available knowledge of aerosol formation for cVMS, Wu and Johnston (2017) observed aerosol size affected aerosol composition, and this work shows the extent of oxidation may also contribute to aerosol chemistry.
3.2.1 Fate of condensable products in the OFR
Condensable vapor (i.e. semi-volatile reaction products) in the OFR can form aerosol, or condense to chamber walls, or undergo fragmentation to non-condensable compounds through multiple OH oxidation, or exit the chamber as a uncondensed semi-volatile gas (Palm et al., 2016). Experiment-specific fates of condensable vapor for the OFR conditions used in this work were assessed using a condensational loss model (Palm et al., 2016; Lambe and Jimenez, 2018). The model compares the relative timescales of competing fates for low volatility organic compounds (LVOC). We modified the LVOC fate model to our chamber conditions for the five yield experiments, and assumed an LVOC diffusion coefficient for the single OH substituted D5 molecule, 4.64 × 10⁻⁶ m2 s−1 (Janechek et al., 2017). Recommendations for gas diffusion sticking coefficient, OFR volume, eddy diffusion coefficient, number of reactions with OH required to render non-condensable through fragmentation, and surface/volume ratio were from Palm et al. (2016). For the condensational sink calculations (Table S5 in the Supplement), the average of the SMPS measurement of the entrance (particle free) and exit was used. For the five yield experiments, the predominant calculated fate is condensation to aerosols (> 97 %) and aerosol concentrations were not corrected for non-aerosol condensation losses.
Chamber experiments were typically run with particle free incoming air so nucleation must play an important role in aerosol formation within the chamber owing to the high yields and mass loadings observed. If initial particle growth is fast enough to serve as sufficient condensation sinks for condensable vapors, then the non-aerosol fates are negligible due to the high aerosol concentrations. Alternatively, if the condensational sink is low, the dominant fate is expected to be multi-generational OH oxidation that could lead to fragmentation. For the range of OH conditions tested in this work, no evidence of fragmentation was observed due to increasing yield with OH exposure. Although the predominant fate of condensation to aerosols remained above 87 % in the fate model even for reductions in the condensational sink by an order of magnitude, our yields may be biased low due to the neglecting of loss to the chamber walls. This is possibly supported by the increase in yields described in Sect. 3.2.2.
3.2.2 Seed aerosol effect
The seed aerosol influence on aerosol yield was quantified by averaging the final 2 h of SMPS measurements for each of the periods described in Sect. 2.2.4. Here 50 nm ammonium sulfate seed aerosol was added upstream of the reactor to serve as a condensational sink for aerosol formation. The addition of seed aerosols resulted in an increase in number concentration of 2.6 %, and mass concentration of 44 %. Wu and Johnston (2017) similarly observed positive yield sensitivity to ammonium sulfate seed aerosols.
3.3 Personal care product as reactant
Replacing liquid D5 with personal care products as the source of reactive gases similarly generated aerosols when oxidized using the OFR. Using a 10 mg solid flake of antiperspirant as the vapor source led to immediate production of over 2000 µg m−3 in the OFR with decay to 600 µg m−3 within 1 h, and 60 µg m−3 after 4 h. The addition of fresh antiperspirant returned the aerosol concentrations to the initial level. The source of the aerosols was verified to be photooxidation of volatilized components of the personal care product since the cleaned chamber concentrations prior to introduction was 0.03 µg m−3, and removing the personal care product or turning off the chamber lights resulted in rapid concentration decrease. The use of 25 mg of conditioner as the vapor source was qualitatively similar but resulted in much lower aerosol loadings of around 40 µg m−3, possibly due to lower cVMS content (Wang et al., 2009; Dudzina et al., 2014).
Particle morphology and elemental composition of D5 and antiperspirant-generated aerosols were analyzed using electron microscopy. The antiperspirant sample was collected 2 h after the initial flake was added to the system with average SMPS concentrations of 2 × 106 cm−3 and 370 µg m−3, and a mode of 50 nm. Similar morphology and elemental composition was observed compared to the generated particles using pure D5 (Fig. 4). Particles generated from both sources had spherical morphology with some aggregates. Elemental composition was consistent from a siloxane source with Si and O elemental peaks observed relative to the background. Background peaks of nickel and carbon were observed, consistent with the TEM grid. The techniques employed herein can confirm the presence of Si in the SOA formed from the antiperspirant, but cannot attribute the fraction of the SOA formed to the various ingredients in the antiperspirant. Samples from the SOA formed from conditioner were not collected for microscopy. In both cases, the personal care products are known to contain other SOA precursors, such as fragrances that may contain monoterpenes and terpenoids.

Figure 4STEM-EDS analysis of D5 oxidation aerosols and antiperspirant oxidation aerosols obtained from analysis of TPS100 samples.
3.4 Hygroscopicity
The CCN measurements up to 1.9 % supersaturation were used to calculate the effective hygroscopicity parameter κ for the oxidized D5 aerosols. As described in the methods section, first the CCN counter temperature differential ΔT was correlated with the supersaturation (S) using theoretical calculations of ammonium sulfate activation supersaturation and measured ammonium sulfate activation ΔT. The result was (R2 of 0.994). The linear fit was used to correlate the cVMS three-parameter and two-parameter activation ΔT with critical supersaturation needed for κ calculation.
The cVMS measurements (Fig. 5) were corrected for size-dependent particle losses and counting efficiencies by dividing by the maximum activation fraction from the ammonium sulfate uncorrected three-parameter fit. The size-dependent maximum activation fractions used were 0.78, 0.87, 0.91, 0.92, 0.94, 0.96, 0.97, and 1.00 for 30, 50, 70, 90, 110, 140, 170, and 200 nm particles, respectively. The remaining deviations from fmax≠1 for cVMS sizes 70–200 nm were attributed to non-homogeneous aerosol composition. Oxidized D5 particles at 30 and 50 nm were too small to exhibit enough activation behavior for calculations (at supersaturations of 1.9 %); therefore, κ calculations for oxidized D5 started at 70 nm.
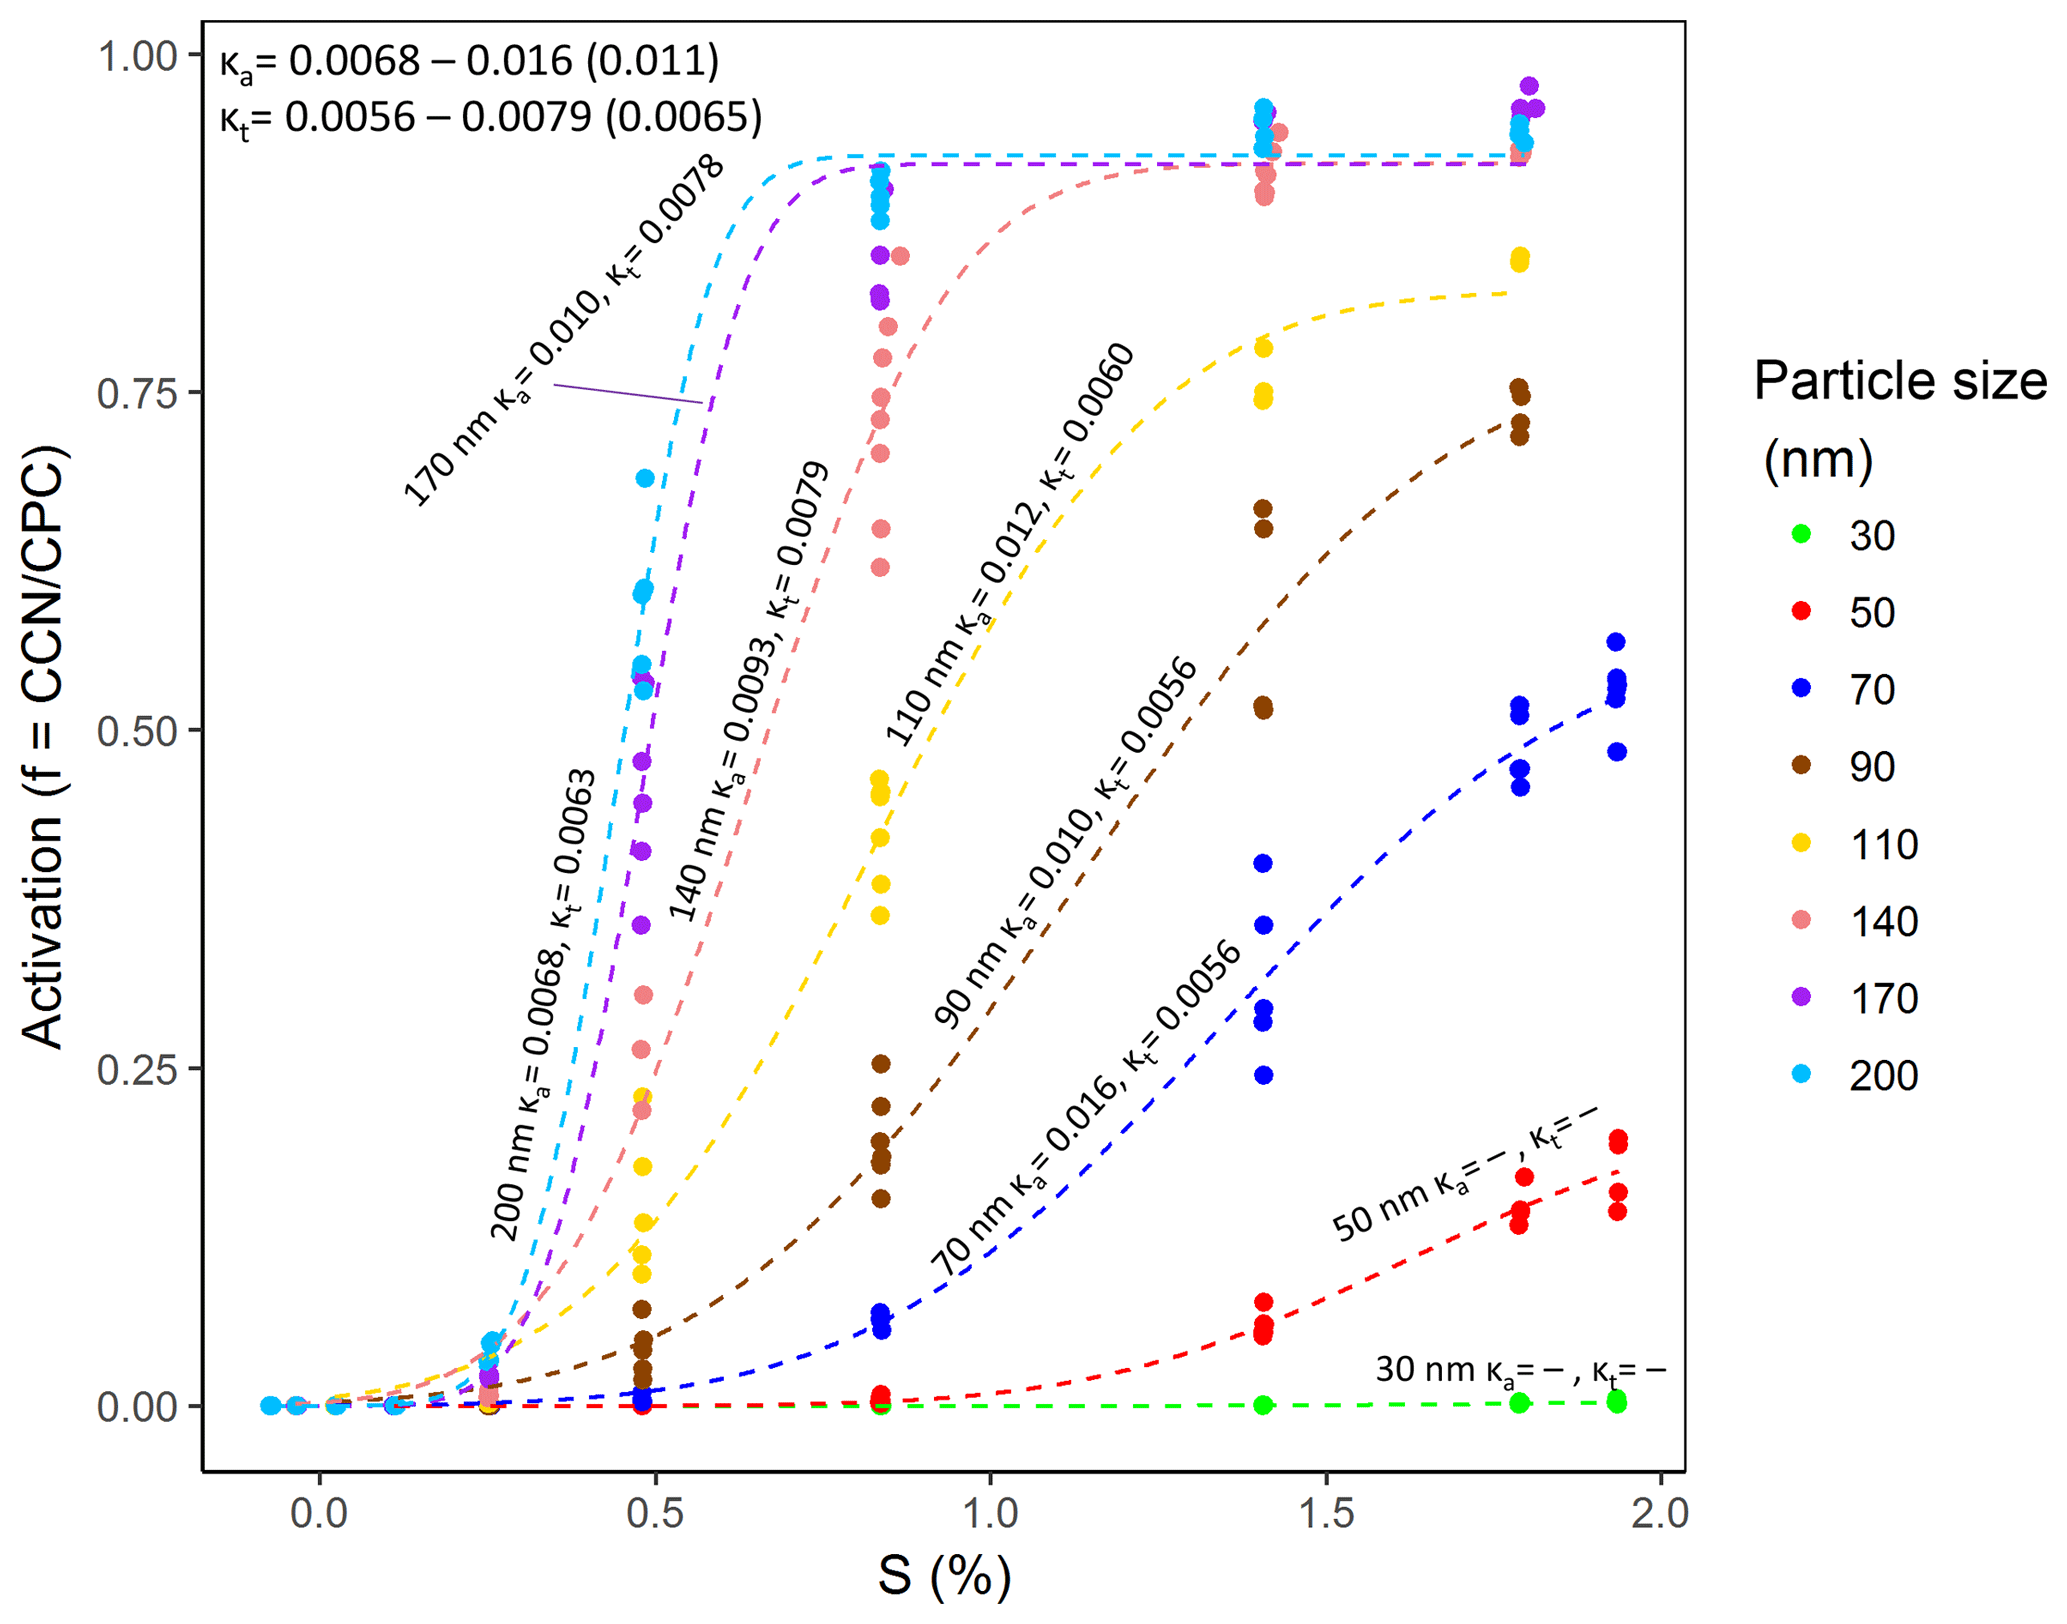
Figure 5D5 oxidation aerosol CCN activation curve. Size-specific κa and κt are tabulated for particles 70–200 nm. The calculated kappa parameter range and average (in parentheses) are tabulated in the upper left. Each point represents an average 30 s CCN∕CPC measurement.
The average D5 oxidation aerosol κa and κt were 0.011 and 0.0065, respectively. Figure 6 (Table S6 in the Supplement) shows the D5 oxidation and ammonium sulfate aerosol size-dependent effective hygroscopicity parameters as determined by the three-parameter and two-parameter fits, labeled κa and κt, respectively. Typical κ values range from 0 for insoluble materials such as soot (Rose et al., 2010) to 1.28 for NaCl (Petters and Kreidenweis, 2007). A large κ value corresponds to a species that more easily serves as CCN than a species with a small κ value. Zhao et al. (2015) reported examples of secondary organic aerosol κ ranging from 0.01 to 0.2, while Lambe et al. (2011b) reported 8 × 10. The κ for oxidized D5 aerosol are on the low end of previously reported SOA. Some literature-reported organic compounds with κ below 0.03 include adipic acid and suberic acid (Cerully et al., 2014) and SOA from OFR oxidation of hydrophobic precursors such as C-17 alkane, bis(2-ethylhexyl) sebacate (BES), and engine lubricating oil (Lambe et al., 2011b). The average ammonium sulfate kappa value was calculated using the same algorithm, and a value of 0.79 was obtained. However, there was considerable error for the linear fit correlating CCN counter ΔT to supersaturation at low supersaturations for ammonium sulfate particle sizes of 140–200 nm (percent error of 30 %). This was also observed in Rose et al. (2008) for their low supersaturations.
Figure 6 shows that no clear size dependence was observed for κt, while κa resulted in smaller particles exhibiting larger kappa values. This suggests the cVMS oxidation aerosol composition was size-dependent in our experiments, with smaller particles likely more oxidized. For SOA, higher hygroscopicity for smaller particles likely arises from more oxidized composition, with possible explanations thought to be the Kelvin effect and greater surface area/volume ratios impacting heterogenous oxidation or increased incorporation of later generation products (Zhao et al., 2015; Winkler et al., 2012).
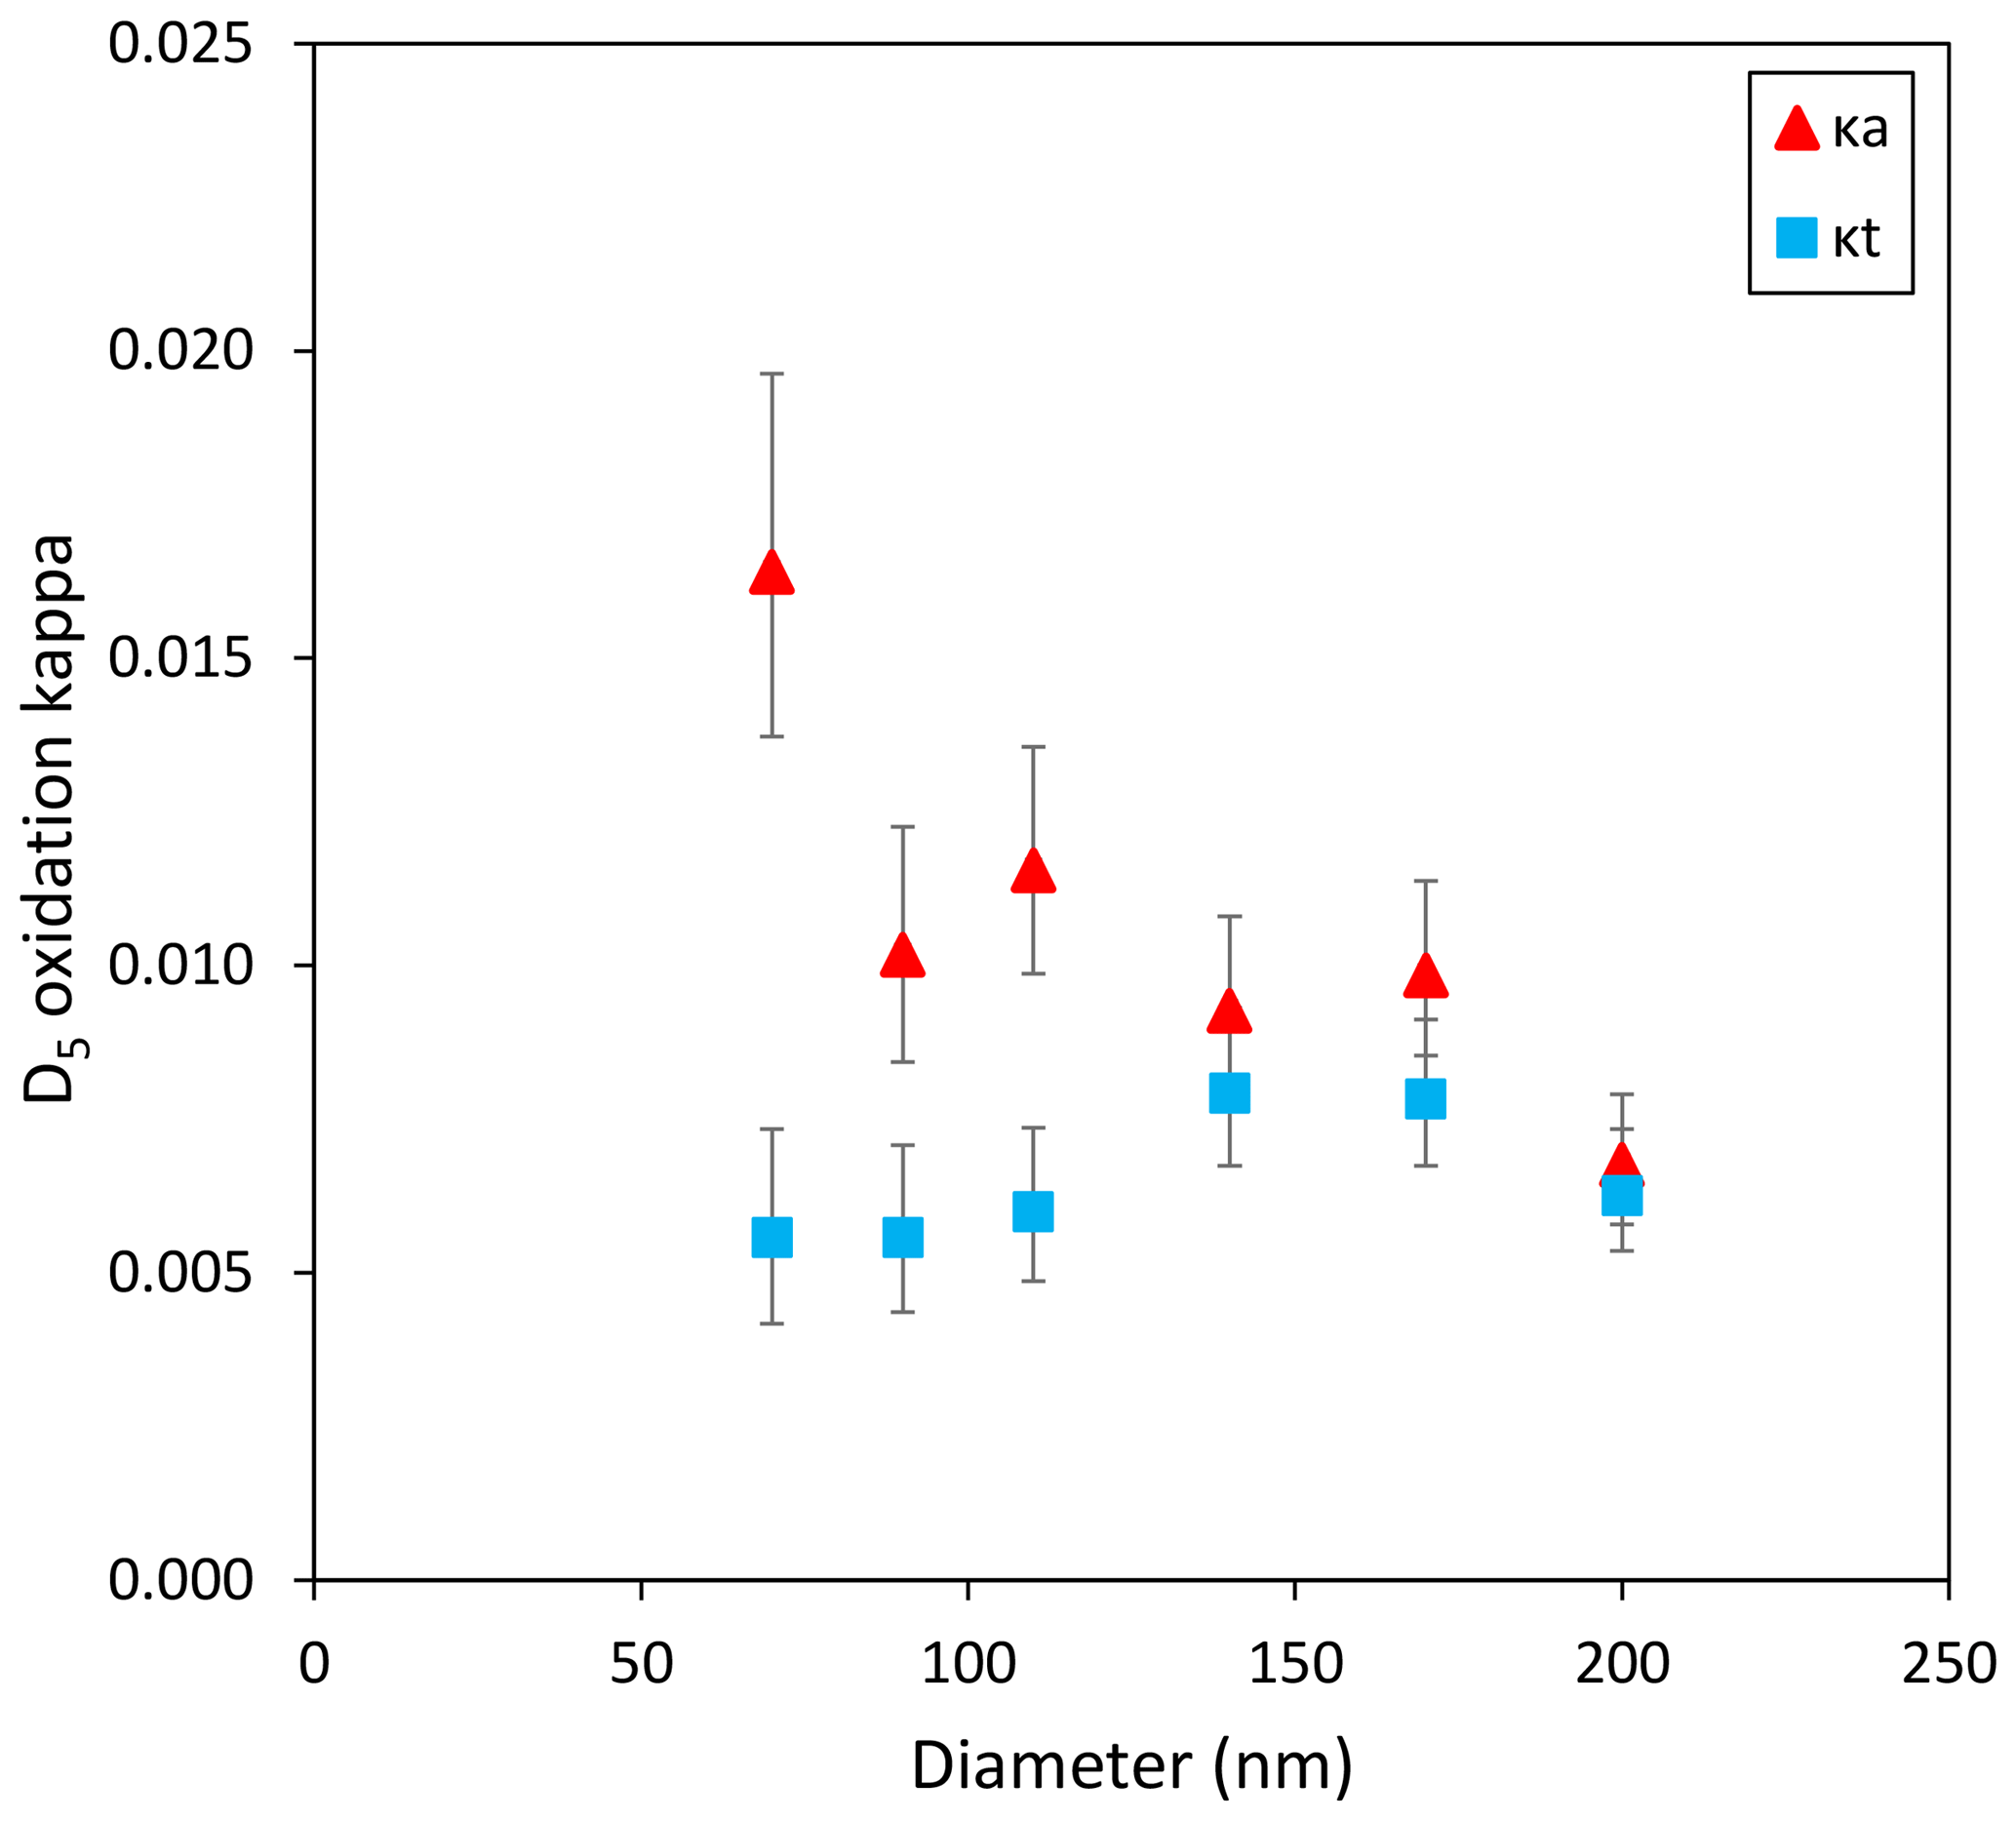
Figure 6Size-resolved kappa parameters for D5 oxidation aerosols. Error bars represent the 95 % confidence interval.
3.5 Volatility
Particle diameter shift (Fig. S13 in the Supplement) between heated and non-heated aerosols indicated the D5 oxidation aerosols produced from the OFR were nearly non-volatile. Particle shrinkage increased with increasing temperature and for smaller sizes which have increased vapor pressure due to particle curvature (Kelvin effect). However, no particles other than 10 nm experienced greater than 4 % shrinkage. Particles with 10 nm diameters experienced shrinkage up to 27 %, but low particle numbers (100–1700 cm−3) and temporal variability complicated interpretation. Number concentrations (Fig. S14 in the Supplement) largely stayed unchanged within ±15 % between heated and unheated cases for particles of size 20–110 nm.
3.6 Thermal aerosol production
Since indoor air with high concentrations of cVMS will periodically be contacted against hot surfaces (heating elements of cooking, heating, hobby, and personal care devices), we assessed whether air with D5, heated up to 550 ∘C would result in any aerosol formation. Siloxane and silicone polymer (polydimethylsiloxane, PDMS) are reported as thermally stable (Hall and Patel, 2006; Clarson and Semlyen, 1986), while Erhart et al. (2016) report polymerization of liquid siloxanes at 300 ∘C and decomposition at 400 ∘C. We could find no reports in the literature on a thermal degradation temperature for D5 in air, or whether thermal degradation products might tend to condense onto preexisting aerosols or to homogeneously nucleate. Octamethylcyclotetrasiloxane (D4) has been reported to catalytically polymerize through interaction with a borosilicate container wall when heated to 420 ∘C under vacuum (Clarson and Semlyen, 1986).
No particle formation was observed for any of the tested temperatures (100, 150, 200, 250, and 550 ∘C). With the experimental configuration, condensable decomposition products could occur but elude detection by condensing onto the tubing walls. Therefore, D5 vapor was heated to 550 ∘C and, after heating, 80 nm ammonium sulfate seed particles were introduced to provide a condensational sink for the cooling condensable gases. No growth in the seed aerosols was observed.
These experiments also serve as a control to the volatility experiments. Residual D5 in the vapor phase, heated along with the SOA aerosols, would not be expected to generate any condensable product that could complicate interpretation of the results in Sect. 3.5.
3.7 Relevance and unanswered questions
In Janechek et al. (2017), the propensity for SOA generation from D4, D5, and D6 across North America was modeled by tracking the OH oxidation products in the gas phase in the CMAQ photochemical grid air quality model. The Janechek et al. (2017) results can therefore be interpreted as the ambient aerosol concentration under the assumption of 100 % aerosol mass fraction (yield). Averaged over the North American modeling domain, the oxidized D5 concentration peaked in summer at ∼0.8 ng m−3, and the peak monthly averaged concentration occurred downwind of population centers, and was ∼10 ng m−3. Adjusting these downward using the yields found in this work (0.2–0.5) or to the lower yield measured by Wu and Johnston (2017) (0.08–0.16), one would infer that secondary organosilicon aerosols from personal care products should be a very minor mass contributor to outdoor aerosol. However, they should be ubiquitous – present as a widespread and diffuse background anthropogenic secondary organosilicon aerosol. A possible estimate of the strength of this “signal” is ∼0.1 ng m−3, based on a reduction of the levels from Janechek et al. (2017) according to the yield experiments of this work.
However, a number of questions remain about this. The assessment done by Janechek et al. (2017) looked only at (a) well-mixed outdoor air (mixed at a spatial scale of 36 km), and (b) D4, D5 and D6 from estimated personal care product use. Other sources of volatile Si were not considered. McDonald et al. (2018) estimated that volatile chemical products (VCPs) represent half the petrochemical-derived VOC emissions and are the major contributor to potential SOA.
Future questions about secondary organosilicon aerosols include
- a.
how relevant are the harsh oxidation (high OH) conditions used in available experimental work for the real atmosphere,
- b.
what are silicon oxidation product concentrations (gas and particle) in indoor environments and microenvironments such as cars where up to 25 ppb D5 have been observed (Coggon et al., 2018),
- c.
how well do personal care products with D4–D6 represent all SOA-producing organosilicon gases, and
- d.
how do Si-containing and non-silicon-containing SOA precursors interact, since both are clearly present from VCPs?
While Tang et al. (2015) showed that 31 % of molecules offgassed in an indoor environment were cVMS, and McDonald et al. (2018) showed that a large ambient contribution to anthropogenic SOA is from VCPs, the situation of a substantial anthropogenic organosilicon SOA contribution from Si-containing VCPs cannot be ruled out yet. Reaction of VCPs in the atmosphere can also contribute to O3 formation.
The only probable ambient detection of photochemical organosilicon SOA in the literature is that of Bzdek et al. (2014), who measured a 1 h averaged peak of 5.5 ng m−3 of Si using the Nano-Aerosol Mass Spectrometer (NAMS) in Pasadena, California, in the 20–25 nm range. Other detections by the same instrument occurred in coastal Delaware on the US East Coast.
If our understanding of the chemistry, physics, and sources is complete, then issues of spatio-temporal variability can be addressed through finer-scale models and comparison to enhanced measurements. For large-scale models that aim to produce a regional, continental, or hemispheric organosilicon signature from cVMS personal care products, the best available information on yield is shown in Fig. 7, which combines experimental data from this work and Wu and Johnston (2017). Fitting the data to Eq. (5), an Odum two-parameter semi-volatile model results in parameters with yields (α) of 0.14 and 0.82, respectively, for saturation concentrations (c*) of 0.95 and 484 µg m−3. The variable α is the mass-based stoichiometric yield, Kom the particle-phase partitioning coefficient (m3 µg−1) which is equivalent to (µg m−3), Mo the aerosol mass concentration (µg m−3), and Y the aerosol yield (aerosol mass fraction). Accordingly, ambient modeling of cVMS SOA could be performed with these parameters, or with a one-product model using the lower-volatility species (α of 0.14 at c* of 0.95 µg m−3), or a non-volatile product with a yield of ∼0.1. Information about the temperature dependence of these values is currently unknown.
These estimates are subject to the obvious caveats of the high concentration experiments done to date, the uncertainties of applying OFR results to the ambient atmosphere, and the possibility of alternate oxidants or undiscovered aqueous or heterogeneous pathways. It is also important to point out that the application of the D5 yield measurements to other siloxanes (e.g. D4 or D6) is uncertain due to the lack of yield measurements for these compounds. D4 SOA has been confirmed in chamber work (Wu and Johnston, 2016) but yields were not quantified. One would anticipate based on decreasing volatility with ring size of the precursors (Lei et al., 2010), yields would increase for larger siloxanes. Regardless, this work should be sufficient as a guide for future laboratory, modeling, and field experiments on the subject of organosilicon aerosols.
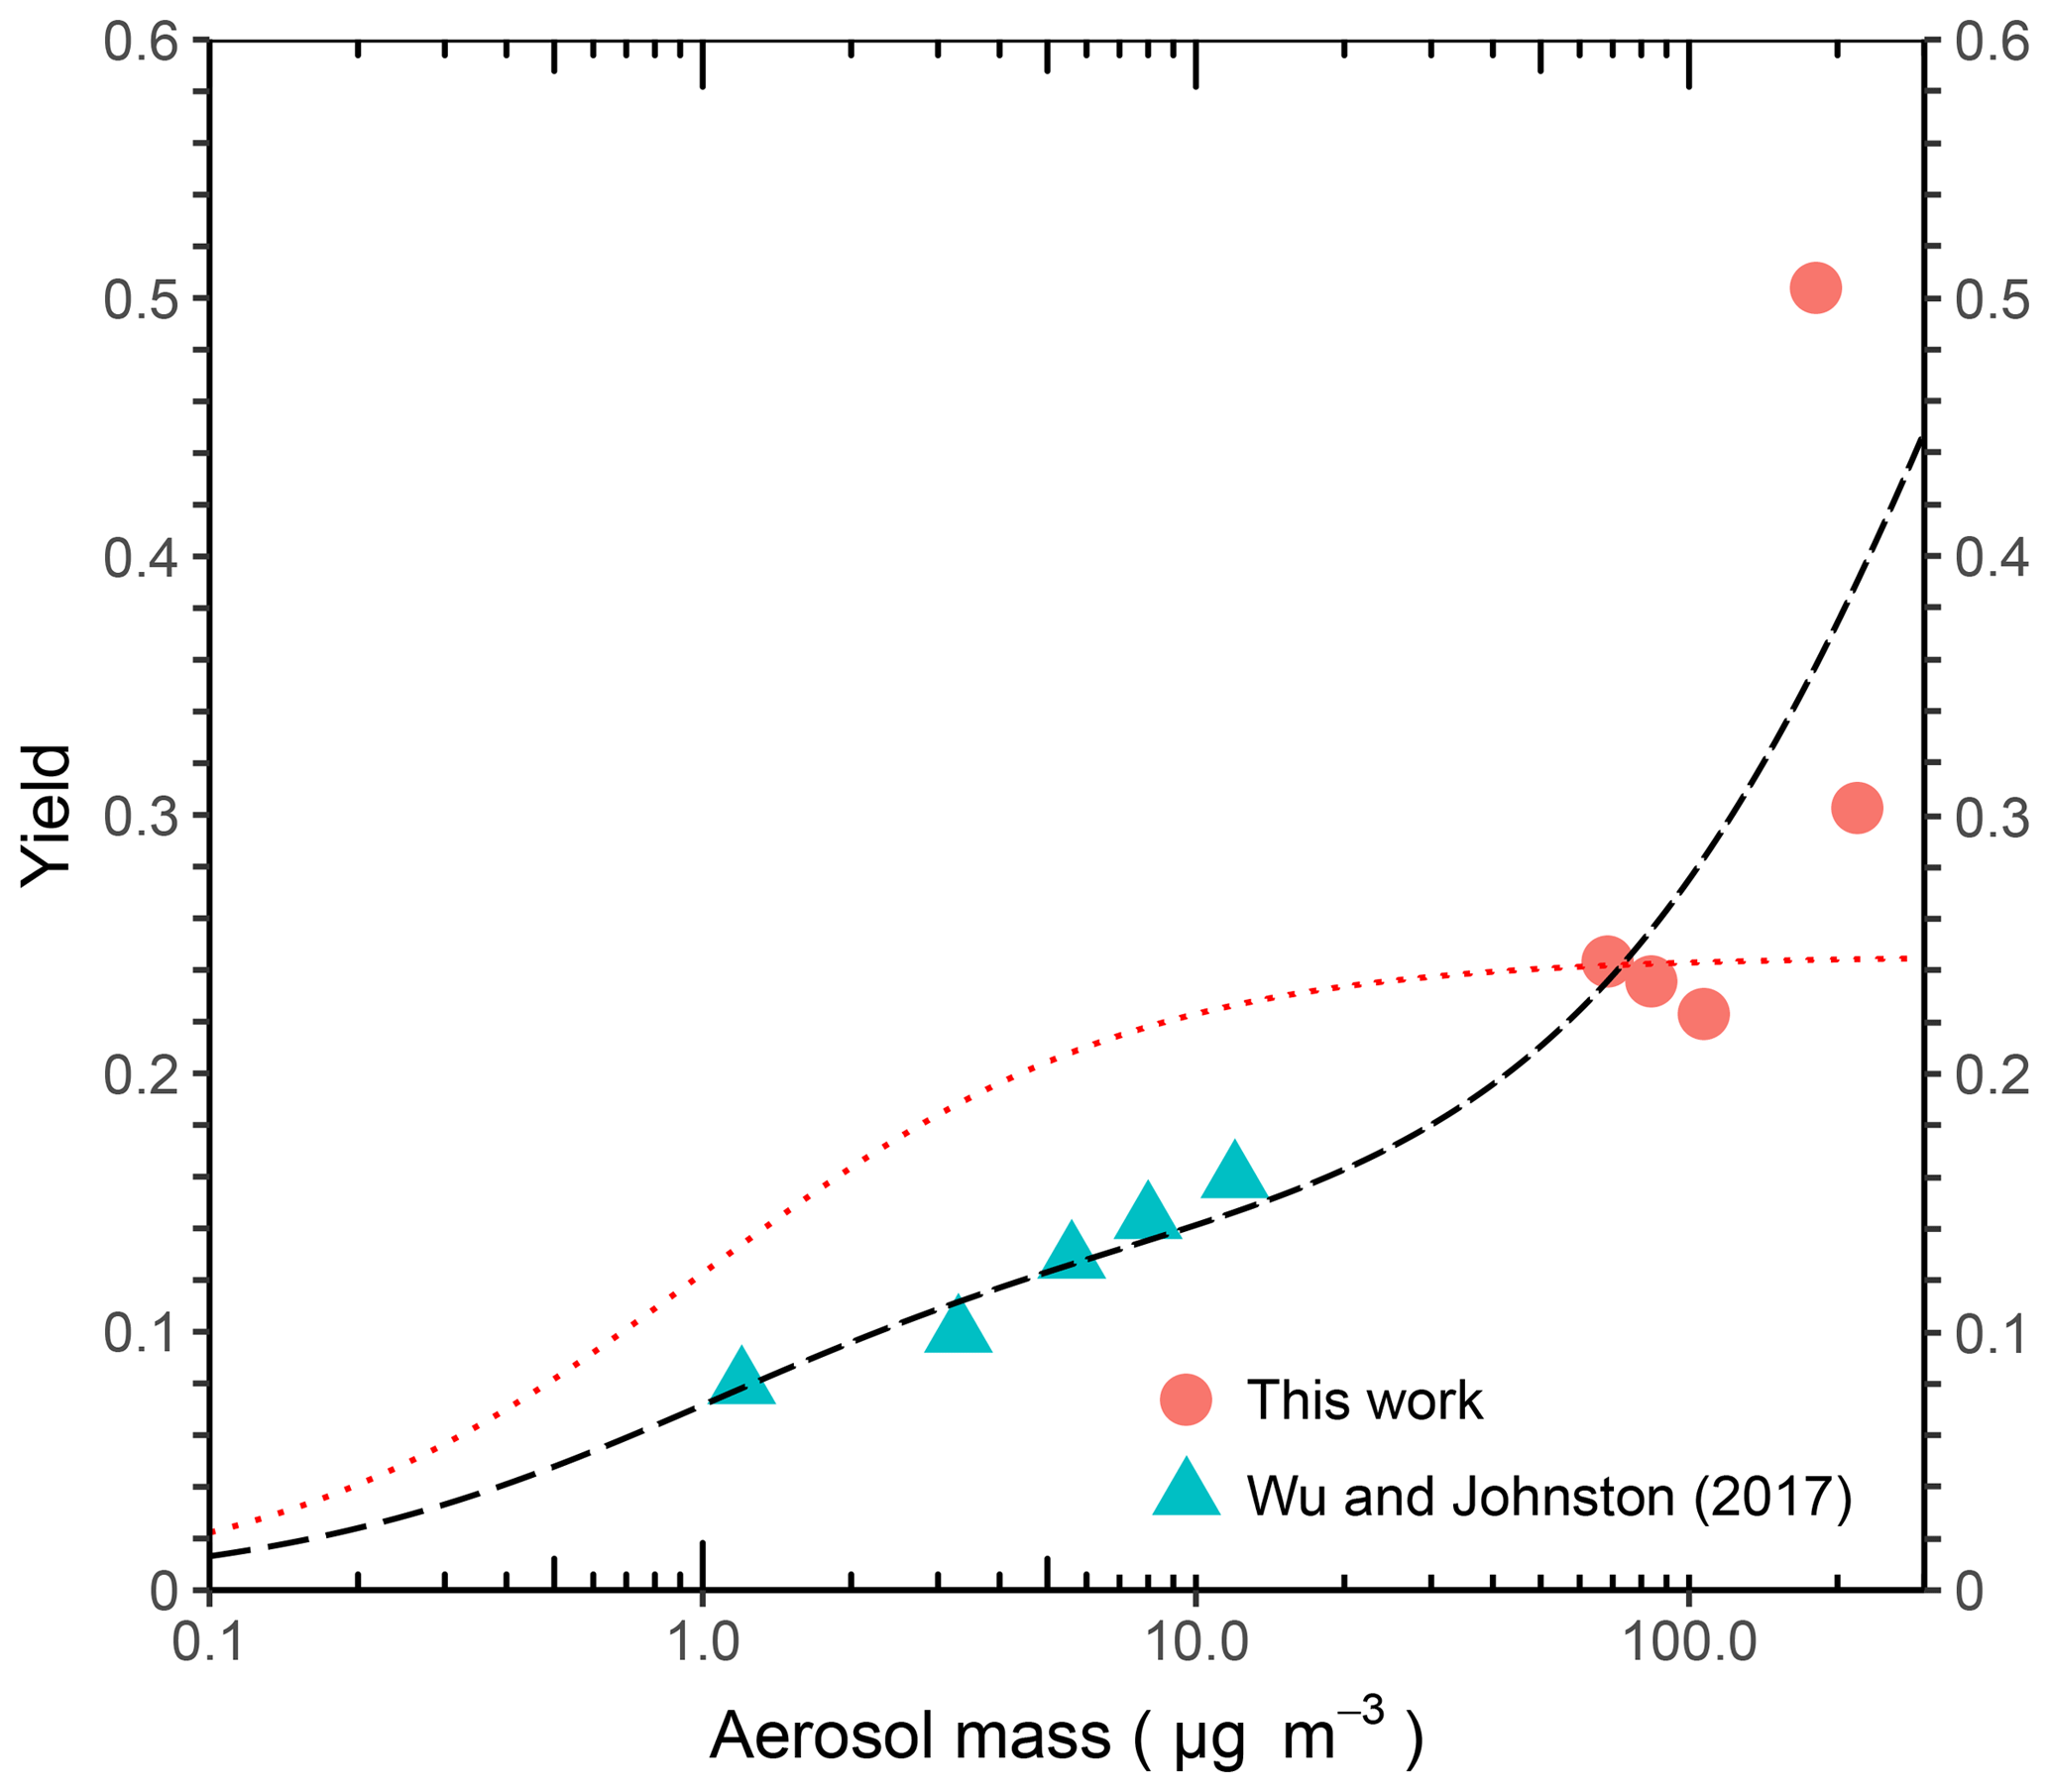
Figure 7Two-product model fit (black long dash) and one-product model fit with a saturation concentration (c*) of 1 µg m−3 (red short dash) overlaid with chamber data from this work and D5 oxidation experiments of Wu and Johnston (2017). Parameters for the two-product model fit are yields of 0.14 and 0.82, respectively, for c* of 0.95 and 484 µg m−3. Parameters for the one-product model are a c* of 1 µg m−3 and a yield of 0.25.
This study adds to the short list of laboratory confirmations where aerosol formation from OH oxidation of D5 has been observed and provides one of the first assessments of particle morphology. In this work, a further confirmation of atmospheric relevance was conducted by verifying that similar aerosols were produced when vapor from solid antiperspirant was used as the reactant. A number of important physical properties of these aerosols have now been established, including morphology via electron microscopy, chemical composition (EDS analysis microscopy), sensitivity to seed aerosol, volatility (V-TDMA), and hygroscopicity (CCN activation). We can conclude that in our OFR experiments D5 with OH produces non-volatile, nearly insoluble aerosols at high yields. Electron microscopy and EDS analysis indicated fractal chain agglomerates were formed in the OFR, with substantial Si and O in the elemental EDS spectra. Using gases emitted from personal care products as the OFR reactant, generated particles with similar morphology and chemical composition compared to the D5 experiments. Yield dependence on OH exposure and size dependence of hygroscopicity suggest that multiple condensable products make up these aerosols. This is consistent with the proposed mechanism and molecular product assignments of Wu and Johnston (2017). Important caveats of our work are the high concentrations under which these experiments were conducted, and the limited number of trials for yield, with only one at each condition.
Through integration of this work with other experiments (Wu and Johnston, 2017) and modeling (Janechek et al., 2017), we have proposed aerosol yield parameterization suitable for atmospheric modeling, and can now estimate the SOA yield from personal care product cVMS. The SOA from silicon-containing personal care products is likely present downwind of many populated areas, and thus may be an additional marker of anthropogenic aerosols. Field confirmation of these values, determination of spatial–temporal patterns, and reconciling of the limited modeling and observational studies are needed.
Additionally, this work provides much needed physical property data and yield parameterization to describe aerosol formation. With the caveats of the low number of replicates, high concentrations, and uncertainty due to sensitivity to seed aerosol, we provide recommendations for modelers:
- a.
a two-parameter semi-volatile model with yield parameters of 0.14 and 0.82, respectively, for saturation concentrations (c*) of 0.95 and 484 µg m−3;
- b.
a one-product model using the lower-volatility species (α of 0.14 at c* of 0.95 µg m−3); and
- c.
a non-volatile product with a yield of ∼0.1.
Data from this study are available upon request by contacting the corresponding author.
The supplement related to this article is available online at: https://doi.org/10.5194/acp-19-1649-2019-supplement.
NJJ and COS designed the study. NJJ, NB, AS, and COS carried out the aerosol experimental work. RFM prepared, extracted, and analyzed the solid-phase extraction cartridges for D5 vapor quantification. AS and RLB built the V-TDMA instrument used for the volatility measurements. WHB provided the OFR chamber and operating expertise. NJJ performed the data analysis. NJJ prepared the manuscript with contributions from COS, WHB, RFM, AS, and RLB.
The authors declare that they have no conflict of interest.
This research was funded by the National Institute of Environmental Health
Sciences through the University of Iowa Environmental Health Sciences
Research Center (NIEHS/NIH P30ES005605), the Iowa Superfund Research Program,
the National Institute of Environmental Health Sciences (grant P42ES013661),
and the National Science Foundation (grant ATM-0748602). We thank the RJ Lee
Group for providing the TPS100 sampler and for performing the microscopy and
elemental analysis. We also thank Keri Hornbuckle for use of her analytical
environmental chemistry lab and for discussions about the
research.
Edited by: Rupert Holzinger
Reviewed by: two anonymous referees
Ahrens, L., Harner, T., and Shoeib, M.: Temporal variations of cyclic and linear volatile methylsiloxanes in the atmosphere using passive samplers and high-volume air samplers, Environ. Sci. Technol., 48, 9374–9381, https://doi.org/10.1021/es502081j, 2014.
Atkinson, R.: Kinetics of the Gas-Phase Reactions of a Series of Organosilicon Compounds with OH and NO3 Radicals and O3 at K, Environ. Sci. Technol., 25, 863–866, https://doi.org/10.1021/es00017a005, 1991.
Brooke, D., Crookes, M., Gray, D., and Robertson, S.: Environmental Risk Assessment Report: Decamethylcyclopentasiloxane, Environment Agency of England and Wales, Bristol, UK, ISBN 978-1-84911-029-7, 223 pp., 2009a.
Brooke, D., Crookes, M., Gray, D., and Robertson, S.: Environmental Risk Assessment Report: Dodecamethylcyclohexasiloxane, Environment Agency of England and Wales, Bristol, UK, ISBN 978-1-84911-030-3, 108 pp. 2009b.
Brooke, D., Crookes, M., Gray, D., and Robertson, S.: Environmental Risk Assessment Report: Octamethylcyclotetrasiloxane, Environment Agency of England and Wales, Bristol, UK, ISBN 978-1-84911-031-0, 201 pp., 2009c.
Bruns, E. A., El Haddad, I., Keller, A., Klein, F., Kumar, N. K., Pieber, S. M., Corbin, J. C., Slowik, J. G., Brune, W. H., Baltensperger, U., and Prévôt, A. S. H.: Inter-comparison of laboratory smog chamber and flow reactor systems on organic aerosol yield and composition, Atmos. Meas. Tech., 8, 2315–2332, https://doi.org/10.5194/amt-8-2315-2015, 2015.
Buser, A. M., Kierkegaard, A., Bogdal, C., MacLeod, M., Scheringer, M., and Hungerbuhler, K.: Concentrations in Ambient Air and Emissions of Cyclic Volatile Methylsiloxanes in Zurich, Switzerland, Environ. Sci. Technol., 47, 7045–7051, https://doi.org/10.1021/es3046586, 2013.
Bzdek, B. R., Horan, A. J., Pennington, M. R., Janechek, N. J., Baek, J., Stanier, C. O., and Johnston, M. V.: Silicon is a Frequent Component of Atmospheric Nanoparticles, Environ. Sci. Technol., 48, 11137–11145, https://doi.org/10.1021/es5026933, 2014.
Capela, D., Alves, A., Homem, V., and Santos, L.: From the shop to the drain – Volatile methylsiloxanes in cosmetics and personal care products, Environ. Int., 92–93, 50–62, https://doi.org/10.1016/j.envint.2016.03.016, 2016.
Cerully, K. M., Hite, J. R., McLaughlin, M., and Nenes, A.: Toward the Determination of Joint Volatility-Hygroscopicity Distributions: Development and Response Characterization for Single-Component Aerosol, Aerosol Sci. Technol., 48, 296–312, https://doi.org/10.1080/02786826.2013.870326, 2014.
Chandramouli, B. and Kamens, R. M.: The photochemical formation and gas-particle partitioning of oxidation products of decamethyl cyclopentasiloxane and decamethyl tetrasiloxane in the atmosphere, Atmos. Environ., 35, 87–95, https://doi.org/10.1016/s1352-2310(00)00289-2, 2001.
Chhabra, P. S., Lambe, A. T., Canagaratna, M. R., Stark, H., Jayne, J. T., Onasch, T. B., Davidovits, P., Kimmel, J. R., and Worsnop, D. R.: Application of high-resolution time-of-flight chemical ionization mass spectrometry measurements to estimate volatility distributions of α-pinene and naphthalene oxidation products, Atmos. Meas. Tech., 8, 1–18, https://doi.org/10.5194/amt-8-1-2015, 2015.
Clarson, S. J. and Semlyen, J. A.: Studies of cyclic and linear poly(dimethyl-siloxanes): 21. High temperature thermal behaviour, Polymer, 27, 91–95, https://doi.org/10.1016/0032-3861(86)90360-5, 1986.
Coggon, M. M., McDonald, B. C., Vlasenko, A., Veres, P. R., Bernard, F., Koss, A. R., Yuan, B., Gilman, J. B., Peischl, J., Aikin, K. C., DuRant, J., Warneke, C., Li, S.-M., and de Gouw, J. A.: Diurnal Variability and Emission Pattern of Decamethylcyclopentasiloxane (D5) from the Application of Personal Care Products in Two North American Cities, Environ. Sci. Technol., 52, 5610–5618, https://doi.org/10.1021/acs.est.8b00506, 2018.
Companioni-Damas, E. Y., Santos, F. J., and Galceran, M. T.: Linear and cyclic methylsiloxanes in air by concurrent solvent recondensation-large volume injection-gas chromatography-mass spectrometry, Talanta, 118, 245–252, https://doi.org/10.1016/j.talanta.2013.10.020, 2014.
Davis, D. D., Ravishankara, A. R., and Fischer, S.: SO2 oxidation via the hydroxyl radical: Atmospheric fate of HSOx radicals, Geophys. Res. Lett., 6, 113–116, https://doi.org/10.1029/GL006i002p00113, 1979.
Dudzina, T., von Goetz, N., Bogdal, C., Biesterbos, J. W. H., and Hungerbuhler, K.: Concentrations of cyclic volatile methylsiloxanes in European cosmetics and personal care products: Prerequisite for human and environmental exposure assessment, Environ. Int., 62, 86–94, https://doi.org/10.1016/j.envint.2013.10.002, 2014.
ECHA: Annex XV Restriction Report Proposal for a Restriction (D4 and D5), Health & Safety Executive, Bootle, UK, 94 pp., 2015.
ECHA: 10 new substances added to the Candidate List: https://echa.europa.eu/-/ten-new-substances-added-to-the-candidate-list, last access: June 2018.
Environment Canada and Health Canada: Screening Assessment for the Challenge Dodecamethylcyclohexasiloxane (D6), 83 pp., 2008a.
Environment Canada and Health Canada: Screening Assessment for the Challenge Decamethylcyclopentasiloxane (D5), 97 pp., 2008b.
Environment Canada and Health Canada: Screening Assessment for the Challenge Octamethylcyclotetrasiloxane (D4), 90 pp., 2008c.
Erhart, T. G., Golz, J., Eicker, U., and van den Broek, M.: Working Fluid Stability in Large-Scale Organic Rankine Cycle-Units Using Siloxanes-Long-Term Experiences and Fluid Recycling, Energies, 9, 1–16, https://doi.org/10.3390/en9060422, 2016.
Genualdi, S., Harner, T., Cheng, Y., MacLeod, M., Hansen, K. M., van Egmond, R., Shoeib, M., and Lee, S. C.: Global Distribution of Linear and Cyclic Volatile Methyl Siloxanes in Air, Environ. Sci. Technol., 45, 3349–3354, https://doi.org/10.1021/es200301j, 2011.
Gouin, T., van Egmond, R., Sparham, C., Hastie, C., and Chowdhury, N.: Simulated use and wash-off release of decamethylcyclopentasiloxane used in anti-perspirants, Chemosphere, 93, 726–734, https://doi.org/10.1016/j.chemosphere.2012.10.042, 2013.
Hall, A. D. and Patel, M.: Thermal stability of foamed polysiloxane rubbers: Headspace analysis using solid phase microextraction and analysis of solvent extractable material using conventional GC–MS, Polym. Degrad. Stab., 91, 2532–2539, https://doi.org/10.1016/j.polymdegradstab.2005.12.017, 2006.
Horii, Y. and Kannan, K.: Survey of organosilicone compounds, including cyclic and linear siloxanes, in personal-care and household products, Arch. Environ. Con. Tox., 55, 701–710, https://doi.org/10.1007/s00244-008-9172-z, 2008.
Janechek, N. J., Hansen, K. M., and Stanier, C. O.: Comprehensive atmospheric modeling of reactive cyclic siloxanes and their oxidation products, Atmos. Chem. Phys., 17, 8357–8370, https://doi.org/10.5194/acp-17-8357-2017, 2017.
Kang, E., Root, M. J., Toohey, D. W., and Brune, W. H.: Introducing the concept of Potential Aerosol Mass (PAM), Atmos. Chem. Phys., 7, 5727–5744, https://doi.org/10.5194/acp-7-5727-2007, 2007.
Kang, E., Toohey, D. W., and Brune, W. H.: Dependence of SOA oxidation on organic aerosol mass concentration and OH exposure: experimental PAM chamber studies, Atmos. Chem. Phys., 11, 1837–1852, https://doi.org/10.5194/acp-11-1837-2011, 2011.
Karl, T., Striednig, M., Graus, M., Hammerle, A., and Wohlfahrt, G.: Urban flux measurements reveal a large pool of oxygenated volatile organic compound emissions, P. Natl. Acad. Sci. USA, 115, 1186–1191, https://doi.org/10.1073/pnas.1714715115, 2018.
Kierkegaard, A. and McLachlan, M. S.: Determination of decamethylcyclopentasiloxane in air using commercial solid phase extraction cartridges, J. Chromatogr. A, 1217, 3557–3560, https://doi.org/10.1016/j.chroma.2010.03.045, 2010.
Krechmer, J. E., Pagonis, D., Ziemann, P. J., and Jimenez, J. L.: Quantification of Gas-Wall Partitioning in Teflon Environmental Chambers Using Rapid Bursts of Low-Volatility Oxidized Species Generated in Situ, Environ. Sci. Technol., 50, 5757–5765, https://doi.org/10.1021/acs.est.6b00606, 2016.
Kroll, J. H., Smith, J. D., Che, D. L., Kessler, S. H., Worsnop, D. R., and Wilson, K. R.: Measurement of fragmentation and functionalization pathways in the heterogeneous oxidation of oxidized organic aerosol, Phys. Chem. Chem. Phys., 11, 8005–8014, https://doi.org/10.1039/B905289E, 2009.
Lambe, A. and Jimenez, J. L.: PAM Wiki: Estimation Equations, availabe at: https://sites.google.com/site/pamwiki/hardware/estimation-equations (last access: February 2018), 2018.
Lambe, A. T., Ahern, A. T., Williams, L. R., Slowik, J. G., Wong, J. P. S., Abbatt, J. P. D., Brune, W. H., Ng, N. L., Wright, J. P., Croasdale, D. R., Worsnop, D. R., Davidovits, P., and Onasch, T. B.: Characterization of aerosol photooxidation flow reactors: heterogeneous oxidation, secondary organic aerosol formation and cloud condensation nuclei activity measurements, Atmos. Meas. Tech., 4, 445–461, https://doi.org/10.5194/amt-4-445-2011, 2011a.
Lambe, A. T., Onasch, T. B., Massoli, P., Croasdale, D. R., Wright, J. P., Ahern, A. T., Williams, L. R., Worsnop, D. R., Brune, W. H., and Davidovits, P.: Laboratory studies of the chemical composition and cloud condensation nuclei (CCN) activity of secondary organic aerosol (SOA) and oxidized primary organic aerosol (OPOA), Atmos. Chem. Phys., 11, 8913–8928, https://doi.org/10.5194/acp-11-8913-2011, 2011b.
Lambe, A. T., Onasch, T. B., Croasdale, D. R., Wright, J. P., Martin, A. T., Franklin, J. P., Massoli, P., Kroll, J. H., Canagaratna, M. R., Brune, W. H., Worsnop, D. R., and Davidovits, P.: Transitions from Functionalization to Fragmentation Reactions of Laboratory Secondary Organic Aerosol (SOA) Generated from the OH Oxidation of Alkane Precursors, Environ. Sci. Technol., 46, 5430–5437, https://doi.org/10.1021/es300274t, 2012.
Lambe, A. T., Chhabra, P. S., Onasch, T. B., Brune, W. H., Hunter, J. F., Kroll, J. H., Cummings, M. J., Brogan, J. F., Parmar, Y., Worsnop, D. R., Kolb, C. E., and Davidovits, P.: Effect of oxidant concentration, exposure time, and seed particles on secondary organic aerosol chemical composition and yield, Atmos. Chem. Phys., 15, 3063–3075, https://doi.org/10.5194/acp-15-3063-2015, 2015.
Latimer, H. K., Kamens, R. M., and Chandra, G.: The Atmospheric Partitioning of Decamethylcylcopentasiloxane (D5) and 1-Hydroxynonomethylcyclopentasiloxane (D4TOH) on Different Types of Atmospheric Particles, Chemosphere, 36, 2401–2414, https://doi.org/10.1016/S0045-6535(97)10209-0, 1998.
Lei, Y. D., Wania, F., and Mathers, D.: Temperature-Dependent Vapor Pressure of Selected Cyclic and Linear Polydimethylsiloxane Oligomers, J. Chem. Eng. Data, 55, 5868–5873, https://doi.org/10.1021/je100835n, 2010.
Leith, D., Miller-Lionberg, D., Casuccio, G., Lersch, T., Lentz, H., Marchese, A., and Volckens, J.: Development of a Transfer Function for a Personal, Thermophoretic Nanoparticle Sampler, Aerosol Sci. Technol., 48, 81–89, https://doi.org/10.1080/02786826.2013.861593, 2014.
Li, R., Palm, B. B., Ortega, A. M., Hlywiak, J., Hu, W., Peng, Z., Day, D. A., Knote, C., Brune, W. H., de Gouw, J. A., and Jimenez, J. L.: Modeling the Radical Chemistry in an Oxidation Flow Reactor: Radical Formation and Recycling, Sensitivities, and the OH Exposure Estimation Equation, J. Phys. Chem. A, 119, 4418–4432, https://doi.org/10.1021/jp509534k, 2015.
Lu, Y., Yuan, T., Wang, W., and Kannan, K.: Concentrations and assessment of exposure to siloxanes and synthetic musks in personal care products from China, Environ. Pollut., 159, 3522–3528, https://doi.org/10.1016/j.envpol.2011.08.015, 2011.
Mackay, D., Cowan-Ellsberry, C. E., Powell, D. E., Woodburn, K. B., Xu, S., Kozerski, G. E., and Kim, J.: Decamethylcyclopentasiloxane (D5) environmental sources, fate, transport, and routes of exposure, Environ. Toxicol. Chem., 34, 2689–2702, https://doi.org/10.1002/etc.2941, 2015.
MacLeod, M., von Waldow, H., Tay, P., Armitage, J. M., Wohrnschimmel, H., Riley, W. J., McKone, T. E., and Hungerbuhler, K.: BETR global – A geographically-explicit global-scale multimedia contaminant fate model, Environ. Pollut., 159, 1442–1445, https://doi.org/10.1016/j.envpol.2011.01.038, 2011.
McDonald, B. C., de Gouw, J. A., Gilman, J. B., Jathar, S. H., Akherati, A., Cappa, C. D., Jimenez, J. L., Lee-Taylor, J., Hayes, P. L., McKeen, S. A., Cui, Y. Y., Kim, S.-W., Gentner, D. R., Isaacman-VanWertz, G., Goldstein, A. H., Harley, R. A., Frost, G. J., Roberts, J. M., Ryerson, T. B., and Trainer, M.: Volatile chemical products emerging as largest petrochemical source of urban organic emissions, Science, 359, 760–764, https://doi.org/10.1126/science.aaq0524, 2018.
McLachlan, M. S., Kierkegaard, A., Hansen, K. M., van Egmond, R., Christensen, J. H., and Skjoth, C. A.: Concentrations and Fate of Decamethylcyclopentasiloxane (D-5) in the Atmosphere, Environ. Sci. Technol., 44, 5365–5370, https://doi.org/10.1021/es100411w, 2010.
Montemayor, B. P., Price, B. B., and van Egmond, R. A.: Accounting for intended use application in characterizing the contributions of cyclopentasiloxane (D5) to aquatic loadings following personal care product use: antiperspirants, skin care products and hair care products, Chemosphere, 93, 735–740, https://doi.org/10.1016/j.chemosphere.2012.10.043, 2013.
OECD Environment Directorate: The 2004 OECD List of High Production Volume Chemicals, OECD Environment Directorate Environment, Health and Safety Division, Paris, FR, 143 pp., 2004.
Pagonis, D., Krechmer, J. E., de Gouw, J., Jimenez, J. L., and Ziemann, P. J.: Effects of gas–wall partitioning in Teflon tubing and instrumentation on time-resolved measurements of gas-phase organic compounds, Atmos. Meas. Tech., 10, 4687–4696, https://doi.org/10.5194/amt-10-4687-2017, 2017.
Palm, B. B., Campuzano-Jost, P., Ortega, A. M., Day, D. A., Kaser, L., Jud, W., Karl, T., Hansel, A., Hunter, J. F., Cross, E. S., Kroll, J. H., Peng, Z., Brune, W. H., and Jimenez, J. L.: In situ secondary organic aerosol formation from ambient pine forest air using an oxidation flow reactor, Atmos. Chem. Phys., 16, 2943–2970, https://doi.org/10.5194/acp-16-2943-2016, 2016.
Palm, B. B., de Sá, S. S., Day, D. A., Campuzano-Jost, P., Hu, W., Seco, R., Sjostedt, S. J., Park, J.-H., Guenther, A. B., Kim, S., Brito, J., Wurm, F., Artaxo, P., Thalman, R., Wang, J., Yee, L. D., Wernis, R., Isaacman-VanWertz, G., Goldstein, A. H., Liu, Y., Springston, S. R., Souza, R., Newburn, M. K., Alexander, M. L., Martin, S. T., and Jimenez, J. L.: Secondary organic aerosol formation from ambient air in an oxidation flow reactor in central Amazonia, Atmos. Chem. Phys., 18, 467–493, https://doi.org/10.5194/acp-18-467-2018, 2018.
Peng, Z., Day, D. A., Stark, H., Li, R., Lee-Taylor, J., Palm, B. B., Brune, W. H., and Jimenez, J. L.: HOx radical chemistry in oxidation flow reactors with low-pressure mercury lamps systematically examined by modeling, Atmos. Meas. Tech., 8, 4863–4890, https://doi.org/10.5194/amt-8-4863-2015, 2015.
Peng, Z., Day, D. A., Ortega, A. M., Palm, B. B., Hu, W., Stark, H., Li, R., Tsigaridis, K., Brune, W. H., and Jimenez, J. L.: Non-OH chemistry in oxidation flow reactors for the study of atmospheric chemistry systematically examined by modeling, Atmos. Chem. Phys., 16, 4283–4305, https://doi.org/10.5194/acp-16-4283-2016, 2016.
Petters, M. D. and Kreidenweis, S. M.: A single parameter representation of hygroscopic growth and cloud condensation nucleus activity, Atmos. Chem. Phys., 7, 1961–1971, https://doi.org/10.5194/acp-7-1961-2007, 2007.
Roberts, G. C. and Nenes, A.: A continuous-flow streamwise thermal-gradient CCN chamber for atmospheric measurements, Aerosol Sci. Technol., 39, 206–221, https://doi.org/10.1080/027868290913988, 2005.
Rose, D., Gunthe, S. S., Mikhailov, E., Frank, G. P., Dusek, U., Andreae, M. O., and Pöschl, U.: Calibration and measurement uncertainties of a continuous-flow cloud condensation nuclei counter (DMT-CCNC): CCN activation of ammonium sulfate and sodium chloride aerosol particles in theory and experiment, Atmos. Chem. Phys., 8, 1153–1179, https://doi.org/10.5194/acp-8-1153-2008, 2008.
Rose, D., Nowak, A., Achtert, P., Wiedensohler, A., Hu, M., Shao, M., Zhang, Y., Andreae, M. O., and Pöschl, U.: Cloud condensation nuclei in polluted air and biomass burning smoke near the mega-city Guangzhou, China – Part 1: Size-resolved measurements and implications for the modeling of aerosol particle hygroscopicity and CCN activity, Atmos. Chem. Phys., 10, 3365–3383, https://doi.org/10.5194/acp-10-3365-2010, 2010.
Singh, A.: Measurement of the physical properties of ultrafine particles in the rural continental U.S., The University of Iowa, Ph.D. dissertation, 2015.
Sommerlade, R., Parlar, H., Wrobel, D., and Kochs, P.: Product Analysis and Kinetics of the Gas-Phase Reactions of Selected Organosilicon Compounds with OH Radicals Using a Smog Chamber – Mass Spectrometer System, Environ. Sci. Technol., 27, 2435–2440, https://doi.org/10.1021/es00048a019, 1993.
Tang, X., Misztal, P. K., Nazaroff, W. W., and Goldstein, A. H.: Siloxanes Are the Most Abundant Volatile Organic Compound Emitted from Engineering Students in a Classroom, Environ. Sci. Tech. Lett., 2, 303–307, https://doi.org/10.1021/acs.estlett.5b00256, 2015.
Varaprath, S., Frye, C. L., and Hamelink, J.: Aqueous solubility of permethylsiloxanes (silicones), Environ. Toxicol. Chem., 15, 1263–1265, https://doi.org/10.1002/etc.5620150803, 1996.
Wang, R., Moody, R. P., Koniecki, D., and Zhu, J.: Low molecular weight cyclic volatile methylsiloxanes in cosmetic products sold in Canada: implication for dermal exposure, Environ. Int., 35, 900–904, https://doi.org/10.1016/j.envint.2009.03.009, 2009.
Willeke, K. and Baron, P. A.: Aerosol Measurement Principles, Techniques, and Applications, Van Nostrand Reinhold, New York, 876 pp., 1993.
Winkler, P. M., Ortega, J., Karl, T., Cappellin, L., Friedli, H. R., Barsanti, K., McMurry, P. H., and Smith, J. N.: Identification of the biogenic compounds responsible for size-dependent nanoparticle growth, Geophys. Res. Lett., 39, L20815, https://doi.org/10.1029/2012GL053253, 2012.
Wu, Y. and Johnston, M. V.: Molecular Characterization of Secondary Aerosol from Oxidation of Cyclic Methylsiloxanes, J. Am. Soc. Mass. Spectr., 27, 402–409, https://doi.org/10.1007/s13361-015-1300-1, 2016.
Wu, Y. and Johnston, M. V.: Aerosol Formation from OH Oxidation of the Volatile Cyclic Methyl Siloxane (cVMS) Decamethylcyclopentasiloxane, Environ. Sci. Technol., 51, 4445–4451, https://doi.org/10.1021/acs.est.7b00655, 2017.
Xu, S. and Wania, F.: Chemical fate, latitudinal distribution and long-range transport of cyclic volatile methylsiloxanes in the global environment: a modeling assessment, Chemosphere, 93, 835–843, https://doi.org/10.1016/j.chemosphere.2012.10.056, 2013.
Yucuis, R. A., Stanier, C. O., and Hornbuckle, K. C.: Cyclic siloxanes in air, including identification of high levels in Chicago and distinct diurnal variation, Chemosphere, 92, 905–910, https://doi.org/10.1016/j.chemosphere.2013.02.051, 2013.
Zhao, D. F., Buchholz, A., Kortner, B., Schlag, P., Rubach, F., Kiendler-Scharr, A., Tillmann, R., Wahner, A., Flores, J. M., Rudich, Y., Watne, Å. K., Hallquist, M., Wildt, J., and Mentel, T. F.: Size-dependent hygroscopicity parameter (κ) and chemical composition of secondary organic cloud condensation nuclei, Geophys. Res. Lett., 42, 10920–10928, https://doi.org/10.1002/2015GL066497, 2015.