the Creative Commons Attribution 4.0 License.
the Creative Commons Attribution 4.0 License.
 | 19 Dec 2019
Multi-method determination of the below-cloud wet scavenging coefficients of aerosols in Beijing, China
Danhui Xu
Xueshun Chen
Nianliang Cheng
Mei Li
Xiaole Pan
Zhiqiang Ma
Yuepeng Pan
Zifa Wang
Wet scavenging is one of the most efficient processes for removing aerosols from the atmosphere. This process is not well constrained in chemical transport models (CTMs) due to a paucity of localized parameterization regarding the below-cloud wet scavenging coefficient (BWSC). Here we conducted field measurements of the BWSC during the Atmospheric Pollution and Human Health Beijing (APHH-Beijing) campaign of 2016. Notably, the observed BWSC values based on the updated aerosol mass balance agree well with another estimation technique, and they fall in a range of 10−5 s−1. The measurement in this winter campaign, combined with that in summer of 2014, supported an exponential power distribution of BWSCs with rainfall intensity. The observed parameters were also compared with both the theoretical calculations and modeling results. We found that the theoretical estimations can effectively characterize the observed BWSCs of aerosols with sizes smaller than 0.2 µm and larger than 2.5 µm. However, the theoretical estimations were an order of magnitude lower than observed BWSCs within 0.2–2.5 µm, a domain size range of urban aerosols. Such an underestimation of BWSC through a theoretical method has been confirmed not only in APHH-Beijing campaign but also in all the rainfall events in summer of 2014. Since the model calculations usually originated from the theoretical estimations with simplified scheme, the significantly lower BWSC could well explain the underprediction of wet depositions in polluted regions as reported by the Model Inter-Comparison Study for Asia (MICS-Asia) and the global assessment of the Task Force on Hemispheric Transport of Atmospheric Pollutants (TF-HTAP). The findings highlighted that the wet deposition module in the CTMs requires improvement based on field measurement estimation to construct a more reasonable simulation scheme for BWSC, especially in polluted regions.
- Article
(1975 KB) - Full-text XML
-
Supplement
(637 KB) - BibTeX
- EndNote


Wet deposition is one of the dominant aerosol sinks on both global and regional scales (Hu et al., 2005; Textor et al., 2006) and can be divided into in-cloud (particles are activated as cloud condensation nuclei and absorbed by cloud water) and below-cloud scavenging (aerosols and gas are captured by raindrops or snow particles after the hydrometeors leave the clouds) (Zhao et al., 2015). Previously, below-cloud scavenging was thought to be less important than in-cloud process and always simplified or even ignored in most global and regional chemical transport models (CTMs) (Tang et al., 2006; Bae et al., 2010; Barth et al., 2000; ENVIRON.INC., 2005; Stier et al., 2005). This may be true in most areas with a clean atmosphere, e.g., some clean regions where air pollutants in the boundary layer were not sufficient. This may be not the case in polluted regions. Recently, some regional models in MICS-Asia (Model Inter-Comparison Study for Asia) obviously underestimated and wet deposition in East Asia (Wang et al., 2008). For global model assessment by the Task Force on Hemispheric Transport of Atmospheric Pollutants (TF-HTAP), wet depositions of nitrogen were also underpredicted in regions of North America, Europe and Asia where a high level of volume-weighted averaged (VWA) nitrogen (N) concentrations were measured in rainfall (>1.25 mg N L−1), and sulfur wet deposition in Asia was also underestimated (Vet et al., 2014). Besides the uncertainties in emission inventory and chemical mechanism, the below-cloud scavenging process may also contribute to affecting the wet deposition simulation (Wang et al., 2008). Actually, below-cloud scavenging cannot be negligible in CTMs, which contributed to more than 53 % of the total wet deposition in some polluted areas, such as India (Chatterjee et al., 2010) and North China (Ge et al., 2016; Xu et al., 2017), on the basis of sequential sampling field measurements.
Extensive efforts have been focused on the study of wet scavenging, and many researchers have noted that precipitation, even light rain, can remove 50 %–80 % of the number or mass concentration of below-cloud aerosols both by filed measurements and modeling calculations (Andronache, 2004b; Zhang et al., 2004). The below-cloud wet scavenging coefficient (hereafter, BWSC), denoted K or K(dp) for size-resolved values, is a parameter that describes scavenging ability characteristics fairly well. The main factors affecting the BWSC, including raindrop number size distribution, collection efficiency and raindrop terminal velocity, remain unknown and hence form the large uncertainties of BWSC (Wang et al., 2010). Seinfeld and Pandis (2016) proposed that collection efficiency (Brownian diffusion, directional interception, inertial impaction, thermophoresis and diffusion electrophoresis) is critical in the below-cloud scavenging process. Coarse particles (aerosol particle sizes dp ranging from 2 to 20 µm) are easily scavenged by inertial impaction. Fine particles (dp<0.2 µm) can be removed by Brownian diffusion. However, accumulation mode aerosols () are efficiently scavenged neither by Brownian diffusion nor by directional interception or inertial impaction, and this particle size range is called the “Greenfield gap” (Slinn, 1984). Recently, Bae et al. (2010) added phoretic and electric charging effects to the collection efficiency assessment and found that the BWSCs increase by up to 20 times in the 0.2–3 µm particle size range. Y. Wang et al. (2014) also improved the understanding of the electrical effects of the collision efficiency, which is also assumed to be a major source of uncertainty but is always ignored in theoretical estimations. It also improved the BWSC estimation by an order of magnitude. The raindrop number size distribution and raindrop terminal velocity are both represented by empirical mathematical functions, and these factors are non-negligible. In order to minimize the computational burden, the calculation of BWSCs in most global and regional-scale models are expressed as the product of rain intensity multiplied by the collection efficiency, where the later is simplified as a constant or calculated based on the work of Slinn (Bae et al., 2010; Slinn, 1984). This simplification may undoubtedly create large uncertainties and influence the simulated wet deposition to within a factor of two ranges of the observations. This is significantly larger compared to the 30 % bias of the prediction of air pollutant evaluation. (Vet et al., 2014; Zhu et al., 2018).
Over the past few decades, a lot of wet scavenging coefficient (WSC) field measurements have been the focus of a large number of studies (Andronache, 2004b; Jylhä, 1991; Laakso et al., 2003; Okita et al., 1996; Y. Wang et al., 2014; Xu et al., 2017). In their field measurements, Okita et al. (1996) used the precipitation intensity, cloud-base height and the ratio between the sulfate concentration in aerosols of air mass and in rainwater to estimate the WSC, and this method is widely applied in most field measurements at present (Andronache, 2004b; Yamagata et al., 2009). However, this method cannot distinguish the below-cloud part from the whole wet scavenging process, which is important to the parameterization scheme in CTMs. Xu et al. (2017) adopted sequential sampling and estimated the BWSCs of various soluble inorganic ions using the washout fraction concentration. In addition, the BWSCs display a strong dependency on the aerosol particle size distribution. Laakso et al. (2003) indicated that the BWSCs could be calculated by the aerosol particle number concentrations for various size ranges both before and after rain. This size-resolved method was also applied in Lanzhou (Zhao et al., 2015) and at Huang Mountain (Y. Wang et al., 2014) in China, southern Finland (Andronache et al., 2006), and India (Chate et al., 2003). In general, both methods are widespread for the estimation of WSCs and BWSCs but few were focused on the differences among these methods.
In this study, we compare the WSCs and BWSCs estimated from original and updated observational methods with the theoretical and model calculations under the same conditions to perform a multi-method evaluation to describe the BWSC's characteristics. First, we introduce the basic circumstances of the data collected with multiple observation instruments. Following this, we present the various methods, compare the results and discuss the discrepancies among the different results. Finally, we evaluate the effect of below-cloud scavenging on aerosol concentrations and wet depositions based on multi-method techniques.
2.1 Sampling site and measurement data
In North China, precipitation was mainly concentrated in summer (more than 80 %) and rare in autumn and winter (Xu et al., 2008; Gao et al., 2015; Chen et al., 2013; Han et al., 2019). However, the air pollution events usually occurred in autumn and winter in the North China Plain (NCP). Here we select a typical rainfall event moving from northwest to southeast in winter in Beijing (a typical air polluted city in the NCP) to study the characteristics of BWSC and its implications for aerosol scavenging. The sampling site is situated on top of the two-floor building of the Institute of Atmospheric Physics (IAP, 39∘58′28′′ N, 116∘22′1′′ E), located between the north 3rd and 4th Ring Road in Beijing. The site is a typical urban site and is 1 km away from the main road to the north and east, near residential buildings to the south and a park to the west, and the pollution at this site is mainly from traffic and domestic sources (Sun et al., 2015). The selected rainfall case lasts from 06:56 LT on 20 November to 01:18 LT on 21 November 2016, which is during the wintertime Atmospheric Pollution and Human Health Beijing (APHH-Beijing) campaign of 2016 (Shi et al., 2019). Thus, comprehensive measurements of air pollutants and simulations of pollution mechanisms are available for our use to investigate the wet scavenging process. Figure S1 in the Supplement shows the radar base reflectivity with echo coverage over the urban area of Beijing from 11:54 LT on 20 November, gradually moving from northwest to southeast. The total recorded amount of rainfall is 5.2 mm, and the rainfall is more concentrated in the evening of 20 November (beginning at 16:29 LT on 20 November) during this event. Notably, the rainfall is nonuniform across Beijing (Song et al., 2015). For example, the recorded rainfall in the southern suburban area of Beijing is approximately 7 mm according to the Beijing Meteorological Administration, and this rainfall end at approximately 09:00 LT on 21 November. In this study, the precipitation chemistry and aerosol components sampling processes occur at the exact same time at the APHH-Beijing measurement site.
An automatic wet-only sequential rainfall sampler is deployed to obtain rainfall samples with 1 mm increments in one precipitation event. Four anions (, , Cl− and F−) and five cations (, Na+, K+, Ca2+ and Mg2+) in these samples are measured by ion chromatography (IC, Dionex 600, USA). The VWA concentrations of the major soluble inorganic ions, i.e., , and (hereafter, SNA) in this rainfall are 35.8, 48.7 and 17.5 mg L−1, respectively, and much higher than the VWA concentrations in the winter of 2016 (8.3, 9.5 and 4.1 mg L−1, respectively) and in previous studies in Beijing (6.3, 9.1 and 4.9 mg L−1 in Pan et al. (2012, 2013) and 6.2, 7.9 and 4.6 mg L−1 in Xu et al. (2017) of summer). An ambient ion monitor-ion chromatograph (AIM-IC) developed by URG Corp., Chapel Hill, NC, and Dionex Inc., Sunnyvale, CA, is used to measure the PM2.5 composition. The time resolution is 60 min. A detailed description of the measured concentration in the rainfall and aerosols can be found in Xu et al. (2017).
30 m away from the sampling site, a scanning mobility particle sizer (SMPS) is deployed to observe the particle number size distribution with a 5 min time resolution. The SMPS is used to measure particle number concentration from 14 to 740 nm. A detailed description of the SMPS and methods can be found in Du et al. (2017).
A single-particle aerosol mass spectrometer (SPAMS) can accurately characterize aerosol particles containing various chemical compositions with diameters ranging from 0.2 to 2.5 µm. It was deployed during the measuring time in China National Environmental Monitoring Center (CNEMC), which is located in the northeast, 8 km away from the IAP sampling site. This site is a typical suburban site and mainly affected by residential source. More detailed fundamentals of the SPAMS and description can be found in Li et al. (2011), Lin et al. (2017) and Cheng et al. (2018). Size-resolved airborne , and are the main focuses in this study, and the time resolution is 1 h. In the meantime, a polarization optical particle counter (POPC) is also deployed to obtain coarse particle (0.4–10.35 µm) size distribution at the IAP sampling site, and time resolution is 5 min. Detailed description and settings can be found in Pan et al. (2016, 2017, 2019) and Tian et al. (2018).
2.2 Methods
2.2.1 Theoretical basis
Seinfeld and Pandis (2016) proposed the following basic equation of variation in the particle number concentration N(dp):
This equation considers that there is no chemical reaction or emission, and wet scavenging is an exponential process. dp is the diameter of the aerosol particle and K(dp) is the size-resolved BWSC obtained by the following equation:
where Dp is the raindrop diameter. Ut(Dp) and N(Dp) are the falling terminal velocity and concentration of raindrops, respectively. There are two approaches for describing Ut(Dp): an empirical formula and a physically based formula. Many expressions have been employed for various raindrop diameter ranges. In addition, there are still no available mathematical functions that can accurately characterize the natural raindrop size spectra, and exponential, gamma and lognormal distributions are still used to represent N(Dp) (Wang et al., 2010). Marshall and Palmer (1948) proposed the Marshall–Palmer (M-P) distribution of raindrop size distribution, which is mostly applied to calculations of BWSCs. E(Dp,dp) is the collision efficiency of raindrops and aerosol particles, which, in most studies, mainly involves Brownian diffusion, interception and inertial impaction due to dimensional analysis, without accounting for thermophoresis, diffusiophoresis and electric charges (Slinn, 1984; Wang et al., 2010). An extensive number of studies have realized that using only the three main mechanisms results in underestimation of the collision efficiency, and the contributions from the other mechanisms were added in these studies (Andronache, 2004c; Andronache et al., 2006; Bae et al., 2010). Assuming that a certain size aerosol particle can be captured by raindrops of any size, K(dp) can be calculated theoretically when the falling terminal velocity, raindrop size distribution and collision efficiency are given. In Y. Wang et al. (2014)'s study, they added thermophoresis, diffusiophoresis and electric charges to the quantitative calculation, and we considered this updated to be the theory's result.
2.2.2 Observational method
In addition to the theoretical calculation, field observations are also critical for estimating BWSCs. One approach is based on the change in the number concentration of aerosols (called O1 in this study). When rainfall occurs from t0 to t1, Eq. (1) can be integrated as follows:
where N0(dp) and N1(dp) are the measured aerosol particle number concentrations before the rain occurs (t0) and after the rain ends (t1), respectively (Laakso et al., 2003).
In addition, Andronache (2004b) proposed that the WSC can be estimated by the bulk model based on the aerosol mass balance within a certain bulk, which assumes that there is a box with a horizontal area A and vertical height h above the observation site. The aerosol flux F on the surface per unit time and area is defined as the following equation:
where K is the WSC and M is the mass of the aerosols in the given box. M can be described as follows:
where Ca is the average aerosol concentration in the box.
In addition, F can also be characterized by the following expression:
where Cp is the aerosol concentration in the precipitation collected at the measurement site, P is the precipitation intensity, and A is the horizontal area for the assumed box. The wet deposition Dep in a certain time Δt can be expressed as follows:
and K becomes the following expression:
where Cp and Ca are the paired aerosol concentrations in the precipitation and aerosol during rainfall (Okita et al., 1996). In addition, Andronache (2004b) pointed out that the aerosol concentration in the vertical profile should be considered and updated Eq. (8) as follows:
where Ca(0) is the aerosol concentration at the surface, h is the cloud-base height during rainfall and is the vertical distribution factor of aerosols. Among these variables, Ca(z) are the aerosol concentrations at the z level height and h′(z) is the depth of the layers in the vertical direction. This approach is called O2.
Moreover, most studies have mentioned that the prevailing wind in Beijing can efficiently reduce the aerosol concentrations (Chan and Yao, 2008; Gonzalez and Aristizabal, 2012). In previous studies by Xu et al. (2017), the north and northwest winds have been recognized as the clear streams to scavenge aerosols in situ, and the effects of clean wind are also considered in this study. In addition, with the help of the 1 mm increments sequential rainfall sampling, Xu et al. (2017) has found that the later increments were maintained at a stable, low level that can be separated into rainout processes. Similar to Eq. (9), an updated below-cloud estimated method using Cp,below has been developed as Eq. (10) and is called O2′:
where Cp,below is the washout concentration that has been eliminated from the rainwater concentrations in each increment and is the aerosol concentration at the surface considering the eliminated effects of north and northwest wind.
2.2.3 Modeling calculation
In this study, a three-dimensional regional model, the Nested Air Quality Prediction Modeling System (NAQPMS) was adopted to calculate the aerosol scavenging coefficient. The NAQPMS, developed by IAP, is a fully modularized chemical transport model describing regional- and urban-scale air pollution (Wang et al., 2001). The meteorological condition is driven by Weather Research and Forecasting (WRF) model. The NAQPMS consists of modules used for horizontal and vertical advection (Walcek and Aleksic, 1998); diffusion (Byun and Dennis, 1995); dry and wet deposition (Zhang et al., 2003; Stockwell et al., 1990); and gaseous-phase, aqueous-phase, and heterogeneous atmospheric chemical reactions (Zaveri and Peters, 1999; Stockwell et al., 1990; Li et al., 2012). Carbon bond mechanism Z (CBM-Z) and the aerosol thermodynamic equilibrium partition model (ISORROPIAI1.7) have been used to calculate the gas and inorganic aerosol process. The cloud process and aqueous chemistry modules from the Community Multi-scale Air Quality (CMAQ) modeling system version 4.7 have been coupled in a model by Ge et al. (2014). More details can be found in Li et al. (2016, 2017). The NAQPMS has been widely used in the prediction of acid rain, dust and secondary pollution and can also reproduce the physical and chemical evolution of reactive pollutants well by solving the mass balance equations in terrain-following coordinates (Chen et al., 2019; Yang et al., 2019). It has been applied by the Ministry of Ecology and Environment and local Environmental Protection Bureaus, such as those of Beijing, Shanghai, Guangzhou, Nanjing, etc. The NAQPMS also made great contribution to air quality assurance during the major activities (Z. F. Wang et al., 2001, 2014; Wu et al., 2010).
The below-cloud scavenging module from the Comprehensive Air Quality Model with Extensions (CAMx) version 4.42 was used to calculate the below-cloud wet scavenging process and the wet scavenging coefficient was briefly described as follows (ENVIRON.INC., 2005):
where dp is the mean raindrop size and related to precipitation intensity. The collision efficiency E is a function of aerosol particle size and mainly considers Brownian diffusion, interception and inertial impaction. NAQPMS used in this study assumed SNA resides in fine mode size range (0.1–2.5 µm) and the geometric mean diameter of 0.5 µm was used in the calculation of E.
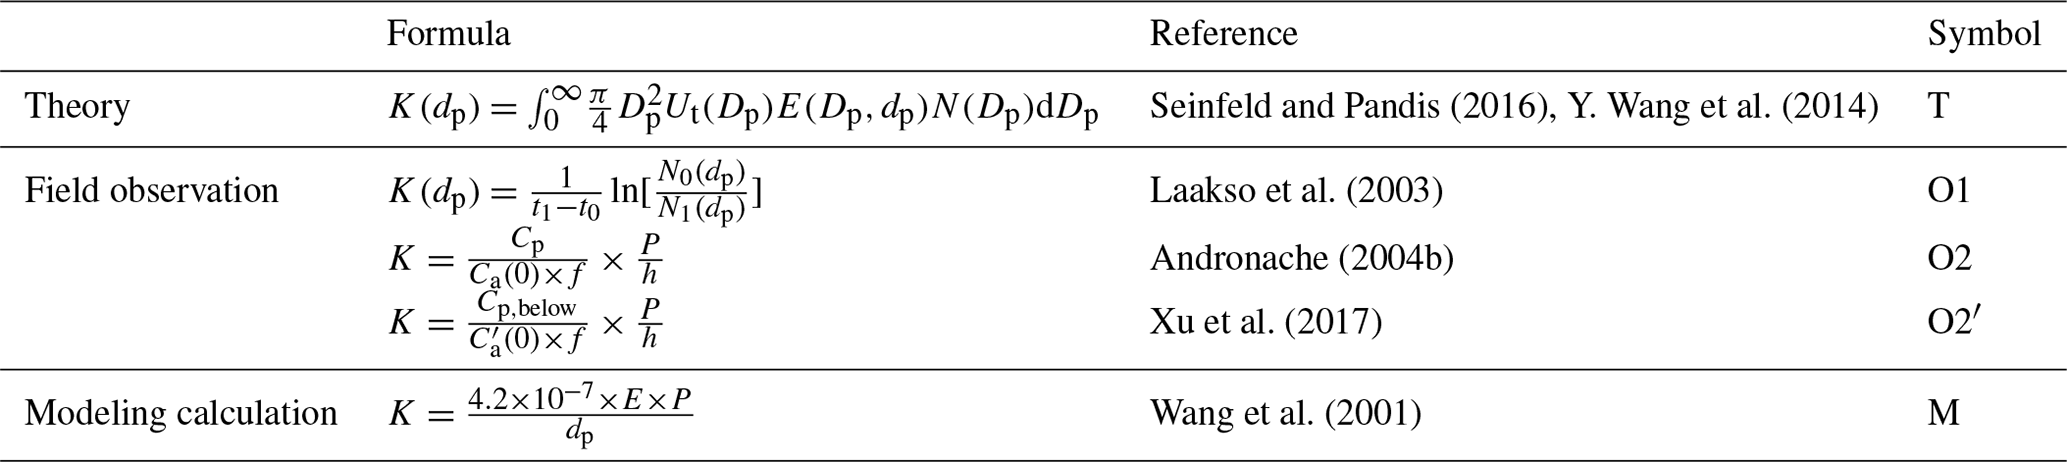
To briefly describe these methods, Table 1 lists the relevant formulae. The theoretical estimated scavenging coefficients are labeled T. The field observations estimated by Eqs. (3) and (9) are labeled O1 and O2, respectively. The updated estimated method by Eq. (10) is labeled O2′. The modeling results are labeled M, and these results are compared with different methods in Sect. 3.
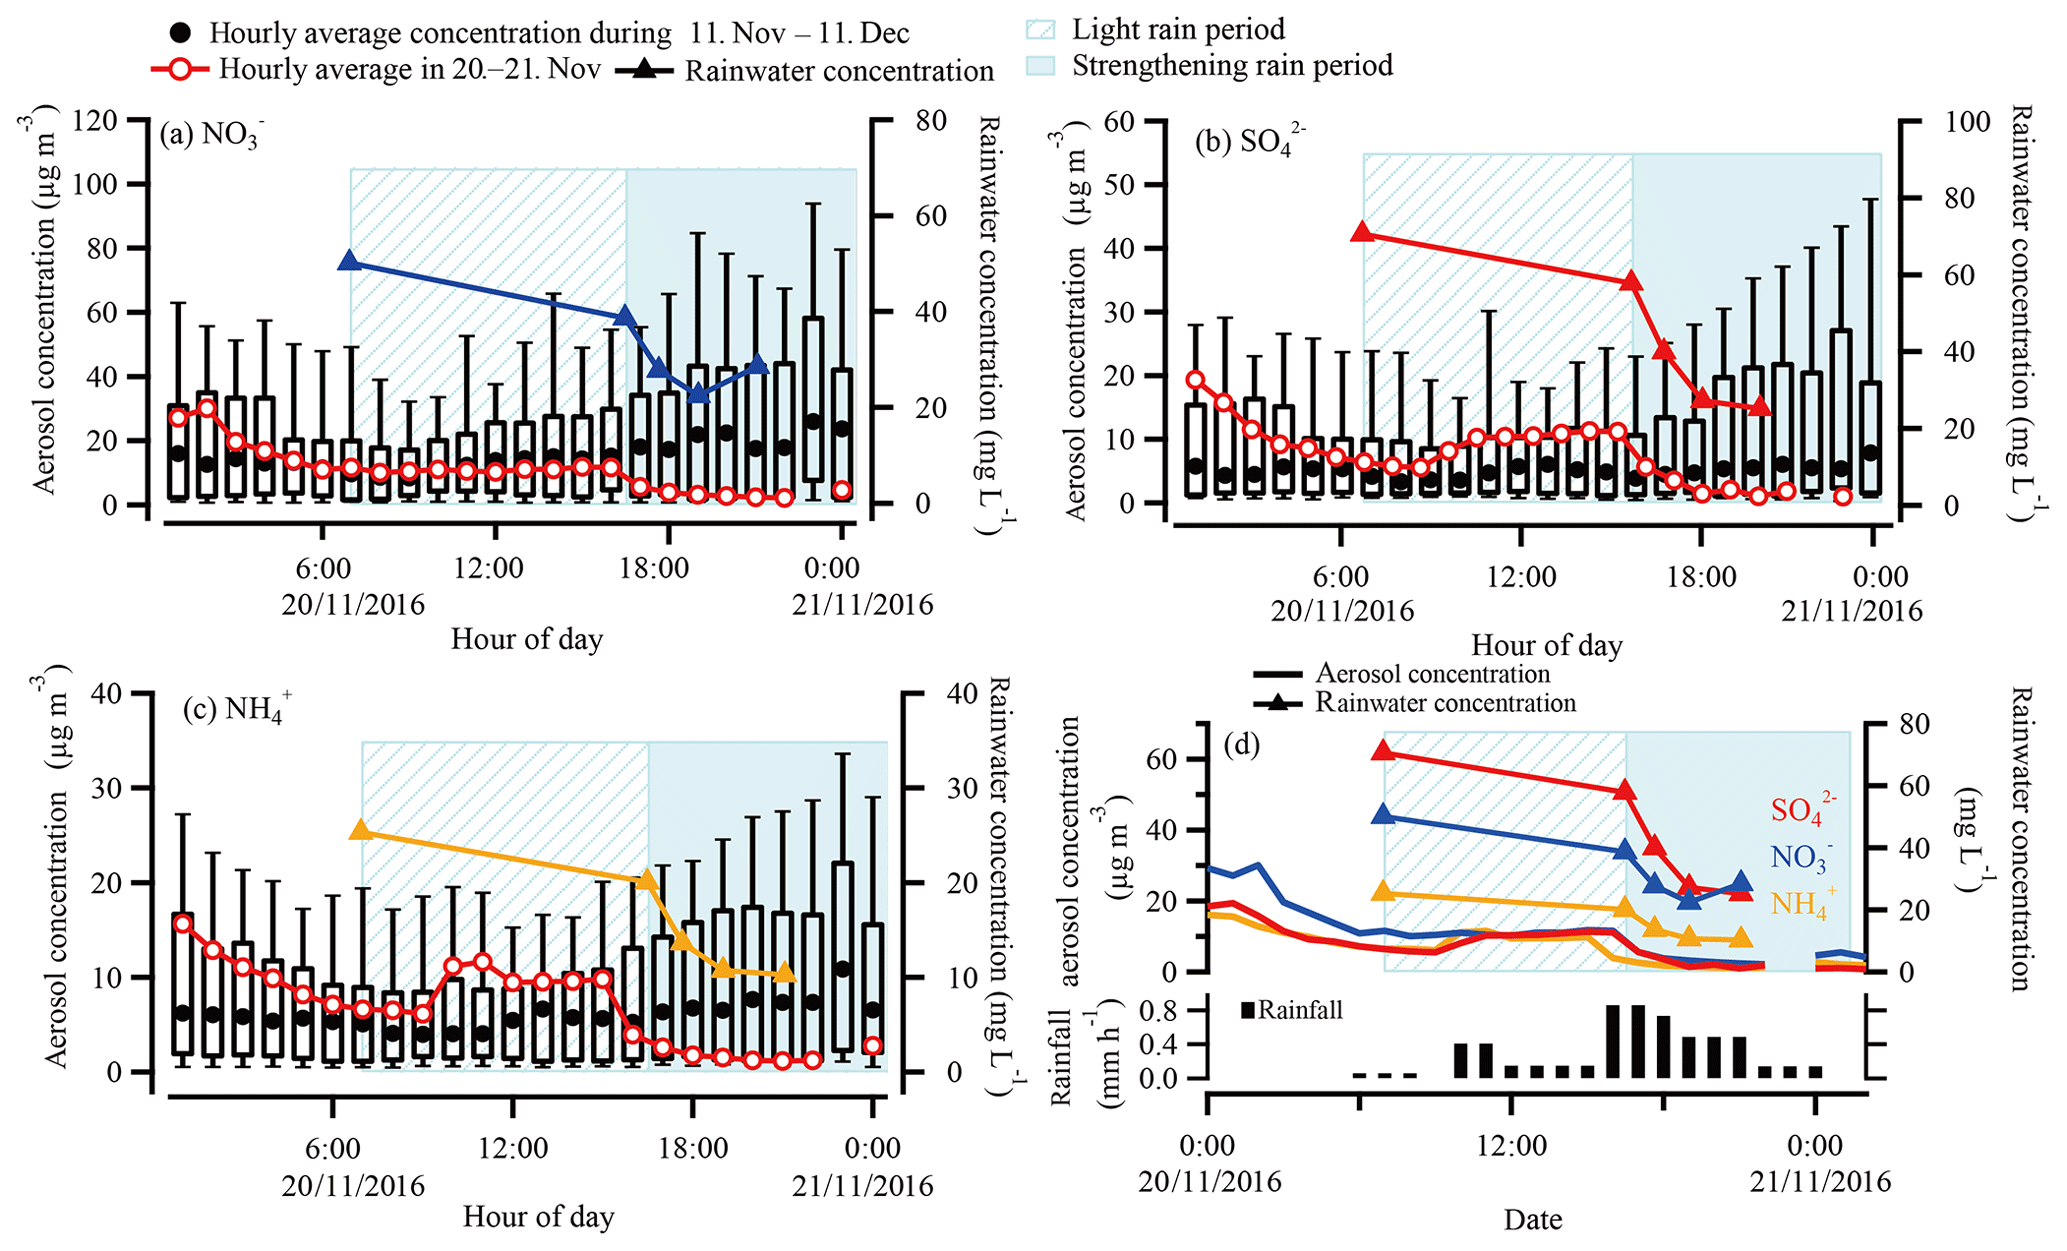
Figure 1Hourly average aerosol concentration from 11 November to 11 December (box and whisker plots; the data show the lowest value, 25th percentile, median highest quartile, 75th percentile and highest value, respectively) and the rainy period on 20 to 21 November (red line and hollow circles) for (a) , (b) and (c) . The rainwater concentrations are shown as follows: (a) , blue; (b) , red; and (c) , orange (line and triangles). Time series of the (blue), (red) and (orange) concentrations in the rainfall (lines and triangles) and in the air (lines) and rainfall (d).
3.1 Impacts of below-cloud wet scavenging on aerosols
In this case, the total precipitation amount was relatively low, but the precipitation duration was long. SNA represented the majority of the ions in the rainwater, accounting for 73 % of the total and their temporal variations are shown in Fig. 1. The precipitation duration is marked with the blue frame. In the early stage, marked with light blue stripes, the precipitation duration was long and the precipitation intensity was weak. In the later period, from 16:29 LT on 20 November to 01:18 LT on 21 November, the precipitation began to strengthen and is marked with the blue shading. Before this event, a severe haze occurred which exceeded the National Ambient Air Quality Standard (NAAQS, 75 µg m−3) (Shi et al., 2019). When rain occurred, both the aerosols in the air and the SNA concentration in the rainwater gradually decreased, especially during the later stage. It is clearly visible in Fig. 1 that all aerosol concentrations on the rainy day were much lower than the hourly averaged aerosol concentrations during the APHH-Beijing campaign, especially during the precipitation time, indicating the below-cloud scavenging impacts. Following the rain, SNA reached relatively stable and low values. , , and decreased from 50.1, 70.6 and 25.3 to 28.5, 25.2 and 10.3 mg L−1 (or a reduction of 43.2 %, 64.3 % and 59.5 %) in the rainwater. Accordingly, aerosol nitrate, sulfate and ammonium decreased from 13.8, 8.3 and 8.4 to 1.2, 2.2 and 0.1 µg m−3 in the air (decreased by more than 6 µg m−3).
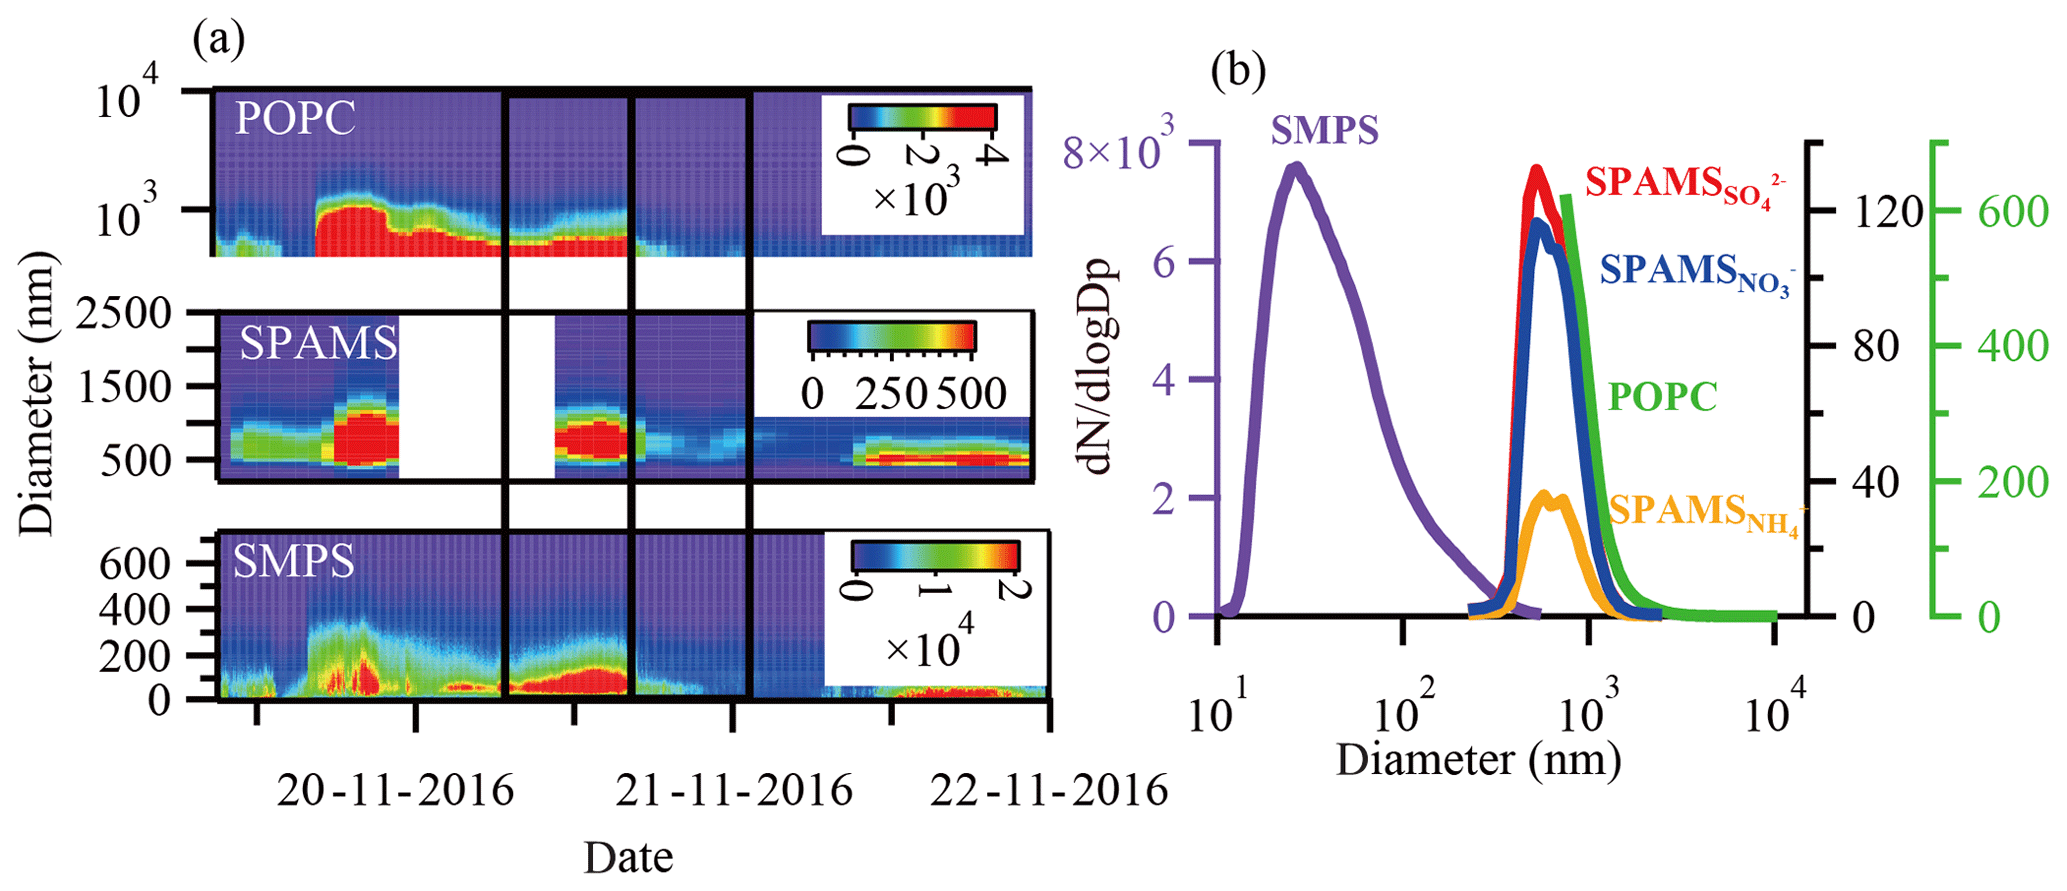
Figure 2Time series of particle number size distributions (a) measured by POPC, SPAMS (take , for example) and SMPS, respectively. The averaged spectrum distribution of number concentration during the APHH-Beijing campaign (a) for SMPS (purple line); POPC (green line); and (blue line), (red line), and (orange line) by SPAMS.
The time series and averaged spectrum distribution of particle number size distributions measured by POPC, SPAMS and SMPS are shown in Fig. 2. With the help of three instruments, the size distributions cover a rather wide range, from 0.014 to 10.35 µm. The spectrum distribution that exhibited unimodal distributions peaked in the size range of 20–90 nm. The spectrum distribution for SPAMS of and both showed particularly high consistency in terms of variation patterns, magnitude and particle size distribution (Liu et al., 2016). For POPC, the trend was also quite consistent with the coarse size of SPAMS. As shown from Fig. 2a, for POPC and SMPS, the number concentration did not immediately decrease due to relatively weak precipitation intensity before 16:29 LT on 20 November. In the later period, the number concentration decreased sharply and remained at a low level. It agreed well with the radar echo and precipitation intensity during this rain event. In order to investigate the BWSC, 16:29 LT on 20 November is taken as the time before the rain occurs in calculating O1; this information will not be repeated in following sections.
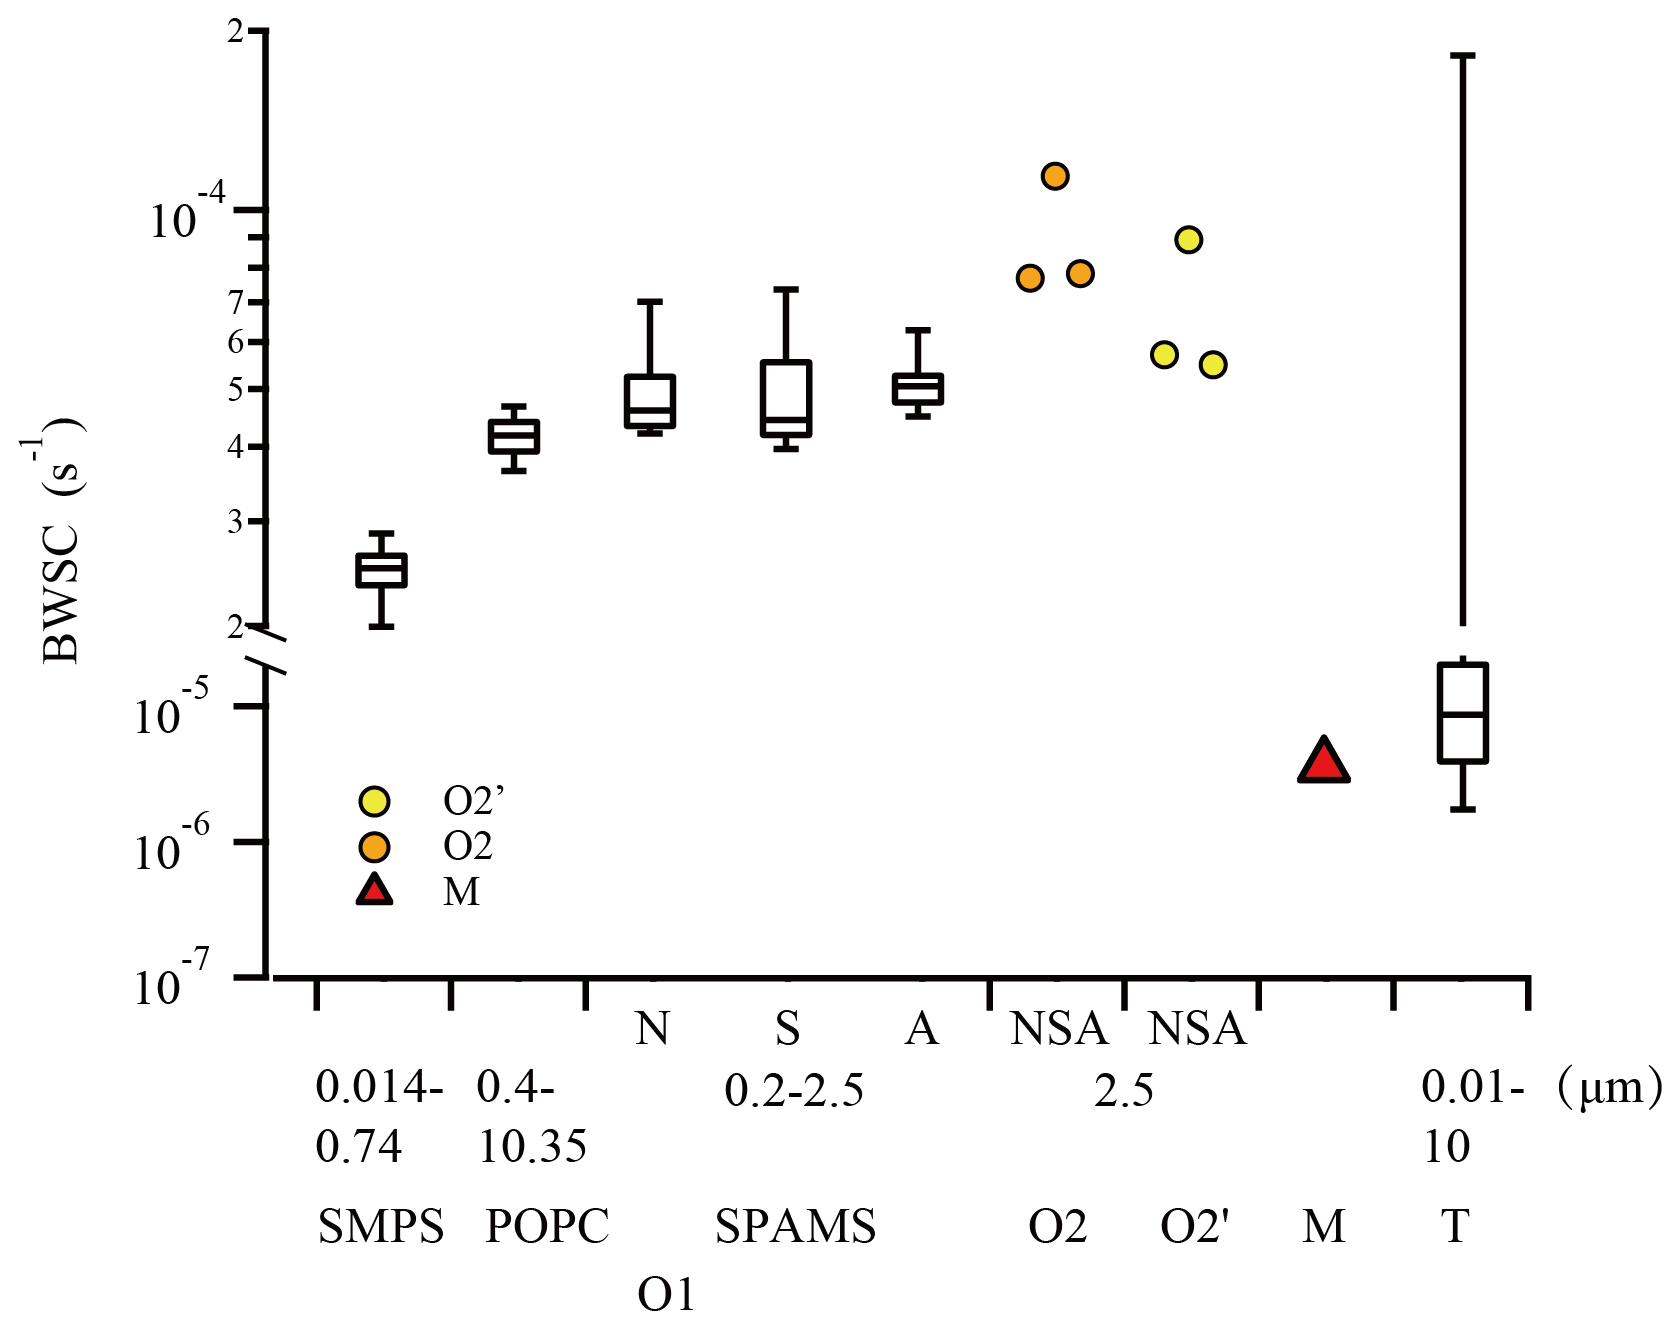
Figure 3Box and whisker plots of the multi-method estimation of the BWSCs. The top and bottom of the boxes represent the 75th and 25th percentiles, and central lines mean the median BWSCs. The whiskers represent maximum and minimum BWSCs, respectively.
3.2 Multi-method comparison of BWSCs
For further analysis, the estimated BWSCs based on multiple methods were compared and shown in Fig. 3. As for the observational methods, e.g., O1, O2 and O2′, there is no significant difference in the range of magnitude between them. The observed O1 by SMPS, which covers the range of Aitken and accumulation mode aerosols (0.014–0.74 µm), are much lower than the other two measurements (0.2–2.5 µm for SPAMS and 0.4–10.35 µm for POPC, respectively). The observed BWSCs by the original O2 are larger than the updated O2′ method. However, O2′ (, and s−1 for , and ) is much closer to the results of O1 ( s−1 for particle size in the range of 0.014–10.35 µm). Since O1 is based on the variations in the aerosol numbers below the cloud, it may be more suitable for the estimation of the BWSCs. It also indicates that the updated O2′ is much more reasonable than the original O2 for estimation of BWSCs of various chemical species. In contrast, the BWSC of T ( s−1) is an order of magnitude lower than the observational results. Considering the effects of thermophoresis, diffusiophoresis and electric charges, there is a wider range of 3 orders of magnitude (10−6–10−4 s−1) (X. H. Wang et al., 2010; Y. Wang et al., 2014). In addition, the BWSC for M ( s−1) is also 1 order of magnitude lower than the field measurements. The low BWSC in CTMs could explain the underestimation of simulated wet deposition, which is mainly thought to be caused by chemical process, modeled precipitation and emissions in previous studies (Wang et al., 2008; Ge et al., 2011). Thus, the observed O1 and O2′ may revise the T and M results in the future.
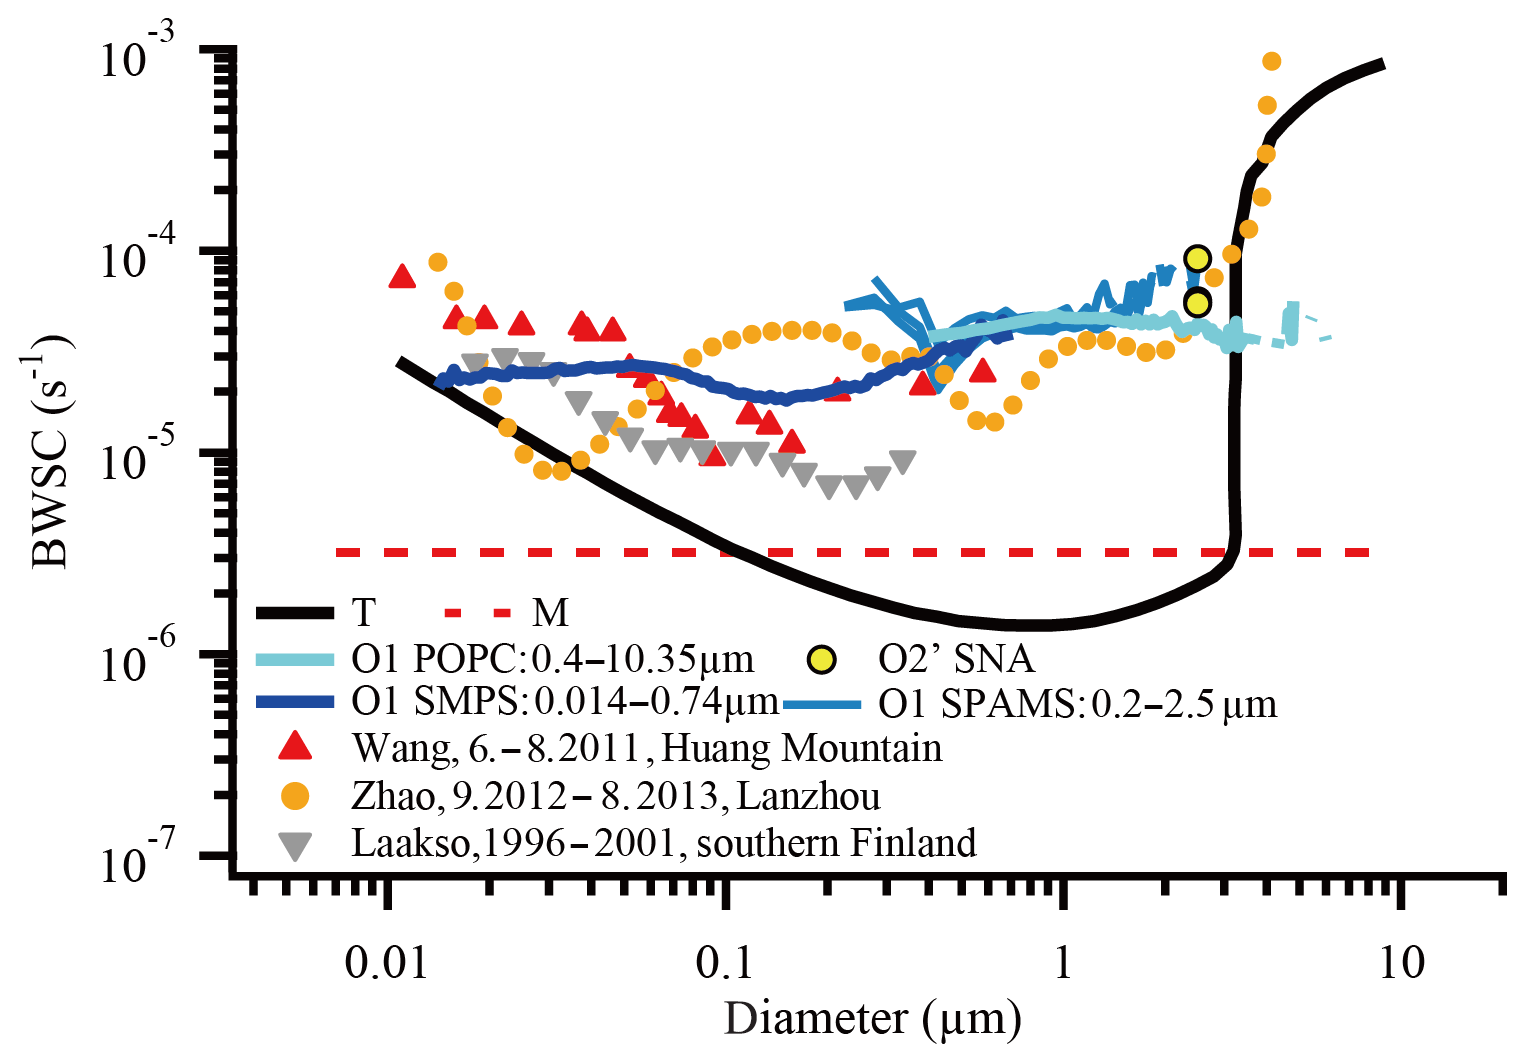
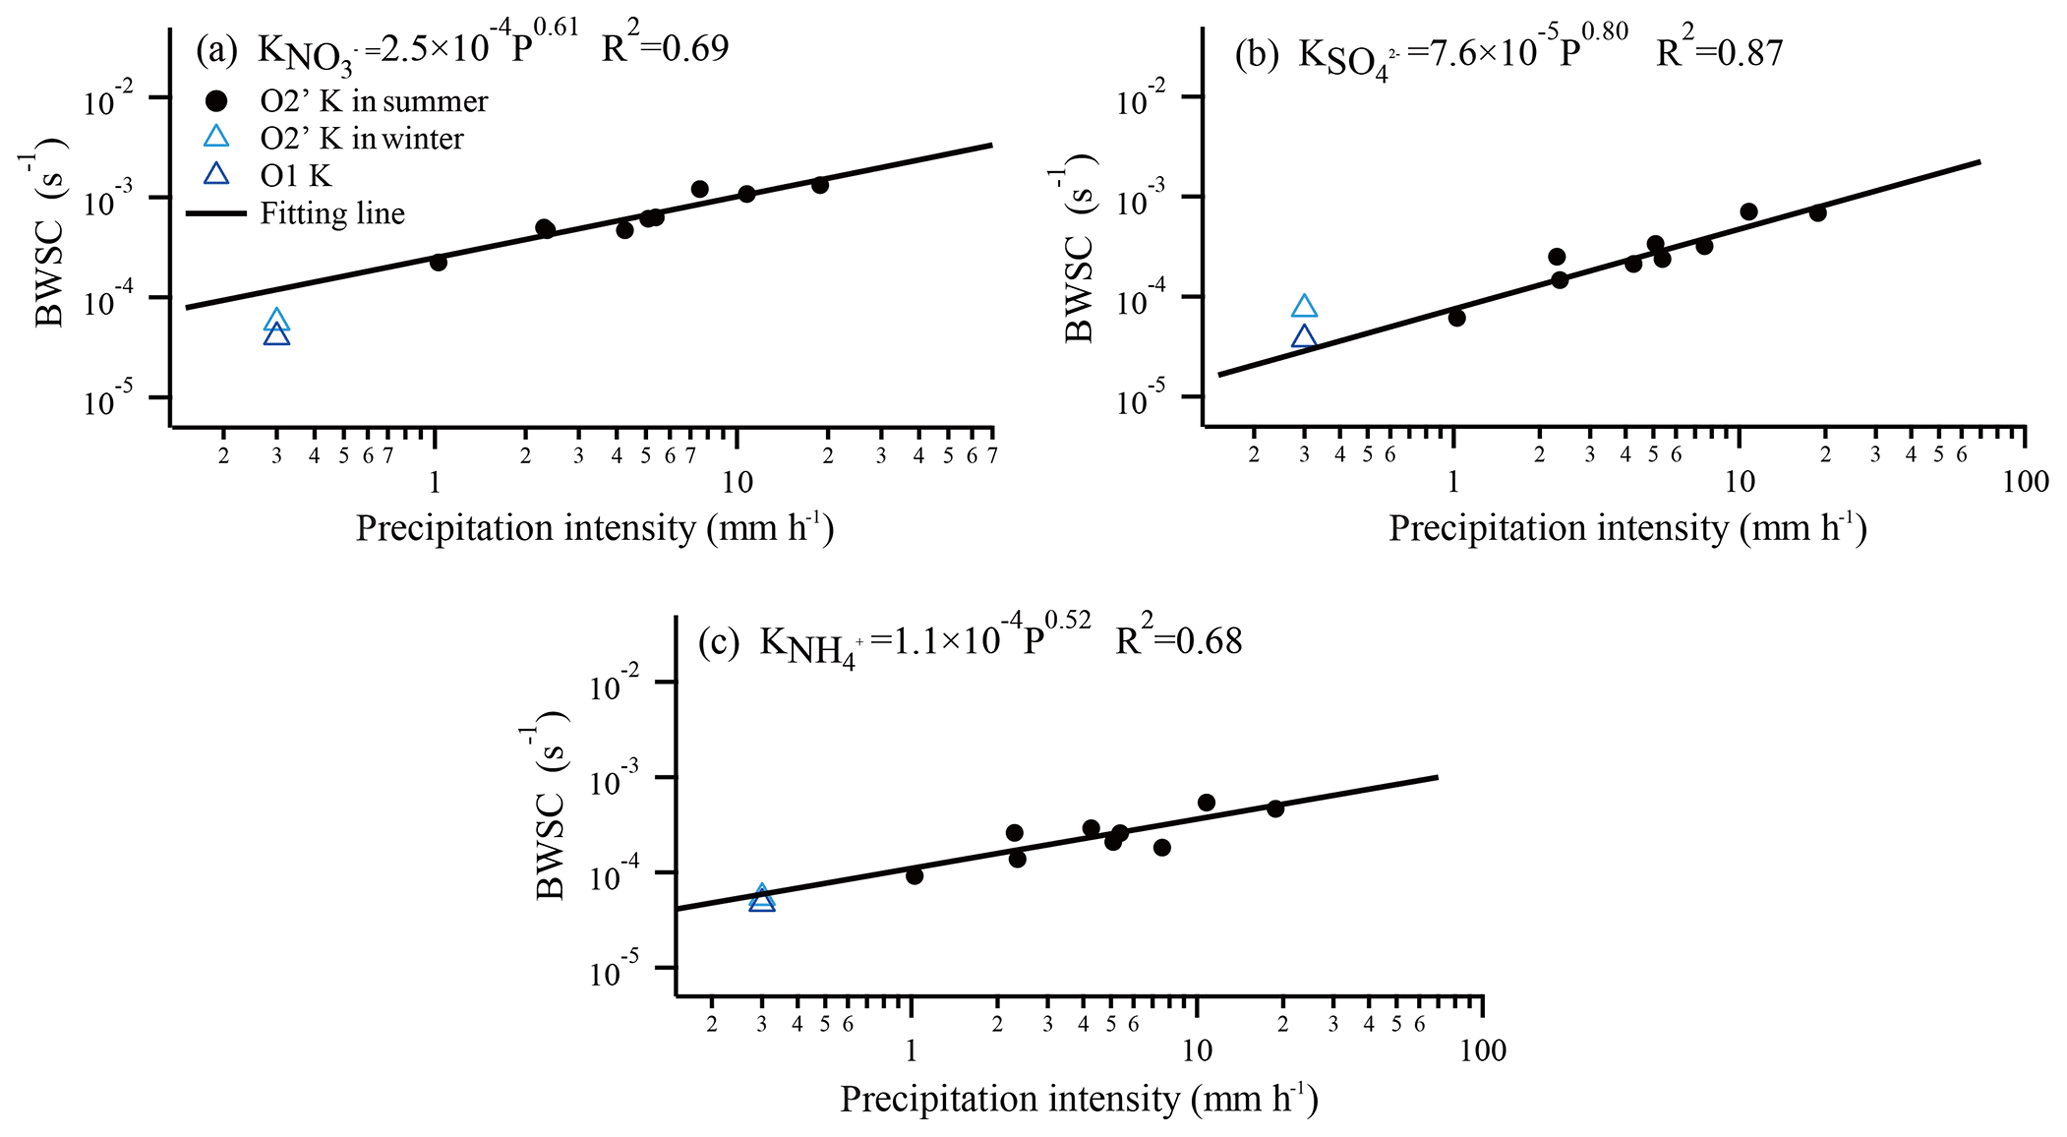
Figure 5Scatterplots of the BWSC and precipitation intensity for (a), (b) and (c) (black dots: O2′ in summer from Xu et al. (2017); light blue triangle: O2′ from this study; deep blue triangle: O1).
To further compare the BWSCs based on the particle size, the results in this study are compared with those of previous studies in Fig. 4. The size-resolved BWSCs of 0.014–0.74, 0.2–2.5 and 0.7–10.35 µm are the total number concentration from SMPS, SPAMS and POPC, respectively, which are within a certain range (– s−1). At approximately 0.2 µm (the lower limit detection of the multicomponent analysis), the O1 of 0.014–0.74 and 0.2–2.5 µm results have a gap that mainly originates from the use of different experimental instruments and their detection limits. However, the estimated results for larger sizes (dp>3 µm) by POPC have great fluctuation, mainly due to lower number concentrations (<2 cm−3), and were considered unreliable in this work. The BWSC from O1 showed a slowly decreasing trend in 0.014–0.2 µm and a significant increasing trend as dp>0.2 µm in this study, which is similar to the results from Huang Mountain (Y. Wang et al., 2014) and southern Finland (Laakso et al., 2003). Besides, the BWSC from O2′ for SNA are similar to the results of O1 in 2.5 µm. Although there is a different trend to that reported in Lanzhou (Zhao et al., 2015) before 0.6 µm, both studies exhibited an increasing trend after 0.6 µm. The difference of BWSCs from O1 in each sites may be due to the measuring conditions (Wang et al., 2010). However, compared to the T, this difference is very small, as shown in Fig. 4. Different from the observational results, the theoretical results show a strong dependence on the particle size with obvious decreasing trend (dp<1 µm) and quickly increasing trend (dp>1 µm). As Seinfeld and Pandis (2016) mentioned, Brownian diffusion and inertial impaction are the principal mechanisms affecting collection efficiency with dp smaller than 0.2 µm and larger than 2.5 µm, respectively. Theoretical estimation can effectively characterize the observed BWSC of aerosols in these two ranges. For the Greenfield gap, there is large difference between the BWSC from O1 and T, with the latter being 1 order of magnitude lower. One reason is that all the influencing mechanisms have still not been fully considered and understood (Seinfeld and Pandis, 2016), another reason is the existing ideal assumptions in derivation, such as there being no chemical reactions or emissions in the scavenging process. The ignored irregular surface of the aerosols and hygroscopic growth will increase the concentration of particles and then influence the scavenging efficiency (Y. Wang et al., 2014). Another extensive explanation is that the turbulent flow fluctuation, evaporation and breakup of raindrops are also important but neglected processes (Wang et al., 2010).
Table 2The observed aerosol concentrations before and after 1 h rainfall; wet depositions after 1 h rainfall; and parameters of the exponential power fittings, WSCs, rebuilt aerosol concentrations, and wet depositions after 1 h compared with multi-method determination.
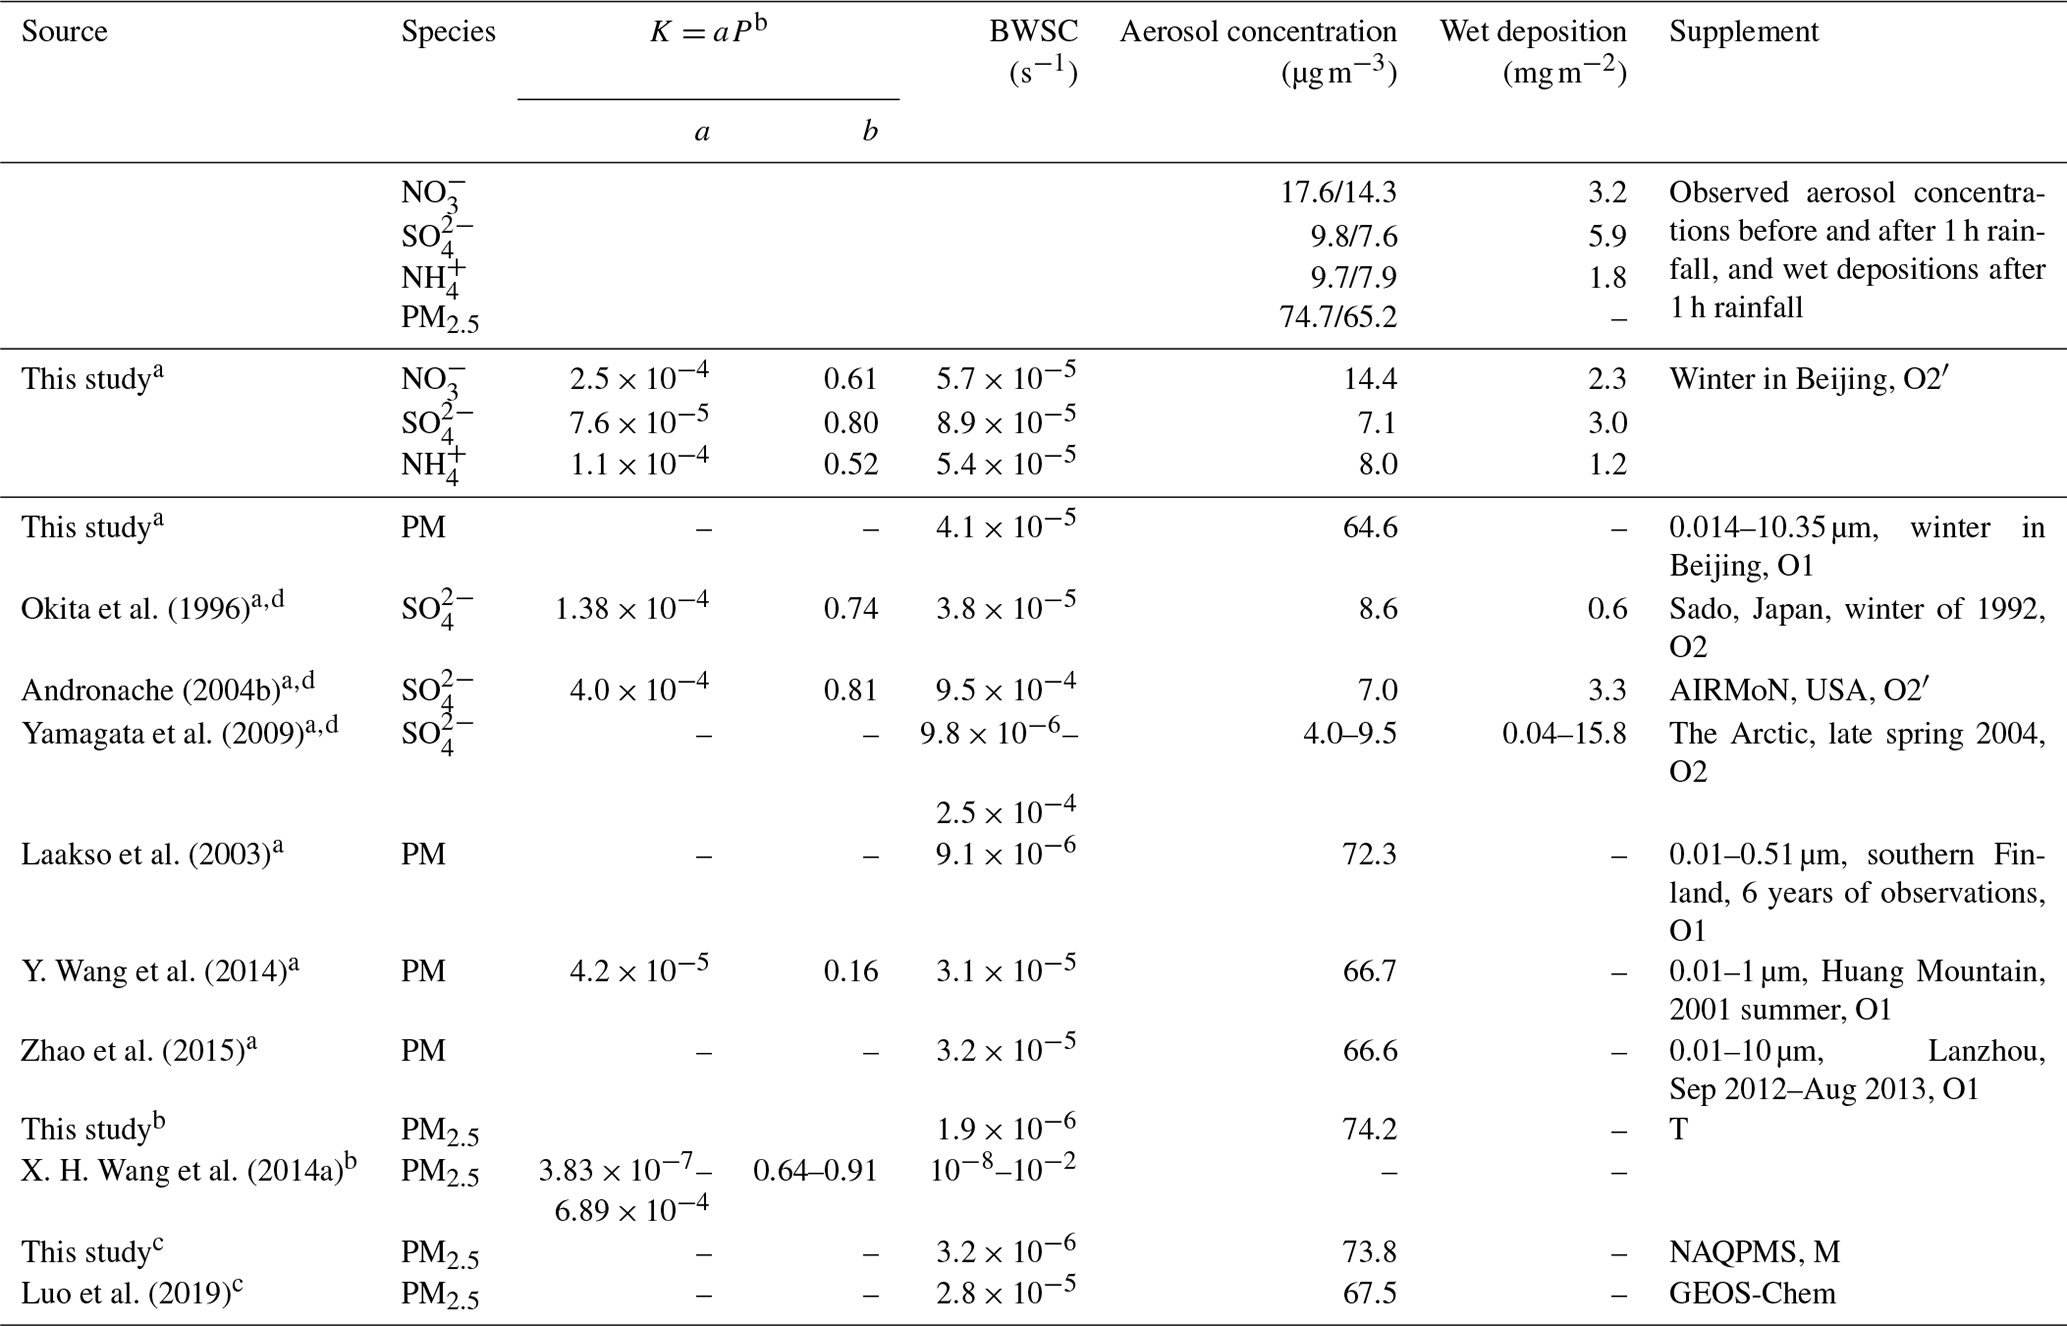
a Field observation, b theory and c modeling calculation.
d WSC.
3.3 The parameterization of BWSCs
To discuss the uncertainties of the BWSC underestimation by theoretical calculations in different rainfall events, nine rain events at the same sampling site in summer of 2014 (by O2′) have also been included. As shown in Fig. 5, a strong relationship between the BWSCs and precipitation intensity obeys exponential power distribution both in the summer of 2014 and the rainfall event in winter of the APHH-Beijing campaign in Beijing with coefficients of determination for SNA over 0.68. Since the estimated BWSCs for SNA based on O1 and O2′ in this event are in line with previous studies in summer, it indicated that the wet scavenging rule and regression fitting formulae are also universal in Beijing not only in summer but also in winter. In fact, this exponential power relationship has been confirmed in previous studies (Jylhä, 1991; Okita et al., 1996; Andronache, 2004a; X. H. Wang et al., 2014a, b; Xu et al., 2017):
where parameter b represents the change rate of BWSCs along with P, while a is equal to the WSCs when the P=1 mm h−1. Both a and b relate to chemical species and aerosol particle size.
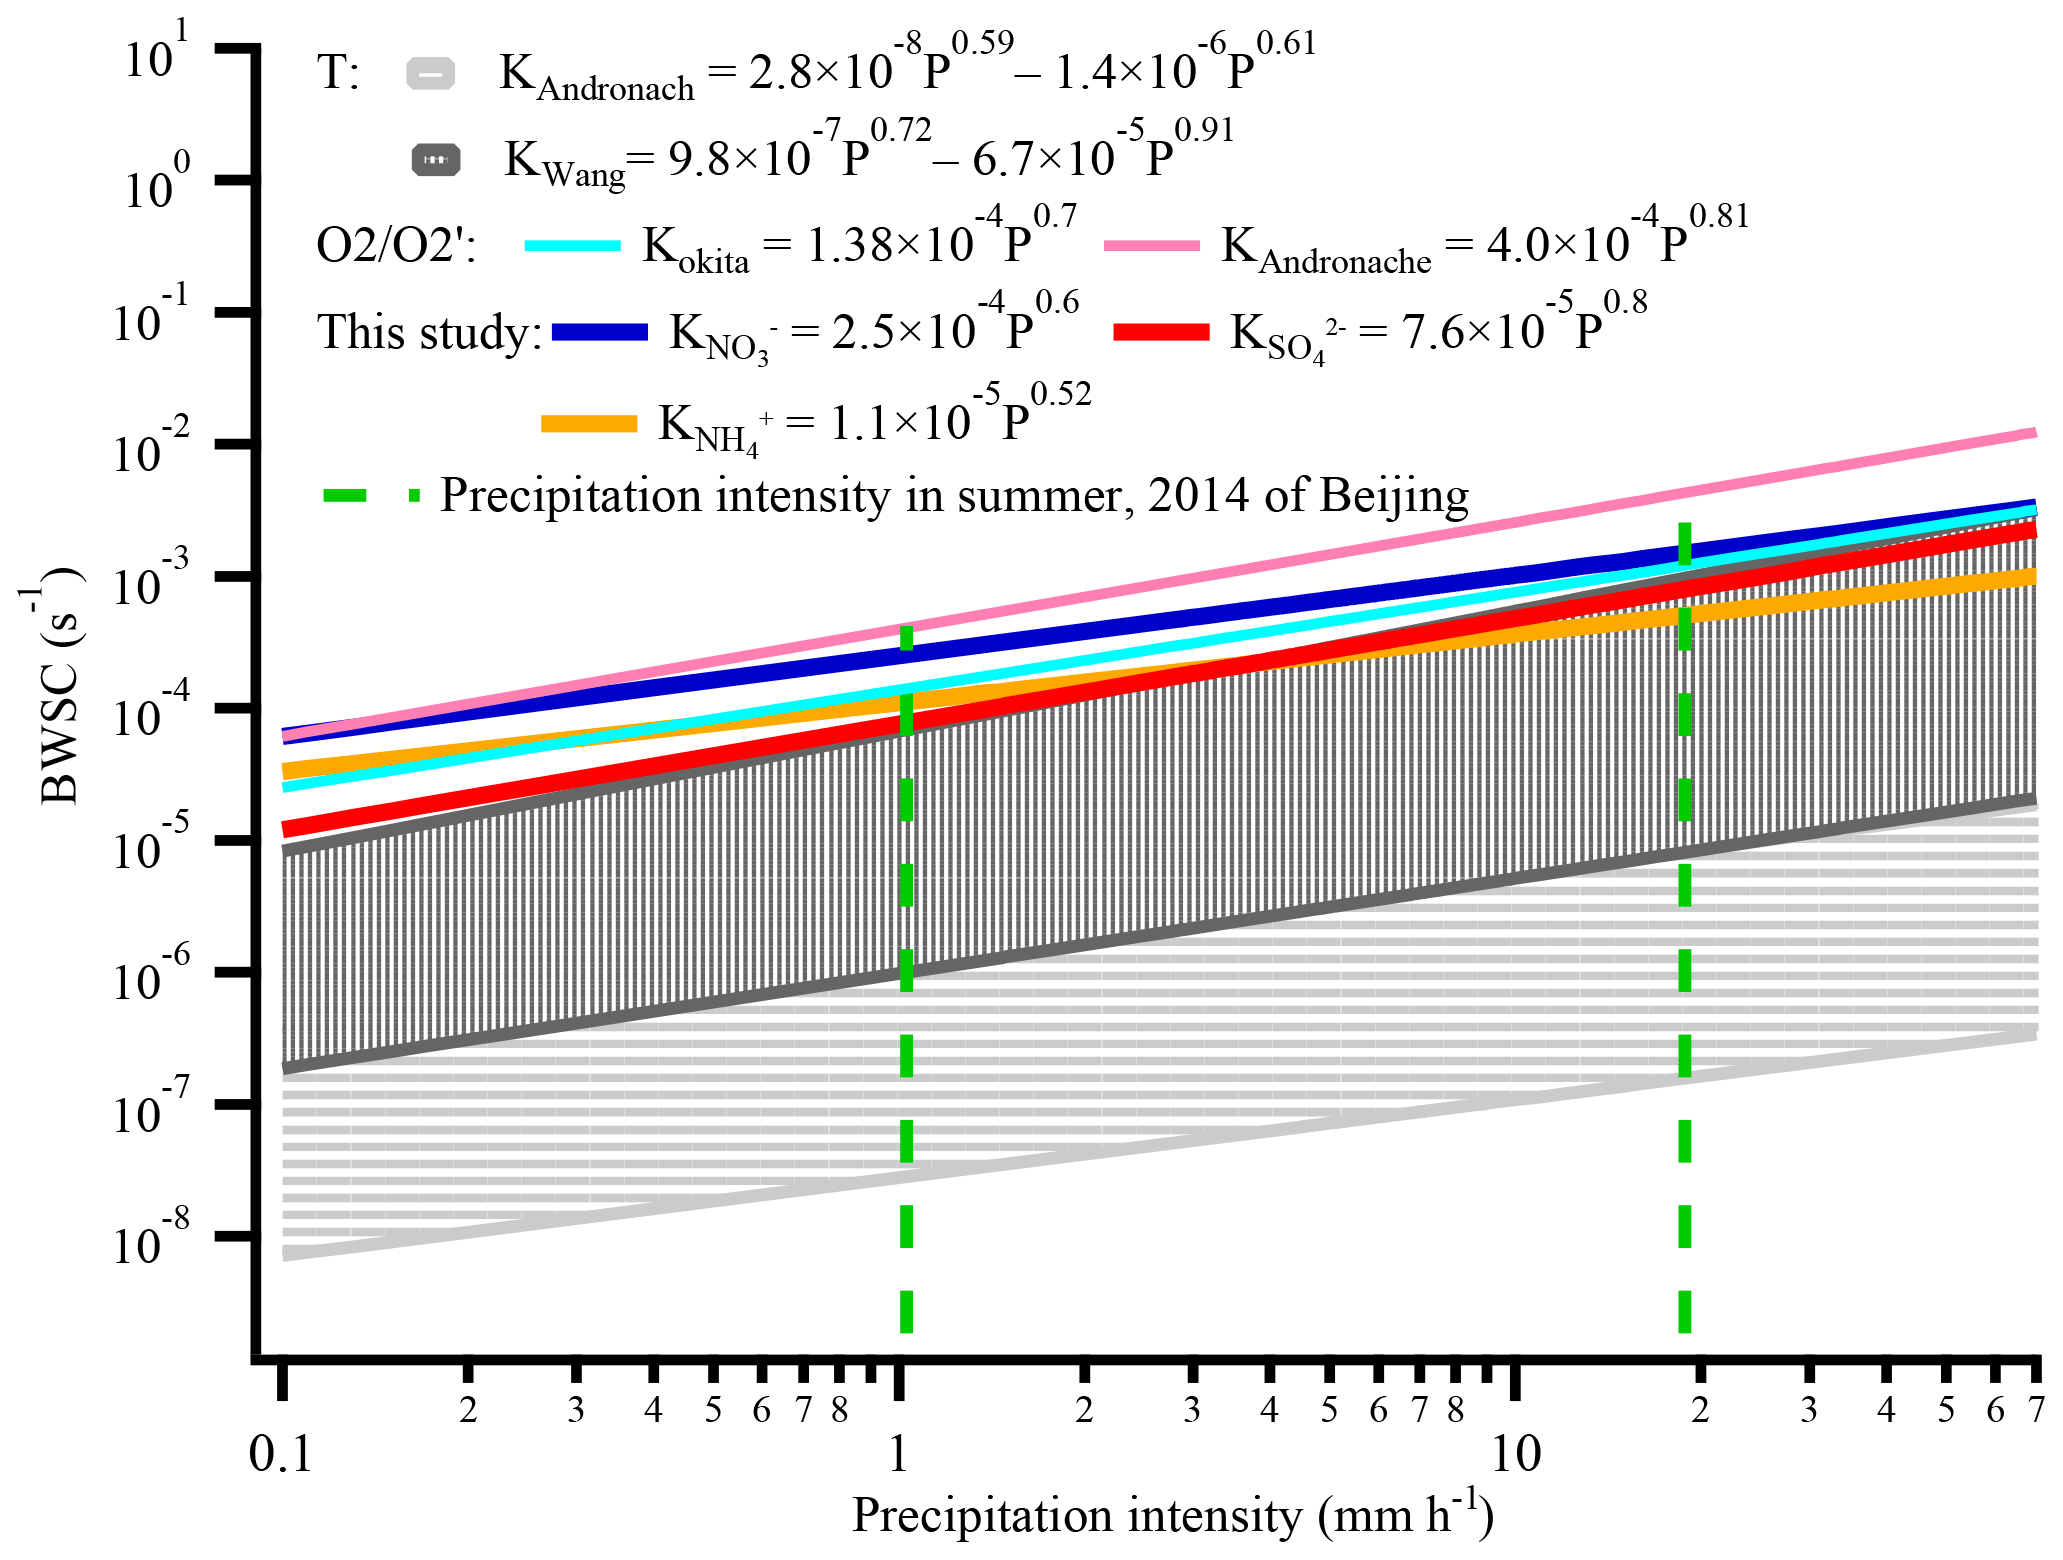
For further comparison, Fig. 6 displays the parameterization of a and b in the exponential power relationship for BWSCs with the precipitation intensity by multi-method determination, i.e., using theoretical methods and field measurement methods. For the theory calculation, the parameter a varies from a relatively wide range of – s−1 and BWSCs also have a wide range of 3–4 orders of magnitude for given precipitation intensities (Andronache, 2003; X. H. Wang et al., 2014a). Similar to the multi-method comparison of estimated BWSCs in this rainfall event of the APHH-Beijing campaign, parameterization for BWSCs obtained by O2 and O2′ show a higher magnitude of variations with the precipitation intensity, where all of the straight lines lie above the upper range of T. This indicates that recent theory-calculated BWSCs have an obvious underestimation not only during a rainfall event but also in the parameterization of large number of rainfall events with different precipitation intensities and need revision or updating via field measurement estimation.
3.4 Impacts and implications
To investigate the impacts of the wet scavenging on aerosol concentrations in the air and the wet depositions in rainfall, multi-method-estimated BWSCs included in Table 2 were used to rebuild the aerosol concentrations and wet depositions after the 1 h rainfall event. Assuming the aerosol concentrations in the air are only influenced by wet scavenging during the rainfall event, its variation should be followed by Eq. (13) according to Seinfeld and Pandis (2016):
Variations in aerosol concentration can be resolved as in Eq. (14), in which the K is a constant BWSC. Here, K and t are the BWSCs and the scavenging time and Ca0 is the original aerosol concentration before the rainfall. In this study, the Ca0 has been observed as being 17.6, 9.8, 9.7 and 74.7 µg m−3 for , , and PM2.5, respectively. After 1 h of wet scavenging by rainfall, the concentration of , , and PM2.5 decreased to 14.3, 7.6, 7.9 and 65.2 µg m−3, respectively. Previous studies have confirmed that the exponential power distribution between the WSCs and precipitation intensity as Eq. (12). The size-resolved BWSC are accumulated for calculating the total BWSC for PM2.5. As it is shown in Table 2, the calculated aerosol concentrations using T and M BWSCs performed the obvious overestimation of PM2.5 concentrations with the bias from 2.3 to 9 µg m−3, while showing similar results to the observation for O1 and O2′ BWSCs (bias<1 µg m−3). It should be noted that the magnitude of BWSCs in the range of 10−5–10−4 perform calculated aerosol concentrations better than those in the lower range. Wet deposition has also been reconstructed according to Eq. (7), with the precipitation intensity set to 0.17 mm h−1 and column height set to 3 km. The normalized mean bias (NMB) for the below-cloud wet depositions of and are −28 % and −33 %, while for it is −49 % according to the BWSCs in this study shown in Table 2.
Overall, the O1 and updated O2′ field observation results can effectively characterize the below-cloud scavenging ability, whereas T and M have obvious deviation. Therefore, the field measurements are needed to compensate for the defects in the theoretical and modeling calculations, which provides room to make further progress in wet deposition numerical simulations.
An evaluation of below-cloud wet scavenging ability is first conducted based on field measurements and accompanied by the theoretical estimation and modeling calculation. The averaged BWSCs obtained by field measurements are similar to each other (10−5 s−1) and there is a strong exponential power relationship between BWSCs and precipitation intensity. Theoretical estimations coincide well with the observed BWSCs of aerosols with dp in ranges smaller than 0.2 µm and larger than 2.5 µm but are an order of magnitude lower than the observed BWSCs within 0.2–2.5 µm. In the form of exponential power distribution between BWSCs and precipitation intensity, the upper range of theoretical results is also lower than the measurement estimation. Thus, the underestimation of BWSC through theoretical methods has been confirmed not only in APHH-Beijing campaign but also in all rainfall events in summer of 2014. These theoretical values are usually applied in CTMs with a simplified scheme; accordingly, the model calculations show lower BWSCs. This may explain the underprediction of wet deposition in both global and regional models of polluted regions. Field measurements are currently required to compensate for the theoretical and modeling calculations and to construct a more reasonable and suitable simulation scheme to improve the wet deposition simulation, especially in polluted regions.
To request observed data for scientific research purposes, please contact Baozhu Ge at the Institute of Atmospheric Physics, Chinese Academy of Sciences, via email (gebz@mail.iap.ac.cn).
The supplement related to this article is available online at: https://doi.org/10.5194/acp-19-15569-2019-supplement.
DX, BG, and ZW designed the whole structure of this work; XC performed the modeling calculation; YS, NC, ML, XP, ZM, and YP prepared the SMPS data, the POPC data, and the SPAMS data. DX performed the sequential sampling of rainwater and analyzed the data. DX and BG prepared the manuscript with contributions from all authors.
The authors declare that they have no conflict of interest.
This article is part of the special issue “In-depth study of air pollution sources and processes within Beijing and its surrounding region (APHH-Beijing) (ACP/AMT inter-journal SI)”. It is not associated with a conference.
The authors sincerely appreciate the editors and anonymous reviewers for their helpful comments.
This research has been supported by the National Natural Science Foundation of China (grant nos. 41575123, 41877313, 41571130024, 41620104008, 91744206) and the Key Deployment Program (ZDRW-CN-2018-1-03), as well as the Strategic Priority Research Program of the Chinese Academy of Sciences (XDA19040204), and also by the National Key Research and Development Project of China (grants nos. 2017YFC0210103, 2018YFC0830802).
This paper was edited by Yongjie Li and reviewed by two anonymous referees.
Andronache, C.: Estimated variability of below-cloud aerosol removal by rainfall for observed aerosol size distributions, Atmos. Chem. Phys., 3, 131–143, https://doi.org/10.5194/acp-3-131-2003, 2003.
Andronache, C.: Precipitation removal of ultrafine aerosol particles from the atmospheric boundary layer, J. Geophys. Res.-Atmos., 109, D16S07, 2004a.
Andronache, C.: Estimates of sulfate aerosol wet scavenging coefficient for locations in the Eastern United States, Atmos. Environ., 38, 795-804, https://doi.org/10.1016/j.atmosenv.2003.10.035, 2004b.
Andronache, C.: Diffusion and electric charge contributions to below-cloud wet removal of atmospheric ultra-fine aerosol particles, J. Aerosol Sci., 35, 1467–1482, 2004c.
Andronache, C., Grönholm, T., Laakso, L., Phillips, V., and Venäläinen, A.: Scavenging of ultrafine particles by rainfall at a boreal site: observations and model estimations, Atmos. Chem. Phys., 6, 4739–4754, https://doi.org/10.5194/acp-6-4739-2006, 2006.
Bae, S. Y., Jung, C. H., and Kim, Y. P.: Derivation and verification of an aerosol dynamics expression for the below-cloud scavenging process using the moment method, J. Aerosol Sci., 41, 266–280, https://doi.org/10.1016/j.jaerosci.2009.11.006, 2010.
Barth, M. C., Rasch, P. J., Kiehl, J. T., Benkovitz, C. M., and Schwartz, S. E.: Sulfur chemistry in the National Center for Atmospheric Research Community Climate Model: Description, evaluation, features, and sensitivity to aqueous chemistry, J. Geophys. Res.-Atmos., 105, 1387–1415, https://doi.org/10.1029/1999jd900773, 2000.
Byun, D. W. and Dennis, R.: Design artifacts in Eulerian air-quality models – evaluation of the effects of layer thickness and vertical profile correction on surface ozone concentrations, Atmos. Environ., 29, 105–126, 1995.
Chan, C. K. and Yao, X.: Air pollution in mega cities in China, Atmos. Environ., 42, 1–42, https://doi.org/10.1016/j.atmosenv.2007.09.003, 2008.
Chate, D. M., Rao, P. S. P., Naik, M. S., Momin, G. A., Safai, P. D., and Ali, K.: Scavenging of aerosols and their chemical species by rain, Atmos. Environ., 37, 2477–2484, https://doi.org/10.1016/S1352-2310(03)00162-6, 2003.
Chatterjee, A., Jayaraman, A., Rao, T. N., and Raha, S.: In-cloud and below-cloud scavenging of aerosol ionic species over a tropical rural atmosphere in India, J. Atmos. Chem., 66, 27–40, https://doi.org/10.1007/s10874-011-9190-5, 2010.
Chen, X. S., Yang, W. Y., Wang, Z. F., Li, J., Hu, M., An, J. L., Wu, Q. Z., Wang, Z., Chen, H. S., Wei, Y., Du, H. Y., and Wang, D. W.: Improving new particle formation simulation by coupling a volatility-basis set (VBS) organic aerosol module in NAQPMS+APM, Atmos. Environ., 204, 1–11, 2019.
Chen, Y. Y., Tian, H. Z., Yang, D. Y., Zou, B. D., Lu, H. F., and Lin, A. G.: Correlation Between Acidic Materials and Acid Deposition in Beijing During 1997–2011, Environ. Sci., 34, 1958–1963, 2013 (in Chinese).
Cheng, C., Huang, Z., Chan, C. K., Chu, Y., Li, M., Zhang, T., Ou, Y., Chen, D., Cheng, P., Li, L., Gao, W., Huang, Z., Huang, B., Fu, Z., and Zhou, Z.: Characteristics and mixing state of amine-containing particles at a rural site in the Pearl River Delta, China, Atmos. Chem. Phys., 18, 9147–9159, https://doi.org/10.5194/acp-18-9147-2018, 2018.
Du, W., Zhao, J., Wang, Y., Zhang, Y., Wang, Q., Xu, W., Chen, C., Han, T., Zhang, F., Li, Z., Fu, P., Li, J., Wang, Z., and Sun, Y.: Simultaneous measurements of particle number size distributions at ground level and 260 m on a meteorological tower in urban Beijing, China, Atmos. Chem. Phys., 17, 6797–6811, https://doi.org/10.5194/acp-17-6797-2017, 2017.
ENVIRON.INC.: User's Guide Comperhensive Air Quality Model with Extension (CAMx) Version 4.42, 101 Rowland Way, Suite 220, Novato, California, 2005.
Gao, X. D., Chen, X. Y., Ding, Z. W., and Yang, W. Q.: Investigation of the variation of atmospheric pollutants from chemical composition of precipitation along an urban-to-rural transect in Beijing, Acta Scientiae Circumstantiae, 35, 4033–4042, 2015 (in Chinese).
Ge, B. Z., Wang, Z. F., Xu, X. B., Tang, J., He, Y. J., Uno, I., and Ohara, T.: Impact of the East Asian summer monsoon on long-term variations in the acidity of summer precipitation in Central China, Atmos. Chem. Phys., 11, 1671–1684, https://doi.org/10.5194/acp-11-1671-2011, 2011.
Ge, B. Z., Wang, Z. F., Xu, X. B., Wu, J. B., Yu, X. L., and Li, J.: Wet deposition of acidifying substances in different regions of China and the rest of East Asia: Modeling with updated NAQPMS, Environ. Pollut., 187, 10–21, 2014.
Ge, B. Z., Wang, Z. F., Gbaguidi, A. E., and Zhang, Q.: Source Identification of Acid Rain Arising over Northeast China: Observed Evidence and Model Simulation, Aerosol Air Qual. Res., 16, 1366–1377, https://doi.org/10.4209/aaqr.2015.05.0294, 2016.
Gonzalez, C. M. and Aristizabal, B. H.: Acid rain and particulate matter dynamics in a mid-sized Andean city: The effect of rain intensity on ion scavenging, Atmos. Environ., 60, 164–171, 2012.
Han, L. H., Wang, H. M., Xiang, X., Zhang, H. L., Yan, H. T., Cheng, S. Y., Wand, H. Y., Zheng, A. H., and Guo, J. H.: The characteristics of precipitation and its impact on fine particles at a representative region in Beijing, China Environmental Science, 39, 3635–3646, 2019 (in Chinese).
Hu, M., Jing, Z., and Wu, Z. J.: Chemical compositions of precipitation and scavenging of particles in Beijing, Sci. China Ser. B, 48, 265–272, https://doi.org/10.1360/042004-49, 2005.
Jylhä, K.: Empirical scavenging coefficients of radioactive substances released from Chernobyl, Atmos. Environ., 25, 263–270, 1991.
Laakso, L., Grönholm, T., Rannik, Ü., Kosmale, M., Fiedler, V., Vehkamäki, H., and Kulmala, M.: Ultrafine particle scavenging coefficients calculated from 6 years field measurements, Atmos. Environ., 37, 3605–3613, https://doi.org/10.1016/S1352-2310(03)00326-1, 2003.
Li, J., Wang, Z., Zhuang, G., Luo, G., Sun, Y., and Wang, Q.: Mixing of Asian mineral dust with anthropogenic pollutants over East Asia: a model case study of a super-duststorm in March 2010, Atmos. Chem. Phys., 12, 7591–7607, https://doi.org/10.5194/acp-12-7591-2012, 2012.
Li, J., Yang, W. Y., Wang, Z. F., Chen, H. S., Hu, B., Li, J. J., Sun, Y. L., Fu, P. Q., and Zhang, Y. Q.: Modeling study of surface ozone source-receptor relationships in East Asia, Atmos. Res., 167, 77–88, 2016.
Li, J., Du, H. Y., Wang, Z. F., Sun, Y. L., Yang, W. Y., Li, J. J., Tang, X., and Fu, P. Q.: Rapid formation of a severe regional winter haze episode over a megacity cluster on the North China Plain, Environ. Pollut., 223, 605–615, 2017.
Li, L., Huang, Z., Dong, J., Li, M., Gao, W., Nian, H., Fu, Z., Zhang, G., Bi, X., Cheng, P., and Zhou, Z.: Real time bipolar time-of-flight mass spectrometer for analyzing single aerosol particles, Int. J. Mass Spectr., 303, 118–124, https://doi.org/10.1016/j.ijms.2011.01.017, 2011.
Lin, Q., Zhang, G., Peng, L., Bi, X., Wang, X., Brechtel, F. J., Li, M., Chen, D., Peng, P., Sheng, G., and Zhou, Z.: In situ chemical composition measurement of individual cloud residue particles at a mountain site, southern China, Atmos. Chem. Phys., 17, 8473–8488, https://doi.org/10.5194/acp-17-8473-2017, 2017.
Liu, L., Zhang, W. J., Du, S. Y., Hou, L. J., Han, B., Yang, W., Chen, M. D., and Bai, Z. P.: Seasonal Variation Characteristics and Potential Source Contribution of Sulfate, Nitrate and Ammonium in Beijing by Using Single Particle Aerosol Mass Spectrometry, Environ. Sci., 37, 1609–1618, 2016 (in Chinese).
Luo, G., Yu, F., and Schwab, J.: Revised treatment of wet scavenging processes dramatically improves GEOS-Chem 12.0.0 simulations of surface nitric acid, nitrate, and ammonium over the United States, Geosci. Model Dev., 12, 3439–3447, https://doi.org/10.5194/gmd-12-3439-2019, 2019.
Marshall, J. S. and Palmer, W. M.: The distribution of raindrop with size, Journal of Meteorology and Environment, 5, 165–166, 1948.
Okita, T., Hara, H., and Fukuzaki, N.: Measurements of atmospheric SO2 and , and determination of the wet scavenging coefficient of sulfate aerosols for the winter monsoon season over the Sea of Japan, Atmos. Environ., 30, 3733–3739, 1996.
Pan, X., Uno, I., Hara, Y., Osada, K., Yamamoto, S., Wang, Z., Sugimoto, N., Kobayashi, H., and Wang, Z.: Polarization properties of aerosol particles over western Japan: classification, seasonal variation, and implications for air quality, Atmos. Chem. Phys., 16, 9863–9873, https://doi.org/10.5194/acp-16-9863-2016, 2016.
Pan, X. L., Uno, I., Wang, Z., Nishizawa, T., Sugimoto, N., Yamamoto, S., Kobayashi, H., Sun, Y., Fu, P., Tang, X., and Wang, Z. F.: Real-time observational evidence of changing Asian dust morphology with the mixing of heavy anthropogenic pollution, Sci. Rep.-UK, 7, 1–8, 2017.
Pan, X., Ge, B., Wang, Z., Tian, Y., Liu, H., Wei, L., Yue, S., Uno, I., Kobayashi, H., Nishizawa, T., Shimizu, A., Fu, P., and Wang, Z.: Synergistic effect of water-soluble species and relative humidity on morphological changes in aerosol particles in the Beijing megacity during severe pollution episodes, Atmos. Chem. Phys., 19, 219–232, https://doi.org/10.5194/acp-19-219-2019, 2019.
Pan, Y. P., Wang, Y. S., Tang, G. Q., and Wu, D.: Wet and dry deposition of atmospheric nitrogen at ten sites in Northern China, Atmos. Chem. Phys., 12, 6515–6535, https://doi.org/10.5194/acp-12-6515-2012, 2012.
Pan, Y. P., Wang, Y. S., Tang, G. Q., and Wu, D.: Spatial distribution and temporal variations of atmospheric sulfur deposition in Northern China: insights into the potential acidification risks, Atmos. Chem. Phys., 13, 1675–1688, https://doi.org/10.5194/acp-13-1675-2013, 2013.
Seinfeld, J. H. and Pandis, S. N.: Atmospheric chemistry and physics: from air pollution to climate change, in: Atmospheric Chemistry and Physics, John Wiley and Sons, Inc., NY, 2016.
Shi, Z., Vu, T., Kotthaus, S., Harrison, R. M., Grimmond, S., Yue, S., Zhu, T., Lee, J., Han, Y., Demuzere, M., Dunmore, R. E., Ren, L., Liu, D., Wang, Y., Wild, O., Allan, J., Acton, W. J., Barlow, J., Barratt, B., Beddows, D., Bloss, W. J., Calzolai, G., Carruthers, D., Carslaw, D. C., Chan, Q., Chatzidiakou, L., Chen, Y., Crilley, L., Coe, H., Dai, T., Doherty, R., Duan, F., Fu, P., Ge, B., Ge, M., Guan, D., Hamilton, J. F., He, K., Heal, M., Heard, D., Hewitt, C. N., Hollaway, M., Hu, M., Ji, D., Jiang, X., Jones, R., Kalberer, M., Kelly, F. J., Kramer, L., Langford, B., Lin, C., Lewis, A. C., Li, J., Li, W., Liu, H., Liu, J., Loh, M., Lu, K., Lucarelli, F., Mann, G., McFiggans, G., Miller, M. R., Mills, G., Monk, P., Nemitz, E., O'Connor, F., Ouyang, B., Palmer, P. I., Percival, C., Popoola, O., Reeves, C., Rickard, A. R., Shao, L., Shi, G., Spracklen, D., Stevenson, D., Sun, Y., Sun, Z., Tao, S., Tong, S., Wang, Q., Wang, W., Wang, X., Wang, X., Wang, Z., Wei, L., Whalley, L., Wu, X., Wu, Z., Xie, P., Yang, F., Zhang, Q., Zhang, Y., Zhang, Y., and Zheng, M.: Introduction to the special issue “In-depth study of air pollution sources and processes within Beijing and its surrounding region (APHH-Beijing)”, Atmos. Chem. Phys., 19, 7519–7546, https://doi.org/10.5194/acp-19-7519-2019, 2019.
Slinn, W. G. N.: Precipitation scavenging, in: Atmospheric Science and Power Production, edited by: Randerson, D., Doc. DOE/TIC-27601, Tech. Inf. Cent., Off. Of Sci. and Tech. Inf., U.S. Dep. Of Energy, Washington, D.C., 1984.
Song, X., Zhang, J., Aghakouchak, A., Roy, S. S., Xuan, Y., Wang, G., He, R., Wang, X., and Liu, C.: Rapid urbanization and changes in spatiotemporal characteristics of precipitation in Beijing metropolitan area, J. Geophys. Res.-Atmos., 119, 11250–11271, 2015.
Stier, P., Feichter, J., Kinne, S., Kloster, S., Vignati, E., Wilson, J., Ganzeveld, L., Tegen, I., Werner, M., Balkanski, Y., Schulz, M., Boucher, O., Minikin, A., and Petzold, A.: The aerosol-climate model ECHAM5-HAM, Atmos. Chem. Phys., 5, 1125–1156, https://doi.org/10.5194/acp-5-1125-2005, 2005.
Stockwell, W. R., Middleton, P., Chang, J. S., and Tang, X. Y.: The second generation regional acid deposition model chemical mechanism for regional air quality modeling, J. Geophys. Res.-Atmos., 95, 16343–16367, 1990.
Sun, Y. L., Wang, Z. F., Du, W., Zhang, Q., Wang, Q. Q., Fu, P. Q., Pan, X. L., Li, J., Jayne, J., and Worsnop, D. R.: Long-term real-time measurements of aerosol particle composition in Beijing, China: seasonal variations, meteorological effects, and source analysis, Atmos. Chem. Phys., 15, 10149–10165, https://doi.org/10.5194/acp-15-10149-2015, 2015.
Tang, X. Y., Zhang, Y. H., and Shao, M.: Atmospheric environment and chemical, Higher education press, Beijing, 2006.
Textor, C., Schulz, M., Guibert, S., Kinne, S., Balkanski, Y., Bauer, S., Berntsen, T., Berglen, T., Boucher, O., Chin, M., Dentener, F., Diehl, T., Easter, R., Feichter, H., Fillmore, D., Ghan, S., Ginoux, P., Gong, S., Grini, A., Hendricks, J., Horowitz, L., Huang, P., Isaksen, I., Iversen, I., Kloster, S., Koch, D., Kirkevåg, A., Kristjansson, J. E., Krol, M., Lauer, A., Lamarque, J. F., Liu, X., Montanaro, V., Myhre, G., Penner, J., Pitari, G., Reddy, S., Seland, Ø., Stier, P., Takemura, T., and Tie, X.: Analysis and quantification of the diversities of aerosol life cycles within AeroCom, Atmos. Chem. Phys., 6, 1777–1813, https://doi.org/10.5194/acp-6-1777-2006, 2006.
Tian, Y., Pan, X., Nishizawa, T., Kobayashi, H., Uno, I., Wang, X., Shimizu, A., and Wang, Z.: Variability of depolarization of aerosol particles in the megacity of Beijing: implications for the interaction between anthropogenic pollutants and mineral dust particles, Atmos. Chem. Phys., 18, 18203–18217, https://doi.org/10.5194/acp-18-18203-2018, 2018.
Vet, R., Artz, R. S., Carou, S., Shaw, M., Ro, C. U., Aas, W., Baker, A., Bowersox, V. C., Dentener, F., Galy-Lacaux, C., Hou, A., Pienaar, J. J., Gillett, R., Forti, M. C., Gromov, S., Hara, H., Khodzher, T., Mahowald, N. M., Nickovic, S., Rao, P. S. P., and Reid, N. W.: A global assessment of precipitation chemistry and deposition of sulfur, nitrogen, sea salt, base cations, organic acids, acidity and pH, and phosphorus, Atmos. Environ., 93, 3–100, 2014.
Walcek, C. J. and Aleksic, N. M.: A simple but accurate mass conservative, peak-preserving, mixing ratio bounded advection algorithm with Fortran code, Atmos. Environ., 32, 3863–3880, 1998.
Wang, X., Zhang, L., and Moran, M. D.: Uncertainty assessment of current size-resolved parameterizations for below-cloud particle scavenging by rain, Atmos. Chem. Phys., 10, 5685–5705, https://doi.org/10.5194/acp-10-5685-2010, 2010.
Wang, X., Zhang, L., and Moran, M. D.: Development of a new semi-empirical parameterization for below-cloud scavenging of size-resolved aerosol particles by both rain and snow, Geosci. Model Dev., 7, 799–819, https://doi.org/10.5194/gmd-7-799-2014, 2014a.
Wang, X. H., Zhang, L. M., and Moran, M. D.: Bulk or modal parameterizations for below-cloud scavenging of fine, coarse, and giant particles by both rain and snow, J. Adv. Model. Earth Sy., 6, 1301–1310, https://doi.org/10.1002/2014ms000392, 2014b.
Wang, Y., Zhu, B., Kang, H. Q, Gao, J. H., Jiang, Q., and Liu, X. H.: Theoretical and observational study on below-cloud rain scavenging of aerosol particles, Journal of University of Chinese Academy of Sciences, 31, 306–321, 2014 (in Chinese).
Wang, Z. F., Maeda, T., Hayashi, M., Hsiao, L. F., and Liu, K. Y.: A nested air quality prediction modeling system for urban and regional scales: Application for high-ozone episode in Taiwan, Water Air Soil Poll, 130, 391–396, 2001.
Wang, Z. F., Xie, F. Y., Sakurai, T., Ueda, H., Han, Z. W., Carmichael, G. R., Streets, D., Engardt, M., Holloway, T., Hayami, H., Kajino, M., Thongboonchoo, N., Bennet, C., Park, S. U., Fung, C., Chang, A., Sartelet, K., and Amann, M.: MICS-Asia II: Model inter-comparison and evaluation of acid deposition, Atmos. Environ., 42, 3528–3542, 2008.
Wang, Z. F., Li, J., Wang, Z., Yang, W. Y., Tang, X., Ge, B. Z., Yan, P. Z., Zhu, L. L., Chen, X. S., Chen, H. S., Wand, W., Li, J. J., Liu, B., Wang, X. Y., Wand, W., Zhao, Y, L., Lu, N., and Su, D. B.: Modeling study of regional severe hazes over mid-eastern China in January 2013 and its implications on pollution prevention and control, Science China: Earth Sciences, 57, 3–13, 2014.
Wu, Q. Z., Wang, Z. F., Xu, W. S., Huang, J. P., and Gbaguidi, A. E.: Multi-model simulation of PM10 during the 2008 Beijing Olympic Games: Effectiveness of emission restrictions, J. Environ. Sci., 30, 1739–1748, 2010 (in Chinese).
Xu, D. H., Ge, B. Z., Wang, Z. F., Sun, Y. L., Chen, Y., Ji, D. S., Yang, T., Ma, Z. Q., Cheng, N. L., Hao, J. Q., and Yao, X. F.: Below-cloud wet scavenging of soluble inorganic ions by rain in Beijing during the summer of 2014, Environ. Pollut., 230, 963–973, https://doi.org/10.1016/j.envpol.2017.07.033, 2017.
Xu, J., Zhang, X. L., Xu, X. B., Ding, G. A., Yan. P., Yu, X. L., Chen, H. B., and Zhou, H. G.: Variations and source identification of chemical compositions in wet deposition at Shangdianzi background station, Acta Scientiae Circumstantiae, 28, 1001–1006, 2008 (in Chinese).
Yamagata, S., Kobayashi, D., Ohta, S., Murao, N., Shiobara, M., Wada, M., Yabuki, M., Konishi, H., and Yamanouchi, T.: Properties of aerosols and their wet deposition in the arctic spring during ASTAR2004 at Ny-Alesund, Svalbard, Atmos. Chem. Phys., 9, 261–270, https://doi.org/10.5194/acp-9-261-2009, 2009.
Yang, W. Y., Li, J., Wang, W. G., Li, J. L., Ge, M. F., Sun, Y. L., Chen. X. S., Ge, B. Z., Tong S, R., Wang, Q. Q., and Wang, Z. F.: Investigating secondary organic aerosol formation pathways in China during 2014, Atmos. Environ., 213, 133–147, 2019.
Zaveri, R. A. and Peters, L. K.: A new lumped structure photochemical mechanism for large-scale applications, J. Geophys. Res.-Atmos., 104, 30387–30415, 1999.
Zhang, L., Brook, J. R., and Vet, R.: A revised parameterization for gaseous dry deposition in air-quality models, Atmos. Chem. Phys., 3, 2067–2082, https://doi.org/10.5194/acp-3-2067-2003, 2003.
Zhang, L., Michelangeli, D. V., and Taylor, P. A.: Numerical studies of aerosol scavenging by low-level, warm stratiform clouds and precipitation, Atmos. Environ., 38, 4653–4665, https://doi.org/10.1016/j.atmosenv.2004.05.042, 2004.
Zhao, S., Yu, Y., He, J., Yin, D., and Wang, B.: Below-cloud scavenging of aerosol particles by precipitation in a typical valley city, northwestern China, Atmos. Environ., 102, 70–78, https://doi.org/10.1016/j.atmosenv.2014.11.051, 2015.
Zhu, J., Tang, X., Wang, Z. F., and Wu, L.: A Review of Air Quality Data Assimilation Methods and Their Application, J. Atmos. Sci., 42, 607–620, 2018 (in Chinese).