the Creative Commons Attribution 4.0 License.
the Creative Commons Attribution 4.0 License.
 | 19 Dec 2019
21st-century Asian air pollution impacts glacier in northwestern Tibet
M. Roxana Sierra-Hernández
Emilie Beaudon
Paolo Gabrielli
Lonnie Thompson
Over the last 4 decades, Asian countries have undergone substantial economic development, leading to rapid urbanization and industrialization. Consequently, fossil fuel consumption has risen dramatically, worsening the air quality in Asia. Fossil fuel combustion emits particulate matter containing toxic metals that can adversely affect living organisms, including humans. Thus, it is imperative to investigate the temporal and spatial extent of metal pollution in Asia. Recently, we reported a continuous and high-resolution 1650–1991 ice core record from the Guliya ice cap in northwestern Tibet, China, showing contamination of Cd, Pb, and Zn during the 20th century. Here, we present a new continuous and high-resolution ice core record of trace metals from the Guliya ice cap that comprises the years between 1971 and 2015, extending the 1650–1991 ice core record into the 21st century. Non-crustal Cd, Pb, Zn, and Ni enrichments increased have since the 1990s relative to the 1971–1990 period, reaching a maximum in 2008. The enrichments of Cd, Pb, Zn, and Ni increased by ∼75 %, 35 %, 30 %, and 10 %, respectively, during the 2000–2015 period relative to 1971–1990. The observed trace element (TE) enrichments likely originated primarily from fossil fuel combustion and biomass burning, with contributions from industrial processes and agricultural activities from South Asia (Pakistan, Afghanistan, India, and Nepal), Central Asia (Kazakhstan, Kyrgyzstan, Tajikistan, Turkmenistan, and Uzbekistan), and the Xinjiang province in western China. This new record demonstrates that the current emissions in Asia impact remote high-altitude glaciers in the region.
- Article
(8507 KB) - Full-text XML
-
Supplement
(632 KB) - BibTeX
- EndNote


Atmospheric levels of trace elements (TEs), including toxic metals (e.g., Hg, Pb, and Cd), have dramatically increased since the 19th century due to human activities (Pacyna and Pacyna, 2001; Tian et al., 2015). Some TEs are highly toxic and harmful to an array of animals, plants, and humans. Atmospheric TEs can originate from natural sources and processes in the environment, such as windborne dust, wildfires, sea-spray aerosols, volcanic activity, and vegetation (Nriagu, 1989a, b). TEs are also released into the atmosphere by human activities such as (1) the combustion of fossil fuels including coal, oil, and its distillates (e.g., gasoline, jet fuel, and diesel); (2) biomass burning (e.g., wood, dung, and agricultural waste); (3) industrial processes such as mineral extraction and metal production; (4) agriculture practices that include the use of fertilizers and pesticides; and (5) waste disposal (Pacyna and Pacyna, 2001; Christian et al., 2010; Zhang et al., 2014; Chen et al., 2015; Singh et al., 2018). These activities, especially high-temperature processes, emit fine (<2.5 µm) particulate matter (PM2.5) containing toxic metals such as As, Cd, Pb, and Zn (Richaud et al., 2004; Xu et al., 2004; Reddy et al., 2005; Alves et al., 2010; Christian et al., 2010); due to its small size, PM2.5 can reside in the atmosphere for over a week, thereby allowing it to be transported and deposited far from its initial sources (e.g., onto remote glaciers; Pacyna and Pacyna, 2001; Marx and McGowan, 2010).
Since the 1970s, Asian countries such as China, India, Pakistan, Nepal, Bangladesh, and others have undergone substantial and rapid economic growth, leading to considerable urbanization and industrialization in the region. Consequently, fossil fuel consumption has risen dramatically in most of these countries, worsening the air quality. In particular, China and India, the second and fifth largest economies in the world according to the International Monetary Fund, are, respectively, the largest and third largest emitters of both CO2 and PM2.5 (Crippa et al., 2018; EDGARv4.3.2, 2017).
In 1999, the Chinese government implemented the “western-development” policy in the 10th five-year plan to improve the quality of the environment in the east and to transfer energy (west-to-east energy program) and mineral resources from the west to the rest of the country (Lai, 2002; Chen et al., 2010; Dong and Yang, 2014). For this purpose, the necessary infrastructure (e.g., airports, railways, highways, water infrastructure, and power lines) was built. As a result, energy consumption (Jianxin, 2016) and atmospheric emissions (Liu et al., 2015) have been largely increasing in western China.
In particular, the Xinjiang Uygur Autonomous Region, situated in an arid region of northwestern China, has become important for the western-development implementation because of its location on the New Silk Road, a project to modernize and build new infrastructure to connect China with the west, and its large reserves of oil, gas, and coal (Chen et al., 2010; Dong and Yang, 2014; Fridley et al., 2017). Three mountain ranges shape the topography of this province: the Altai Mountains on the northern border, Tien Shan in the center, and the western Kunlun Mountains, where the Guliya ice cap is located (see below), along the southern border with Tibet (Fig. 1a).

Figure 1Maps showing the location of the Guliya ice cap (star) and the three mountain ranges of the province of Xinjiang (a), and seasonal NOAA HYSPLIT 7 d back-trajectory frequency plots for December, January, and February (b) and June, July, and August (c) for the 1992–2015 period (Rolph et al., 2017; Stein et al., 2015).
Pakistan, to the southeast of Xinjiang, gained its independence in 1947, after which its population rose very rapidly, becoming the world's sixth most populated country by 2003 (UN, 2017). Although Pakistan's economic growth has been much slower than that of China and India, urban Pakistani cities are among the most polluted in the world (WHO, 2019) due to the high population growth, industrialization, and a considerable increase in motor vehicles that lack emission controls and use low-quality gasoline and diesel.
For the year 1995, Pacyna and Pacyna (2001) estimated that non-ferrous metal production was the largest source of As, Cd, Cu, In, and Zn; coal combustion was a major source of Cr, Hg, Mn, Sb, Se, Sn, and Tl; and oil combustion was a major source of Ni and V, both worldwide and in Asia. For the same year, these authors estimated that leaded gasoline was the primary source of Pb worldwide as well as in Asia. However, changes in emissions of atmospheric TEs have occurred during the 21st century in Asia due to the following: (1) China and India emerged as the fastest-growing economies and most populated countries in the world (UN, 2017); (2) developing countries such as Pakistan, Nepal, and Bangladesh have greatly increased their national economic activities since the 1980s–1990s; (3) there are temporal and regional variations in the implementation of control emission technologies and air quality standards (often higher concentrations than those recommended by the World Health Organization); and (4) leaded gasoline was banned in 2000 in China, India, and Nepal and in 2002 in Pakistan, while it is still consumed in Afghanistan. Therefore, it is imperative to study the spatial and temporal effects of these new pollution sources and their resulting impacts on the environment.
Atmospheric emission estimates are associated with large uncertainties due to inaccurate inventories and emission factors, the lack of field data, and limited temporal and spatial coverage of observations. Thus, natural registers of past environmental conditions such as glaciers, which are influenced only by deposition of atmospheric species, are essential for reconstructing time series of atmospheric metal depositions (Hansson et al., 2015; Cooke and Bindler, 2015; Gabrielli and Vallelonga, 2015; Marx et al., 2016) that can be further used by modelers to reconstruct past emissions and project future atmospheric contamination trends.
Recently, we obtained a 350-year (1650–1991) high-resolution TE record (Sierra-Hernández et al., 2018) using an ice core drilled in 1992 from the Guliya ice cap located in northwestern China, specifically in Tibet's Kunlun Mountains (35∘17.37′ N; 81∘29.73′ E; 6200 m a.s.l.; Thompson et al., 1995; Fig. 1a). Outside of the Arctic and Antarctica, the glaciers in the Kunlun Mountains, along with those in Tibet and the Himalayas, are the largest reservoir of ice on the globe and are commonly referred to as the “Third Pole”. This glacial region is the source for numerous rivers in Asia which provide water to hundreds of millions of people. The 1992 Guliya TE record showed that long-distance emissions from coal combustion in Europe were likely deposited on the ice cap between 1850 and 1940 (Sierra-Hernández et al., 2018). Additionally, Pb, Cd, and Sn enrichments were detected between 1975 and 1991. The origin of these more recent enrichments could not be determined, as more anthropogenic sources have emerged, especially in this region.
Here, we use a new ice core retrieved from Guliya in 2015 to extend the 1650–1991 TE records into the 21st century (1971–2015) and to determine the impacts of the recent emission changes in Asia on the glaciers of the western Kunlun Mountains. New emission inventories of air pollutants, in particular the Emissions Database for Global Atmospheric Research (EDGAR v4.3.2), which compiles a comprehensive dataset of air pollutants between 1970 and 2012, are used here to attribute possible sources. This study fills a temporal and spatial gap in the investigation of atmospheric toxic trace metals in northwestern China, where atmospheric emission data are limited.
2.1 Guliya cores
In 2015, two ice cores (309.73 and 72.40 m long) were extracted from the plateau of the Guliya ice cap (6200 m a.s.l), in close proximity to the 1992 drilling site. The timescale was constructed by annual layer counting, also constrained by three reference horizons: in 2015 (surface of the glacier), in 1992, corresponding to the surface of the 1992 core (at 6 m in the shallow core), and in 1963 (at 10.9 m in the shallow core determined by beta radioactivity from the Arctic thermonuclear tests). Annual layers were determined using both cores by matching the signals of at least three different parameters (Cl−, Na+, dust, Ca2+, , and δ18O). Dating uncertainties are estimated at 1–2 years between the fixed points and may be the result of the very low annual accumulation (∼230 mm water equivalent) and surface-alteration processes such as snow redistribution through wind. Details of the drilling operation, the ice cores, and the timescale can be found in Thompson et al. (2018).
2.2 Sample preparation and ICP-SFMS analysis
The preparation of the samples and their analysis were performed following the same procedures adopted for the 1992 Guliya core samples (Sierra-Hernández et al., 2018). Briefly, 159 ice samples, comprising the years 1971 (11 m) to 2015 (0.06 m) were cut from the 309.73 m long deep ice core. To ensure the analysis of 3–4 samples yr−1, the sample resolution was adjusted between 4.5 and 11 cm accordingly. The samples were rinsed three times with nanopure water (18.3 MΩ) in a class-100 clean room and placed in acid pre-cleaned low-density polyethylene (LDPE) containers (Nalgene) to melt. Once melted, samples were transferred into acid pre-cleaned LDPE vials, where nitric acid (HNO3; Optima for Ultra Trace Element Analysis, Fisher Scientific) was added to obtain a 2 % (v∕v) acidified sample. The samples were then stored in the clean room for a 30 d period, during which the acid leaching process took place. At the end of the 30 d period, the samples were immediately analyzed or stored at −32 ∘C.
Twenty-nine TEs (Ag, Al, As, Ba, Bi, Cd, Co, Cr, Cs, Cu, Fe, Ga, Li, Mg, Mn, Mo, Na, Nb, Ni, Pb, Rb, Sb, Sn, Sr, Ti, Tl, U, V, and Zn) were measured in the samples by inductively coupled plasma sector field mass spectrometry (ICP-SFMS; Element 2; Beaudon et al., 2017; Sierra-Hernández et al., 2018). Trace elements were quantified using linear calibration curves constructed from external standards analyzed before and after the samples.
Detection limits, procedural blanks, and accuracy results are presented in Table S1 in the Supplement. Detection limits correspond to three standard deviations of the concentration of 10 blank measurements (2 % optima HNO3 aqueous solution) and fluctuate between 0.01 pg g−1 for Bi to 0.2 ng g−1 for Fe and 0.4 ng g−1 for Na (Beaudon et al., 2017; Sierra-Hernández et al., 2018). To verify that the sampling and decontamination procedures did not add TEs to the ice core samples, procedural blanks were made with nanopure water and analyzed with the ice core samples (Uglietti et al., 2014). Their TE concentrations are considered negligible for all TEs, apart from Nb (9 %), as they were lower than 2 % of the corresponding median concentration. The accuracy of the ICP-SFMS was determined each day of analysis using a 20-fold dilution of a TMRain-95 certified solution (Environment Canada). The obtained TE concentrations fell within the uncertainty limits in the certificate of analysis.
2.3 Non-crustal contribution
Enrichment factors (EFs) and excess concentrations are used to assess the crustal and non-crustal (e.g., anthropogenic) origins of each TE. The EF is obtained following Eq. (1):
where [TE∕Fe]ice corresponds to the ratio of a particular TE concentration to that of Fe in an ice sample and [TE∕Fe]PSA is the respective ratio in dust samples used as a potential source area (PSA). Eight dust samples were collected during the 1992 and 2015 Guliya field expeditions and are used here as PSAs. For details about the collection sites, the preparation and analysis of the PSA samples, and EFs derived from PSAs, the reader is referred to Sierra-Hernández et al. (2018). Briefly, approximately 0.1–0.5 g of a PSA sample was added to an acid pre-cleaned LDPE container with ultrapure water. The solution was mixed by agitation and settled for ∼2 min. For the ICP-SFMS analysis, 10 mL of supernatant was used and prepared like the ice samples.
Similar to the previous Guliya TEs study, Fe was chosen as the crustal reference due to its stability and high abundance in soil and rocks (Wedepohl, 1995), its high concentration both in the ice core samples and the PSAs, and the ability of the ICP-SFMS to measure Fe with high accuracy and precision (Uglietti et al., 2014). Additionally, Fe is highly correlated with Al (Pearson's r=1) and with Ba (Pearson's r=0.98). EFs calculated using Al and Ba as crustal references showed no significant differences to EFs relative to Fe, which indicates that the choice of Fe as a crustal TE to calculate EFs did not affect the results (Sierra-Hernández et al., 2018).
The EFs relative to the PSA are particularly small, since the composition of the PSA is a much closer representation of the crustal background of the ice samples compared to those obtained using the upper-continental-crust background (Wedepohl, 1995). Therefore, excess concentration is also used here as in our previous publication (Sierra-Hernández et al., 2018) to further corroborate the EF increases observed. Excess concentrations are calculated following Eq. (2):
[TE]ice and [Fe]ice are the concentrations of a particular TE and of Fe in the sample; [TE∕Fe]pre-industrial is the median of the TE concentration to the Fe concentration ratio during the pre-industrial period (1650–1750). The pre-industrial period corresponds the oldest part of the 1992 Guliya record (Sierra-Hernández et al., 2018) between 1650 and 1750, ∼30 years before the Industrial Revolution began in Europe. The excess concentration provides the TE concentration difference between TE deposition after and before the pre-industrial period.
To be consistent with our previous Guliya TEs publication, a TE will be considered of non-crustal origin (enriched) when increases in EF and excess concentration are significantly different from its background (pre-industrial levels), using both a two-sample t test for averages and the Mann–Whitney test for medians (p<0.01).
2.4 Statistical analysis
All statistical analyses, including factor analysis, cluster analysis, Mann–Whitney tests for medians, two-sample t tests for averages, Spearman correlations (correlation coefficient ρ), and Mann–Kendall trend tests, were performed using Minitab 17 and 18. The Mann–Whitney test and the two-sample t test were applied to the entire dataset and subdivided into three groups: 1971–1990, 1990–2000, and 2000–2015.
The time series of Cd, Pb, Zn, Ni, and Al concentrations; excess concentrations; and EFs are presented as 5-year running means in Fig. 2. The concentrations show high variability between 1971 and 1990 that decreases after 1990, perhaps as a result of the decreasing frequency of dust storms in the region (Thompson et al., 2018).
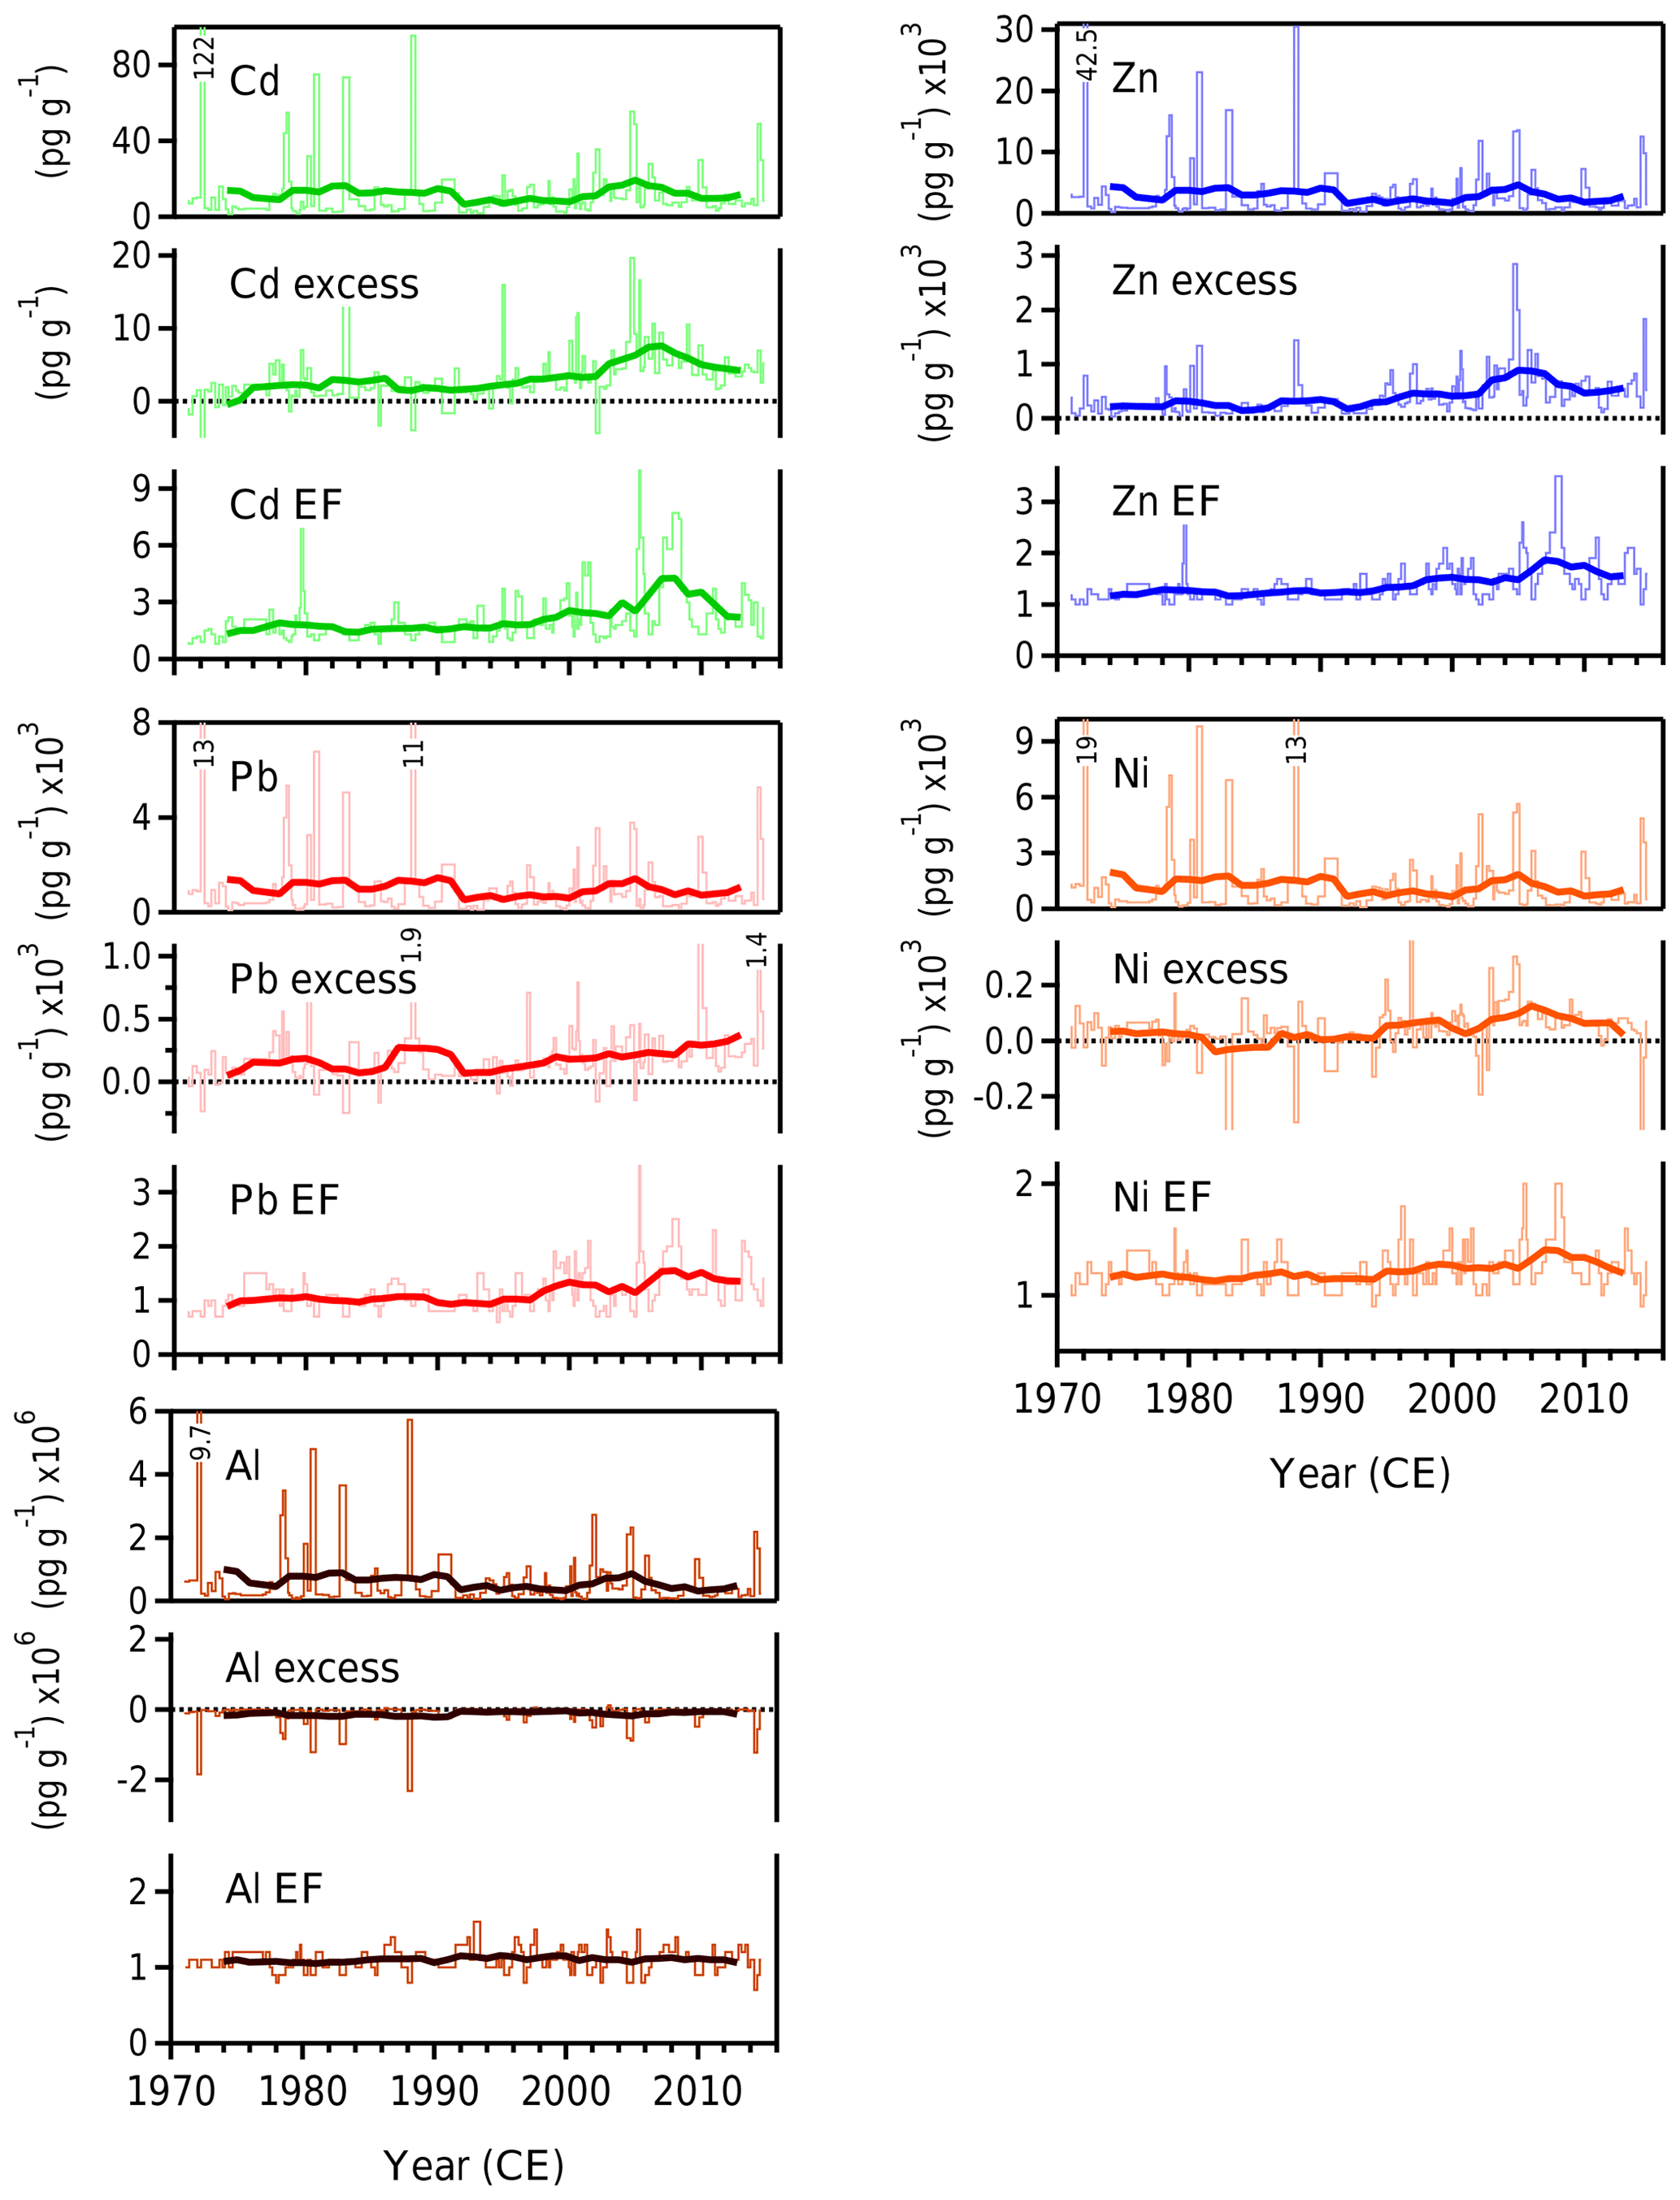
Figure 2Cd, Pb, Zn, Ni, and Al 5-year running means (thick lines) of concentrations, excess concentrations, and EFs between 1971 and 2015. Thin lines show the sample resolution.
The excess concentrations and EFs of Cd, Ni, Pb, and Zn increase after ∼1990 and continue to increase more rapidly and significantly after 2000. Their EF averages increase by ∼10 % for all four TEs during 1990–2000 and during 2000–2015 by 75 % (Cd), 35 % (Pb), 30 % (Zn), and 10 % (Ni) relative to the 1971–1990 period.
A comparison between the 1992 and the 2015 Guliya TE records is discussed in the Supplement (Figs. S1–S2). The 1992 Guliya TE records show that enrichments of Pb and Cd begin ∼1975, while the 2015 Guliya record shows that they continue to rise into the 21st century until ∼2008, when the Cd enrichment started to decrease. In addition to these TEs, the 2015 record exhibits clear increases in Zn and Ni EFs from the 1990s into the 21st century, and similar to Cd, they decrease after 2008. The Zn enrichment began to increase after 1975 similar to Pb and Cd; however, the signal may have been overwhelmed by its crustal component in the 1992 core record, rendering it undetectable.
Factor analysis was used to assess the shared variability among TEs to determine possible common sources (Sierra-Hernández et al., 2018). Most of the variance (94 %) is explained by both Factor 1 (73 %) and Factor 2 (21 %; Table S2). Similar to the 1992 TE results, TEs of crustal origin (e.g., Al, As, Ba, Fe, Mg, Mn, Ti, and V) fall into Factor 1. In Fig. S3 the time series of Factor 1 scores are compared with the ice core concentrations of dust particles (ρ=0.20, p=0.2) and with the typical crustal TEs, Fe and Al. Water-soluble TEs (e.g., Na and Sr), which are deposited in the form of salts (evaporites) or carbonates, contribute to Factor 2 (Sierra-Hernández et al., 2018; Table S2). This is shown in the Factor 2 time series (Fig. S4) which has significant (p<0.001) correlations with the ions Cl− (ρ=0.83), (ρ=0.84), (ρ=0.90), Na+ (ρ = 0.92), (ρ=0.62), K+ (ρ=0.84), Mg2+ (ρ=0.86), and Ca2+ (ρ=0.75; Fig. S3; Thompson et al., 2018).
Factor 3 explains 2 % of the variance and is loaded in Cd and, to a lesser extent, in Bi, Cu, Mn, Ni, Pb, Sn, Tl, and Zn. Although 2 % represents a low variance possibly within the background noise, it could still have physical significance (Moore and Grinsted, 2009). In order to determine if Factor 3 is physically explainable, its time series scores are plotted with the EFs of Cd, Pb, and Zn in Fig. 3.
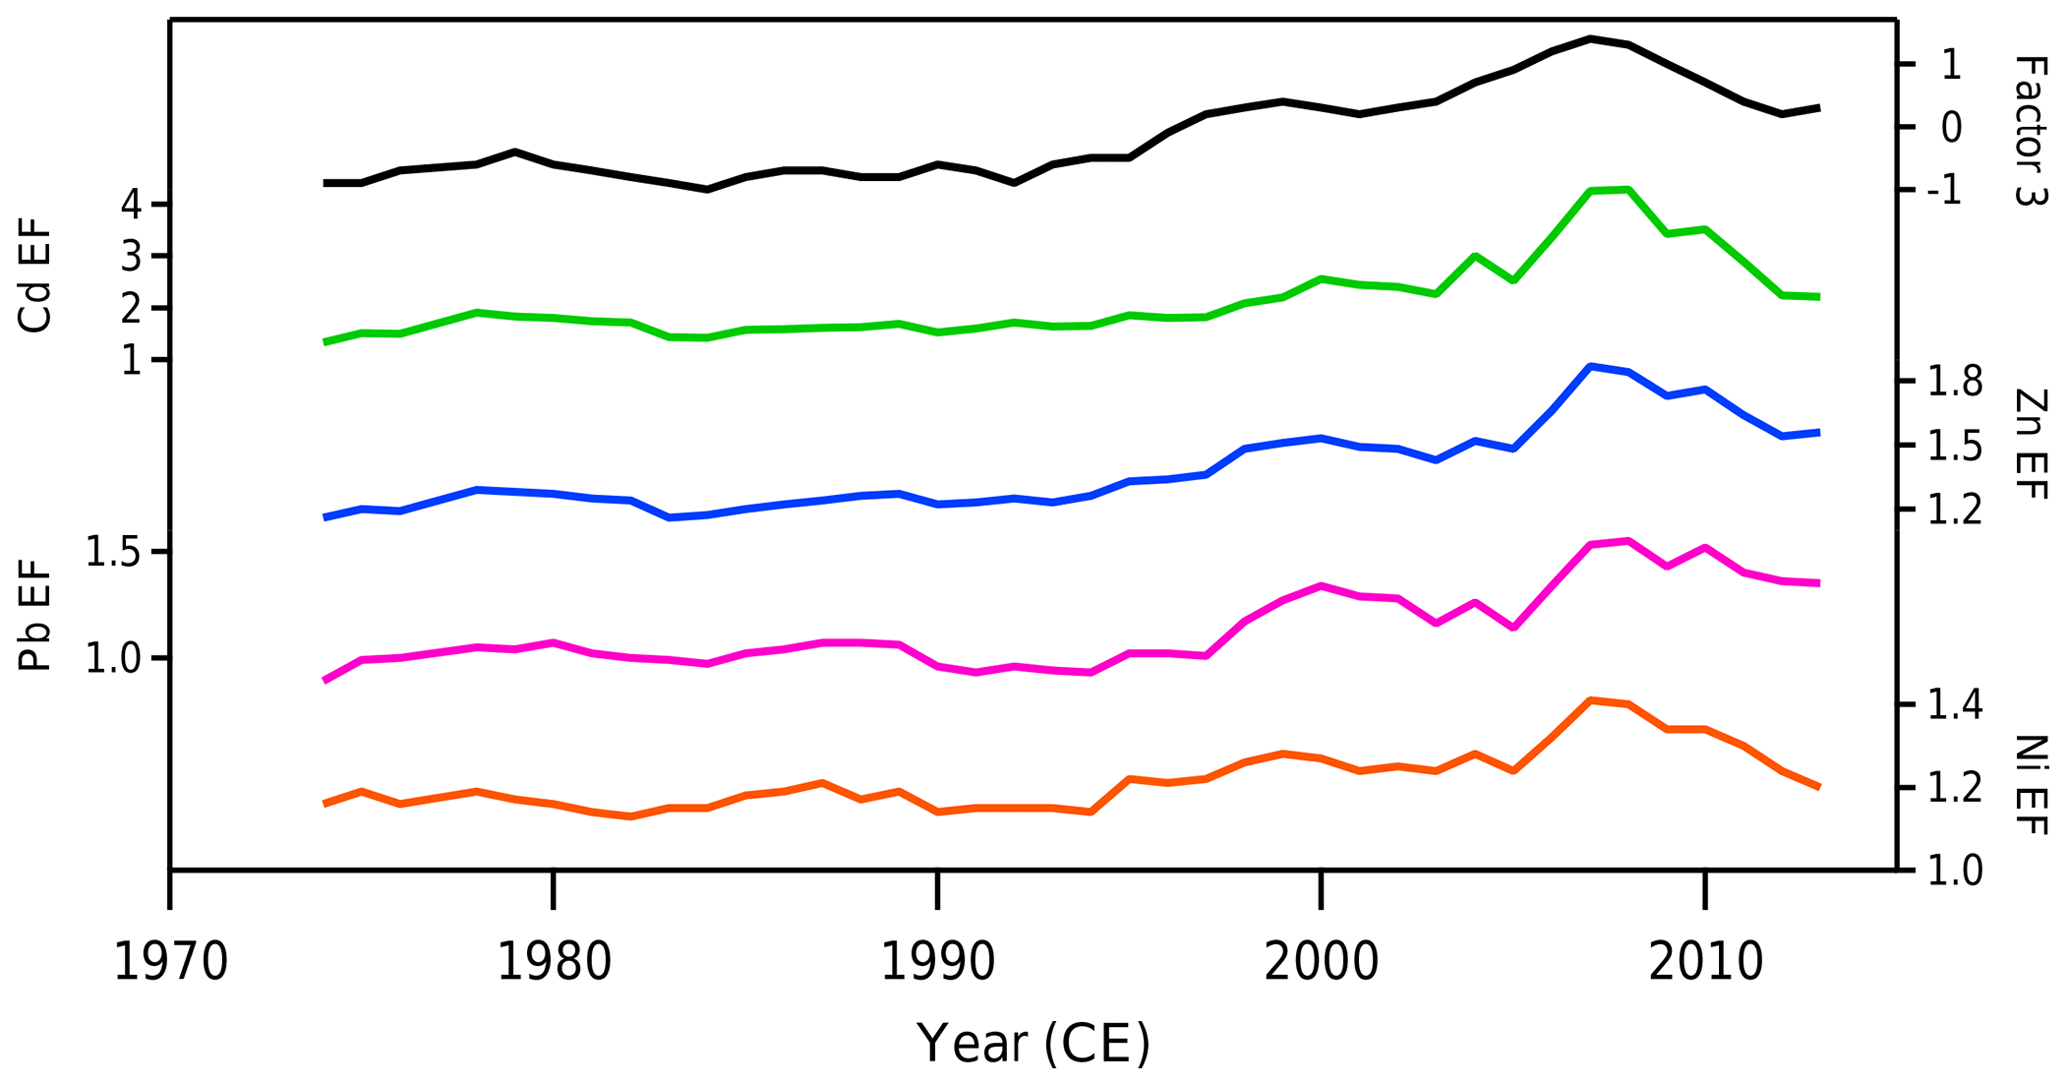
Figure 3Comparison of 5-year running means of Factor 3 scores with Cd, Zn, Pb, and Ni EFs between 1971 and 2015.
Factor 3 was found to be significantly (p<0.01) correlated with the EFs of the following 12 metals: Cd (ρ=0.92), Zn (ρ=0.92), Pb (ρ=0.80), and Ni (ρ=0.80), shown in Fig. 2, and Ag (ρ=0.62), Bi (ρ=0.60), Co (ρ=0.50), Cr (ρ=0.60), Cu (ρ=0.51), Mn (ρ=0.63), Sn (ρ=0.74), and Tl (ρ=0.64). This indicates that Factor 3 explains the EFs of the aforementioned metals. A hierarchical cluster analysis using the Ward linkage method and the Euclidean distance measure and a non-hierarchical (K-means) cluster analysis were performed with factors 1–3 to explore the possible distribution of TEs into associated groups (Fig. S5). Both cluster analyses show that Pb and Zn are strongly associated, suggesting that these TEs likely have common origins.
3.1 21st-century anthropogenic sources
The Mann–Kendall trend test was used to detect TEs with sustained and significant increasing trends in EF and excess concentration during the 1971–2015 period. The trend test indicated that Bi, Cd, Ni, Pb, Tl, and Zn, which are loaded in Factor 3, have significant increasing EF and excess concentration trends. The EFs obtained here using PSAs are much smaller than those calculated using the upper-continental-crust average (Wedepohl, 1995) and also smaller than those from ice cores with lower dust loads compared to Guliya. Thus, it is necessary to determine which of the TEs mentioned above were significantly more enriched during the 2000–2015 period. For this purpose, two different tests were used, the Mann–Whitney test and the two-sample t test (p<0.0005). Both tests showed that the EFs and excess concentrations for the metals, Cd, Zn, Pb, and Ni, are significantly higher during the 2000–2015 period than during the 1971–1990 period. Thus, the following sections will specifically focus on these four TEs and their possible sources.
Back-trajectory frequency distributions were determined to establish the origin of air parcels reaching the Guliya ice cap. Back trajectories (7 d) were calculated daily for the 1992–2015 period for winter (December–January–February; Fig. 1b) and summer (June–July–August; Fig. 1c) using the HYSPLIT model from the National Oceanic and Atmospheric Administration. During winter, Guliya is strongly influenced by air parcels mostly from western Xinjiang (China); from Central Asia, which consists of the former Soviet republics of Kazakhstan, Kyrgyzstan, Tajikistan, Turkmenistan, and Uzbekistan; from Afghanistan and Pakistan in South Asia; and to a lesser extent from the Middle East, northern Africa, and both eastern and western Europe. In summer, westerly and southerly (monsoonal) flows, and even occasional northerly flows, influence Guliya such that the entire Xinjiang region, in addition to Central Asia and the northern regions of Afghanistan and Pakistan, lies within the back-trajectory area. Air parcels from other South Asian countries, such as India and Nepal, can also reach Guliya during summer.
Trace element enrichments in the Guliya core could reflect changes in emissions, atmospheric circulation, and/or post-depositional processes. Post-depositional processes (e.g., seasonal surface melting, percolation, and refreezing of meltwater) do not significantly affect the stratigraphy of the Guliya core (Thompson et al., 2018). The Guliya borehole temperatures were between −8 and −12 ∘C from the surface to ∼15 m depth, confirming that the ice is cold (Thompson et al., 2018) and that overprinting disturbance of the TE records due to meltwater percolation is unlikely to occur. Thus, the enrichments observed in the Guliya record indicate increasing emissions in specific source regions and/or changes in atmospheric circulation. To determine the origin of the Guliya Cd, Pb, Zn, and Ni enrichments, we examine the most important emission sources of atmospheric TEs from the determined regions of influence: Central Asia, South Asia (Afghanistan, Pakistan, and India), and Xinjiang (China). We also use PM2.5 emission estimates, which very likely contain toxic metals such as Cd, Pb, Ni, and Zn, using the EDGAR (Emissions Database for Global Atmospheric Research) v4.3.2 air pollutant dataset (1970–2012; EDGARv4.3.2, 2017; Crippa et al., 2018). The EDGAR dataset provides total PM2.5 and also PM2.5 by emission sector for all countries.
In the EDGAR database, the total PM2.5 corresponds to emissions from all human activities except large-scale biomass burning and land use, land-use change, and forestry (EDGARv4.3.2, 2017; Crippa et al., 2018). To better understand the possible emission sources, here we divided the EDGAR PM2.5 emission sectors into five source categories in accordance with the “2006 IPCC Guidelines for National Greenhouse Gas Inventories” (IPCC, 2006). These source categories include (1) fossil fuel combustion, which comprises the emission sectors of power generation and combustion in the manufacturing, transportation, and residential sectors; (2) biomass burning, which includes biofuel combustion in the manufacturing, transportation, and residential emission sectors as well as agricultural waste and field burning; (3) industrial processes, which include the emission sectors of the mineral, chemical, and metal industry and other production industries (note: this category does not include any type of fossil fuel combustion used by these industries); (4) agriculture, which includes the emission sectors of manure management, rice cultivation, direct soil emission, manure in pasture–range–paddock, and other direct soil emissions; and (5) waste, which includes the emission sectors of waste incineration and solid waste disposal on land.
In 2012, fossil fuel combustion was the primary source of the total PM2.5 emissions in China, Kazakhstan, and Kyrgyzstan (∼60 %–80 %), followed by biomass burning (∼20 %–35 %), industry (∼2 %–10 %), agriculture (∼1 %–3 %), and waste (<1 % for China; no PM2.5 emissions estimated for waste incineration for the other countries in the EDGAR database). Meanwhile, biomass burning was the primary PM2.5 source in Afghanistan, Pakistan, and Nepal (∼80 %–90 %) and in India, Tajikistan, Uzbekistan, and Turkmenistan (∼50 %–60 %), followed by fossil fuel combustion (∼2 %–15 % and 20 %–30 %, respectively) and industrial activities (<2 % and ∼2 %–15 %, respectively; EDGARv4.3.2, 2017; Crippa et al., 2018). Regarding Xinjiang in particular, numerous studies have estimated coal combustion to be a major source of atmospheric Cd, Pb, Zn, and Ni, followed by smelting processes as a source of Cd, Pb, and Zn (Li et al., 2012; Shao et al., 2013; Cheng et al., 2014; Tian et al., 2015); by oil combustion as a source of Ni (Tian et al., 2012); and by biomass burning as a source of Cd, Pb, and Ni (Cheng et al., 2014; Tian et al., 2015). Thus, in the following sections we focus on the largest TE and PM2.5 source categories: fossil fuel combustion (Sect. 3.1.1), biomass burning (Sect. 3.1.2), metal production (Sect. 3.1.3), and the agricultural sector (Sect. 3.1.4).
3.1.1 Fossil fuel combustion
In the regions that influence Guliya, two distinct trends in fossil fuel consumption emissions are discernible. Firstly, a steady increasing trend since the 1970s is observed in Xinjiang, Afghanistan, Pakistan, India, and Nepal (Fig. 4a). Secondly, a decline after the 1990s is observed in Central Asian countries due to the collapse of the Soviet Union (Fig. 4b). India and Xinjiang (China) became the largest consumers of both coal and oil in the region during the 21st century, with coal as their primary energy source (Fig. 4). The third largest consumer of coal and oil in the region during the 21st century is Kazakhstan despite its decreased consumption after the 1990s. Significant (p<0.001) positive correlations were found between the Guliya EFs of Cd, Pb, Zn, and Ni and coal consumption in Xinjiang, India, China, and Pakistan; oil consumption in Xinjiang, India, China, Pakistan, and Turkmenistan; and total PM2.5 emissions from China, India, Pakistan, and Afghanistan. These positive correlations were expected, since these records show generally increasing trends, as shown in Fig. 4. Although Pakistan's fossil fuel consumption is 1–2 orders of magnitude lower than that of Xinjiang and India, the Guliya TE enrichments closely resemble Pakistan's coal consumption between 2005 and 2015. Both records peaked in 2008, after which they began to decrease, suggesting that Pakistan's coal consumption could be one of the sources of anthropogenic TEs observed in the Guliya core.

Figure 4Oil and coal consumption in (a) Xinjiang, as coal energy production in million tonnes of standard coal equivalent (Jianxin, 2016), Afghanistan, in million tonnes of oil equivalent (Mtoe; EIA, 2019), Pakistan (BP, 2019), India (BP, 2019), and Nepal (coal ≤ 0.1 Mtoe; EIA, 2019). (b) Central Asian countries: Kazakhstan (BP, 2019), Kyrgyzstan and Tajikistan (EIA, 2019), and Uzbekistan and Turkmenistan (BP, 2019). PM2.5 emissions from fossil fuel combustion sources (EDGARv4.3.2, 2017; Crippa et al., 2018), shown in both panels for all countries except Xinjiang (China). Smoke and dust emissions from Xinjiang (Ning, 2019) are shown, since no PM2.5 data were available. The Guliya EF composite (average of Cd, Pb, Zn, and Ni EF z scores) is shown at the bottom of each panel for comparison. The two Guliya maxima at 2000 and 2008 are shown as shaded bars.
To further investigate the role of fossil fuel combustion in Pakistan and in the other regions, we examined PM2.5 emitted by the different sectors comprising fossil fuel combustion. The most interesting outcome is the temporal correspondence between the Guliya TE enrichments and Pakistan's PM2.5 emissions associated with road transportation and manufacturing and construction (M–C) industries, which are the two largest fossil fuel combustion PM2.5 emission sectors in Pakistan (Fig. S6). The enrichments of Cd, Pb, Zn, and Ni have two maxima, one in 2000, when PM2.5 emissions from road transportation peaked, and the other in 2008, when PM2.5 emissions from the M–C industries peaked. After 2008, TE enrichments (except for Pb) and PM2.5 emissions (road transportation and M–C industries) decreased (Fig. S6).
Although Pakistan's oil and coal consumption is much lower than that in Xinjiang and India, Pakistan is home to some of the most polluted cities in the world (WHO, 2019) due to the lack of emission controls and air quality standards (Colbeck et al., 2010; Sánchez-Triana et al., 2014). These cities include Peshawar, Rawalpindi, Lahore, Faisalabad, and Pakistan's capital, Islamabad (Rasheed et al., 2014; WHO, 2019; Shi et al., 2018), all located in northern Pakistan, from which air parcels have been shown to strongly influence the Guliya site throughout the year. Air parcels from Xinjiang and India, on the other hand, only reach Guliya during summer (Fig. 1c). Thus, fossil fuel combustion emissions from Xinjiang and India but also from Pakistan contribute significantly to the Guliya TE enrichments observed. Nepal's and Afghanistan's fossil fuel consumption has also been increasing, and even though it is ∼10–100 times lower than that of Xinjiang, India, or Pakistan, it is within the high-percentage (5 %–15 %) region of back-trajectory frequencies. Thus, fossil fuel emissions from both Nepal and Afghanistan can also reach Guliya. Although fossil fuel consumption has declined in Central Asia since the 1990s, their emissions have also likely contributed to the TE enrichments detected in Guliya, since Central Asia is in the high-frequency region of the Guliya back trajectories.
3.1.2 Biomass burning
Total PM2.5 emissions from biomass burning have been increasing since 1970 in Pakistan, India, and Nepal at a constant rate and in Afghanistan, Tajikistan, Uzbekistan, and Turkmenistan since ∼1995 (Fig. 5). In China, they reached a maximum in 1990, after which they slightly decreased probably due to the increase of fossil fuel consumption. The Guliya TE enrichments do not resemble the biomass burning PM2.5 emission trends for any country except for Turkmenistan's, which peaks in 2007, 1 year before the Guliya EF maximum, and then it decreases similarly to the Guliya TE enrichments. The residential sector is the largest contributor of biomass burning PM2.5 emissions in China, India, Nepal, and Pakistan, followed by agricultural waste burning; conversely, in Central Asia and Afghanistan the burning of agricultural waste is the largest contributor of biomass burning PM2.5, followed by the residential sector (EDGARv4.3.2, 2017; Crippa et al., 2018).
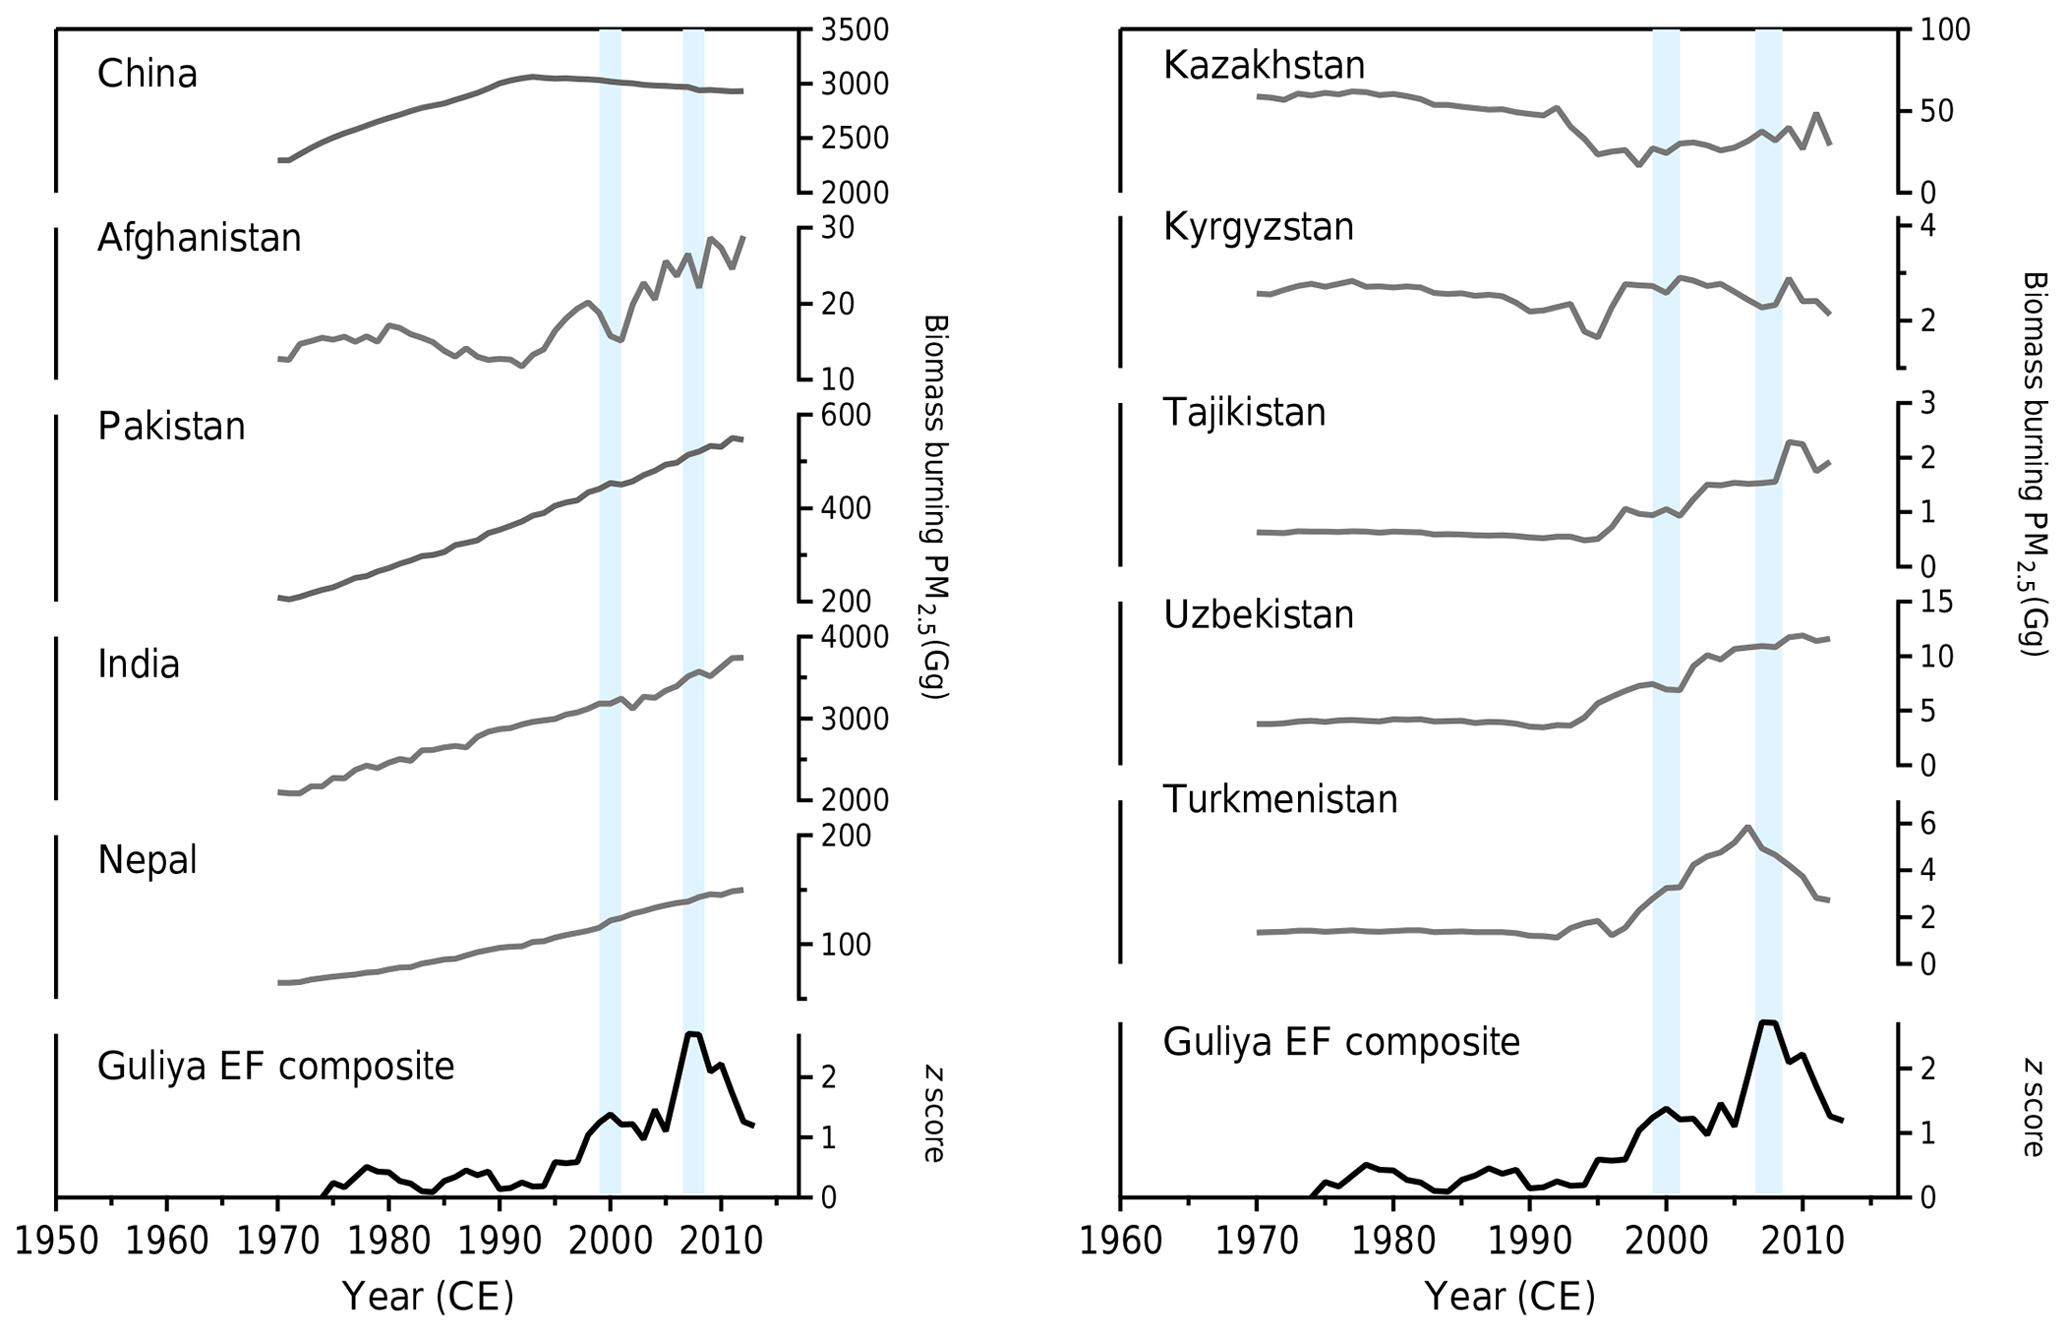
Figure 5PM2.5 emissions from biomass burning sources (EDGARv4.3.2, 2017; Crippa et al., 2018), shown in both panels for all countries. The Guliya EF composite (average of Cd, Pb, Zn, and Ni EF z scores) is shown at the bottom of each panel for comparison. The two Guliya maxima at 2000 and 2008 are shown as shaded bars.
Households in developing countries, particularly in rural areas of Asia, widely use traditional biomass burning, characterized by its low efficiency and by the lack of emission controls, for heating and cooking (Gumartini, 2009; Chen et al., 2017; Weyant et al., 2019). In 2012, 4513 Gg of PM2.5 from biomass burning and 2534 Gg of PM2.5 from fossil fuel combustion from all the countries of interest here (except China) were emitted to the atmosphere (EDGARv4.3.2, 2017; Crippa et al., 2018). Some studies have found higher TE contents in PM2.5 emitted from coal combustion than from biomass burning (except for Zn; Steenari et al., 1999; Ross et al., 2002; Richaud et al., 2004). However, biomass, like fossil fuels, is a complex mixture of organic and inorganic matter, and the TE contents in its PM2.5 emissions depend on the type and origin of the biomass and on its burning conditions (Christian et al., 2010; Vassilev et al., 2013). Thus, while PM2.5 from biomass burning is almost twice that from fossil fuel combustion, we can only conclude that biomass burning emissions from Central Asia, South Asia, and Xinjiang likely have greatly contributed, like fossil fuels, to the TE enrichments detected in the Guliya ice cap.
Large-scale biomass burning events, excluded in the EDGAR database, can be another source of atmospheric TEs. In the regions of interest here, fire activity and its emissions decreased in Central Asia and in northwestern China between 1997 and 2016. However they increased in India (including northwestern India) and in Nepal, both of which are in the high-percentage back-trajectory frequency of Guliya (Fig. S7; van der Werf et al., 2017; You et al., 2018). Thus, emissions from the increased fire activity in India and Nepal probably contribute to the enrichments observed in the Guliya ice core.
3.1.3 Metal production
Like fossil fuel consumption, metal production has increased in Asia since the 1980s (Fig. S8), with China, India, and Kazakhstan being the most important non-ferrous metal producers in the region and in the world (BGS, 2019). In China, most of the non-ferrous metal production is located in the coastal regions, while all Ni production is located in the western region of China (Gansu, Xinjiang, Chongqing, Yunnan, and Liaoning provinces). Gansu, just east of Xinjiang, produces 95 % of the total Ni production in China (Yanjia and Chandler, 2010). The Guliya TE enrichment trends do not resemble those of metal production in China, Pakistan, India, or Kazakhstan (Fig. S8). Thus, although these important metal production sources are relatively close to Guliya, they are likely not the primary source of the Guliya TE enrichments.
PM2.5 emissions by industrial processes contribute 10 % of the total PM2.5 emissions in China and 2 % to the total PM2.5 emissions in India, Pakistan, and Kazakhstan. Pakistan's PM2.5 emissions by industrial processes peaked in 2008, similar to the Guliya TE enrichments, but they remained relatively stable after 2008, while the Guliya TE enrichments decreased (Fig. S8). Thus, while the increasing emissions from metal production could also influence the TE depositions observed in Guliya, the metal production temporal trends and the industrial PM2.5 emissions suggest that they are not the main sources of the Guliya TE enrichments.
3.1.4 Agricultural activities
Emissions from agricultural activities are an important source of atmospheric PM2.5 worldwide (Lelieveld et al., 2015; Bauer et al., 2016). Fertilizers and pesticides can be a direct (aerial spreading) or indirect (soil exposed to wind erosion) source of toxic metals such as As, Cd, Cu, Cr, Pb, Ni, Zn, and others to the atmosphere (Nriagu and Pacyna, 1988; Nriagu, 1989b). In particular, fertilizers derived from phosphate rocks contain heavy metal impurities such as Cd and Pb that can contaminate agricultural soils (Mortvedt, 1995; Roberts, 2014). While consumption of phosphate fertilizers decreased in Central Asia in the 1990s, it has been increasing in China, Pakistan, India, and Nepal since the 1970s (Fig. S9). The Guliya TE enrichments resemble neither the phosphate fertilizer consumption records in these countries nor their PM2.5 emissions from agricultural activities (Fig. S9). However, emissions associated with agricultural activities in western China, Pakistan, India, and Nepal are likely becoming more important sources of atmospheric TEs, since they have been increasing recently and they originate in the back-trajectory high-frequency regions for Guliya.
Although practically all human activities that emit PM2.5 and toxic metals have been increasing in South Asia and in northwestern China, it is very likely that emissions from fossil fuel combustion and biomass burning have dominated the Guliya Cd, Pb, Zn, and Ni enrichments during the 21st century. Emissions from other sources such as industrial processes, agriculture activities, waste disposal, and land-use change have also likely been deposited on the Guliya ice cap. Although economic activities in Central Asia have declined since the 1990s, emissions from their different sectors also probably contribute to the TE enrichments observed in Guliya during the 21st century.
China is investing heavily in global infrastructure projects like the Belt and Road Initiative (New Silk Road), the western-development policy, and the Pakistan–China Economic Corridor (PCEP) that could potentially increase the emission of atmospheric toxic TEs. These projects were established to improve the economic connectivity with the west and with other countries in the region by modernizing and building new airports, railways, highways, water infrastructure, and power lines. In Pakistan energy was generated mostly from oil, gas, and hydropower until 2015. After the establishment of the PCEP, five coal-fired power plants were built and have been operational since 2017. Three additional plants are expected to open in 2019, and more are currently under construction (CPEC, 2019). These developing projects and the shift to coal-generated power could have severe environmental and human health impacts in the region if mitigation actions are not taken.
A new continuous, high-resolution ice core record of trace elements covering the 1971–2015 period was extracted from the Guliya ice cap in northwestern Tibet, China. This new record extends our previous 1650–1991 Guliya record well into the 21st century, making it the first and most up-to-date ice-core-derived archive of trace metal contamination in the Third Pole region. Since the dust concentrations in the Guliya ice cores are extremely high in comparison to other ice cores from the Third Pole as shown in Sierra-Hernández et al. (2018), we also used EF and excess concentrations to differentiate between crustal and non-crustal origins in this new record. Increases in EF and excess concentrations of Cd, Pb, Zn, and Ni have been observed since the 1990s, reaching a maximum in 2008. The enrichments of Cd, Pb, Zn, and Ni increased by ∼75 %, 35 %, 30 %, and 10 %, respectively, during the 2000–2015 period relative to 1971–1990. Comparisons between the Cd, Pb, Zn, and Ni enrichments from the Guliya records and fossil fuel consumption, metal production, phosphate fertilizer consumption, and PM2.5 emissions from Xinjiang (China), Afghanistan, Pakistan, India, Nepal, and Central Asia suggest that the metal enrichments detected in Guliya originate primarily from fossil fuel combustion and biomass burning in these regions and secondarily from industrial processes and agricultural activities. This new Guliya ice core record demonstrates that the current emissions in Asia impact remote high-altitude glaciers in the region. Therefore, mitigation policies and technologies should be enforced by the governments of Central and South Asian countries to improve the air quality in the region as most Asian countries continue to develop.
The data presented in this work are archived at the NOAA's National Centers for Environmental Information for Paleoclimatology (https://www.ncdc.noaa.gov/paleo-search/, last access: 12 November 2019). The data will be posted following the publication of this paper.
The supplement related to this article is available online at: https://doi.org/10.5194/acp-19-15533-2019-supplement.
MRSH wrote the paper, performed all the data analysis, interpreted the data, and ran the daily HYSPLIT back trajectories; MRSH and EB prepared the ice core samples and conducted their ICP-MS analysis; and EB created the maps for Fig. 1. All authors contributed to the study design, data interpretation, and revision and editing of the paper. PG oversees the ICP-MS lab. LT planned the drilling operation and led the field expedition during which both LT and PG contributed to the ice core processing in the field.
The authors declare that they have no conflict of interest.
We thank everybody that made the 2015 Guliya field expedition a success, in particular Tandong Yao from the Institute for Tibetan Plateau Research. The authors greatly acknowledge Julien Nicolas for creating the seasonal back-trajectory frequency grid for all our Guliya TEs publications as well as for his time discussing them. We thank Aaron Wilson for his insight on the meteorology of the region. We thank Xiaoxing Yang and Chao You for providing recent energy yearbook data from Xinjiang. We also thank Max Woodworth for helpful discussions about development projects and policies in western China. We are grateful to Ellen Mosley-Thompson and Mary Davis for valuable comments throughout the development of the paper. We thank Henry Brecher for his detailed proofreading of the paper. Lastly, Stacy Porter is greatly acknowledged for all her help in editing and improving the English of the different versions of the paper. This is Byrd Polar and Climate Research Center contribution no. C-1590.
This research has been supported by the National Science Foundation, P2C2 program of the Directorate for Geosciences (grant no. 1502919).
This paper was edited by Jayanarayanan Kuttippurath and reviewed by Aubrey Hillman and two anonymous referees.
Alves, C. A., Gonçalves, C., Pio, C. A., Mirante, F., Caseiro, A., Tarelho, L., Freitas, M. C., and Viegas, D. X.: Smoke emissions from biomass burning in a Mediterranean shrubland, Atmos. Environ., 44, 3024–3033, https://doi.org/10.1016/j.atmosenv.2010.05.010, 2010.
Bauer, S. E., Tsigaridis, K., and Miller, R.: Significant atmospheric aerosol pollution caused by world food cultivation, Geophys. Res. Lett., 43, 5394–5400, https://doi.org/10.1002/2016gl068354, 2016.
Beaudon, E., Gabrielli, P., Sierra-Hernández, M. R., Wegner, A., and Thompson, L. G.: Central Tibetan Plateau atmospheric trace metals contamination: A 500-year record from the Puruogangri ice core, Sci. Total Environ., 601–602, 1349–1363, 2017.
BGS (British Geological Survey): World Mineral Statistics and World Mineral Production, Keyworth, Nottingham, UK, available at: https://www.bgs.ac.uk/mineralsuk/statistics/wms.cfc?method=searchWMS, last access: 5 April 2019.
BP (British Petroleoum): Statistical Review of World Energy, London, UK, available at: http://www.bp.com/statisticalreview, last access: 4 October 2019.
Chen, J., Li, C., Ristovski, Z., Milic, A., Gu, Y., Islam, M. S., Wang, S., Hao, J., Zhang, H., He, C., Guo, H., Fu, H., Miljevic, B., Morawska, L., Thai, P., Lam, Y. F., Pereira, G., Ding, A., Huang, X., and Dumka, U. C.: A review of biomass burning: Emissions and impacts on air quality, health and climate in China, Sci. Total Environ., 579, 1000–1034, https://doi.org/10.1016/j.scitotenv.2016.11.025, 2017.
Chen, P., Kang, S., Bai, J., Sillanpää, M., and Li, C.: Yak dung combustion aerosols in the Tibetan Plateau: Chemical characteristics and influence on the local atmospheric environment, Atmos. Res., 156, 58–66, https://doi.org/10.1016/j.atmosres.2015.01.001, 2015.
Chen, W., Li, H., and Wu, Z.: Western China energy development and west to east energy transfer: Application of the Western China Sustainable Energy Development Model, Energ. Policy, 38, 7106–7120, 2010.
Cheng, K., Tian, H. Z., Zhao, D., Lu, L., Wang, Y., Chen, J., Liu, X. G., Jia, W. X., and Huang, Z.: Atmospheric emission inventory of cadmium from anthropogenic sources, Int. J. Environ. Sci. Te., 11, 605–616, https://doi.org/10.1007/s13762-013-0206-3, 2014.
China Pakistan Economic Corridor: http://cpec.gov.pk/, last access: 4 April 2019.
Christian, T. J., Yokelson, R. J., Cárdenas, B., Molina, L. T., Engling, G., and Hsu, S.-C.: Trace gas and particle emissions from domestic and industrial biofuel use and garbage burning in central Mexico, Atmos. Chem. Phys., 10, 565–584, https://doi.org/10.5194/acp-10-565-2010, 2010.
Colbeck, I., Nasir, Z. A., and Ali, Z.: The state of ambient air quality in Pakistan – A review, Environ. Sci. Pollut. R., 17, 49–63, https://doi.org/10.1007/s11356-009-0217-2, 2010.
Cooke, C. A. and Bindler, R.: Lake Sediment Records of Preindustrial Metal Pollution, in: Environmental Contaminants. Developments in Paleoenvironmental Research, edited by: Blais, J., Rosen, M., and Smol, J., Springer, Dordrecht, the Netherlands, 101–119, 2015.
Crippa, M., Guizzardi, D., Muntean, M., Schaaf, E., Dentener, F., van Aardenne, J. A., Monni, S., Doering, U., Olivier, J. G. J., Pagliari, V., and Janssens-Maenhout, G.: Gridded emissions of air pollutants for the period 1970–2012 within EDGAR v4.3.2, Earth Syst. Sci. Data, 10, 1987–2013, https://doi.org/10.5194/essd-10-1987-2018, 2018.
Dong, W. and Yang, Y.: Exploitation of mineral resource and its influence on regional development and urban evolution in Xinjiang, China, J. Geogr. Sci., 24, 1131–1146, https://doi.org/10.1007/s11442-014-1143-x, 2014.
EDGARv4.3.2: European Commission, Joint Research Centre (EC-JRC)/Netherlands Environmental Assessment Agency (PBL). Emissions Database for Global Atmospheric Research (EDGAR), release EDGAR v4.3.2 (1970–2012), available at: http://edgar.jrc.ec.europa.eu/overview.php?v=431 (last access: 3 October 2019), 2017.
EIA (U.S. Energy Information Administration): International Energy Statistics, Washington, D.C., USA, available at: https://www.eia.gov/beta/international/, last access: 15 March 2019.
Fridley, D., Lu, H., and Liu, X.: China Energy Databook 9.0, 9th edn., edited by: Group, C. E., Lawrence Berkeley National Laboratory, Berkeley, CA, USA, 2017.
Gabrielli, P. and Vallelonga, P.: Contaminant Records in Ice Cores, in: Environmental Contaminants. Developments in Paleoenvironmental Research, edited by: Blais, J., Rosen, M., and Smol, J., Springer, Dordrecht, the Netherlands, 393–430, 2015.
Gumartini, T.: Biomass energy in the Asia-pacific region: current status, trends and future setting, FAO Regional Office, Bangkok, Thailand, 2009.
Hansson, S., Bindler, R., and De Vleeschouwer, F.: Using Peat Records as Natural Archives of Past Atmospheric Metal Deposition, in: Environmental Contaminants. Developments in Paleoenvironmental Research, edited by: Blais, J., Rosen, M., and Smol, J., Springer, Dordrecht, the Netherlands, 323–354, 2015.
IPCC: 2006 IPCC Guidelines for National Greenhouse Gas Inventories, edited by: Eggleston, S., Buendia, L., Miwa, K., Ngara, T., and Tanabe, K., Hayama, Japan, 2006.
Jianxin, J.: Xinjiang Statistical Yearbook, China Statistics Press, Beijing, China, 2016.
Lai, H. H.: China's Western Development Program: Its Rationale, Implementation, and Prospects, Modern China, 28, 432–466, 2002.
Lelieveld, J., Evans, J. S., Fnais, M., Giannadaki, D., and Pozzer, A.: The contribution of outdoor air pollution sources to premature mortality on a global scale, Nature, 525, 367–371, https://doi.org/10.1038/nature15371, 2015.
Li, Q., Cheng, H., Zhou, T., Lin, C., and Guo, S.: The estimated atmospheric lead emissions in China, 1990–2009, Atmos. Environ., 60, 1–8, 2012.
Liu, F., Zhang, Q., Tong, D., Zheng, B., Li, M., Huo, H., and He, K. B.: High-resolution inventory of technologies, activities, and emissions of coal-fired power plants in China from 1990 to 2010, Atmos. Chem. Phys., 15, 13299–13317, https://doi.org/10.5194/acp-15-13299-2015, 2015.
Marx, S. K. and McGowan, H. A.: Long-Distance Transport of Urban and Industrial Metals and Their Incorporation into the Environment: Sources, Transport Pathways and Historical Trends, in: Urban Airborne Particulate Matter. Origin, Chemistry, Fate and Health Impacts, edited by: Zereini, F., and Wiseman, C. L. S., Springer, Berlin, Germany, 103–123, 2010.
Marx, S. K., Rashid, S., and Stromsoe, N.: Global-scale patterns in anthropogenic Pb contamination reconstructed from natural archives, Environ. Pollut., 213, 283–298, 2016.
Moore, J. C. and Grinsted, A.: Ion Fractionation and Percolation in Ice Cores with Seasonal Melting, Physics of Ice Core Records II, Suppl Issue of Low Temperature Science, 68, 287–298, 2009.
Mortvedt, J. J.: Heavy metal contaminants in inorganic and organic fertilizers, Fert. Res., 43, 55–61, https://doi.org/10.1007/bf00747683, 1995.
Ning, J.: China Statistical Yearbook, China Statistics Press, Beijing, China, available at: http://www.stats.gov.cn/english/Statisticaldata/AnnualData/, last access: 19 March 2019.
Nriagu, J. O.: Natural Versus Anthropogenic Emissions of Trace Metals to the Atmosphere, in: Control and Fate of Atmospheric Trace Metals, edited by: Pacyna, J., and Ottar, B., Mathematical and Physical Sciences, 268, Kluwer Academic Publishers, Dordrecht, the Netherlands, 3–13, 1989a.
Nriagu, J. O.: A global assessment of natural sources of atmospheric trace metals, Lett. Nature, 338, 47–49, 1989b.
Nriagu, J. O. and Pacyna, J. M.: Quantitative assessment of worldwide contamination of air, water and soils by trace metals, Nature, 333, 134–139, 1988.
Pacyna, J. M. and Pacyna, E. G.: An assessment of global and regional emissions of trace metals to the atmosphere from anthropogenic sources worldwide, Environ. Rev., 9, 269–298, 2001.
Rasheed, A., Aneja, V. P., Aiyyer, A., and Rafique, U.: Measurements and analysis of air quality in Islamabad, Pakistan, Earth's Future, 2, 303–314, https://doi.org/10.1002/2013ef000174, 2014.
Reddy, M. S., Basha, S., Joshi, H. V., and Jha, B.: Evaluation of the emission characteristics of trace metals from coal and fuel oil fired power plants and their fate during combustion, J. Hazard. Mater., 123, 242–249, https://doi.org/10.1016/j.jhazmat.2005.04.008, 2005.
Richaud, R., Herod, A. A., and Kandiyoti, R.: Comparison of trace element contents in low-temperature and high-temperature ash from coals and biomass, Fuel, 83, 2001–2012, https://doi.org/10.1016/j.fuel.2004.05.009, 2004.
Roberts, T. L.: Cadmium and Phosphorous Fertilizers: The Issues and the Science, Procedia Eng., 83, 52–59, https://doi.org/10.1016/j.proeng.2014.09.012, 2014.
Rolph, G., Stein, A., and Stunder, B.: Real-time Environmental Applications and Display sYstem: READY, Environ. Model. Softw., 95, 210–228, 2017.
Ross, A. B., Jones, J. M., Chaiklangmuang, S., Pourkashanian, M., Williams, A., Kubica, K., Andersson, J. T., Kerst, M., Danihelka, P., and Bartle, K. D.: Measurement and prediction of the emission of pollutants from the combustion of coal and biomass in a fixed bed furnace, Fuel, 81, 571–582, https://doi.org/10.1016/S0016-2361(01)00157-0, 2002.
Sánchez-Triana, E., Enriquez, S., Afzal, J., and Nakawaga, A.: Air Pollution in Pakistan, in: Cleaning Pakistan's Air: Policy Options to Address the Cost of Outdoor Air Pollution, The World Bank, Washington, D.C., USA, 57–81, 2014.
Shao, X., Cheng, H., Li, Q., and Lin, C.: Anthropogenic atmospheric emissions of cadmium in China, Atmos. Environ., 79, 155–160, 2013.
Shi, Y., Matsunaga, T., Yamaguchi, Y., Li, Z., Gu, X., and Chen, X.: Long-term trends and spatial patterns of satellite-retrieved PM2.5 concentrations in South and Southeast Asia from 1999 to 2014, Sci. Total Environ., 615, 177–186, https://doi.org/10.1016/j.scitotenv.2017.09.241, 2018.
Sierra-Hernández, M. R., Gabrielli, P., Beaudon, E., Wegner, A., and Thompson, L. G.: Atmospheric depositions of natural and anthropogenic trace elements on the Guliya ice cap (northwestern Tibetan Plateau) during the last 340 years, Atmos. Environ., 176, 91–102, 2018.
Singh, N., Banerjee, T., Raju, M. P., Deboudt, K., Sorek-Hamer, M., Singh, R. S., and Mall, R. K.: Aerosol chemistry, transport, and climatic implications during extreme biomass burning emissions over the Indo-Gangetic Plain, Atmos. Chem. Phys., 18, 14197–14215, https://doi.org/10.5194/acp-18-14197-2018, 2018.
Steenari, B. M., Schelander, S., and Lindqvist, O.: Chemical and leaching characteristics of ash from combustion of coal, peat and wood in a 12MW CFB – a comparative study, Fuel, 78, 249–258, https://doi.org/10.1016/S0016-2361(98)00137-9, 1999.
Stein, A. F., Draxler, R. R., Rolph, G. D., Stunder, B. J. B., Cohen, M. D., and Ngan, F.: NOAA's HYSPLIT Atmospheric Transport and Dispersion Modeling System, B. Am. Meteorol. Soc., 96, 2059–2077, https://doi.org/10.1175/bams-d-14-00110.1, 2015.
Thompson, L. G., Mosley-Thompson, E., Davis, M. E., Lin, P.-N., Mikhalenko, V., and Dai, J.: A 1000 year ice core climate record from the Guliya Ice Cap, China and its relationship to global climate variability, Ann. Glaciol., 21, 175–181, 1995.
Thompson, L. G., Yao, T., Davis, M. E., Mosley-Thompson, E., Wu, G., Porter, S. E., Xu, B., Lin, P.-N., Wang, N., Beaudon, E., Duan, K., Sierra-Hernández, M. R., and Kenny, D. V.: Ice core records of climate variability on the Third Pole with emphasis on the Guliya ice cap, western Kunlun Mountains, Quaternary Sci. Rev., 188, 1–14, 2018.
Tian, H. Z., Lu, L., Cheng, K., Hao, J. M., Zhao, D., Wang, Y., Jia, W. X., and Qiu, P. P.: Anthropogenic atmospheric nickel emissions and its distribution characteristics in China, Sci. Total Environ., 417–418, 148–157, https://doi.org/10.1016/j.scitotenv.2011.11.069, 2012.
Tian, H. Z., Zhu, C. Y., Gao, J. J., Cheng, K., Hao, J. M., Wang, K., Hua, S. B., Wang, Y., and Zhou, J. R.: Quantitative assessment of atmospheric emissions of toxic heavy metals from anthropogenic sources in China: historical trend, spatial distribution, uncertainties, and control policies, Atmos. Chem. Phys., 15, 10127–10147, https://doi.org/10.5194/acp-15-10127-2015, 2015.
Uglietti, C., Gabrielli, P., Olesik, J. W., Lutton, A., and Thompson, L. G.: Large variability of trace element mass fractions determined by ICP-SFMS in ice core samples from worldwide high altitude glaciers, Appl. Geochem., 47, 109–121, 2014.
UN (United Nations): World Population Prospects: The 2017 Revision, Department of Economic and Social Affairs, Population Division, New York, NY, USA, 2017.
van der Werf, G. R., Randerson, J. T., Giglio, L., van Leeuwen, T. T., Chen, Y., Rogers, B. M., Mu, M., van Marle, M. J. E., Morton, D. C., Collatz, G. J., Yokelson, R. J., and Kasibhatla, P. S.: Global fire emissions estimates during 1997–2016, Earth Syst. Sci. Data, 9, 697–720, https://doi.org/10.5194/essd-9-697-2017, 2017.
Vassilev, S. V., Baxter, D., Andersen, L. K., and Vassileva, C. G.: An overview of the composition and application of biomass ash. Part 1. Phase–mineral and chemical composition and classification, Fuel, 105, 40–76, https://doi.org/10.1016/j.fuel.2012.09.041, 2013.
Wedepohl, K. H.: The composition of the continental crust, Geochim. Cosmochim. Ac., 59, 1217–1232, 1995.
Weyant, C. L., Chen, P., Vaidya, A., Li, C., Zhang, Q., Thompson, R., Ellis, J., Chen, Y., Kang, S., Shrestha, G. R., Yagnaraman, M., Arineitwe, J., Edwards, R., and Bond, T. C.: Emission Measurements from Traditional Biomass Cookstoves in South Asia and Tibet, Environ. Sci. Technol., 53, 3306–3314, https://doi.org/10.1021/acs.est.8b05199, 2019.
WHO (World Health Organization): Ambient Air Pollution Database, Geneva, Switzerland, available at: https://www.who.int/airpollution/data/cities/en/, last access: 25 March 2019.
Xu, M., Yan, R., Zheng, C., Qiao, Y., Han, J., and Sheng, C.: Status of trace element emission in a coal combustion process: a review, Fuel Process. Technol., 85, 215–237, https://doi.org/10.1016/S0378-3820(03)00174-7, 2004.
Yanjia, W. and Chandler, W.: The Chinese nonferrous metals industry-energy use and CO2 emissions, Energ. Policy, 38, 6475–6484, https://doi.org/10.1016/j.enpol.2009.03.054, 2010.
You, C., Yao, T., and Xu, C.: Recent Increases in Wildfires in the Himalayas and Surrounding Regions Detected in Central Tibetan Ice Core Records, J. Geophys. Res.-Atmos., 123, 3285–3291, https://doi.org/10.1002/2017jd027929, 2018.
Zhang, W., Tong, Y., Wang, H., Chen, L., Ou, L., Wang, X., Liu, G., and Zhu, Y.: Emission of metals from pelletized and uncompressed biomass fuels combustion in rural household stoves in China, Sci. Rep., 4, 5611–5611, https://doi.org/10.1038/srep05611, 2014.