the Creative Commons Attribution 4.0 License.
the Creative Commons Attribution 4.0 License.
 | 16 Dec 2019
Sea spray fluxes from the southwest coast of the United Kingdom – dependence on wind speed and wave height
Sarah J. Norris
Thomas G. Bell
Ian M. Brooks
Fluxes of sea spray aerosols were measured with the eddy covariance technique from the Penlee Point Atmospheric Observatory (PPAO) on the southwest coast of the United Kingdom over several months from 2015 to 2017. Two different fast-responding aerosol instruments were employed: an ultra-fine condensation particle counter (CPC) that detects aerosols with a radius above ca. 1.5 nm and a compact lightweight aerosol spectrometer probe (CLASP) that provides a size distribution between ca. 0.1 and 6 µm. The measured sea spray emission fluxes essentially all originated from the shallow waters upwind, rather than from the surf zone/shore break. Fluxes from the CPC and from the CLASP (integrated over all sizes) were generally comparable, implying a reasonable closure in the aerosol number flux. Compared to most previous observations over the open ocean, at the same wind speed the mean sea spray number fluxes at PPAO are much greater. Significant wave height and wave Reynolds numbers explain more variability in sea spray fluxes than wind speed does, implying that enhanced wave breaking resulting from shoaling in shallow coastal waters is a dominant control on sea spray emission. Comparisons between two different wind sectors (open water vs. fetch-limited Plymouth Sound) and between two sets of sea states (growing vs. falling seas) further confirm the importance of wave characteristics on sea spray fluxes. These results suggest that spatial variability in wave characteristics need to be taken into account in predictions of coastal sea spray productions and also aerosol loading.
- Article
(5389 KB) - Full-text XML
- BibTeX
- EndNote


Sea spray aerosols formed from wave breaking impacting the Earth's radiative balance both directly by scattering light (Haywood et al., 1999; Lewis and Schwartz, 2004) and indirectly by affecting marine cloud formation (Clarke et al., 2006). At high wind speeds sea spray also has the potential to influence the air–sea transfer of heat and gases (e.g. Andreas et al., 1995; Jeong et al., 2012). For atmospheric chemistry, sea spray droplets provide an important medium for heterogeneous reactions (Sievering et al., 1991; Kim et al., 2014). In coastal regions where roughly half of the world's population resides, sea spray constitutes a major component of particulate matter in the marine atmospheric boundary layer. Particulate matter is directly relevant for human health and is subject to air quality regulations.
Breaking waves entrain air into water, resulting in plumes of bubbles within the top metres of the ocean and the appearance of whitecaps (Thorpe, 1992). Sea spray aerosols are primarily formed from the bursting of those bubbles. Two modes of sea spray aerosols are commonly observed: the film drop mode (predominantly submicron) arising from disintegration of relatively large bubbles, and the jet drop mode (≥ 500 nm to a few microns in radius) from relatively small bubbles (e.g. Blanchard, 1963). Tearing of the wave crest under conditions of very high winds can also lead to large spume droplets (tens of microns to millimetres; Monahan et al., 1983), which may contribute significantly to the total sea spray mass flux but not to the number flux. The causal relationship between bubbles and sea spray has led to the application of the “whitecap” method for the estimation of sea spray flux over the ocean, in which the spray production flux from unit area of a foam surface is prescribed based on other measurements and scaled up by the whitecap fraction (e.g. Monahan et al., 1986; Mårtensson et al., 2003; Clarke et al., 2006). However, the parameterization of whitecap fraction as a function of wind speed has an uncertainty of about an order of magnitude in moderate winds (e.g. Anguelova and Webster, 2006).
Recent works suggest that the whitecap fraction is also sensitive to parameters such as sea state (Scanlon and Ward, 2016; Brumer et al., 2017a) and water temperature (Salisbury et al., 2014; Salter et al., 2015). In shallow waters, wave breaking (and so whitecap fraction) depends not only on wind forcing, but also on the interactions between wind waves and swell with the bottom topography (e.g. de Leeuw et al., 2000; Resio et al., 2002). The bubble number concentrations within the surf zone can be about 2 orders of magnitude higher than over the open ocean (e.g. Brooks et al., 2009). van Eijk et al. (2011) estimated surf zone aerosol flux on sandy beaches to be about an order of magnitude higher than for the open ocean under similar wind conditions.
There are only a few datasets of direct measurements of sea spray fluxes by the eddy covariance (EC) method. Based on data from an Arctic cruise, Nilsson et al. (2001) published the first EC measurements of aerosol number fluxes, which correlated strongly with wind speed. Their data suggest that sea spray source flux consists of a film drop mode centred at a ∼ 50 nm radius and a jet-drop-mode centre at a 500 nm radius. Geever et al. (2005) measured submicron aerosol fluxes at a radius > 5 and > 50 nm at the coastal station of Mace Head on the west coast of Ireland. They found comparable aerosol number fluxes in the Aitken mode (5–50 nm) and in the accumulation mode (50–500 nm). Norris et al. (2008) measured size-distributed aerosol fluxes between 0.15 and 3.5 µm radius at the Duck Pier on the east coast of the United States. They showed that sea spray flux increases with the local wind speed up to a radius of 1 µm. More recently Norris et al. (2012, 2013b) measured size-distributed sea spray fluxes (0.18 < radius < 6.61 µm) over the open ocean, and they explored the wind speed and wave Reynolds number dependences of the flux. The wave Reynolds number (primarily a function of wind stress and significant wave height) was found to explain about twice as much variance in the open ocean sea spray fluxes than wind speed alone (Norris et al., 2013b).
Total and size-distributed aerosol number fluxes have seldom been measured simultaneously, precluding an assessment of the sea spray flux closure and distribution. Here we report concurrent measurements of effectively “total” (radius > 1.5 nm) and size-distributed sea spray fluxes (about 0.1 < radius < 6 µm radius) from a coast site over several months from February 2015 to February 2017. We examine how sea spray fluxes vary with wind speed (1–21 m s−1), significant wave height (0.2–3.1 m), wave Reynolds number (7×10³–2×10⁶) and other surface ocean parameters. We also examine the size distribution and closure in aerosol number fluxes at different sea states.
The Penlee Point Atmospheric Observatory (PPAO, http://www.westernchannelobservatory.org.uk/penlee/, last access: 13 December 2019) on the southwest coastal of the United Kingdom has proven to be a suitable site for eddy covariance measurements of air–sea transfer (Yang et al., 2016a, b, 2019). PPAO sits about 11 m above mean sea level and a few tens of metres away from the water's edge. The eddy covariance (EC) system, including the fast aerosol sensors and a sonic anemometer (R3, Gill), is mounted on a mast at about 18 m above mean sea level. An ultra-fine condensation particle counter detecting aerosols > 1.5 nm radius (condensation particle counter (CPC) 3025A, TSI) and a compact lightweight aerosol spectrometer probe (CLASP; Hill et al., 2008) providing size spectra for radii between ca. 0.1 and 6 µm at ambient humidity were employed at PPAO. The CPC was used for flux measurements between 24 February and 3 June 2015. The CLASP unit deployed between 17 February and 1 March 2015 had a size range of 0.11 to 6 µm. This encompasses 1 week of overlap with the CPC, which we primarily use to study the closure of aerosol number fluxes. A slightly different CLASP unit was deployed between 21 December 2016 and 16 February 2017, which had a size range of 0.15 to 6 µm. Because of the narrower size range of this second unit and thus more undetected film drop aerosols, data from the 2016–2017 period were only used to contrast between open water and fetch-limited conditions. In this paper, we operationally use the word “total” to refer to aerosol source flux (i.e. corrected for deposition; see below) either from the CPC or integrated over the entire CLASP size range, unless otherwise specified.
Previous EC observations of momentum, sensible heat, CO2, and CH4 fluxes at PPAO show that two wind sectors are representative of air–water transfer: the southwest sector for which airflow is from the open ocean and the northeast sector with airflow from the fetch-limited Plymouth Sound (Yang et al., 2016a, b, 2019). A flux footprint model for spatially homogeneous conditions (Kljun et al., 2004) predicts that under typical southwesterly winds, the majority of the turbulent flux at a sensor height of 18 m above mean sea level comes from waters several hundred metres upwind of the site with a mean water depth of ∼ 20 m. When winds are from the northeast, the flux footprint is over the Plymouth Sound and does not overlap with land on the opposite side of the sound (5–6 km away) except possibly under strongly stable conditions.
In the eddy covariance method, aerosol number concentration (C) measured at high frequency (here 10 Hz) is correlated with the vertical wind velocity component and averaged over time to yield the net aerosol flux (, where primed quantities are perturbations from the mean and the overbar is the averaging operator). The measured net flux is the sum of the source (upwards, positive) and deposition (downwards, negative) flux components (Nilsson et al., 2001; Geever et al., 2005; Norris et al., 2013b). The sea spray source flux must be derived from the net flux by subtracting a deposition flux (). Here Vd, negative in sign, is the aerosol deposition velocity from Slinn and Slinn (1980) (their Eq. 4), which accounts for gravitational settling and is computed assuming the density of sea salt. Both the CLASP and the CPC fluxes are initially computed as 10 min averages and then filtered for non-stationary turbulence conditions following Yang et al. (2016a). Valid fluxes can be averaged (e.g. to hourly intervals) to reduce noise.
For the CLASP, a small fraction of the aerosols are lost to the short inlet (∼ 25 cm) during the 0.1 s of transit time. The loss is size dependent, and predicted inlet efficiency varies from essentially unity for aerosols smaller than 2 µm radius (film droplets and most of the jet droplets) to ∼ 0.5 at 5 µm and to ∼ 0.1 at 8 µm (Pui et al., 1987). Spume aerosols are likely too large to be efficiently sampled by the CLASP. We corrected for aerosol loss in the CLASP inlet prior to the flux calculations. Following Norris et al. (2012), the CLASP measurements are converted from net fluxes to source fluxes using the size-resolved Vd. Integrated over all CLASP sizes, this deposition correction amounts to −25 cm−2 s−1 in the mean (up to ∼ −200 cm−2 s−1) when winds were from the southwest. This represents 14 % of the net flux on average (up to ∼ 50 %). For submicron aerosols only (i.e. radius of 0.1–0.5 µm), the deposition correction is −7 cm−2 s−1 in the mean. Humidity flux induces a bias in the CLASP aerosol flux (Fairall et al., 1984). This is because the particles are sized at ambient humidity, but grow or shrink with local relative humidity (RH). We correct for this bias using the modified bulk correction scheme described by Sproson et al. (2013). The final CLASP fluxes are presented at a constant relative humidity of 80 % following the aerosol growth rate for sea salt reported by Gerber (1985). Together these corrections amount to typically 20 %–30 % of the total CLASP source number flux at PPAO. A robust humidity observation was unavailable from December 2016 to February 2017. Thus the CLASP measurements during that phase could not be fully corrected for humidity effects and were thus more uncertain.
The ultra-fine CPC sub-sampled from a Teflon tube (18 m long, 0.64 cm ID, flow rate of ∼ 15 L min−1). The use of Teflon tube is generally not recommended for aerosol measurements, as its non-conductive nature can lead to significant aerosol losses; it was employed here out of convenience because the CPC was sub-sampling from an existing inlet tube for CO2 flux measurements (Yang et al., 2016b). A brief test of CPC measurements at PPAO between using the long Teflon inlet tube and a ∼ 5 m, 0.32 cm ID stainless steel tube did not show any obvious difference in the aerosol number concentration. The CPC cospectra also do not suggest severe aerosol losses at high frequencies. The better-than-expected transmission through the Teflon sampling tube may be because the tube had been used under high flow rate at PPAO for nearly a year prior to the CPC measurements. It was well coated with sea salt, which probably increased its conductivity and thus reduced electrostatic aerosol losses.
The long sampling tube resulted in a delay time of ∼ 3 s in the CPC signal relative to the turbulent wind measurements, as determined by the maximum covariance method between aerosol concentration and vertical wind velocity. This delay is close to the expected time based on inlet length, diameter, and flow rate in the main tube (2.3 s). The CPC inlet efficiency, accounting for its length, a 90∘ turn and three bends (not including any electrostatic losses), is predicted to be essentially unity for 0.3 < radius < 2 µm (Pui et al., 1987). For radius < 0.3 µm, the mean inlet efficiency is 0.96 (< 0.8 for nucleation-mode aerosols). For radius > 3 µm, the efficiency drops to ∼ 0.7. Previous observations in the marine atmosphere show that total aerosol number is usually dominated by particles below a radius of about 0.3 µm (e.g. Hoppel et al., 1990), which suggests only a minor inlet loss for the CPC (≤ 4 %). We choose not to apply any inlet efficiency correction to the CPC flux since the corrections are probably small, and the size distribution of aerosol flux below 0.1 µm (lower cut-off of CLASP) is not known. We correct our CPC fluxes for high-frequency flux attenuation due to the finite instrument response time (1 s for 95 % change) using an empirical filter function approach analogous to that for gas flux measurements (e.g. Yang et al., 2013). Increasing with wind speed, this correction amounts to ∼ 10 % of the CPC number flux for the average condition at PPAO.
The deposition correction for the CPC flux is only approximate due to both uncertainties in Vd and the lack of knowledge of the fine-/Aitken-mode aerosol size distribution. The deposition velocity for submicron aerosols over water, dependent on aerosol size and environmental conditions, is on the order of approximately −0.01 to −0.1 cm s−1 (Slinn and Slinn 1980; Duce et al., 1991). The aerosol size distribution below 100 nm radius was not measured at PPAO but previous maritime observations of submicron aerosols generally suggest peak number concentrations at radii of ∼ 25 and 100 nm (e.g. Hoppel et al., 1990). We compute the wind-speed-dependent Vd at these two aerosol sizes using the Slinn and Slinn (1980) parameterization, which amounts to −0.034 and −0.010 cm s−1 for the mean conditions at PPAO. For simplicity, we take the average of the two Vd datasets and multiply it by the CPC number concentration to estimate the deposition flux. When winds were from the southwest, the deposition flux amounts to 33 cm−2 s−1 in the mean (19 % of the net flux).
Frequency-weighted cospectra of total CLASP and CPC net aerosol fluxes averaged to wind speed bins are shown in Figs. 1 and 2 for the open water wind sector. In low to moderate winds, the aerosol cospectra are broadly consistent with the theoretical spectral shape for turbulent transfer (Kaimal et al., 1972) and with previously observed gas cospectra at PPAO (Yang et al., 2016a). With increasing wind speeds the magnitudes of the cospectra increase, reflecting greater sea spray fluxes. The CPC cospectra are much noisier than those of the CLASP. This may be because most of the aerosols detected by the CLASP arise from sea spray emission. In contrast, only a very small fraction of the aerosols detected by the CPC participate in rapid air–sea exchange (i.e. sea spray emission); the vast majority comes from other sources (e.g. pollution) and increases the random measurement noise in the CPC flux (see analogous discussion on methane flux by Yang et al., 2016a).

Figure 1Averaged CLASP frequency-weighted total (net) aerosol number cospectra in wind speed bins for the southwest (open water) wind direction.
3.1 Sea spray flux closure and wind speed dependence
Aerosol fluxes were almost always positive (i.e. from sea to air), indicating sea spray emission. Figure 3 shows the time series of total aerosol number concentrations and source fluxes from the CPC and the CLASP (during the 1 week of overlap), relative humidity and the CLASP deposition correction term, significant wave height and tide height above the reference height, and wind speed and wave Reynolds number. Winds were coming from the southwest for the majority of this week with peak speed > 16 m s−1. The CPC detected baseline concentrations of a few hundred aerosols per cubic centimetre, typical for a marine atmosphere. Many short and sharp spikes (of the order of thousands of reciprocal cubic centimetres) are apparent in the CPC time series. These spikes are often coincident with spikes in sulfur dioxide and carbon dioxide and are likely from ship exhaust emissions. CPC fluxes during such brief periods of excessive variability (i.e. relative standard deviation over 50 %) are removed on the basis of non-stationarity.
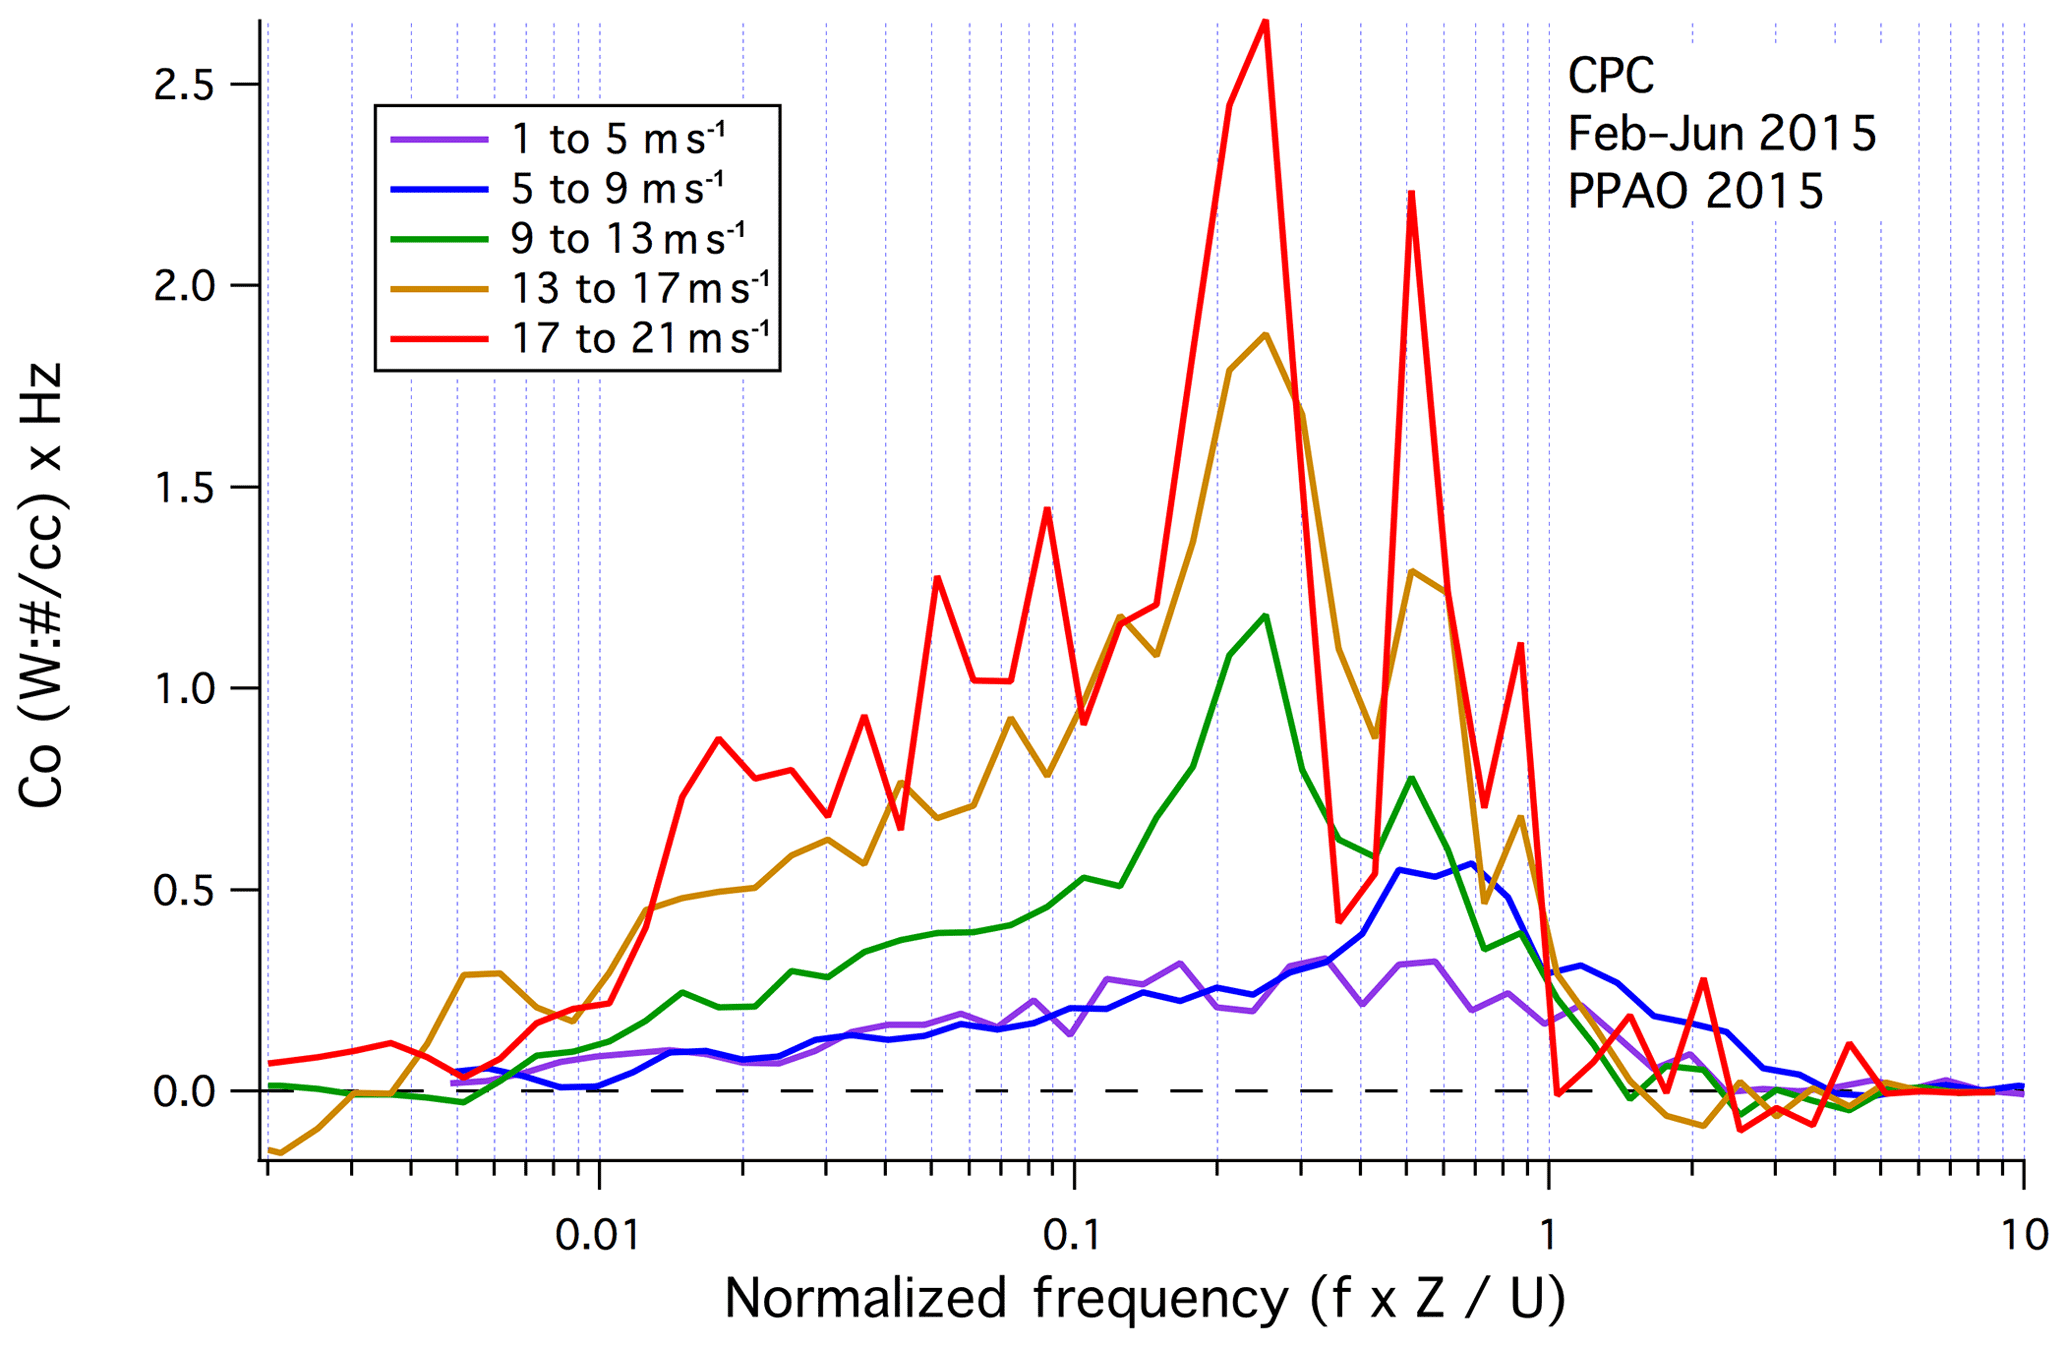
Figure 2Averaged CPC frequency-weighted (net) aerosol number cospectra in wind speed bins for the southwest (open water) wind direction.
Aerosol number concentration integrated over all sizes is much lower and more constant from the CLASP. For the southwest wind sector, the median supermicron and submicron aerosol concentrations detected by the CLASP were 11 and 24 cm−3 respectively. The magnitude of the former is consistent with the typical sea spray aerosol number concentration in the marine boundary layer (e.g. O'Dowd and Smith, 1993). The CLASP did not detect ship plumes as ship-emitted particles tend to be small (< 30 nm radius) and below the measurement size cut-off (e.g. Hobbs et al., 2000; Petzold et al., 2008). Despite the large differences in total number concentrations between the CPC and CLASP, total aerosol fluxes from the two instruments were generally comparable in magnitude. The CPC fluxes were slightly higher than the integrated CLASP number fluxes by a mean (median) difference of 45 (40) cm−2 s−1 during this week. As discussed in Sect. 3.3, this difference is likely due to the part of the film drop mode not completely captured by the CLASP as a result of its lower size cut-off (∼ 0.1 µm).
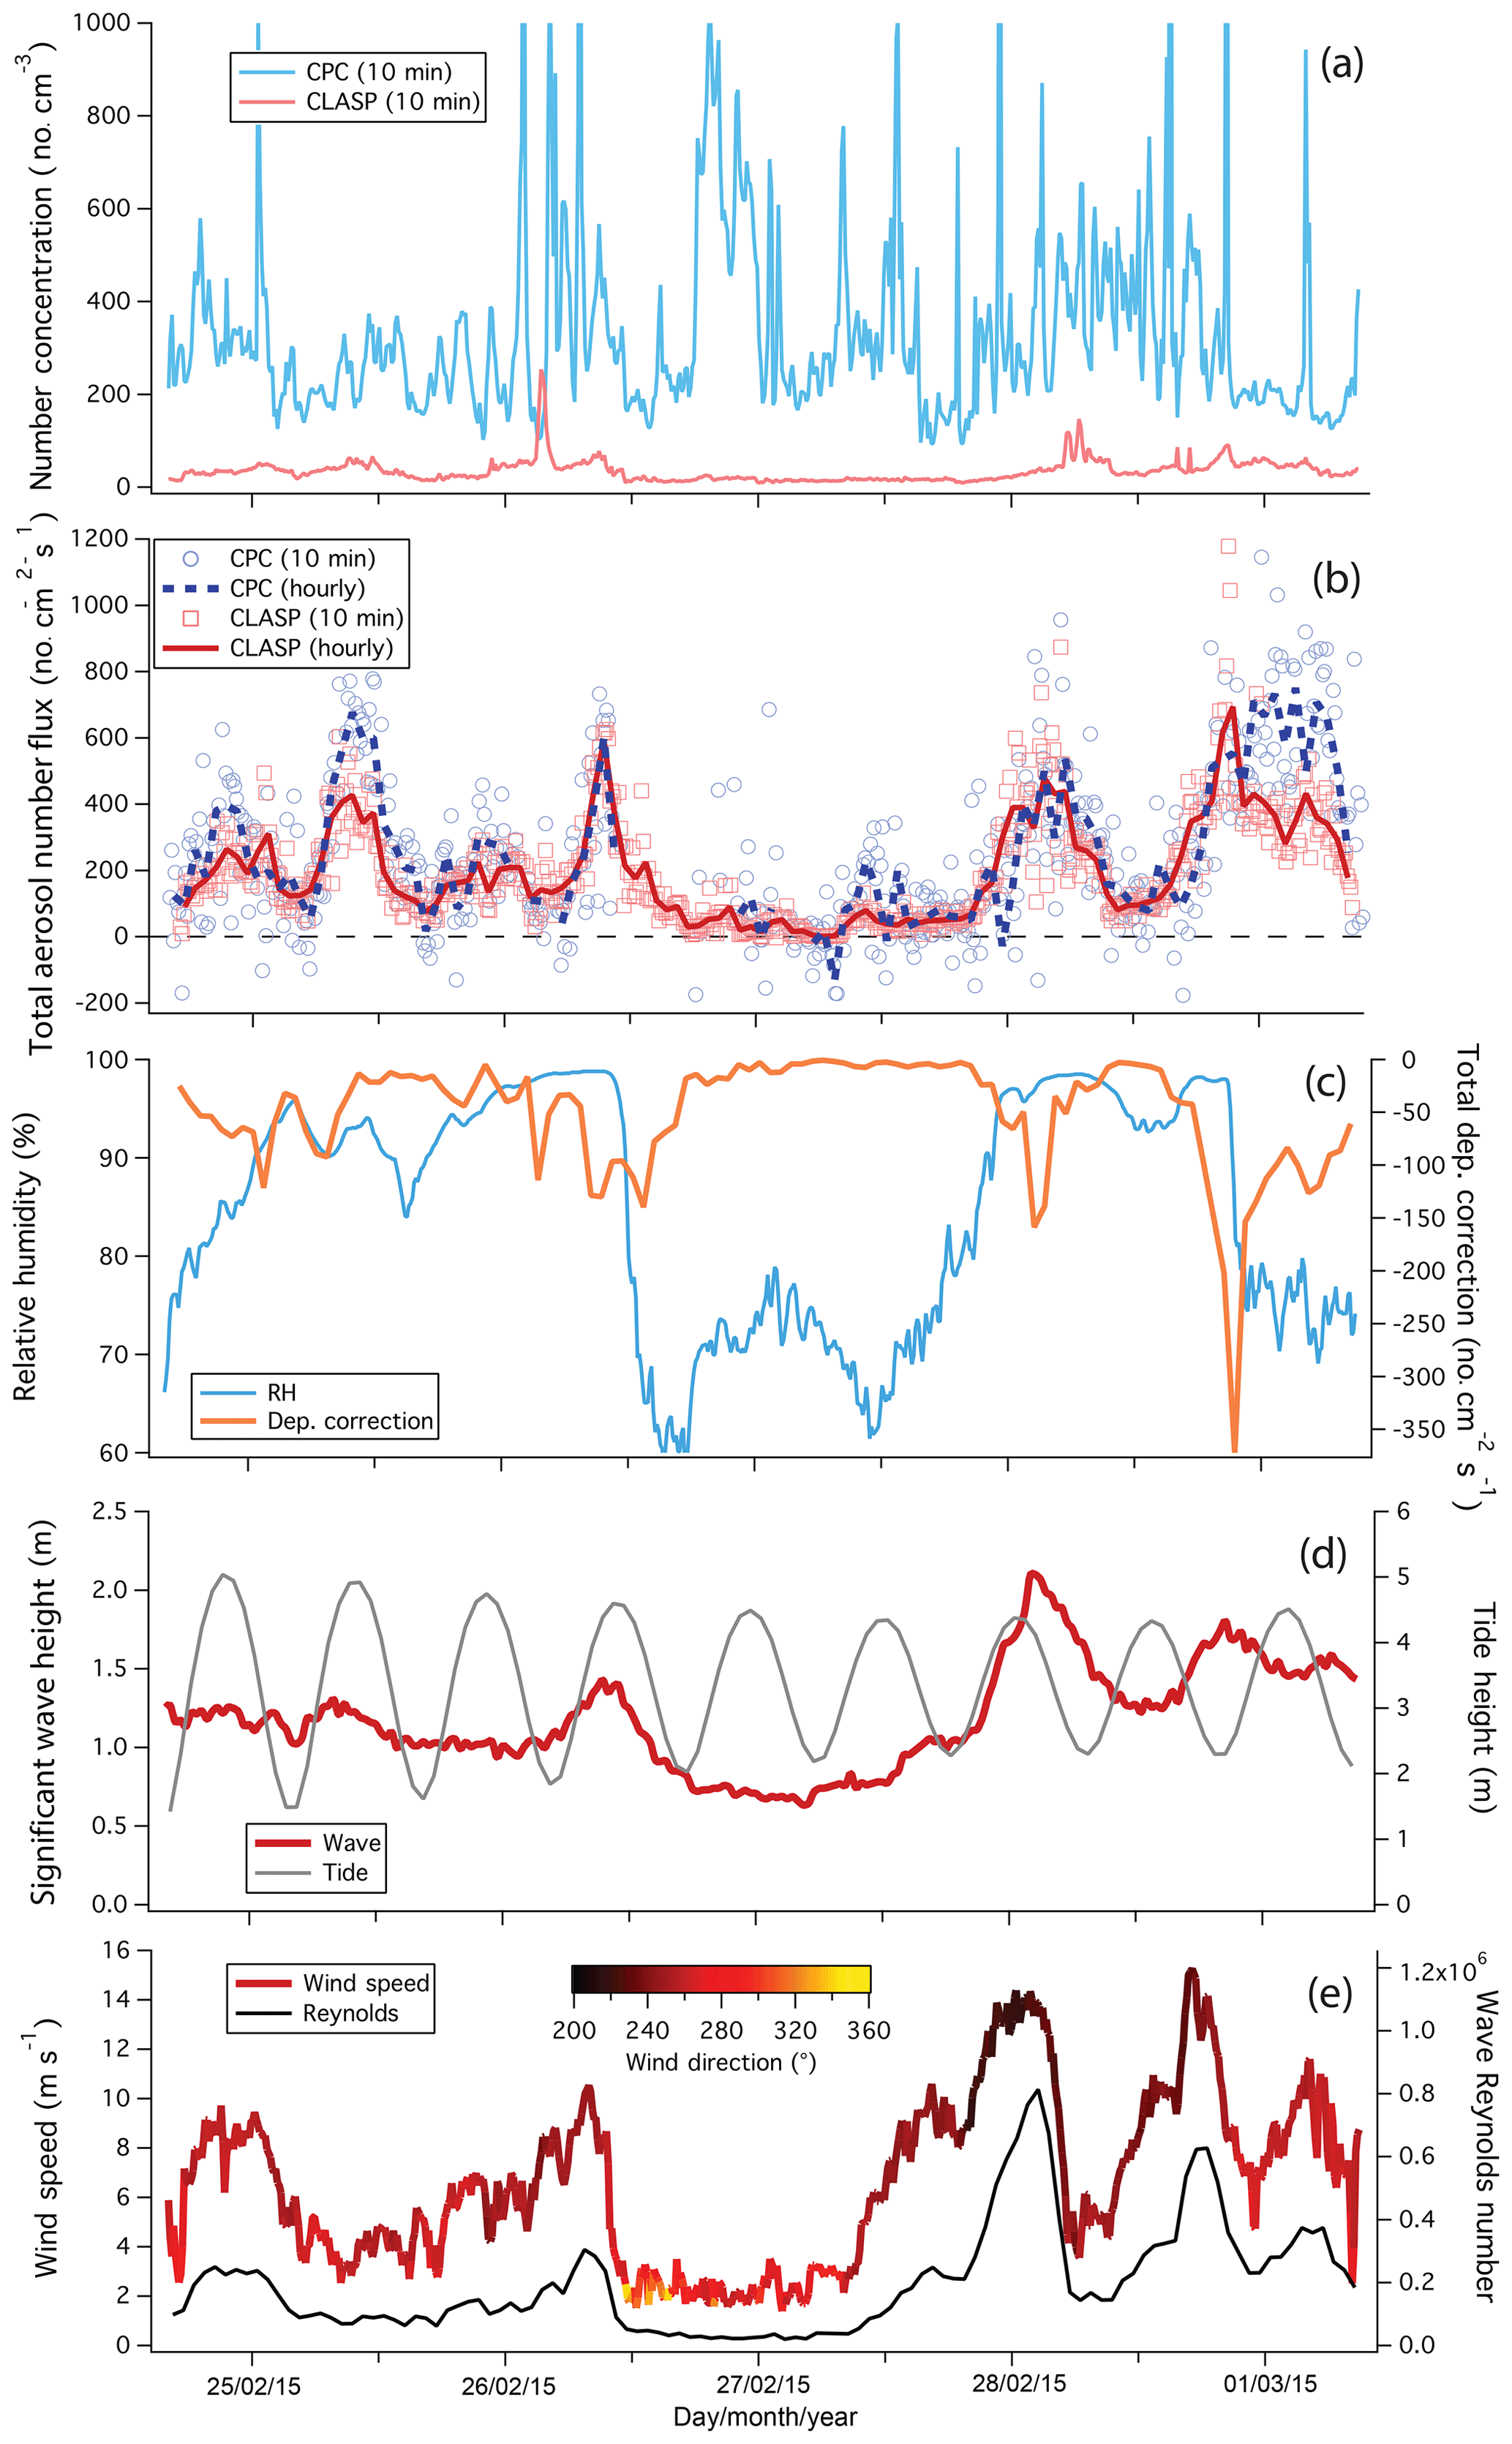
Figure 3Times series of (a) CPC and integrated CLASP aerosol number concentration, (b) total aerosol number source flux from the CPC and CLASP, (c) relative humidity and the integrated CLASP deposition correction, (d) significant wave height and tide height, and (e) wind speed (colour-coded by wind direction) and wave Reynolds number.
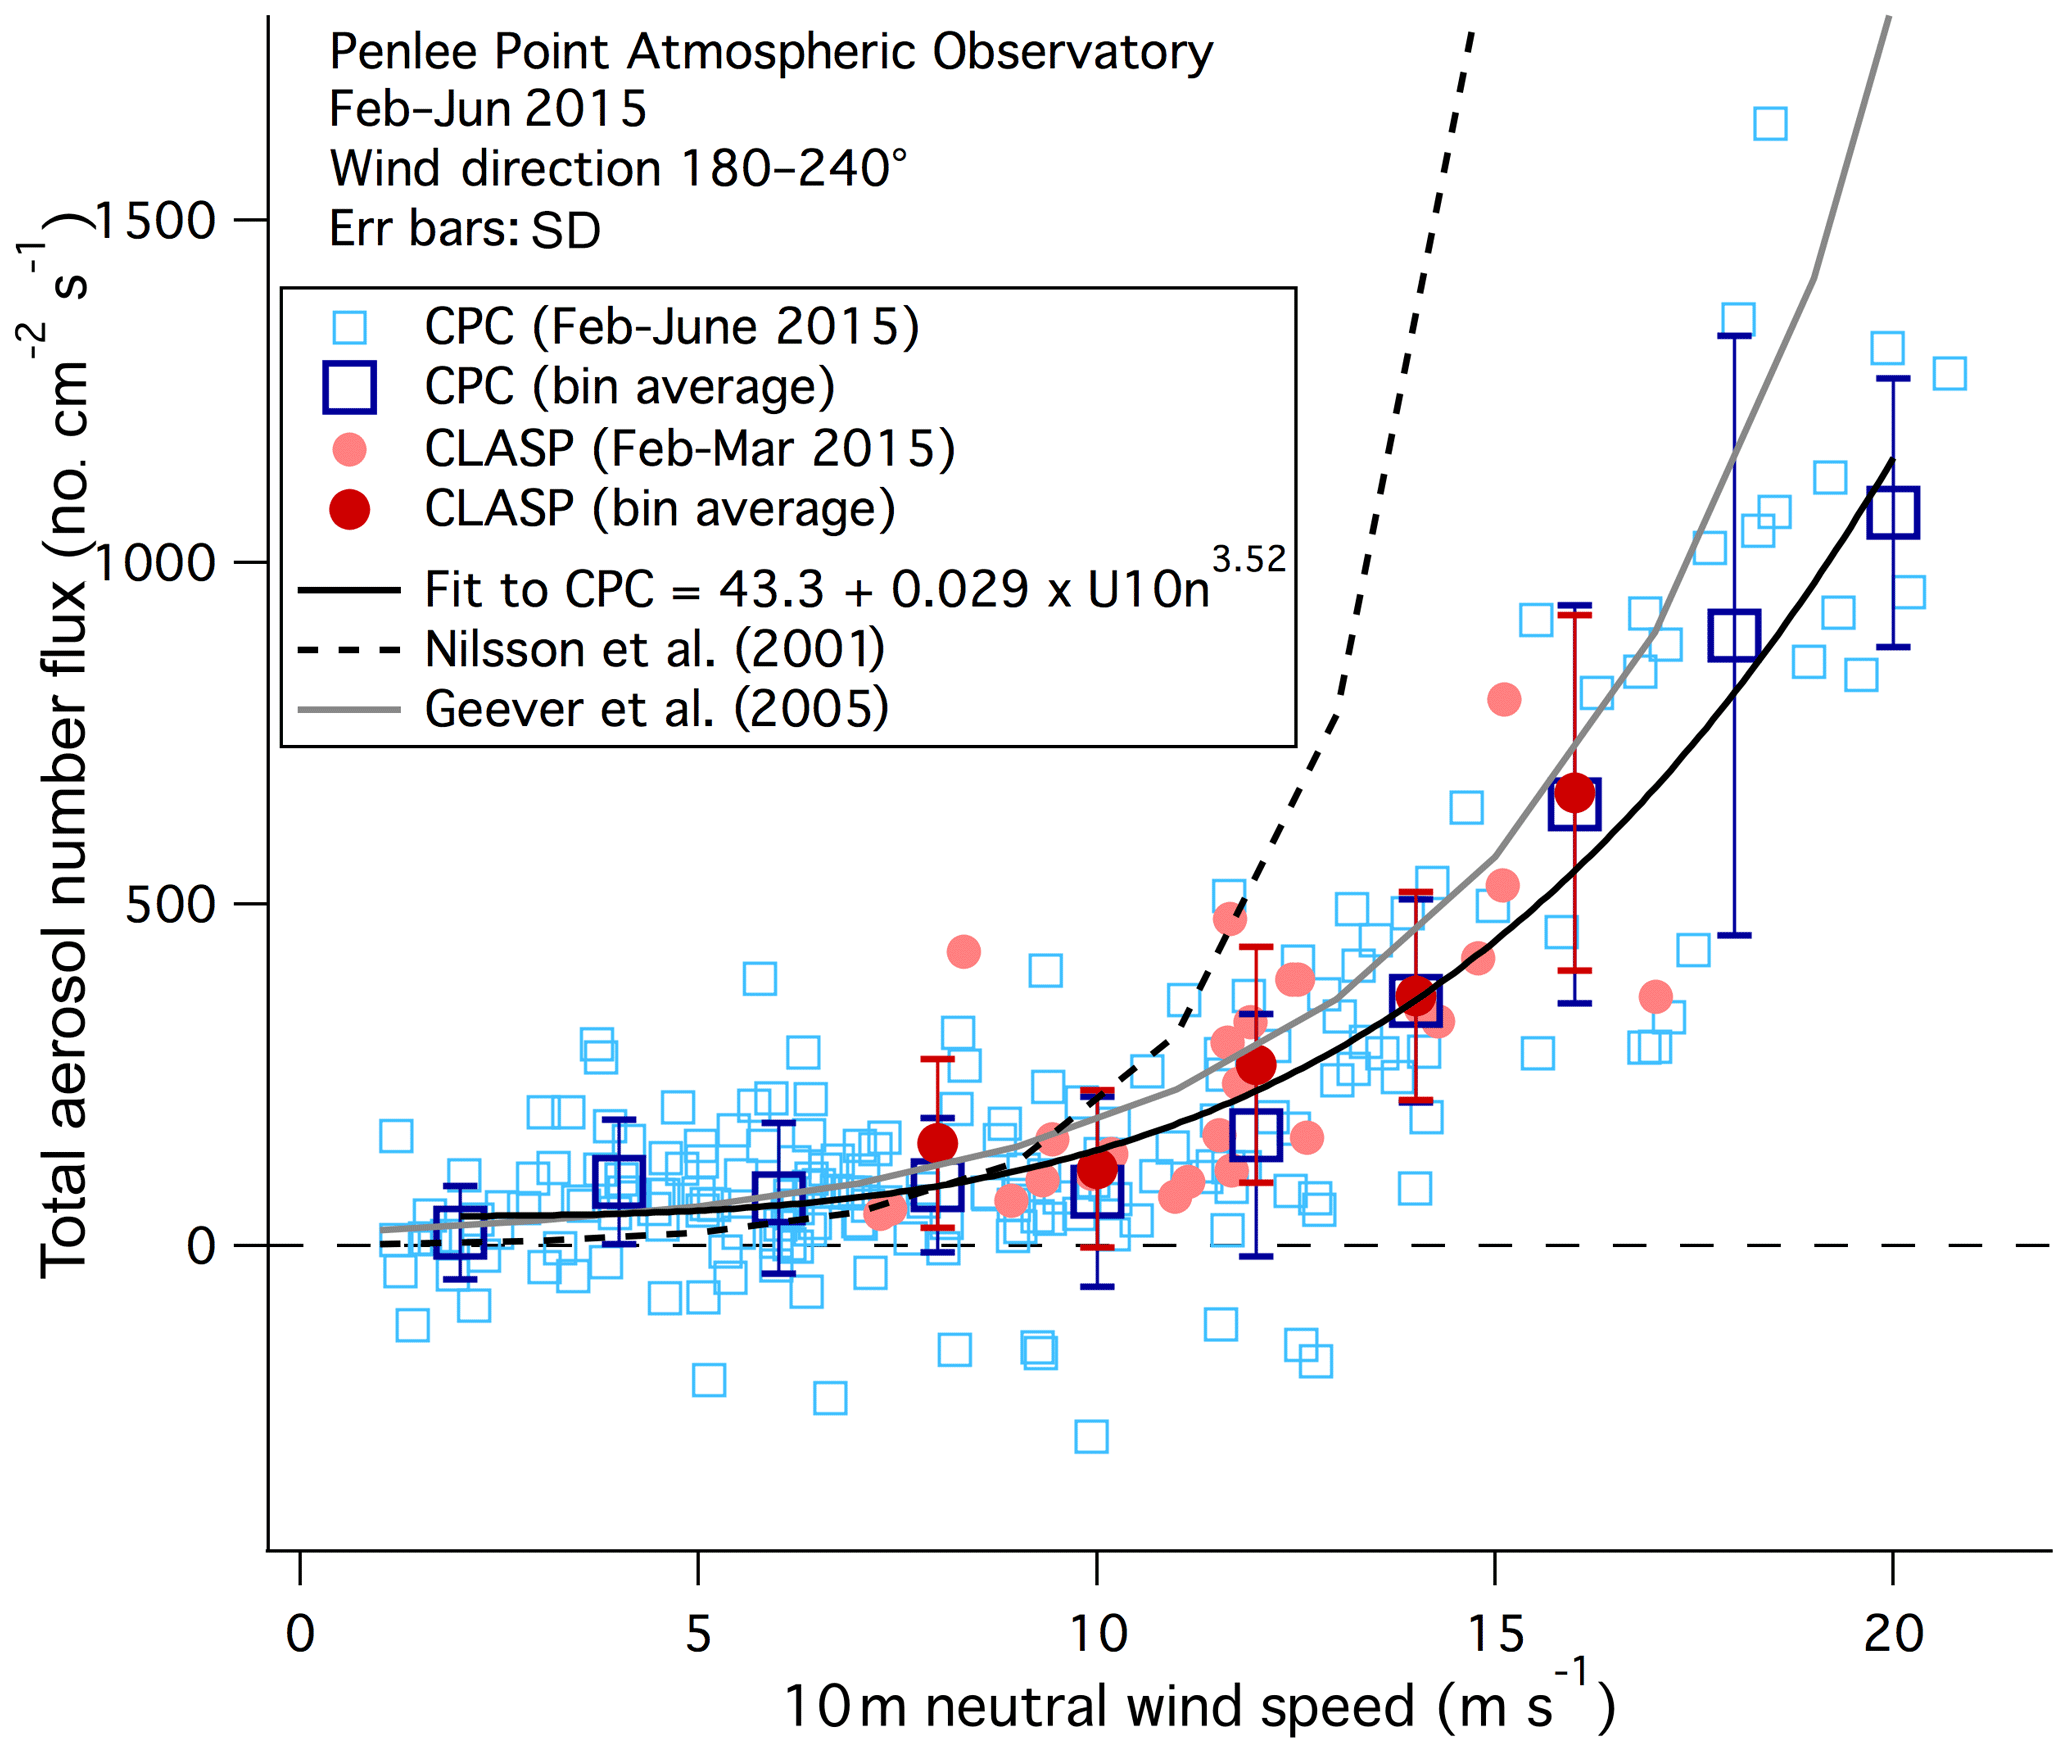
Figure 4Hourly total aerosol number source fluxes from the CPC and CLASP vs. wind speed (data from 2015). Error bars correspond to standard deviations within the bins. Also shown are source flux relationships derived by Geever et al. (2005; > 5 nm radius) from the coastal site of Mace Head and Nilsson et al. (2001; > 5 radius nm) from the open ocean of the Arctic.
Sea spray flux peaked during periods of high winds and large waves. At low tide, the distance between the water's edge and the flux sensors increases, shifting the centre of the flux footprint closer to the shoreline. Previously observed transfer rates of momentum, sensible heat and gases (CO2 and CH4) did not vary with the tidal height (Yang et al., 2016a, b), suggesting that the narrow surf zone (width of a few metres) beyond the rocky shoreline in front of PPAO has a negligible influence on the measured fluxes. The same appears to be true for the aerosols, as periods of low tide do not consistently result in large sea spray fluxes (Fig. 3). Thus unlike Geever et al. (2005), we do not need to filter out data for low-tide conditions. On 27 February 2015, during light, northerly winds from over the land, aerosol fluxes from both instruments were near zero, as expected.
Figure 4 shows the wind speed dependence in aerosol source flux from the CPC (February to June 2015) and from the CLASP (February to March 2015). Here we have restricted data to the southwest wind sector (open water) only. Across most of the wind speed range, total aerosol source fluxes from the CPC and the CLASP show a similar relationship with wind speed. Sea spray source flux from PPAO amounts to about 200 cm−2 s−1 in the mean (median of ∼ 150 cm−2 s−1), increasing non-linearly with wind speed up to ∼ 1000 cm−2 s−1 at a wind speed of 20 m s−1. These fluxes are in reasonable agreement with the source flux relationship found by Geever et al. (2005; > 5 nm radius) for a coastal site at Mace Head during high tide, when wave breaking at the shore did not unduly influence their measurements. In comparison, the relationship found by Nilsson et al. (2001; > 5 nm radius) from the Arctic Ocean is significantly higher than the PPAO measurements at wind speeds above ∼ 12 m s−1. Bin averages of total aerosol number flux measurements at PPAO are plotted on a log scale against wind speed in Fig. 5 along with the parameterizations from Nilsson et al. (2001) and Geever et al. (2005) for both net and source fluxes. Measured net fluxes at PPAO agree very well with the net fluxes from Geever et al. (2005). The source fluxes show greater discrepancy due to the different deposition correction schemes applied.
3.2 Non-wind-speed controlling factors on sea spray fluxes
Sea spray flux is more strongly associated with significant wave height (Hs, derived from the full wave spectrum) than with wind speed (Fig. 6). Wave data when winds were from the southwest are taken from a Waverider buoy from Looe Bay, about 16 km west of PPAO (http://www.channelcoast.org/data_management/real_time_data/charts/?chart=98, last access: 13 December 2019). The stronger dependence on Hs is reflected in the hourly CPC data (n=452) by both higher R2 (0.65) and Spearman's rank correlation coefficient (R=0.71) compared to the dependence on wind speed (R2=0.47 and Spearman's R=0.51). When Hs was below 0.5 m, the mean CPC source flux averaged to about zero. Such a strong dependence of sea spray flux on wave height is typically not observed over the open ocean (e.g. Norris et al., 2013b) and is likely due to coastal wave breaking. Equilibrium wind waves at wind speeds > 10 m s−1 as well as swell have wavelengths that are longer than twice the water depth within the PPAO flux footprint (Pierson and Moskowitz, 1964) and should shoal due to interactions with the sea floor. We thus expect coastal waves to break more frequently and generate more sea spray compared to open ocean waves at the same wind speeds.
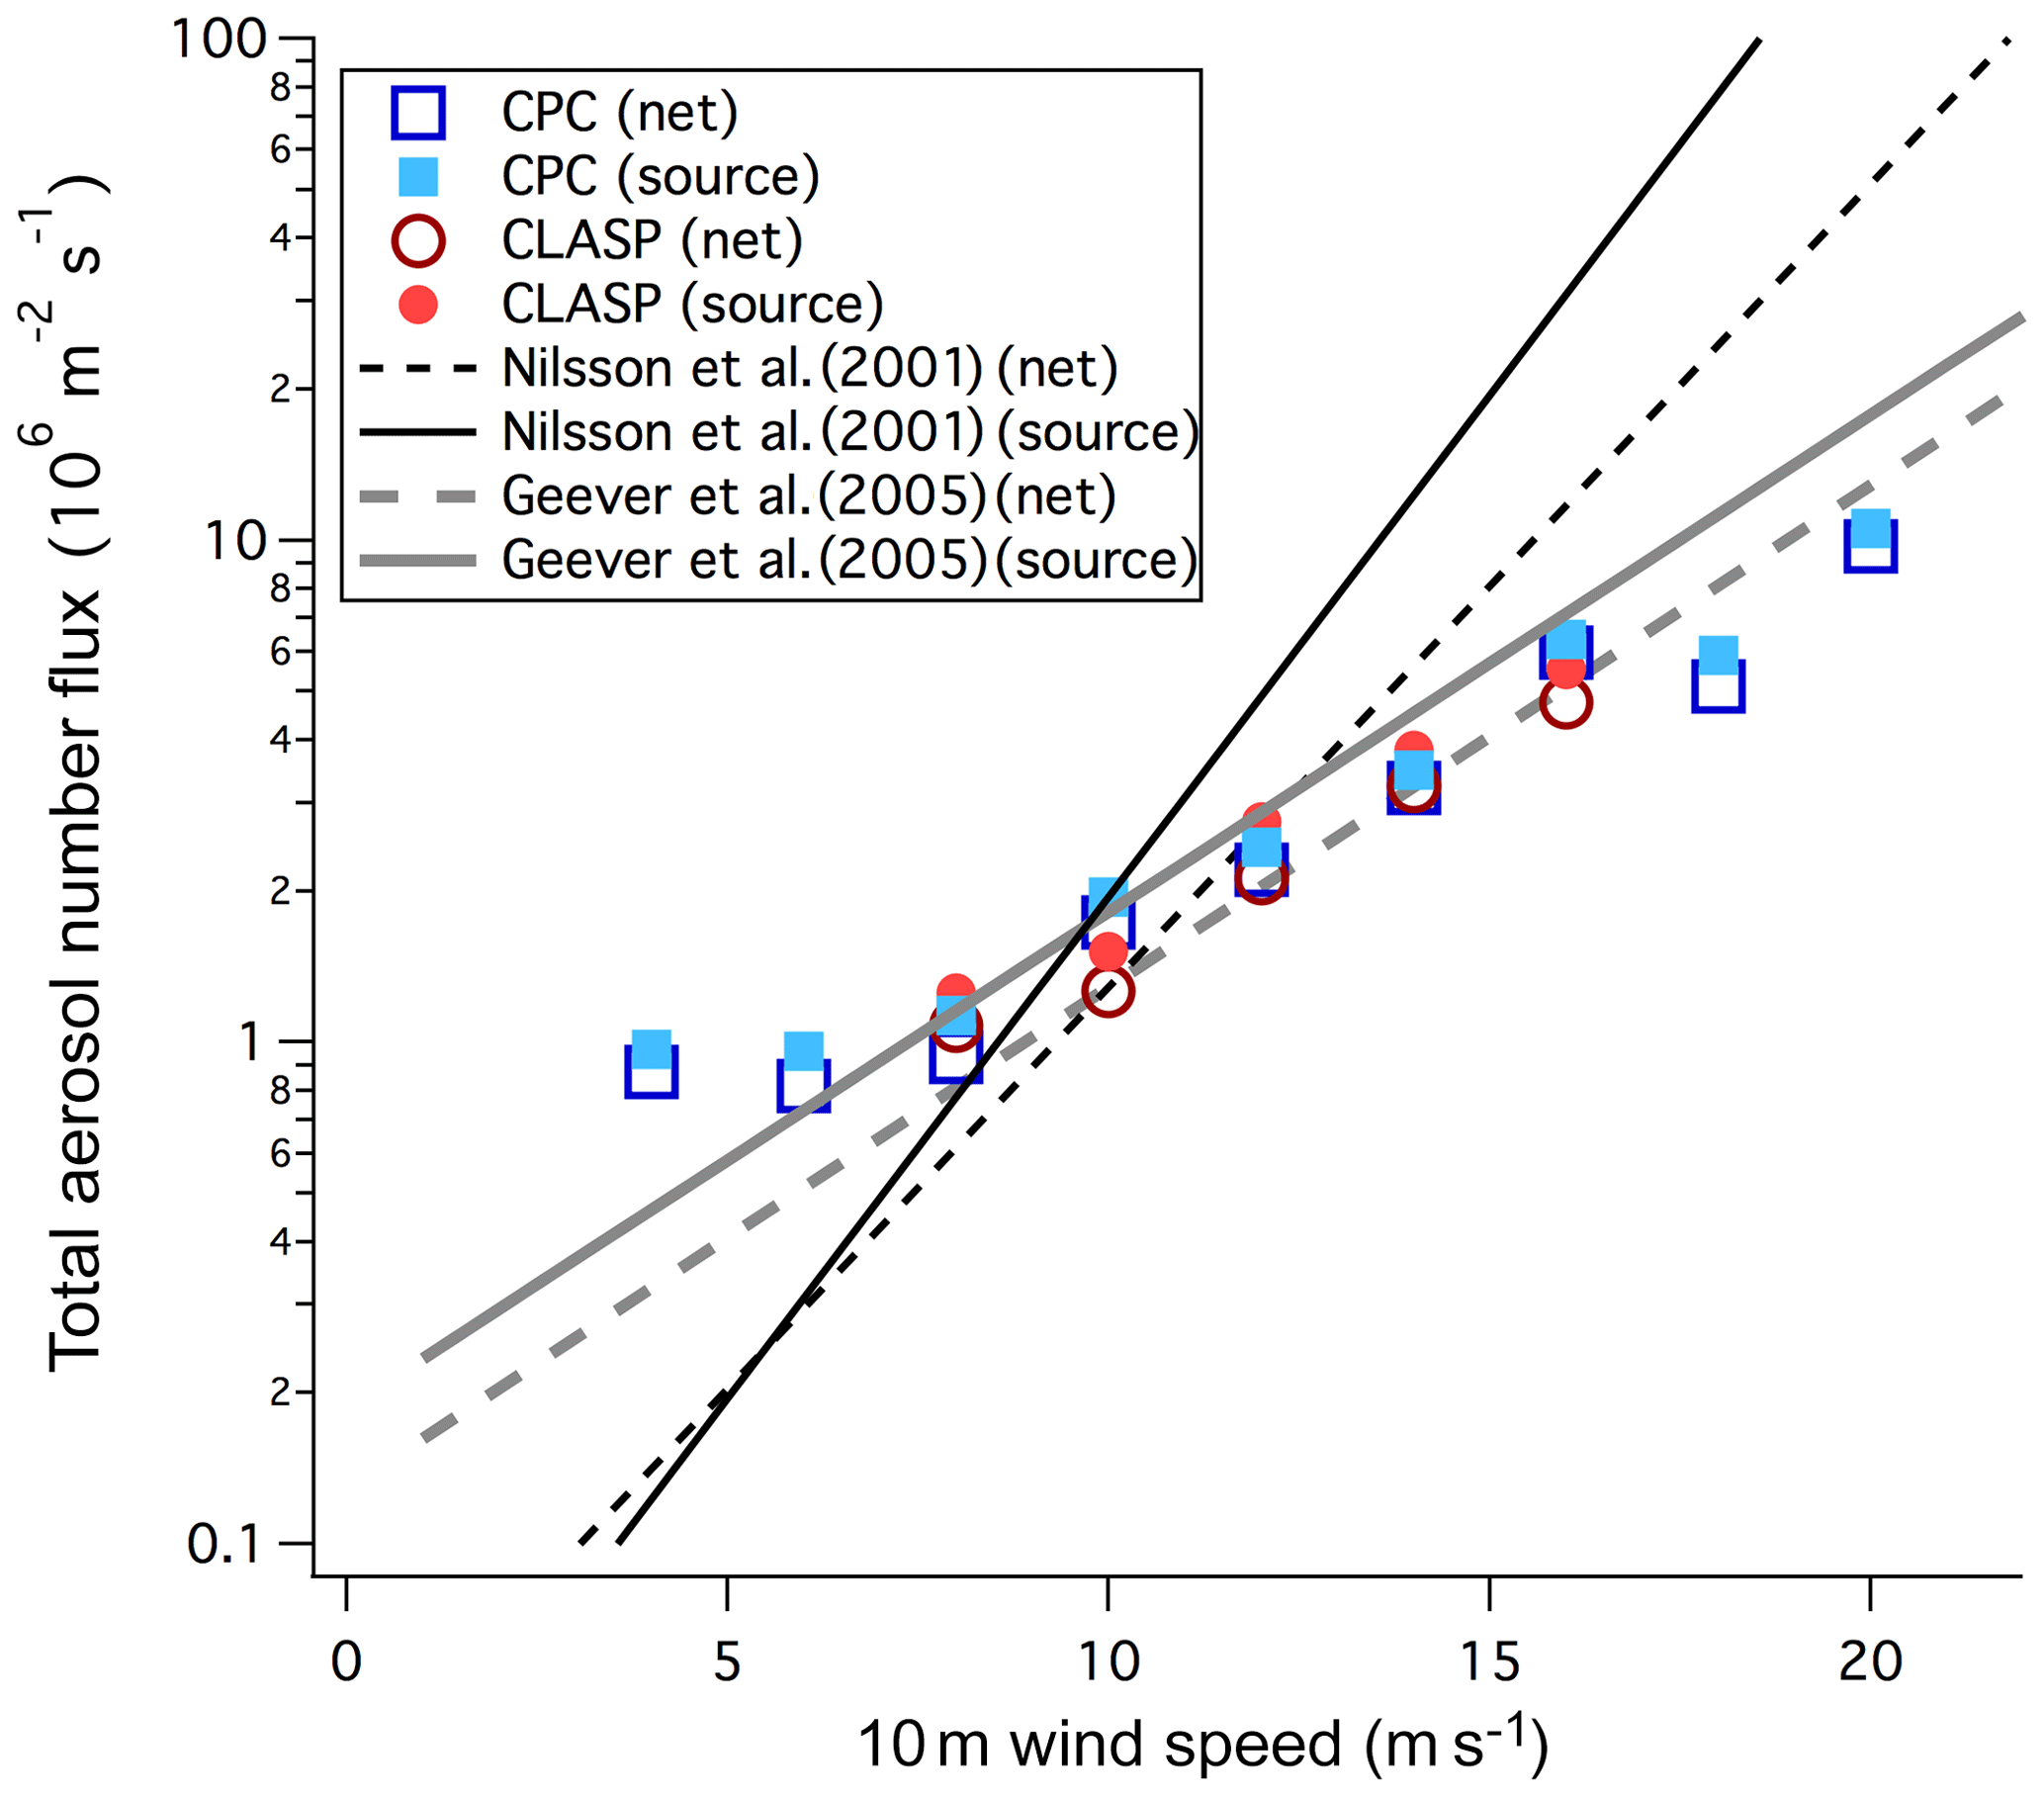
Figure 5Bin-averaged total aerosol number fluxes (net and source) from the CPC and the CLASP (in log scale) vs. 10 m wind speed (data from 2015). Also shown are net and source flux relationships derived by Geever et al. (2005; > 5 nm radius) from the coastal site of Mace Head and Nilsson et al. (2001; > 5 radius nm) from the open ocean of the Arctic. Error bars (2× standard error) are smaller than the marker size and thus not displayed.
Following Zhao and Toba (2001), we computed the wave Reynolds number as , where u* is the friction velocity from eddy covariance and ν is the kinematic viscosity of seawater. Sea spray flux increases approximately linearly with the wave Reynolds number (, Fig. 7). The source flux dependence on is slightly weaker than on Hs but stronger than on wind speed (R2=0.62 and Spearman's R=0.63) for the open water sector. Norris et al. (2013b) found a linear dependence between sea spray flux and . They also argued that below a critical of 7.2×10⁴, wave breaking does not occur and sea spray source flux should be zero, in general agreement with observations here. The linear dependence of sea spray flux at PPAO on is qualitatively consistent with their open ocean results. The parameterization from Norris et al. (2013b) integrated over all CLASP size bins is shown in Fig. 7. We see that sea spray fluxes measured at PPAO exceed those open ocean observations by about an order of magnitude (but are smaller than estimates over a surf zone by Clarke et al., 2006, as shown in Sect. 3.3).
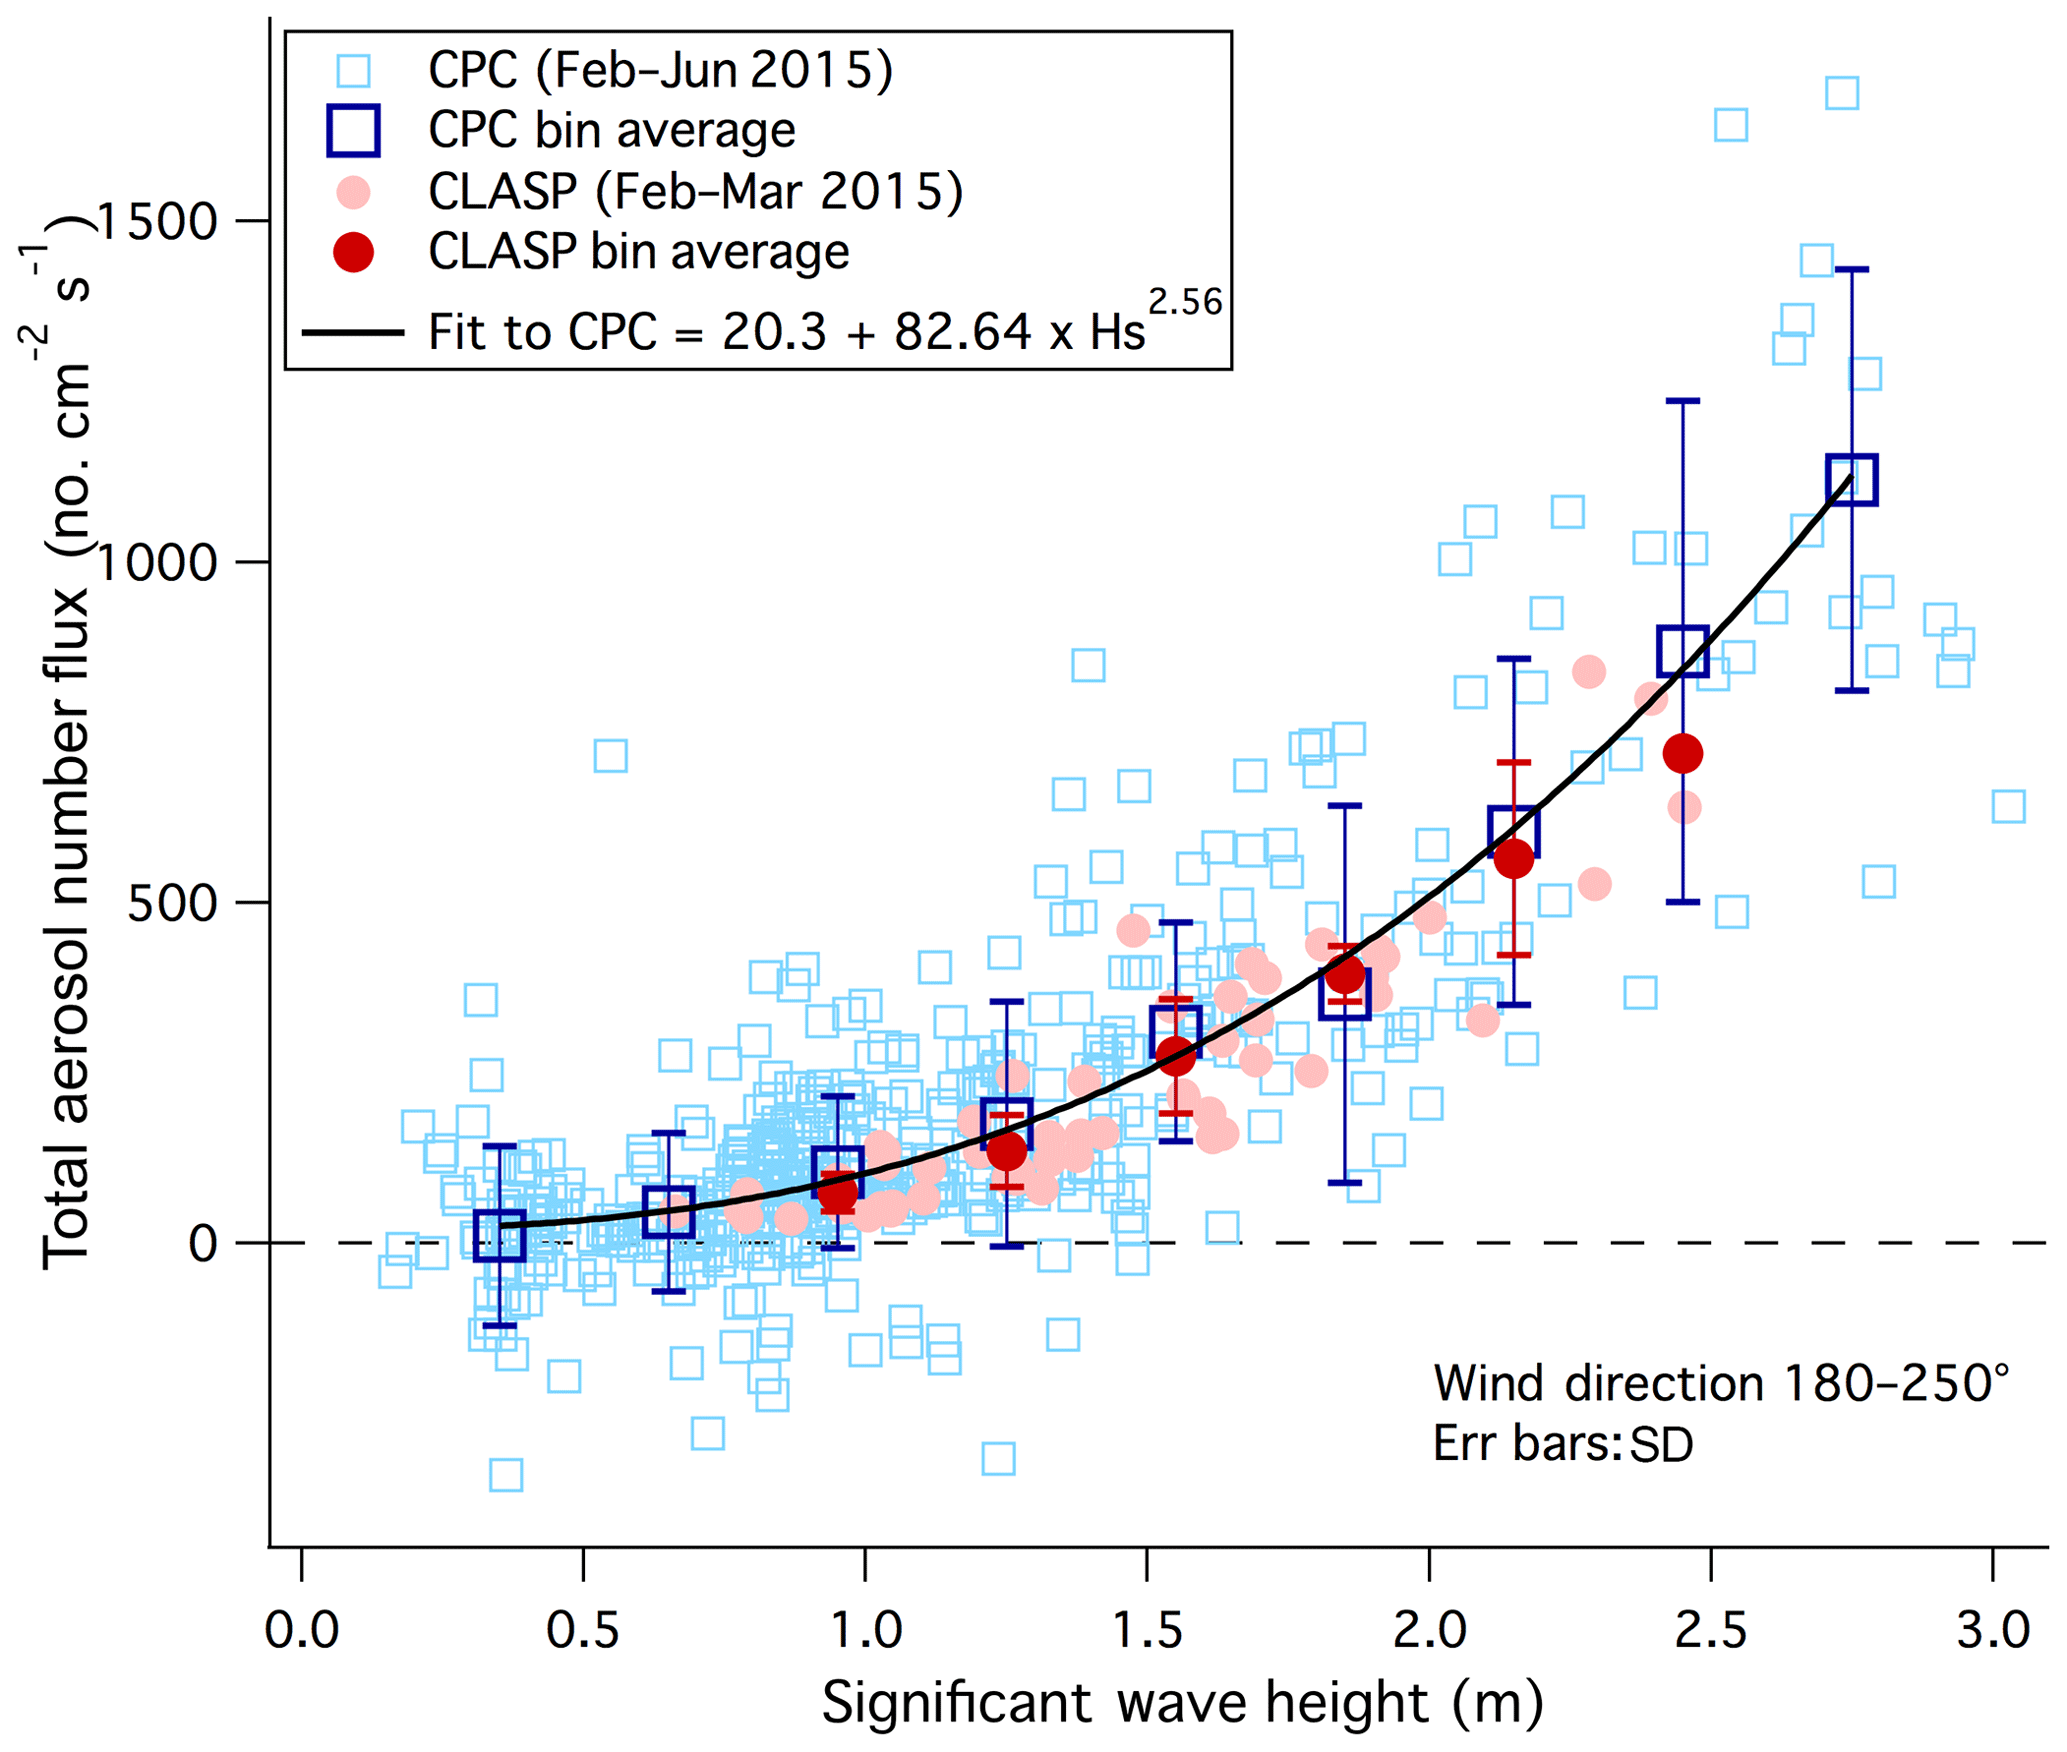
Figure 6Hourly total aerosol number source fluxes from the CPC and CLASP vs. significant wave height (data from 2015).
The influence of waves on coastal sea spray generation is further illustrated in the comparison between open water and fetch-limited conditions (Fig. 8). We use data from the second CLASP deployment (December 2016 to February 2017) for this analysis, as winds were seldom from the northeast during the first CLASP deployment (February–March 2015). Here we separate the integrated sea spray fluxes measured by the CLASP into two different wind sectors: the southwest (open water) and the northeast (facing the Plymouth Sound with a fetch over water of ∼ 5 km). At a given wind speed, sea spray fluxes were generally greater for the open water sector than for the fetch-limited sector. Wind speed was an even poorer predictor of sea spray flux from the open water during this period, as some high sea spray fluxes were observed at low wind speeds due to the presence of large swell. Fluxes from both wind sectors show better correlations against Hs, though with different trends; higher fluxes are observed for the fetch-limited conditions than for open water at a given wave height. Here Hs in the Plymouth Sound is predicted using a parameterization for fetch-limited waters (Resio et al., 2002) as a function of fetch and friction velocity since a direct wave measurement was not available. The different functional dependencies of the sea spray flux on wind speed and wave state for open water and fetch-limited conditions are reconciled when their joint influence is accounted for by the wave Reynolds number. When plotting against sea spray fluxes from both wind sectors fall closely on the same curve (Fig. 8c). This clearly illustrates the importance of jointly accounting for the influence of both wind and waves on air–sea exchange. This result is consistent with the recent findings of Brumer et al. (2017a, b) for whitecaps and gas transfer and from Norris et al. (2013b) for sea spray fluxes.

Figure 7Hourly total aerosol number source fluxes from the CPC and CLASP vs. wave Reynolds number (log scale; data from 2015). Also shown are a linear fit to the CPC fluxes and the Reynolds number parameterization from Norris et al. (2013b, integrated over all CLASP size bins).
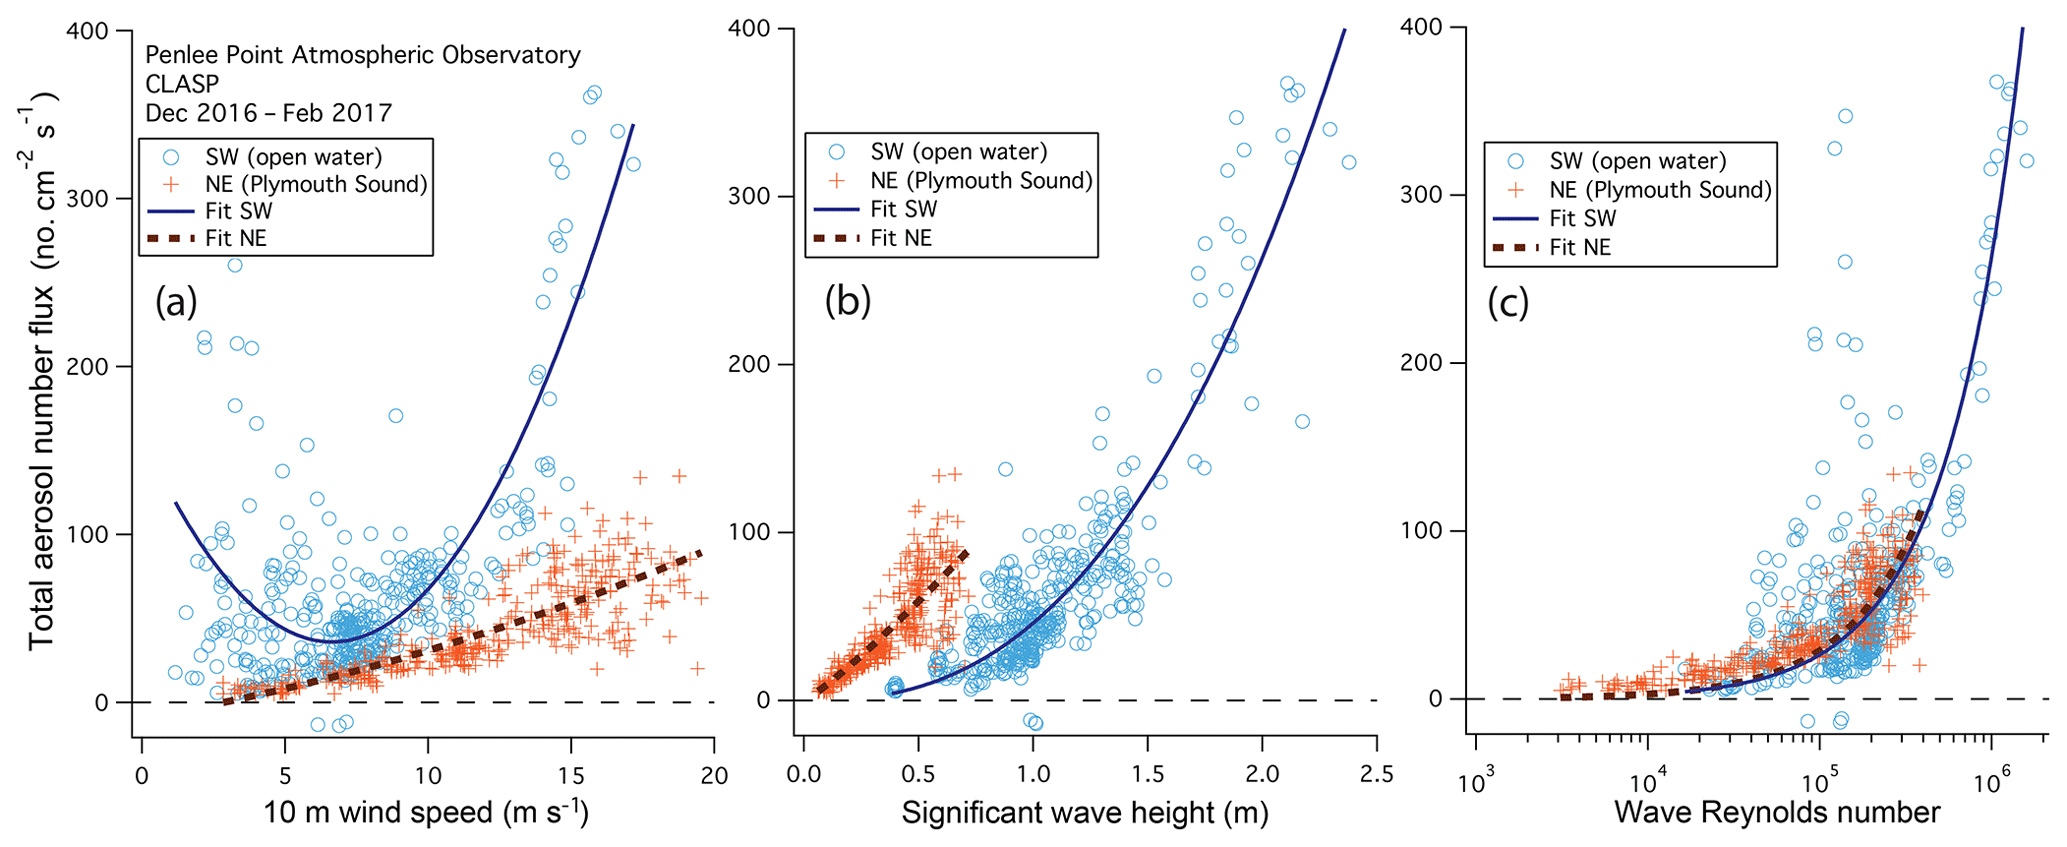
Figure 8Total aerosol number net flux from the CLASP (December 2016–February 2017) vs. wind speed (a), significant wave height (b), and wave Reynolds number (c). Data are separated into two distinct wind sectors: the southwest sector that faces the open water and the northeast sector that faces the Plymouth Sound (fetch of ∼ 5 km). Power fits of aerosol fluxes to Hs and linear fits to are also shown.

Figure 9Total aerosol number source flux from the CPC for the southwest, open water wind sector versus wind speed (a) and versus significant wave height (b). Data on both plots are separated into periods of increasing wind speed (red crosses) and decreasing wind speed (blue dashes; see Sect. 3.2 for details).
There is an observable sea-state dependence in the sea spray flux for the open water sector. Here we separate the CPC flux data into two groups of sea states: increasing wind speed (i.e. hourly increase by more than 1 m s−1) and decreasing wind speed (i.e. hourly decrease by more than 1 m s−1). These correspond approximately to younger–growing seas and older–more developed seas, respectively. As shown in Fig. 9, at intermediate wind speeds (∼ 10 m s−1) the aerosol flux is, in the mean, about twice as high during periods of decreasing wind speed than during periods of increasing wind speed, qualitatively consistent with Norris et al. (2013b) for sea spray fluxes and Callaghan et al. (2008) for whitecap fraction. Hs is also larger during periods of decreasing wind speed. Waves shoal and are be likely to break near the coast regardless of their state of development. Thus larger waves from more developed seas tend to lead to greater sea spray fluxes in these kinds of coastal environments.
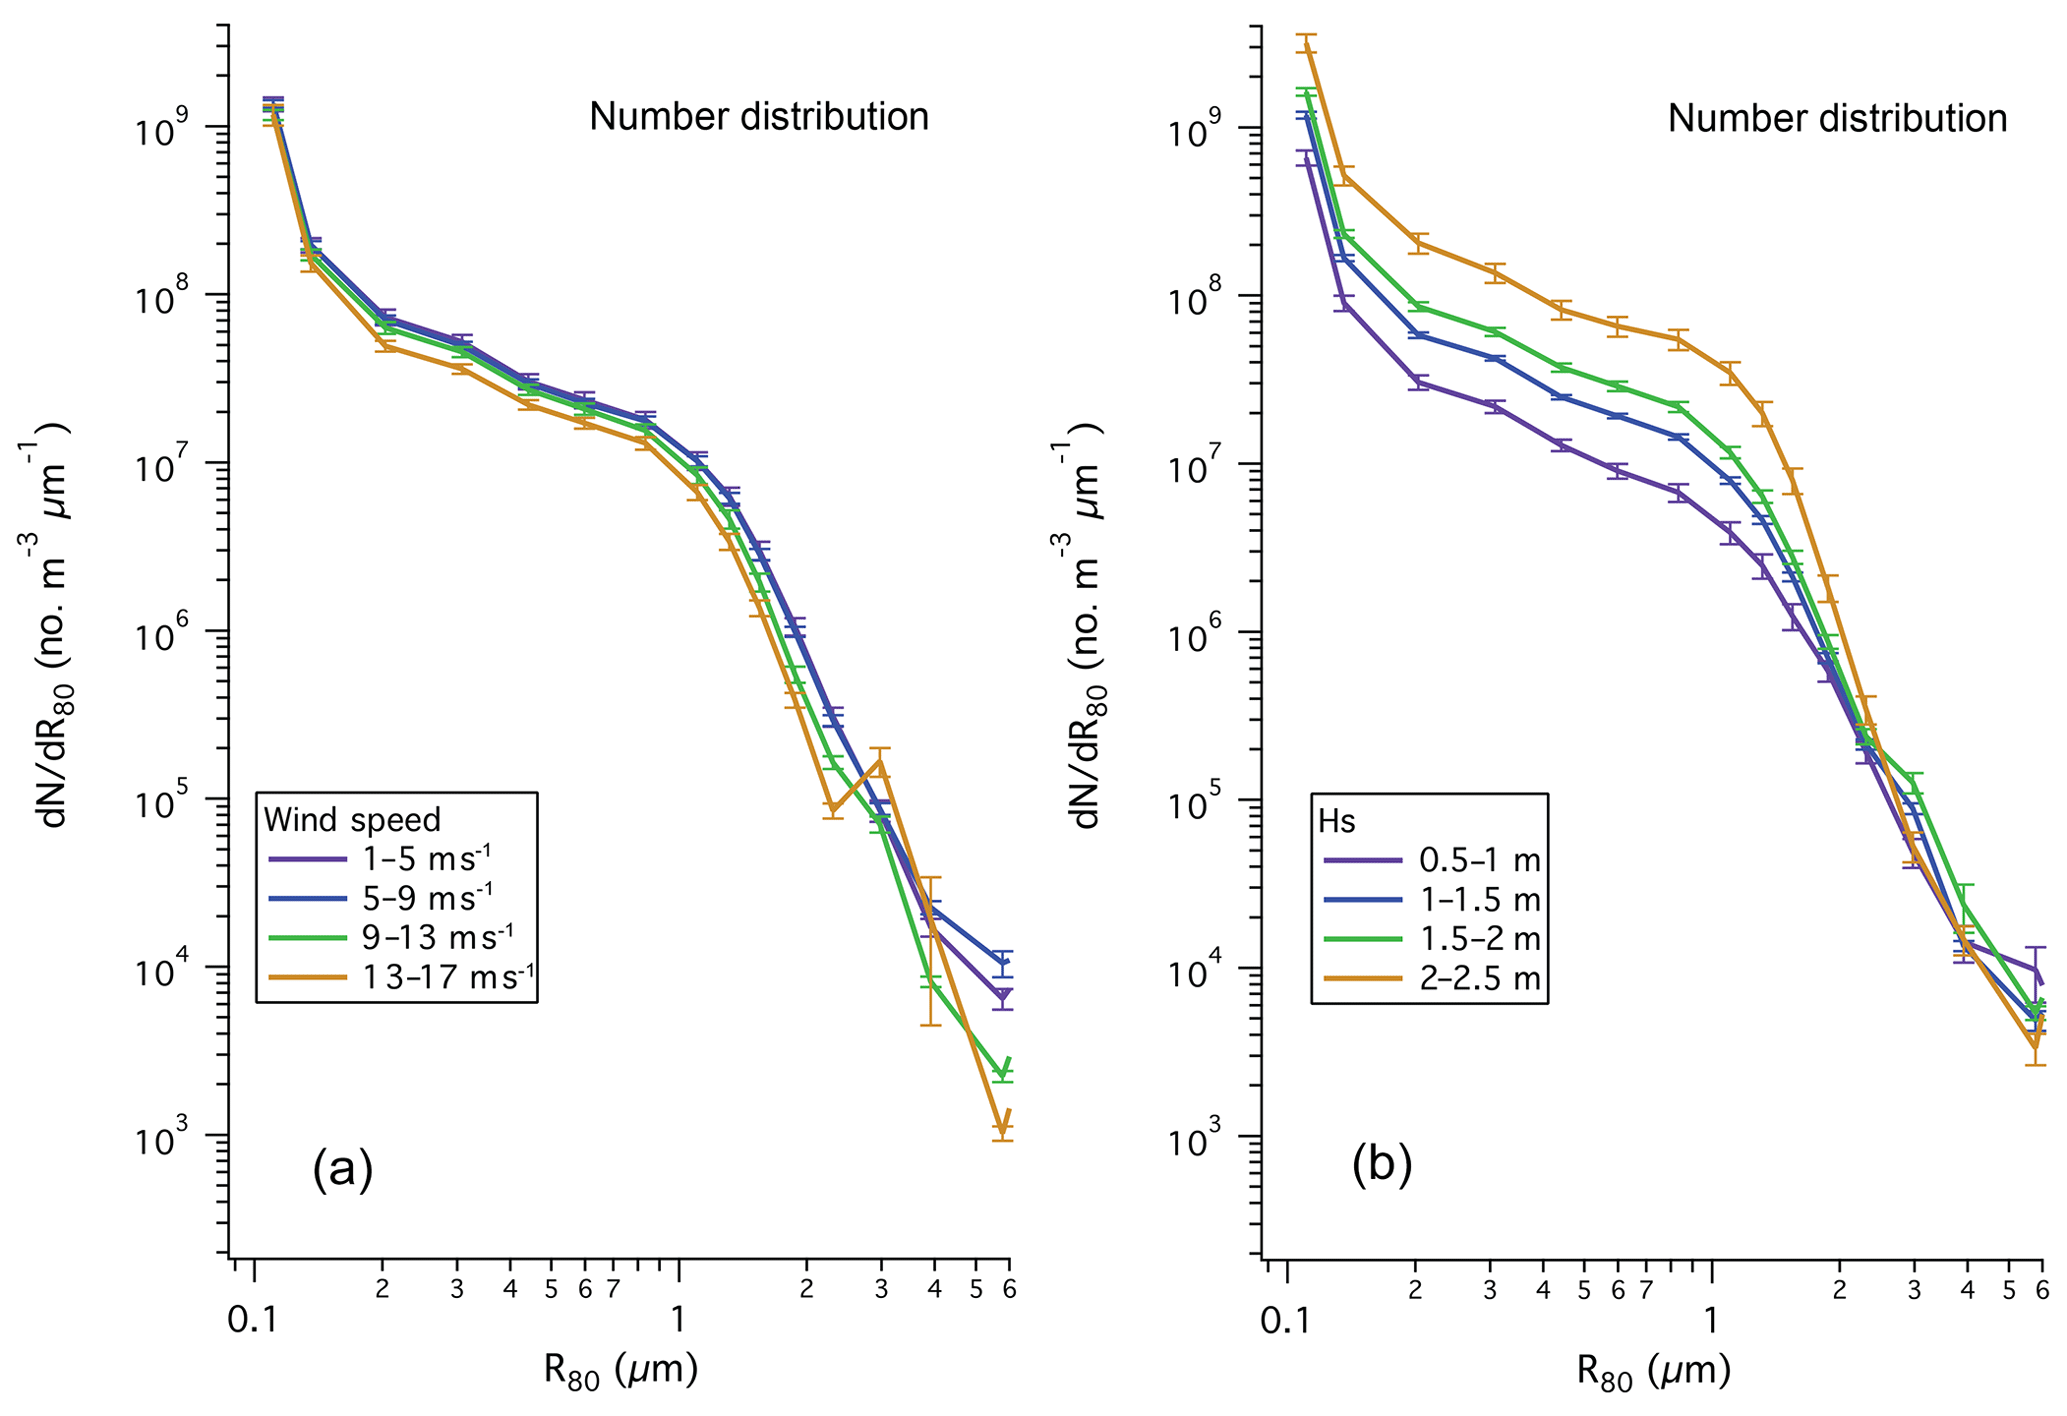
Figure 10Size-distributed aerosol number from the CLASP, bin-averaged according to wind speed (a) and significant wave height (b). Data are limited to the southwest (open water) wind sector only. Error bars indicate standard errors. Radius adjusted from ambient humidity to a relative humidity of 80 %.
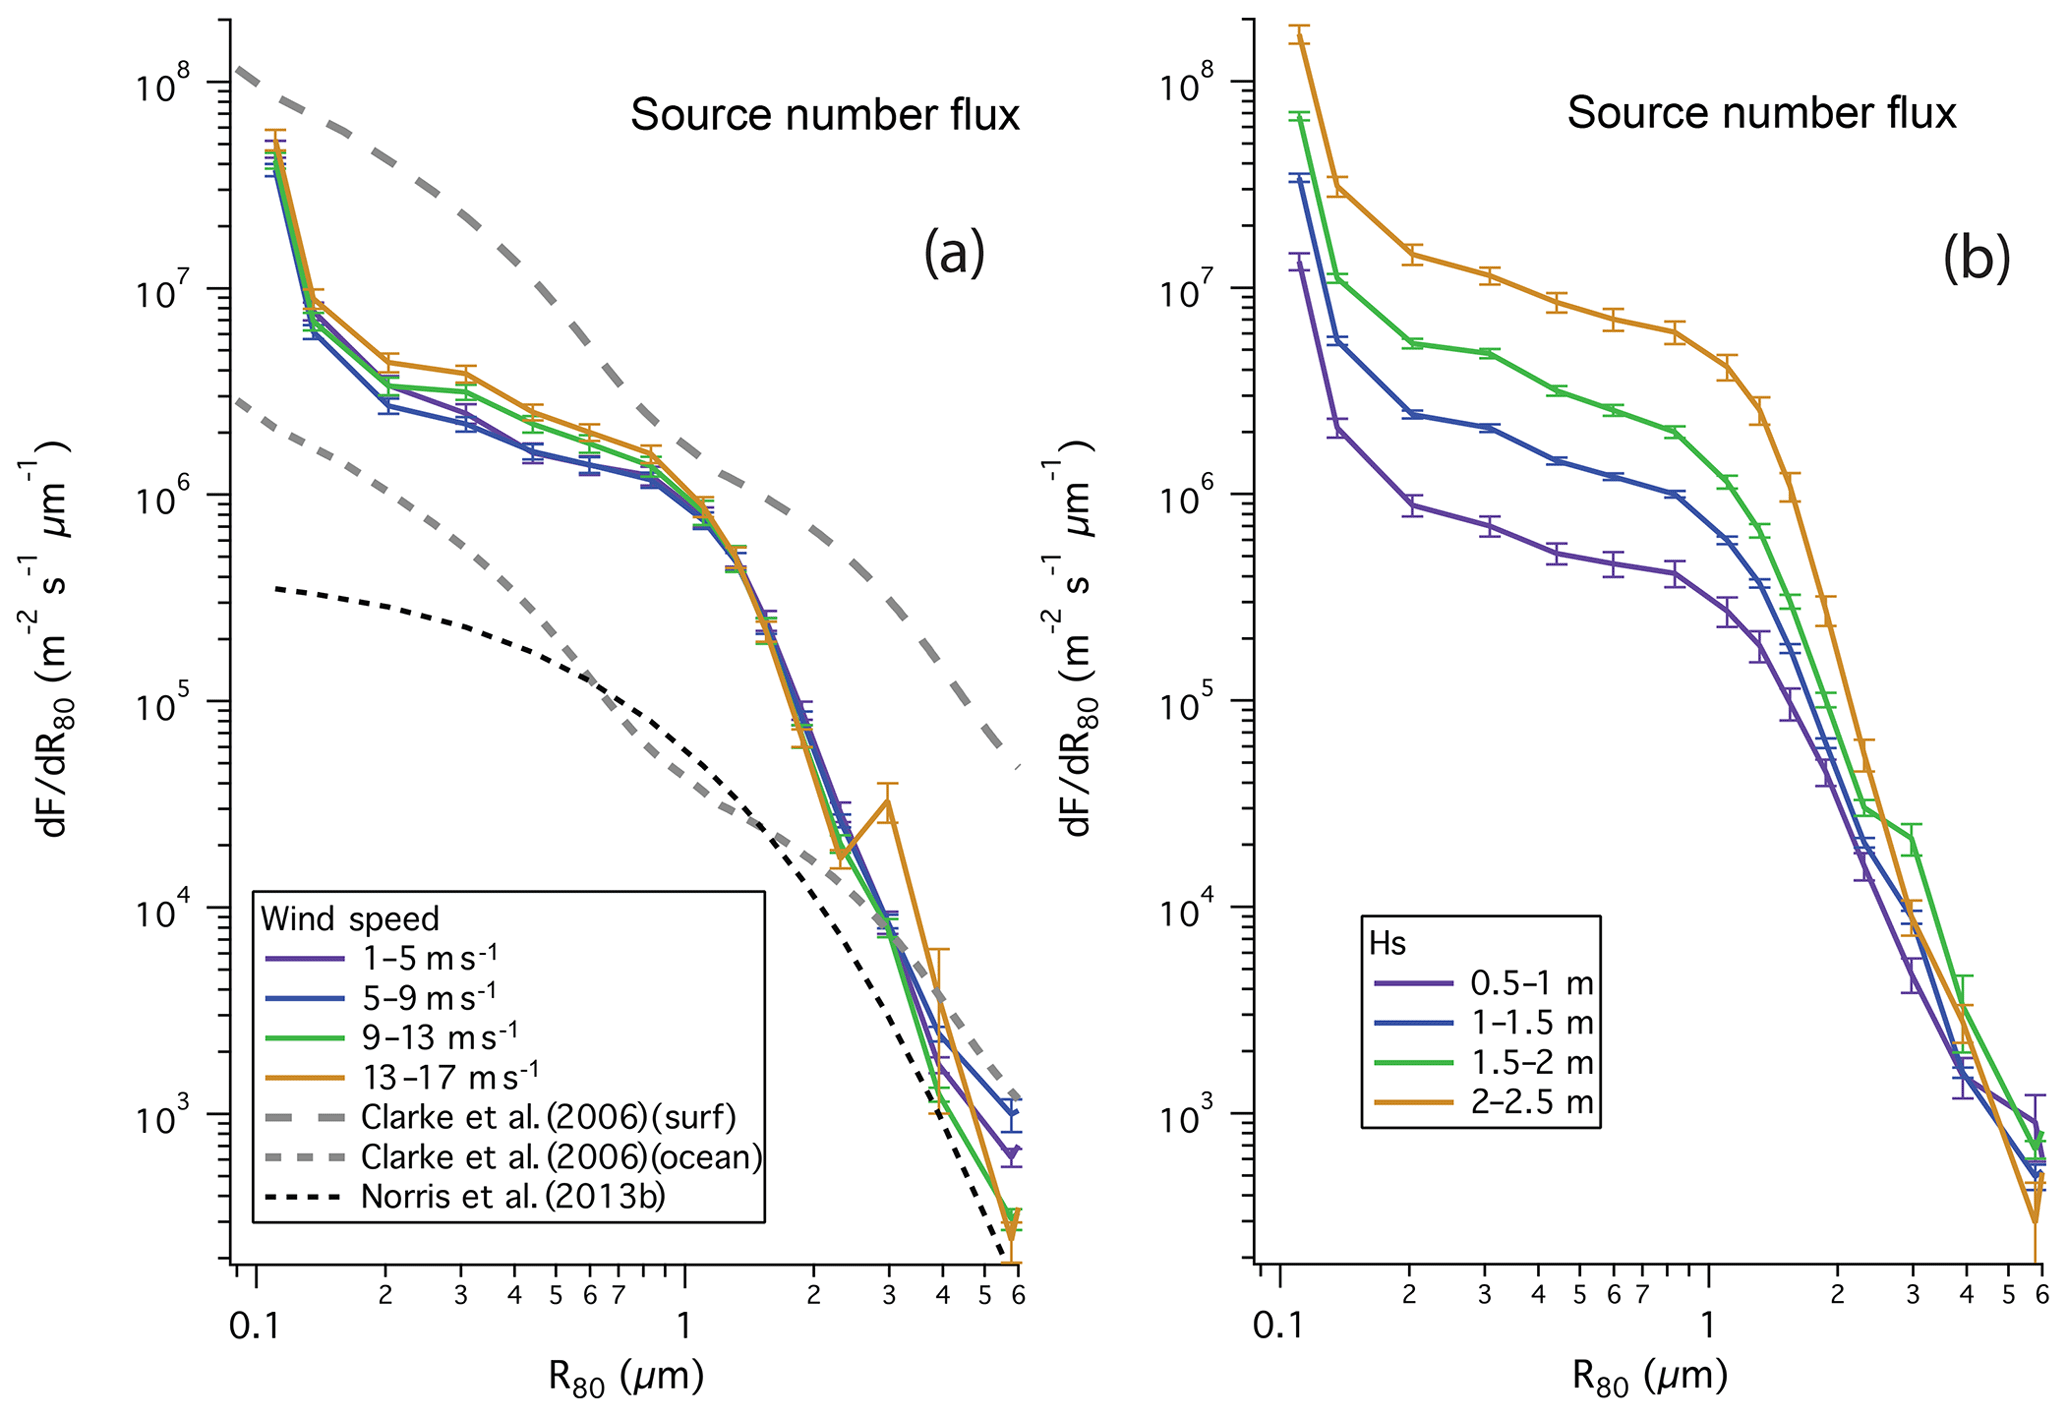
Figure 11Size-distributed source number flux from the CLASP, bin-averaged according to wind speed (a) and significant wave height (b). Data are limited to the southwest (open water) wind sector only. The open ocean source flux parameterizations from Clarke et al. (2006) and Norris et al. (2013b) are approximated at a wind speed of 10 m s−1, while the measured surf zone flux from Clarke et al. (2006) is more than an order of magnitude higher. Error bars indicate standard errors. Radius adjusted from ambient humidity to a relative humidity of 80 %.
It is interesting that there is a large discrepancy in magnitude in the source flux vs. relationship between the open ocean observations from Norris et al. (2013b) and those at PPAO (Fig. 7) – if is such a good predictor of air–sea fluxes, why does it fail to reconcile these two datasets? We suggest two possible reasons. First, shoaling may result in more frequent and intense wave breaking near the coast compared to the open ocean as the waves steepen upon approaching the shore (e.g. Elgar et al., 1997). Second is a potential difference in aerosol production per unit area whitecap between a coastal region with shoaling waves and the open ocean as a result of the different wave breaking and bubble generation processes (Deane and Stokes, 1999; Lewis and Schwartz, 2004; de Leeuw et al., 2011). Bubble populations near the sea surface were generally found to be higher close to the coast than in open water (Johnson and Cooke, 1979; Brooks et al., 2009). Different void fractions have also been observed beneath plunging and spilling breaking waves (Rojas and Loewen, 2010). Testing of these hypotheses requires observations of the relationships between whitecaps, bubbles and in the nearshore region.
Laboratory measurements suggest dependence of the sea spray flux on water temperature and salinity (e.g. Mårtensson et al., 2003; Salter et al., 2014), while Tyree et al. (2007) showed that the addition of natural organic matter increased the submicron aerosol flux by 50 %. Previous observations of aerosol composition in marine environments imply that a significant fraction of sea spray is made up of organic materials (e.g. O'Dowd et al., 2004). We investigate these dependencies by comparing our sea spray flux data to surface ocean parameters from the marine station L4 (6 km south of PPAO) of the Western Channel Observatory (http://westernchannelobservatory.org.uk/, last access: 13 December 2019). From February to June 2015, sea surface temperature and salinity varied between 9.2 and 12.5 ∘C and between 35.1 and 35.3, respectively. Chlorophyll a increased from 0.8 to 3.1 mg m−3 during the spring phytoplankton bloom, while coloured dissolved organic matter (from the E1 buoy 18 km offshore) also varied by about a factor of 4. We test the importance of these surface ocean parameters by examining their correlations vs. , where is the total sea spray source flux (FSSA) minus a polynomial fit to FSSA (as a function of wind speed or Hs). No significant correlation was found. This suggests that within the range of conditions observed at PPAO during this deployment, waves and wind are the 1st-order drivers for sea spray formation, while the other parameters appear to be of little importance.
3.3 Size-distributed aerosol number concentrations and fluxes
Figure 10 shows number distribution (dN∕dR80) vs. radius at a humidity of 80 % (R80) averaged in wind speed as well as significant wave height bins. Data are taken from February to March 2015 and for the southwest (open water) wind sector only. The overall distribution in concentration is fairly typical of the marine atmosphere, with most aerosols in the submicron mode. The number distributions are more clearly segregated by significant wave height than by wind speed for radius up to about 2 µm. Above this cut-off, the number distribution seems to be largely independent of Hs or wind speed.
In accordance with the total aerosol number fluxes, size-distributed fluxes from the PPAO (dF∕dR80) are significantly higher than measurements over the open ocean (Fig. 11). For example, in moderate seas at PPAO the measured source flux at R80 of 1 µm exceeds 106 m−2 s−1 µm−1, compared to approximately 105 m−2 s−1 µm−1 from Norris et al. (2013b). Sea spray flux from the coastal seas near PPAO is lower than estimates from the surf zone by Clarke et al. (2006). Readers interested in other previous measurements and parameterizations of size-distributed sea spray source fluxes are referred to reviews by O'Dowd and de Leeuw (2007) and de Leeuw et al. (2011).
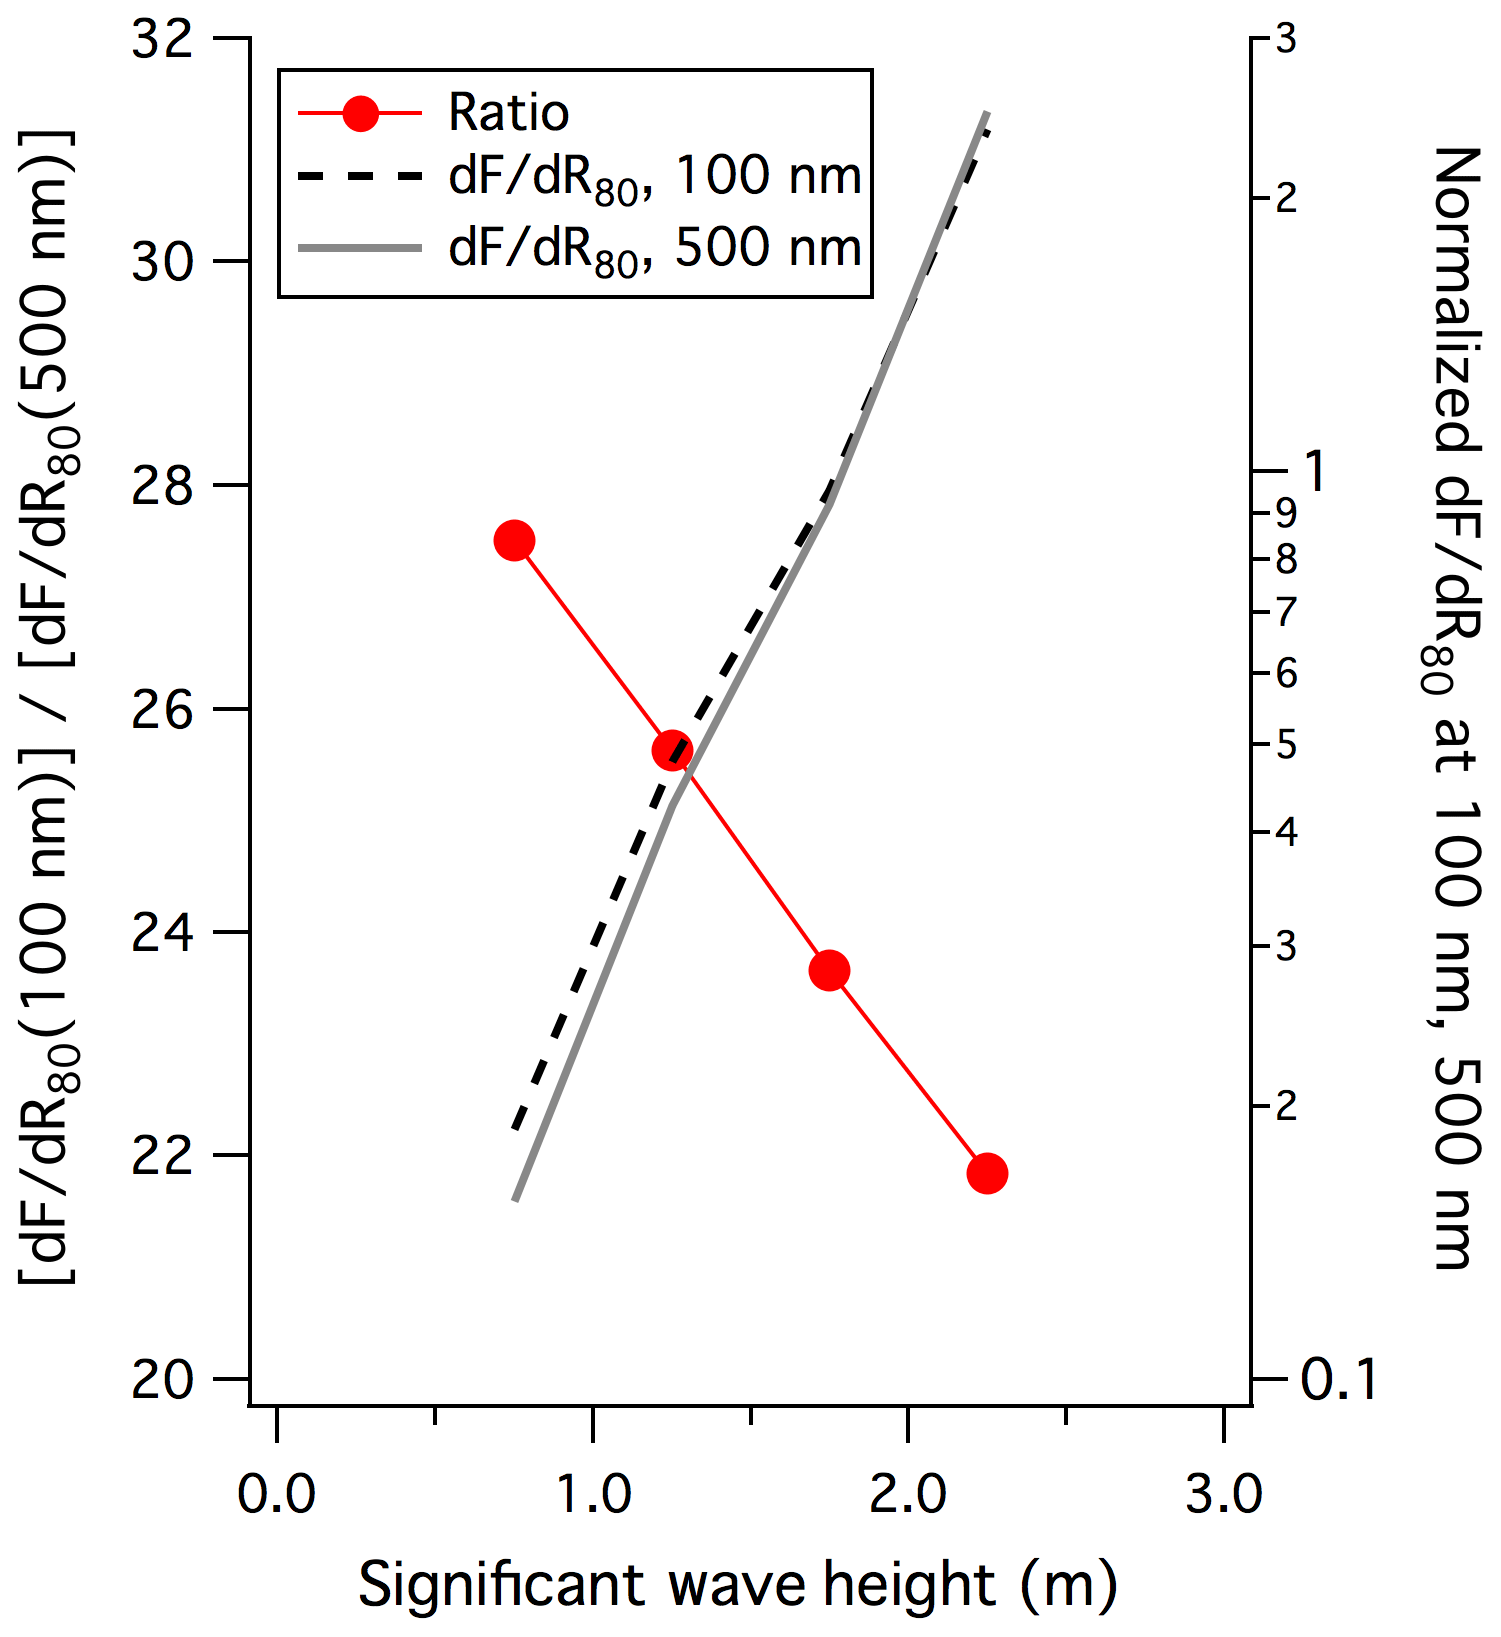
Figure 12Ratio of size-distributed source number flux in film drop mode (here R80=100 nm) to that in the jet drop mode (here R80=500 nm) as well as normalized dF∕dR80 at these sizes as a function of significant wave height.
Size-distributed aerosol number concentrations as well as fluxes peak at the lowest size bin of CLASP (0.1 µm radius at ∼ 80 % RH), near the typical mode centre for film droplets (Mårtensson et al., 2003; Tyree et al., 2007). We can crudely estimate the contribution of film drop fluxes below the detection cut-off for the CLASP by fitting a log-normal distribution to the observed dF∕dR80. Here we assume that the observed dF∕dR80 at a R80 of 0.1 µm represents the peak in the film drop mode. Integrating the log-normal fit from 1.5 nm to 0.1 µm yields the “missing” film drop flux (median value of ∼ 40 cm−2 s−1), which amounts to about 25 % of the total measured CLASP number flux. This is consistent with the finding that the total aerosol number flux from the CLASP was lower than that from the CPC by a mean (median) of 45 (40) cm−2 s−1. Future observations of the fine aerosol size distribution (e.g. by a scanning mobility particle sizer) at PPAO should provide more information on the robustness of our assumption above.
About 70 % of the sea spray number fluxes measured by CLASP are submicron (at RH of 80 %), with the vast majority of the aerosol number flux residing between radius 0.1 and 1.1 µm (Fig. 11). Aerosols with a radius greater than 2 µm make up only ∼ 1 % of the integrated CLASP number flux. The distribution of source number flux below a radius of about 2 µm is more clearly segregated by Hs than by wind speed, as with the aerosol number size distribution. Above 2 µm radius, size-distributed fluxes no longer seem to depend on Hs or wind speed. There is a subtle decreasing trend in the ratio between film drop mode (radius of ∼ 100 nm at 80 % RH) and jet drop mode (radius of ∼ 500 nm at 80 % RH) with increasing significant wave height (Fig. 12). An examination of normalized dF∕dR80 (by the respective mean flux) shows that with greater wave height, the jet drop mode appears to increase more steeply than the film drop mode. A similar shift in the shape of size-distributed aerosol flux with growing seas has been observed previously by Norris et al. (2013a). They showed that the bubble spectra change with wind speed, with the concentrations of small bubbles (which lead to jet-mode aerosols) increasing more rapidly than the large bubbles (which lead to film-drop-mode aerosols).
Eddy covariance measurements of sea spray fluxes originating from the shallow waters upwind of PPAO show that about 70 % of the total detected number fluxes were submicron. A reasonable closure is found between the aerosol number flux from the CPC (> 1.5 nm in radius) and the total number flux from the CLASP (0.1–6 µm in radius) after considering the incomplete detection of film-mode aerosols by the latter. Sea spray fluxes from the open water wind sector at PPAO increase with wind speed with a dependence that is similar to previous coastal sea spray flux measurements at Mace Head (Geever et al., 2005). Our observed fluxes are greater in magnitude than most previous open ocean measurements except those reported by Nilsson et al. (2001), but are lower in magnitude than previous surf zone estimates (e.g. Clarke et al., 2006).
Sea spray formation in this coastal environment is strongly dependent on sea state. Both significant wave height (Hs) and wave Reynolds number () are better predictors of sea spray fluxes than local wind speed. The importance of waves is further confirmed by comparing sea spray fluxes measured from the open water sector to fluxes from the fetch-limited Plymouth Sound, where waves were much smaller at a given wind speed. For both wind sectors, sea spray fluxes correlate with Hs more strongly than with wind speed, but with two very different relationships. The wave Reynolds number ( reconciles the fluxes from the two sectors. This finding is consistent with those of Brumer et al. (2017a, b), who found to be a much better predictor than wind speed of both the whitecap fraction and gas transfer velocity in different wind–wave regimes.
Sea spray fluxes measured at PPAO (open water sector) are likely only representative of the nearest few kilometres from shore. The median supermicron and submicron sea spray fluxes from the CLASP during February–March 2015 were about 60 and 100 cm−2 s−1, respectively. The residence times of supermicron and submicron aerosols in a 500 m deep marine atmospheric boundary layer (MABL) against dry deposition are of the order of 0.6 and 6 d (at a respective deposition velocity of −1 and −0.1 cm s−1; Slinn and Slinn, 1980). The residence time for submicron aerosols is likely further reduced by wet deposition (∼ 3 d; Lewis and Schwartz, 2004). At these timescales, the expected steady-state supermicron and submicron aerosol number concentrations for a well-mixed MABL based on our measured fluxes would be on the order of 60 and 300 cm−3, respectively. These are significantly higher than the observed median supermicron and submicron aerosol concentrations from the CLASP of 11 and 24 cm−3 for the open water wind sector. Clearly aerosol concentrations and fluxes are not in steady state in this coastal environment, consistent with previous findings by Andreas et al. (2010) and Freire et al. (2016). The fluxes are enhanced near the coast due to increased wave breaking resulting from shoaling of waves in shallow water, while the concentrations reflect both sea spray generated within the flux footprint and the aerosol sources and sinks further upwind. To map out the spatial distributions of sea spray fluxes, measurement techniques such as eddy covariance from a ship and aerial imaging of whitecap fraction (e.g. from an unmanned aerial vehicle) are needed.
The data collection for this work was unfunded, and thus the data will not be submitted to a central depository. Please contact the corresponding author for the data.
MY carried out the majority of the measurements. IB provided the CLASP and CPC instruments. IB and SN helped with instrument installation and data analysis. TB helped with maintenance of the instruments at PPAO. MY prepared the paper with contributions from all co-authors.
The authors declare that they have no conflict of interest.
Trinity House owns the Penlee site and has kindly agreed to rent the building to PML so that instrumentation can be protected from the elements. We are able to access the site thanks to the cooperation of Mount Edgcumbe House. We thank John Prytherch and Matt Salter (Stockholm University) for useful discussions; Frances Hopkins, Timothy Smyth and Phil Nightingale (Plymouth Marine Laboratory, PML) for support; Robin Pascal and Margaret Yelland (National Oceanography Centre, Southampton) for the loan of the R3 sonic anemometer; and Ben Carlton (PML) for setting up data communication. The wave data from Looe Bay are provided by the Channel Coastal Observatory. The Penlee site is part of the Western Channel Observatory, which is funded by NERC's National Capability programme. This work is contribution number 6 from the Penlee Point Atmospheric Observatory (since the grant number is listed below under financial support).
This research has been supported by the Natural Environment Research Council (grant no. NE/N018044/1).
This paper was edited by Lynn M. Russell and reviewed by Sebastian Landwehr and Christopher Fairall.
Andreas, E. L., Edson, J. B., Monahan, E. C., Rouault, M. P., and Smith, S. D.: The spray contribution to net evaporation from the sea: A review of recent progress, Bound.-Lay. Meteor., 72, 3–52, 1995.
Andreas, E. L, Jones, K. F., and Fairall, C. W.: Production velocity of sea spray droplets, J. Geophys. Res., 115, C12065, https://doi.org/10.1029/2010JC006458, 2010.
Anguelova, M. D. and Webster, F.: Whitecap coverage from satellite measurements: A first step toward modeling the variability of oceanic whitecaps, J. Geophys. Res., 111, C03017, https://doi.org/10.1029/2005JC003158, 2006.
Blanchard, D. C.: The electrification of the atmosphere by particles from bubbles in the sea, Prog. Oceanogr., 1, 73–112, https://doi.org/10.1016/0079-6611(63)90004-1, 1963.
Brooks, I. M., Yelland, M. J., Upstill-Goddard, R. C., Nightingale, P. D., Archer, S., d'Asaro, E., Beale, R., Beatty, C., Blomquist, B., Bloom, A. A., Brooks, B. J., Cluderay, J., Coles, D., Dacey, J., DeGrandpre, M., Dixon, J., Drennan, W. M., Gabriele, J., Goldson, L., Hardman-Mountford, N., Hill, M. K., Horn, M., Hsueh, P.-C., Huebert, B., de Leeuw, G., Leighton, T. G., Lid- dicoat, M., Lingard, J. J. N., McNeil, C., McQuaid, J. B., Moat, B. I., Moore, G., Neill, C., Norris, S. J., O'Doherty, S., Pas- cal, R. W., Prytherch, J., Rebozo, M., Sahlee, E., Salter, M., Schuster, U., Skjelvan, I., Slagter, H., Smith, M. H., Smith, P. D., Srokosz, M., Stephens, J. A., Taylor, P. K., Telszewski, M., Walsh, R., Ward, B., Woolf, D. K., Young, D., and Zemmelink, H.: Physical Exchanges at the Air-Sea Interface: Field Measurements from UK-SOLAS, B. Am. Meteorol. Soc., 90, 629–644, https://doi.org/10.1175/2008BAMS2578.1, 2009.
Brumer, S. E., Zappa, C. J., Brooks, I. M., Tamura, H., Brown, S. M., Blomquist, B., Fairall, C. W., and Cifuentes-Lorenzen, A.: Whitecap coverage dependence on wind and wave statistics as observed during SO GasEx and HiWinGS, J. Phys. Oceanogr. 47, 2211-2235, https://doi.org/10.1175/JPO-D-17-0005.1, 2017a.
Brumer, S. E., Zappa, C. J., Blomquist, B., Fairall, C. W., Cifuentes-Lorenzen, A., Edson, J. B., Brooks, I. M., and Huebert, B. J.: Wave-related Reynolds number parameterizations of CO2 and DMS transfer velocities, Geophys. Res. Letts., 44, 9865–9875, https://doi.org/10.1002/2017GL074979, 2017b.
Callaghan, A. H., de Leeuw, G., Cohen, L., and O'Dowd, C. D.: Relationship of oceanic whitecap coverage to wind speed and wind history, Geophys. Res. Lett., 35, L23609, https://doi.org/10.1029/2008GL036165, 2008.
Clarke, A. D., Owens, S. R., and Zhou,J.: An ultrafine sea-salt flux from breaking waves: implications for cloud condensation nuclei in the remote marine atmosphere, J. Geophys. Res., 111, D06202, https://doi.org/10.1029/2005JD006565, 2006.
Deane, G. B. and Stokes, M. D.: Air entrainment processes and bubble size distributions in the surf zone, J. Phys. Oceanogr., 29, 1393–1403, https://doi.org/10.1175/1520-0485(1999)029<1393:AEPABS>2.0.CO;2, 1999.
de Leeuw, G., Neele, F. P., Hill, M., Smith, M. H., and Vignati, E.: Sea spray aerosol production by waves breaking in the surf zone, J. Geophys. Res., 105, 29397–29409, https://doi.org/10.1029/2000JD900549, 2000.
de Leeuw, G., Andreas, E. L., Anguelova, M. D., Fairall, C. W., Lewis, E. R., O'Dowd, C., Schulz, M., and Schwartz, S. E.: Production flux of sea spray aerosol, Rev. Geophys., 49, RG2001, https://doi.org/10.1029/2010RG000349, 2011.
Duce, R. A., Liss, P. S., Merrill, J. T., Atlas, E. L., Buat-Menard, P., Hicks, B. B., Miller, J. M., Prospero, J. M., Arimoto, R., Church, T. M., Ellis, W., Galloway, J. N., Hansen, L., Jickells, T. D., Knap, A. H., Reinhardt, K. H., Schneider, B., Soudine, A., Tokos, J. J., Tsunogai, S., Wollast, R., and Zhou, M.: The Atmospheric Input of Trace Species to the World Ocean, Global Biogeochem. Cy., 5, 193–259, 1991.
Elgar, S., Guza, R. T., Raubenheimeter, B., Herbers, T. H. C., and Gallagher, E. L.: Spectral evolution of shoaling and breaking waves on a barred beach, J. Geophys., Res., 102, 15797–15805, 1997.
Fairall, C. W.: Interpretation of eddy-correlation measurements of particulate deposition and aerosol flux, Atmos. Environ., 18, 1329–1337, https://doi.org/10.1016/0004-6981(84)90041-6, 1984.
Freire, L. S., Chamecki, M., and Gillies, J. A: Flux-profile relationship for dust concentration in the stratified atmospheric surface layer. Bound.-Lay. Meteorol., 160, 249–267, 2016.
Geever, M., O'Dowd, C. D., van Ekeren, S., Flanagan, R., Nilsson, E. D., de Leeuw, G., and Rannik, U.: Submicron sea spray fluxes, Geophys. Res. Lett., 32, L15810, https://doi.org/10.1029/2005GL023081, 2005.
Gerber, H. E.: Relative-humidity parameterization of the navy aerosol model (NAM), Naval Research Laboratory, Washington, Report No. NRL Report 8956, 17 pp., 1985.
Haywood, J. M., Ramaswamy, V., and Soden B. J.: Tropospheric aerosol climate forcing in clear-sky satellite observations over the oceans, Science, 283, 1299–1303, https://doi.org/10.1126/science.283.5406.1299, 1999.
Hill, M. K., Brooks, B. J., Norris, S. J., Smith, M. H., Brooks, I. M., and de Leeuw, G.: A Compact Lightweight Aerosol Spectrometer Probe (CLASP), J. Atmos. Ocean. Technol., 25, 1996–2006, https://doi.org/10.1175/2008JTECHA1051.1, 2008.
Hobbs, P. V., Garrett, T. J., Ferek, R. J., Strader, S. R., Hegg, D. A., Frick, G. M., Hoppel, W. A., Gasparovic, R. F., Russell, L. M., Johnson, D. W., O'Dowd, C., Durkee, P. A., Nielsen, K. E., and Innis, G.: Emissions from ships with respect to their effects on clouds, J. Atmos. Sci., 57, 2570–2590, https://doi.org/10.1175/1520-0469(2000)057<2570:efswrt>2.0.co;2, 2000.
Hoppel, W. A., Fitzgerald, J. W., Frick, G. M., Larson, R. E., and Mack, E. J.: Aerosol size distributions and optical properties found in the marine boundary layer over the Atlantic Ocean, J. Geophys. Res., 95, 3659–3686, https://doi.org/10.1029/JD095iD04p03659, 1990.
Hoppel, W. A., Frick, G. M., and Larson, R. E.: Effect of nonprecipitating clouds on the aerosol size distribution in the marine boundary layer. Geophys. Res. Lett., 13, 125–128, https://doi.org/10.1029/GL013i002p00125, 1986.
Jeong, D., Haus, B. K., and Donelan, M. A.: Enthalpy transfer across the air-water interface in high winds including spray, J. Atmos. Sci., 69, 2733–2748, https://doi.org/10.1175/jas-d-11-0260.1, 2012.
Johnson, B. D. and Cooke, R. C.: Bubble populations and spectra in coastal waters: A photographicapproach, J. Geophys.Res., 84, 3761–3766, 1979.
Kaimal, J. C., Wyngaard, J. C., Izumi, Y., and Cote, O. R.: Spectral characteristics of surface-layer turbulence, Q. J. Roy. Meteor. Soc., 98, 563–589, 1972.
Kim, M. J., Farmer, D. K., and Bertram, T. H.: A controlling role for the air-sea interface in the chemical processing of reactive nitrogen in the coastal marine boundary layer, P. Natl. Acad. Sci. USA, 111, 3943–3948, https://doi.org/10.1073/pnas.1318694111, 2014.
Kljun, N., Calanca, P., Rotach, M. W., and Schmid, H. P.: A Simple Parameterisation for Flux Footprint Predictions, Bound.-Lay. Meteorol., 112, 503–523, 2004.
Lewis, E. R. and Schwartz, S. E: Sea Salt Aerosol Production: Mechanisms, Methods, Measurements and Models – A Critical Review, AGU, Washington, DC, Geophys. Monogr. Ser., 152, 413 pp., 2004.
Mårtensson, E. M., Nilsson, E. D., de Leeuw, G., Cohen, L. H., and Hansson, H.-C.: Laboratory simulations and parameterization of the primary marine aerosol production, J. Geophys. Res., 108, 4297, https://doi.org/10.1029/2002JD002263, 2003.
Monahan, E. C., Fairall, C. W., Davidson, K. L., and Jones-Boyle, P.: Observed inter-relations between 10 m winds, ocean whitecaps and marine aerosols, Q. J. Roy. Meteorol. Soc., 109, 379–392, https://doi.org/10.1002/qj.49710946010, 1983.
Monahan, E. C., Spiel, D. E., and Davidson, K. L.: A model of marine aerosol generation via whitecaps and wave disruption, in: Oceanic whitecaps and their role in air-sea exchange processes, edited by: Monahan, E. C. and MacNiocaill, G., Dordrecht, The Netherlands: Reidel, 167–174, 1986.
Nilsson, E. D., Rannik, U., Swietlicki, E., Leck, C., Aalto, P. P., Zhou, J., and Norman, M.: Turbulent aerosol fluxes over the Arctic Ocean: 2. Wind-driven sources from the sea, J. Geophys. Res., 106, 32139–32154, https://doi.org/10.1029/2000JD900747, 2001.
Norris, S. J., Brooks, I. M., Hill, M. K., Brooks, B. J., Smith, M. H., and Sproson, D. A. J.: Eddy covariance measurements of the sea spray aerosol flux over the open ocean, J. Geophys. Res., 117, D07210, https://doi.org/10.1029/2011JD016549, 2012.
Norris, S. J., Brooks, I. M., de Leeuw, G., Smith, M. H., Moerman, M., and Lingard, J. J. N.: Eddy covariance measurements of sea spray particles over the Atlantic Ocean, Atmos. Chem. Phys., 8, 555–563, https://doi.org/10.5194/acp-8-555-2008, 2008.
Norris, S. J., Brooks, I. M., Moat, B. I., Yelland, M. J., de Leeuw, G., Pascal, R. W., and Brooks, B.: Near-surface measurements of sea spray aerosol production over whitecaps in the open ocean, Ocean Sci., 9, 133–145, https://doi.org/10.5194/os-9-133-2013, 2013a.
Norris, S. J., Brooks, I. M., and Salisbury, D. J.: A wave roughness Reynolds number parameterization of the sea spray source flux, Geophys. Res. Lett., 40, 4415–4419, https://doi.org/10.1002/grl.50795, 2013b.
O'Dowd, C. D. and de Leeuw G.: Marine aerosol production: A review of the current knowledge, Philos. Trans. R. Soc. A, 365, 1753–1774, https://doi.org/10.1098/rsta.2007.2043, 2007.
O'Dowd, C. D., Facchini, M. C., Cavalli, F., Ceburnis, D., Mircea, M., Decesari, S., Fuzzi, S., Yoon, Y. J., and Putaud, J. P.: Biogenically-driven organic contribution to marine aerosol, Nature, 431, 676–780, https://doi.org/10.1038/nature02959, 2004.
O'Dowd, C. D. and Smith, M. H.: Physicochemical properties of aerosols over the northeast Atlantic: Evidence for wind-speed-related submicron sea-salt aerosol production, J. Geophys. Res., 98, 1137–1149, https://doi.org/10.1029/92JD02302, 1993.
Petzold, A., Hasselbach, J., Lauer, P., Baumann, R., Franke, K., Gurk, C., Schlager, H., and Weingartner, E.: Experimental studies on particle emissions from cruising ship, their characteristic properties, transformation and atmospheric lifetime in the marine boundary layer, Atmos. Chem. Phys., 8, 2387–2403, https://doi.org/10.5194/acp-8-2387-2008, 2008.
Pierson, W. J. and Moskowitz, L.: A proposed spectral form for fully developed wind seas based on the similarity theory of S. A. Kitaigorodskii, J. Geophys. Res., 69, 5181–5190, 1964.
Pui, D. Y. H., Romay-Novas, F., and Lui, B. Y. H.: Experimental study of particle deposition in bends of circular cross section, Aerosol Sci. Technol., 7, 301–315, https://doi.org/10.1080/02786828708959166, 1987.
Resio, T. D., Bratos, S., and Thompson, E. F.: Meteorology and Wave Climatology: Costal Engineering Manual, Part 2, chap. 2, 44–47, 2002.
Rojas, G. and Loewen M. R.: Void fraction measurements beneath plunging and spilling breaking waves, J. Geophys. Res., 115, C08001, https://doi.org/10.1029/2009JC005614, 2010.
Salisbury, D. J., Anguelova, M. D., and Brooks, I. M.: Global distribution and seasonal dependence of satellite- based whitecap fraction, Geophys. Res. Lett., 41, 1616–1623, https://doi.org/10.1002/2014GL059246, 2014.
Salter, M. E., Nilsson, E. D., Butcher, A., and Bilde, M.: On the sea- water temperature dependence of the sea spray aerosol generated by a continuous plunging jet, J. Geophys. Res. Atmos., 119, 9052–9072, https://doi.org/10.1002/2013JD021376, 2014.
Salter, M. E., Zieger, P., Acosta Navarro, J. C., Grythe, H., Kirkevåg, A., Rosati, B., Riipinen, I., and Nilsson, E. D.: An empirically derived inorganic sea spray source function incorporating sea surface temperature, Atmos. Chem. Phys., 15, 11047–11066, https://doi.org/10.5194/acp-15-11047-2015, 2015.
Scanlon, B. and Ward, B.: The influence of environmental parameters on active and maturing oceanic whitecaps, J. Geophys. Res.-Oceans, 121, 3325–3336, https://doi.org/10.1002/2015JC011230, 2016.
Sievering, H., Boatman, J., Galloway, J., Keene, W., Kim, Y., Luria, M., and Ray, J.: Heterogeneous sulfur conversion in sea-salt aerosol particles: the role of aerosol water content and size distribution, Atmos. Environ., 25, 1479–1487, 1991.
Slinn, S. A. and Slinn, W. G. N.: Predictions for particle deposition on natural waters, Atmos. Environ., 14, 1013–1016, 1980.
Sproson, D. A. J., Brooks, I. M., and Norris, S. J.: The effect of hygroscopicity on eddy covariance estimates of sea-spray aerosol fluxes: a comparison of high-rate and bulk correction methods, Atmos. Meas. Tech., 6, 323–335, https://doi.org/10.5194/amt-6-323-2013, 2013.
Thorpe, S. A.: Bubble clouds and the dynamics of the upper ocean, Q. J. Roy. Meteorol. Soc., 118, 1–22, https://doi.org/10.1002/qj.49711850302, 1992.
Tyree, C. A., Hellion, V. M., Alexandrova, O. A., and Allen, J. O.: Foam droplets generated from natural and artificial seawaters, J. Geophys. Res., 112, D12204, https://doi.org/10.1029/2006JD007729, 2007.
van Eijk, A. M. J., Kusmierczyk-Michulec, J. T., Francius, M. J., Tedeschi, G., Piazzola, J., Merritt, D. L., and Fontana, J. D.: Sea-spray aerosol particles generated in the surf zone, J. Geophys. Res., 116, D19210, https://doi.org/10.1029/2011JD015602, 2011.
Yang, M., Beale, R., Smyth, T., and Blomquist, B.: Measurements of OVOC fluxes by eddy covariance using a proton-transfer-reaction mass spectrometer – method development at a coastal site, Atmos. Chem. Phys., 13, 6165–6184, https://doi.org/10.5194/acp-13-6165-2013, 2013.
Yang, M., Bell, T. G., Hopkins, F. E., Kitidis, V., Cazenave, P. W., Nightingale, P. D., Yelland, M. J., Pascal, R. W., Prytherch, J., Brooks, I. M., and Smyth, T. J.: Air–sea fluxes of CO2 and CH4 from the Penlee Point Atmospheric Observatory on the south-west coast of the UK, Atmos. Chem. Phys., 16, 5745–5761, https://doi.org/10.5194/acp-16-5745-2016, 2016a.
Yang, M., Prytherch, J., Kozlova, E., Yelland, M. J., Parenkat Mony, D., and Bell, T. G.: Comparison of two closed-path cavity-based spectrometers for measuring air–water CO2 and CH4 fluxes by eddy covariance, Atmos. Meas. Tech., 9, 5509–5522, https://doi.org/10.5194/amt-9-5509-2016, 2016b.
Yang, M., Bell, T. G., Brown, I. J., Fishwick, J. R., Kitidis, V., Nightingale, P. D., Rees, A. P., and Smyth, T. J.: Insights from year-long measurements of air–water CH4 and CO2 exchange in a coastal environment, Biogeosciences, 16, 961–978, https://doi.org/10.5194/bg-16-961-2019, 2019.