the Creative Commons Attribution 4.0 License.
the Creative Commons Attribution 4.0 License.
 | 13 Dec 2019
The unprecedented 2017–2018 stratospheric smoke event: decay phase and aerosol properties observed with the EARLINET
Albert Ansmann
Kevin Ohneiser
Moritz Haarig
Ronny Engelmann
Dietrich Althausen
Ingrid Hanssen
Michael Gausa
Aleksander Pietruczuk
Artur Szkop
Iwona S. Stachlewska
Dongxiang Wang
Jens Reichardt
Annett Skupin
Ina Mattis
Thomas Trickl
Hannes Vogelmann
Francisco Navas-Guzmán
Alexander Haefele
Karen Acheson
Albert A. Ruth
Boyan Tatarov
Detlef Müller
Qiaoyun Hu
Thierry Podvin
Philippe Goloub
Igor Veselovskii
Christophe Pietras
Martial Haeffelin
Patrick Fréville
Michaël Sicard
Adolfo Comerón
Alfonso Javier Fernández García
Francisco Molero Menéndez
Carmen Córdoba-Jabonero
Juan Luis Guerrero-Rascado
Lucas Alados-Arboledas
Daniele Bortoli
Maria João Costa
Davide Dionisi
Gian Luigi Liberti
Xuan Wang
Alessia Sannino
Nikolaos Papagiannopoulos
Antonella Boselli
Lucia Mona
Giuseppe D'Amico
Salvatore Romano
Maria Rita Perrone
Livio Belegante
Doina Nicolae
Ivan Grigorov
Anna Gialitaki
Vassilis Amiridis
Ourania Soupiona
Alexandros Papayannis
Rodanthi-Elisaveth Mamouri
Argyro Nisantzi
Birgit Heese
Julian Hofer
Yoav Y. Schechner
Ulla Wandinger
Gelsomina Pappalardo
Six months of stratospheric aerosol observations with the European Aerosol Research Lidar Network (EARLINET) from August 2017 to January 2018 are presented. The decay phase of an unprecedented, record-breaking stratospheric perturbation caused by wildfire smoke is reported and discussed in terms of geometrical, optical, and microphysical aerosol properties. Enormous amounts of smoke were injected into the upper troposphere and lower stratosphere over fire areas in western Canada on 12 August 2017 during strong thunderstorm–pyrocumulonimbus activity. The stratospheric fire plumes spread over the entire Northern Hemisphere in the following weeks and months. Twenty-eight European lidar stations from northern Norway to southern Portugal and the eastern Mediterranean monitored the strong stratospheric perturbation on a continental scale. The main smoke layer (over central, western, southern, and eastern Europe) was found at heights between 15 and 20 km since September 2017 (about 2 weeks after entering the stratosphere). Thin layers of smoke were detected at heights of up to 22–23 km. The stratospheric aerosol optical thickness at 532 nm decreased from values > 0.25 on 21–23 August 2017 to 0.005–0.03 until 5–10 September and was mainly 0.003–0.004 from October to December 2017 and thus was still significantly above the stratospheric background (0.001–0.002). Stratospheric particle extinction coefficients (532 nm) were as high as 50–200 Mm−1 until the beginning of September and on the order of 1 Mm−1 (0.5–5 Mm−1) from October 2017 until the end of January 2018. The corresponding layer mean particle mass concentration was on the order of 0.05–0.5 µg m−3 over these months. Soot particles (light-absorbing carbonaceous particles) are efficient ice-nucleating particles (INPs) at upper tropospheric (cirrus) temperatures and available to influence cirrus formation when entering the tropopause from above. We estimated INP concentrations of 50–500 L−1 until the first days in September and afterwards 5–50 L−1 until the end of the year 2017 in the lower stratosphere for typical cirrus formation temperatures of −55 ∘C and an ice supersaturation level of 1.15. The measured profiles of the particle linear depolarization ratio indicated a predominance of nonspherical smoke particles. The 532 nm depolarization ratio decreased slowly with time in the main smoke layer from values of 0.15–0.25 (August–September) to values of 0.05–0.10 (October–November) and < 0.05 (December–January). The decrease of the depolarization ratio is consistent with aging of the smoke particles, growing of a coating around the solid black carbon core (aggregates), and thus change of the shape towards a spherical form. We found ascending aerosol layer features over the most southern European stations, especially over the eastern Mediterranean at 32–35∘ N, that ascended from heights of about 18–19 to 22–23 km from the beginning of October to the beginning of December 2017 (about 2 km per month). We discuss several transport and lifting mechanisms that may have had an impact on the found aerosol layering structures.
- Article
(2918 KB) - Full-text XML
- BibTeX
- EndNote


Record-breaking wildfire activity in British Columbia during the summer of 2017 coupled with rather favorable weather conditions on 12 August 2017 triggered the evolution of five major thunderstorms over western Canada in the afternoon of this day (Peterson et al., 2018). Exceptionally strong and well-organized pyrocumulonimbus (pyroCb) clusters (Fromm et al., 2010; Peterson et al., 2017) developed over the fire areas and lifted enormous amounts of fire smoke into the upper troposphere and lower stratosphere (UTLS) (Khaykin et al., 2018; Peterson et al., 2018; Ansmann et al., 2018; Hu et al., 2019). Within pyroCb clusters the upward transport takes usually less than 1 h from the ground to the tropopause level (Fromm et al., 2000; Fromm and Servranckx, 2003; Rosenfeld et al., 2007). Many of the smoke particles may have served as cloud condensation nuclei (CCN) and ice-nucleating particles (INPs), but the number of smoke particles was so large that most of them were just lifted as interstitial aerosol to the UTLS region. The particles apparently reached the stratosphere as pure soot particles. According to Petzold et al. (2013), soot particles are light-absorbing carbonaceous particles formed from incomplete combustion. They had a nonspherical shape after 7–10 d of travel towards Europe (Haarig et al., 2018; Hu et al., 2019) and even after months as will be shown here. Self-lifting effects caused by sunlight absorption and warming of the ambient air (Boers et al., 2010; Siddaway and Petelina, 2011; de Laat et al., 2012) then led to a further significant ascent of the soot-containing layers. The aerosol optical thickness (AOT) in the UTLS region must have exceeded values of 2–3 at 500 nm wavelength so that strong absorption in the visible spectrum and warming of the smoke layers occurred and enabled the fire smoke plumes to ascend by about 2–3 km d−1 during the first days after injection, as was observed with the spaceborne lidar aboard CALIPSO (Cloud-Aerosol Lidar and Infrared Pathfinder Satellite Observation) (Khaykin et al., 2018).
Peterson et al. (2018) and Yu et al. (2019) discussed the strength of this stratospheric smoke event based on spaceborne lidar observations and passive remote sensing and concluded that the pyroCb-driven aerosol injection into the UTLS was comparable with a moderate volcanic eruption, characterized by a volcanic explosivity index of 3–4. The 12 August 2017 event, denoted as the Pacific Northwest Event by Peterson et al. (2018), injected 0.1–0.3 Tg of total aerosol particle mass into the lower stratosphere. However, such mass comparisons do not provide an adequate description of the difference regarding the impact on atmospheric processes. Volcanic and smoke particles show rather different chemical, physical, and morphological properties. In contrast to liquid, spherical, less light-absorbing sulfuric acid droplets of volcanic origin, stratospheric smoke particles from the wildfires in 2017 were observed to be nonspherical (Haarig et al., 2018; Hu et al., 2019) and probably consisted of a solid core (black carbon (BC) aggregate) with nonspherical organic coating (Yu et al., 2019). In contrast to volcanic sulfuric acid particles, soot particles significantly absorb solar radiation (a direct effect on climate) and also influence the evolution of cirrus clouds by serving as INPs in heterogeneous ice nucleation processes (an indirect effect) (Hoose and Möhler, 2012; Kanji et al., 2017; Ullrich et al., 2017), unlike liquid sulfuric acid droplets which influence cirrus occurrence and evolution via homogeneous ice nucleation (Jensen and Toon, 1992; Sassen et al., 1995; Liu and Penner, 2002; Campbell et al., 2012). Homogeneous nucleation is the process in which droplets freeze (and no solid particle phase is involved). In the case of heterogeneous nucleation at cirrus level (via deposition nucleation at, e.g., −50 to −60 ∘C), a solid particle is needed to initiate the formation of an ice crystal, but the ice nucleation process can take place at much lower ice supersaturation as needed to initiate homogeneous freezing.
After injection on 12 August 2012, the smoke traveled to northern Canada and then through the jet stream eastward, crossed the northern Atlantic, and reached Europe on 21–23 August 2017 (Ansmann et al., 2018; Haarig et al., 2018; Zuev et al., 2019; Hu et al., 2019). Compared to the maximum stratospheric perturbation over Europe after the eruption of Mt. Pinatubo in 1991 (Ansmann et al., 1997), 20 times higher particle extinction coefficients were observed in the lower stratosphere over Germany on 22 August 2017 (Ansmann et al., 2018). The smoke spread over the entire Northern Hemisphere during the following weeks, mostly at heights below 20 km with the dominating westerly air flow, and even reached the tropics via the dynamical transport around the Asian monsoon anticyclone (Kloss et al., 2019). The strong stratospheric perturbation diminished slowly from September 2017 to May–June 2018 according to SAGE III-ISS (Stratospheric Aerosol and Gas Experiment III) mounted aboard the International Space Station) and OMPS-LP (Ozone Mapping Profiler Suite Limb Profiler on board Suomi National Polar-orbiting Partnership, Suomi NPP) observations (Kloss et al., 2019; Yu et al., 2019). A fraction of the smoke particles ascended to heights of 20–23 km and enriched the natural soot particle reservoir located between heights of 20 and 30 km (Renard et al., 2008). The stratospheric smoke influenced radiative transfer (Ditas et al., 2018; Kloss et al., 2019; Yu et al., 2019), chemical processes (Yu et al., 2019), and, probably, cirrus evolution after entering the upper troposphere via gravitational settling and other processes, causing an effective downward transport.
This historical event of a strong and long-lasting stratospheric aerosol perturbation was observed all over Europe with ground-based lidar systems of the European Aerosol Research Lidar Network (EARLINET) (Pappalardo et al., 2014). The arrival of the first optically dense smoke plumes and layers over France was documented by Khaykin et al. (2018) and Hu et al. (2019), and the arrival over central Europe was documented in the accompanying articles of Ansmann et al. (2018) and Haarig et al. (2018). As a highlight, the smoke particles could be characterized regarding size distribution and shape properties at Leipzig (Germany) and Lille (France) by means of triple-wavelength polarization lidar observations (Haarig et al., 2018; Hu et al., 2019).
In this study, we present the observations from August 2017 to the end of January 2018 and discuss the decay phase and the changing optical and microphysical properties of the smoke particles over the almost 6 month period. A strong role in the long-lasting 2017–2018 monitoring effort was played by the subnet PollyNET (NETwork of POrtabLe Lidar sYstems) (Baars et al., 2016), which consists of continuously running multiwavelength polarization/Raman lidars. The smoke layers were well-detectable even 6 months after the injection, until the end of January 2018. We will discuss the stratospheric perturbation in terms of layer base and top heights, AOT and column mass load, vertically averaged extinction coefficients and soot mass concentrations, and even in terms of INP concentration estimates.
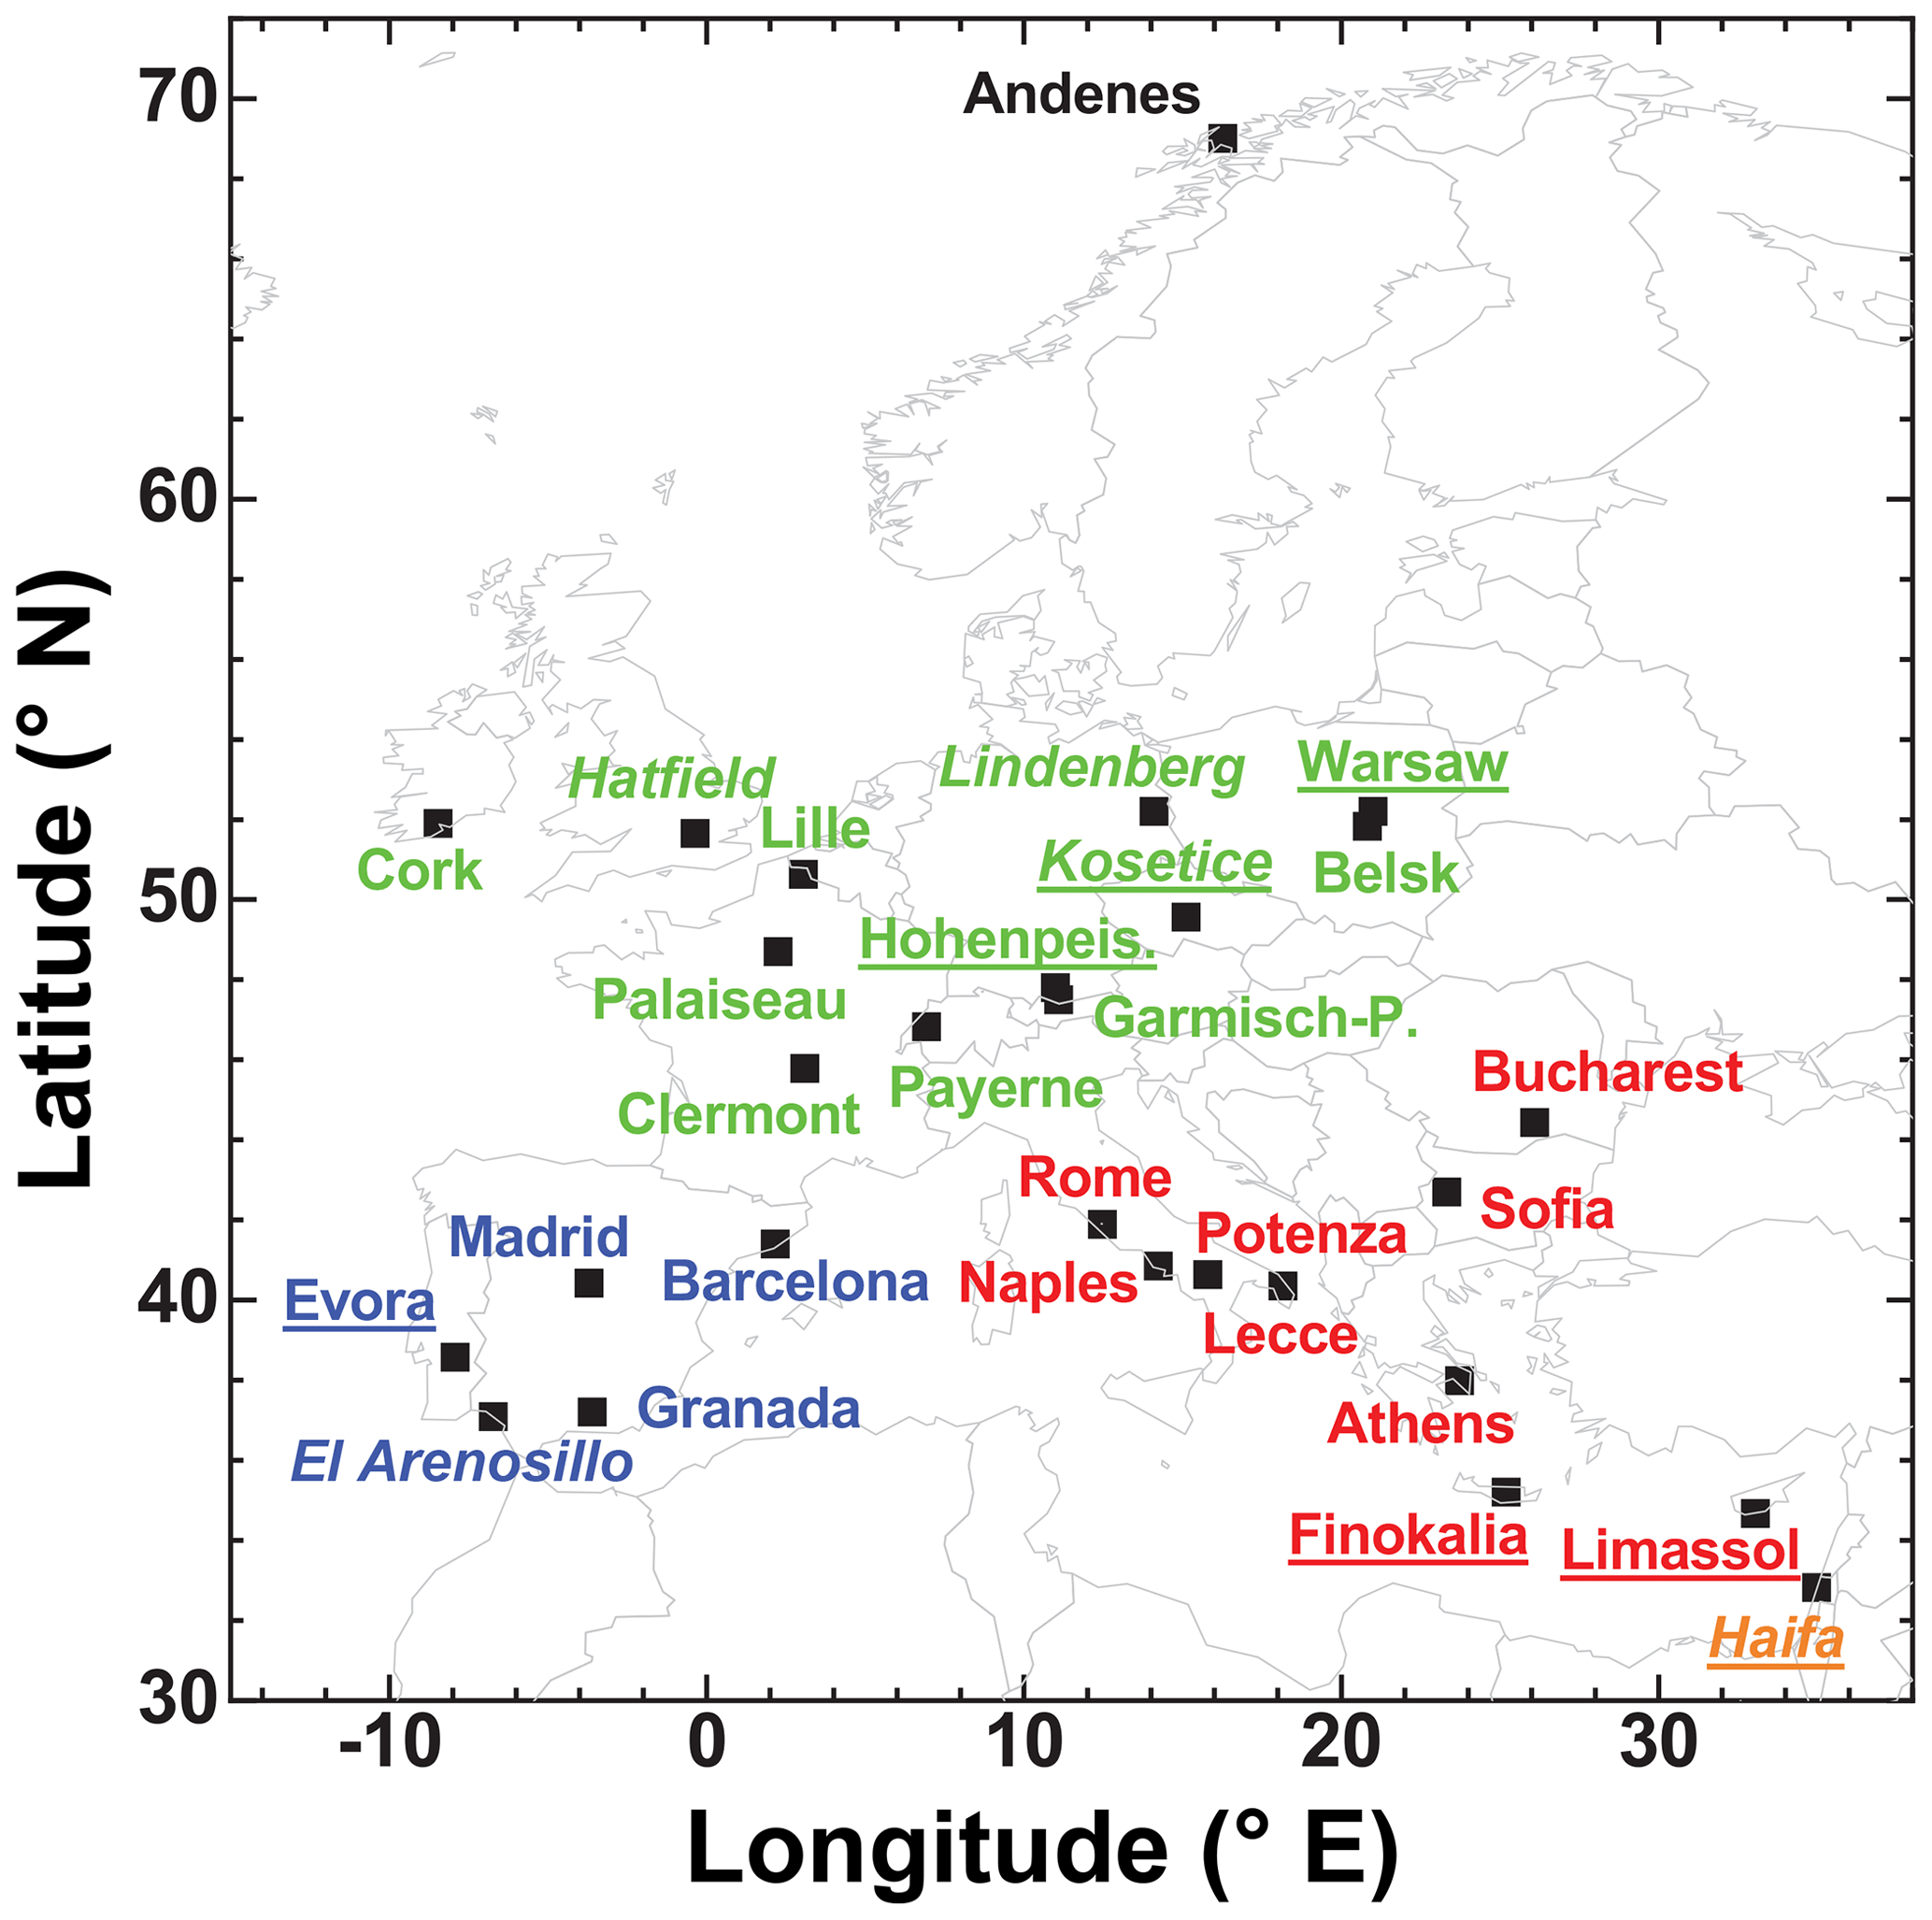
Figure 1Lidar network of 23 ACTRIS–EARLINET stations and five non-EARLINET sites (in italics). This network observed stratospheric smoke layers from August 2017 to January 2018. Northern (black), central and western (green), southwestern (blue), southeastern European (red), and Israel (orange) lidar sites are distinguished. Polly stations are underlined.
Twenty-three EARLINET stations from northern Norway (at 69∘ N) to Cyprus (34.5∘ N) (Pappalardo et al., 2014) contributed to the study. The lidar stations are shown in Fig. 1 together with five additional non-EARLINET lidar stations at Hatfield (UK), Lindenberg (Germany), El Arenosillo (Spain), Košetice (Czech Republic), and Haifa (Israel). These non-EARLINET stations are closely collaborating with the EARLINET team under the umbrella of the European infrastructure project ACTRIS (Aerosols, Clouds, and Trace gases Research Infrastructure, https://www.actris.eu/, last access: 10 October 2019), which is a pan-European initiative consolidating actions amongst European partners producing high-quality observations of aerosols, clouds, and trace gases. ACTRIS is composed of observing stations, exploratory platforms, instrument calibration centers, and a data center, and it aims to support atmospheric and environmental science by providing a platform for researchers to combine their efforts more effectively. Different lidar systems are operated at the EARLINET stations but the quality assurance/quality control (QA/QC) programs developed and run within ACTRIS RI (research infrastructure) allow continuous control of the lidar operation and data. Among the considered 28 stations, there are seven continuously measuring Polly instruments (Althausen et al., 2009; Engelmann et al., 2016; Baars et al., 2016) operated at Košetice, Limassol (Cyprus), Haifa, Warsaw (Poland), Hohenpeissenberg (Germany), Évora (Portugal), and Finokalia on Crete (Greece).
Most of the EARLINET aerosol lidars are not designed for stratospheric aerosol observations. They are optimized for tropospheric measurements (e.g., boundary layer (BL) aerosols, diurnal cycle of BL conditions, or lofted dust plumes in the free troposphere). The Polly instruments have, e.g., a 30 cm telescope and a small laser emitting light pulses of 110 mJ at 532 nm at a repetition rate of 20 Hz. In contrast, the big Leipzig EARLINET lidar (Mattis et al., 2010; Haarig et al., 2018; Jimenez et al., 2019) has an 80 cm telescope, 500 mJ per laser pulse at 532 nm, and a repetition rate of 30 Hz. This lidar is highly capable of monitoring stratospheric aerosol even at background conditions (Mattis et al., 2010; Finger, 2011). Most measurements presented in Sect. 3 are performed with the Polly instruments. Long averaging times (of typically 3–6 h during nighttime hours) and vertical smoothing lengths of several 100 m had to be applied in the data analysis. An example is shown in Fig. 2. Fortunately, aerosol layering structures in the stratosphere are usually long-lasting, coherent, and persistent over many hours and sometimes even over days so that long temporal averaging and signal smoothing will not remove essential information about the observed stratospheric smoke layers.
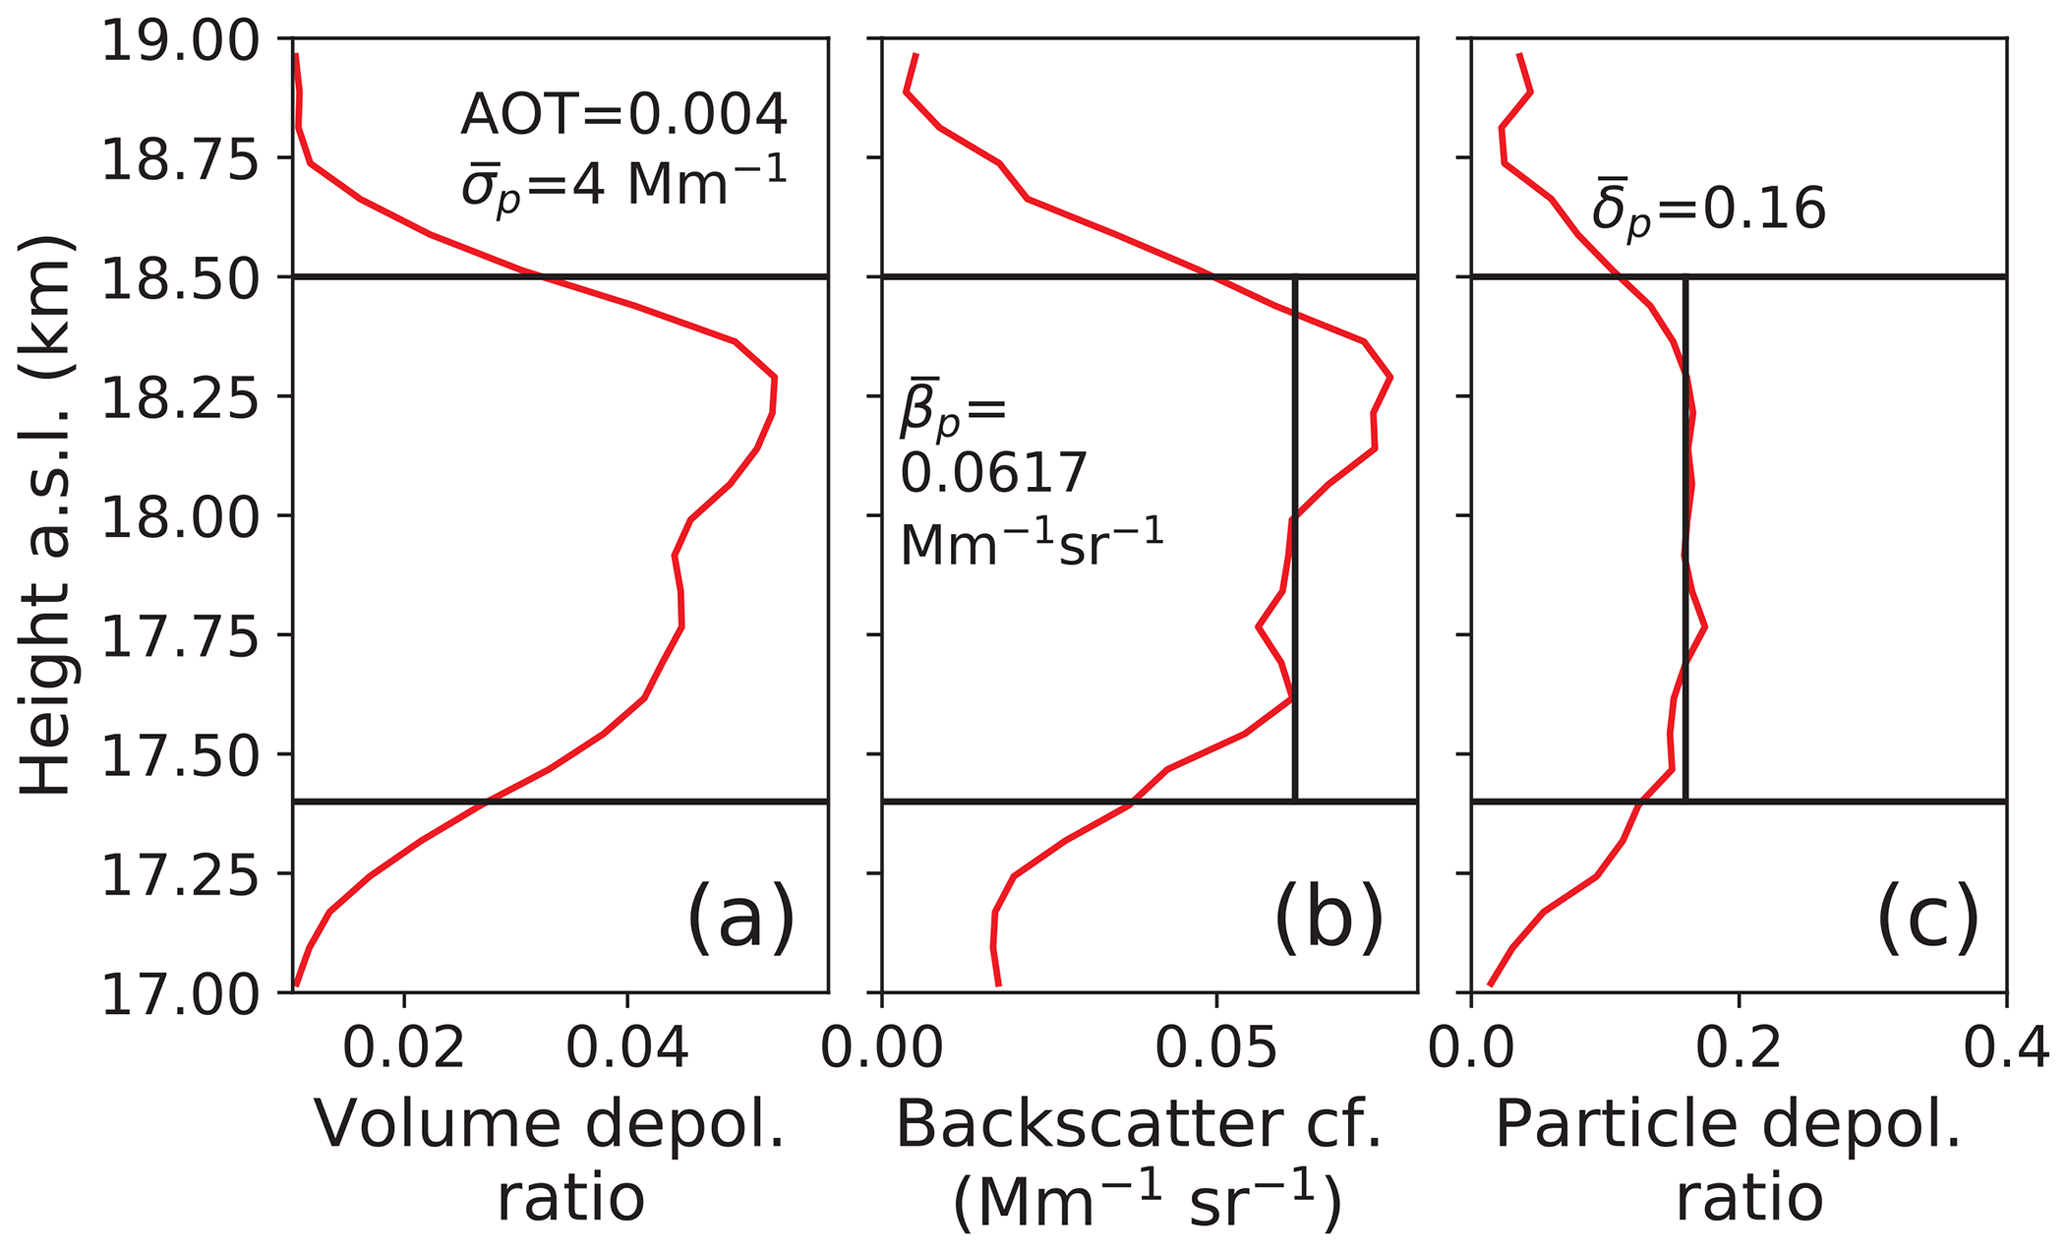
Figure 2Analysis of a Polly measurement at Limassol, Cyprus, on 9 September 2017. The 532 nm backscatter and depolarization ratio profiles are computed from 6 h mean lidar return signal profiles (18:00–24:00 UTC). Vertical signal smoothing with a window length of 367.5 m is applied. The volume depolarization ratio in (a) and the particle backscatter coefficient in (b) were used to identify the smoke layer. The shown smoke layer base and top heights (horizontal lines) are mean values for the observation period, estimated from subsequent 60–90 min mean depolarization ratio profiles. The particle depolarization ratio in (c) is the one for smoke (after the correction for Rayleigh depolarization contributions). Values for the vertically averaged particle extinction coefficient (for the column from zbot and ztop, assuming a lidar ratio of 65 sr) and 532 nm AOT, mean backscatter coefficient , and mean particle linear depolarization ratio are stated in the three panels.
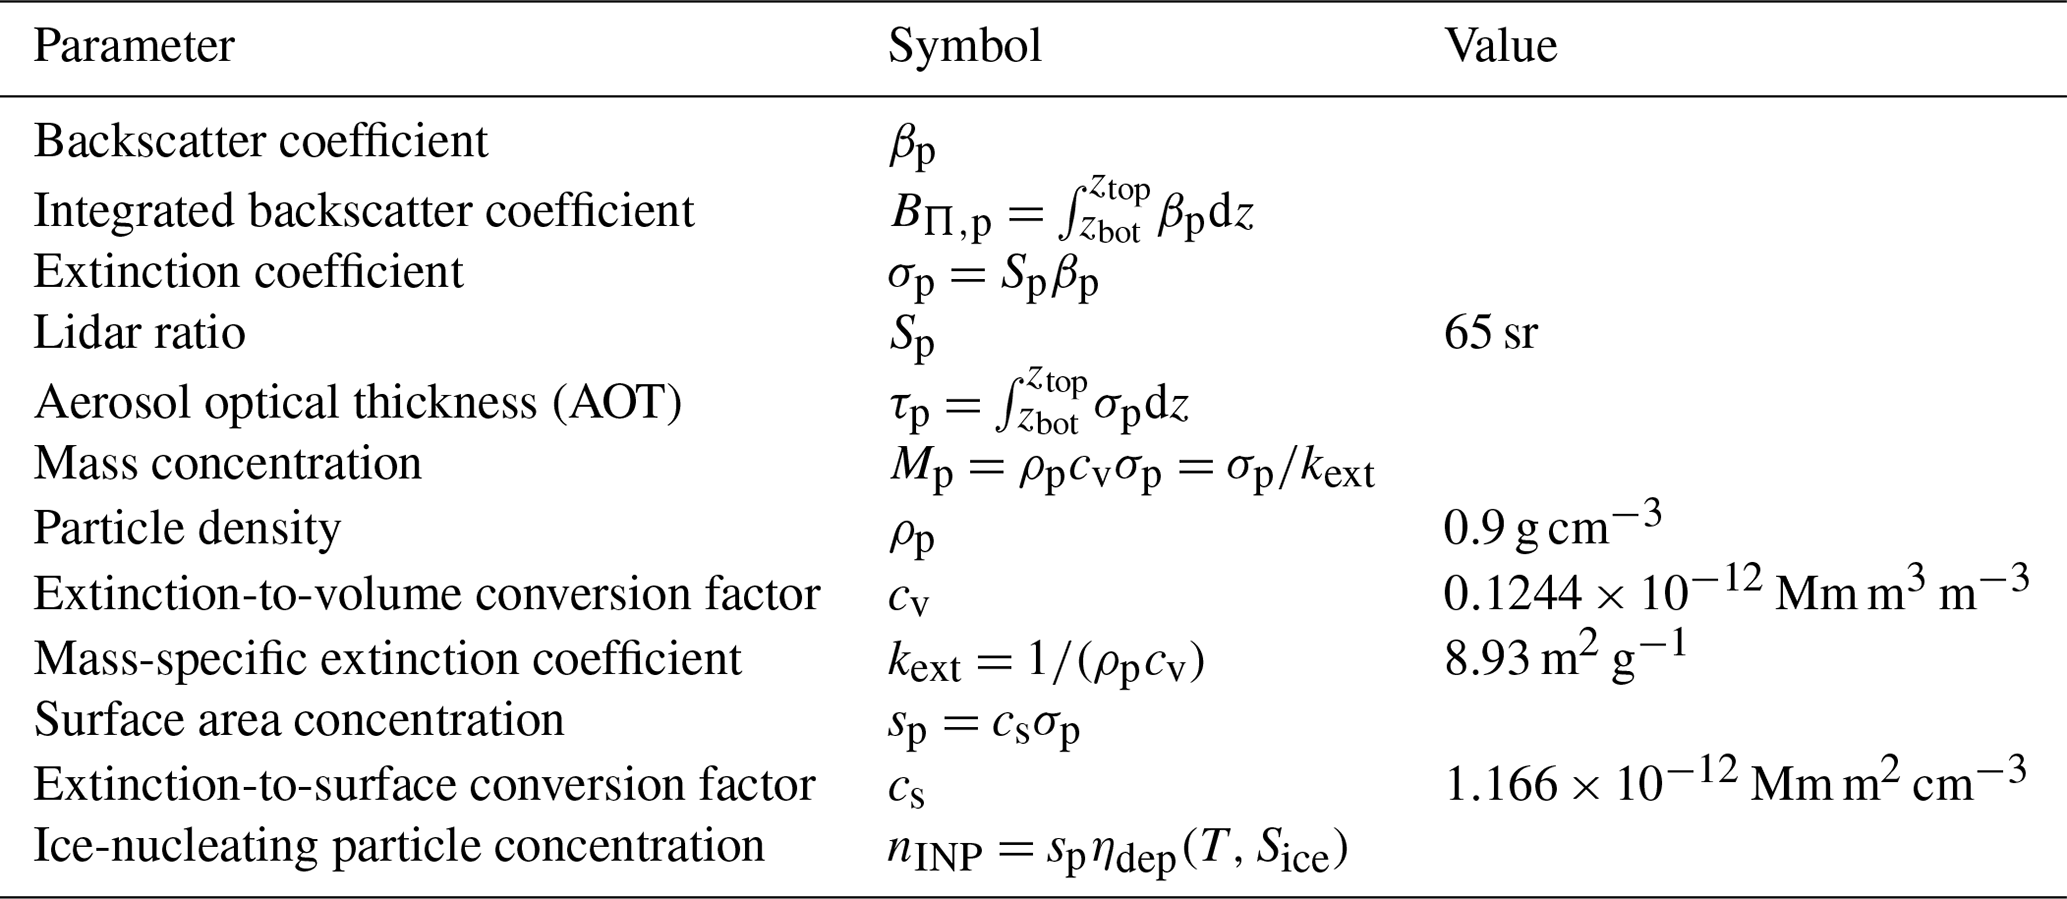
Table 1Lidar-derived smoke (soot) particle optical and microphysical properties and retrieval input parameters for 532 nm. zbot and ztop are the layer base and top height of the detected stratospheric smoke layer, respectively. The values for the lidar ratio Sp and the two conversion factors cv and cs are taken from Haarig et al. (2018), and the estimate of particle density ρp is based on Rissler et al. (2013). For detailed explanations see text.
In Sect. 3, quality-assured lidar observations are presented and discussed, mostly based on the retrieval of particle backscatter coefficients and particle linear depolarization ratio at 532 nm. Details of the lidar data analysis can be found in D'Amico et al. (2015, 2016), Mattis et al. (2016), Freudenthaler (2016), Baars et al. (2016), and Mamouri and Ansmann (2016, 2017). The EARLINET observations are taken from the EARLINET database (EARLINET, 2019) and selected by careful inspection of the involved lidar teams. The Polly data analysis was performed by following the EARLINET data analysis protocols and procedures. The Raman lidar method (Baars et al., 2016) was used to compute the particle backscatter coefficient from the ratio of elastic backscatter to the respective nitrogen Raman signal. To compute and correct for molecular backscatter and extinction contributions to the lidar backscatter signals, GDAS (Global Data Assimilation System) air temperature and pressure data were partly used in the Polly data analysis (GDAS, 2019). However, most days were analyzed by assuming standard atmospheric conditions in the stratosphere. Significant differences to the results obtained with GDAS data were not observed. The relative uncertainties are on the order of 5 %–10 % in the case of the particle backscatter coefficient and AOT and < 5 % for the particle depolarization ratio.
Except the Lindenberg and Payerne (Switzerland) lidars, all participating stations provided height profiles of the particle backscatter coefficient βp at 532 nm. Several stations could successfully measure the 532 nm volume (i.e., Rayleigh + particle) linear depolarization ratio and the respective particle depolarization ratio in the stratosphere. The powerful lidar system at the Meteorological Observatory Lindenberg of the German Weather Service provided the optical properties at 355 nm. The height profiles of the particle backscatter coefficient were used to determine base height zbot and top height ztop of the detected stratospheric smoke layers. In the next step, the layer mean and column-integrated smoke optical properties were calculated.
The relative uncertainties in the lidar products shown in Sect. 3 are on the order of 10 %–30 % (particle backscatter coefficients), 20 %–50 % (particle extinction estimates and AOT estimates), and 10 %–30 % for the presented smoke layer mean values for the particle depolarization ratio. The smoke layer geometrical properties (base and top heights) may have an uncertainty on the order of 50–150 m. The larger uncertainties describe the data quality for the observational period from October 2017 to January 2018. Signal noise is the main contributor to the large uncertainties.
Figure 2 presents an example of a complete Polly data analysis. A stratospheric smoke observation taken at Limassol, Cyprus, from 18:00 to 24:00 UTC on 9 September 2017, is shown. Height–time displays of the range-corrected signals indicated almost constant backscatter conditions over the 6 h period. The 6 h mean lidar return signals were vertically smoothed with a gliding averaging window length of 367.5 m before calculating the particle optical properties as a function of height above sea level (a.s.l.). The volume linear depolarization ratio at 532 nm in Fig. 2a, simply obtained from the calibrated cross-polarized to co-polarized signal ratio, enabled us to unambiguously identify the smoke layer in most cases. By means of the profiles of the volume depolarization ratio and the particle backscatter coefficient (in Fig. 2b), the particle linear depolarization ratio δp at 532 nm in Fig. 2c was calculated. When the particle depolarization ratio exceeds a threshold value of, e.g., 0.02, nonspherical particles are detected (Haarig et al., 2018). The depolarization ratio information is used to determine bottom and top height of each detected smoke layer. The indicated base and top heights, zbot and ztop, of the smoke layer in Fig. 2c are the mean values obtained from several 60–90 min mean backscatter profiles measured from 18:00 to 24:00 UTC. Smooth (instead of sharp) layer boundaries are the result of vertical signal smoothing with a window length of 367.5 m.
Based on the profiles in Fig. 2, layer mean values of the particle backscatter coefficient and particle linear depolarization ratio were computed (as given in Fig. 2). By assuming an appropriate smoke extinction-to-backscatter ratio (lidar ratio) of 65 sr at 532 nm (Haarig et al., 2018), we obtained the aerosol optical thickness (AOT) τp and the vertically averaged particle extinction coefficient also given in Fig. 2. The relative uncertainties in the layer mean optical properties are on the order of 20 %–50 %. An overview of all lidar products together with the needed input parameter assumptions is given in Table 1. The listed input parameters were used throughout the investigated period from August 2017 to January 2018 and applied to all EARLINET data shown below.
By means of the computed optical properties, the microphysical properties, i.e., the soot mass concentration Mp and the ice-nucleating particle concentration nINP, were estimated. Here, conversion factors such as the soot particle extinction-to-volume conversion factor cv and extinction-to-surface conversion factor cs (Mamouri and Ansmann, 2016, 2017) and the density ρp of the soot particles or the mass-specific extinction coefficient kext are required. From the measured smoke optical properties and the derived microphysical properties (from multiwavelength lidar inversions), presented by Haarig et al. (2018) for the optically dense smoke layer observed over Leipzig, Germany, on 22 August 2017, the extinction-to-volume and extinction-to-surface conversion factors cv and cs in Table 1 were obtained. The soot particle density is highly variable and can vary from 0.2 to 2 g cm−3 (Rissler et al., 2013). As a compromise, we selected arbitrarily a value of 0.9 g cm−3 in our study. Similarly, the mass-specific extinction coefficient can vary from about 3 to > 15 m2 g−1 (Smith et al., 2015; Forestieri et al., 2018). Thus, the mass concentration estimation is highly uncertain (by a factor of 2–3). The INP concentration nINP (see Table 1) is computed by using an INP parameterization developed for heterogeneous ice nucleation on soot particles via deposition nucleation (i.e., direct deposition of water vapor on the INPs) (Ullrich et al., 2017). Input aerosol parameter is the particle surface area sp. In addition, the atmospheric conditions (ambient temperature T and ice supersaturation Sice within the cirrus layer) are considered in the nINP calculation via the ηdep term (see Table 1). The INP efficacy of aerosol particles increases by an order of magnitude when the temperature decreases by 5 K and is thus highest at the tropopause level (the coldest point of the troposphere). This behavior is described by the ηdep term (Mamouri and Ansmann, 2016; Ullrich et al., 2017). The relative uncertainty of the entire INP retrieval is determined by the large uncertainty (a factor of 2–5) in the INP parameterization (Ullrich et al., 2017).
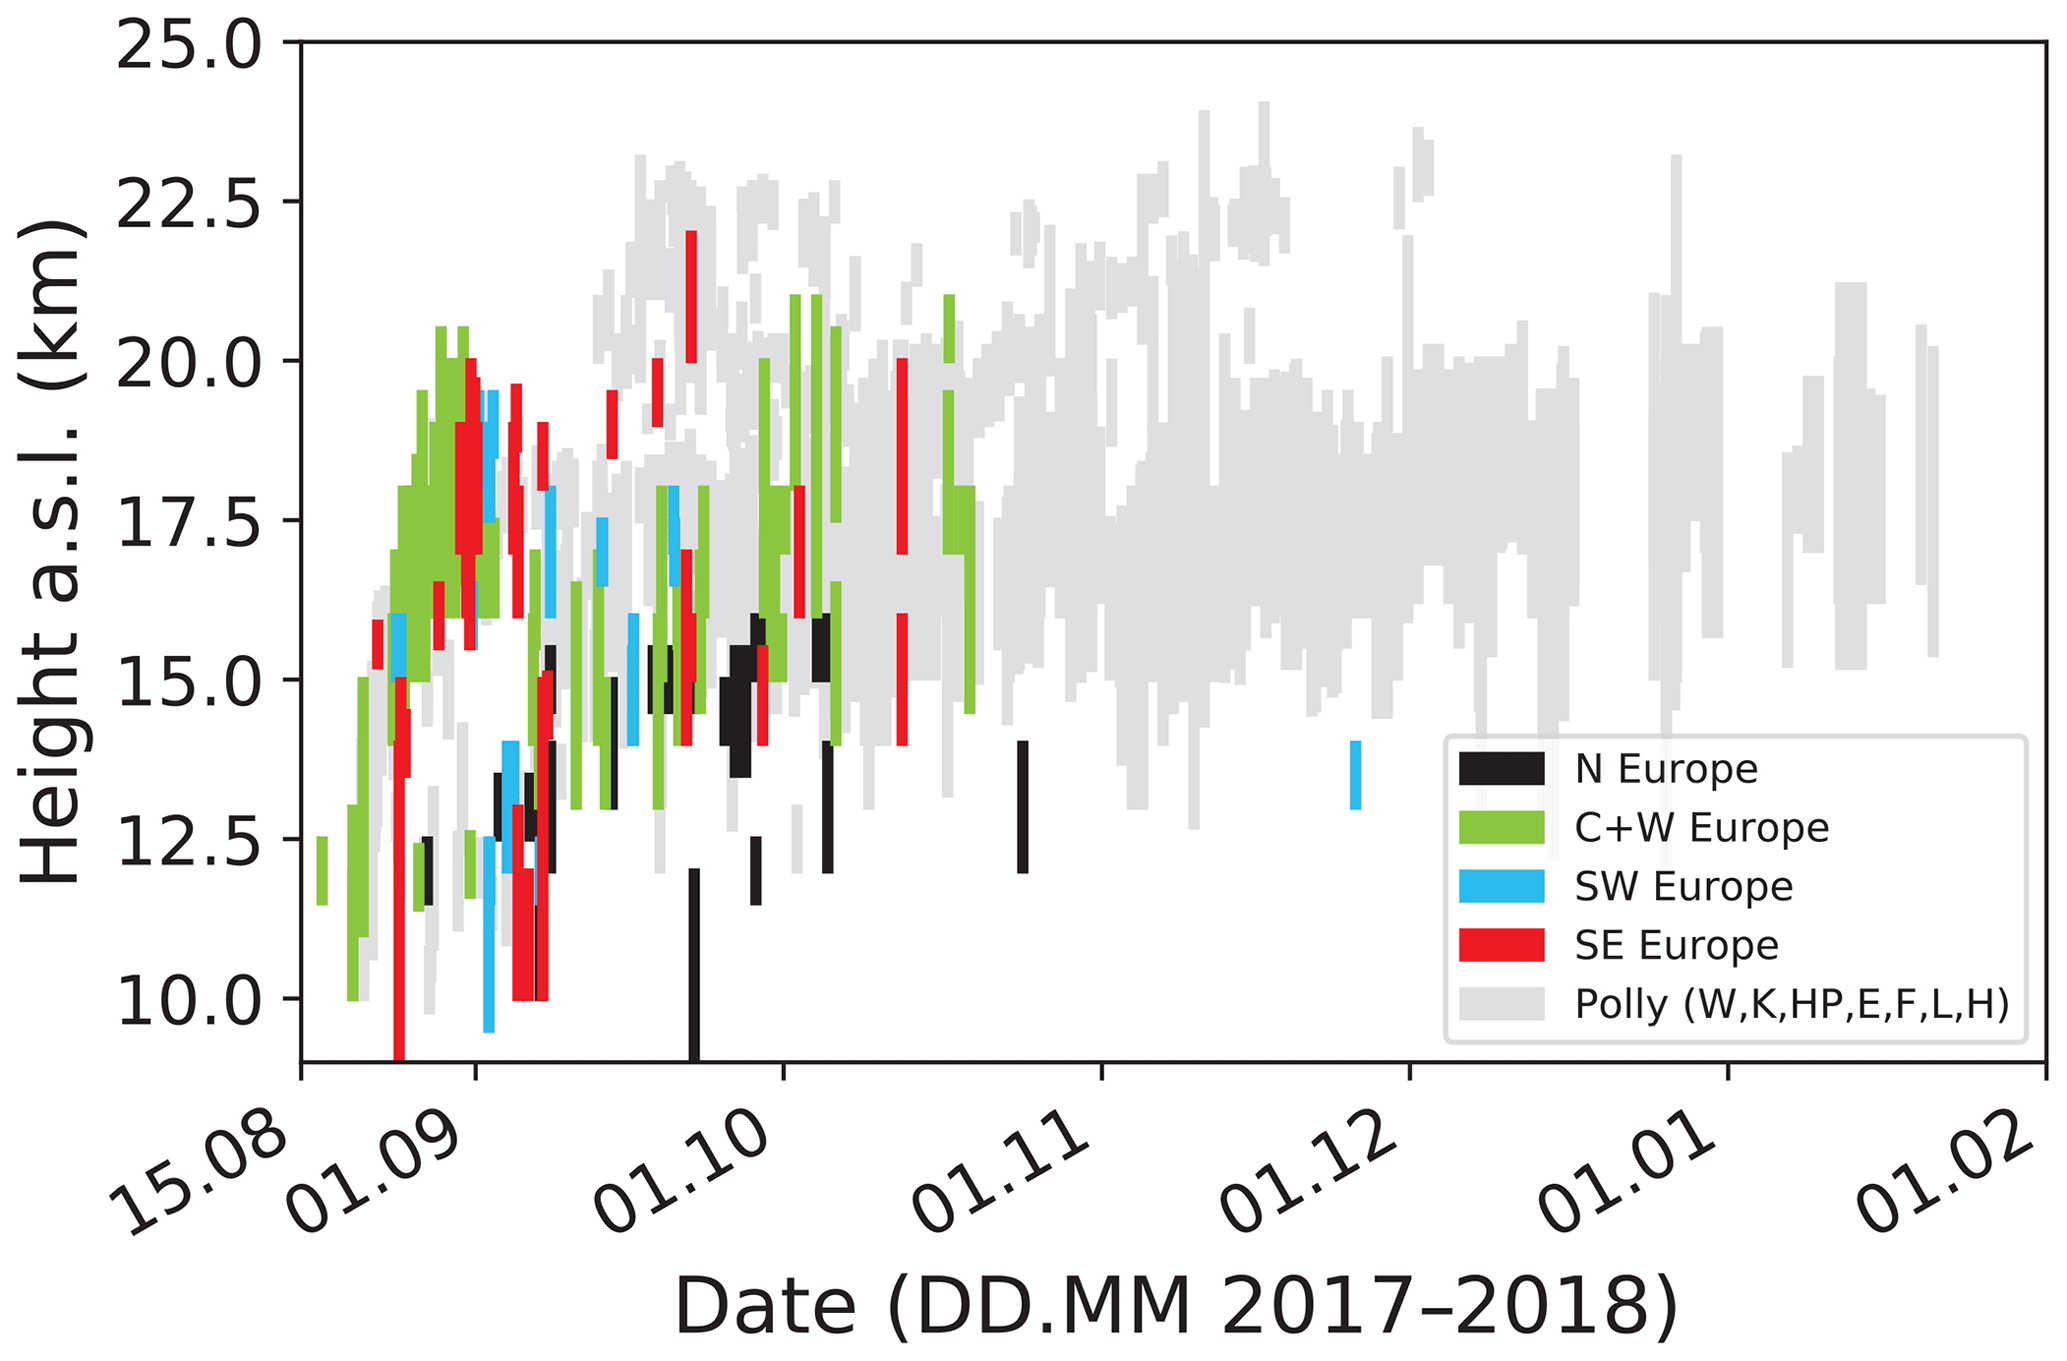
Figure 3Overview of the lidar network observations of stratospheric smoke from August 2017 to January 2018. Each observation is represented as one colored vertical line indicating the vertical extent from layer base to top (in height above sea level, a.s.l.). One observation per day and site is considered. The colors separate the different European regions of the EARLINET stations as defined in Fig. 1. Polly observations (collected at Évora, Hohenpeissenberg, Košetice, Warsaw, Finokalia, Limassol, and Haifa) are given here as grey background and are presented in Fig. 4.
3.1 Decay of the stratospheric perturbation
Figure 3 provides an overview of the stratospheric smoke observations conducted with the 28 lidar systems. We considered all observations above a height of 10 km (a.s.l.) during the first 4 weeks after injection (until 9 September 2017). Afterwards (since 10 September), only the layers clearly above the local tropopause are shown. Vertical lines represent individual observations (one per day and site) of the detected smoke layers from base to top. The observations were taken after sunset, and signal averaging time periods were at least 2 h, with only a few exceptions. We subdivided the EARLINET observations according to the colors used in Fig. 1 for northern Europe (black, Norway), central and western Europe (green), the Iberian Peninsula (blue, Spain and Portugal), and southeastern Europe (red, mainly central and eastern Mediterranean stations). The Polly observations will be presented in Fig. 4 and are given here as grey background lines.
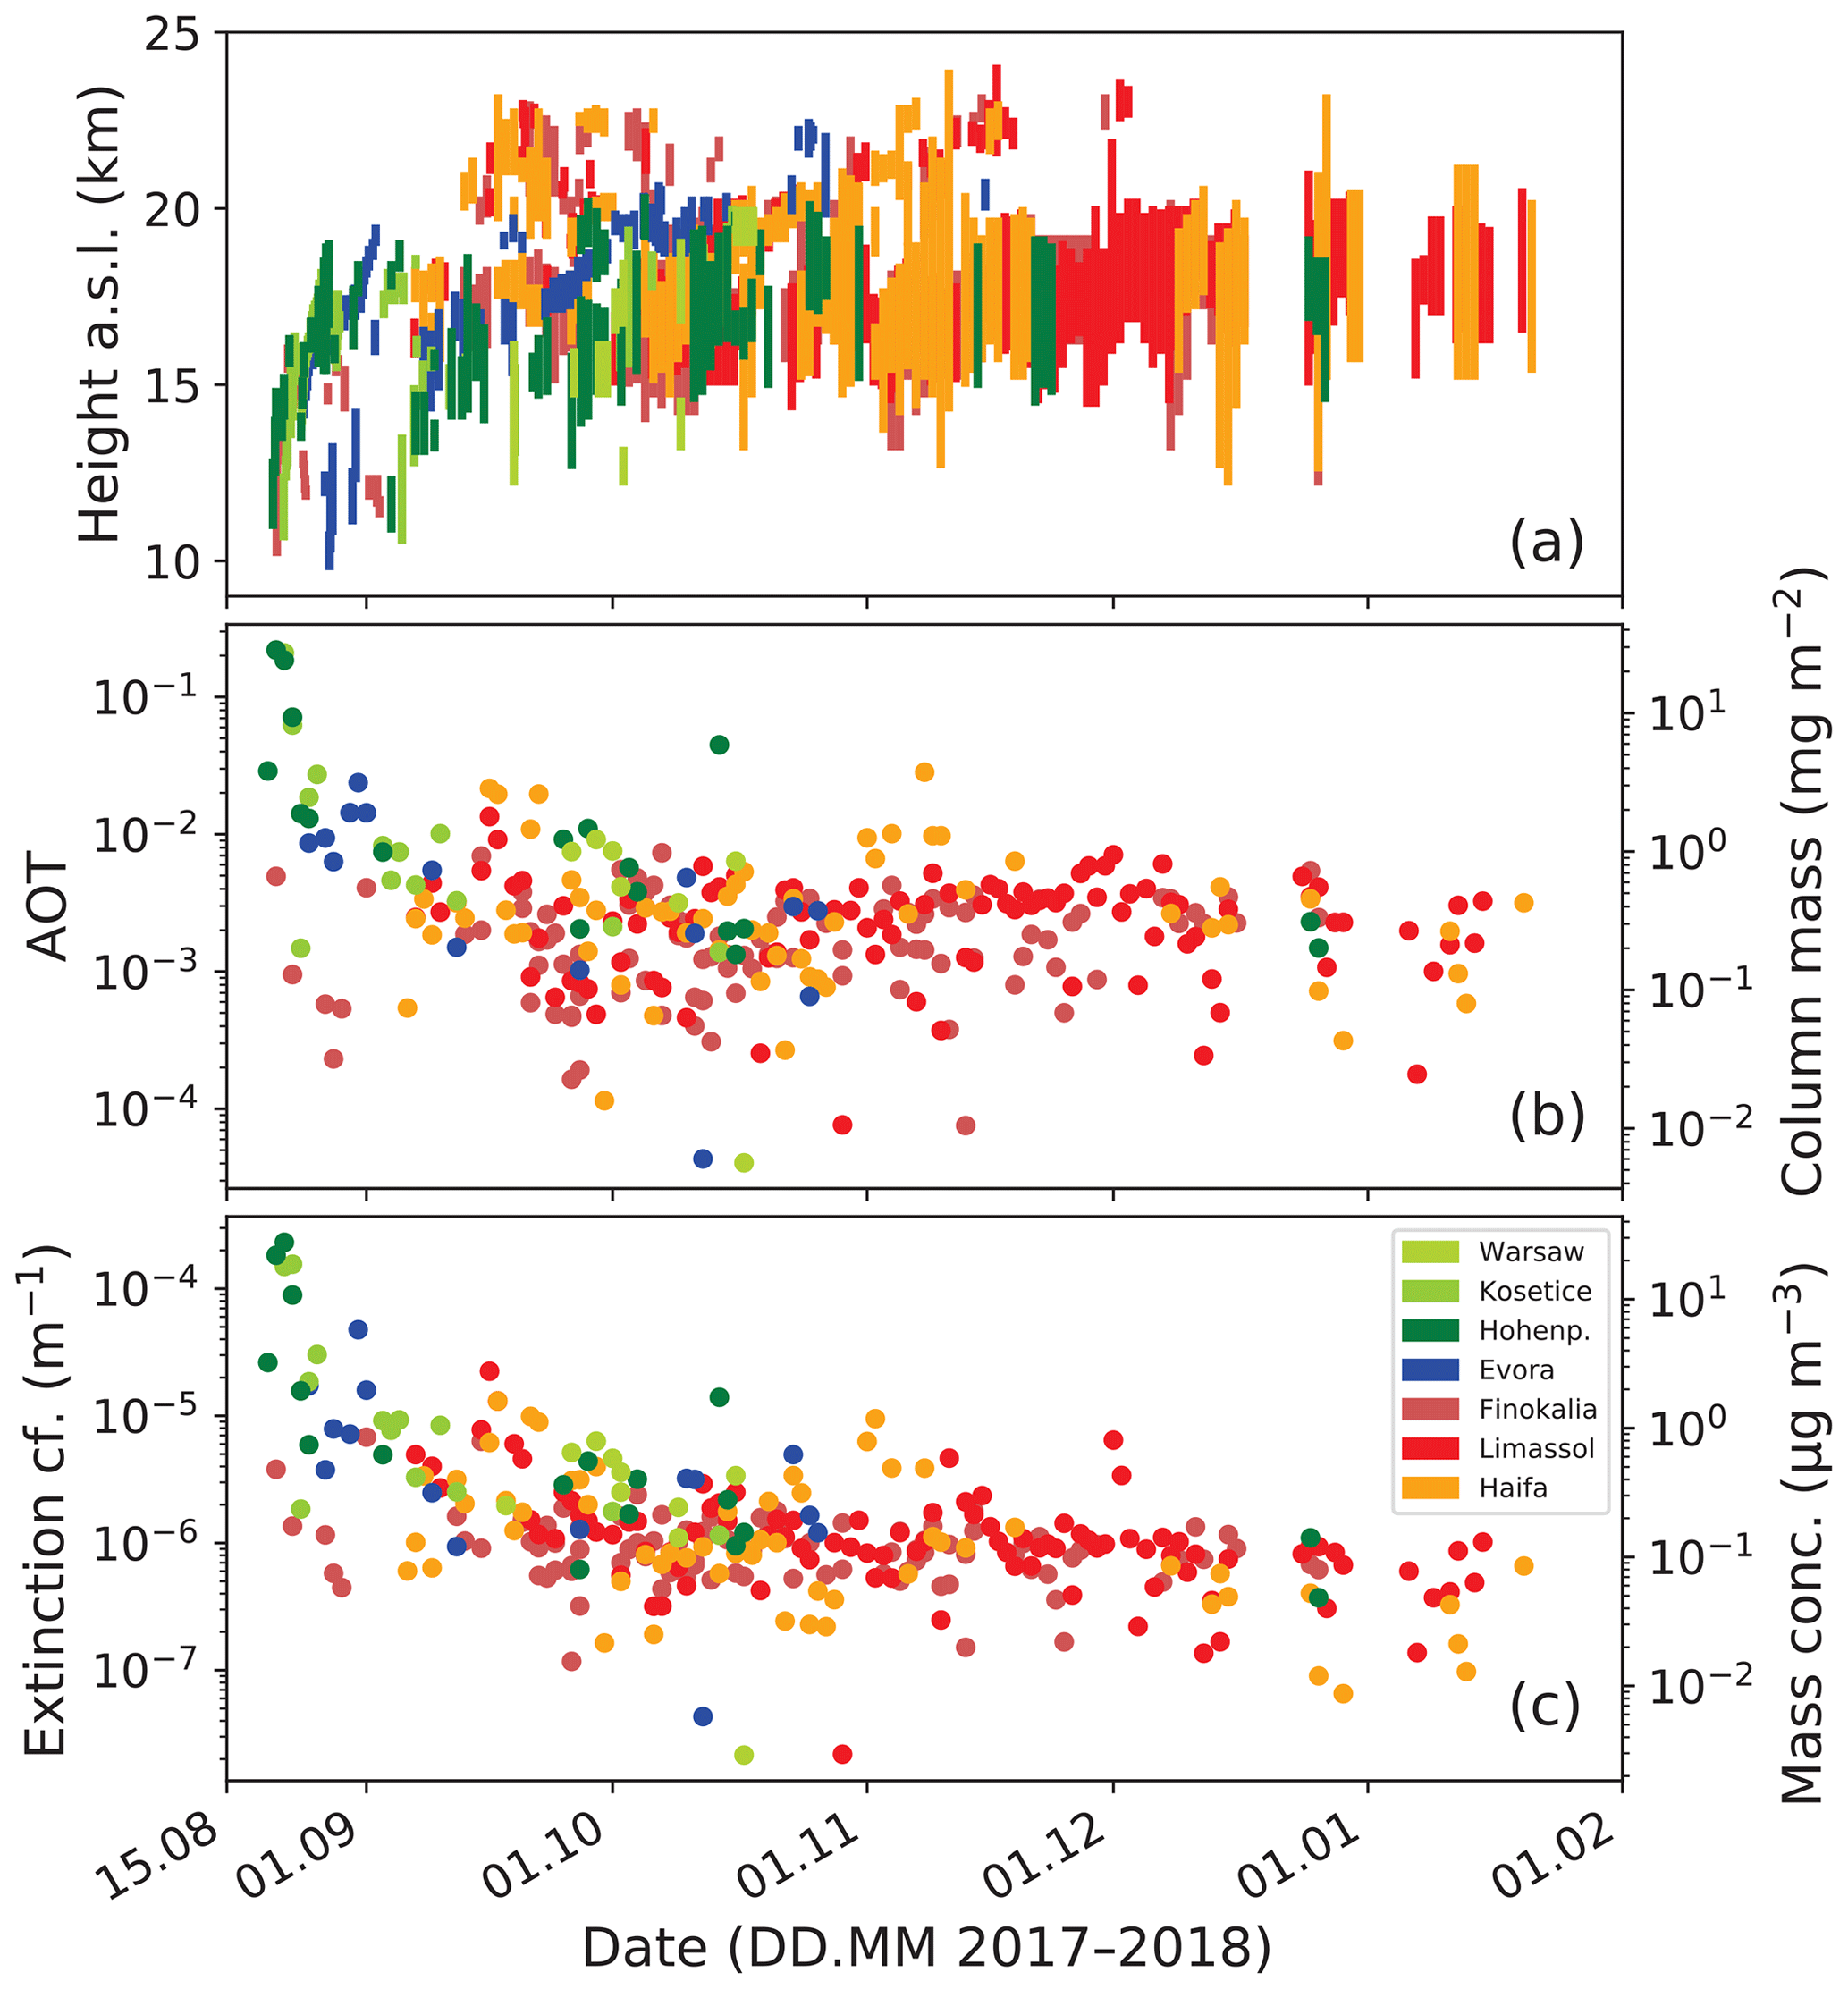
Figure 4(a) Overview of all Polly observations of the stratospheric smoke layer (from base to top as colored vertical lines). For each station, one nighttime observation per day is considered. (b) Corresponding smoke layer AOT at 532 nm and estimated column-integrated smoke particle mass concentration and (c) vertically averaged smoke particle extinction coefficient and corresponding mean particle mass concentration.
Smoke was frequently detected all over Europe until the end of October 2017 as the dense set of colored vertical lines indicates. Within a few weeks, the smoke spread over large parts of the Northern Hemisphere. This quick dispersion is corroborated by the lidar observations aboard the CALIPSO satellite (Kar et al., 2019) in August and September 2017. Based on atmospheric modeling and spaceborne extinction measurements (SAGE III-ISS), Yu et al. (2019) showed that the fire plumes reached the latitudes from 30 to 70∘ N within the first 2 weeks after the Pacific Northwest Event on 12 August 2017.
A fast spread over the Northern Hemisphere within 1 month was also reported by Fromm et al. (2008) after the Chisholm pyroCB-related stratospheric smoke event in 2001. The study was based on lidar observations at four stations in Europe, one lidar in Boulder (Colorado), and one in Hawaii. The aerosol lidars observed the meridional spread of smoke from 20 to 79∘ N.
In northern Norway (69∘ N), the 2017 smoke layer was observed below a height of 16 km, whereas over the central, western, and southern European stations (excluding here the Polly instruments), the smoke reached a height of 22 km. Also, the spaceborne lidar shows this height dependence in terms of zonal averages of the attenuated total-to-Rayleigh backscatter ratio (Kar et al., 2019). According to the ground-based lidar observations in Fig. 3 the layer depth was frequently 1–2.5 km and in some cases even more than 5 km.
The Polly observations in Fig. 4a collected at Évora (Portugal), the central European stations of Hohenpeissenberg (Germany), Košetice (Czech Republic), and Warsaw (Poland) and in the eastern Mediterranean (Finokalia on the Greek island of Crete, Limassol in Cyprus, and Haifa, Israel) also show that the layer top frequently exceeded 20 km (up to around 23 km) from mid-September 2017 until the end of the year. Similarly, Yu et al. (2019) found the maximum top height at 23 km by using the spaceborne SAGE III-ISS aerosol extinction observations. The main smoke layer extended from 15 to 20 km. The smoke was frequently detected over southwestern and central Europe in the beginning of the smoke period (August–September 2017) and then mostly over the eastern Mediterranean (October 2017 to January 2018). The data analysis was stopped at the end of January 2018 because no significant smoke layer was found anymore over Finokalia, Limassol, and Haifa during the following months. The results are again in agreement with the spaceborne lidar observations of the zonally averaged smoke optical properties and the detected latitudinal differences regarding occurrence, height, and vertical depth of the smoke layers in the months from September to November 2017 (Kar et al., 2019).
As shown in Fig. 4b, the stratospheric AOT at 532 nm decreased rapidly from values > 0.2 in August 2017 to values between 0.005 and 0.03 in the beginning of September 2017, and afterwards the AOT ranged from 0.002 (almost stratospheric background conditions) to 0.008 with most values between 0.003 and 0.004 (over Finokalia, Limassol, and Haifa; mid-September to December 2017). A lidar ratio of 65 sr was applied to the respective column-integrated particle backscatter coefficients, integrated over the vertical column from zbot to ztop (see Fig. 2), to obtain the AOT values. The AOT fluctuations are partly caused by the relatively strong impact of signal noise on the retrieval results. However, atmospheric variability also contributed to the observed fluctuations and to the respective vertically averaged extinction coefficients (mean backscatter coefficient for the vertical column from zbot to ztop multiplied with the soot lidar ratio of 65 sr) shown in Fig. 4c. We observed vertically averaged 532 nm particle extinction coefficients for the smoke layers as having values from 10 to 200 Mm−1 in August 2017, from 2 to 50 Mm−1 until 5 September 2017, from 1 to 10 Mm−1 until the end of September, and from 0.5 to 5 Mm−1 (accumulating around 1 Mm−1) until the end of January 2018.
Note that 532 nm AOT values around 0.004 indicate already typical stratospheric aerosol conditions for periods without major volcanic eruptions as discussed in Trickl et al. (2013) and in further articles reviewed and summarized in Ansmann et al. (2018). Based on 731 clear-sky EARLINET nighttime lidar observations at Leipzig from January 2000 to June 2008, we conclude, however, that the minimum stratospheric AOT is on the order of 0.001 to 0.002 for the layer from 1 km above the tropopause to the top of the identified aerosol structures (< 30 km in height) (Finger, 2011). This is in accordance with the long-term observations presented by Trickl et al. (2013) and spaceborne stratospheric background observations presented by Kloss et al. (2019) and Vernier et al. (2018). When using a typical extinction-to-backscatter ratio of 50 sr (for non-soot particles), the vertically averaged particle extinction coefficients at minimum stratospheric aerosol conditions are in the range of 0.1–0.2 Mm−1 at 532 nm (Finger, 2011).
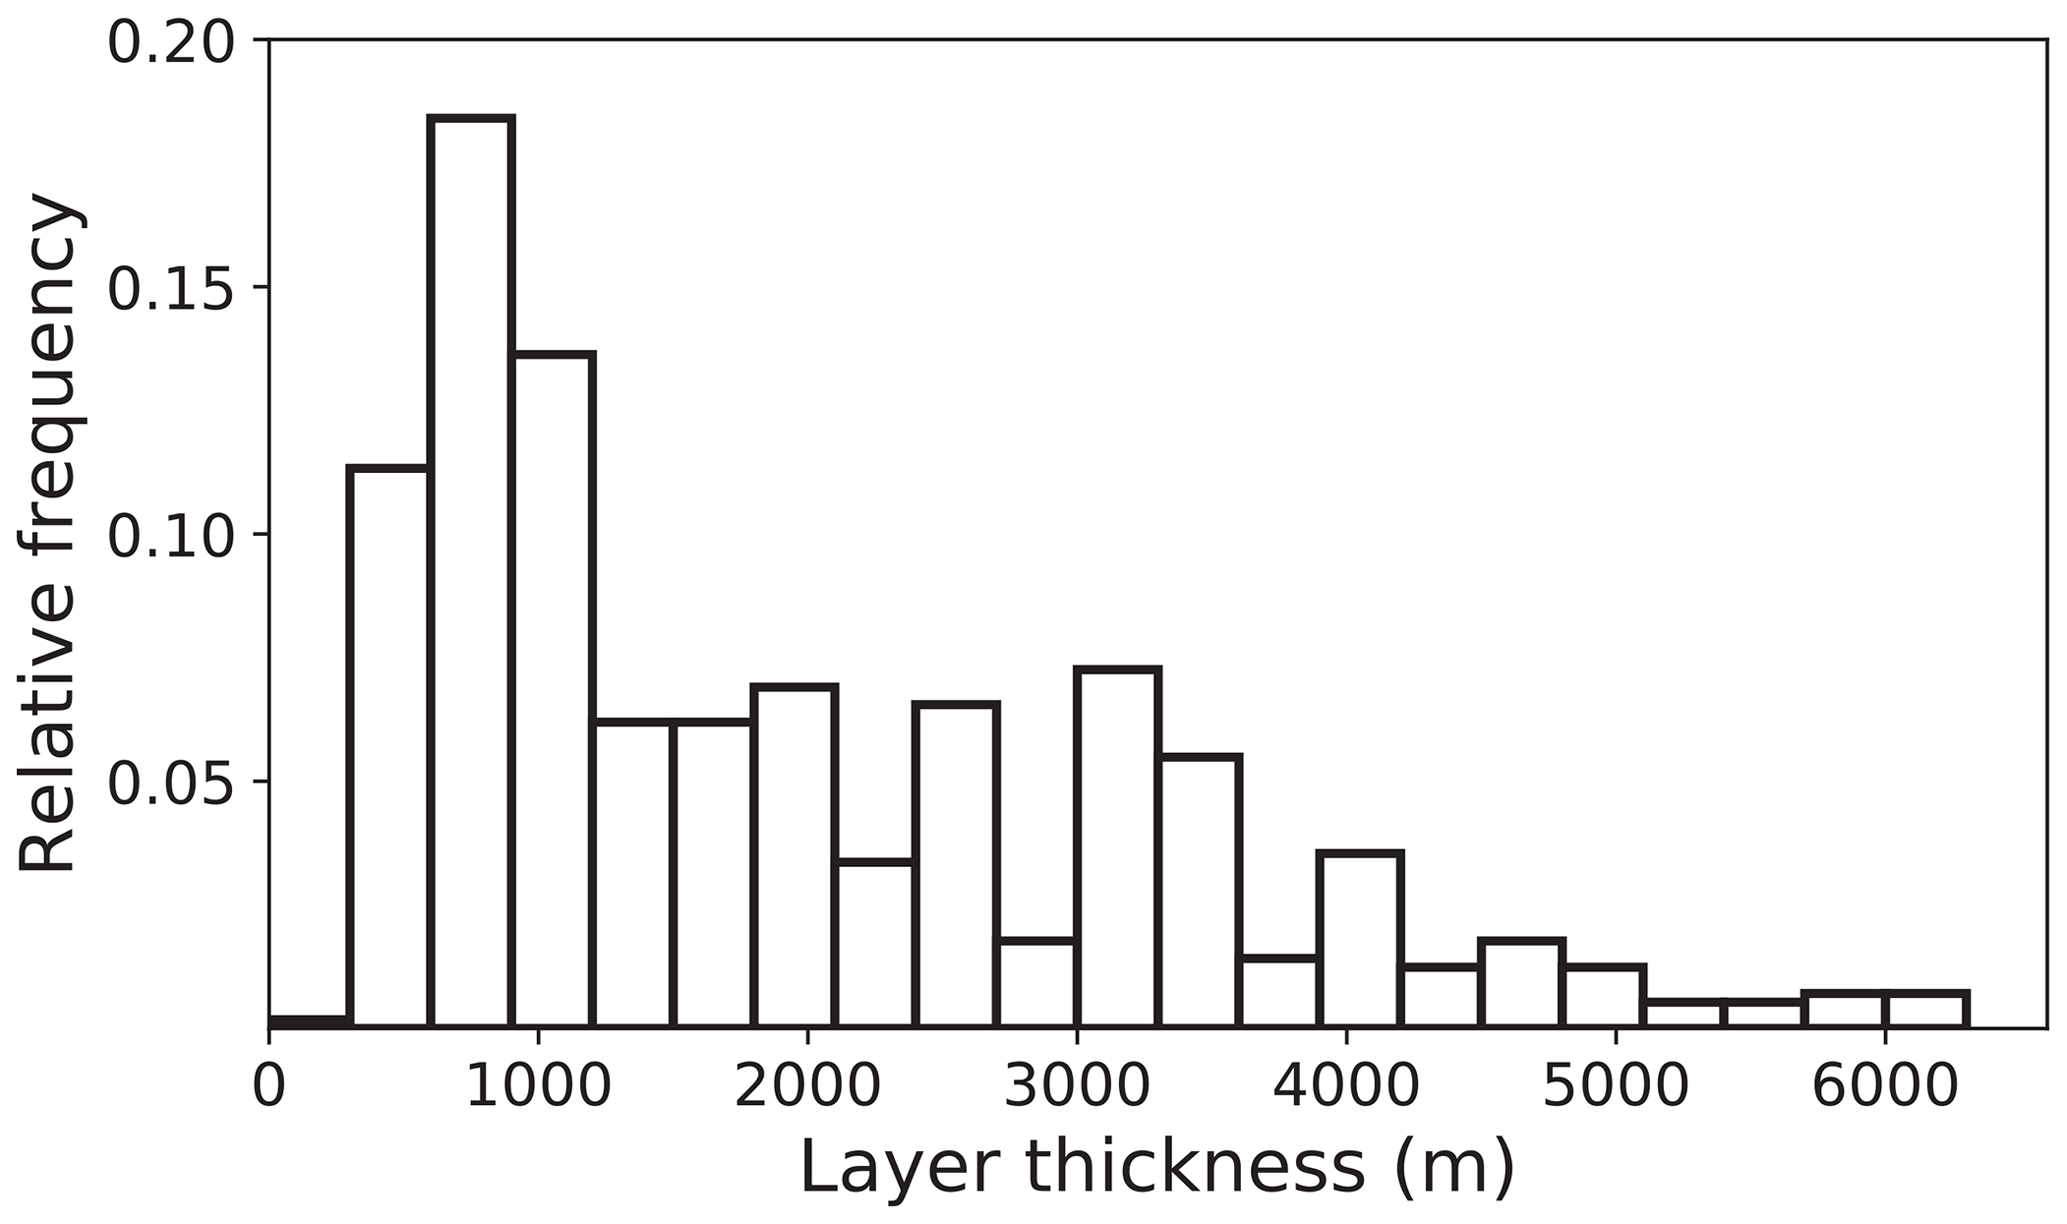
Figure 5Frequency of occurrence of day-by-day smoke layer depth, considering all 566 detected layers, based on all Polly observations at the seven sites from August 2017 to January 2018.
Figure 5 provides a statistical overview of smoke layer depths. There were 566 daily Polly observations (conducted at the seven Polly stations after sunset from August 2017 to January 2018) of individual layers analyzed. As shown, the vertical extent of the smoke layers was between 500 and 1500 m in 50 % of all cases. However, smoke layer depths of several kilometers were observed as well.
We compared our findings with measurements of the particle extinction coefficient at 521 nm wavelength aboard the International Space Station (SAGE III-ISS) presented by Yu et al. (2019) and Kloss et al. (2019). For the more homogeneous period from October to December 2017, Kloss et al. (2019) also found the main smoke layer between heights of 15 and 20 km. They analyzed stratospheric extinction measurements for an area from 25 to 38∘ N and 40 to 95∘ E (covering the Middle East, central Asia, and western China). The Polly stations at Cyprus and Israel were just west of this data analysis region. The mean extinction coefficients for this large area of almost 1000 km × 5000 km were about 0.5–1 Mm−1 during the October–December period, and hence in good agreement with the Polly observations. The good agreement also indicates that the assumed smoke lidar ratio of 65 sr at 532 nm is justified. For the entire Northern Hemisphere (> 40∘ N), Kloss et al. (2019) found mean particle extinction coefficients of 0.8–1 Mm−1 for the October–December period and for the height range from about 14 to 19 km. According to the SAGE III and OMPS-LP observations, stratospheric background extinction values were again reached in April–May 2018, about 8–9 months after the intense smoke injection event.
Yu et al. (2019) presented mean smoke extinction coefficients (at 1020 nm) at 18 km for the northern latitudes from 15 to 60∘ N as a function of time. From these observations we can conclude that the maximum 18 km mean extinction coefficient at 532 nm was close to 1 Mm−1 (in October 2017) and accumulated around 0.5–0.7 Mm−1 during the following months, until the end of 2017. The stratospheric background (0.2–0.25 Mm−1 at 532 nm after Yu et al., 2019) was almost reached in May 2018.
After conversion of the smoke extinction coefficients into respective mass concentrations (see Sect. 2 for more details), we found smoke mass concentrations on the order of 1–25 µg m−3 in August and the beginning of September (see Fig. 4c) and afterwards frequently values from 0.1 to 1 µg m−3. Minimum stratospheric background values are < 0.02 µg m−3 (Finger, 2011). Column mass concentrations exceeded 10 mg m−2 in August 2017, and later on most values were found in the range from 0.1 to 1 mg m−2 (see Fig. 4b). The particle mass estimates are uncertain by a factor of 2–3 due to the unknown soot particle density.
Figure 6 highlights the potential of soot particles to serve as INPs and the potential impact on ice formation at the tropopause level. The extinction coefficients in Fig. 4c were converted to INP concentrations for a typical cirrus formation temperature of −55 ∘C and typical supersaturation conditions expressed by Sice=1.15. Besides slow downward motion by gravitational settling of the soot particles, an efficient way to transport aerosol from the lower stratosphere downward to the upper troposphere are stratospheric intrusions (Trickl et al., 2014, 2016). Smoke particles reaching the upper troposphere and entrained into ascending humid tropospheric air masses may trigger cirrus formation at conditions with ice supersaturation values < 1.4, still not favorable for homogeneous ice nucleation, which needs ice supersaturation levels of typically 1.5–1.7. Heterogeneous ice formation on soot particles may thus have slightly enhanced cirrus formation in the Northern Hemisphere, especially during the first few months after injection.
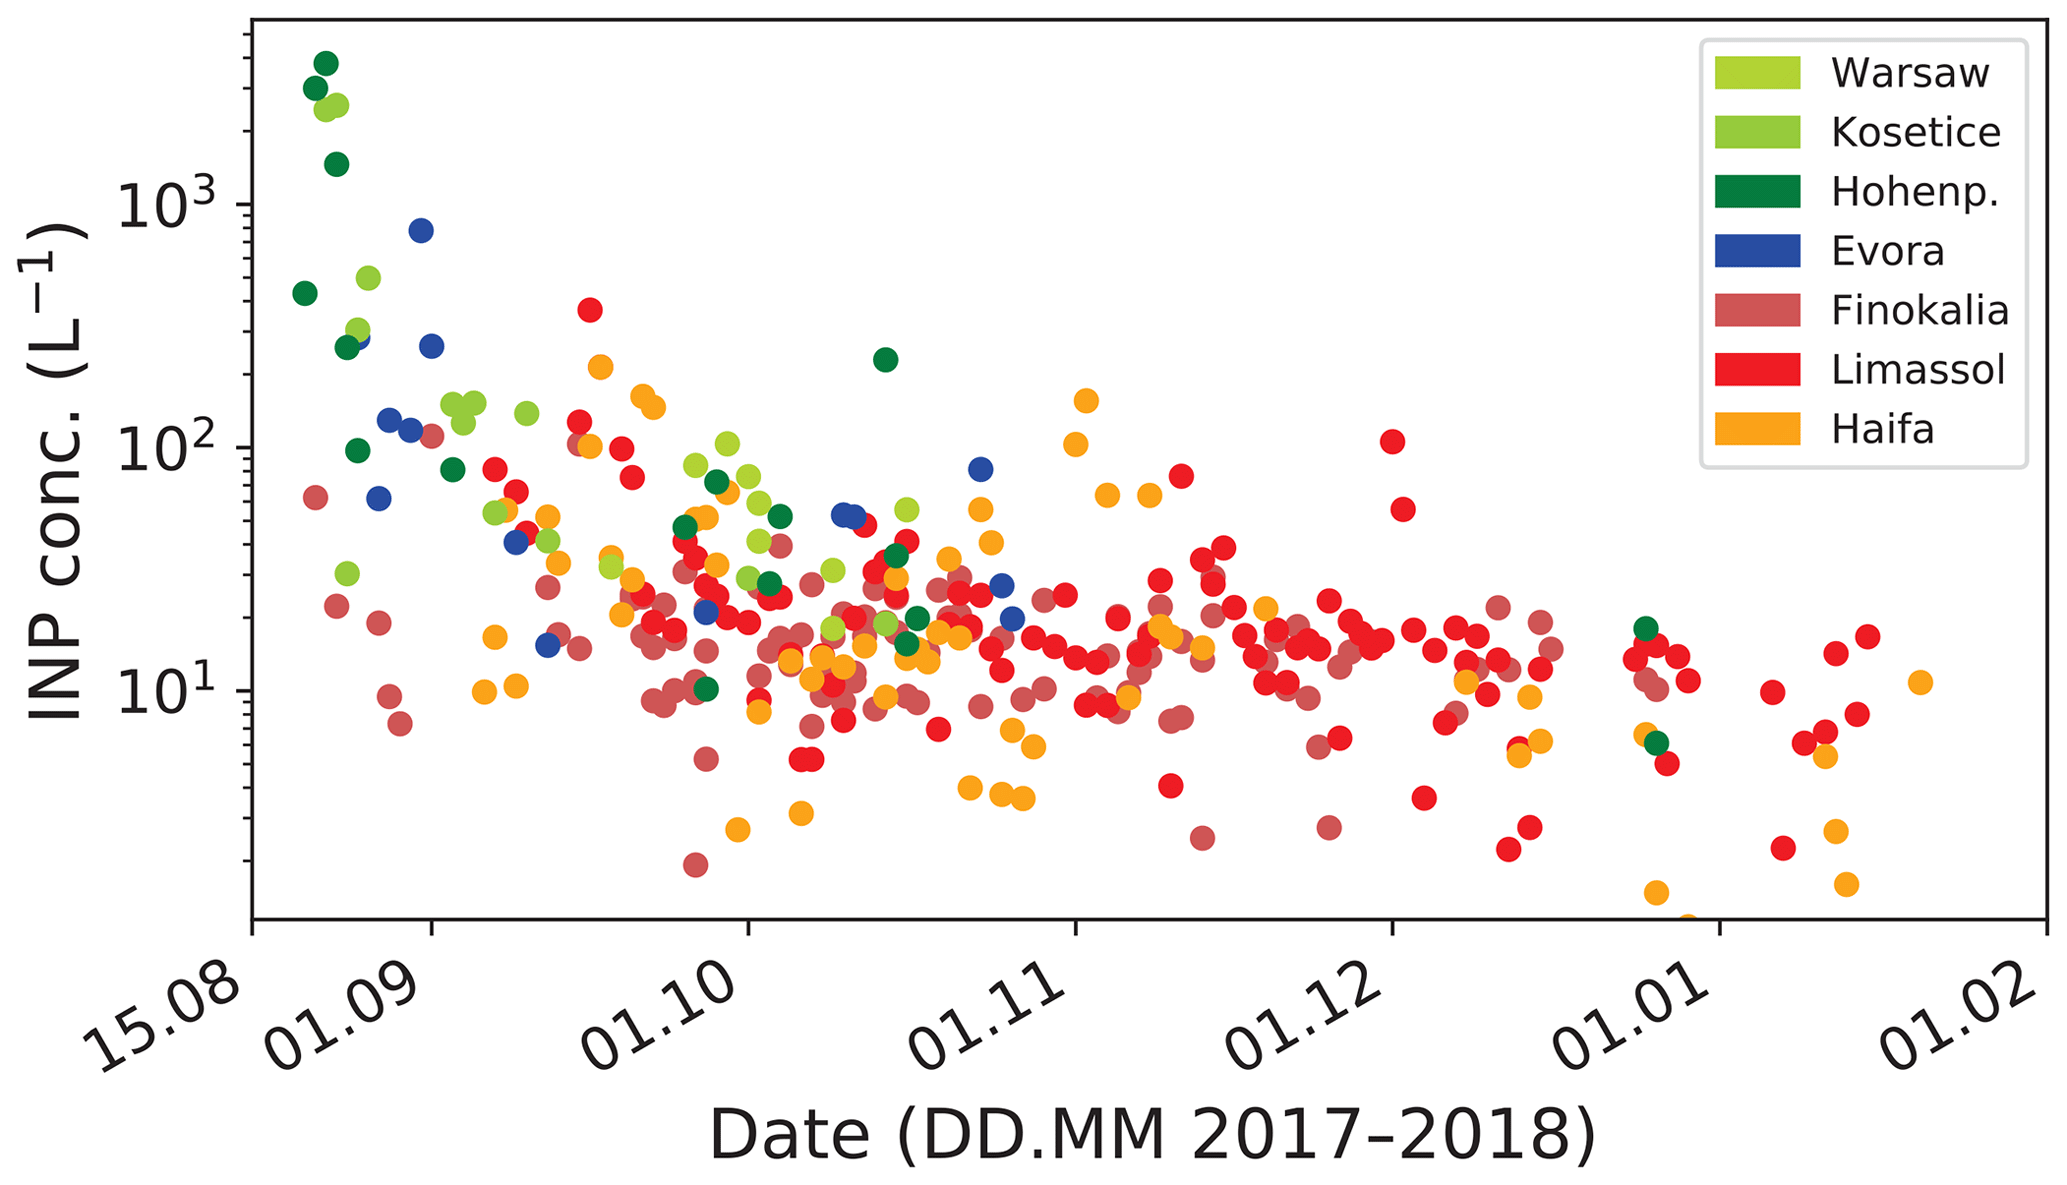
Figure 6Ice-nucleating particle (INP) concentration estimated from the smoke extinction coefficients in Fig. 4c, assuming heterogeneous ice nucleation (deposition nucleation) on soot particles at the temperature ∘C and a typical ice supersaturation level during cirrus formation of Sice=1.15 (Ullrich et al., 2017).
The observed smoke extinction coefficients indicate INP concentrations of 3000 L−1 in the beginning of the event during August 2017, then 50–500 L−1 until 5 September, 10–300 L−1 until 20 September, 5–50 L−1 until November, and finally < 20 L−1 until the end of January 2018 for ∘C and Sice=1.15. These values are large and can sensitively disturb cirrus formation in the usually clean upper troposphere.
3.2 Particle shape and size characteristics
Haarig et al. (2018) and Hu et al. (2019) discussed the shape properties of the fire smoke particles based on lidar observations over Europe about 2 weeks after injection into the UTLS regime over Canada. They found high particle linear depolarization ratios (PLDRs) at 355 nm (mostly 0.2–0.25) and 532 nm (0.15–0.2) and low values of 0.03–0.07 at 1064 nm for the smoke in the stratosphere. The high depolarization values at 355 and 532 nm indicate, first of all, that the particles were nonspherical. Ideal spheres such as liquid cloud droplets and wet marine particles would produce a particle depolarization ratio close to zero. However, besides the strong sensitivity of PLDR to particle shape, particle size also influences PLDR (Mamouri and Ansmann, 2014, 2017). Fine-mode mineral dust particles (diameters < 1 µm) cause PLDR values around 0.15 at 532 nm whereas coarse-mode dust particles lead to PLDR of 0.35–0.4 according to laboratory studies and field observations as reviewed by Mamouri and Ansmann (2014, 2017). The dependence on size caused the observed strong wavelength dependence of PLDR for the stratospheric smoke plumes over Europe in August 2017 as pointed out by Haarig et al. (2018). The size distribution mainly consisted of a well-developed accumulation mode. A coarse mode was absent. The inversion of the multiwavelength extinction and backscattering data revealed that the particles had diameters from 400 to 1400 nm with the mode maximum at 600–700 nm (Haarig et al., 2018). Particles with diameters < 1 µm thus dominated backscattering of the laser radiation. However, if coarse-mode particles dominate, as in the case of typical desert dust size distributions, the PLDR wavelength dependence is less pronounced (Haarig et al., 2017).
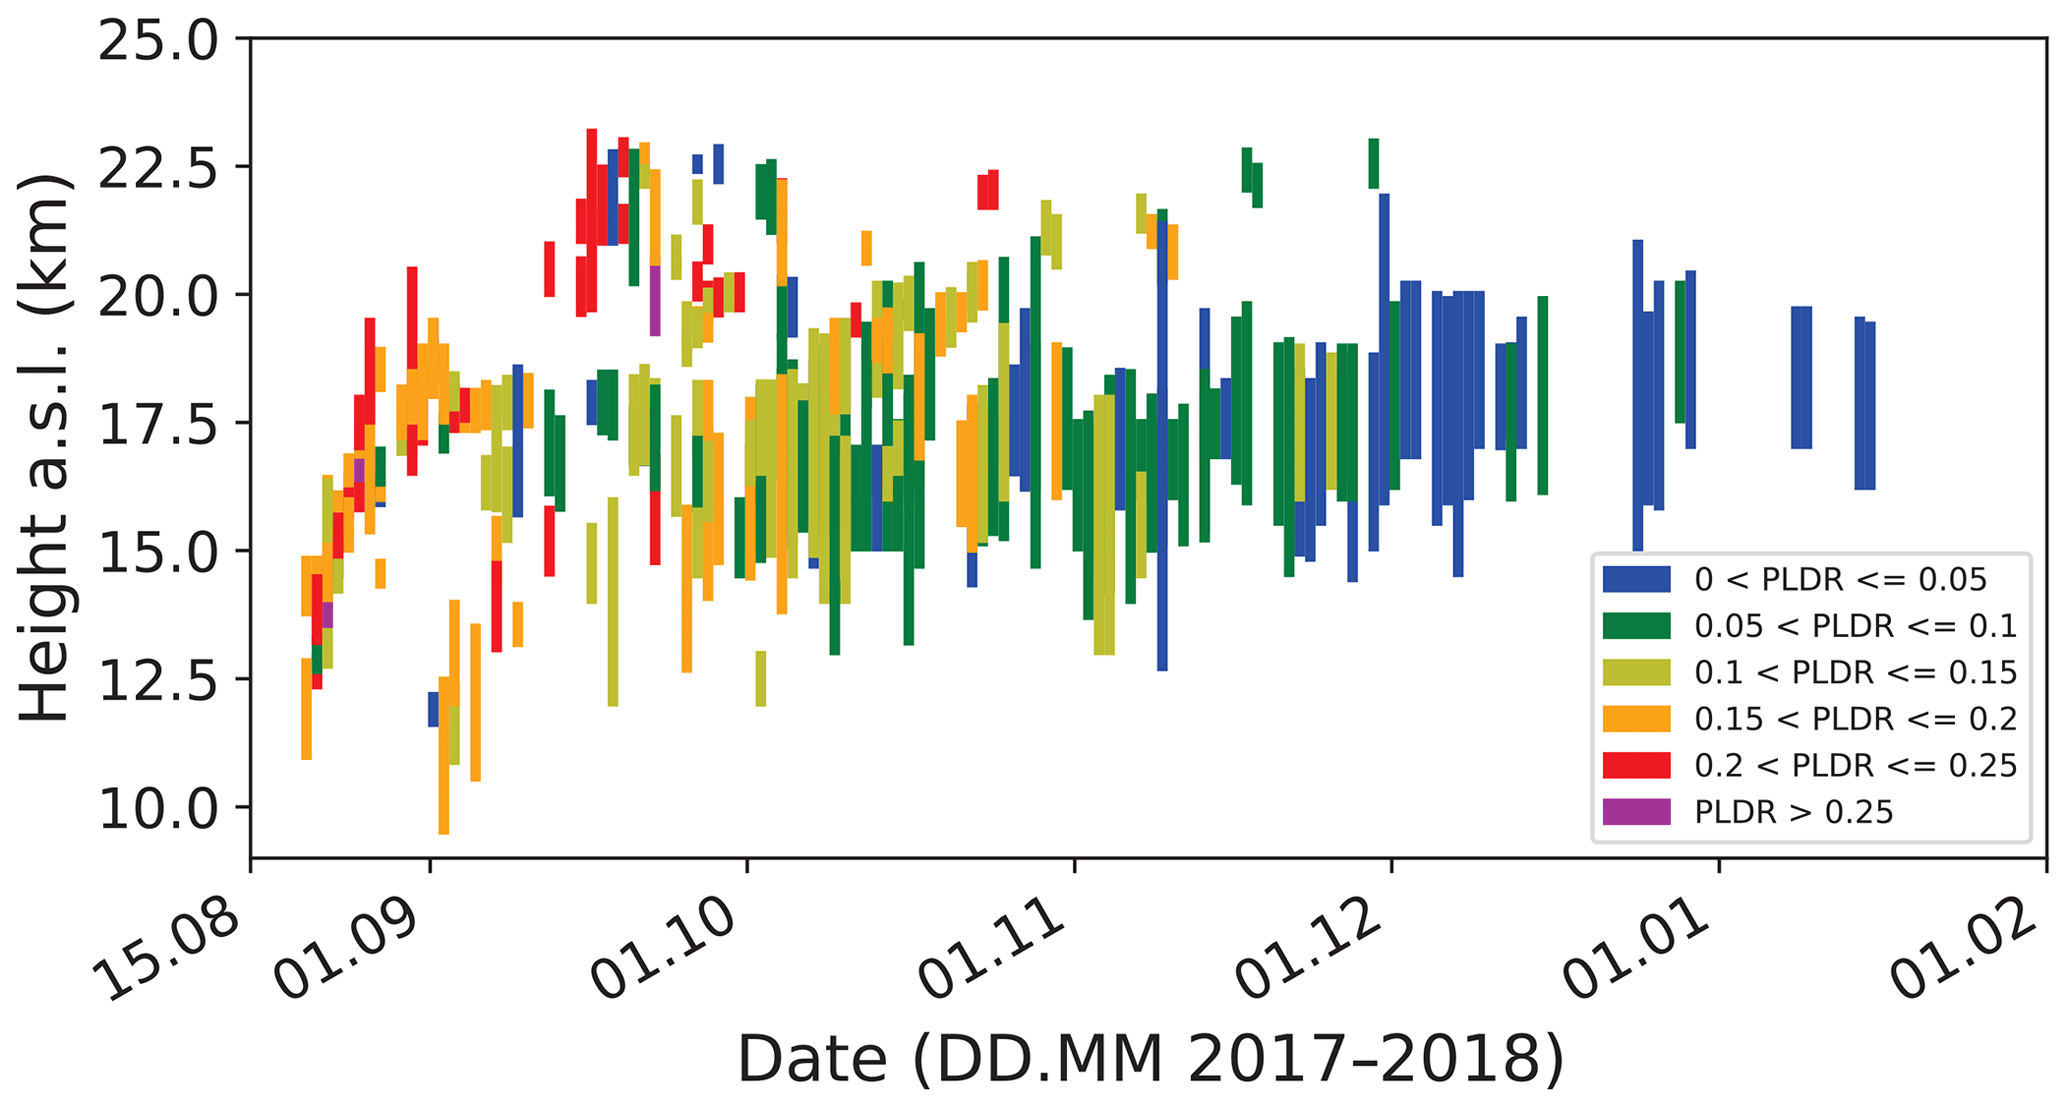
Figure 7All individual day-by-day smoke observations of the 532 nm particle linear depolarization ratio (PLDR, from all contributing stations, including several Lindenberg observations at 355 nm). Colors indicate different depolarization value ranges. The depolarization ratio decreased with time because of the removal of the larger nonspherical smoke particles and/or the change in the shape characteristics (from nonspherical to spherical particle shape).
Recently, Yu et al. (2019) modeled the optical properties of the Canadian smoke particles. They assumed that in the beginning an external mixture, consisting of (a) so-called fractal BC particles (i.e., fractal aggregates of BC) coated with organics, causing an overall spheroidal shape, and (b) organic particles without BC, rapidly coagulated and left behind a mixture of organic and BC-containing particles with a typical abundance of 2 % BC. The authors concluded from their modeling studies that the observed high PLDR of 0.2 at 532 nm (Haarig et al., 2018; Hu et al., 2019) cannot be explained by the presence of fractal BC particles with nonspherical organic coating alone, due to their small abundance. They hypothesize that the organic-coated particles were most likely solids because they either froze in the stratosphere or effloresced.
Gialitaki et al. (2019) modeled the optical properties (PLDR and lidar ratio at 355, 532, and 1064 nm) of the aged nonspherical smoke particles and compared the results with the respective multiwavelength lidar observation presented by Haarig et al. (2018). These extensive simulations suggest that the smoke particles with particle effective radii of 550 nm were compact and almost spherical in shape.
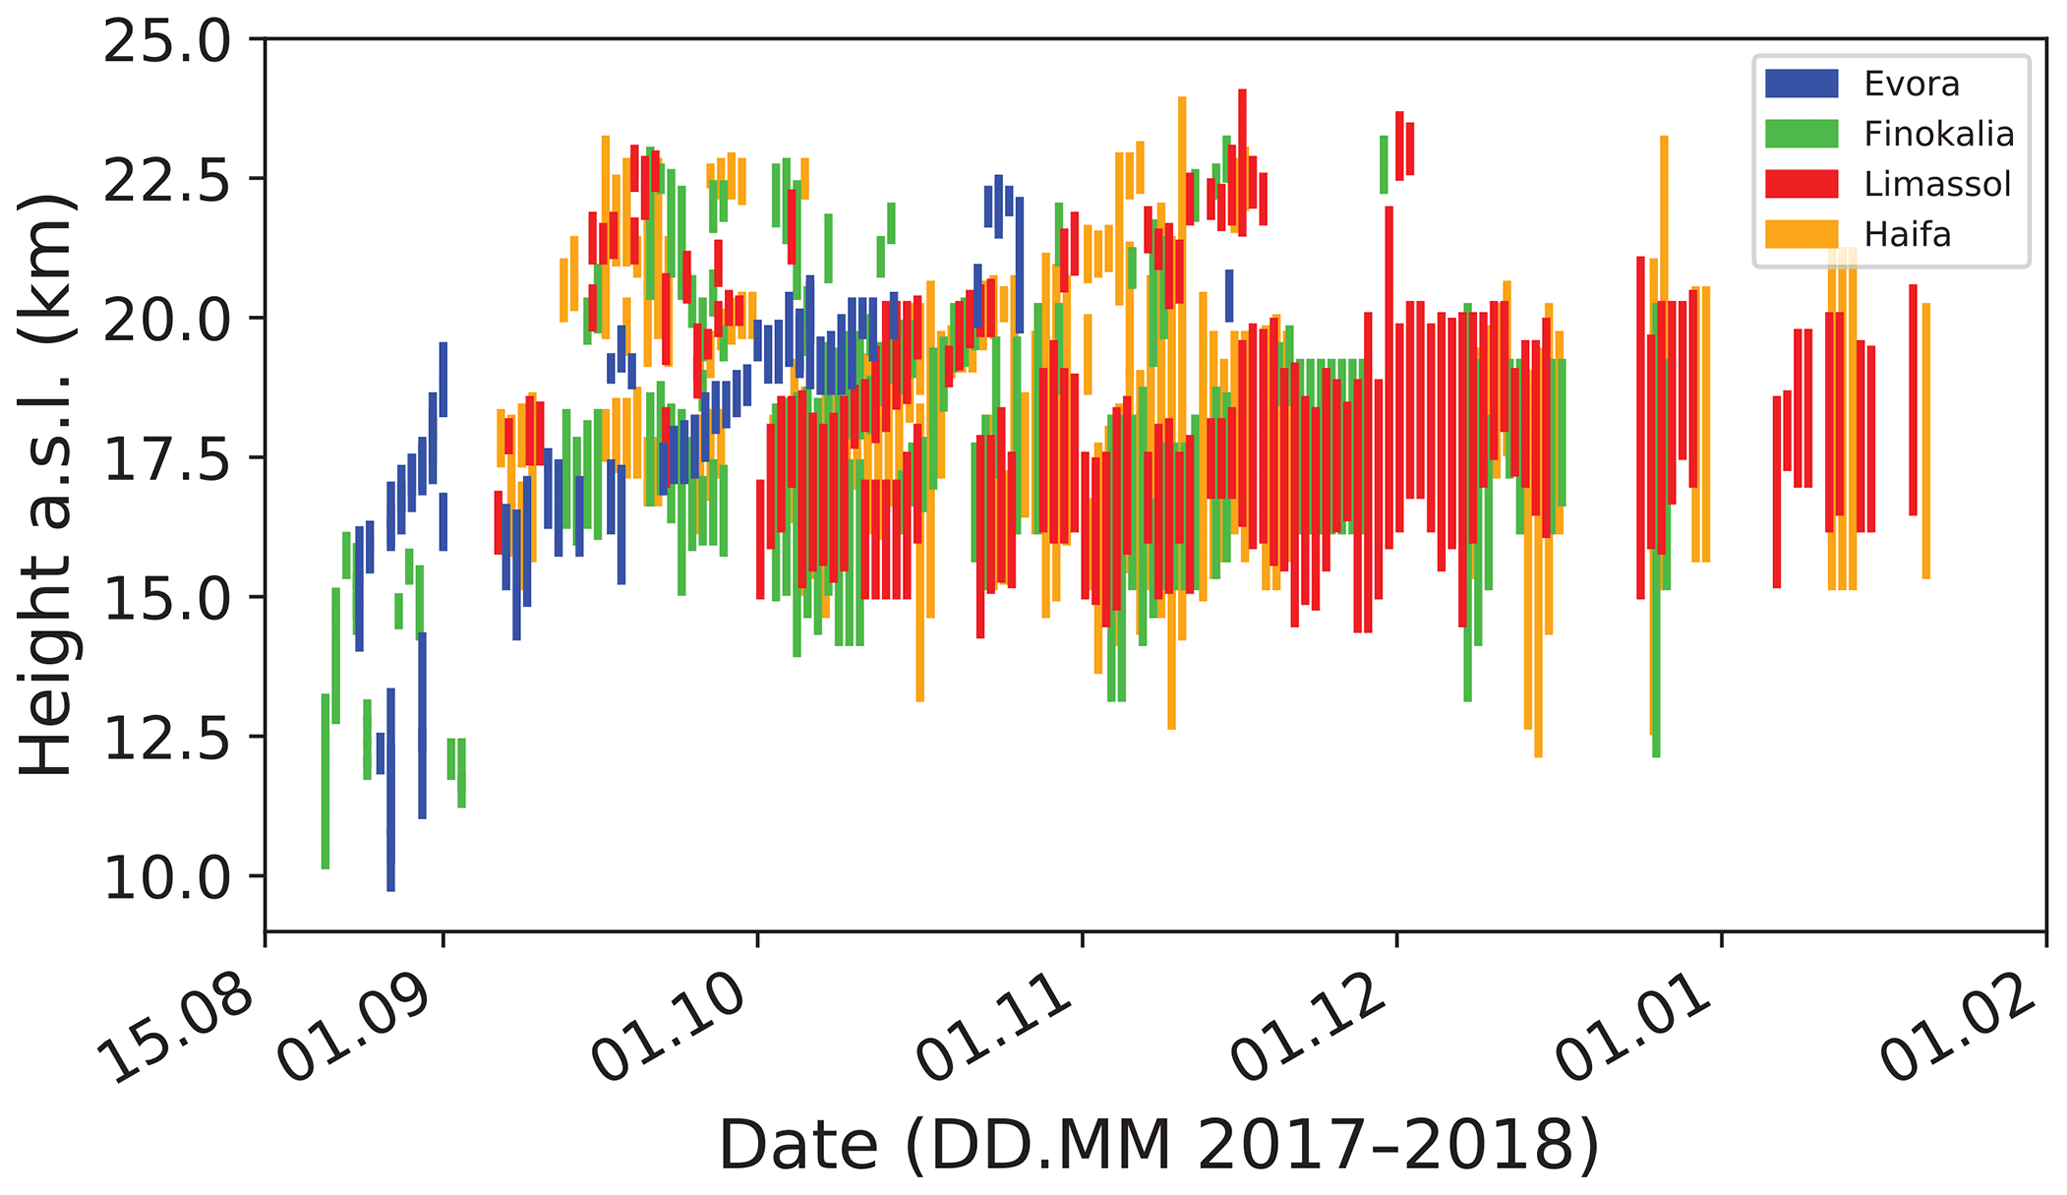
Figure 8Same as Fig. 4a, except only for the southern Polly stations. The Finokalia data set is shown here in green for better identification. The different data sets are shifted against each other by 6 h and the line width is reduced to better see all observations. An ascending structure, first seen over Évora in September (in blue) and then also detected over the eastern Mediterranean in October and November (in green, red, and orange) triggered the discussion about potential aerosol lifting processes and effects.
In Fig. 7, we now provide an overview of all available 532 nm depolarization ratios measured with the EARLINET lidar consortium from August 2017 to the end of January 2018. A few 355 nm particle depolarization values are included (Lindenberg). Most values are contributed by the Polly lidars. In the beginning, orange and red colors prevailed. The retrieved particle depolarization ratios were between 0.15 and 0.25 at 532 nm. Because the tropospheric lidars were not optimized for stratospheric observations (at relatively low backscatter and AOT conditions), a significant contribution of signal noise to the variability in the depolarization ratio values has to be considered. However, a general trend, i.e., a decrease of the depolarization ratio with time towards 0.05–0.1 and later < 0.05, is clearly visible. This decrease of the layer mean depolarization ratio is probably mainly related to a growing coating of the smoke particles. The larger the coating shell is, the higher the probability is that the particles are perfectly spherical. However, the removal of the larger smoke particles by sedimentation may also have contributed to the decrease of PLDR. As explained above, the depolarization ratio decreases with decreasing contribution of large particles to light backscattering.
3.3 Underlying transport processes
In the following, we discuss a variety of processes that influence the aerosol transport and observed aerosol properties and features in the lower stratosphere. In Fig. 8, we show again the Polly observations of the smoke layer structures, but now only for the southern-most stations at Évora in Portugal and Finokalia, Limassol, and Haifa in the eastern Mediterranean. At these southern European sites, coherent observations without strong disturbances by extended cloudy periods and unfavorable weather conditions in autumn and winter could be performed. Such coherent measurements were not possible at the more northern stations, e.g., in Germany and Poland, so many of the very thin aerosol features were not detectable here. As can be seen, numerous individual and apparently randomly distributed fire smoke layers are visible in Fig. 8. The prevailing westerly winds (jet stream) caused a main stratospheric aerosol transport from west to east. A descending trend (downward moving of the layer) as usually found after major volcanic eruptions as a result of sedimentation of particles (Jäger, 2005) was not visible in Fig. 8 from September 2017 to January 2018. Gravitational settling and warming of the air mass by absorption of solar radiation by the soot particles may have compensated each other. The decrease of the depolarization ratio over these months may thus be mainly related to the change in particle shape due to particle aging processes, as suggested by Yu et al. (2019) and Kloss et al. (2019), and not to the removal of larger particles by sedimentation. However, during the autumn and winter seasons a possible impact of the Brewer–Dobson circulation (BDC) (Seviour et al., 2012; Butchart, 2014; Abalos et al., 2015) on aerosol transport and layering must be taken into account. The BDC initiates a northward transport of aerosols from the tropical stratospheric reservoir (TSR) towards the midlatitudes. Such a meridional aerosol transport out of the tropics can best be observed (at midlatitudes) in any winter half year after major tropical volcanic eruptions (Jäger, 2005).
3.3.1 Brewer–Dobson circulation
The BDC describes the global-scale meridional circulation of the stratosphere and is characterized by tropospheric air rising into the stratosphere in the tropics, moving poleward before descending in the middle and high latitudes. This meridional aerosol transport is modulated by the quasi-biennial oscillation (QBO) of the equatorial lower and middle stratosphere with alternating (and descending) regimes of easterly and westerly winds (Jäger, 2005). The aerosol transport out of the TSR is suppressed when strong horizontal wind shear during the easterly phase of the QBO separates the tropics from the extratropical westerlies, while equatorial westerlies reduce the wind shear and promote transport into the winter hemisphere by isentropic mixing due to planetary waves penetrating into the subtropics and tropics and breaking there.
As further pointed out by Jäger (2005), a very similar aerosol transport out of the tropics was observed over Garmisch-Partenkirchen (southern Germany; 47.5∘ N) in the first autumn and winter seasons after the major volcanic eruptions of El Chichón (in 1982–1983) and during the second winter half year after the Pinatubo eruption (in 1992–1993; eruption took place in June 1991), caused by similar phases of the QBO with strong westerly winds at the relevant aerosol layer heights. During the second winter after the Pinatubo eruption, a clear and continuous rise of the aerosol layer top height, by about 5 km from the beginning of October 1992 (25 km layer top) to the end of December 1992 (30 km layer top), was observed.
QBO-related westerly winds also prevailed in the winter of 2017–2018 (GSFC-NASA, 2019), however only in the lower part of the QBO regime (from heights of about 17 to 23 km). At greater heights, strong easterly winds prevailed. So, the northward movement of tropical aerosols of the TSR was favored up to 23 km and suppressed higher up. Thus, the rising layer height from 17 to 18 km in the beginning of October 2017 to 22–23 km at the beginning of December 2017 observed over the eastern Mediterranean Polly stations and shown in Fig. 8 may be linked to the steadily intensifying QBO-influenced BDC.
Kloss et al. (2019) concluded that the BDC had a modulating impact on the smoke transport in the Northern Hemisphere in autumn and winter 2017. They found that the fire plumes injected into the lower stratosphere at high northern latitudes in August 2017 partly reached the tropics. The transport to the tropics was mediated by the anticyclonic flow of the Asian monsoon circulation. The fire plumes reached the Asian monsoon area in late August/early September, when the Asian monsoon anticyclone (AMA) was still in place. A substantial part of the smoke was entrained in the anticyclonic flow at the AMA edge and transported around its eastern flank into the tropics, where the air has further been lifted with the ascending branch of the BDC and then transported from the tropics to the extratropics. According to Kloss et al. (2019), the fire plumes were lifted by about 4 km in 6 months (from heights of 16–17 km in October 2017 to 20–21 km in March 2018) in the upwelling branch of the BDC. Based on SAGE III-ISS extinction observations, a slope in the aerosol signal with downwelling velocities (at northern latitudes > 40∘ N; 5 km in 3 months, October to January) and upwelling velocities (in the tropics, 0–25∘ N; October to March) was found. Thus, Kloss et al. (2019) hypothesize that the BDC played a sensitive role in both extratropical downward and tropical upward transport of the aerosol.
We may thus conclude that some of the layers in Fig. 8, coherently ascending by several kilometers with time during the period from October to December 2017, may have been influenced by the BDC. It remains however an open question whether the aerosol was fire smoke, tropical volcanic particles, or even anthropogenic pollution and traces of mineral dust originating from sources in the tropics and entering the stratosphere in the upwelling branch of the BDC.
Many more rising, mostly short-term features are visible in Fig. 8. An example of an ascending short-term fire smoke structure was observed over Košetice from 21 to 23 August 2017 and discussed by Ansmann et al. (2018). The layer was found at 12 km on 21 August 2017 and then coherently went up to 16 km within 2 d. This behavior could be explained by the fact that the wind velocity decreased with height from the tropopause (jet stream region) to a height of 16 km. Even if a compact smoke plume starts at all heights in the lower stratosphere simultaneously over the fire region, strong vertical wind shear may produce an apparently ascending aerosol layer several thousand kilometers downwind. Over Košetice, the layers close to the tropopause traveled much faster, because of the strong wind of 50 m s−1, than the smoke layers at heights of 15–16 km where the horizontal wind component showed values around 15–20 m s−1. Because of this strong vertical wind shear the smoke layer arrived over Košetice 1 d later at heights of 15–16 km rather than at 12 km (Ansmann et al., 2018). This vertical wind shear effect may explain ascending features observed over days, but cannot explain ascending features lasting over months.
3.3.2 Lifting by gravito-photophoretic forces
Two further smoke lifting processes are discussed in the literature. The first one is related to the gravito-photophoresis effect (Rohatschek, 1996; Pueschel et al., 2000; Cheremisin et al., 2005, 2011). Upward motion of individual particles is caused by radiometric forces, resulting from normal stresses on the particle surface due to temperature gradients in the gas surrounding the surface. Gas molecules continuously impact on the surface of an aerosol particle and are reflected (Cheremisin et al., 2011). During reflection the molecules may pick up some energy and leave the surface with a higher thermal energy. The required temperature gradients are produced by a difference in the thermal accommodation coefficient (in the case of particle lifting the accommodation coefficient at the bottom of the particle is higher than at the top). The sun is the source of irradiance, and negative photophoresis takes place; that is, a force pointing towards the sun poses a lifting component that opposes the forces of gravity (Rohatschek, 1996; Pueschel et al., 2000). Very specific aerosol and atmospheric conditions must be fulfilled. Only particles well-aligned in the air flow can be lifted. Stable alignment (and lifting) is only possible in the case of larger particles for which the center of gravity is always below their geometrical center (i.e., in the lower half of the particles during lifting). However, if particles are too large and thus too heavy, gravitational settling will always dominate. Optimum sizes (diameters) of particles for lifting are 1–2 µm. A stable equilibrium, with the force of gravity pointing towards the Earth and the photophoretic force pointing upward, will develop for these particles. However, as shown by Pueschel et al. (2000) for irregularly shaped stratospheric soot particles (chains of spherules), with sizes or lengths of 1 µm, the resulting vertical velocity is 0.009 cm s−1 or about 7–8 m d−1 at heights around 20 km. Thus, the gravito-photophoresis effect cannot explain the strong upward movement which was found to be on the order of 70–80 m d−1.
3.3.3 Self-lifting by absorption of solar radiation
Another process leading to a cross adiabatic movement (by diabatic heating) is related to the so-called self-lifting effect (Boers et al., 2010; Siddaway and Petelina, 2011; de Laat et al., 2012). Absorption of shortwave solar radiation heats the smoke layers and creates buoyancy that can then result in an ascent of the aerosol layer over several kilometers altitude within 1–2 d (Siddaway and Petelina, 2011; de Laat et al., 2012). Such a heating is seasonally dependent. The largest lifting effect occurs in the summer hemisphere around 21 June, when aerosol layers are exposed to sunshine for close to 24 h a day. Boers et al. (2010) demonstrated in the case of soot (assuming a single-scattering albedo of 0.75 at 500 nm) for midsummer conditions at 40∘ N (approximately for Évora, Finokalia, Limassol, and Haifa in late summer) that an ascent rate of 2.5 km d−1 is possible in the case of a smoke AOT of 3.5 (at 500 nm). For an AOT of 0.5, lifting is on the order of 400–500 m d−1, and for an AOT of 0.003–0.005, a lifting velocity of a few meters per day during midsummer conditions is plausible. However, the strong lifting over Finokalia, Limassol, and Haifa was observed in autumn (from October to December). In conclusion, the self-lifting effect can also be ruled out as an explanation for the measured upward movement of smoke layers in October to December 2017.
The spread of extremely high amounts of wildfire smoke injected into the UTLS over western Canada in August 2017 and the decay of the stratospheric perturbation were monitored and documented with a network of 28 ground-based lidars in Europe. Stratospheric soot layers were observed for 6 months from August 2017 to January 2018. The AOT decreased from initial values of > 0.2 (in the second half of August) to 0.005–0.03 in the beginning of September 2017 and then to around 0.003–0.004 during the following months, until January 2018. Vertically averaged extinction coefficients and soot mass concentrations were on the order of 1 Mm−1 and 0.1 µg m−3 over the two time periods described above, respectively, and thus were significantly above the minimum stratospheric aerosol background values (0.1–0.2 Mm−1, 0.01–0.02 µg m−3). The decrease of the particle linear depolarization ratio with time was found to be most consistent with aging of the smoke particles and related changes in the smoke particle shape properties (from nonspherical to spherical particle shape). The estimated ice-nucleating particle (INP) concentration levels were significantly enhanced for several months, and thus the smoke plumes served as a long-lasting reservoir for INPs able to trigger heterogeneous ice nucleation and in this way to influence cirrus formation at the tropopause level. It would be interesting to find indications for the impact of smoke particles on ice formations at the tropopause level. The most favorable time period for such a study is probably the first month (mid-August to mid-September 2017) after the pyroCB event on 12 August 2017, when the smoke particle number, and thus the INP concentration, was high enough over northwestern Canada and downstream towards Europe and Asia to significantly influence cirrus formation at the tropopause level and thus cloud lifetime and cirrus optical and radiative properties.
This record-breaking stratospheric smoke event is the second major event after the Eyjafjallajökull volcanic eruption in 2010 (Ansmann et al., 2011; Pappalardo et al., 2013; Navas‐Guzmán et al., 2013) that highlights the importance, need, and usefulness of EARLINET, a well-organized, Europe-wide, ground-based aerosol profiling network of advanced lidars. Dense sets of height and temporally resolved measurements of geometrical, optical, and microphysical smoke particle properties were collected to document this significant stratospheric perturbation event in the Northern Hemisphere, to support aerosol transport and life cycle modeling with global atmospheric circulation models (Earth system models, covering aerosol long-range transport, spread, and removal and the influence of the aerosol layers on climate-relevant processes), and to support spaceborne remote sensing of aerosols by providing high-quality ground-truth data. The PollyNET observations have shown that automated, continuously running lidar systems are powerful tools and allow us to cover the decay phase of the stratospheric aerosol perturbation in a coherent way. Without having continuous measurements, the smoke layering details and properties as presented and discussed in this article would widely remain undetected. At the European level, an upgrade of the current lidar capabilities is foreseen in terms of aerosol observation in the implementation of ACTRIS as a research infrastructure. In this framework, the aim is to move towards powerful and continuously running automated lidars.
The research on this spectacular case of a stratospheric perturbation is ongoing and will be widely based on spaceborne active and passive remote sensing, in combination with ground-based remote sensing (EARLINET and further ground-based lidar observations; e.g., in Asia and North America). This will then provide a good basis for sophisticated aerosol modeling. The complex transport features and climatic influences of stratospheric soot layers make it necessary to compare simulated smoke scenarios and the evolution of the smoke layer during long-range transport with the available observations. In this context one should finally mention (as an outlook on what is left to be improved) that the realization of a well-organized ground-based lidar network such as EARLINET but on a hemispheric or even global scale (such as the Global Aerosol Watch (GAW) initiative, GALION: GAW Aerosol LIdar Observations Network) (Bösenberg et al., 2008) would be desirable and could be seen as a big step forward towards a complete monitoring of global aerosol distributions and environmental conditions in the troposphere and stratosphere around the world. Sawamura et al. (2012) demonstrated the importance of having such a coordinated lidar profiling effort in the case of the Nabro volcanic eruption event. The importance of needing such global aerosol monitoring network structures may increase during the upcoming years because of the hypothesis that in a changing climate natural hazards, such as severe wildfires combined with pyroCb activity and major desert dust outbreaks, may occur more frequently and that detailed profile observations are required to support weather and climate research and forecasting. Regarding vertically resolved observational studies of atmospheric processes (aerosol and cloud life cycles and aerosol–cloud–dynamics relationships) there is practically no alternative to ground-based (lidar and radar) network observations. Spaceborne lidars such as the CALIPSO lidar are complementary to these network observations by providing global 3-D aerosol distributions, but these snapshot-like satellite lidar observations are of limited use in process studies.
Future activities should also be undertaken in the direction of harmonization of lidar network observations and data. In this sense, the effort to develop standardized tools for aerosol lidar analysis, as realized in the case of ACTRIS–EARLINET in form of the single-calculus-chain (SCC) software (D'Amico et al., 2015, 2016; Mattis et al., 2016), and to open its use to non-EARLINET lidar stations and teams is another step forward on the long way to global lidar data harmonization.
EARLINET data are accessible through the ACTRIS data portal http://actris.nilu.no/ (last access: 10 October 2019) The long-term Polly lidar level-0 data are plotted online at http://polly.rsd.tropos.de (last access: 10 October 2019); raw data are available at TROPOS upon request (polly@tropos.de). GDAS meteorological data are available via an ARL web page (https://www.ready.noaa.gov/gdas1.php, last access: 20 May 2019, GDAS, 2019). All the analysis products are available from TROPOS upon request (info@tropos.de).
HB coordinated the project, communicated with all EARLINET groups, and collected all EARLINET data. KO performed the Polly data analysis and prepared all figures, supervised by HB and AA. The layout of the manuscript was designed by AA and HB. Finally, AA wrote the text in cooperation with HB and KO. All EARLINET and further PollyNET coauthors performed the stratospheric smoke measurements, carefully analyzed their observations with focus on stratospheric aerosol signatures, and transferred the findings to TROPOS.
The authors declare that they have no conflict of interest.
This article is part of the special issue “EARLINET aerosol profiling: contributions to atmospheric and climate research”. It is not associated with a conference.
The authors thank the teams at Košetice observatory (in particular Vlastimil Hanuš, Adéla Holubová Šmejkalová, and Vladimír Ždímal) for their great logistical support.
The authors acknowledge support through ACTRIS under grant agreement no. 262 254 and BACCHUS (no. 603445) of the European Commission Seventh Framework Programme (FP7/2007-2013), ACTRIS-2 and EXCELSIOR under grant agreement nos. 654109 and 763643 from Horizon 2020, research and innovation program of the European Commission, and HD(CP)2 under grant agreement no. 01LK1502I with the German Ministry for Education and Research (BMBF). The research leading to these results has also received funding from the H2020 program of the European Commission regarding GRASP-ACE (grant agreement no. 778349) and Spanish funding (ref. CGL2014-55230-R, TEC2015-63832-P, CGL2017-90884-REDT, CGL2016-81092-R, and MDM-2016-0600). This work was also supported by Ambizione program of the Swiss National Science Foundation (project no. PZ00P2 168114). The lidar data analyses at University of Warsaw were supported by European Space Agency grant no. 4000119961/16/NL/FF/mg (POLIMOS). Évora lidar observations were funded by the Portuguese Science Foundation (FCT) within the project TOMAQAPA (Ref: PTDC/CTA-MET/29678/2017) and the European Union through the European Regional Development Fund, included in COMPETE 2020 (Operational Program Competitiveness and Internationalization) through the ICT project (UID/GEO/04683/2013) with reference POCI-01-0145-FEDER-007690, and also through Interreg V-A Spain – Portugal (POCTEP) program, through the CILIFO project (Ref: 0753_CILIFO_5_E). Cork lidar observations were supported by the Irish Research Council (2014) and Science Foundation Ireland (05/RF/EEB011). The Cyprus observations were supported by the SIROCCO project, which is co-funded by the Republic of Cyprus and Structural Funds of the European Union for Cyprus under the Research & Innovation Foundation grant agreement EXCELLENCE/1216/0217. Haifa lidar observations were funded by the German-Israeli Foundation (GIF grant I-1262 401.10/2014) with support of the Norman and Helen Asher Fund and Ollendorff Minerva Center. The development of the lidar inversion algorithm used to analyze Lille and Leipzig lidar data was supported by the Russian Science Foundation (project 16-17-10241).
The publication of this article was funded by the
Open Access Fund of the Leibniz Association.
This paper was edited by Matthias Tesche and reviewed by Michael Fromm and two anonymous referees.
Abalos, M., Legras, B., Ploeger, F., and Randel, W. J.: Evaluating the advective Brewer‐Dobson circulation in three reanalyses for the period 1979–2012, J. Geophys. Res.-Atmos., 120, 7534– 7554. https://doi.org/10.1002/2015JD023182, 2015. a
Althausen, D., Engelmann, R., Baars, H., Heese, B., Ansmann, A., Müller, D., and Komppula, M.: Portable Raman Lidar PollyXT for Automated Profiling of Aerosol Backscatter, Extinction, and Depolarization, J. Atmos. Ocean. Tech., 26, 2366–2378, https://doi.org/10.1175/2009JTECHA1304.1, 2009. a
Ansmann, A., Mattis, I., Wandinger, U., Wagner, F., Reichardt, J., and Deshler, T.: Evolution of the Pinatubo Aerosol: Raman Lidar Observations of Particle Optical Depth, Effective Radius, Mass, and Surface Area over Central Europe at 53.48∘ N, J. Atmos. Sci., 54, 2630–2641, https://doi.org/10.1175/1520-0469(1997)054<2630:EOTPAR>2.0.CO;2, 1997. a
Ansmann, A., Tesche, M., Seifert P, Groß, S., Freudenthaler, V., Apituley, A., Wilson, K. M., Serikov, I., Linné, H., Heinold, B., Hiebsch, A., Schnell, F., Schmidt, J., Mattis, I., Wandinger, U., and Wiegner, M.: Ash and fine–mode particle mass profiles from EARLINET-AERONET observations over central Europe after the eruptions of the Eyjafjallajökull volcano in 2010, J. Geophys. Res., 116, D00U02, https://doi.org/10.1029/2010JD015567, 2011. a
Ansmann, A., Baars, H., Chudnovsky, A., Mattis, I., Veselovskii, I., Haarig, M., Seifert, P., Engelmann, R., and Wandinger, U.: Extreme levels of Canadian wildfire smoke in the stratosphere over central Europe on 21–22 August 2017, Atmos. Chem. Phys., 18, 11831–11845, https://doi.org/10.5194/acp-18-11831-2018, 2018. a, b, c, d, e, f, g
Ansmann, A., Mamouri, R.-E., Bühl, J., Seifert, P., Engelmann, R., Hofer, J., Nisantzi, A., Atkinson, J. D., Kanji, Z. A., Sierau, B., Vrekoussis, M., and Sciare, J.: Ice-nucleating particle versus ice crystal number concentrationin altocumulus and cirrus layers embedded in Saharan dust:a closure study, Atmos. Chem. Phys., 19, 15087–15115, https://doi.org/10.5194/acp-19-15087-2019, 2019.
Baars, H., Kanitz, T., Engelmann, R., Althausen, D., Heese, B., Komppula, M., Preißler, J., Tesche, M., Ansmann, A., Wandinger, U., Lim, J.-H., Ahn, J. Y., Stachlewska, I. S., Amiridis, V., Marinou, E., Seifert, P., Hofer, J., Skupin, A., Schneider, F., Bohlmann, S., Foth, A., Bley, S., Pfüller, A., Giannakaki, E., Lihavainen, H., Viisanen, Y., Hooda, R. K., Pereira, S. N., Bortoli, D., Wagner, F., Mattis, I., Janicka, L., Markowicz, K. M., Achtert, P., Artaxo, P., Pauliquevis, T., Souza, R. A. F., Sharma, V. P., van Zyl, P. G., Beukes, J. P., Sun, J., Rohwer, E. G., Deng, R., Mamouri, R.-E., and Zamorano, F.: An overview of the first decade of PollyNET: an emerging network of automated Raman-polarization lidars for continuous aerosol profiling, Atmos. Chem. Phys., 16, 5111–5137, https://doi.org/10.5194/acp-16-5111-2016, 2016. a, b, c, d
Boers, R., de Laat, A. T., Stein Zweers, D. C., and Dirksen, R. J.: Lifting potential of solar-heated aerosol layers, Geophys. Res. Lett., 37, L24802, https://doi.org/10.1029/2010GL045171, 2010. a, b, c
Bösenberg, J, Hoff, R., Ansmann, A., Müller, D., Antuña-Marrero, J. C., Whiteman, D., Sugimoto, N., Apituley, A., Hardesty, M., Welton, E., Eloranta, E., Arshinov, Y., Kinne, S., and Freudenthaler, V.: Plan for the implementation of the GAW Aerosol Lidar Observation Network GALION, Hamburg, Germany, 27–29 March 2007, WMO TD No. 1443, 52 pp., 2008. a
Butchart, N.: The Brewer‐Dobson circulation, Rev. Geophys., 52, 157–184, https://doi.org/10.1002/2013RG000448, 2014. a
Campbell, J. R., Welton, E. J., Krotkov, N. A., Yang, K., Stewart, S. A., and Fromm, M. D.: Likely seeding of cirrus clouds by stratospheric Kasatochi volcanic aerosol particles near a mid-latitude tropopause fold, Atmos. Environ., 46, 441–448, https://doi.org/10.1016/j.atmosenv.2011.09.027, 2012. a
Cheremisin, A. A., Vassilyev, Y. V., and Horvath, H.: Gravito-photophoresis and aerosol stratification in the atmosphere, J. Aerosol. Sci., 36, 1277–1299, https://doi.org/10.1016/j.jaerosci.2005.02.003, 2005. a
Cheremisin, A. A., Shnipov, I. S., Horvath, H., and Rohatschek, H.: The global picture of aerosol layers formation in the stratosphere and in the mesosphere under the influence of gravito‐photophoretic and magneto‐photophoretic forces, J. Geophys. Res., 116, D19204, https://doi.org/10.1029/2011JD015958, 2011. a, b
Dahlkötter, F., Gysel, M., Sauer, D., Minikin, A., Baumann, R., Seifert, P., Ansmann, A., Fromm, M., Voigt, C., and Weinzierl, B.: The Pagami Creek smoke plume after long-range transport to the upper troposphere over Europe – aerosol properties and black carbon mixing state, Atmos. Chem. Phys., 14, 6111–6137, https://doi.org/10.5194/acp-14-6111-2014, 2014.
D'Amico, G., Amodeo, A., Baars, H., Binietoglou, I., Freudenthaler, V., Mattis, I., Wandinger, U., and Pappalardo, G.: EARLINET Single Calculus Chain – overview on methodology and strategy, Atmos. Meas. Tech., 8, 4891–4916, https://doi.org/10.5194/amt-8-4891-2015, 2015. a, b
D'Amico, G., Amodeo, A., Mattis, I., Freudenthaler, V., and Pappalardo, G.: EARLINET Single Calculus Chain – technical – Part 1: Pre-processing of raw lidar data, Atmos. Meas. Tech., 9, 491–507, https://doi.org/10.5194/amt-9-491-2016, 2016. a, b
de Laat, A. T. J., Stein Zweers, D. C., Boers, R., and Tuinder, O. N. E.: A solar escalator: Observational evidence of the self-lifting of smoke and aerosols by absorption of solar radiation in the February 2009 Australian Black Saturday plume, J. Geophys. Res., 117, D04204, https://doi.org/10.1029/2011JD017016, 2012. a, b, c
Ditas, J., Ma, N., Zhang, Y., Assmann, D., Neumaier, M., Riede, H., Karu, E., Williams, J., Scharffe, D., Wang, Q., Saturno, J., Schwarz, J. P., Katich, J. M., McMeeking, G. R., Zahn, A., Hermann, M., Brenninkmeijer, C. A. M., Andreae, M. O., Pöschl, U., Su, H., and Cheng, Y.: Strong impact of wildfires on the abundance and aging of black carbon in the lowermost stratosphere, P. Natl. Acad. Sci. USA, 115, E11595–E11603, https://doi.org/10.1073/pnas.1806868115, 2018. a
EARLINET: ACTRIS data portal, available at: http://actris.nilu.no/, last access: 20 May 2019. a
Engelmann, R., Kanitz, T., Baars, H., Heese, B., Althausen, D., Skupin, A., Wandinger, U., Komppula, M., Stachlewska, I. S., Amiridis, V., Marinou, E., Mattis, I., Linné, H., and Ansmann, A.: The automated multiwavelength Raman polarization and water-vapor lidar PollyXT: the neXT generation, Atmos. Meas. Tech., 9, 1767–1784, https://doi.org/10.5194/amt-9-1767-2016, 2016. a
Finger, F.: Aerosolschichten in der oberen Troposphäre und unteren Stratosphäre über Mitteleuropa, University Master Thesis, Universität Leipzig, Germany, 89 pp., 2011. a, b, c, d
Forestieri, S. D., Helgestad, T. M., Lambe, A. T., Renbaum-Wolff, L., Lack, D. A., Massoli, P., Cross, E. S., Dubey, M. K., Mazzoleni, C., Olfert, J. S., Sedlacek III, A. J., Freedman, A., Davidovits, P., Onasch, T. B., and Cappa, C. D.: Measurement and modeling of the multiwavelength optical properties of uncoated flame-generated soot, Atmos. Chem. Phys., 18, 12141–12159, https://doi.org/10.5194/acp-18-12141-2018, 2018. a
Freudenthaler, V.: About the effects of polarising optics on lidar signals and the Δ90 calibration, Atmos. Meas. Tech., 9, 4181–4255, https://doi.org/10.5194/amt-9-4181-2016, 2016. a
Fromm, M., Alfred, J., Hoppel, K., Hornstein, J., Bevilacqua, R., Shettle, E., Servranckx, R., Li, Z., and Stocks, B.: Observations of boreal forest fire smoke in the stratosphere by POAM III, SAGE II, and lidar in 1998, Geophys. Res. Lett., 27, 1407–1410, 2000. a
Fromm, M. D. and Servranckx, R.: Transport of forest fire smoke above the tropopause by supercell convection, Geophys. Res. Lett., 30, 1542, https://doi.org/10.1029/2002GL016820, 2003. a
Fromm, M., Shettle, E. P., Fricke, K. H., Ritter, C., Trickl, T., Giehl, H., Gerding, M., Barnes, J. E., O'Neill, M., Massie, S. T., Blum, U., McDermid, I. S., Leblanc, T., and Deshler, T.: Stratospheric impact of the Chisholm pyrocumulonimbus eruption: 2. Vertical profile perspective, J. Geophys. Res., 113, D08203, https://doi.org/10.1029/2007JD009147, 2008. a
Fromm, M., Lindsey, D. T., Servranckx, R., Yue, G., Trickl, T., Sica, R., Doucet, P., and Godin-Beekmann, S. E.: The untold story of pyrocumulonimbus, B. Am. Meteorol. Soc., 91, 1193–1209, https://doi.org/10.1175/2010bams3004.1, 2010. a
GDAS: Global Data Assimilation System, meteorological data base, available at: https://www.ready.noaa.gov/gdas1.php, last access: 20 May 2019. a, b
Gialitaki, A., Tsekeri, A., Amiridis, V., Ceolato, R., Paulien, L., Proestakis, E., Marinou, E., Haarig, M., Baars, H., and Balis, D.: Is near-spherical shape the “new black” for smoke?, in: Proceedings of the 29th International Laser Radar Conference (ILRC), Hefei, Anhui, China, 24–28 June 2019, 114–117, 2019. a
GSFC-NASA: QBO-related wind information, available at: https://acd-ext.gsfc.nasa.gov/Data_services/met/qbo/qbo.html, last access: 10 October 2019. a
Haarig, M., Ansmann, A., Althausen, D., Klepel, A., Groß, S., Freudenthaler, V., Toledano, C., Mamouri, R.-E., Farrell, D. A., Prescod, D. A., Marinou, E., Burton, S. P., Gasteiger, J., Engelmann, R., and Baars, H.: Triple-wavelength depolarization-ratio profiling of Saharan dust over Barbados during SALTRACE in 2013 and 2014, Atmos. Chem. Phys., 17, 10767–10794, https://doi.org/10.5194/acp-17-10767-2017, 2017. a
Haarig, M., Ansmann, A., Baars, H., Jimenez, C., Veselovskii, I., Engelmann, R., and Althausen, D.: Depolarization and lidar ratios at 355, 532, and 1064 nm and microphysical properties of aged tropospheric and stratospheric Canadian wildfire smoke, Atmos. Chem. Phys., 18, 11847–11861, https://doi.org/10.5194/acp-18-11847-2018, 2018. a, b, c, d, e, f, g, h, i, j, k, l, m, n, o
Hoose, C. and Möhler, O.: Heterogeneous ice nucleation on atmospheric aerosols: a review of results from laboratory experiments, Atmos. Chem. Phys., 12, 9817–9854, https://doi.org/10.5194/acp-12-9817-2012, 2012. a
Hu, Q., Goloub, P., Veselovskii, I., Bravo-Aranda, J.-A., Popovici, I. E., Podvin, T., Haeffelin, M., Lopatin, A., Dubovik, O., Pietras, C., Huang, X., Torres, B., and Chen, C.: Long-range-transported Canadian smoke plumes in the lower stratosphere over northern France, Atmos. Chem. Phys., 19, 1173–1193, https://doi.org/10.5194/acp-19-1173-2019, 2019. a, b, c, d, e, f, g, h
Jäger, H.: Long-term record of lidar observations of the stratospheric aerosol layer at Garmisch-Partenkirchen, J. Geophys. Res.-Atmos., 110, D08106, https://doi.org/10.1029/2004JD005506, 2005. a, b, c, d
Jensen, E. J. and Toon, O. B.: The potential effects of volcanic aerosols on cirrus cloud microphysics, Geophys. Res. Lett., 19, 1759–1762, https://doi.org/10.1029/92GL01936, 1992. a
Jimenez, C., Ansmann, A., Engelmann, R., Haarig, M., Schmidt, J., and Wandinger, U.: Polarization lidar: an extended three-signal calibration approach, Atmos. Meas. Tech., 12, 1077–1093, https://doi.org/10.5194/amt-12-1077-2019, 2019. a
Kanji, Z. A., Ladino, L. A., Wex, H., Boose, Y., Burkert-Kohn, M., Cziczo, D. J., and Krämer, M.: Chapter 1: Overview of ice nucleating particles, Meteor Monogr., 58, 1–33, https://doi.org/10.1175/amsmonographs-d-16-0006.1, 2017. a
Kar, J., Lee, K.-P., Vaughan, M. A., Tackett, J. L., Trepte, C. R., Winker, D. M., Lucker, P. L., and Getzewich, B. J.: CALIPSO level 3 stratospheric aerosol profile product: version 1.00 algorithm description and initial assessment, Atmos. Meas. Tech., 12, 6173–6191, https://doi.org/10.5194/amt-12-6173-2019, 2019. a, b, c
Khaykin, S. M., Godin-Beekmann, S., Hauchecorne, A., Pelon, J., Ravetta, F., and Keckut, P.: Stratospheric smoke with unprecedentedly high backscatter observed by lidars above southern France, Geophys. Res. Lett., 45, 1639–1646, https://doi.org/10.1002/2017GL076763, 2018. a, b, c
Kloss, C., Berthet, G., Sellitto, P., Ploeger, F., Bucci, S., Khaykin, S., Jégou, F., Taha, G., Thomason, L. W., Barret, B., Le Flochmoen, E., von Hobe, M., Bossolasco, A., Bègue, N., and Legras, B.: Transport of the 2017 Canadian wildfire plume to the tropics via the Asian monsoon circulation, Atmos. Chem. Phys., 19, 13547–13567, https://doi.org/10.5194/acp-19-13547-2019, 2019. a, b, c, d, e, f, g, h, i, j, k
Liu, X. and Penner, J. E.: Effect of Mount Pinatubo H2SO4 ∕ H2O aerosol on ice nucleation in the upper troposphere using a global chemistry and transport model, J. Geophys. Res., 107, AAC 2-1–AAC 2-18, https://doi.org/10.1029/2001JD000455, 2002. a
Mamouri, R. E. and Ansmann, A.: Fine and coarse dust separation with polarization lidar, Atmos. Meas. Tech., 7, 3717–3735, https://doi.org/10.5194/amt-7-3717-2014, 2014. a, b
Mamouri, R.-E. and Ansmann, A.: Potential of polarization lidar to provide profiles of CCN- and INP-relevant aerosol parameters, Atmos. Chem. Phys., 16, 5905–5931, https://doi.org/10.5194/acp-16-5905-2016, 2016. a, b, c
Mamouri, R.-E. and Ansmann, A.: Potential of polarization/Raman lidar to separate fine dust, coarse dust, maritime, and anthropogenic aerosol profiles, Atmos. Meas. Tech., 10, 3403–3427, https://doi.org/10.5194/amt-10-3403-2017, 2017. a, b, c, d
Mattis, I., Seifert, P., Müller, D., Tesche, M., Hiebsch, A., Kanitz, T., Schmidt, J., Finger, F., Wandinger, U., and Ansmann, A.: Volcanic aerosol layers observed with multiwavelength Raman lidar over central Europe in 2008–2009, J. Geophys. Res., 115, D00L04, https://doi.org/10.1029/2009JD013472, 2010. a, b
Mattis, I., D'Amico, G., Baars, H., Amodeo, A., Madonna, F., and Iarlori, M.: EARLINET Single Calculus Chain – technical – Part 2: Calculation of optical products, Atmos. Meas. Tech., 9, 3009–3029, https://doi.org/10.5194/amt-9-3009-2016, 2016. a, b
Navas‐Guzmán, F., Müller, D., Bravo‐Aranda, J. A., Guerrero‐Rascado, J. L., Granados‐Muñoz, M. J., Pérez‐Ramírez, D., Olmo,, F. J., and Alados‐Arboledas, L.: Eruption of the Eyjafjallajökull Volcano in spring 2010: Multiwavelength Raman lidar measurements of sulphate particles in the lower troposphere, J. Geophys. Res.-Atmos., 118, 1804–1813, https://doi.org/10.1002/jgrd.50116, 2013. a
Pappalardo, G., Mona, L., D'Amico, G., Wandinger, U., Adam, M., Amodeo, A., Ansmann, A., Apituley, A., Alados Arboledas, L., Balis, D., Boselli, A., Bravo-Aranda, J. A., Chaikovsky, A., Comeron, A., Cuesta, J., De Tomasi, F., Freudenthaler, V., Gausa, M., Giannakaki, E., Giehl, H., Giunta, A., Grigorov, I., Groß, S., Haeffelin, M., Hiebsch, A., Iarlori, M., Lange, D., Linné, H., Madonna, F., Mattis, I., Mamouri, R.-E., McAuliffe, M. A. P., Mitev, V., Molero, F., Navas-Guzman, F., Nicolae, D., Papayannis, A., Perrone, M. R., Pietras, C., Pietruczuk, A., Pisani, G., Preißler, J., Pujadas, M., Rizi, V., Ruth, A. A., Schmidt, J., Schnell, F., Seifert, P., Serikov, I., Sicard, M., Simeonov, V., Spinelli, N., Stebel, K., Tesche, M., Trickl, T., Wang, X., Wagner, F., Wiegner, M., and Wilson, K. M.: Four-dimensional distribution of the 2010 Eyjafjallajökull volcanic cloud over Europe observed by EARLINET, Atmos. Chem. Phys., 13, 4429–4450, https://doi.org/10.5194/acp-13-4429-2013, 2013. a
Pappalardo, G., Amodeo, A., Apituley, A., Comeron, A., Freudenthaler, V., Linné, H., Ansmann, A., Bösenberg, J., D'Amico, G., Mattis, I., Mona, L., Wandinger, U., Amiridis, V., Alados-Arboledas, L., Nicolae, D., and Wiegner, M.: EARLINET: towards an advanced sustainable European aerosol lidar network, Atmos. Meas. Tech., 7, 2389–2409, https://doi.org/10.5194/amt-7-2389-2014, 2014. a, b
Peterson, D. A., Hyer, E. J., Campbell, J. R., Solbrig, J. E., and Fromm, M. D.: A conceptual model for development of intense pyrocumulonimbus in western North America, Mon. Weather Rev., 145, 2235–2255, https://doi.org/10.1175/MWR-D-16-0232.1, 2017. a
Peterson, D. A., Campbell, J. R., Hyer, E. J., Fromm, M. D., Kablick III, G. P., Cossuth, J. H., and DeLand, M. T.: Wildfire-driven thunderstorms cause a volcano-like stratospheric injection of smoke, npj Clim. Atmos. Sci., 1, 30, https://doi.org/10.1038/s41612-018-0039-3, 2018. a, b, c, d
Petzold, A., Ogren, J. A., Fiebig, M., Laj, P., Li, S.-M., Baltensperger, U., Holzer-Popp, T., Kinne, S., Pappalardo, G., Sugimoto, N., Wehrli, C., Wiedensohler, A., and Zhang, X.-Y.: Recommendations for reporting “black carbon” measurements, Atmos. Chem. Phys., 13, 8365–8379, https://doi.org/10.5194/acp-13-8365-2013, 2013. a
Pueschel, R. F., Verma, S., Rohatschek, H., Ferry, G. V., Boiadjieva, N., Howard, S. D., and Strawa, A. W.: Vertical transport of anthropogenic soot aerosol into the middle atmosphere, J. Geophys. Res., 105, 3727–3736, https://doi.org/10.1029/1999JD900505, 2000. a, b, c
Renard, J.-B., Brogniez, C., Berthet, G., Bourgeois, Q., Gaubicher, B., Chartier, M., Balois, J.-Y., Verwaerde, C., Auriol, F., Francois, P., Daugeron, D., and Engrand, C.: Vertical distribution of the different types of aerosols in the stratosphere: Detection of solid particles and analysis of their spatial variability, J. Geophys. Res., 113, D21303, https://doi.org/10.1029/2008JD010150, 2008. a
Rissler, J., Messing, M. E., Malik, A. I., Nilsson, P. T., Nordin, E. Z., Bohgard, M., Sanati, M., and Pagels, J. H.: Effective density characterization of soot agglomerates from various sources and comparison to aggregation theory, Aerosol Sci. Technol., 47, 792–805, https://doi.org/10.1080/02786826.2013.7913, 2013. a, b
Rohatschek, H.: Levitation of stratospheric and mesospheric aerosols by gravito-photophoresis, J. Aerosol. Sci., 27, 467–475, 1996. a, b
Rosenfeld, D., Fromm, M., Trentmann, J., Luderer, G., Andreae, M. O., and Servranckx, R.: The Chisholm firestorm: observed microstructure, precipitation and lightning activity of a pyro-cumulonimbus, Atmos. Chem. Phys., 7, 645–659, https://doi.org/10.5194/acp-7-645-2007, 2007. a
Sassen, K., Starr, D. O. C., Mace, G. G., Poellot, M. R., Melfi, S. H., Eberhard, W. L., Spinhirne, J. D., Eloranta, E. W., Hagen, D. E., and Hallett, J.: The 5–6 December 1991 FIRE IFO II jet stream cirrus case study: Possible influences of volcanic aerosols, J. Atmos. Sci., 52, 97–123, 1995. a
Sawamura, P., Vernier, J. P., Barnes, J. E., Berkoff, T. A., Welton, E. J., Alados-Arboledas, L., Navas-Guzmán, F., Pappalardo, G., Mona, L., Madonna, F., Lange, D., Sicard, M., Godin-Beekmann, S., Payen, G., Wang, Z., Hu, S., Tripathi, S. N., Cordoba-Jabonero, C., and Hoff, R. M.: Stratospheric AOD after the 2011 eruption of Nabro volcano measured by lidars over the Northern Hemisphere, Environ. Res. Lett., 7 034013, https://doi.org/10.1088/1748-9326/7/3/034013, 2012. a
Seviour, W. J. M., Butchart, N., and Hardiman, S. C.: The Brewer–Dobson circulation inferred from ERA-Interim, Q. J. Roy. Meteorol. Soc., 138, 878–888, https://doi.org/10.1002/qj.966, 2012. a
Siddaway, J. M. and Petelina, S. V.: Transport and evolution of the 2009 Australian Black Saturday bushfire smoke in the lower stratosphere observed by OSIRIS on Odin, J. Geophys. Res., 116, D06203, https://doi.org/10.1029/2010JD015162, 2011. a, b, c
Smith, A. J. A., Peters, D. M., McPheat, R., Lukanihins, S., and Grainger, R. G.: Measuring black carbon spectral extinction in the visible and infrared, J. Geophys. Res.-Atmos., 120, 9670–9683, https://doi.org/10.1002/2015JD023564, 2015. a
Trickl, T., Giehl, H., Jäger, H., and Vogelmann, H.: 35 yr of stratospheric aerosol measurements at Garmisch-Partenkirchen: from Fuego to Eyjafjallajökull, and beyond, Atmos. Chem. Phys., 13, 5205–5225, https://doi.org/10.5194/acp-13-5205-2013, 2013. a, b
Trickl, T., Vogelmann, H., Giehl, H., Scheel, H.-E., Sprenger, M., and Stohl, A.: How stratospheric are deep stratospheric intrusions?, Atmos. Chem. Phys., 14, 9941–9961, https://doi.org/10.5194/acp-14-9941-2014, 2014. a
Trickl, T., Vogelmann, H., Fix, A., Schäfler, A., Wirth, M., Calpini, B., Levrat, G., Romanens, G., Apituley, A., Wilson, K. M., Begbie, R., Reichardt, J., Vömel, H., and Sprenger, M.: How stratospheric are deep stratospheric intrusions? LUAMI 2008, Atmos. Chem. Phys., 16, 8791–8815, https://doi.org/10.5194/acp-16-8791-2016, 2016. a
Ullrich, R., Hoose, C., Möhler, O., Niemand, M., Wagner, R., Höhler, K., Hiranuma, N., Saathoff, H., and Leisner, T.: A new ice nucleation active site parameterization for desert dust and soot, J. Atmos. Sci., 74, 699–717, https://doi.org/10.1175/JAS-D-16-0074.1, 2017. a, b, c, d, e
Vernier, J., Fairlie, T.D., Deshler, T., Venkat Ratnam, M., Gadhavi, H., Kumar, B. S., Natarajan, M., Pandit, A. K., Akhil Raj, S. T., Hemanth Kumar, A., Jayaraman, A., Singh, A. K., Rastogi, N., Sinha, P. R., Kumar, S., Tiwari, S., Wegner, T., Baker, N., Vignelles, D., Stenchikov, G., Shevchenko, I., Smith, J., Bedka, K., Kesarkar, A., Singh, V., Bhate, J., Ravikiran, V., Durga Rao, M., Ravindrababu, S., Patel, A., Vernier, H., Wienhold, F. G., Liu, H., Knepp, T. N., Thomason, L., Crawford, J., Ziemba, L., Moore, J., Crumeyrolle, S., Williamson, M., Berthet, G., Jegou, F., and Renard, J.: BATAL: The Balloon Measurement Campaigns of the Asian Tropopause Aerosol Layer, B. Am. Meteorol. Soc., 99, 955–973, https://doi.org/10.1175/BAMS-D-17-0014.1, 2018. a
Yu, P., Toon, O. B., Bardeen, C. G., Zhu, Y., Rosenlof, K. H., Portmann, R. W., Thornberry, T. D., Gao, R.-S., Davis, S. M., Wolf, E. T., de Gouw, J., Peterson, D. A., Fromm, M. D., and Robock, A.: Black carbon lofts wildfire smoke high into the stratosphere to form a persistent plume, Science, 365, 587–590, https://doi.org/10.1126/science.aax1748, 2019. a, b, c, d, e, f, g, h, i, j, k, l
Zuev, V. V., Gerasimov, V. V., Nevzorov, A. V., and Savelieva, E. S.: Lidar observations of pyrocumulonimbus smoke plumes in the UTLS over Tomsk (Western Siberia, Russia) from 2000 to 2017, Atmos. Chem. Phys., 19, 3341–3356, https://doi.org/10.5194/acp-19-3341-2019, 2019. a