the Creative Commons Attribution 4.0 License.
the Creative Commons Attribution 4.0 License.
 | 10 Dec 2019
A study of volatility by composition, heating, and dilution measurements of secondary organic aerosol from 1,3,5-trimethylbenzene
Yuji Fujitani
Satoshi Inomata
Yu Morino
Kiyoshi Tanabe
Toshihide Hikida
Akio Shimono
Akinori Takami
Akihiro Fushimi
Yoshinori Kondo
Takashi Imamura
Hiroshi Tanimoto
Seiji Sugata
Studies of the volatility distribution of secondary organic aerosol (SOA) from aromatic compounds are limited compared with SOA from biogenic monoterpenes. In this study, the volatility distribution was investigated by composition, heating, and dilution measurements for SOA formed from the photooxidation of 1,3,5-trimethylbenzene in the presence of NOx. Composition studies revealed that highly oxygenated monomers (C9H14Ox, x = 4–7) and dimers (C18H26Ox, x = 8–12) are the major products in SOA particles. Highly oxygenated molecules (HOMs) with five or more oxygens were formed during photochemical aging, whereas dimers degraded during photochemical aging. HOMs with five or more oxygens may be produced from the photooxidation of phenol-type gaseous products, whereas dimers in the particle phase may be photolyzed to smaller molecules during photochemical aging. The results of composition, heating, and dilution measurements showed that fresh SOA that formed from 1,3,5-trimethylbenzene (TMB) photooxidation includes low-volatility compounds with <1 µg m−3 saturation concentrations, which are attributed to dimers. Similar results were reported for α-pinene SOA in previous studies. Low-volatility compounds with <1 µg m−3 saturation concentrations are not included in the volatility distributions employed in the standard volatility basis-set (VBS) approach. Improvements in the organic aerosol model will be necessary for the study of anthropogenic SOA as well as biogenic SOA.
- Article
(536 KB) - Full-text XML
- Companion paper
-
Supplement
(947 KB) - BibTeX
- EndNote


Secondary organic aerosol (SOA) is a major component of atmospheric fine particles (Zhang et al., 2007), affecting climate (IPCC, 2013) and human health (Dockery et al., 1993; Shiraiwa et al., 2017). Aromatic hydrocarbons are major sources of SOA in urban air (Hayes et al., 2015; Wu and Xie, 2018). SOA formed from the photooxidation of aromatic hydrocarbons is predicted to have a 33 % contribution to the global SOA production by atmospheric-model calculations (Kelly et al., 2018).
Volatility basis-set (VBS) models have improved underestimation of atmospheric organic aerosol levels by accounting for the decrease in organic aerosol volatility with photochemical aging (Robinson et al., 2007). Morino et al. (2015) reported that a VBS model still underestimates organic aerosol concentrations in urban environments, although predictions in remote environments show better agreement with observations. The results reported by Morino et al. (2015) suggest that current VBS models, as well as the emission inventory, still include uncertainties. The volatility distribution of SOA, a key property in the prediction of particle levels in VBS models, has been investigated by several experimental techniques. Lane et al. (2008) used laboratory SOA yield data (e.g., Izumi and Fukuyama, 1990; Odum et al., 1997; Ng et al., 2007) to evaluate the volatility distributions for standard VBS models. The yield curve analysis for laboratory data assumes gas-phase single-step oxidation of volatile organic compounds (VOCs) during laboratory experiments and gas–particle equilibrium. If these assumptions are not applicable, the volatility distributions obtained from yield curve analysis may not be accurate.
Particle volatility distribution can also be studied by heating measurements (Baltensperger et al., 2005; Kolesar et al., 2015; Docherty et al., 2018). Heating measurements provide volatilities at high temperatures. The enthalpy of vaporization is needed to determine the volatility distribution at ambient temperatures. Furthermore, thermal decomposition may affect the results obtained by this method. Another technique used to study volatility distribution is the dilution method, which has been successfully applied to the volatility studies of diesel exhaust particles (Robinson et al., 2007; Fujitani et al., 2012). This technique is also used for SOA formed from the α-pinene ozonolysis (e.g., Grieshop et al., 2007; Saleh et al., 2013), but to the best of our knowledge, SOA from aromatic hydrocarbons has not been investigated by this method. Saleh et al. (2013) reported that the equilibration timescales for dilution of α-pinene SOA particles were several tens of minutes. Data from dilution measurements may be affected by long equilibration timescales due to low particle number concentrations and/or low mass accommodation coefficients.
Chemical analysis can also provide the product volatility distribution as well as formation mechanisms of products. Mass spectrometry combined with a soft ionization method, such as electrospray ionization (ESI) and chemical ionization, can identify a wide range of oxygenated organic molecules. These techniques identified small organic acids, highly oxygenated molecules (HOMs), and oligomers present in SOA particles from aromatic hydrocarbons (Kalberer et al., 2004; Fisseha et al., 2004; Sato et al., 2012; Praplan et al., 2014; Molteni et al., 2018). HOMs are formed through auto-oxidation mechanisms, which include the intramolecular hydrogen abstraction of organic peroxy radicals (Zhang et al., 2017), but it is still unclear whether or not the suggested intramolecular reaction occurs for the peroxy radicals from aromatic hydrocarbons. Oligomers may be produced by acid-catalyzed oligomerization (Kalberer et al., 2004) and/or gas-phase bimolecular reactions of peroxy radicals (Molteni et al., 2018). Recent studies on the parameterization of the saturation concentration (Shiraiwa et al., 2014; Li et al., 2016) and the sensitivity of ESI mass spectrometry (Kruve et al., 2013; Heinritzi et al., 2016) are helpful in the evaluation of SOA volatility using mass analysis data.
In this study, the photooxidation of 1,3,5-trimethylbenzene (TMB) in the presence of NOx was investigated to evaluate the volatility distribution of SOA. Although the volatility distribution of α-pinene SOA has been investigated in several laboratories (Sato et al., 2018 and references therein), the number of studies addressing the volatility of SOA from aromatic hydrocarbons is limited. Products formed from the photooxidation of TMB were further exposed to OH radicals to study the effect of photochemical aging. The volatility distribution of SOA was evaluated by composition, heating, and dilution measurements. This work aims to evaluate the volatility distribution of SOA from a typical anthropogenic VOC and discuss SOA formation processes for improving organic aerosol modeling.
2.1 Chamber experiment
A 6 m3 Teflon-coated stainless-steel chamber (Sato et al., 2007, 2018) was used for all experiments. Figure S1 in the Supplement shows a schematic diagram of the chamber system and analytical instruments. We listed initial concentrations together with SOA mass concentrations and mean sizes observed immediately before the sampling for the composition or dilution study (Table S1 in the Supplement). Prior to each experiment, the chamber was filled with dry purified air (1 atm, relative humidity <1 %). The temperature of the chamber was controlled at 298±1 K. Required amounts of TMB, NO, and methyl nitrite were added to the purified air in the chamber. A small amount (∼0.01 ppm) of methyl nitrite was added because it was used as an OH radical source for the initiation of photooxidation. The reaction mixture in the chamber was irradiated by light from 19 xenon lamps (1 kW each) through Pyrex filters. In normal photooxidation experiments (i.e., runs other than run 2), composition, heating, and dilution measurements of SOA particles were conducted after 240 min irradiation. In an aging experiment (run 2), ∼1 ppmv methyl nitrite was added at 239 and 299 min to expose photooxidation products to OH radicals. The concentrations of TMB, NO, and methylglyoxal (MEGLY) were measured every 6 min by a Fourier transform infrared (FT-IR) spectrometer (Nexus 670, Thermo Fisher Scientific, USA), with a 221.5 m optical path. For dilution measurements, ∼20 ppmv CO was added to the reaction mixture as a dilution marker. The CO levels before and after dilution were measured using a CO monitor (model 48i-TLE, Thermo Fisher Scientific, USA).
We investigated SOA formation under dry conditions only because the chamber facility was designed for dry use (Akimoto et al., 1979). Present experiments with dry air will simulate a dry urban atmosphere, in which aqueous-phase chemistry during SOA formation will be suppressed (Kamens et al., 2011; Zhou et al., 2011). In the present study, proton transfer reaction mass spectrometer (PTR-MS) and dilution measurements required the SOA mass concentrations to be >100 µg m−3 in order to obtain sufficient signals (Table S1). In order to form the desired amounts of SOA, we set the initial TMB concentrations to ppm levels. We note that a TMB concentration higher than ambient levels may induce RO2+RO2 reactions in comparison to ambient conditions, although we observed no experimental evidence of the enhancement of these reactions.
SOA mass concentration was measured every 3 min using an aerosol mass spectrometer (AMS) (H-ToF-AMS, Aerodyne Research, USA) (Aiken et al., 2008). The heating measurements were started immediately after sampling for the composition or dilution study. A thermal denuder (TD) equipped with a bypass line (Aerodyne Research, USA) (Huffmann et al., 2008; Faulhaber et al., 2009) was combined with the AMS instrument for heating measurements. During each heating measurement cycle, we used the bypass first for 9 min to obtain the reference data and then used the TD for 15 min to obtain the data for a specific temperature. Particle size distribution was observed every 3 min using a scanning mobility particle sizer (SMPS) (model 3034, TSI, USA). The effective particle density was measured using a combination of a differential mobility analyzer (DMA) (Sibata Scientific Technology, Japan), an aerosol particle mass analyzer (APM) (Model 3600, Kanomax, Japan), and a condensation particle counter (CPC) (Model 3772, TSI, USA). The effective density of SOA was determined to be 1.40±0.28 g cm−3, which is close to the values found in the literature: 1.35–1.40 g cm−3 (Alfarra et al., 2006).
2.2 LC-TOF-MS analysis
Chemical composition analysis was conducted using positive-mode ESI liquid-chromatography time-of-flight mass spectrometry (LC-TOF-MS) (Agilent Technologies, UK). The mass calibration and lock-mass correction were conducted using G1969-85000 and G1969-85001 tuning mixtures (Agilent Technologies, UK), respectively. A mass resolution of the mass spectrometer (full width at half maximum) was > 20 000. SOA particles were collected on a Fluoropore Teflon filter (Sumitomo Electric Industries, Japan; 47 mm φ, pore size: 1 µm) at 16.7 L min−1 for 30 min. The filter sampling was performed at irradiation times of 272 and 411 min in normal photooxidation (run 1) and aging experiments (run 2), respectively. After sampling, the filter sample was sonicated in 5 mL methanol for 30–38 min. The filter extract was concentrated to near dryness under ∼1 L min−1 stream of nitrogen. A 1 mL formic-acid–methanol–water solution () was added to the concentrated extract to obtain the analytical sample. A 10 µL aliquot of the analytical sample was injected into the LC-TOF-MS instrument and separated with an octadecyl silica gel column (Inertsil ODS-3, GL Science, Japan; 0.5 µm × 3.0 mm × 150 mm). A formic-acid–water solution (0.05 % v∕v) and methanol were used as mobile phases. The methanol fraction during each analysis was set at 10 % (0 min), 90 % (30 min), 90 % (40 min), 10 % (45 min), and 10 % (60 min). In our previous study (Sato et al., 2007), the recovery of malic acid with a saturation concentration of 157 µg m−3 was determined to be >90 %, suggesting that evaporation loss during pre-treatment is negligible for molecules with saturated concentrations of 157 µg m−3 or less.
2.3 PTR-MS measurements
Gas and particle products were measured using a PTR-MS (PTR-QMS 500, Ionicon Analytik, Austria) (Lindinger et al., 1998) to determine the saturation concentration of each product (Inomata et al., 2014). To measure the products in the gas phase, online measurements were taken from the filtered chamber air at 240 and 359 min in the normal photooxidation (run 1) and aging experiments (run 2), respectively. Afterwards, particles were collected on another Fluoropore Teflon filter at 16.7 L min−1 for 30–50 min to measure products in the particle phase. The sample filter was placed in a filter holder, which was then heated at 368 K under a stream of nitrogen. The gases evaporating from the filter were measured using the PTR-MS. The saturation concentration was calculated from the gas–particle ratio determined by the PTR-MS for each mass-to-carbon ratio (m∕z), assuming gas–particle equilibrium. The procedure used for calculating the saturation concentration is described in Sect. S1 in the Supplement.
2.4 Dilution measurement
Another 6 m3 fluorinated ethylene propylene (FEP) film bag was used as an external dilution chamber (EDC) in runs 3, 4, 5, and 6. The temperature of the laboratory was controlled at 298±1 K. Prior to each dilution experiment, the EDC was filled with dry purified air (relative humidity <1 %). A necessary amount of reaction chamber air was injected into the EDC using a dilution ejector (FPS-4000, Dekati Ltd., Finland) at ∼240 min of irradiation time. The dilution ratio (DR) was set to 20–86. Dry filtered air was used as the carrier of the dilution ejector. The particle size distribution, particle density, and CO concentration in the EDC were monitored after the SOA dilution. The required duration for gas transfer from the reaction chamber to the EDC was 13 min or less. During gas transfer, CO might decrease due to either dilution effects and/or to the reaction with OH radicals. We ignored the reaction of CO in the EDC because the EDC was not irradiated. However, before gas transfer was complete, a portion of diluted gas remained in the irradiated reaction chamber; the decrease in this portion might lead to an overestimation of the DR. Even though we assume a maximum level of OH radicals (107 molecules cm−3), CO decreases by only ≤2 % due to the reaction with OH radicals for ≤13 min. Thus we ignored the overestimation of the DR due to the reaction of CO with OH radicals. We conducted dilution experiments under flow conditions using the dilution ejector in run 7. We confirmed that negligible evaporation occurred immediately after dilution, in accordance with the previous results reported for α-pinene SOA (Grieshop et al., 2007).
3.1 Time series
Figure 1 shows a time series of (a) TMB and MEGLY concentrations observed by the FT-IR, (b) SOA mass concentrations observed by the AMS, and (c) O∕C the ratio observed for SOA by the AMS during normal photooxidation (run 1) and aging experiments (run 2). The MEGLY concentration increased with decreasing the TMB concentration in runs 1 and 2. Methyl nitrite was added at irradiation times of 239 and 299 min in run 2. The first injection of methyl nitrite was aimed at completing the photooxidation of the remaining TMB, whereas the second injection was aimed at ensuring that the photooxidation of gaseous secondary products is promoted. The total OH exposures were determined to be 5.0×10¹⁰ and 6.2×10¹⁰ molecule cm−3 s−1 for the first (239–299 min) and second exposures (299–359 min), respectively. The total OH exposures were calculated by integrating the OH concentrations over irradiation time. The OH concentration at each irradiation time was calculated assuming the steady state between OH formation from the methyl nitrite photolysis and OH reactions with TMB, MEGLY, formic acid, and NO2.
where we used present FT-IR data for the concentrations and literature values for the rate coefficients. If we assume that the daytime OH radical concentration is 106, the first and second exposures corresponded to 14 and 17 h photooxidation under ambient conditions. The TMB that remained after the first addition of methyl nitrite was entirely consumed within 1 h. The concentration of MEGLY slightly increased after the first addition of methyl nitrite due to formation from the remaining TMB and then decreased by the photo-degradation of MEGLY. The decreasing rate of MEGLY increased after the second addition of methyl nitrite, suggesting that the concentration of OH radicals increased due to the second addition of methyl nitrite.
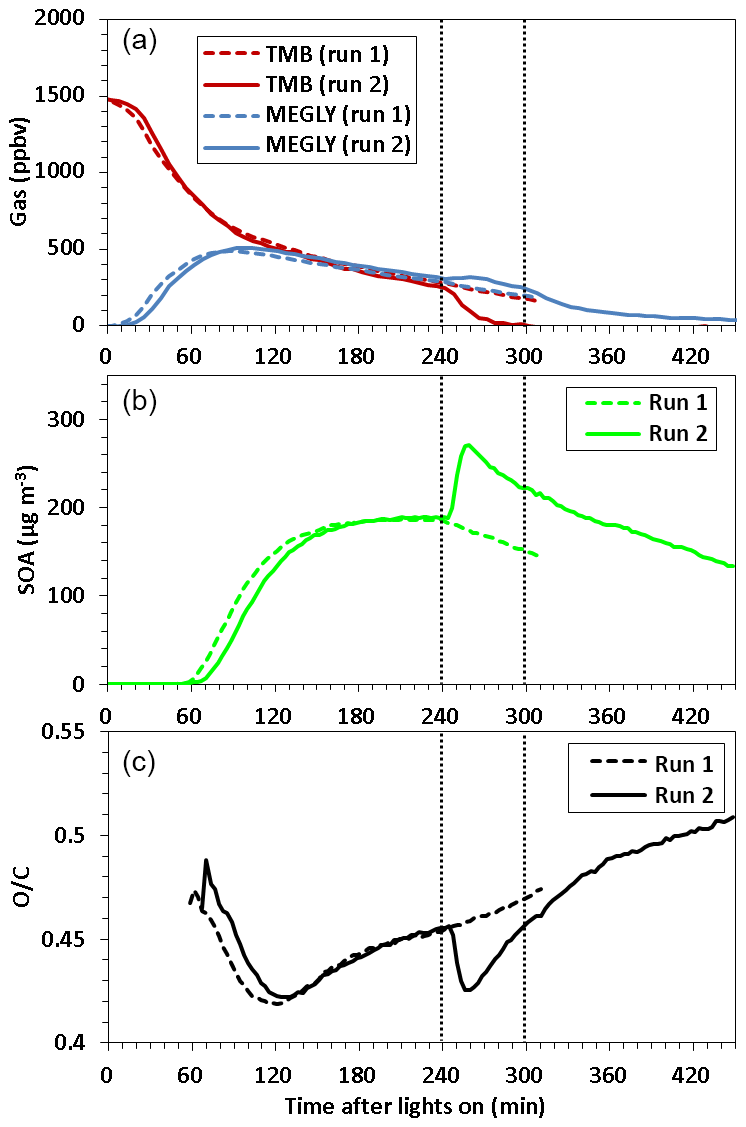
Figure 1Time series of (a) TMB and methylglyoxal (MEGLY) concentrations observed by FT-IR, (b) SOA mass concentration observed by AMS, and (c) O∕C ratio observed for organic aerosol by AMS during normal photooxidation (run 1) and aging experiments (run 2). Methyl nitrite was added in run 2 at the irradiation times indicated by vertical dotted straight lines.
SOA particles became detectable at an irradiation time of 55–58 min in runs 1 and 2. Afterwards, the SOA mass concentration increased with time, reaching to ∼189 µg m−3 at 239 min of irradiation time for both runs. After the first addition of methyl nitrite in run 2, the mass concentration of SOA increased to 259 µg m−3. SOA, forming after the first addition of methyl nitrite, could be formed from the photooxidation of TMB as well as gaseous secondary products. The mass concentration of SOA then decreased with a rate of s−1. The geometric mean particle size after OH exposure was 558 nm, which was larger than for run 1 (395 nm). The wall loss rates of ammonium sulfate particles with sizes of 279–322 and 372–429 nm were measured using the present reaction chamber to be ( and s−1, respectively. Particle wall loss may explain the observed decrease in SOA mass concentration. No great change in the decreasing rate was observed when methyl nitrite was added for the second time.
In the early stages of SOA formation, the O∕C ratio decreased with increasing time, probably because new particle formation from HOMs was followed by condensation of less oxygenated compounds from the gas phase. After ∼120 min of irradiation time, the O∕C ratio increased because of photochemical aging. After the first addition of methyl nitrite in run 2, the O∕C ratio decreased, likely because of the formation of fresh SOA from the photooxidation of the remaining TMB or an increase in the mass concentration followed by the condensation of less oxygenated compounds. The O∕C ratio reached a minimum at 256 min and then again increased with time. The O∕C ratio increased continuously after the second addition of methyl nitrite. Filter sampling of SOA for LC-TOF-MS analysis took place at irradiation times of 272 and 411 min in runs 1 and 2, respectively. The O∕C ratio observed at the start time of filter sampling in run 2, 0.50, was higher than that observed at the start time of filter sampling in run 1, 0.46, indicating that the filter sample collected in the aging experiment must be more highly oxygenated than that collected in the normal photooxidation experiment.
3.2 LC-TOF-MS analysis
Figure 2 shows the mass spectra observed using the positive-mode ESI mass spectrometer for SOA samples collected in (a) run 1 and (b) run 2. These results were obtained by direct infusion of SOA samples into the ESI mass spectrometer. Strong signals measured by the positive-mode ESI analysis were identified as sodium-attached product ions. No sodium salt was added to the mobile phase or analytical sample. Species that do not generate stable positive ions through protonation were ionized by clustering with Na+ cations that are naturally present in the solvent chemicals and glassware (Kruve et al., 2013; Zhang et al., 2017). The signal intensities of the sodium-attached ions were confirmed to have a linear relationship with the amount of the injected sample.
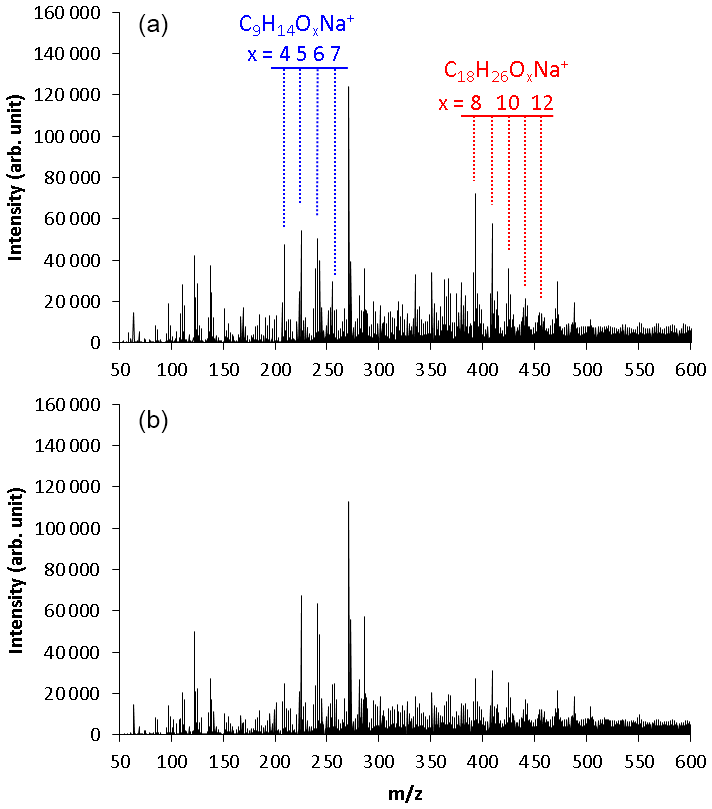
Figure 2Mass spectra observed using positive-mode electrospray ionization time-of-flight mass spectrometry for TMB SOA samples collected in (a) normal photooxidation (run 1) and (b) aging experiments (run 2). These results were obtained by direct infusion of the SOA samples to the ESI mass spectrometer.
Two series of mass signals with a regular mass difference of 16 were measured in the regions m∕z 209–257 and m∕z 393–457. The signals observed in the region m∕z 209–257 were suggested to be C9H14Ox (x = 4–7) molecules clustered with Na+. The C9H14Ox products are HOMs with the same number of carbons as TMB and two more hydrogens than TMB. The highest peak of m∕z 271 was also observed in the analysis of blank samples, suggesting that this peak had a contribution from contaminants or solvents. Monomers detected in a previous online study, C9H14O5−11 (Molteni et al., 2018), are similar to those detected in our present offline analysis, but monomers detected in the previous study have slightly more oxygens than those detected in this study. A small portion of HOMs may decompose during the present offline analysis.
The signals observed in the region m∕z 393–457 were suggested to be C18H26Ox (x = 8–12) molecules clustered with Na+. The C18H26Ox products have twice as many carbons as TMB. These products are, thus, attributed to dimeric products. Similar products were observed between the samples collected in runs 1 and 2. Largely, monomer signals observed in run 2 were higher than in run 1, whereas dimer signals observed in run 2 were lower than in run 1.
Figure S2 shows the extracted-ion chromatograms (EICs) observed for (a) C9H14O4Na+, (b) C9H14O5Na+, and (c) C9H14O6Na+ by positive-mode LC-TOF-MS. We measured EICs using LC columns because mass signals observed without the column may be interfered from solvent and/or contaminant signals. Contaminant signals were checked from measurements with blank samples, and these contaminant signals were ignored from calculations of product signal intensity. Here, a blank sample was prepared by extracting a new Teflon filter. The method of extraction was similar to that used for the SOA samples. The chromatograms observed for C9H14O4Na+, C9H14O5Na+, and C9H14O6Na+ included at least 9, 8, and 11 chromatographic peaks, respectively, suggesting that each HOM product has a number of structural isomers. The total peak area observed for the C9H14O4 products in run 2 was lower than that observed in run 1, whereas the total peak areas observed for C9H14O5 and C9H14O6 products in run 2 were higher than those observed in run 1. Note that we collected similar amounts of SOA between runs 1 and 2 (i.e., 122 and 114 µg for runs 1 and 2, respectively).
3.3 Saturation concentration calculations
Table S2 summarizes the measured mass-to-charge ratio, suggested ion formula, calculated molecular weight, measured total intensity of EIC peaks, calculated O∕C ratio, and predicted saturation concentrations for products existing in SOA. A common logarithm of the saturation concentration of each product (log 10 C∗) was calculated by using Eq. (1), which predicts log 10 C∗ as a function of the number of carbon, nitrogen, and oxygen atoms included in a referred molecule (Li et al., 2016).
where nC is the number of carbons, nO is the number of oxygens, nN is the number of nitrogens, and , bC, bO, and bN are coefficients determined by fitting. Two different sets of coefficients were used in this study. One was a set of coefficients determined by fitting to log 10 C∗ data calculated by a SPARC (SPARC Performs Automated Reasoning in Chemistry) calculator (Hilal et al., 2003) for CHO and CHNO products formed from the photooxidation of TMB. The , bC, bO, and bN values determined were 41.53, 0.202, 0.8805, −0.05239, and −1.715, respectively. The root mean square error (RMSE) of predicted log 10 C∗ was determined to be 1.91, which corresponds to the uncertainty of the predicted log 10 C∗. The other set of parameters is that described by Li et al. (2016), who fitted the equation to the log 10 C∗ results calculated for over 30 000 compounds.
Figure S3 shows a molecular corridor plotted for products from the photooxidation of TMB, where a molecular corridor is a plot of molecular weight as a function of the logarithm of the saturation concentration (Shiraiwa et al., 2014). The saturation concentrations were calculated by a SPARC calculator (Hilal et al., 2003) for products reported by previous experimental studies (Smith et al., 1999; Kalberer et al., 2004; Fisseha et al., 2004; Sato et al., 2012; Praplan et al., 2014) and the Master Chemical Mechanism version 3.3.1 (MCM v3.3.1) (Jenkin et al., 2003). The SPARC calculator predicts vapor pressures accounting for the chemical structure, induction, resonance, and field effects. Table S3 shows simplified molecular-input line entry system (SMILES) code, saturation concentrations determined by the SPARC calculator, and molecular weights for products from the TMB photooxidation. The logarithm of the saturation concentrations calculated for TMB photooxidation products ranged from −7.99 to 9.86. The saturation concentrations were also determined experimentally from the results of present PTR-MS measurements. Results obtained for m∕z ≥150 by PTR-MS were only plotted in the molecular corridor because the signals observed for m∕z <150 were interfered with by fragmentations from compounds with higher molecular weights. Saturation concentrations calculated by the SPARC calculator showed agreement with those determined by present PTR-MS observations.
3.4 Volatility distributions based on LC-TOF-MS data
Figure 3 shows volatility versus carbon number mapping obtained from LC-TOF-MS results for particle-phase products in (a) run 1 and (b) run 2 and the volatility distribution determined for the sum of gas- and particle-phase products in (c) run 1 and (d) run 2. The size of the circle represents the normalized total EIC peak intensity. The volatility versus carbon number mapping shows that low-volatility compounds with are dimers. The color of the circle represents the O/C ratio of each product. The O∕C ratios of products were determined to be 0.24–0.89. The saturation concentration was predicted by Eq. (1) and adapted to TMB oxidation products. Compounds of 9-carbon (e.g., C9H14O5, C9H14O6, C9H16O6, and C9H13NO8) and 18-carbon compounds (e.g., C18H24O8, C18H26O8, C8H26O9, and C18H27NO12) are dominant monomer and dimer products, respectively. As discussed previously, signal intensities of dimers decreased during photochemical aging, whereas those of monomers with five or more oxygens increased during photochemical aging. The weighted O∕C average determined in the aging experiment, 0.57, was higher than the normal photooxidation experiment, 0.53, showing a qualitative agreement with the results of the O∕C ratio measured by the AMS. According to the LC-TOF-MS results, the weighted O∕C average increased, probably because monomers with five or more oxygens are formed during photochemical aging.
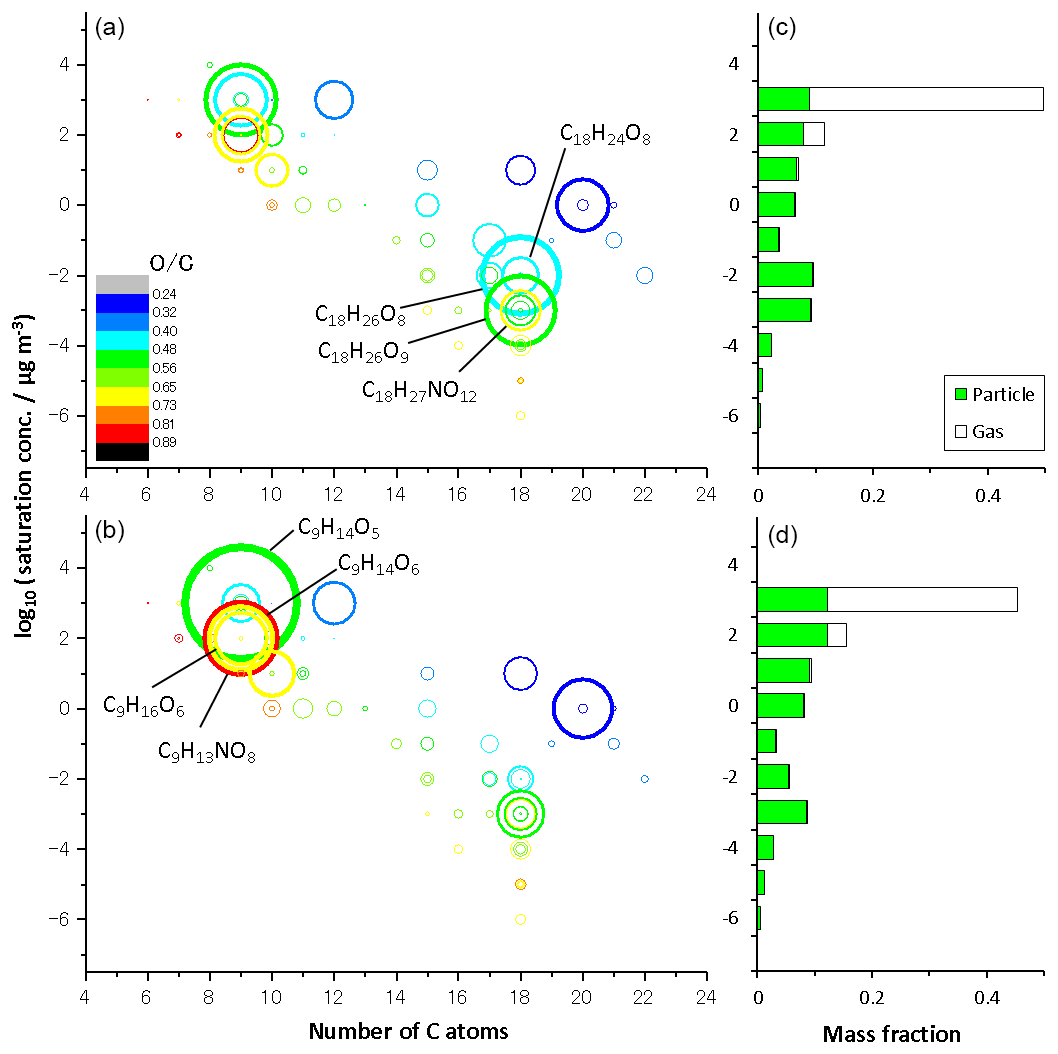
Figure 3Volatility versus carbon number mapping obtained from LC-TOF-MS results for particulate products in (a) normal photooxidation (run 1) and (b) aging experiments (run 2), and the volatility distribution determined for the sum of gaseous and particulate products in (c) normal photooxidation (run 1) and (d) aging experiments (run 2).
The volatility distributions with 10 bins were calculated for the gas- and particle-phase products, using the results of LC-TOF-MS analysis. The total EIC peak intensities were corrected assuming that the transmission efficiency for time-of-flight mass spectrometry is proportional to (Heinritzi et al., 2016). We assumed that the corrected signal intensity is proportional to the mass concentration in the particle phase. We divided the region between and 3.5 into 10 bins. The mass fraction in the particle phase was calculated for each bin by summing the corrected intensities among the products existing in the referred bin. The mass fraction of the gas phase was calculated assuming gas–particle equilibrium. The compound of existed predominantly in the gas phase, whereas less volatility compounds existed predominantly in the particle phase under present particle mass conditions. The volatility distributions determined from LC-TOF-MS data were bimodal. Two components of each volatility distribution were attributed to monomer and dimer products. The mass fractions between log 10 and 2 increased during photochemical aging due to the increase in monomers with five or more oxygens, whereas those between and −1 decreased during photochemical aging, due to the decrease in dimers. The weighted averages of log 10 C∗ were close between the normal photooxidation (1.15) and aging experiments (1.16). Here, the weighted averages are calculated using the total mass fraction as the weighting factor. We note that the sensitivity of ESI mass spectrometry is compound specific, thus the calculated distribution includes the uncertainties that result from compound-specific sensitivities. In this regard, however sodium adduct formation during ESI can ionize a wide range of oxygenated organic compounds, including carbonyls, peroxides, and alcohols (Kruve et al., 2013; Zhang et al., 2017).
Figure 4a–c compare the volatility distributions determined from LC-TOF-MS data employing different methods. Figure 4a shows the volatility distribution determined by predicting saturation concentrations (using Eq. 1 adapted to TMB photooxidation products) and correcting intensities accounting for transmission efficiencies. The volatility distribution was also calculated without correcting intensities to check the effect of the intensity corrections (Fig. 4b). Similar bimodal volatility distributions were obtained even if the signal intensities were not corrected. The average log 10 C∗ values determined without accounting for intensity corrections for normal photooxidation and aging experiments were 0.80 and 0.83, which were slightly lower than those determined with intensity corrections. Again, average log 10 C∗ values are weighted by the total mass fraction. The method used for saturation concentration predictions was also checked. Figure 4c shows the volatility distributions determined employing the unaltered equation proposed by Li et al. (2016). The average log 10 C∗ values determined for normal photooxidation and aging experiments were 0.34 and 0.39, respectively, suggesting that the results obtained employing the method of Li et al. were slightly lower than those determined from Eq. (1) adapted to TMB photooxidation products. Even though we take into account uncertainties for the saturation concentrations, all three results determined from LC-TOF-MS data suggest that low-volatility products with exist in SOA. As shown in Fig. 4f, these low-volatility compounds are not included in the volatility distribution determined by conventional yield curve analysis (Lane et al., 2008).
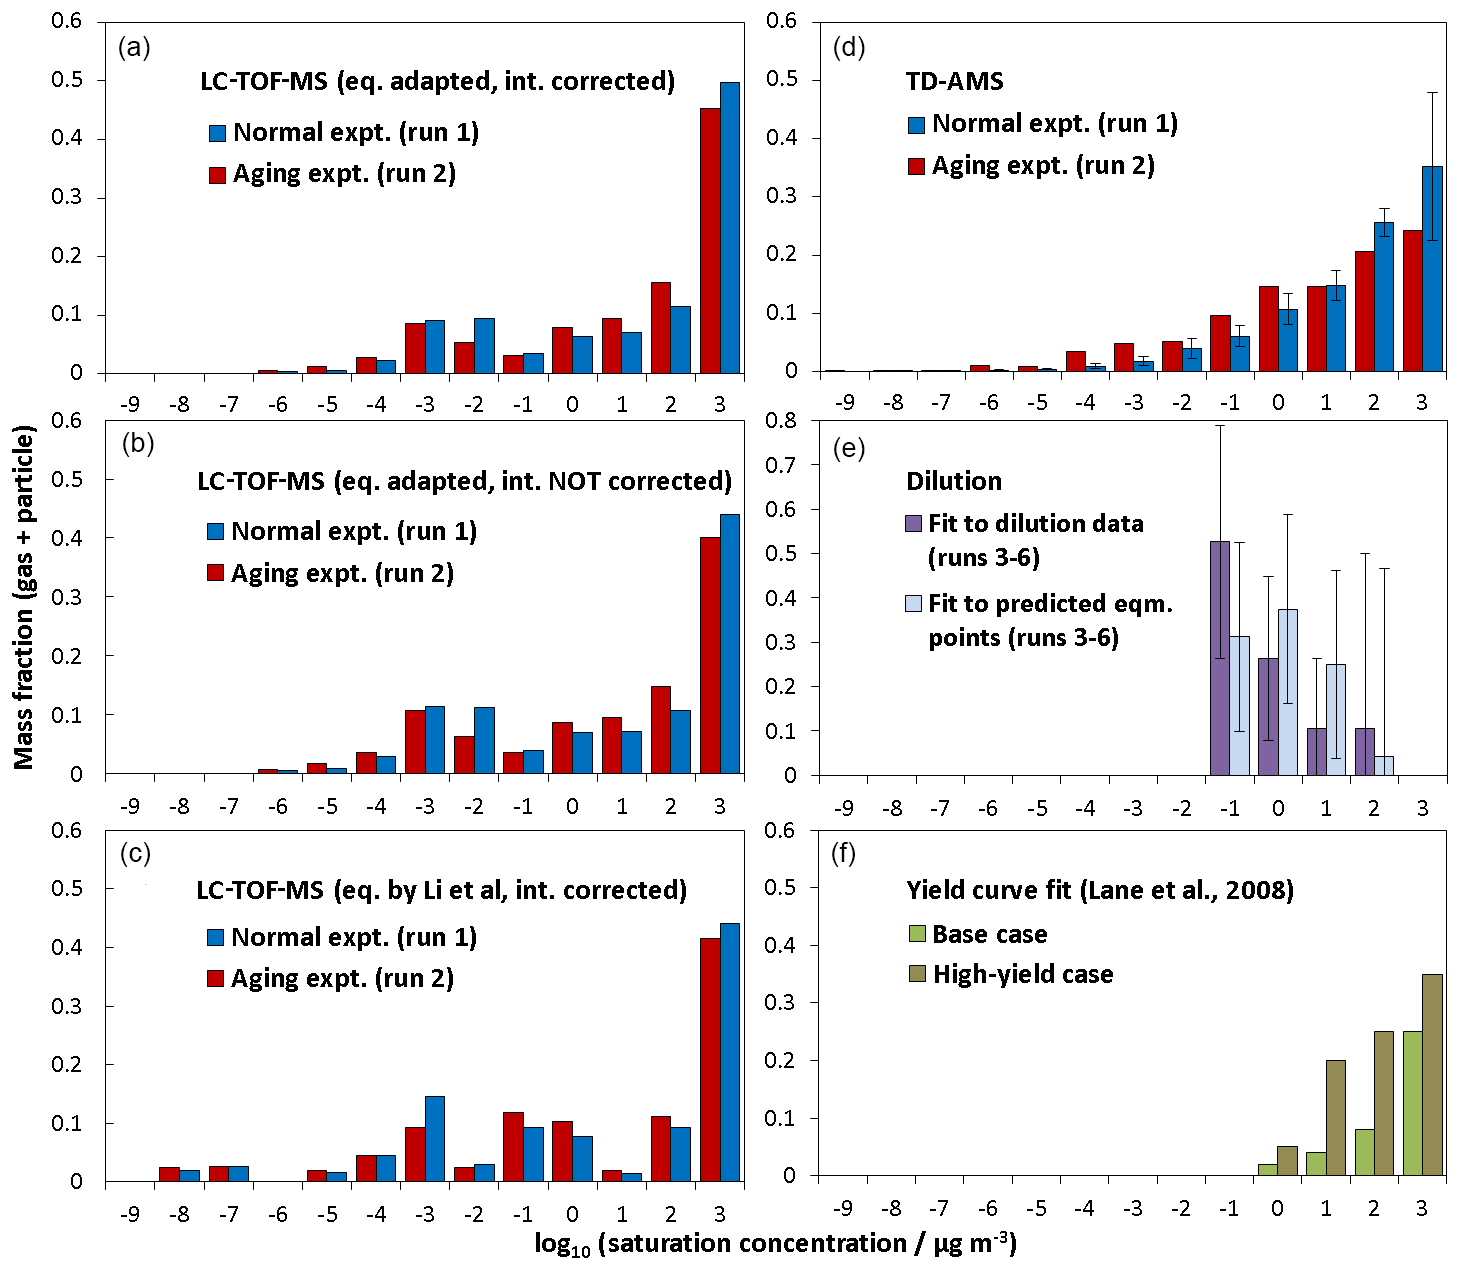
Figure 4Volatility distributions determined for products from TMB using (a) LC-TOF-MS results, (b) LC-TOF-MS results obtained without intensity correction, (c) LC-TOF-MS results obtained using equation by Li et al. (2016) for saturation concentration calculations, (d) TD-AMS results, (e) dilution results, and (f) results of previous yield curve analysis.
3.5 Reaction mechanism
Figure 5 shows mechanisms suggested for the formation and photochemical aging of abundant products. In this study, we found the C9H14O4−7 monomers and the C18H26O8−12 dimers to be major products. The photooxidation of TMB is mainly initiated by the addition of OH radicals to the aromatic ring. The produced adduct reacts with an oxygen molecule to form a peroxy radical, which undergoes a bridging reaction followed by an oxygen molecule addition to form a C9H13O5 peroxy radical (TM135BPRO2), according to the MCM mechanism. The TM135BPRO2 peroxy radical can undergo an auto-oxidation process (Wang et al., 2017), namely, intramolecular hydrogen abstraction and the following oxygen addition occur to form a C9H13O7 peroxy radical. Molteni et al. (2018) suggested the and reactions for the formation processes of monomer products (e.g., TM135BPOOH of the MCM mechanism) and dimer products, respectively, where RO2 is a highly oxygenated peroxy radical. Highly oxygenated monomers and dimers may also be formed from ring-opening RO2 radicals (Molteni et al., 2018), which are formed from the following reactions of bicyclic RO2 radicals (i.e., C9H13O5 and C9H13O7).
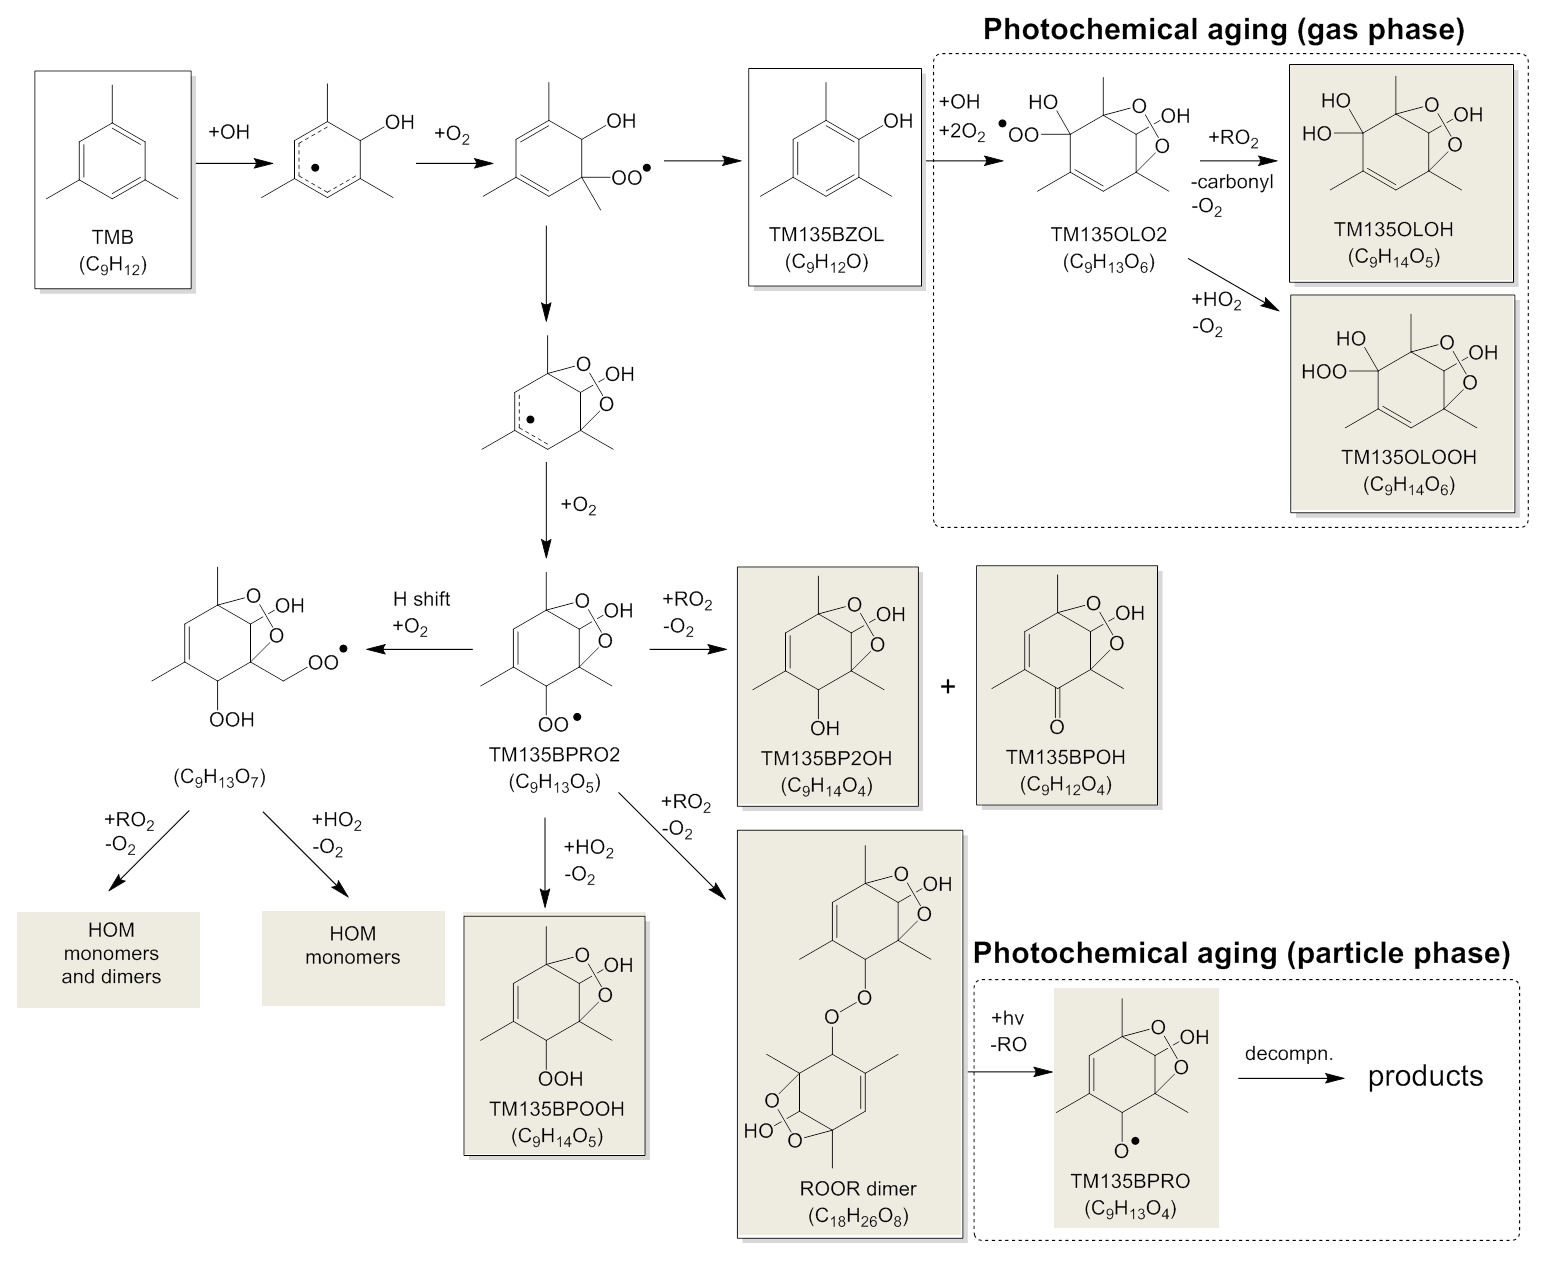
Figure 5Suggested mechanism for the formation and photochemical aging of abundant products. Shaded products may exist predominantly in the particle phase.
Since a relatively high concentration (i.e., ppm level) was used for the initial TMB concentration in this study, the auto-oxidation of RO2 might be suppressed by fast RO2+RO2 reactions. Currently, accurate rate constant values are not known for intramolecular hydrogen abstraction from RO2 (k1) and for the RO2+RO2 reaction (k2). We conducted the following preliminary calculations: the rate constant for the CH3O2+CH3O2 reaction ( cm3 molecule−1 s−1; DeMore et al., 1997) was employed as k2. We assumed the concentration of RO2 during the chamber experiments under ppm level conditions to be <1010 molecule cm−3. If this is the case, k2 [RO2] is determined to be s−1, which is sufficiently lower than the k1 value assumed for intramolecular hydrogen abstraction from RO2 (0.1 s−1; Praske et al., 2018). These results suggest that RO2 auto-oxidation will dominate even under ppm level conditions.
The mechanisms suggested by Molteni et al. (2018) can explain the number of hydrogen atoms in C18H26Ox dimers because monomer peroxy radicals have the structure C9H13Ox. For example, the bimolecular reaction between TM135BPRO2 (C9H13O5) radicals leads to the formation of C18H26O8 dimer + O2. The RO2+RO2 reactions also have another product pathway to form a combination of carbonyl and alcohol monomers (e.g., formation of TM135BP2OH + TM135BPOH in the MCM mechanism). The O∕C ratios of the C18H26O8−12 dimers, 0.44–0.67, were similar to those of the C9H14O4−7 monomers, 0.44–0.78. The mechanisms suggested by Molteni et al. (2018) are also consistent with the results of the O∕C ratios; in this mechanism, the O∕C ratios of monomers and dimers are determined by those of abundant RO2 radicals present during photooxidation.
If we assume ROOR-type structures for dimers, the dimers existing in particle phase could be photolyzed during photochemical aging to form RO+RO. RO radicals, e.g., TM135BPRO in the MCM mechanism, may decompose to smaller fragments, methylglyoxal, and a C6 counter product. These smaller fragments existing in the particle phase may evaporate because their volatilities are higher than the original ROOR dimers or RO radicals. The volatility distributions determined from LC-TOF-MS data showed that dimers comprise 25 %–49 % of the total product mass. The gas-phase RO2+RO2 reactions may not fully explain the mass ratio of dimer products because the rate constant for the reactions, cm3 molecule−1 s−1 (Atkinson et al., 1989), was lower than that for reactions, cm3 molecule−1 s−1 (DeMore et al., 1997). These results suggest that other dimer formation processes cannot be excluded. The probable additional formation processes for dimers are acid-catalyzed particle-phase reactions (Kalberer et al., 2004) or gas-phase reactions of organic compounds with Criegee intermediates. Criegee intermediates may be produced during photooxidation because ozone can react with unsaturated photooxidation products (Sato et al., 2004). Present LC-TOF-MS results show that C9H14O5 and C9H14O6 products are produced during photochemical aging. These five- and six-oxygen monomers are produced by the photooxidation of gaseous phenol-type compounds formed from TMB photooxidation (Nakao et al., 2011). The compound 2-Hydroxy-1,3,5-trimethylbenzene (TM135BZOL of the MCM mechanism) is formed as a primary product of TMB photooxidation. According to the MCM mechanism, this phenol-type product reacts with OH radicals to form the TM135OLO2 peroxy radical. This peroxy radical reacts with RO2 to form TM135OLOH or reacts with HO2 to form TM135OLOOH, suggesting that the C9H14O5 and C9H14O6 products are formed from the photooxidation of TM135BZOL during photochemical aging. The peroxy radical, TM135OLO2, may also react with NO2 to produce peroxy nitrate, C9H13NO8.
3.6 TD-AMS measurements
Figure 6 shows the mass fraction remaining (MFR) observed for SOA as a function of TD temperature (thermogram). Results obtained for SOA in normal photooxidation experiments are averages from runs 1, 3, 4, 5, and 6. The error bars quoted for results of the normal photooxidation experiments are standard deviations. The MFR results observed between 50 and 150 ∘C in the aging experiment were slightly higher than those from normal photooxidation experiments, but these differences may not be significant because results of the aging experiment were obtained from only one experimental run. The thermogram observed for SOA, formed from α-pinene ozonolysis without photochemical aging in our previous study (Sato et al., 2018), was similar to that observed for SOA from TMB in the aging experiment in this study. The transmission efficiency of 50–250 nm sodium chloride particles was reported to be >80 % in the region 298–498 K for a TD with the same design as the present TD (Huffmann et al., 2008). We ignored particle wall loss in the TD during the data analysis.
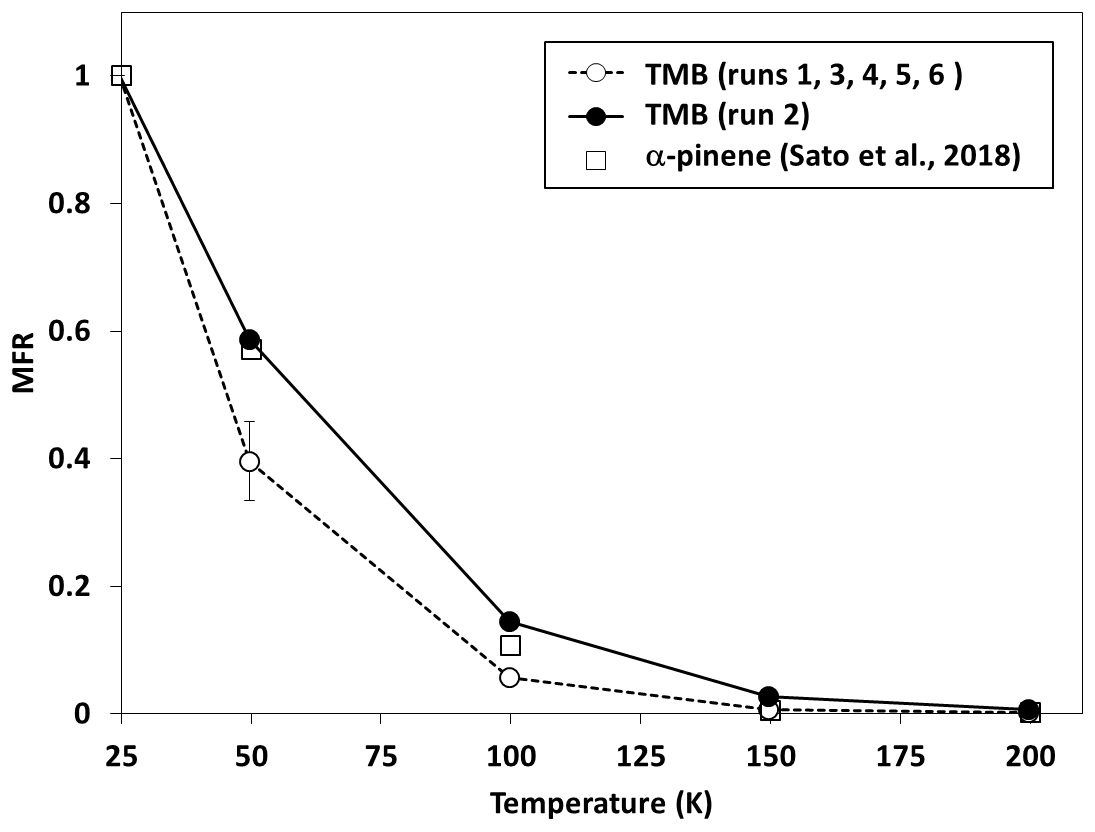
Figure 6Mass fraction remaining (MFR) for SOA formed from the photooxidation of TMB as a function of thermal denuder temperature (thermogram).
Figure 4d shows the volatility distribution determined from the results of the heating measurements. Thermogram data were converted into volatility distributions using an empirical method developed by Faulhaber et al. (2009). Faulhaber et al. (2009) measured the relationship between the saturation concentration and the TD temperature at which MFR becomes 0.5 for several kinds of single-compound particles. We used the results of the calibration curve from Faulhaber et al. (2009) directly, as the TD in our study has the same design as their TD and has a residence time (∼13 s at 298 K) close to that used for their TD (∼15 s 298 K). Furthermore, we confirmed that their calibration curve agreed with our results obtained for pinonic acid particles (Sato et al., 2018). The volatility distributions determined from TD-AMS data included low-volatility products with , showing agreement with results obtained from LC-TOF-MS data. The weighted averages of log 10 C∗ determined from TD-AMS data for normal photooxidation and aging experiments were 1.44 and 0.65, respectively. The mass fractions determined between and 0 for aging experiments were slightly higher than those determined for normal photooxidation experiments, but again these differences may not be significant.
3.7 Dilution measurements
Figure 7 shows the volume fraction remaining (VFR) observed for SOA as a function of time after dilution. The number concentration and mean size of SOA particles decreased with increasing time during dilution measurements. We assumed that the decrease in the number concentration resulted from particle wall loss, and the decrease in the mean size resulted from particle evaporation. To remove the influence of wall loss, the VFR was determined by , where r is the geometric mean radius of particles and r0 is the geometric mean radius immediately before dilution. We observed the time series of the VFR at the DRs of 20, 40, 63, and 86. Although evaporation is assumed to occur instantaneously in gas–particle equilibrium partitioning models, the VFR of SOA particles decreased very slowly. The VFR reached equilibrium more than 2 h after dilution, and in some cases, it did not reach equilibrium at all within the observation duration.
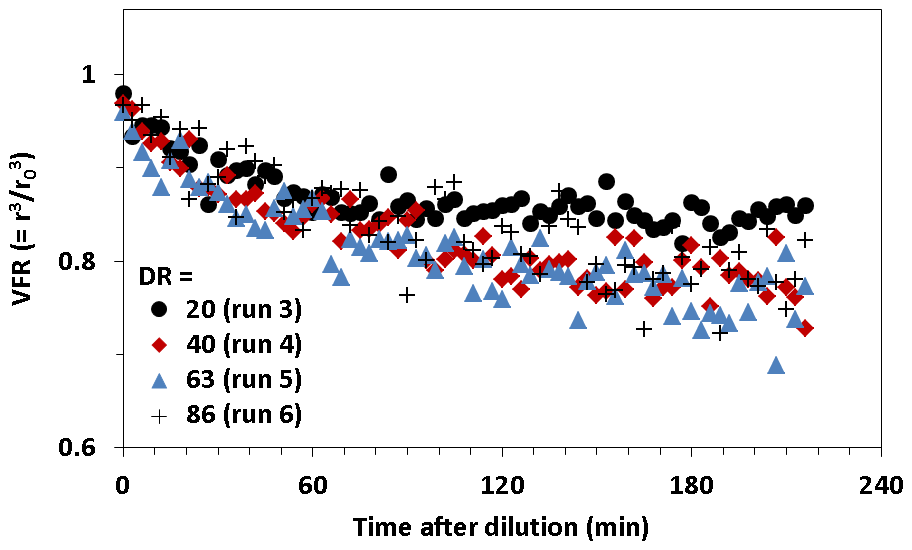
Figure 7Volume fraction remaining (VFR) for SOA particles formed from the photooxidation of TMB as a function of time after dilution.
The equilibration timescale (τ) for gas–particle equilibrium could be expressed as a function of the particle size, the particle number concentration, and the mass accommodation coefficient (Saleh et al., 2013). Figure S4 shows plots of effective saturation ratios as a function of t∕τ. Here, τ was calculated by Eq. (2).
In this expression, Kn is the Knudsen number, α is the mass accommodation coefficient, D is the gas-phase diffusion coefficient, d is the particle geometric mean diameter, and N is the particle number concentration. The α value was treated as the fitting parameter. An effective saturation ratio (SReff) in Fig. S4 is defined as the ratio of the total vapor concentration in the gas phase to the vapor concentration at equilibrium, as expressed by Eq. (3).
where Csat,eff is the effective saturation concentration, xi is mole fraction, γi is the activity coefficient, and Csat,i is the saturation concentration of component i. The time variation of SReff is approximately a 1st-order variation if the change in the particle mass concentration after dilution is less than several tens of percent, as expressed by Eq. (4).
Fitting Eq. (4) to experimental results, we determined the equilibration timescales of DR = 20, 40, 63, and 86 to be 68±17, 174±40, 275±65, and 399±94 min, respectively. The current results of a 68–399 min equilibration timescale was similar to or higher than our previous results reported for α-pinene SOA, due to similar or lower number concentrations (32–212 cm−3) during present dilution experiments. We also determined the mass accommodation coefficient from the fitting to be 0.7±0.3. The mass accommodation coefficient includes all resistance to gas–particle partitioning other than gas-phase diffusion, for example, surface accommodation and diffusion limitations in the particle phase (Saleh et al., 2013). The existence of low-volatility materials in SOA, kinetic inhibition, or some combined effect may explain an accommodation coefficient of less than unity. The mass accommodation coefficient determined for SOA from TMB was higher than that estimated for α-pinene SOA in our previous study (0.1).
The normalized SOA yields determined for the observed dilution data and predicted equilibrium points are plotted as a function of particle concentration (Fig. S5). The normalized yield of the vertical axis is based on the VFR determined from particle size, whereas the particle concentration of the horizontal axis is the actual concentration affected by particle wall loss in the EDC. The particle wall loss rate in the EDC was observed to be s−1. We extrapolated observed dilution data to predict normalized yields and particle concentrations at gas–particle equilibria using results obtained by the present equilibration timescale analysis. The observed dilution data and the predicted equilibrium data were fitted by Eq. (2) in Grieshop et al. (2007) to determine the volatility distributions, respectively. We determined the volatility distributions only for log 10 C∗ = −1, 0, 1, and 2 accounting for the mass concentration region examined. The bin of needed to have a non-zero mass fraction in order to explain observed dilution data or predicted equilibrium data. Figure 4e shows the volatility distributions determined from the results of dilution measurements. The errors quoted for the volatility distributions were uncertainties in the fitting analysis. The volatility distribution determined from dilution data also shows that low-volatility products with are present, contradicting the volatility distributions predicted from yield curve analysis.
3.8 Implications of data from different methods
There are not only statistical uncertainties for volatility distributions obtained from each technique but also systematic uncertainties among composition, heating, and dilution measurements. The volatility distributions obtained from composition analysis will contain systematic errors from sensitivity and saturation concentration parameterizations. In addition, composition analysis may lose information for products with low sensitivities, although positive-mode ESI analysis can detect major known products. The results of heating measurements involve interference from thermal decomposition and the uncertainties from the parameterizations for the enthalpies of vaporization. The volatility distribution obtained from dilution measurements also include large uncertainties under high DR conditions, as discussed in the previous paragraph. Despite the probable uncertainties in composition, heating, and dilution measurements, the present results of all three methods suggest that TMB photooxidation products include low-volatility compounds with , which are not predicted from yield curve analysis. Possible reasons for underestimations of low-volatility compounds by yield curve analysis are the effects of semivolatile vapor wall loss generally enhanced in batch experiments in a low-concentration region or constant product yields assumed in a gas–particle partitioning model function. In the standard VBS approach, the product volatility distributions determined by yield curve analysis are employed (e.g., Robinson et al., 2007; Lane et al., 2008). Currently, a limited number of non-standard treatments are available only for α-pinene SOA; e.g., Trump and Donahue (2014) took into account dimer formation in the particle phase, and Yli-Juuti et al. (2017) employed the product volatility distribution determined from dilution data. Further improvement in the atmospheric organic aerosol model will be necessary not only for the study of biogenic SOA but also for anthropogenic SOA.
In this study, we investigated the volatility of SOA formed from TMB photooxidation by composition, heating, and dilution measurements. To our knowledge, this is the first study to determine the volatility distributions from composition and dilution measurements of SOA formed from the photooxidation of aromatic hydrocarbons. Results of the present composition study showed that C9H14Ox monomers (x = 4–7) and C18H26Ox dimers (x = 8–12) are major products in SOA particles. These results are consistently explained by previously proposed mechanisms in which highly oxygenated RO2 radicals are generated by auto-oxidation mechanisms, and monomer and dimer products are formed by the RO2+HO2 and RO2+RO2 reactions, respectively. Dimer formation processes from particle-phase reactions or gas-phase reactions of Criegee intermediates cannot be excluded because the rate constants for the reactions in the gas phase are lower than those for the reactions. Monomer products with five or more oxygens were newly formed, and dimer products degraded during photochemical aging. Monomer products with five or more oxygens may be produced from the photooxidation of phenol-type gaseous products during photochemical aging, and dimer products in the particle phase may undergo photolysis during photochemical aging.
The present results of composition, heating, and dilution measurements suggest that TMB photooxidation products include compounds with volatilities less than those predicted from conventional SOA yield curve analysis. In the standard VBS approach, the product volatility distributions are determined by SOA yield curve analysis, and the distributions employed in the standard VBS approach do not include low-volatility products. A limited number of non-standard treatments, accounting for the formation of low-volatility products, are available, but non-standard treatments are examined only for α-pinene ozonolysis. Further improvement of the atmospheric simulation model will be necessary not only for the study of biogenic SOA formation but also for anthropogenic SOA formation. Furthermore, the volatility distribution of SOA was only studied under dry conditions in the present study. Further studies would be necessary to understand the effects of relative humidity on SOA volatility.
All data used in this work can be found on the Figshare database (https://doi.org/10.6084/m9.figshare.10026131; Sato et al., 2019).
The supplement related to this article is available online at: https://doi.org/10.5194/acp-19-14901-2019-supplement.
KS and TI designed and performed chamber experiments, TD-AMS measurements, and LC-TOF-MS analysis. YF, AF, and YK designed and carried out dilution measurements. SI and HT designed and carried out PTR-MS measurements. YM, KT, and SS contributed to data interpretations from the viewpoint of atmospheric modeling. TH, AS, and AT gave technical support for TD-AMS measurements and also contributed to data interpretations.
The authors declare that they have no conflict of interest.
The authors would like to thank Akio Togashi of Randstad, Yutaka Sugaya of NIES, and Tsuyoshi Fujii of HORIBA Techno Service for their technical supports to dilution measurements. Kei Sato thanks Shinichi Enami for a useful discussion on the formation mechanisms of dimers and Yoshikatsu Takazawa for technical support in LC-TOF-MS analysis.
This research has been supported by the Environmental Research and Technology Development Fund (grant no. 5-1408), JSPS KAKENHI (grant nos. JP25340021, JP16H06305, and JP17H01866), the Steel Foundation for Environmental Protection Technology (grant no. 14-15 Taiki-221), and the Sumitomo Foundation (grant no. 123449).
This paper was edited by Neil M. Donahue and reviewed by three anonymous referees.
Aiken, A. C., DeCarlo, P. F., Kroll, J. H., Worsnop, D. R., Huffman, J. A., Docherty, K. S., Ulbrich, I. M., Mohr, C., Kimmel, J. R., Sueper, D., Sun, Y., Zhang, Q., Trimborn, A., Northway, M., Ziemann, P. J., Canagaratna, M. R., Onasch, T. B., Alfarra, M. R., Prevot, A. S. H., Dommen, J., Duplissy, J., Metzger, A., Baltensperger, U., and Jimenez, J. L.: O∕C and OM∕OC ratios of primary, secondary, and ambient organic aerosols with high-resolution time-of-flight aerosol mass spectrometry, Environ. Sci. Technol., 42, 4478–4485, https://doi.org/10.1021/es703009q, 2008.
Akimoto, H., Hoshino, M., Inoue, G., Sakamaki, F., Washida, N., and Okuda, M.: Design and characterization of the evacuable and bankable photochemical smog chamber, Environ. Sci. Technol., 13, 471–475, https://doi.org/10.1021/es60152a014, 1979.
Alfarra, M. R., Paulsen, D., Gysel, M., Garforth, A. A., Dommen, J., Prévôt, A. S. H., Worsnop, D. R., Baltensperger, U., and Coe, H.: A mass spectrometric study of secondary organic aerosols formed from the photooxidation of anthropogenic and biogenic precursors in a reaction chamber, Atmos. Chem. Phys., 6, 5279–5293, https://doi.org/10.5194/acp-6-5279-2006, 2006.
Atkinson, R., Baulch, D. L., Cox, R. A., Hampson Jr., R. F., Kerr, J. A., and Troe, J.: Evaluated kinetic and photochemical data for atmospheric chemistry: supplement III. IUPAC subcommittee on gas kinetic data evaluation for atmospheric chemistry, J. Phys. Chem. Ref. Data, 18, 881–1097, https://doi.org/10.1063/1.555832, 1989.
Baltensperger, U., Kalberer, M., Dommen, J., Paulsen, D., Alfarra, M. R., Coe, H., Fisseha, R., Gascho, A., Gysel, M., Nyeki, S., Sax, M., Seinbacher, M., Prevot, A. S. H., Sjögren, S., Weingartner, E., and Zenobi, R.: Secondary organic aerosols from anthropogenic and biogenic precursors, Faraday Discuss., 130, 265–278, https://doi.org/10.1039/B417367H, 2005.
DeMore, W. B., Sander, S. P., Golden, D. M., Hampson, R. F., Kurylo, M. J., Howard, C. J., Ravishankara, A. R., Kolb, C. E., and Molina, M. J.: Chemical Kinetics and Photochemical Data for Use in Stratospheric Modeling Evaluation No. 12, JPL Publication 97-4, Jet Propulsion Laboratory, California Institute of Technology, Pasadena, CA, USA, 274 pp., 1997.
Docherty, K. S., Corse, E. W., Jaoui, M., Offenberg, J. H., Kleindienst, T. E., Krug, J. D., Riedel, T. P., and Lewandowski, M.: Trends in the oxidation and relative volatility of chamber-generated secondary organic aerosol, Aerosol Sci. Tech., 52, 992–1004, https://doi.org/10.1080/02786826.2018.1500014, 2018.
Dockery, D. W., Pope III, A., Xu, X., Spengler, J. D., Ware, J. H., Fay, M. E., Ferris Jr., B. G., and Speizer, F. E.: An association between air pollution and mortality in six U.S. cities, N. Engl. J. Med., 329, 1753–1759, https://doi.org/10.1056/NEJM199312093292401, 1993.
Faulhaber, A. E., Thomas, B. M., Jimenez, J. L., Jayne, J. T., Worsnop, D. R., and Ziemann, P. J.: Characterization of a thermodenuder-particle beam mass spectrometer system for the study of organic aerosol volatility and composition, Atmos. Meas. Tech., 2, 15–31, https://doi.org/10.5194/amt-2-15-2009, 2009.
Fisseha, R., Dommen, J., Sax, M., Paulsen, D., Kalberer, M., Maurer, R., Höfler, F., Weingartner, E., and Baltensperger, U.: Identification of organic acids in secondary organic aerosol and the corresponding gas phase from chamber experiments, Anal. Chem., 76, 6535–6540, https://doi.org/10.1021/ac048975f, 2004.
Fujitani, Y., Saitoh, K., Fushimi, A., Takahashi, K., Hasegawa, S., Tanabe, K., Kobayashi, S., Furuyama, A., Hirano, S., and Takami, A.: Effect of isothermal dilution on emission factors of organic carbon and n-alkanes in the particle and gas phases of diesel exhaust, Atmos. Environ., 59, 389–397, https://doi.org/10.1016/j.atmosenv.2012.06.010, 2012.
Grieshop, A. P., Donahue, N. M., and Robinson, A. L.: Is the gas-particle partitioning in alpha-pinene secondary organic aerosol reversible?, Geophys. Res. Lett., 34, L14810, https://doi.org/10.1029/2007GL029987, 2007.
Hayes, P. L., Carlton, A. G., Baker, K. R., Ahmadov, R., Washenfelder, R. A., Alvarez, S., Rappenglück, B., Gilman, J. B., Kuster, W. C., de Gouw, J. A., Zotter, P., Prévôt, A. S. H., Szidat, S., Kleindienst, T. E., Offenberg, J. H., Ma, P. K., and Jimenez, J. L.: Modeling the formation and aging of secondary organic aerosols in Los Angeles during CalNex 2010, Atmos. Chem. Phys., 15, 5773–5801, https://doi.org/10.5194/acp-15-5773-2015, 2015.
Heinritzi, M., Simon, M., Steiner, G., Wagner, A. C., Kürten, A., Hansel, A., and Curtius, J.: Characterization of the mass-dependent transmission efficiency of a CIMS, Atmos. Meas. Tech., 9, 1449–1460, https://doi.org/10.5194/amt-9-1449-2016, 2016.
Hilal, S. H., Karickhoff, S. W., and Carreira, L. A.: Prediction of the vapor pressure, boiling point, heat of vaporization and diffusion coefficient of organic compounds, QSAR Comb. Sci., 22, 565–574, https://doi.org/10.1002/qsar.200330812, 2003.
Huffman, J. A., Ziemann, P. J., Jayne, J. T., Worsnop, D. R., and Jimenez, J. L.: Development and characterization of a fast-stepping/scanning thermodenuder for chemically-resolved aerosol volatility measurements, Aerosol Sci. Tech., 42, 395–407, https://doi.org/10.1080/02786820802104981, 2008.
Inomata, S., Sato, K., Hirokawa, J., Sakamoto, Y., Tanimoto, H., Okumura, M., Tohno, S., and Imamura, T.: Analysis of secondary organic aerosols from ozonolysis of isoprene by proton transfer reaction mass spectrometry, Atmos. Environ., 97, 397–405, https://doi.org/10.1016/j.atmosenv.2014.03.045, 2014.
IPCC: Climate Change 2013: The Physical Science Basis. Contribution of Working Group I to the Fifth Assessment Report of the Intergovernmental Panel on Climate Change, edited by: Stocker, T. F., Qin, D., Plattner, G.-K., Tignor, M., Allen, S. K., Boschung, J., Nauels, A., Xia, Y., Bex, V., and Midgley, P. M., Cambridge University Press, Cambridge, UK and New York, NY, USA, 1535 pp., 2013.
Izumi, K. and Fukuyama, T.: Photochemical aerosol formation from aromatic hydrocarbons in the presence of NOx, Atmos. Environ. A-Gen., 24, 1433–1441, https://doi.org/10.1016/0960-1686(90)90052-O, 1990.
Jenkin, M. E., Saunders, S. M., Wagner, V., and Pilling, M. J.: Protocol for the development of the Master Chemical Mechanism, MCM v3 (Part B): tropospheric degradation of aromatic volatile organic compounds, Atmos. Chem. Phys., 3, 181–193, https://doi.org/10.5194/acp-3-181-2003, 2003.
Kalberer, M., Paulsen, D., Sax, M., Steinbacher, M., Dommen, J., Prevot, A. S. H., Fisseha, R., Weingartner, E., Frankevich, V., Zenobi, R., and Baltensperger, U.: Identification of polymers as major components of atmospheric organic aerosols, Science, 303, 1659–1662, https://doi.org/10.1126/science.1092185, 2004.
Kamens, R. M., Zhang, H., Chen, E. H., Zhou, Y., Parikh, H. M., Wilson, R. L., Galloway, K. E., and Rosen, E. P.: Secondary organic aerosol formation from toluene in an atmospheric hydrocarbon mixture: Water and particle seed effects, Atmos. Environ., 45, 2324–2334, https://doi.org/10.1016/j.atmosenv.2010.11.007, 2011.
Kelly, J. M., Doherty, R. M., O'Connor, F. M., and Mann, G. W.: The impact of biogenic, anthropogenic, and biomass burning volatile organic compound emissions on regional and seasonal variations in secondary organic aerosol, Atmos. Chem. Phys., 18, 7393–7422, https://doi.org/10.5194/acp-18-7393-2018, 2018.
Kolesar, K. R., Li, Z., Wilson, K. R., and Cappa, C. D.: Heating-induced evaporation of nine different secondary organic aerosol types, Environ. Sci. Technol., 49, 12242–12252, https://doi.org/10.1021/acs.est.5b03038, 2015.
Kruve, A., Kaupmees, K., Liigand, J., Oss, M., and Leito, I.: Sodium adduct formation efficiency in ESI source, J. Mass Spectrom., 48, 695–702, https://doi.org/10.1002/jms.3218, 2013.
Lane, T. E., Donahue, N. M., and Pandis, S. N.: Simulating secondary organic aerosol formation using the volatility basis-set approach in a chemical transport model, Atmos. Environ., 42, 7439–7451, https://doi.org/10.1016/j.atmosenv.2008.06.026, 2008.
Li, Y., Pöschl, U., and Shiraiwa, M.: Molecular corridors and parameterizations of volatility in the chemical evolution of organic aerosols, Atmos. Chem. Phys., 16, 3327–3344, https://doi.org/10.5194/acp-16-3327-2016, 2016.
Lindinger, W., Hansel, A., and Jordan, A.: Proton-transfer-reaction mass spectrometry (PTR-MS): on-line monitoring of volatile organic compounds at pptv levels, Chem. Soc. Rev., 27, 347–354, https://doi.org/10.1016/S0168-1176(97)00281-4, 1998.
Molteni, U., Bianchi, F., Klein, F., El Haddad, I., Frege, C., Rossi, M. J., Dommen, J., and Baltensperger, U.: Formation of highly oxygenated organic molecules from aromatic compounds, Atmos. Chem. Phys., 18, 1909–1921, https://doi.org/10.5194/acp-18-1909-2018, 2018.
Morino, Y., Nagashima, T., Sugata, S., Sato, K., Tanabe, K., Noguchi, T., Takami, A., Tanimoto, H., and Ohara, T.: Verification of chemical transport models for PM2.5 chemical composition using simultaneous measurement data over Japan, Aerosol Air Qual. Res., 15, 2009–2023, https://doi.org/10.4209/aaqr.2015.02.0120, 2015.
Nakao, S., Clark, C., Tang, P., Sato, K., and Cocker III, D.: Secondary organic aerosol formation from phenolic compounds in the absence of NOx, Atmos. Chem. Phys., 11, 10649–10660, https://doi.org/10.5194/acp-11-10649-2011, 2011.
Ng, N. L., Kroll, J. H., Chan, A. W. H., Chhabra, P. S., Flagan, R. C., and Seinfeld, J. H.: Secondary organic aerosol formation from m-xylene, toluene, and benzene, Atmos. Chem. Phys., 7, 3909–3922, https://doi.org/10.5194/acp-7-3909-2007, 2007.
Odum, J. R., Jungkamp, T. P. W., Griffin, R. J., Flagan, R. C., and Seinfeld, J. H.: The atmospheric aerosol-forming potential of whole gasoline vapor, Science, 276, 96–99, https://doi.org/10.1126/science.276.5309.96, 1997.
Praplan, A. P., Hegyi-Gaeggeler, K., Barmet, P., Pfaffenberger, L., Dommen, J., and Baltensperger, U.: Online measurements of water-soluble organic acids in the gas and aerosol phase from the photooxidation of 1,3,5-trimethylbenzene, Atmos. Chem. Phys., 14, 8665–8677, https://doi.org/10.5194/acp-14-8665-2014, 2014.
Praske, E., Otkjær, R. V., Crounse, J. D., Hethcox, J. C., Stoltz, B. M., Kjaergaard, H. G., and Wennberg, P. O.: Atmospheric autoxidation is increasingly important in urban and suburban North America, P. Natl. Acad. Sci. USA, 115, 64–69, https://doi.org/10.1073/pnas.1715540115, 2018.
Robinson, A. L., Donahue, N. M., Shrivvastava, M. K., Weitkamp, E. A., Sage, A. M., Grieshop, A. P., Lane, T. E., Pierce, J. R., and Pandis, S. N.: Rethinking organic aerosols: Semivolatile emissions and photochemical aging, Science, 315, 1259–1262, https://doi.org/10.1126/science.1133061, 2007.
Saleh, R., Donahue, N. M., and Robinson, A. L.: Time scales for gas-particle partitioning equilibration of secondary organic aerosol formed from alpha-pinene ozonolysis, Environ. Sci. Technol., 47, 5588–5594, https://doi.org/10.1021/es400078d, 2013.
Sato, K., Klotz, B., Hatakeyama, S., Imamura, T., Washizu, Y., Matsumi, Y., and Washida, N.: Secondary organic aerosol formation during the photo-oxidation of toluene: dependence on initial hydrocarbon concentration, B. Chem. Soc. Jpn., 77, 667–671, https://doi.org/10.1246/bcsj.77.667, 2004.
Sato, K., Hatakeyama, S., and Imamura, T.: Secondary organic aerosol formation during the photooxidation of toluene: NOx dependence of chemical composition, J. Phys. Chem. A, 111, 9796–9808, https://doi.org/10.1021/jp071419f, 2007.
Sato, K., Takami, A., Kato, Y., Seta, T., Fujitani, Y., Hikida, T., Shimono, A., and Imamura, T.: AMS and LC/MS analyses of SOA from the photooxidation of benzene and 1,3,5-trimethylbenzene in the presence of NOx: effects of chemical structure on SOA aging, Atmos. Chem. Phys., 12, 4667–4682, https://doi.org/10.5194/acp-12-4667-2012, 2012.
Sato, K., Fujitani, Y., Inomata, S., Morino, Y., Tanabe, K., Ramasamy, S., Hikida, T., Shimono, A., Takami, A., Fushimi, A., Kondo, Y., Imamura, T., Tanimoto, H., and Sugata, S.: Studying volatility from composition, dilution, and heating measurements of secondary organic aerosols formed during α-pinene ozonolysis, Atmos. Chem. Phys., 18, 5455–5466, https://doi.org/10.5194/acp-18-5455-2018, 2018.
Sato, K., Fujitani, Y., Inomata, S., Morino, Y., Tanabe, K., Hikida, T., Shimono, A., Takami, A., Fushimi, A., Kondo, Y., Imamura, T., Tanimoto, H., and Sugata, S.: Data for “A study of volatility by composition, heating and dilution measurements of secondary organic aerosol from 1,3,5-trimethylbenzene”, FigShare, https://doi.org/10.6084/m9.figshare.10026131, 2019.
Shiraiwa, M., Berkemeier, T., Schilling-Fahnestock, K. A., Seinfeld, J. H., and Pöschl, U.: Molecular corridors and kinetic regimes in the multiphase chemical evolution of secondary organic aerosol, Atmos. Chem. Phys., 14, 8323–8341, https://doi.org/10.5194/acp-14-8323-2014, 2014.
Shiraiwa, M., Ueda, K., Pozzer, A., Lammel, G., Kampf, C. J., Fushimi, A., Enami, S., Arangio, A. M., Fröhlich-Nowoisky, J., Fujitani, Y., Furuyama, A., Lakey, P. S. J., Lelieveld, J., Lucas, K., Morino, Y., Poschl, U., Takahama, S., Takami, A., Tong, H., Weber, B., Yoshino, A., and Sato, K.: Aerosol health effects from molecular to global scales, Environ. Sci. Technol., 51, 13545–13567, https://doi.org/10.1021/acs.est.7b04417, 2017.
Smith, D. F., Kleindienst, T. E., and McIver, C. D.: Primary product distributions from the reaction of OH with m-, p-xylene, 1,2,4-and 1,3,5-trimethylbenzene, J. Atmos. Chem., 34, 339–364, https://doi.org/10.1023/A:1006277328628, 1999.
Trump, E. R. and Donahue, N. M.: Oligomer formation within secondary organic aerosols: equilibrium and dynamic considerations, Atmos. Chem. Phys., 14, 3691–3701, https://doi.org/10.5194/acp-14-3691-2014, 2014.
Wang, S., Wu, R., Berndt, T., Ehn, M., and Wang, L.: Formation of highly oxidized radicals and multifunctional products from the atmospheric oxidation of alkylbenzenes, Environ. Sci. Technol., 51, 8442–8449, https://doi.org/10.1021/acs.est.7b02374, 2017.
Wu, R. and Xie, S.: Spatial distribution of secondary organic aerosol formation potential in China derived from speciated anthropogenic volatile organic compound emissions, Environ. Sci. Technol., 52, 8146–8156, https://doi.org/10.1021/acs.est.8b01269, 2018.
Yli-Juuti, T., Pajunoja, A., Tikkanen, O.-P., Buchholz, A., Faiola, C., Väisänen, O., Hao, L., Kari, E., Peräkylä, O., Garmash, O., Shiraiwa, M., Ehn, M., Lehtinen, K., and Virtanen, A.: Factors controlling the evaporation of secondary organic aerosol from α-pinene ozonolysis, Geophys. Res. Lett., 44, 2562–2570, https://doi.org/10.1002/2016GL072364, 2017.
Zhang, Q., Jimenez, J. L., Canagaratna, M. R., Allan, J. D., Coe, H., Ulbrich, I., Alfarra, M. R., Takami, A., Middlebrook, A. M., Sun, Y. L., Dzepina, K., Dunlea, E., Docherty, K., DeCarlo, P. F., Salcedo, D., Onasch, T., Jayne, J. T., Miyoshi, T., Shimono, A., Hatakeyama, S., Takegawa, N., Kondo, Y., Schneider, J., Drewnick, F., Borrmann, S., Weimer, S., Demerjian, K., Williams, P., Bower, K., Bahreini, R., Cottrell, L., Griffin, R. J., Rautiainen, J., Sun, J. Y., Zhang, Y. M., and Worsnop, D. R.: Ubiquity and dominance of oxygenated species in organic aerosols in anthropogenically-influenced Northern Hemisphere midlatitudes, Geophys. Res. Lett., 34, L13801, https://doi.org/10.1029/2007GL029979, 2007.
Zhang, X., Lambe, A. T., Upshur, M. A., Brooks, W., Gray Bé, A., Thomson, R. J., Geiger, F. M., Surratt, J. D., Zhang, Z., Gold, A., Graf, S., Cubison, M. J., Groessl, M., Jayne, J. T., Worsnop, D. R., and Canagaratna, M. R.: Highly oxygenated multifunctional compounds in α-pinene secondary organic aerosol, Environ. Sci. Technol., 51, 5932–5940, https://doi.org/10.1021/acs.est.6b06588, 2017.
Zhou, Y., Zhang, H., Parikh, H. M., Chen, E. H., Rattanavaraha, W., Rosen, E. P., Wang, W., and Kamens, R. M.: Secondary organic aerosol formation from xylenes and mixtures of toluene and xylenes in an atmospheric urban hydrocarbon mixture: Water and particle seed effects (II), Atmos. Environ., 45, 3882–3890, https://doi.org/10.1016/j.atmosenv.2010.12.048, 2011.