the Creative Commons Attribution 4.0 License.
the Creative Commons Attribution 4.0 License.
 | 10 Dec 2019
Biomass burning and urban emission impacts in the Andes Cordillera region based on in situ measurements from the Chacaltaya observatory, Bolivia (5240 m a.s.l.)
Aurélien Chauvigné
Diego Aliaga
Karine Sellegri
Nadège Montoux
Radovan Krejci
Griša Močnik
Isabel Moreno
Thomas Müller
Marco Pandolfi
Fernando Velarde
Kay Weinhold
Patrick Ginot
Alfred Wiedensohler
Marcos Andrade
Paolo Laj
This study documents and analyses a 4-year continuous record of aerosol optical properties measured at the Global Atmosphere Watch (GAW) station of Chacaltaya (CHC; 5240 m a.s.l.), in Bolivia. Records of particle light scattering and particle light absorption coefficients are used to investigate how the high Andean Cordillera is affected by both long-range transport and by the fast-growing agglomeration of La Paz–El Alto, located approximately 20 km away and 1.5 km below the sampling site. The extended multi-year record allows us to study the properties of aerosol particles for different air mass types, during wet and dry seasons, also covering periods when the site was affected by biomass burning in the Bolivian lowlands and the Amazon Basin. The absorption, scattering, and extinction coefficients (median annual values of 0.74, 12.14, and 12.96 Mm−1 respectively) show a clear seasonal variation with low values during the wet season (0.57, 7.94, and 8.68 Mm−1 respectively) and higher values during the dry season (0.80, 11.23, and 14.51 Mm−1 respectively). The record is driven by variability at both seasonal and diurnal scales. At a diurnal scale, all records of intensive and extensive aerosol properties show a pronounced variation (daytime maximum, night-time minimum), as a result of the dynamic and convective effects. The particle light absorption, scattering, and extinction coefficients are on average 1.94, 1.49, and 1.55 times higher respectively in the turbulent thermally driven conditions than the more stable conditions, due to more efficient transport from the boundary layer. Retrieved intensive optical properties are significantly different from one season to the other, reflecting the changing aerosol emission sources of aerosol at a larger scale. Using the wavelength dependence of aerosol particle optical properties, we discriminated between contributions from natural (mainly mineral dust) and anthropogenic (mainly biomass burning and urban transport or industries) emissions according to seasons and local circulation. The main sources influencing measurements at CHC are from the urban area of La Paz–El Alto in the Altiplano and from regional biomass burning in the Amazon Basin. Results show a 28 % to 80 % increase in the extinction coefficients during the biomass burning season with respect to the dry season, which is observed in both tropospheric dynamic conditions. From this analysis, long-term observations at CHC provide the first direct evidence of the impact of biomass burning emissions of the Amazon Basin and urban emissions from the La Paz area on atmospheric optical properties at a remote site all the way to the free troposphere.
- Article
(6470 KB) - Full-text XML
- BibTeX
- EndNote


Natural and anthropogenic aerosol particle emissions significantly influence the global and regional climate by absorbing and scattering solar radiation (Charlson et al., 1992; Boucher et al., 2013; Kuniyal and Guleria, 2018). Global-scale estimates of aerosol radiative forcing are still highly uncertain. Regional- and local-scale radiative forcing estimates show large variability, reflecting the dependence on highly variable factors such as the ground albedo, aerosol particle loadings, and the nature and localization of the aerosol particle in the atmosphere. While aerosol particles have a net cooling effect at a global scale (−0.35 W m−2, Myhre et al., 2013), the sign of local direct radiative forcing is determined by a balance between cooling by most aerosol species (sulfates, nitrates, organic aerosols, and secondary organic aerosols) and warming by black carbon (BC) that absorbs solar radiation (Myhre et al., 2013).
The major sources of BC particles are biomass burning and incomplete fuel combustion. The Amazon Basin accounts for approximatively 50 % of the global tropical forest area and shrinks by more than 2 % every year, which makes it one of the most important sources of BC particles. However, long-term measurements at high altitudes are still poorly documented in this region. Some observations of regional aerosol burden show intense emission sources for both primary and secondary aerosol particle and their local impacts. Martin et al. (2010) report evidence of natural and anthropogenic emissions in this region with clear seasonal variations in atmospheric particle concentrations close to the surface. From a sampling location close to nearby recurrent fires (close to Porto Velho), Artaxo et al. (2013) retrieved concentrations of biomass particles 10 times higher during the dry period than during the wet period. The authors also report that the particle concentrations at this site are 5 times higher than at a remote site in the same area, and both sites show a clear seasonal variation.
In addition to the aforementioned studies on the aerosol burdens, several other studies show important modifications of the atmospheric optical properties during biomass burning (BB) episodes, in the Amazon Basin and in the La Plata Basin at the end of the dry season (August–September). Between the wet season and the biomass burning season, Schafer et al. (2008) show an increase in aerosol optical depth by a factor of 10 from AERONET sites in the southern forest region and the Cerrado region and by a factor of 4 in the northern forest region. Husar et al. (2000) have reported extinction coefficients on the integrated visible range (or visibility) in the Amazon Basin at four different altitude stations during the BB period. The study reports a spatial pattern of the visibility between 100 and 200 Mm−1 over the Amazon Basin. However, values can reach 600 Mm−1 at Sucre station (2903 m a.s.l.), 1000 Mm−1 at Vallegrande (1998 m a.s.l.), and 2000 Mm−1 at Camiri (792 m a.s.l.) during the BB period. Although the study clearly shows impacts of Amazonian activities at different altitudes and long distances, only a few studies report a long time period of aerosol optical properties. At the Fazenda Nossa Senhora Aparecida (FNSA) station in Brazil (770 m a.s.l.), Chand et al. (2006) report the absorption and scattering coefficients reaching 70 Mm−1 (at 532 nm) and 1435 Mm−1 (at 545 nm) during large-scale BB events (PM2.5 > 225 µg m−3) from ground-based measurements. These extremely high coefficients are due to the proximity to BB sources for the FNSA station and its very low altitude.
Only a few studies report BC transport through different atmospheric layers. During the Large-Scale Biosphere-Atmosphere Experiment in Amazonia (LBA, in March 1998), Krejci et al. (2003) retrieved particle concentrations in the free tropospheric layer (above 4 km a.s.l.) that were 2 and 15 times higher than in the boundary layer, due to new particle formation in BB plumes. From airborne lidar measurements during SAMBBA (South AMerican Biomass Burning Analysis), Marenco et al. (2016) also observed high particle concentrations at a high altitude (between 1 and 6 km). Their work highlights long-range transport of biomass burning plumes with lifetimes of several weeks. Chand et al. (2006) also demonstrate increasing particle scattering with altitude, partly explained by particle coagulation and condensation of gases during transport. From satellite remote-sensing measurements (Cloud-Aerosol Lidar with Orthogonal Polarization, CALIOP), Bourgeois et al. (2015) show that BB particles originating from the Amazon Basin reach an altitude of 5 km a.s.l. Contrary to Krejci et al. (2003) and Chand et al. (2006), they show a constant decrease in aerosol particle extinction with altitude, at a rate of 20 Mm−1 per kilometre of altitude. Hamburger et al. (2013) present long-term (3-year) ground-based measurements at Pico Espejo (4765 m a.s.l.), Venezuela. They show the influences of the local Venezuelan savannah and of the Amazon Basin biomass burning emissions, mainly during the dry period and in the whole tropospheric layer.
A challenging part is to separate the contributions of different aerosol sources from retrieved optical properties. For example, the single scattering albedo (SSA) is closely related to the particle size and determines the magnitude of the aerosol radiative forcing (Hansen et al., 1997). For tropical BB events, the SSA is around 0.83 at 550 nm for a fresh plume and increases with time up to 0.87 (Reid et al., 2005). On the other hand, the spectral dependency of aerosol optical properties, the Ångström exponents, decrease during the ageing process of the smoke. From five different campaigns over different continents using AERONET sites, Russell et al.'s (2010) work permits us to define thresholds for the absorption and scattering Ångström exponents (respectively AAE and SAE) for urban pollution, BB, and dust particles. They associated urban pollution particles with an AAE close to 1, whereas BB particles were associated with an AAE close to 2. In addition, SAE values are close to 1 for dust particles and close to 2 for urban particles. Similar results are observed from Clarke et al.'s (2007) work, based on in situ airborne measurements over North America. Their work shows BB plumes with AAE values close to 2.1 and polluted plumes with an AAE close to 1. The correlation between the single scattering albedo Ångström exponent (SSAAE) and the concentration of dust allows us to determine that air masses with SSAAE values below 0 as mainly influenced by dust sources, contrary to urban pollution sources, which show values above 0 (Collaud Coen et al., 2004). This has also been confirmed from different AERONET sites in the world (Dubovik et al., 2002).
Table 1Expected aerosol type and their optical properties for each cluster according season and atmospheric stability.
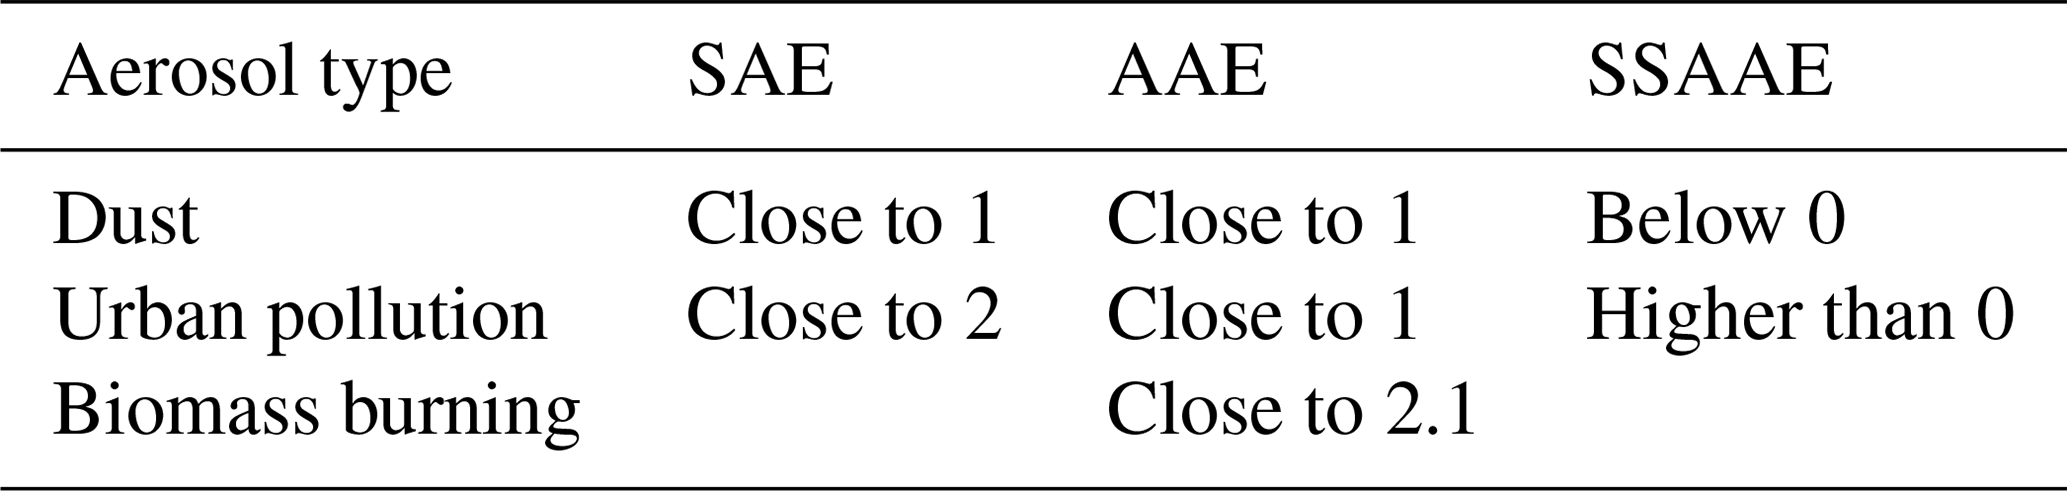
As a summary, Table 1 shows the expected Ångström exponent for dust, urban pollution, and biomass burning particles according to the different referenced works (Dubovik et al., 2002; Collaud Coen et al., 2004; Clarke et al., 2007; Russell et al., 2010). This information has to be treated with caution since source influences are expected to be homogeneous and have been reported from several regions. The present work aims to evaluate the contribution of anthropogenic and natural particles to the global optical properties of aerosols measured at a high-altitude background site at Chacaltaya (Bolivia) over a 4-year period (2012–2015). Monthly and diurnal variations in extensive optical properties (related to particle concentration) and intensive optical properties (related to particle chemistry) are firstly shown. A robust method based on the measurement of the atmospheric stability is then applied to distinguish atmospheric conditions (stable and turbulent). Finally, back-trajectory analysis and optical wavelength dependencies are presented to identify the impacts of local and regional aerosol sources.
2.1 Site description
The urban area of La Paz–El Alto extends from approximately 3200 m to more than 4000 m a.s.l. in the Altiplano. It is a fast-growing urban area with a population of ca. 1.7 million inhabitants, covering a complex topography. In this region, meteorological conditions are governed by wet and dry seasons. The wet season spans from December to March and the dry season from May to September. April, October, and November are regarded as transition periods between the two main seasons. Between May and October, agricultural practices in the Yungas (closest valleys to the La Paz plateau and the Amazon Basin) and the Amazon and La Plata basins include intense vegetation burning (Carmona-Moreno et al., 2005; Giglio et al., 2013). Indeed, the closest region where large areas are affected by biomass burning activities is the Bolivian Amazonia (Beni, Santa Cruz, north of La Paz departments) located ca. 300 km from the station, north and eastward of the Andes mountain range. In this paper, we choose to define August and September as the BB period because those are the months when the BB activities are more intense in the aforementioned region.
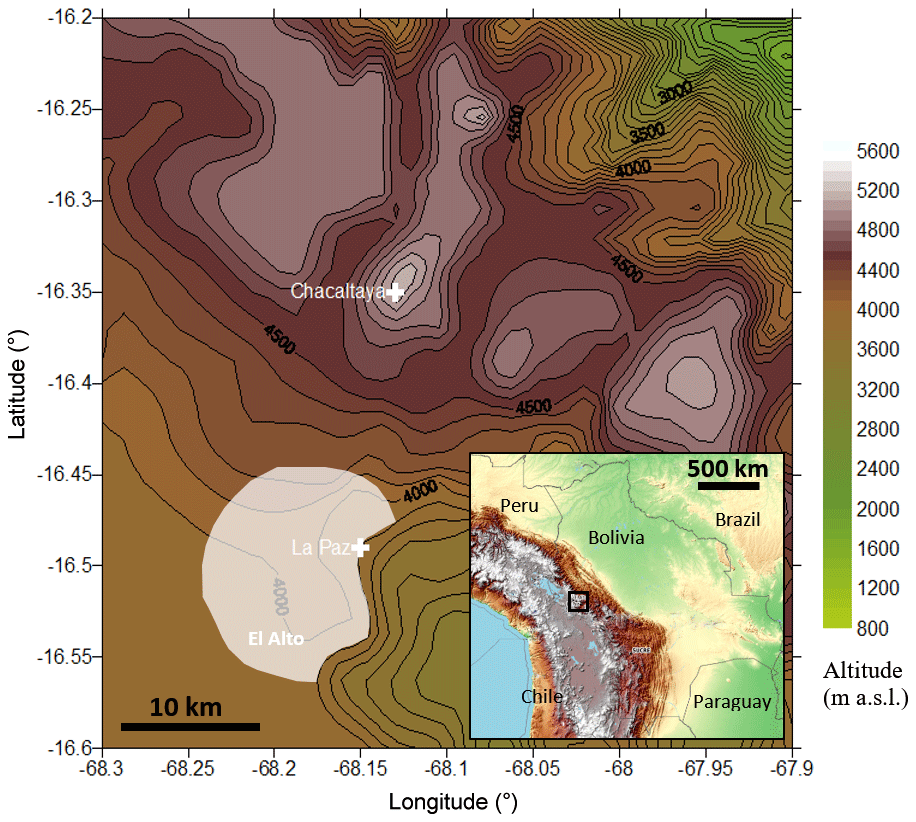
Figure 1Topographic description of La Paz and Chacaltaya region, and Bolivia in the lower right panel. The black rectangle on the small panel represents La Paz region. The urban area of La Paz–El Alto (marked as white shading) lies in the Altiplano at around 4000 m a.s.l.
The in situ measurement site used in this study is the high-altitude station of Chacaltaya GAW (Global Atmospheric Watch) (site code: CHC; coordinates: 16∘21 S, 68∘07 W), located at 5.240 m a.s.l., 17 km north of La Paz, as shown in Fig. 1. In situ instruments of the station operated behind a whole-air inlet equipped with an automatic dryer (activated above 90 % RH). The station has continuously measured concentrations of trace gases and physical and chemical properties of aerosols since 2011 (Rose et al., 2015). In the current study, the full dataset of in situ optical measurements has been used between January 2012 and December 2015.
2.2 In situ measurements
Absorption and scattering coefficients of the aerosol were measured in dry conditions (< 40 %) using an aethalometer (Magee Scientific AE31) at seven different wavelengths (370, 470, 520, 590, 660, 880, and 950 nm), a multi-angle absorption photometer (MAAP, Thermo Scientific) at 635 nm and an integrated nephelometer (Ecotech Aurora 3000) at three wavelengths (450, 525, and 635 nm). The aethalometer measures the rate of change in optical transmission of the filter on which particles are collected at 5 min resolution. Every 5 min, the spot on the filter band is changed in order to reduce loading effects. The reference of the transmissivity is the part of the same filter without particles (Hansen et al., 1982). Sensor calibration is performed automatically and an uncertainty of 5 % on attenuation coefficients is given by the constructor. Aethalometer measurements were adjusted for multi-scattering effects and loading effects (or shadowing effects) following the method described by Weingartner et al. (2003) briefly explained below. As described by Weingartner et al. (2003) and used on Chacaltaya measurements by Rose et al. (2015), the absorption coefficient σabs is retrieved from BC concentrations measured from the aethalometer. From BC concentrations at every measurement spot, attenuation coefficients σatn at different wavelengths are retrieved as
with σm being the mass coefficients given by the instrument's instructions (The Aethalometer, A.D.A. Hansen, Magee Scientific Company, Berkley, California, USA) and based on Mie theory. σm strongly depends on the aerosol type and age (from 5 to 20 m2 g−1, Liousse et al., 1993). However, the manufacturer values (14625 nm m2 g−1 λ−1) have been recently validated in a comparison study between different aethalometer corrections (Collaud Coen et al., 2010; Saturno et al., 2017).
The absorption coefficient is then calculated with the following equation:
with C=3.5 being a calibration factor linked to multiple scattering and an assumed constant according to different wavelengths (GAW Report No. 227) and R being a calibration factor which depends on aerosol loading on the filter and aerosol optical properties, calculated as
where f is the filter loading effect compensation parameter and represents the slope of the curve of R as function of ln(σatn) for a σatn change from 10 % to 50 %. This factor is adjusted to obtain a median ratio between the absorption coefficient before and after spot changes close to 1.
Similarly to the aethalometer, the MAAP measures the radiation transmitted and scattered back from a particle-loaded fibre filter (Petzold and Schönlinner, 2004). According to Petzold and Schönlinner (2004), uncertainty of absorbance is 12 %. A mass absorption cross section QEBC=6.6 m2 g−1 at 670 nm is used to determine equivalent black carbon mass concentrations (mEBC) from absorption coefficient (σabs), and a wavelength correction factor of 1.05 was applied according Eq. (4) to obtain σabs at 635 nm (Müller et al., 2011a) from the measurement at 637 nm.
The nephelometer measures the integrated light scattered by particles. Because the angular integration is only partial (from 10 to 171∘), nephelometer data were corrected for truncation errors but also for detection limits according to Müller et al. (2011b). The instrument permits us to retrieve aerosol particle scattering coefficients (σscat from 10 to 171∘). The nephelometer instrument is calibrated using CO2 as span gas and frequent zero adjusts were performed, following the procedure described in Ecotech (2009) manual. The uncertainty of the Aurora 3000 is given in the user manual as 2.5 %. However, it has been noted that the three wavelengths of the Chacaltaya's nephelometer do not present equivalent robustness. Indeed, measurements at 635 nm remain unstable during the analysed period and are thus not selected for the following results.
More optical parameters can be retrieved from the combination of these instruments. The extinction coefficient (σext) and aerosol particle SSA are calculated according to Eqs. (5) and (6). In addition, the full spectral information of each instrument is fitted by a power law (Eqs. 7 and 8) and allow us to retrieve aerosol particle Ångström exponents such as the SAE from nephelometer measurements, the AAE from aethalometer measurements, and the SSAAE.
with babs, bscat, and bssa and AAE, SAE, and SSAAE being the power-law fit coefficients.
2.3 Method for differentiating stable or turbulent conditions at CHC
As is often the case for mountain sites, CHC is strongly influenced by thermal circulation, developed on a daily basis on mountain slopes (Whiteman, 2000). Depending on the time of the day and the season, the CHC high-altitude site can be influenced by air masses from the mixing layer, the residual layer or the lower free troposphere. The mixing layer height is driven by convective processes related to surface temperature, with a higher mixing layer height during the daytime and a lower height during the night-time. In addition to the diurnal mixing layer cycle, the complex mountainous topography of the area affects local circulation by channelling the air flow, thus complicating the differentiation between the mixing layer and free troposphere. In addition, a residual layer can also be present at the CHC station during night-time, resulting from low dispersion of the daytime convection. Because no clear distinctions between the mixing, the free tropospheric, and the residual layers can be strictly obtained from in situ measurements only, the present dataset recorded at Chacaltaya station is separated in terms of stability conditions (turbulent and stable). To differentiate stable conditions (SCs; typically the free tropospheric layer, but also RL, residual layer) from turbulent conditions (TCs; typically the mixing layer, but also cloudiness over the station or wind channelling effects), we used a methodology described in Rose et al. (2017). This method is based on the hourly averaged value of the standard deviation of the horizontal wind direction (σθ in Eq. 10) calculated every 15 min:
with σθ(15) being the standard deviation of the horizontal wind direction calculated for the first 15 min of every hour and σθ(60) being the last 15 min of every hour.
and , , with the averages and of N being the number of horizontal wind direction (θi) recorded in 15 min.
A smoothed threshold is used to separate TC and SC ranges from 12.5 to 18∘ for the dry season and from 12.5 to 22.5∘ for the wet season based on Mitchell's (1982) recommendations and on BC analyses (Rose et al., 2017). Interface cases correspond to unclassified data which mainly show high variability of the standard deviation between the two categories of dynamics. As described in Rose et al. (2017), the classification depends also on the σθ value in the 4 h time interval across the time of interest. Interface cases correspond to unclassified data which mainly show a high variability of the standard deviation between the two categories of dynamics. For clarity, the interface cases are excluded from the dataset in the rest of the paper.
The standard deviation of horizontal wind direction at CHC highlights the diurnal cycle between stable and turbulent conditions directly related to temperature and the behaviour of the atmospheric boundary layer (ABL). This influence of the TC at CHC is due to its particular topographical setting, particularly due to its proximity to the Altiplano (altitude > 3 km, 200 km width near CHC). This high and semi-arid plateau receives significant amounts of solar radiation that heat the surface, producing an expansion of the TC as observed in lidar measurements near the station (Wiedensohler et al., 2018).
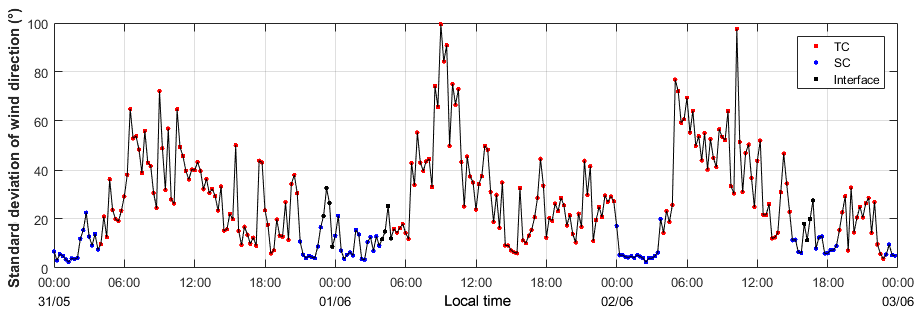
Figure 2Standard deviation of the wind direction measured at the high-altitude site of Chacaltaya (5240 m a.s.l.) from 31 May to 2 June 2012 at 1 h resolution. Red points correspond to turbulent-condition (TC) cases, blue points to stable-condition (SC) cases and black points to undefined or interface cases. Time corresponds to the local time.
Figure 2 shows the standard deviation of the horizontal wind direction during a 3 d period (from 31 May 2015 to 2 June 2012) with blue lines representing SC cases and red lines TC cases. Black spots represent undefined cases (or interface) due to a fluctuating classification within the 1 h time window. This 3 d example shows that SCs are mostly observed during night when the convective effect of the previous day is already dissipated and no convective effect of the current day is present.
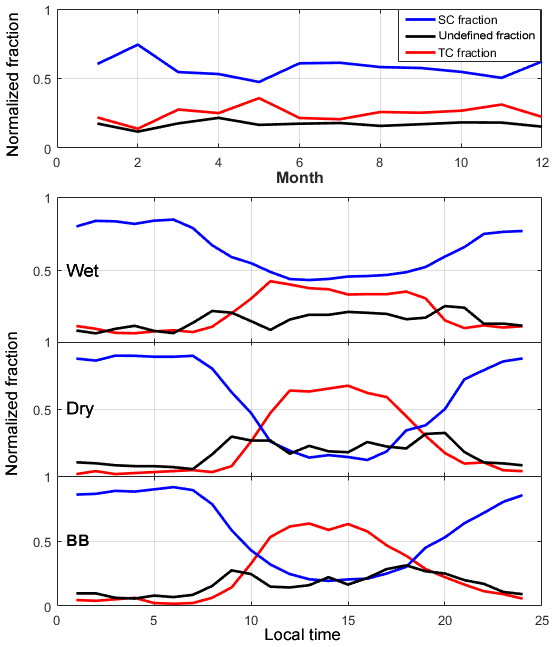
Figure 3Monthly and diurnal variations in TCs (red), SCs (blue), and undefined (black) fractions for each season.
Following this classification, the average monthly and diurnal variation in the fraction of SCs, TCs, and undefined conditions for each season for 4 years of measurements (from 2012 to 2015) were calculated and are represented in Fig. 3. For each season, SCs are dominant before 10:00 LT and after 18:00, whereas TCs are mostly observed during the daytime. This tendency is mostly observed during the dry season with more than 60 % of TCs in the daytime and 80 % of SCs at night-time. However, monthly variations show similar tendencies during the full year with around 60 % of time in the SC (in blue).
2.4 Identification of air mass origins at regional and mesoscales
HYSPLIT (Hybrid Single Lagrangian Integrate Trajectory; Stein et al., 2015) back-trajectories (BTs) are used in this study to investigate the aerosol particle transport to the CHC station and their properties as a function of the air mass origins. Hence, 96 h air mass BTs are calculated every hour from the CHC station during the 4-year measurement period (from 2012 to 2015). The WRFd04 dataset has been used to generate BTs every hour, starting at nine locations around the Chacaltaya station (within a square of 2 km × 2 km around the station). This dataset presents the best topographic resolution for this region with a spatial resolution of 1.06 km × 1.06 km, and 28 pressure levels.
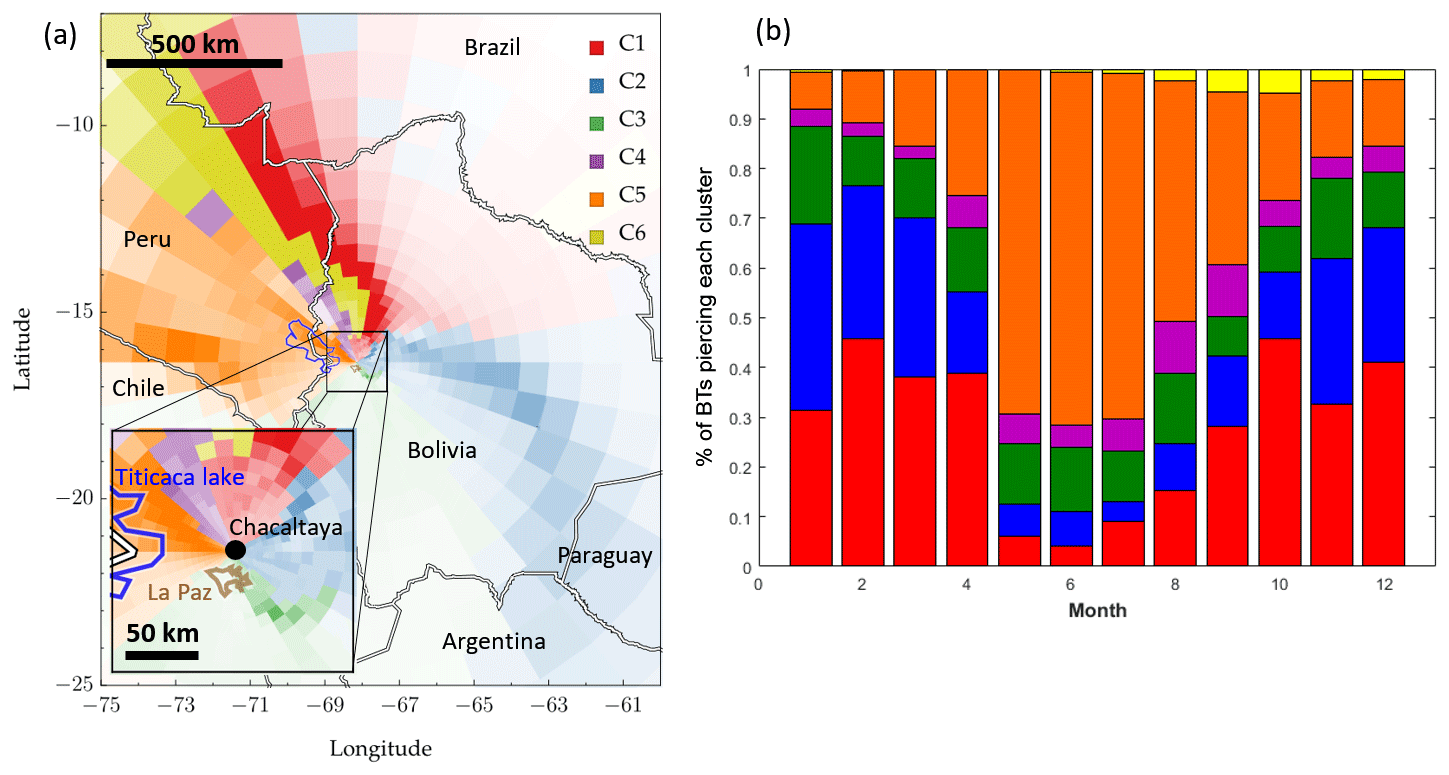
Figure 4(a) Trajectory frequency plot in the La Paz region in Bolivia, with a scale of 500 and 50 km in the lower left corner centred on the CHC station. (b) Monthly variation in the percentage of BTs for each cluster.
The BTs have been grouped into different clusters defined by their similarities in time and space. The cluster analysis method used in this study is described in Borge et al. (2007) and based on the Euclidean geographical coordinates distance and given time intervals. Figure 4a shows the trajectory frequency plot. The opacity of each pixel is proportional to the number of BTs passing through each grid cell. Clusters are defined by using a two-stage technique (based on the non-hierarchical K-means algorithm). Six clusters have been found around the Chacaltaya station. Hence, a fraction of each cluster is assigned to each BT and is calculated according the residence time in each cluster and their distance from the reference location (the Chacaltaya station). In order to obtain aerosol optical properties of each cluster, only a part of the back-trajectories have been selected. One BT is selected if its contribution to one cluster is high enough. For each cluster, the first 10 % of the BTs have been selected by demonstrating the highest contribution to any one cluster. This first 10 % of BTs related to each clusters and their mean paths are shown in Appendix A1.
Figure 4b shows seasonal variations in each cluster fraction. Results show that most of the air masses influencing the CHC station come from the highlands (Altiplano), the Pacific Ocean, and along the Cordillera Real slopes to the north of the CHC station. For each cluster, a characteristic geolocation along the path of back-trajectory is identified, and abbreviations are used for clarity:
-
Cluster 1 (NA): northern Amazon Basin/north-east slope of the Cordillera Real
-
Cluster 2 (SA): southern Amazon Basin
-
Cluster 3 (LP): La Paz–El Alto
-
Cluster 4 (ATL): Altiplano/Lake Titicaca
-
Cluster 5 (APO): Altiplano/Pacific Ocean
-
Cluster 6 (NES): north-east slope of the Cordillera Real
Clusters 1 and 2 (NA and SA respectively) cover the entire east part of air masses, limited by the high wall formed by the Cordillera Real. These two clusters could be influenced by Amazon Basin activities, such as BB, which is extremely active from August to September, and biogenic forest emissions. Cluster 3 (LP) seems to be the main cluster representing local urban emissions, for example vehicle emissions, industrial activities, and domestic heating. Clusters 4 and 5 (ATL and APO) can both give information on Altiplano sources (dust, urban emissions, etc.) but also on humid air masses from Pacific Ocean and Lake Titicaca. Finally, Cluster 6 (NES) has properties close to Cluster 1 but with less influence from the Amazon Basin and properties close to Cluster 4 but with aerosol sources further from the CHC station (> 100 km). All these cluster definitions will be discussed in this paper in the context of the associated aerosol particle optical properties.
Figure 4b shows the seasonal influence of the different clusters on CHC measurements. During the dry period, air masses measured at the CHC station are mainly influenced from the north-west (Cluster APO), accounting for more than 60 % of the BTs between June and July. During the wet period, the main influence is from the east (Clusters NA and SA) with more than 60 % of the BTs between December and April. Finally, LP, ATL, and NES share about 10 % of the BTs throughout the year but with a local maximum in August, September, and October respectively.
3.1 Seasonal and diurnal variations
The monthly median scattering coefficient (σscat), absorption coefficient (σabs), extinction coefficient, and SSAs from 2012 to 2015 are shown in Fig. 5a with 25th and 75th percentiles. They are all interpolated at 500 nm using scattering and absorption Ångström coefficients (Eqs. 7 and 8). The extinction coefficient and SSA were calculated from Eqs. (5) and (6) respectively at 500 nm. Figure 5b shows monthly Ångström exponent values from the same dataset.
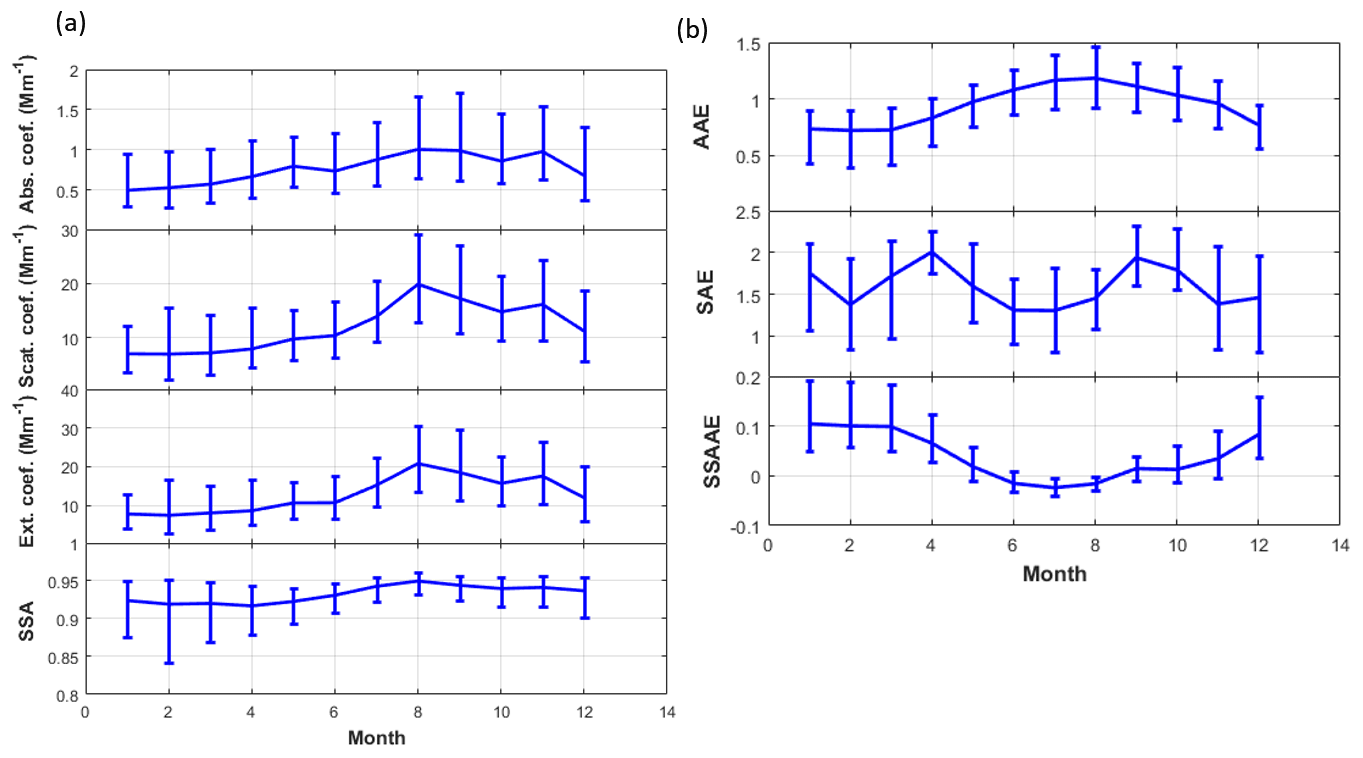
Figure 5Monthly (a) absorption coefficient, scattering coefficient, extinction coefficient, and single scattering albedo (all at 500 nm) measured at the CHC station for 4 years and (b) AAE, SAE, and SSAAE. Solid line corresponds to the median, and error bars indicate the range between the 25th and 75th percentiles.
The annual median [25th percentile–75th percentile] absorption coefficient at CHC is 0.74 Mm−1 [0.43–1.25] at 500 nm. A clear seasonal variation can be observed with low values during the wet season (0.57 Mm−1 [0.32–1.05] between December and March) and higher values during the dry season (0.80 Mm−1 [0.52–1.24] between May and July). The highest values are observed from July to November (including the August–September BB period) with a median absorption coefficient of 1.00 Mm−1 [0.64–1.70]. Similar seasonal variations are observed for the scattering coefficient, with a more pronounced increase occurring during the BB period.
The median scattering coefficient of the entire dataset is 12.14 Mm−1 [6.55–20.17]. Scattering coefficients are lower during the wet season (7.94 Mm−1 [3.45–15.00]) than during the dry season (11.23 Mm−1 [6.94–17.60]), and reach a maximum median scattering coefficient of 18.57 Mm−1 [11.63–28.45] during the BB period. Regardless of the season, these values are very low in comparison to aerosol particle optical properties at lower-lying stations, as shown by Chand et al. (2006) during the LBA-SMOCC (Smoke, Aerosols, Clouds, Rainfall and Climate) campaign at the FNSA station (10.76∘ S, 62.32∘ W; 315 m a.s.l.). Their work shows that scattering coefficients and absorption coefficients reach 1435 and 70 Mm−1 respectively during important BB periods, while remaining at 5 and 1 Mm−1 during clean conditions.
The median extinction coefficient at CHC is 12.96 Mm−1 [7.07–21.62]. This extinction coefficient range is at least 1 order of magnitude lower than other measurements reported during the BB period in the Amazon Basin. This is likely due to the altitude at which the CHC station is located and but mainly to its distance from the BB sources.
We measured a small seasonal variation in the SSA, with a median value of 0.93 [0.87–0.95] during the wet season, 0.93 [0.91–0.95] during the dry season, and 0.95 [0.93–0.96] during the BB period. These observations are again different from results reported from measurements performed closer to BB sources in the Amazon region, with the SSA being higher at CHC than at the source regions. Reid et al. (1998) show that at Cuiabá, Porto Velho, and Marabá, the SSA was around 0.80 from aircraft measurements during BB episodes. However, the authors report that the SSA values increase rapidly with time, i.e. from 0.85 to 0.90 in 1 or 2 d in this region (Reid et al., 1998, 2005). The remote location of the Chacaltaya station thus explains the high SSA values observed in the present study.
Figure 5b shows the monthly variations in the Ångström exponents. Although AAE values are slightly lower than expected (between 1 and 2 according Russell et al., 2010), variations in AAE and SSAAE values exhibited typical seasonal variation. The lowest values of the AAE are retrieved between December and March (mean AAE value of 0.8), and the highest SSAAE values are retrieved during the same period (around 0.1). A seasonal variation in these intensive optical parameters shows that different sources of aerosol influence CHC in different season. While AAE and SSAAE values show a significant seasonal variability, SAE values are more fluctuating. The highest SAE values are observed in April and September (up to 2) and persistent low values are seen between June and August. Ealo et al. (2016) used Ångström coefficients to address the nature of aerosols. Applying their analysis technique, the seasonal evolution of the AAE, SSAAE, and SAE can be interpreted as indicating that urban emissions (low AAE values and high SSAAE and SAE values) contribute in the wet period in the La Paz region (from December to March), whereas dust particles mostly contribute in the dry and biomass burning period (from April to November).
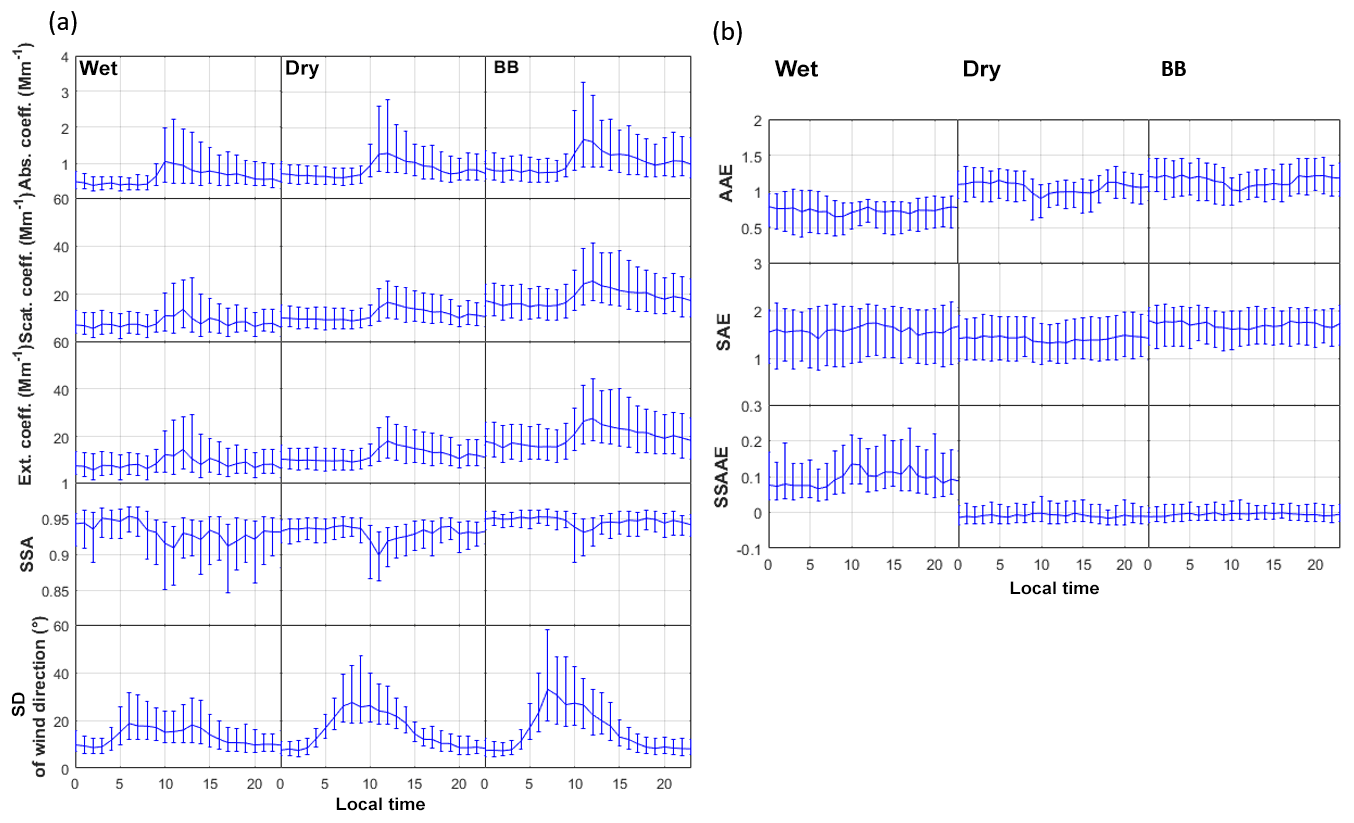
Figure 6Hourly medians (with 25th and 75th percentiles) of (a) the absorption coefficient, the scattering coefficient, the extinction coefficient, the single scattering albedo at 500 nm, and the standard deviation (SD) of the wind direction and of (b) the AAE, SAE, and SSAAE measured at the CHC station for each season.
Figure 6a shows the diurnal variations in aerosol particle optical properties averaged over the wet and dry seasons and the BB period and the diurnal variation in the standard deviation of the wind direction. For extensive optical parameters, a clear increase is observed starting around 08:00 LT. This time evolution is observed for all seasons, as the result of the diurnal variation in the turbulent layer height described in Sect. 2.3. Optically scattering and absorbing particles emitted at ground level are mixed into the turbulent layer and reach the CHC altitude due to dynamic and convective effects of the atmosphere during the daytime. Indeed, the variation in the atmospheric dynamics can be observed through the variation in the wind direction with significantly stronger turbulences between 08:00 and 12:00 and during all seasons.
From the diurnal variations one can also observe that not only the daytime optical properties exhibit pronounced seasonal variation but the night-time coefficients also do so, being influenced by the SC (Fig. 3). This confirms that emissions in the region have a clear influence on both TC and SC layers which can be measured at high-altitude stations continuously.
The diurnal variation in the SSA shows a clear decrease at around 11:00, when only TC particles are sampled at the station, indicating that TC particles are relatively more absorbing compared to SC particles. This observation can be explained by the local BC emission from traffic (Wiedensohler et al., 2018) and aged BB particles. Values can reach 0.90 a few hours after exhaust emissions according Reid et al. (2005). Figure A2 allows us to identify these urban influences of the in situ measurements at the CHC station through the difference in the AAE between workdays and Sundays.
Figure 6b also shows hourly variations in the Ångström exponents for the three periods. A diurnal variation is observed mostly for SSAAE values for the wet period, with an increase of more than 50 % of SSAAE values during the daytime compared to the night-time. As from extensive optical properties, these observations can be explained by the arrival of the TC at the CHC stations, with more local urban particles reaching the mountain station around 11:00.
3.2 Aerosol particle optical properties in stable and turbulent layer conditions
Using the method explained in Sect. 2.3, it is possible to characterize SC and TC optical properties separately. Median optical properties for each atmospheric condition (TC and SC) are presented Fig. 7 for each season (wet, dry, and BB).
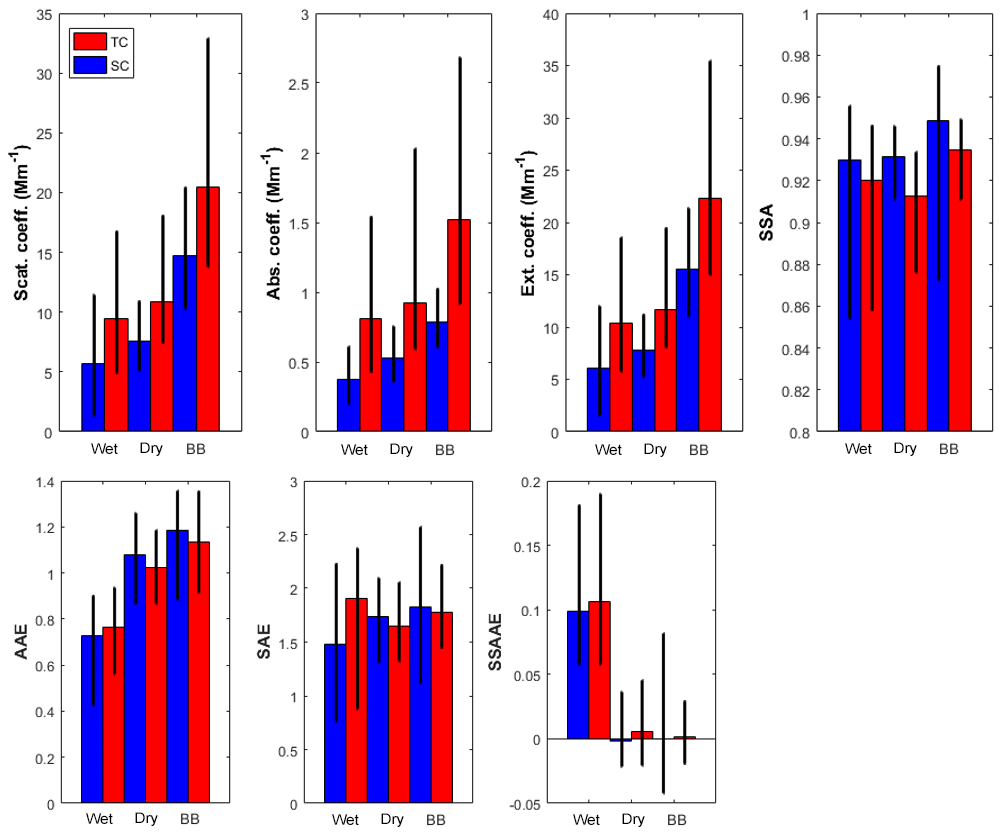
Figure 7Median aerosol particle optical properties at 500 nm for each season and each atmospheric layer determined by the method detailed in Sect. 2.3. Red bars represent the turbulent-condition optical properties and blue bars the stable-condition properties. Error bars correspond to the 25th and 75th percentiles.
The optical properties of the particles sampled in the TC are different from the ones sampled in the SC, with 1.49 times higher scattering coefficients, 1.94 times higher absorption coefficients, and 1.55 times higher extinction coefficients. We observe that the difference between TCs and SCs is highest during the wet season and lowest during the dry season. Indeed, the mean TC-to-SC ratio of extinction coefficients is 1.71 during the wet season, while it is only 1.49 during the dry season and 1.44 during the BB period. These lower TC-to-SC ratios indicate that the SC particles are more influenced by TC intrusions during the dry season and the BB period than during the wet season.
These results also show that emissions from the Amazon Basin have an important influence on the whole atmospheric column and at the regional scale. Indeed, both SCs and TCs present higher extinction coefficients during the BB period than the dry season (around 2 times higher). The same observations can be made for scattering and absorption coefficients.
The SSA values do not show a strong contrast between the SC and the TC, although lower values are systematically observed in the TC compared to the SC (0.93, 0.93, and 0.95 during wet, dry, and BB seasons respectively in the SC and 0.92, 0.91, and 0.93 in the TC). As discussed by Reid et al. (2005), SC aerosol particles are aged longer and transported farther than TC particles due to less scavenging effects. The long transport modifies their optical properties to slightly increase the SSA. However, the small SSA difference between TCs and SCs indicates that the nature of the aerosol is actually similar between the TC and SC for a given season. As shown previously, the AAE increases in the dry and BB seasons, probably due to dust transport and to BB emissions. The contribution of dust is consistent with the drastic difference in SSAAEs between wet season on one side and dry and BB seasons on the other. Not only SSA values, but also AAE, SAE, and SSAAE values show a weak TC–SC contrast. This again illustrates that ageing processes of air masses in the full troposphere, which homogenize their properties with time after emission.
3.3 Influences of air mass type on aerosol particle optical properties
The separation of air mass types into clusters allows us to analyse the influence of the different sources surrounding the station on their aerosol particle optical properties. The seasonal variability of aerosol particle optical properties may be attributed to a seasonal variability in the air mass types arriving at the station. As shown Fig. 4, air masses coming from the north-west (Cluster APO) dominate during the dry season, whereas other air masses are from the east of the station. Clusters NA and SA play a major role during the wet season. Figure 8 shows TC and SC optical properties. For each cluster and each season, the left bar indicates the TC property and the right bar the SC property.
Table 2Median aerosol Ångström exponents of turbulent conditions (stable conditions) for each cluster and season measured at the CHC station along with the resulting aerosol types.
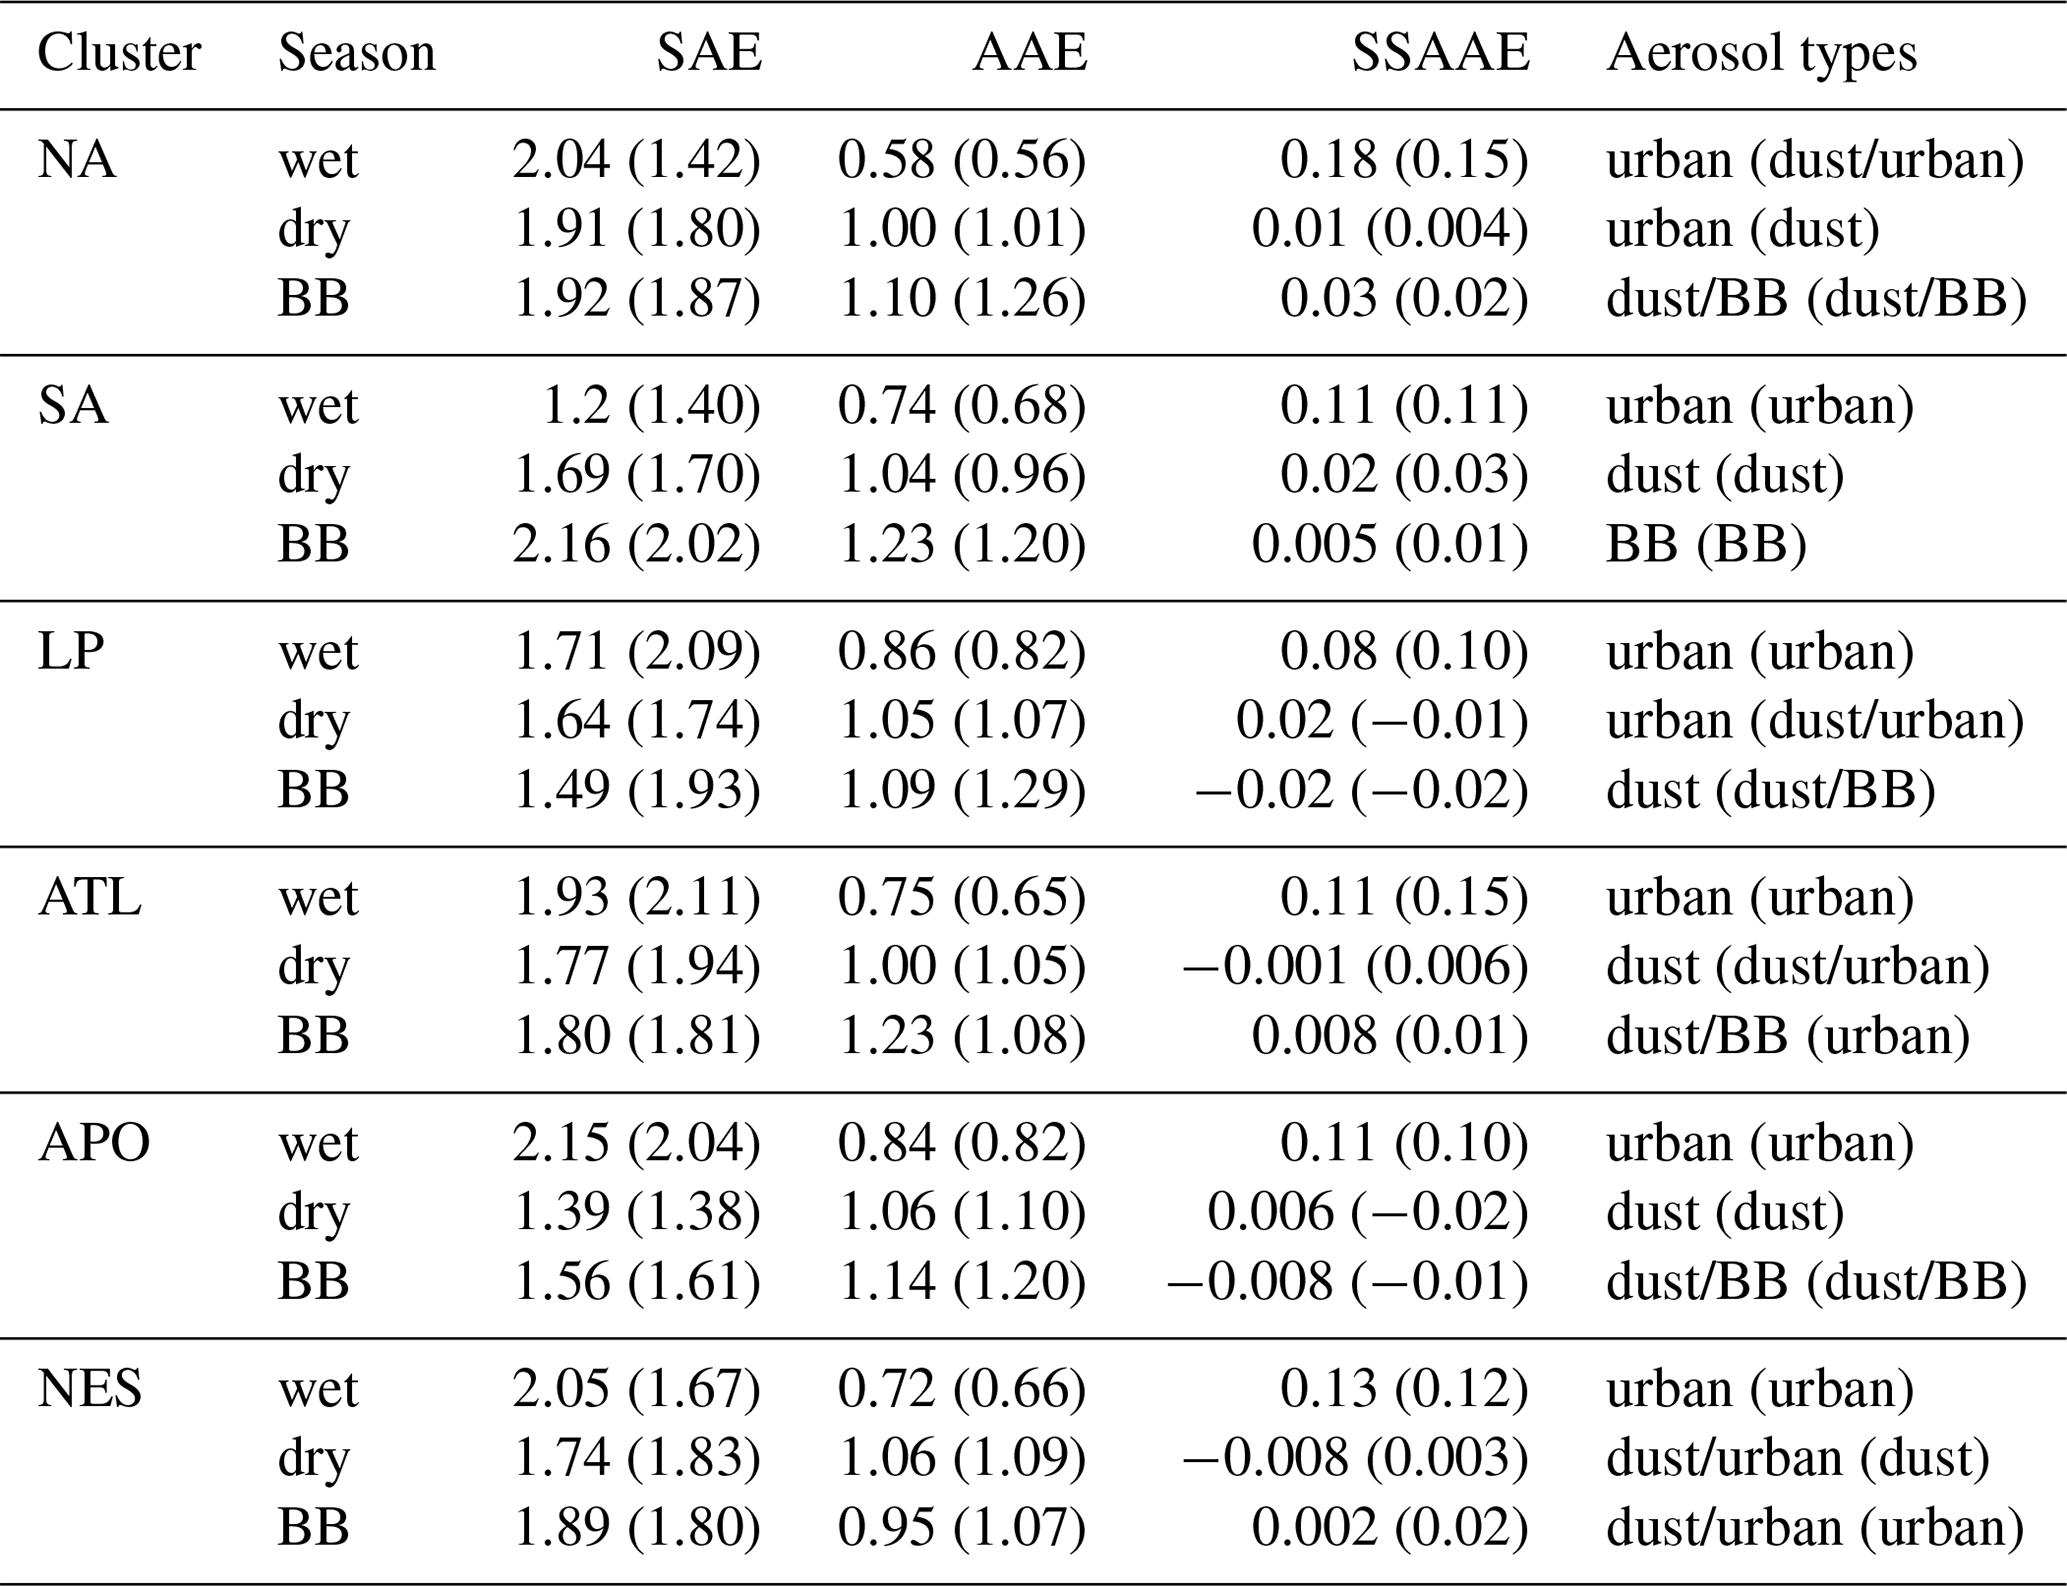

Figure 8Aerosol particle optical properties from Chacaltaya measurements from 2012 to 2015 at 500 nm for TC (left bar of each colour) and SC (right bar of each colour) layers for each cluster and the three periods.
A strong air mass type dependence of the aerosol optical properties is found during the wet season. The highest extinction coefficients are found within air masses originating from the urban area of La Paz–El Alto (LP in green in Fig. 4) with a median value of 13 Mm−1. This value is significantly larger than other air masses, which remain at less than 7 Mm−1. The exceptionally high extinction coefficient may be mainly due to particle emissions from traffic in La Paz (Wiedensohler et al., 2018), despite the effect of wet deposition during this period. The lowest SSAs are measured during the wet period, mainly within the NA air masses. This may be explained by important heating activities in the Yungas region on the north-east slope of the Cordillera Real in this period. Due to the wet deposition, aerosol particle lifetime is significantly decreased and the main part of aerosol particle optical measurements at CHC is from low altitudes (TC). Indeed, median TC extinction coefficients are from 10 % (for APO) to 200 % (for NA) higher than values in the SC.
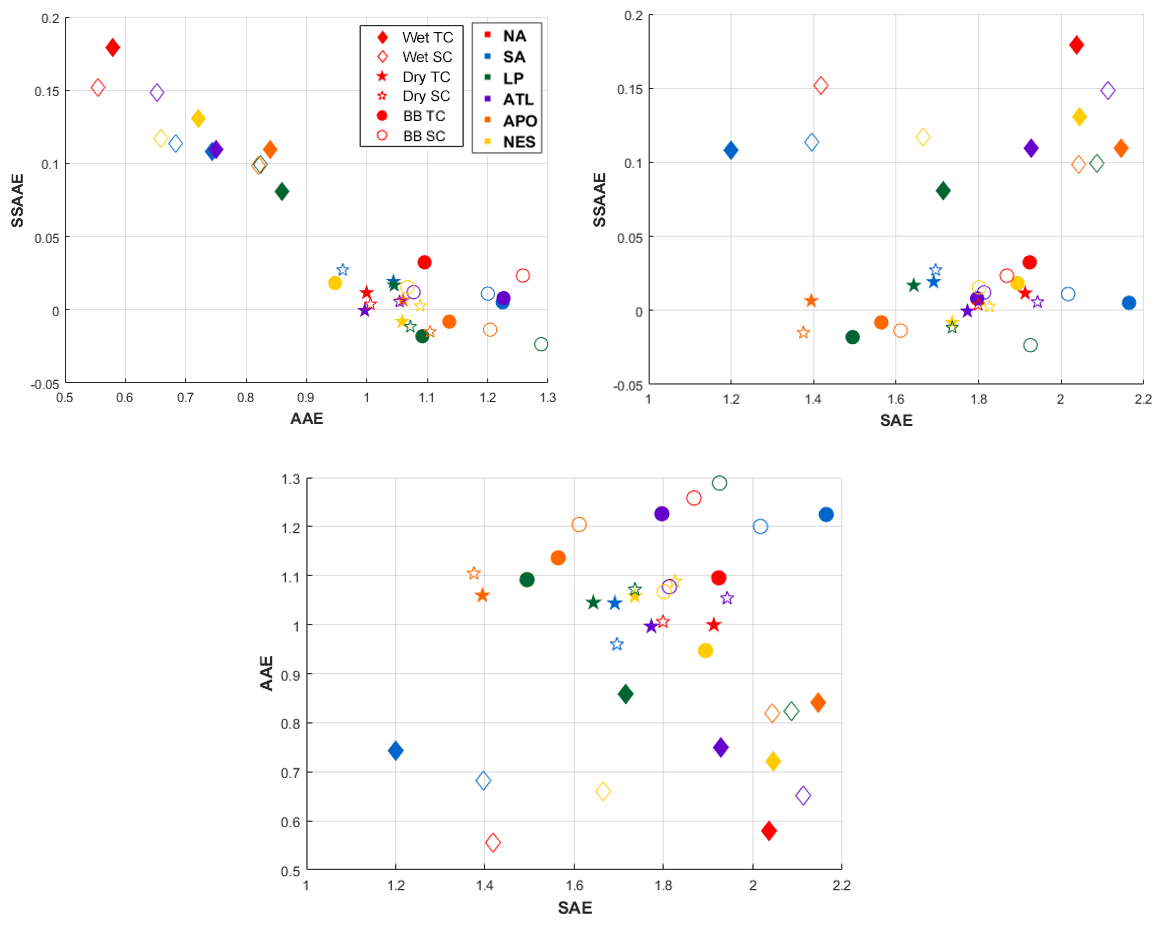
Figure 9Wavelength dependence of optical properties measured at Chacaltaya station for each cluster (colours) and each season (markers) as parameterized by Ångström exponents. Diamonds correspond to median values during the wet period, stars correspond to the dry period, and circles correspond to the BB period.
During the dry season, extensive optical properties are larger than during the wet season for all clusters except for the cluster from the urban area of La Paz–El Alto (LP). The extinction coefficients are more than 50 % larger, with median values of around 10±2 Mm−1. The strong rise of the extensive optical properties is due to a low wet deposition rate during the dry season that extends aerosol lifetime. The extended aerosol lifetime allows local emissions to reach the in situ station.
A further clear increase in all extensive optical properties is observed during the BB period. Extinction coefficients increase by 42 % (LP) to 203 % (NA). The cluster analysis shows that BB events impact atmospheric properties, regionally influencing all clusters. However, higher increases are observed for air masses coming from the east (more than 80 % higher for NA, SA, LP, and NES) compared to from the west (45 % to 70 % higher), directly linked to intensive anthropogenic activities in the Amazon Basin during this period. During extreme events, average extinction coefficients in CHC measurements can reach 247 Mm−1 (for NA). A strong influence of BB emissions appears in TC measurements with extinction values more than 160 % higher than during the dry season, but a significant increase is also observed in the SC measurements (around 110 % higher than the dry season for north-east air masses).
In addition to the classification of air masses into different clusters, we further classify aerosol particle types on the basis of their optical properties to characterize the influence of the different sources in this region.
Figure 9 shows the correlation of the AAE, the SAE, and the SSAAE for each season (symbols), each cluster (colours) and each tropospheric condition (filled marker for the TC and un-filled markers for the SC).
As shown in Fig. 5, low AAE values, especially during the wet season, can be explained by an important reduction in dust and less biomass burning particles due to more efficient removal. As observed previously, Fig. 9 demonstrates that the wet season (diamonds) in this region is mainly influenced by a different source from the dry and the BB season. Thus, the wet season presents a positive SSAAE and AAE close to or lower than 0.9, while the dry season and the BB period present SSAAEs close to 0 and AAEs higher than 0.9. A linear relationship between AAE and SSAAE values is observed and illustrates that it is mainly urban emissions that drive aerosol particle properties during the wet period and mainly dust emissions that drive aerosol particle properties during the dry season and the BB period. Indeed, the large covering of arid surfaces on the Altiplano (west of the CHC station) presents an important source of dust. This result also indicates that whatever the air mass type and the atmospheric condition, ground emissions influence the optical properties of the whole atmospheric column at a regional scale. In addition to dust emissions, the BB period also demonstrates a significant contribution of BB combustion particles, with higher median AAE values than during the dry season. Except for the NES cluster (west side of the Bolivian Cordillera), AAE values are retrieved between 1.1 and 1.3 during the BB period and between 0.9 and 1.1 during the dry season.
Although there are dominant aerosol sources for each season as demonstrated in Fig. 8, the scatter plots of Ångström exponents in Fig. 9 provide additional insights into air mass origins. During the dry season, the scatter plot of the AAE and SAE shows an important contribution of urban emissions in addition to the dominant dust aerosol. For some clusters, characteristics of urban emission are observed with an AAE close to 1 and an SAE higher than 1.4 for some clusters. During the BB period, a strong TC or SC dependence is seen for La Paz–El Alto air masses (Cluster LP). The AAE value for the TC indicates urban pollution effects (AAE below 1.1), whereas the AAE for the SC shows an influence of BB emissions (AAE close to 1.3). A similar SC dependence can also be observed for NA and APO clusters. Because AAE values are powerful tracers to separate urban and BB influences on aerosol particle optical properties, the TC or SC dependence clearly demonstrates the influence of Amazonian biomass burning on Chacaltaya in situ measurements during the BB period within the SC. Because BB particles are mainly emitted from the east part of the Bolivian Cordillera, NES air masses are less influenced by these sources and present the lowest AAE values during the BB period.
The distribution of the SAEs is more spread out, and the value depends on atmospheric conditions, clusters, and seasons. In addition to urban influences, during the BB period and the wet season, LP air masses are also affected by dust particles, especially in the TC, with lower SAE values. The opposite is observed for NA air masses. While the main influence in these two air masses continues to be from urban emissions, it may be seen that the lower part of the atmosphere (TC) in LP air masses is more affected by local dust particles than at the higher part of the atmosphere (SC). In NA cases, also observed for APO air masses, SC measurements are less influenced by urban particles due to a longer distance between the CHC station and urban emissions than in LP cases.
Table 2 summarizes the median Ångström exponents measured at the CHC station for turbulent conditions (stable conditions in parentheses). According to these values and as discussed above, aerosol types for the turbulent conditions (and stable conditions in parentheses) are also given.
Table 3Updated Ångström exponent values expected for aerosol types at the CHC station.

Chacaltaya station is currently a unique high-altitude atmospheric observatory in the Andes. The location of the station allows us to sample air masses of different types (mainly urban, biomass burning, and dust particles). Measurements have been run over a long-term period at a high temporal resolution and with a large set of instruments. This study reports the impact of several aerosol sources in South America through the variability of aerosol particle optical properties. We show that the Central Andean region (Cordillera Real) is characterized by median annual values of absorption, scattering, and extinction coefficients of 0.74, 12.14, and 12.96 Mm−1 respectively. Results also show the effect of the two main seasons (a dry and a wet season) on aerosol particle optical properties characteristic of different source influences. Diurnal variations are also observed due to atmospheric boundary layer dynamics influencing this high-altitude location.
The topography of the surrounding region also gives unique opportunities to sample aerosol particle optical properties within different atmospheric conditions. For each season, SCs have been identified in contrast to TCs using the standard deviation of the wind direction. Although the TC is usually attributed to the mixing layer, the SC can undoubtedly be attributed to free tropospheric or residual layers.
Every year, from July to November, this region is influenced by important biomass-burning activities at the regional scale. The present study clearly demonstrates the regional impacts of these activities. Results show higher scattering and absorption coefficients during the BB period (44 % to 144 % increase compared to the dry season) that can be observed in all tropospheric layers. The present study has hence demonstrated that BB particles are efficiently transported to the higher part of the troposphere (stable conditions) and over long distances (more than 300 km). However, differences in the optical properties between different air mass types are less pronounced in the SC than in the TC, which can be mainly explained by the longer lifetime of the aerosol particles within the higher troposphere.
One of the main aerosol sources in the Bolivian plateau is the urban area of La Paz–El Alto. It contributes significantly to optical properties of the atmosphere due to important traffic emissions and industries (Wiedensohler et al., 2018). In addition to BB activities, the urban area with 1.7 million inhabitants, located at 17 km south of the CHC station between 3200 and 4000 m a.s.l, was found to contribute significantly to the optical characteristics of the aerosol particles sampled at CHC. The lowest single scattering albedo values (median of 0.85), attributed to incomplete combustion, were observed for back-trajectories from the urban area of La Paz–El Alto during the wet season, and the same air mass has the highest extinction coefficient during the wet season. This strong signature of pollution aerosols is also highlighted by the wavelength dependence of the AAE both in the TC and SC.
Finally, the arid plateau of the region has also demonstrated a regional impact. In addition to urban and BB influences, the wavelength dependence of the single scattering albedo (SSAAE) measured at CHC highlights a main dust influence during the entire dry season, with SSAAE values close to 0. This influence is no longer observed during the wet season due to particle scavenging and less dust rising up due to wet soils.
A new Ångström exponent classification can then be defined for measurement at the CHC station and is reported in Table 3. Thresholds are close to the ones proposed in previous work (Dubovik et al., 2002; Collaud Coen et al., 2004; Clarke et al., 2007; Russell et al., 2010) but adapted to CHC's instruments and particular atmospheric conditions.
The in situ measurements of the high-altitude station of Chacaltaya provide useful information on the different aerosol sources in this region. Thus, they can be used to validate satellite products such as the Cloud Aerosol Lidar and Infrared Pathfinder Satellite Observations (CALIPSO) measurements of the vertical aerosol profiles, when chosen at the appropriate time of the day. We also found that most aerosol intrinsic properties were very similar over the whole atmospheric column, thus indicating that they can also be used to validate Moderate Resolution Imaging Spectroradiometer (MODIS) measurements of columnar aerosol particle optical depth over the bright region at a high elevation.
Nephelometer, aethalometer, and MAAP measurements are accessible from the EBAS website (http://ebas.nilu.no/, last access: 2 December 2019).
For each hour of the period of the study, nine back-trajectories were used to describe the mean influence at Chacaltaya station. The nine BTs start within a square of 2 km by 2 km around the station. The mean BT has been calculated from these nine BTs and generated every hour from January 2012 to December 2015. Clusters are defined according the Borge et al. (2017) methods, using a two-stage technique (based on the non-hierarchical K-means algorithm). The Borge et al. (2007) method allows us to attribute to each mean BT a fraction of each cluster according to their time residence in the cluster and their distance from the CHC station. Hence, BTs are sorted according to their representativeness in each cluster. The first 10 % of them are used in the present study and are reported in Fig. A1.
The weekly variation in the AAE is shown in Fig. A2 for the 4-year dataset. This representation of in situ measurements at Chacaltaya station allows a better discrimination between anthropogenic influence on the aerosol optical properties.
A net decrease in the AAE is observed for every working day at about 10:00, with median values of 1.2 in contrast to around 1.5 in the beginning and the end of the day, whereas Sundays clearly show constant (±0.05) values of the AAE for the entire day. These observations show that aerosol concentrations measured at Chacaltaya greatly depend on the activities in the urbanized area below the station.
Figure A3 shows a comparison of absorption coefficients at 635 nm measured by the aethalometer and the MAAP at the CHC station from 2012 to 2014. Because MAAP measurements can measure the aerosol particle absorption coefficient with a better accuracy (Saturno et al., 2017), this study validates the correction method by Weingartner et al. (2003) that is applied to the aethalometer measurements as recommended by Aerosols, Clouds, and Trace gases Research InfraStructure (ACTRIS; Müller et al., 2011a; Drinovec et al., 2015).
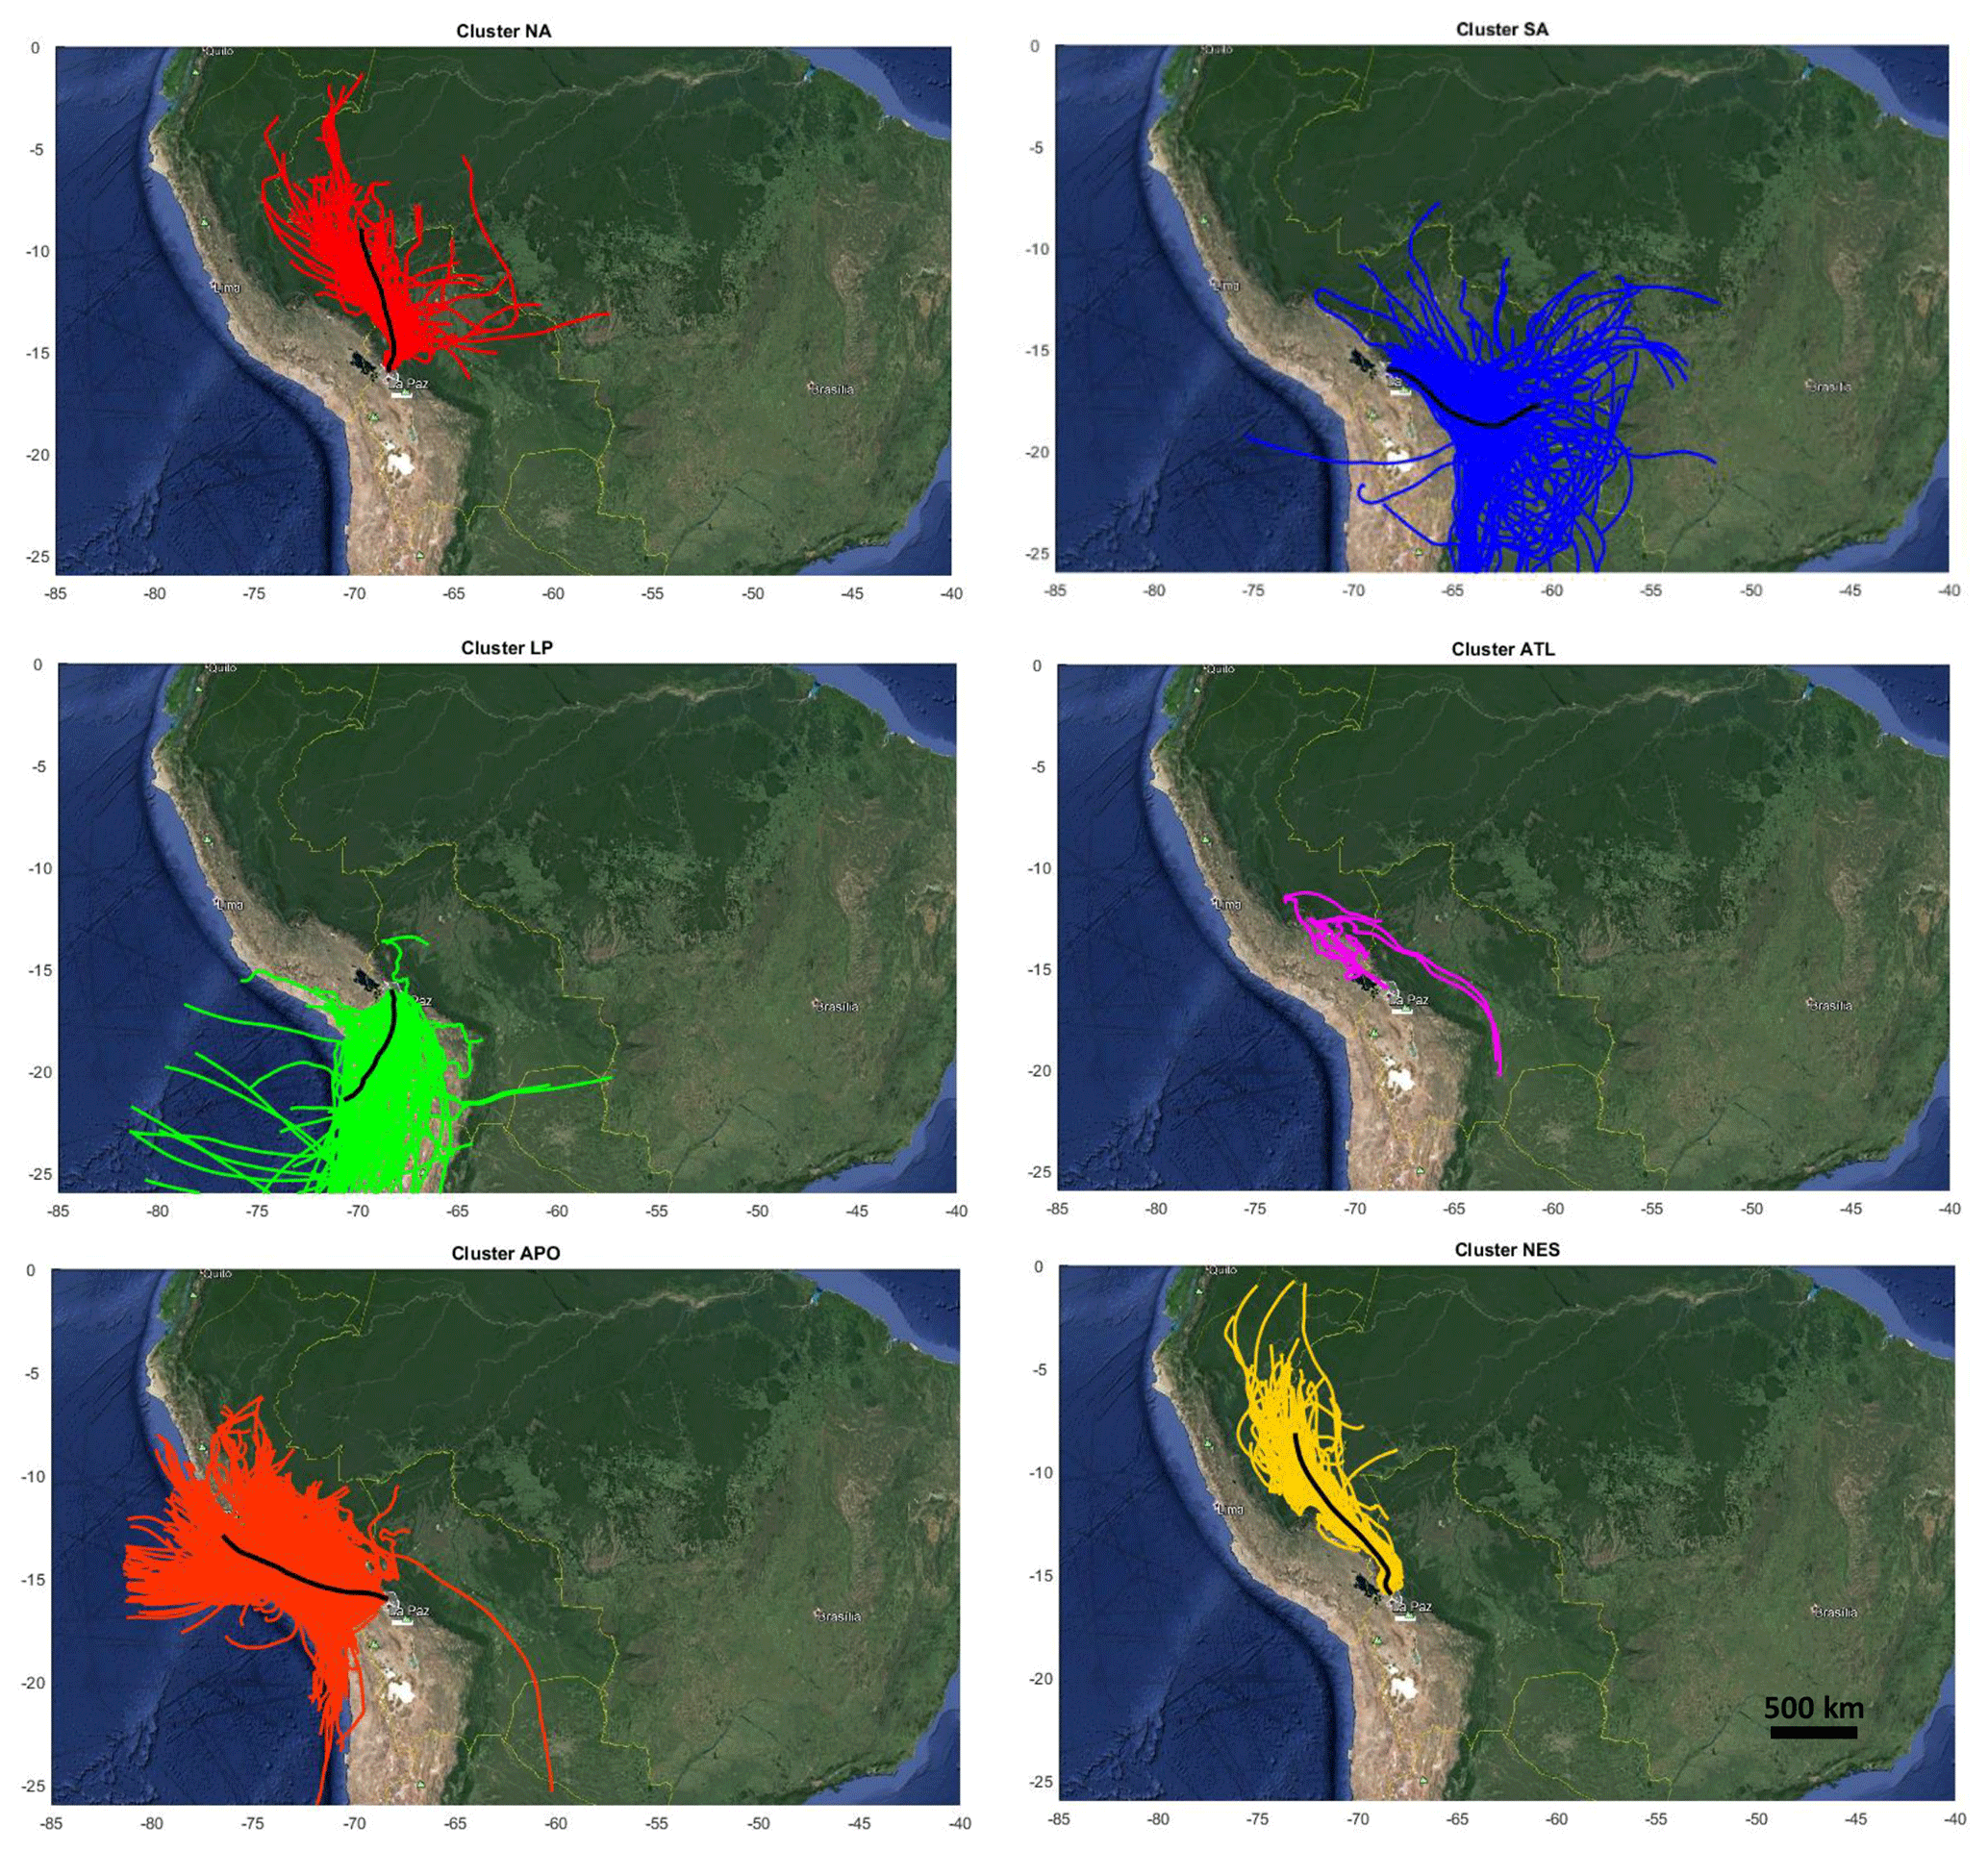
Figure A1Selected 96 h back-trajectories for the six clusters obtained with the Borge et al. (2007) method. The black line corresponds to the main back-trajectory. Background maps have been uploaded from © Google maps.
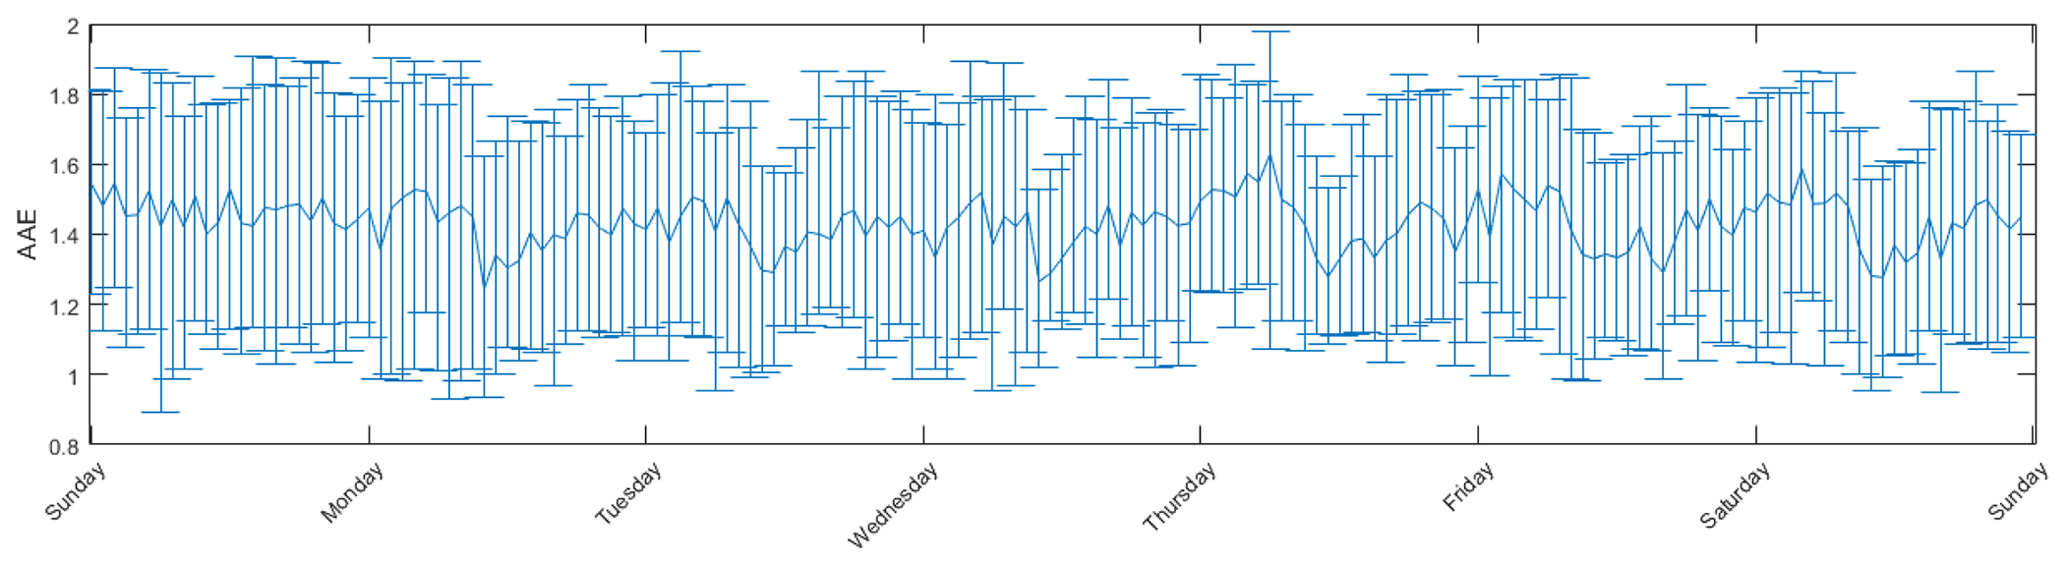
Figure A2Weekly variation in the AAE for the whole dataset from 2012 to 2015. The medians and their 25th and 75th percentiles from Sundays to Saturdays are represented.
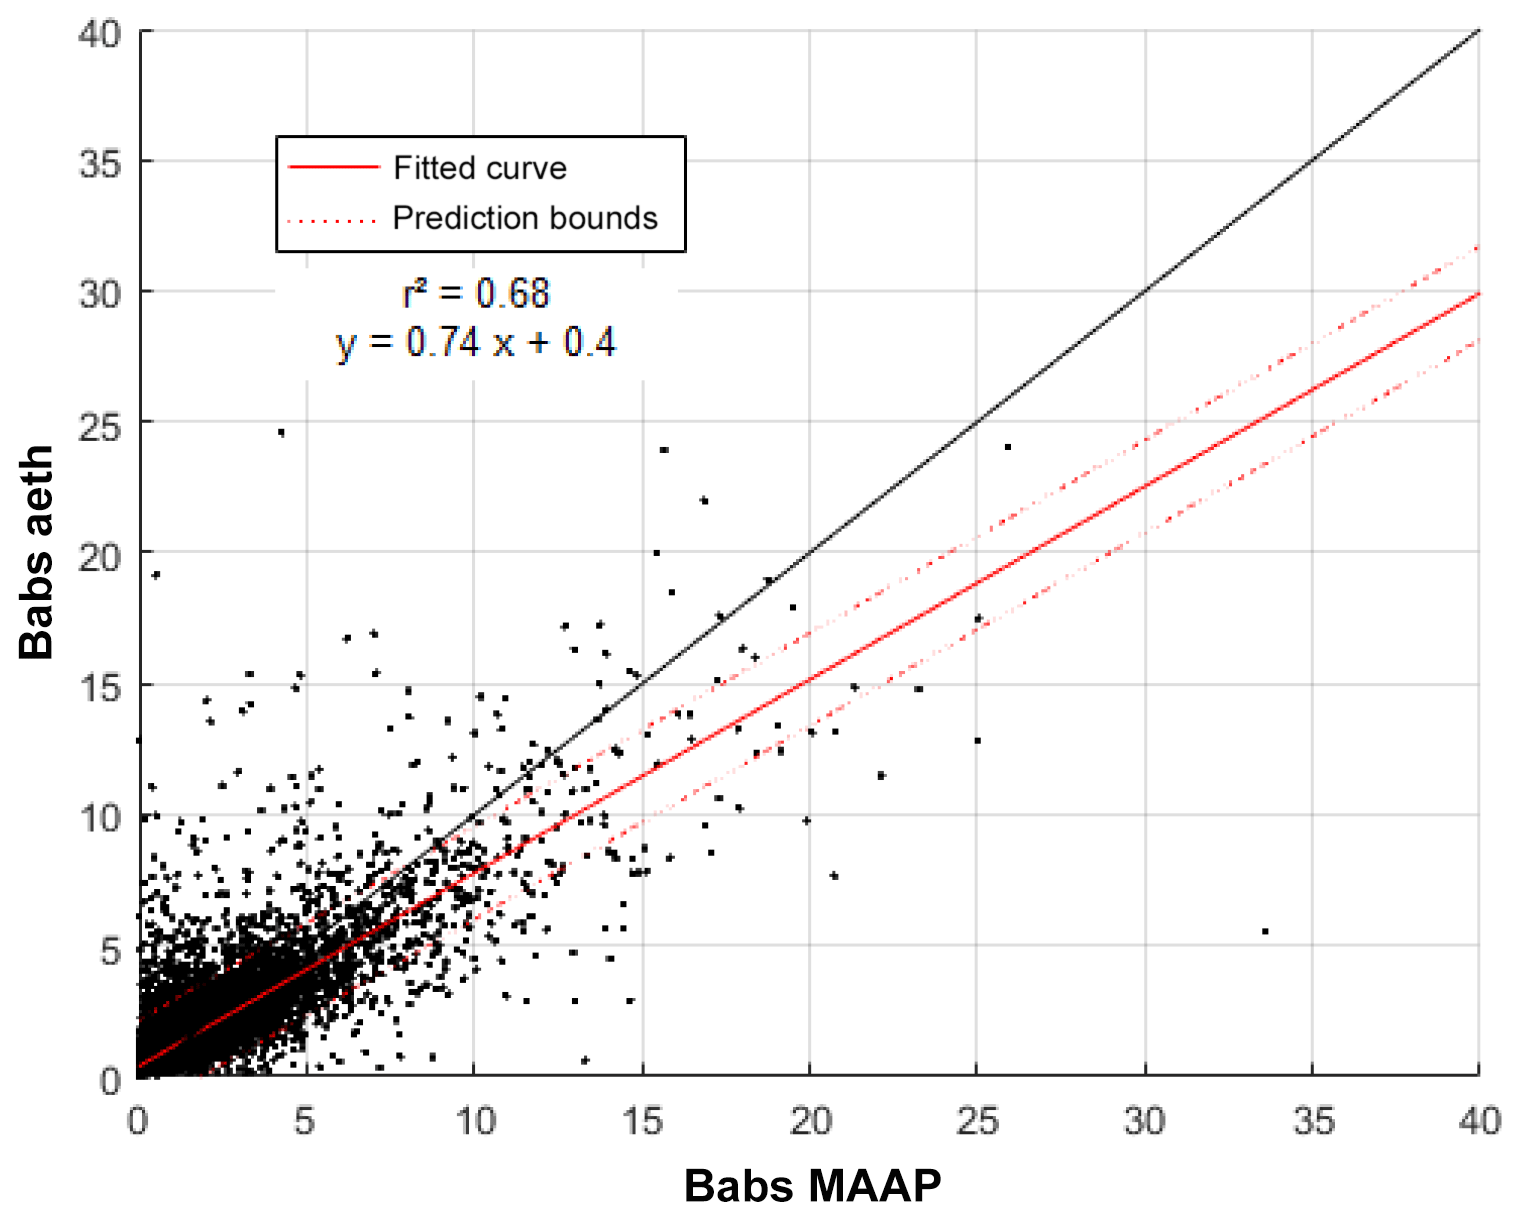
Figure A3Comparison of absorption coefficients (babs) measured at 635 nm according to aethalometer and MAAP measurements from the CHC dataset between 2012 and 2014. Black line corresponds to the 1-to-1 fit.
PG, IM, and FV, with the help of the UMSA, carried out the measurements at the station. MA, KS, AW, and PL supervised the project. DA and FV did trajectory analyses and IM developed the method to discriminate between stable and turbulent conditions. AC wrote the paper with the help of DA. RK, GM, and TM and brought instrumental instructions to convert and correct measurements. NM, MP, and KW helped shape the research and analysis. All authors discussed the results and contributed to the final paper.
The authors declare that they have no conflict of interest.
We acknowledge the financial support from IRD (Institut de Recherche pour le Développement) under the Jeune Equipe programme CHARME awarded to LFA, by Labex OSUG@2020 (Investissements d'avenir – ANR10 LABX56) and by ACTRIS-France National Research infrastructure. We gratefully acknowledge Souichiro Hioki for his help with English corrections and proofreading of an earlier version of this paper.
This research has been supported by European Union (grant agreement no. 654109) under the ACTRIS-2 (Aerosols, Clouds, and Trace gases Research InfraStructure) project.
This paper was edited by Nikolaos Mihalopoulos and reviewed by four anonymous referees.
Artaxo, P., Rizzo, V. L.,Brito, F. J., Barbosa, J. H., Arana, M. A., Sena, T. E., Cirino, G. G., Bastos, W., Martin, T. S. and Andreae, O. M.: Atmospheric aerosols in Amazonia and land use change: from natural biogenic to biomass-burning conditions, Faraday Discuss., 165, 203–235, https://doi.org/10.1039/C3FD00052D, 2013.
Borge, R., Lumbreras, J., Vardoulakis, S., Kassomenos, P., and Rodríguez, E.: Analysis of long-range transport influences on urban PM10 using two-stage atmospheric trajectory clusters, Atmos. Environ., 41, 4434–4450, 2007.
Boucher, O., Randall, D., Artaxo, P., Bretherton, C., Feingold, G.,Forster, P., Kerminen, V.-M., Kondo, Y., Liao, H., Lohmann, U., Rasch, P., Satheesh, S., Sherwood, S., Stevens, B., and Zhang, X.: Clouds and Aerosols, book section 7, 571–658, Cambridge University Press, Cambridge, UK and New York, NY, USA, https://doi.org/10.1017/CBO9781107415324.016, 2013.
Bourgeois, Q., Ekman, A. M. L., and Krejci, R.: Aerosol transport over the Andes from the Amazon Basin to the remote Pacific Ocean: A multiyear CALIOP assessment, J. Geophys. Res.-Atmos., 120, 2015JD023254, https://doi.org/10.1002/2015JD023254, 2015.
Carmona-Moreno, C., Belward, A., Malingreau, J.-P., Hartley, A., Garcia-Alegre, M., Antonovskiy, M., Buchshtaber, V., and Pivovarov, V.: Characterizing interannual variations in global fire calendar using data from Earth observing satellites, Glob. Change Biol., 11, 1537–1555, 2005.
Chand, D., Guyon, P., Artaxo, P., Schmid, O., Frank, G. P., Rizzo, L. V., Mayol-Bracero, O. L., Gatti, L. V., and Andreae, M. O.: Optical and physical properties of aerosols in the boundary layer and free troposphere over the Amazon Basin during the biomass burning season, Atmos. Chem. Phys., 6, 2911–2925, https://doi.org/10.5194/acp-6-2911-2006, 2006.
Charlson, R. J., Schwartz, S. E., Hales, J. M., Cess, R. D., Coakley, J. A., Hansen, J. E., and Hofmann, D. J.: ClimateForcing by Anthropogenic Aerosols, Science, 255, 423–430, https://doi.org/10.1126/science.255.5043.423, 1992.
Clarke, A., McNaughton, C., Kapustin, V., Shinozuka, Y., Howell, S., Dibb, J., Zhou, J., Anderson, B., Brekhovskikh, V., Turner, H., and Pinkerton, M.: Biomass burning and pollution aerosol over North America: Organic components and their influence on spectral optical properties and humidification response, J. Geophys. Res.-Atmos., 112, D12S18, https://doi.org/10.1029/2006JD007777, 2007.
Collaud Coen, M., Weingartner, E., Schaub, D., Hueglin, C., Corrigan, C., Henning, S., Schwikowski, M., and Baltensperger, U.: Saharan dust events at the Jungfraujoch: detection by wavelength dependence of the single scattering albedo and first climatology analysis, Atmos. Chem. Phys., 4, 2465–2480, https://doi.org/10.5194/acp-4-2465-2004, 2004.
Collaud Coen, M., Weingartner, E., Apituley, A., Ceburnis, D., Fierz-Schmidhauser, R., Flentje, H., Henzing, J. S., Jennings, S. G., Moerman, M., Petzold, A., Schmid, O., and Baltensperger, U.: Minimizing light absorption measurement artifacts of the Aethalometer: evaluation of five correction algorithms, Atmos. Meas. Tech., 3, 457–474, https://doi.org/10.5194/amt-3-457-2010, 2010.
Drinovec, L., Močnik, G., Zotter, P., Prévôt, A. S. H., Ruckstuhl, C., Coz, E., Rupakheti, M., Sciare, J., Müller, T., Wiedensohler, A., and Hansen, A. D. A.: The ”dual-spot” Aethalometer: an improved measurement of aerosol black carbon with real-time loading compensation, Atmos. Meas. Tech., 8, 1965–1979, https://doi.org/10.5194/amt-8-1965-2015, 2015.
Dubovik, O., Smirnov, A., Holben, B. N., King, M. D., Kaufman, Y. J., Eck, T. F. and Slutsker, I.: Accuracy assessments of aerosol optical properties retrieved from Aerosol Robotic Network (AERONET) Sun and sky radiance measurements, J. Geophys. Res., 105, 9791–9806, https://doi.org/10.1029/2000JD900040, 2000.
Dubovik, O., Holben, B., Eck, T. F., Smirnov, A., Kaufman, Y. J., King, M. D., Tanre, D., and Slutsker, I.: Variability of absorption and optical properties of key aerosol types observed in worldwide locations, J. Atmos. Sci., 59, 590–608, 2002.
Ealo, M., Alastuey, A., Ripoll, A., Pérez, N., Minguillón, M. C., Querol, X., and Pandolfi, M.: Detection of Saharan dust and biomass burning events using near-real-time intensive aerosol optical properties in the north-western Mediterranean, Atmos. Chem. Phys., 16, 12567–12586, https://doi.org/10.5194/acp-16-12567-2016, 2016.
Ecotech: Aurora 3000 User manual 1.3, available at: https://www.psi.ch/sites/default/files/import/lac/ProjectAddonCatcosOperationsEN/MAN_0058_Aurora_3000_User_Manual_1.3.pdf (last access: 2 December 2019), November 2009.
Giglio, L., Randerson, J. T., and van der Werf, G. R.: Analysis of daily, monthly, and annual burned area using the fourth-generation global fire emissions database (GFED4), J. Geophys. Res.-Biogeo., 118, 317–328, 2013.
Hamburger, T., Matisāns, M., Tunved, P., Ström, J., Calderon, S., Hoffmann, P., Hochschild, G., Gross, J., Schmeissner, T., Wiedensohler, A., and Krejci, R.: Long-term in situ observations of biomass burning aerosol at a high altitude station in Venezuela – sources, impacts and interannual variability, Atmos. Chem. Phys., 13, 9837–9853, https://doi.org/10.5194/acp-13-9837-2013, 2013.
Hansen, A. D. A., Rosen, H., and Novakov, T.: Real-time measurement of the aerosol absoprtion-coefficient of aerosol particles, Appl. Opt., 21, 3060–3062, https://doi.org/10.1364/AO.21.003060, 1982.
Hansen, J., Sato, M., and Ruedy, R.: Radiative forcing and climate response, J. Geophys. Res., 102, 6831–6864, 1997.
Husar, R. B., Husar, J. D., and Martin, L.: Distribution of continental surface aerosol extinction based on visual range data, Atmos. Environ., 34, 5067–5078, https://doi.org/10.1016/S1352-2310(00)00324-1, 2000.
Krejci, R., Ström, J., de Reus, M., Hoor, P., Williams, J., Fischer, H., and Hansson, H.-C.: Evolution of aerosol properties over the rain forest in Surinam, South America, observed from aircraft during the LBA-CLAIRE 98 experiment, J. Geophys. Res.-Atmos., 108, 4561, https://doi.org/10.1029/2001JD001375, 2003.
Kuniyal, J. C. and Guleria, R.: The current state of aerosol-radiation interactions: A mini review, J. Aerosol Sci., 130, 45–54, https://doi.org/10.1016/j.jaerosci.2018.12.010, 2018.
Liousse, C., Cachier, H., and Jennings, S. G.: Optical and thermal measurements of black carbon aerosol content in different environments: Variation of the specific attenuation cross-section, sigma (σ), Atmos. Environ. A. Gen. Top., 27, 1203–1211, 1993.
Marenco, F., Johnson, B., Langridge, J. M., Mulcahy, J., Benedetti, A., Remy, S., Jones, L., Szpek, K., Haywood, J., Longo, K., and Artaxo, P.: On the vertical distribution of smoke in the Amazonian atmosphere during the dry season, Atmos. Chem. Phys., 16, 2155–2174, https://doi.org/10.5194/acp-16-2155-2016, 2016.
Martin, S. T., Andreae, M. O., Artaxo, P., Baumgardner, D., Chen, Q., Goldstein, A. H., Guenther, A., Heald, C. L., Mayol-Bracero, O. L., McMurry, P. H., Pauliquevis, T., Pöschl, U., Prather, K. A., Roberts, G. C., Saleska, S. R., Silva Dias, M. A., Spracklen, D. V., Swietlicki, E., and Trebs, I.: Sources and properties of Amazonian aerosol particles, Rev. Geophys., 48, RG2002, https://doi.org/10.1029/2008RG000280, 2010.
Mitchell, A. E.: A comparison of short-term dispersion estimates resulting from various atmospheric stability classification methods, Atmos. Environ., 16, 765–773, https://doi.org/10.1016/0004-6981(82)90394-8, 1982.
Moosmüller, H. and Chakrabarty, R. K.: Technical Note: Simple analytical relationships between Ångström coefficients of aerosol extinction, scattering, absorption, and single scattering albedo, Atmos. Chem. Phys., 11, 10677–10680, https://doi.org/10.5194/acp-11-10677-2011, 2011.
Müller, T., Henzing, J. S., de Leeuw, G., Wiedensohler, A., Alastuey, A., Angelov, H., Bizjak, M., Collaud Coen, M., Engström, J. E., Gruening, C., Hillamo, R., Hoffer, A., Imre, K., Ivanow, P., Jennings, G., Sun, J. Y., Kalivitis, N., Karlsson, H., Komppula, M., Laj, P., Li, S.-M., Lunder, C., Marinoni, A., Martins dos Santos, S., Moerman, M., Nowak, A., Ogren, J. A., Petzold, A., Pichon, J. M., Rodriquez, S., Sharma, S., Sheridan, P. J., Teinilä, K., Tuch, T., Viana, M., Virkkula, A., Weingartner, E., Wilhelm, R., and Wang, Y. Q.: Characterization and intercomparison of aerosol absorption photometers: result of two intercomparison workshops, Atmos. Meas. Tech., 4, 245–268, https://doi.org/10.5194/amt-4-245-2011, 2011a.
Müller, T., Laborde, M., Kassell, G., and Wiedensohler, A.: Design and performance of a three-wavelength LED-based total scatter and backscatter integrating nephelometer, Atmos. Meas. Tech., 4, 1291–1303, https://doi.org/10.5194/amt-4-1291-2011, 2011b.
Myhre, G., Samset, B. H., Schulz, M., Balkanski, Y., Bauer, S., Berntsen, T. K., Bian, H., Bellouin, N., Chin, M., Diehl, T., Easter, R. C., Feichter, J., Ghan, S. J., Hauglustaine, D., Iversen, T., Kinne, S., Kirkevåg, A., Lamarque, J.-F., Lin, G., Liu, X., Lund, M. T., Luo, G., Ma, X., van Noije, T., Penner, J. E., Rasch, P. J., Ruiz, A., Seland, Ø., Skeie, R. B., Stier, P., Takemura, T., Tsigaridis, K., Wang, P., Wang, Z., Xu, L., Yu, H., Yu, F., Yoon, J.-H., Zhang, K., Zhang, H., and Zhou, C.: Radiative forcing of the direct aerosol effect from AeroCom Phase II simulations, Atmos. Chem. Phys., 13, 1853–1877, https://doi.org/10.5194/acp-13-1853-2013, 2013.
Petzold, A. and Schönlinner, M.: Multi-angle absorption photometry–a new method for the measurement of aerosol light absorption and atmospheric black carbon, J. Aerosol Sci., 35, 421–441, https://doi.org/10.1016/j.jaerosci.2003.09.005, 2004.
Reid, J. S., Hobbs, P. V., Ferek, R. J., Blake, D. R., Martins, J. V., Dunlap, M. R., and Liousse, C.: Physical, chemical, and optical properties of regional hazes dominated by smoke in Brazil, J. Geophys. Res.-Atmos., 103, 32059–32080, https://doi.org/10.1029/98JD00458, 1998.
Reid, J. S., Eck, T. F., Christopher, S. A., Koppmann, R., Dubovik, O., Eleuterio, D. P., Holben, B. N., Reid, E. A., and Zhang, J.: A review of biomass burning emissions part III: intensive optical properties of biomass burning particles, Atmos. Chem. Phys., 5, 827–849, https://doi.org/10.5194/acp-5-827-2005, 2005.
Rose, C., Sellegri, K., Velarde, F., Moreno, I., Ramonet, M., Weinhold, K., Krejci, R., Ginot, P., Andrade, M., and Wiedensohler, A.: Frequent nucleation events at the high altitude station of Chacaltaya (5240 m a.s.l.), Bolivia, Atmos. Environ., 102, 18–29, 2015.
Rose, C., Sellegri, K., Moreno, I., Velarde, F., Ramonet, M., Weinhold, K., Krejci, R., Andrade, M., Wiedensohler, A., Ginot, P., and Laj, P.: CCN production by new particle formation in the free troposphere, Atmos. Chem. Phys., 17, 1529–1541, https://doi.org/10.5194/acp-17-1529-2017, 2017.
Russell, P. B., Bergstrom, R. W., Shinozuka, Y., Clarke, A. D., DeCarlo, P. F., Jimenez, J. L., Livingston, J. M., Redemann, J., Dubovik, O., and Strawa, A.: Absorption Angstrom Exponent in AERONET and related data as an indicator of aerosol composition, Atmos. Chem. Phys., 10, 1155–1169, https://doi.org/10.5194/acp-10-1155-2010, 2010.
Saturno, J., Pöhlker, C., Massabò, D., Brito, J., Carbone, S., Cheng, Y., Chi, X., Ditas, F., Hrabě de Angelis, I., Morán-Zuloaga, D., Pöhlker, M. L., Rizzo, L. V., Walter, D., Wang, Q., Artaxo, P., Prati, P., and Andreae, M. O.: Comparison of different Aethalometer correction schemes and a reference multi-wavelength absorption technique for ambient aerosol data, Atmos. Meas. Tech., 10, 2837–2850, https://doi.org/10.5194/amt-10-2837-2017, 2017.
Schafer, J. S., Eck, T. F., Holben, B. N., Artaxo, P., and Duarte, A. F.: Characterization of the optical properties of atmospheric aerosols in Amazônia from long-term AERONET monitoring (1993–1995 and 1999–2006), J. Geophys. Res.-Atmos., 113, https://doi.org/10.1029/2007JD009319, 2008.
Stein, A. F., Draxler, R. R., Rolph, G. D., Stunder, B. J. B., Cohen, M. D., and Ngan, F.: NOAA's HYSPLIT atmospheric transport and dispersion modeling system, B. Am. Meteor. Soc., 96, 2059–2077, https://doi.org/10.1175/BAMS-D-14-00110.1, 2015.
Weingartner, E., Saathoff, H., Schnaiter, M., Streit, N., Bitnar, B., and Baltensperger, U.: Absorption of light by soot particles: determination of the absorption coefficient by means of aethalometers, J. Aerosol Sci., 34, 1445–1463, https://doi.org/10.1016/S0021-8502(03)00359-8, 2003.
Whiteman, C. D.: Mountain meteorology: fundamentals and applications, Oxford University Press, Oxford, 2000.
Wiedensohler, A., Andrade, M., Weinhold, K., Müller, T., Birmili, W., Velarde, F., Moreno, I., Forno, R., Sanchez, M. F., and Laj, P.: Black carbon emission and transport mechanisms to the free troposphere at the La Paz/El Alto (Bolivia) metropolitan area based on the Day of Census (2012), Atmos. Environ., 194, 158–169, 2018.