the Creative Commons Attribution 4.0 License.
the Creative Commons Attribution 4.0 License.
 | 29 Nov 2019
Significant climate impacts of aerosol changes driven by growth in energy use and advances in emission control technology
Massimo A. Bollasina
Monica Crippa
David S. Stevenson
Anthropogenic aerosols have increased significantly since the industrial revolution, driven largely by growth in emissions from energy use in sectors including power generation, industry, and transport. Advances in emission control technologies since around 1970, however, have partially counteracted emissions increases from the above sectors. Using the fully coupled Community Earth System Model, we quantify the effective radiative forcing (ERF) and climate response to 1970–2010 aerosol changes associated with the above two policy-relevant emission drivers. Emissions from energy-use growth generate a global mean aerosol ERF (mean ± 1 standard deviation) of W m−2 and result in a global mean cooling ( K) and a precipitation reduction ( mm d−1). By contrast, the avoided emissions from advances in emission control technology, which benefit air quality, generate a global mean ERF of W m−2, a global warming of K, and global mean precipitation increase of mm d−1. Despite the relatively small changes in global mean precipitation, these two emission drivers have profound impacts at regional scales, in particular over Asia and Europe. The total net aerosol impacts on climate are dominated by energy-use growth, from Asia in particular. However, technology advances outweigh energy-use growth over Europe and North America. Various non-linear processes are involved along the pathway from aerosol and their precursor emissions to radiative forcing and ultimately to climate responses, suggesting that the diagnosed aerosol forcing and effects must be interpreted in the context of experiment designs. Further, the temperature response per unit aerosol ERF varies significantly across many factors, including location and magnitude of emission changes, implying that ERF, and the related metrics, needs to be used very carefully for aerosols. Future aerosol-related emission pathways have large temporal and spatial uncertainties; our findings provide useful information for both assessing and interpreting such uncertainties, and they may help inform future climate change impact reduction strategies.
- Article
(12543 KB) - Full-text XML
-
Supplement
(7214 KB) - BibTeX
- EndNote


Climate change is driven by changes in a combination of natural and anthropogenic factors (Stocker et al., 2013). The increasing atmospheric abundance of greenhouse gases (GHGs) associated with human activities has long been recognized as the major driver of global warming since the industrial revolution. Anthropogenic emissions of aerosols and their precursor gases have also led to significant climate impacts (Boucher et al., 2013), in addition to their detrimental impacts on atmospheric visibility, human health, and ecosystems. Aerosols can influence climate by absorbing or scattering shortwave radiation (aerosol–radiation interactions; Haywood and Ramaswamy, 1998) and by modifying cloud microphysics and precipitation processes (aerosol–cloud interactions; Fan et al., 2016). Overall, anthropogenic aerosols cause a net cooling of the Earth; almost a third of the warming from increases in GHGs is thought to have been counteracted by cooling due to increased anthropogenic aerosols since the 1950s (Stocker et al., 2013). Yet, despite extensive research in the last decade that has led to significant progress in our understanding of the effects of aerosols (Ming and Ramaswamy, 2009, 2011; Shindell and Faluvegi, 2009; Allen and Sherwood, 2011; Bollasina et al., 2011; Ming et al., 2011; Boucher et al., 2013; Hwang et al., 2013; Wilcox et al., 2013; Xie et al., 2013; Shindell, 2014; Wang et al., 2015), there are still major uncertainties associated with their impacts on climate (Carslaw et al., 2013a; Fan et al., 2016; Lee et al., 2016; Fletcher et al., 2018).
In fact, aerosol forcing remains the dominant uncertainty in current estimates of radiative forcing on climate since pre-industrial times (Myhre et al., 2013). This is because of compounding uncertainties associated with the large spatial and temporal variability of aerosols, their short lifetimes, their diverse physical and chemical properties, and complex interactions with radiation and microphysical processes (Boucher et al., 2013; Carslaw et al., 2013b; Fan et al., 2016). For example, the sign and magnitude of the effect of aerosols on clouds and the intertwined effects on precipitation can vary substantially depending on emission locations, aerosol species, and meteorological conditions (Rosenfeld et al., 2008; Stevens and Feingold, 2009; Yu et al., 2014; Malavelle et al., 2017; Kasoar et al., 2018). Also, there are large uncertainties due to the incomplete knowledge of both historical aerosol changes and how they will evolve in the future (Gidden et al., 2018). All these uncertainties make it challenging to project future climate and to quantify the associated impacts on a range of sectors. More importantly, despite ongoing debates as to whether aerosol has larger impacts on mean climate and climate extremes compared to GHGs (Feichter et al., 2004; Xie et al., 2013; Wilcox et al., 2019), a large body of studies indicate that, per unit of forcing or warming, aerosols have significantly larger impacts than GHGs on both global mean climate (Hansen et al., 2005; Shindell, 2014; Shindell et al., 2015) and global or regional climate extremes (Perkins, 2015; Xu et al., 2015; Lin et al., 2016; Wang et al., 2016; Samset et al., 2018a; Zhao et al., 2018, 2019a).
Emissions of anthropogenic aerosols (and their precursors) have followed opposite trends between developed (decreases) and developing (increases) countries during the past few decades. For example, emissions of SO2 from Asia increased steadily since the 1950s, while emissions from Europe and North America started to decline after the 1970s (Smith et al., 2011; Wang et al., 2015; Crippa et al., 2016). The decline of air pollutant emissions in Europe and North America dates back to around 1970 when the first air quality directives were implemented at the continental scale (Crippa et al., 2016). By comparison, only after about 2010 have some developing countries started to take mitigation measures. For example, Chinese SO2 emissions have shown a noticeable decline since around 2012 (Silver et al., 2018; Zheng et al., 2018). As a result, India has recently overtaken China as the largest present-day emitter of SO2 (Li et al., 2017). Anthropogenic aerosol-related emissions are expected to be further significantly reduced worldwide during the 21st century (Markandya et al., 2018). Aerosol mitigation, however, may lead to adverse climate impacts, such as the increased risk of climate extremes (Kloster et al., 2010; Samset et al., 2018a; Zhao et al., 2018, 2019a). A number of equally plausible future emission pathways have been designed to seek a compromise between the impacts of air pollution on environment and climate following aerosol abatement in the near-, medium-, and long-term (Gidden et al., 2018). The uncertainty in the emission pathway alone represents a key limiting factor to a robust quantification and isolation of the overall aerosol impact on climate. Yet, possible differences in the climate response to varying aerosols and their precursor emission trajectories, all the other forcings being the same, have been mostly overlooked so far (e.g. Sillmann et al., 2013; Pendergrass et al., 2015; Bartlett et al., 2016). This, nevertheless, is useful for partially assessing the uncertainty range of future climate projections related to uncertainties in aerosol-related emission pathways alone, despite the fact that emissions of GHGs also differ between those emission pathways.
Emission changes described above are primarily associated with three important and largely regulated sectors (industry, power generation, and transport), while the residual contribution to emissions from residential and agricultural sectors is relatively stationary in time (Crippa et al., 2016; Hoesly et al., 2018). Also, such changes originate primarily from two competing emission drivers: economic growth and policy-driven emission controls (Crippa et al., 2016). The former is associated with energy-use growth within the three sectors described above, while the latter include both air pollution abatement measures and technology advances (hereinafter technology advances for short). To quantify the impacts of these factors, Crippa et al. (2016) developed the Emission Database for Global Atmospheric Research (EDGAR) retrospective air pollution emission scenarios for the period 1970–2010 (Sect. 2.1). Using a chemistry–climate model, Turnock et al. (2016) reported that the avoided aerosol-related emissions due to legislation and technology measures have improved air quality and human health over Europe, but they have also led to a regional warming of up to 0.45±0.11 ∘C.
As discussed above, energy-use growth and technology advances are two of the major policy-relevant drivers of past aerosol changes via, for example, changes in power generation, industry, and transport. These drivers are very likely to continue to play important but competing roles in modulating future emissions of aerosols and their precursor gases, as we gradually transit to a new energy structure. An analysis of the climate impact to recent changes in the two above emission drivers is therefore critically important for future aerosol-related climate projections and climate change impact reduction strategies. Here we perform time-slice model simulations using the fully coupled Community Earth System Model (CESM1), seeking to quantify the climate forcing and impacts of aerosol changes related to the above policy-relevant emission drivers (energy-use growth and technology advances) at both global and regional scales. The aerosol scenarios used here represent the best estimate of past emissions. Therefore, compared to idealized experiments where aerosol emissions/concentrations are scaled rather arbitrarily, the implications of this work can be more informative for future decision-making. The EDGAR scenarios, CESM1 model overview, and experiment design, as well as analysis methods, are introduced in Sect. 2; Sect. 3 presents the results followed by a discussion in Sect. 4 and a summary in Sect. 5.
2.1 The EDGAR retrospective air pollution scenarios
Based on the EDGAR v4.3.1 best estimate for 1970 and 2010 (REF2010), the EDGAR retrospective emission scenarios were designed to quantify the effectiveness of 1970–2010 changes in energy use and efficiency, technology progress, and end-of-pipe emission reduction measures (Crippa et al., 2016). For the 1970–2010 changes in emissions of each individual aerosol or precursor species, please refer to Fig. S1 in the Supplement, as well as Crippa et al. (2016) for more details. These retrospective scenarios focus on sectors including power generation, industry, and transport (the most regulated sectors), whereas emissions from all other sectors are the same as those in REF2010. The highest emission scenario (STAG_TECH, Table 1) assumes no further improvements in technology and abatement measures after 1970 but with energy use and different fuel mix as in REF2010. The second and lowest emission scenario (STAG_ENE) assumes stagnation of energy consumption since 1970, while fuel mix, energy efficiency, emission factors, and abatements are the same as REF2010. Therefore, the difference between REF2010 and STAG_TECH represents the 2010–1970 emission reductions due to technology advances. Similarly, the difference between REF2010 and STAG_ENE represents the 2010–1970 emission increase due to energy-use growth. Note carefully that the retrospective emission scenarios were deliberately designed to have emission changes from these two competing drivers that do not add up to those of the total 1970–2010 changes, for the aim of quantifying the associated impacts from a “what-if” perspective. For example, what would be expected when assuming that we had not introduced any emission control technologies since the 1970s? For more details regarding the non-linearity associated with the retrospective emission scenarios, please refer to Crippa et al. (2016).
Table 1Overview of the fully coupled (Fcpd) and the paired simulation (Fsst) where sea surface temperature and sea ice are fixed. They are the baseline 2010 (B10) simulation, fixing aerosol-related emissions in 1970 levels (SAA), stagnation of anthropogenic aerosol-related emissions from energy use in 1970 levels (SEN), and stagnation of aerosol-related emissions related to technology and abatement measures in 1970 levels (STC). All Fcpd simulations are run until equilibrium (numbers in brackets denote the lengths of model integrations in years), while all Fsst runs are integrated for 40 years. Only the last 30 years of each Fcpd∕Fsst run is used for analysis. Note the difference in the integration lengths of Fcpd simulations, which is determined on the criterion that the top-of-the-atmosphere radiation imbalance no longer shows significant trends (stabilizing at around ∼0.3 W m−2 in this case) during the last few decades of each run (see the main text). The responses to the 1970–2010 anthropogenic aerosol-related emissions are given as the following: Best Estimate = B10–SAA; energy-use growth = B10–SEN; and technology advances = B10–STC.

2.2 Model and experiment design
We carry out time-slice simulations (Table 1) using the fully coupled Community Earth System Model (CESM1; Hurrell et al., 2013) at the nominal 1∘ resolution. The motivation for carrying out time-slice model simulation for this particular period has been justified in Zhao et al. (2019b). A few of the post-processed model output fields are freely accessible through Zhao et al. (2019c). The atmospheric component of CESM1 is the Community Atmosphere Model 5 (CAM5) in which surface concentrations of CO2 and CH4 are prescribed with seasonal cycles and latitude gradients (Conley et al., 2012). CAM5 includes a three-mode (Aitken, accumulation, and coarse) aerosol scheme (Modal Aerosol Mode 3; MAM3). Several aerosol species (sulfate, organic carbon (OC), black carbon (BC), sea salt, and dust) are simulated and their number concentration and mass are prognostically calculated for each aerosol mode. Simple gas-phase chemistry is included for sulfate species: SO2 is converted into SO4 through both gas-phase OH oxidation and aqueous-phase oxidation by H2O2 and O3 (Liu et al., 2015, 2016; Tilmes et al., 2015). Note that CESM1 (CAM5) has a relatively larger aerosol forcing compared to other Coupled Model Intercomparison Project Phase 5 (CMIP5) models, likely due to the large cloud adjustments through cloud water path in MAM3 (Allen and Ajoku, 2016; Malavelle et al., 2017; Zhou and Penner, 2017). In light of this and considering the overall uncertainties in the representation of aerosol effects, we underscore that all results and discussions below should be interpreted in the context of CESM1-CAM5.
Long-lived GHGs, natural aerosols, and other reactive gas emissions and concentrations are obtained from Lamarque et al. (2011) for 2010. Ozone concentrations for 2010 are from the Whole Atmosphere Community Climate Model (WACCM) simulations (Marsh et al., 2013). Anthropogenic aerosols and their precursor emissions are from the EDGAR retrospective scenarios (Sect. 2.1). The EDGAR emission sectors are remapped to conform to CAM5 emissions following Lamarque et al. (2010).
The baseline 2010 experiment (B10) was initialized using the year 2010 model dump from one ensemble member (no. 34) of the CESM1 large ensemble (Kay et al., 2015) transient historical experiment, and it was driven by the 2010 all forcing factors (Table 1). Also, we have three perturbation experiments where anthropogenic aerosols are perturbed using different emission scenarios (i.e. the 1970 best estimate, STAG_ENE and STAG_TECH as described in Sect. 2.1), while all others forcing agents (e.g. GHGs, natural aerosols, land use, solar forcing) are the same as in the B10 run, in order to differentiate the impacts of the two emission drivers (refer to Table 1 for more details). For each case, we have a paired set of simulations: one with sea surface temperature and sea ice fixed (hereinafter Fsst) and the other with a fully coupled ocean (Fcpd). All Fcpd simulations were integrated until equilibrium (i.e. where the surface climate system equilibrates to imposed perturbations; NB the deep ocean may take longer to equilibrate) after the initial perturbation, with repeated annual cycles of the forcings. For example, the baseline B10 simulation was integrated until equilibrium under constant 2010 forcings. Note carefully that the length of each integration is different and is deemed sufficient for analysis once the top-of-the-atmosphere radiation imbalance does not show significant trends any more during the last few decades of each run (stabilizing at values around ∼0.3 W m−2), following recent works (Samset et al., 2016, 2018b; Myhre et al., 2017). We analyse the last 30 years of each equilibrium simulation and show differences between the baseline and perturbed simulations. Specifically, we denote “Best Estimate” as the response to the best estimate of 1970–2010 total net anthropogenic aerosol-related emissions, “energy-use growth” as the response to emissions increases due to growth in energy use, and “technology advances” as the response to avoided emissions from advances in emission control technology. Changes in anthropogenic aerosols and their precursor emissions associated with the two emission drivers are presented in Fig. S1. The statistical significance of the difference between each two (baseline and perturbed) sets of 30-year model runs is estimated by the two-sided Student's t test (p value < 0.05) and accounting for serial autocorrelation by adjusting the degrees of freedom following (Nychka et al., 2000).
The paired Fsst simulation is under the same forcings as the corresponding Fcpd simulation, and both are integrated for 40 years from the initial condition. The last 30 years of each Fsst simulation is used to diagnose the effective radiative forcing (ERF) at the top of the atmosphere (top of the model, in this case ∼3.6 hPa) following Forster et al. (2016). Additionally, we carried out similar Fsst simulations to diagnose the ERFs of the best estimate of 1970–2010 changes in the three major anthropogenic aerosol species (BC, OC, and sulfate species; Fig. S1a–c). For example, we have a perturbation run, Fsst, in which only emissions of sulfate species are changed back to 1970 levels while all other forcings are the same as B10 to diagnose the ERF due to 1970–2010 sulfate aerosol changes.
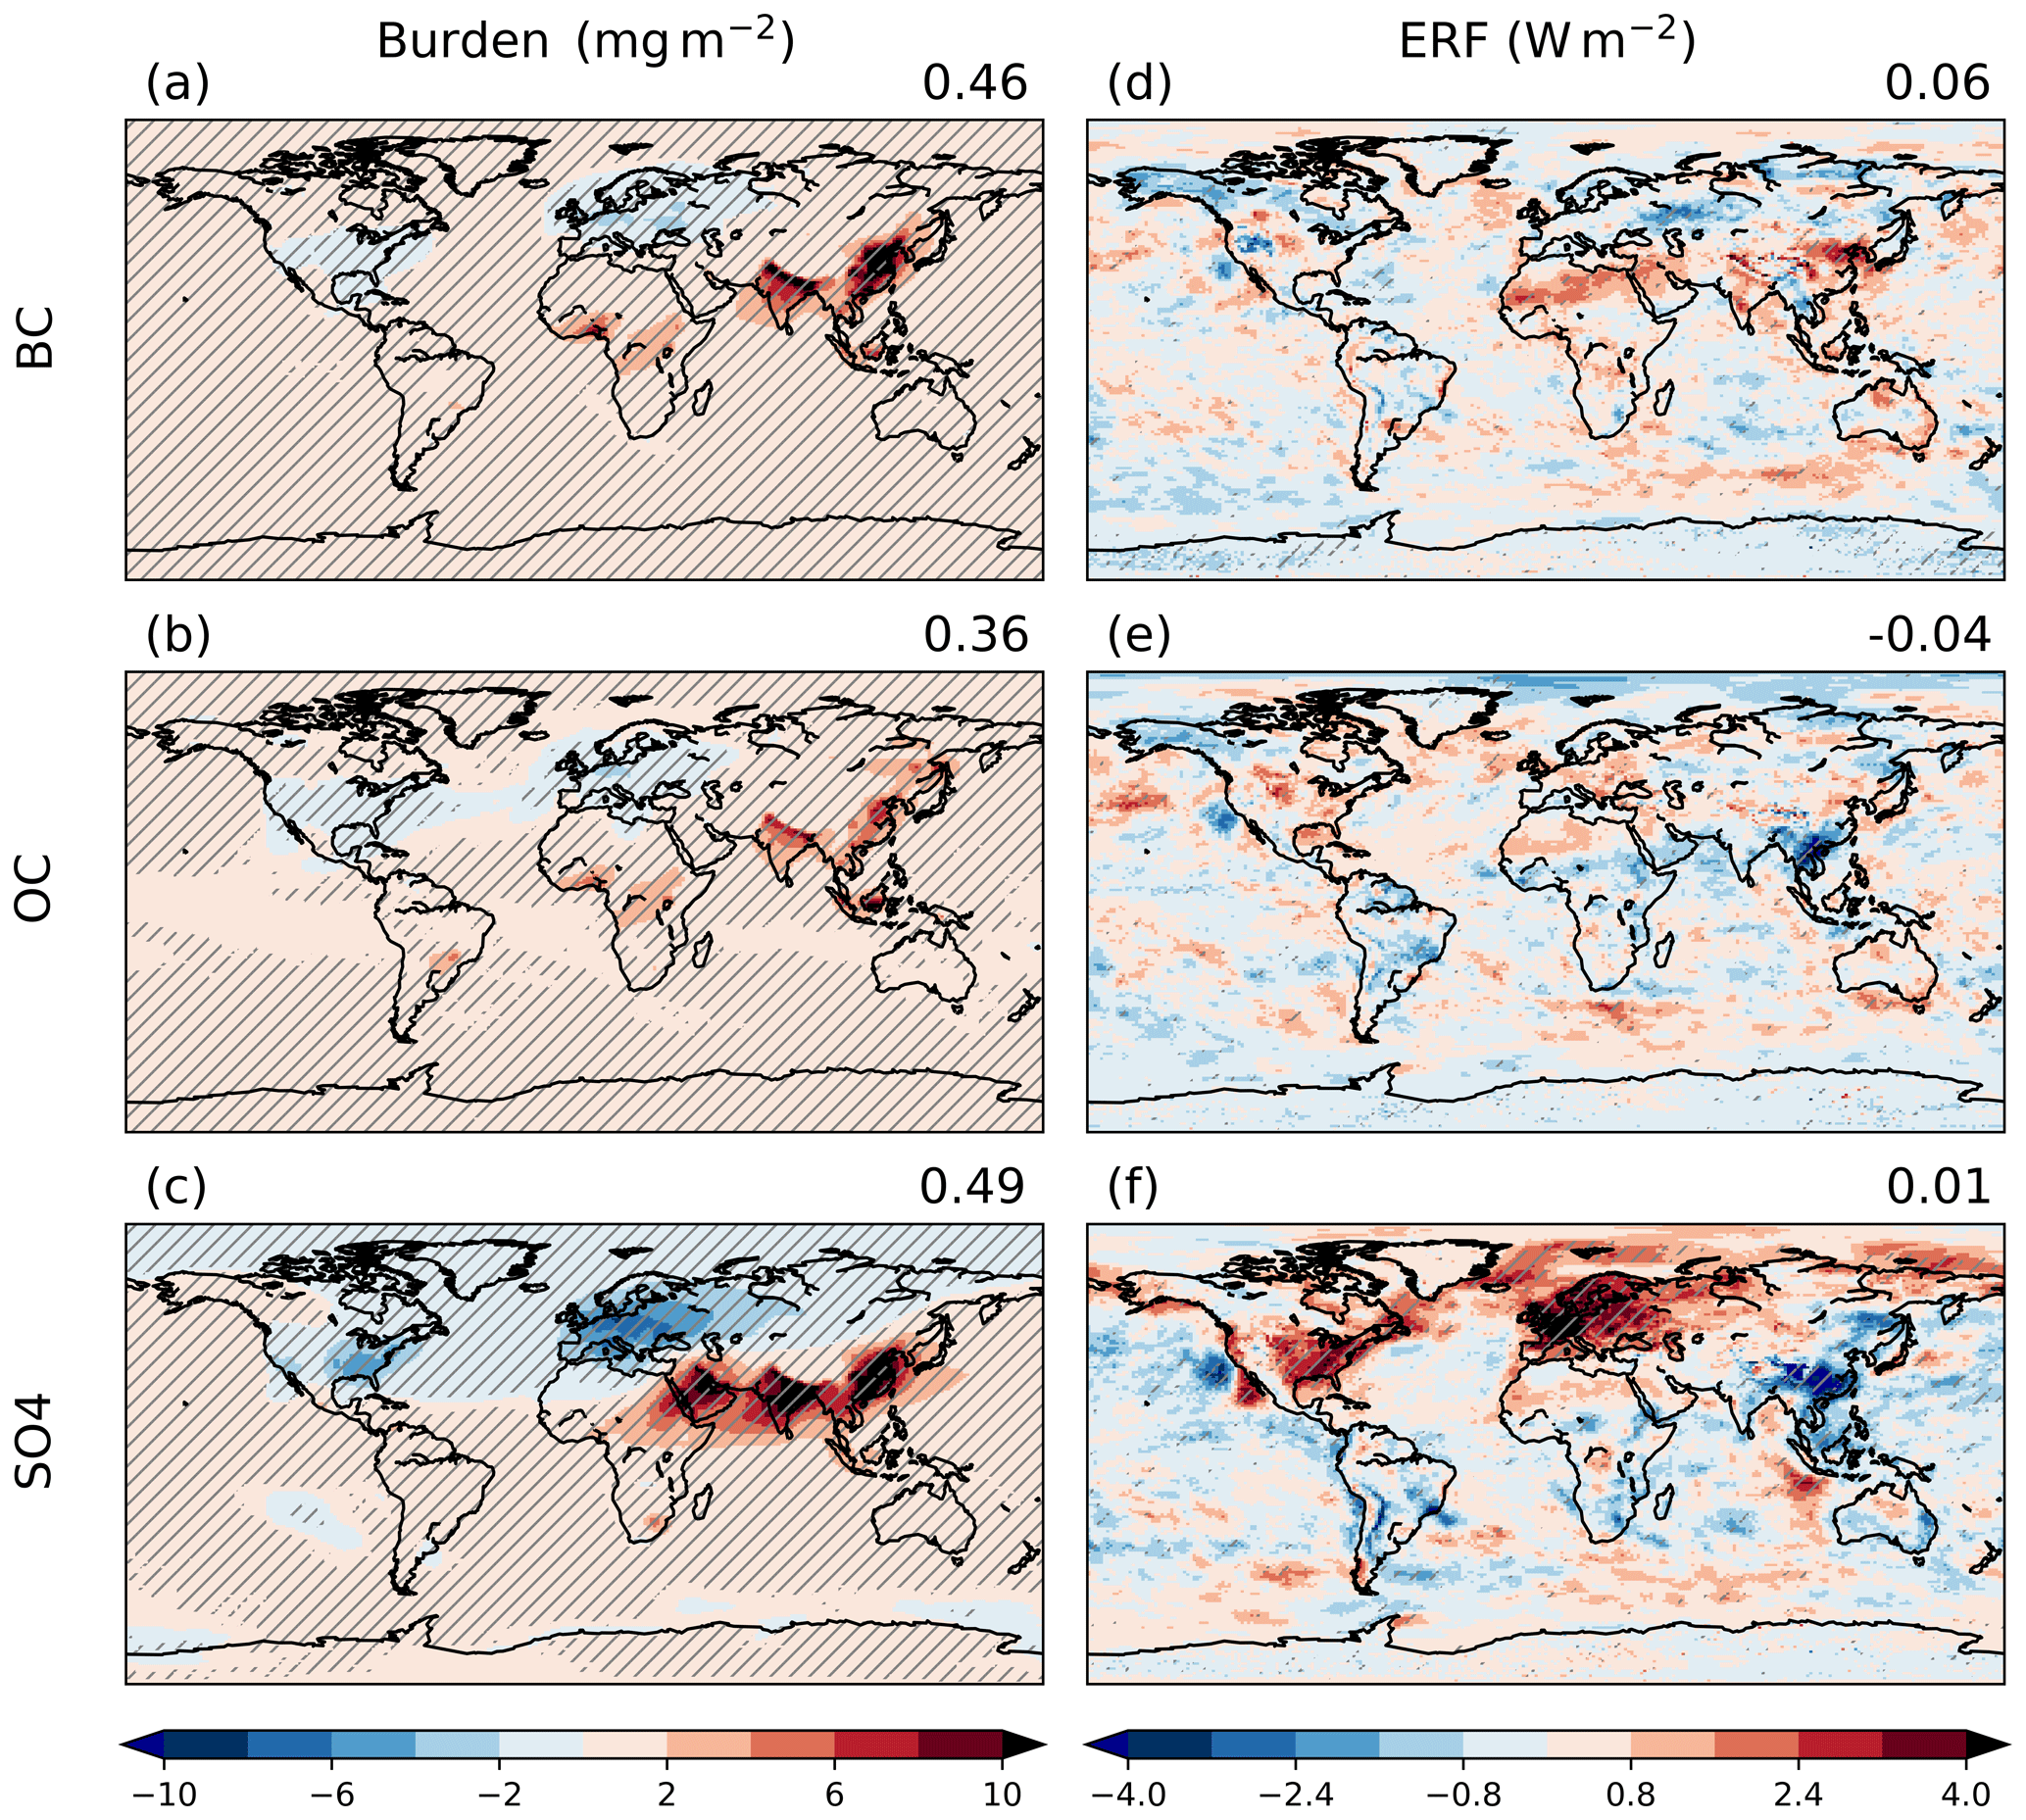
Figure 1Changes in aerosol burdens (mg m−2; a, b, c) and the effective radiative forcing (ERF, W m−2; d, e, f) associated with the best estimate of 1970–2010 changes in emissions of (a, d) black carbon (BC), (b, e) organic carbon (OC), and (e, f) sulfate species (SO4). The numbers on the top right of each panel are the global means. NB the burden of BC (including the global mean value) is multiplied by a factor of 10 for legibility. The statistical significance at the 5 % level is calculated using the two-tailed Student's t test, and these areas are denoted by the grey hatching.
3.1 Effective radiative forcing
Figure 1 shows changes in aerosol burdens and the diagnosed ERF associated with the best estimate of 1970–2010 changes in BC, OC, and sulfate species (Fig. S1a–c). It can be seen that changes in the burdens of all aerosol species are statistically significant almost worldwide, while areas with statistically significant ERFs are very confined. Aerosol burdens display opposite changes between Asia and industrialized regions of Europe and North America. For instance, the burden of SO4 increases by 5.6 mg m−2 in Asia but decreases by −4.0 mg m−2 in Europe. BC changes are shown to generate a global mean positive radiative forcing of +0.06 W m−2; the spatial pattern of BC ERF is positively correlated to that of the burdens, resulting in peak values over Asia and Africa. In contrast to BC, OC changes generate a global mean negative forcing of −0.04 W m−2; note also the general spatial anti-correlation between OC burdens and ERFs. The global mean ERF of sulfate aerosol changes is small and positive because of the partial cancellation between the negative forcing from sulfate aerosol increases over Asia and the pronounced positive forcing from sulfate aerosol reductions over Europe and North America, which is amplified over the Arctic (Fig. 1f). Regional ERF values are dominated by the 1970–2010 changes in sulfate species. It is worth noticing that the individual ERF values of each aerosol species do not add up to that due to the simultaneous changes in all these at the global scale (Fig. 2d). A further discussion on this is provided in Sect. 4.1.
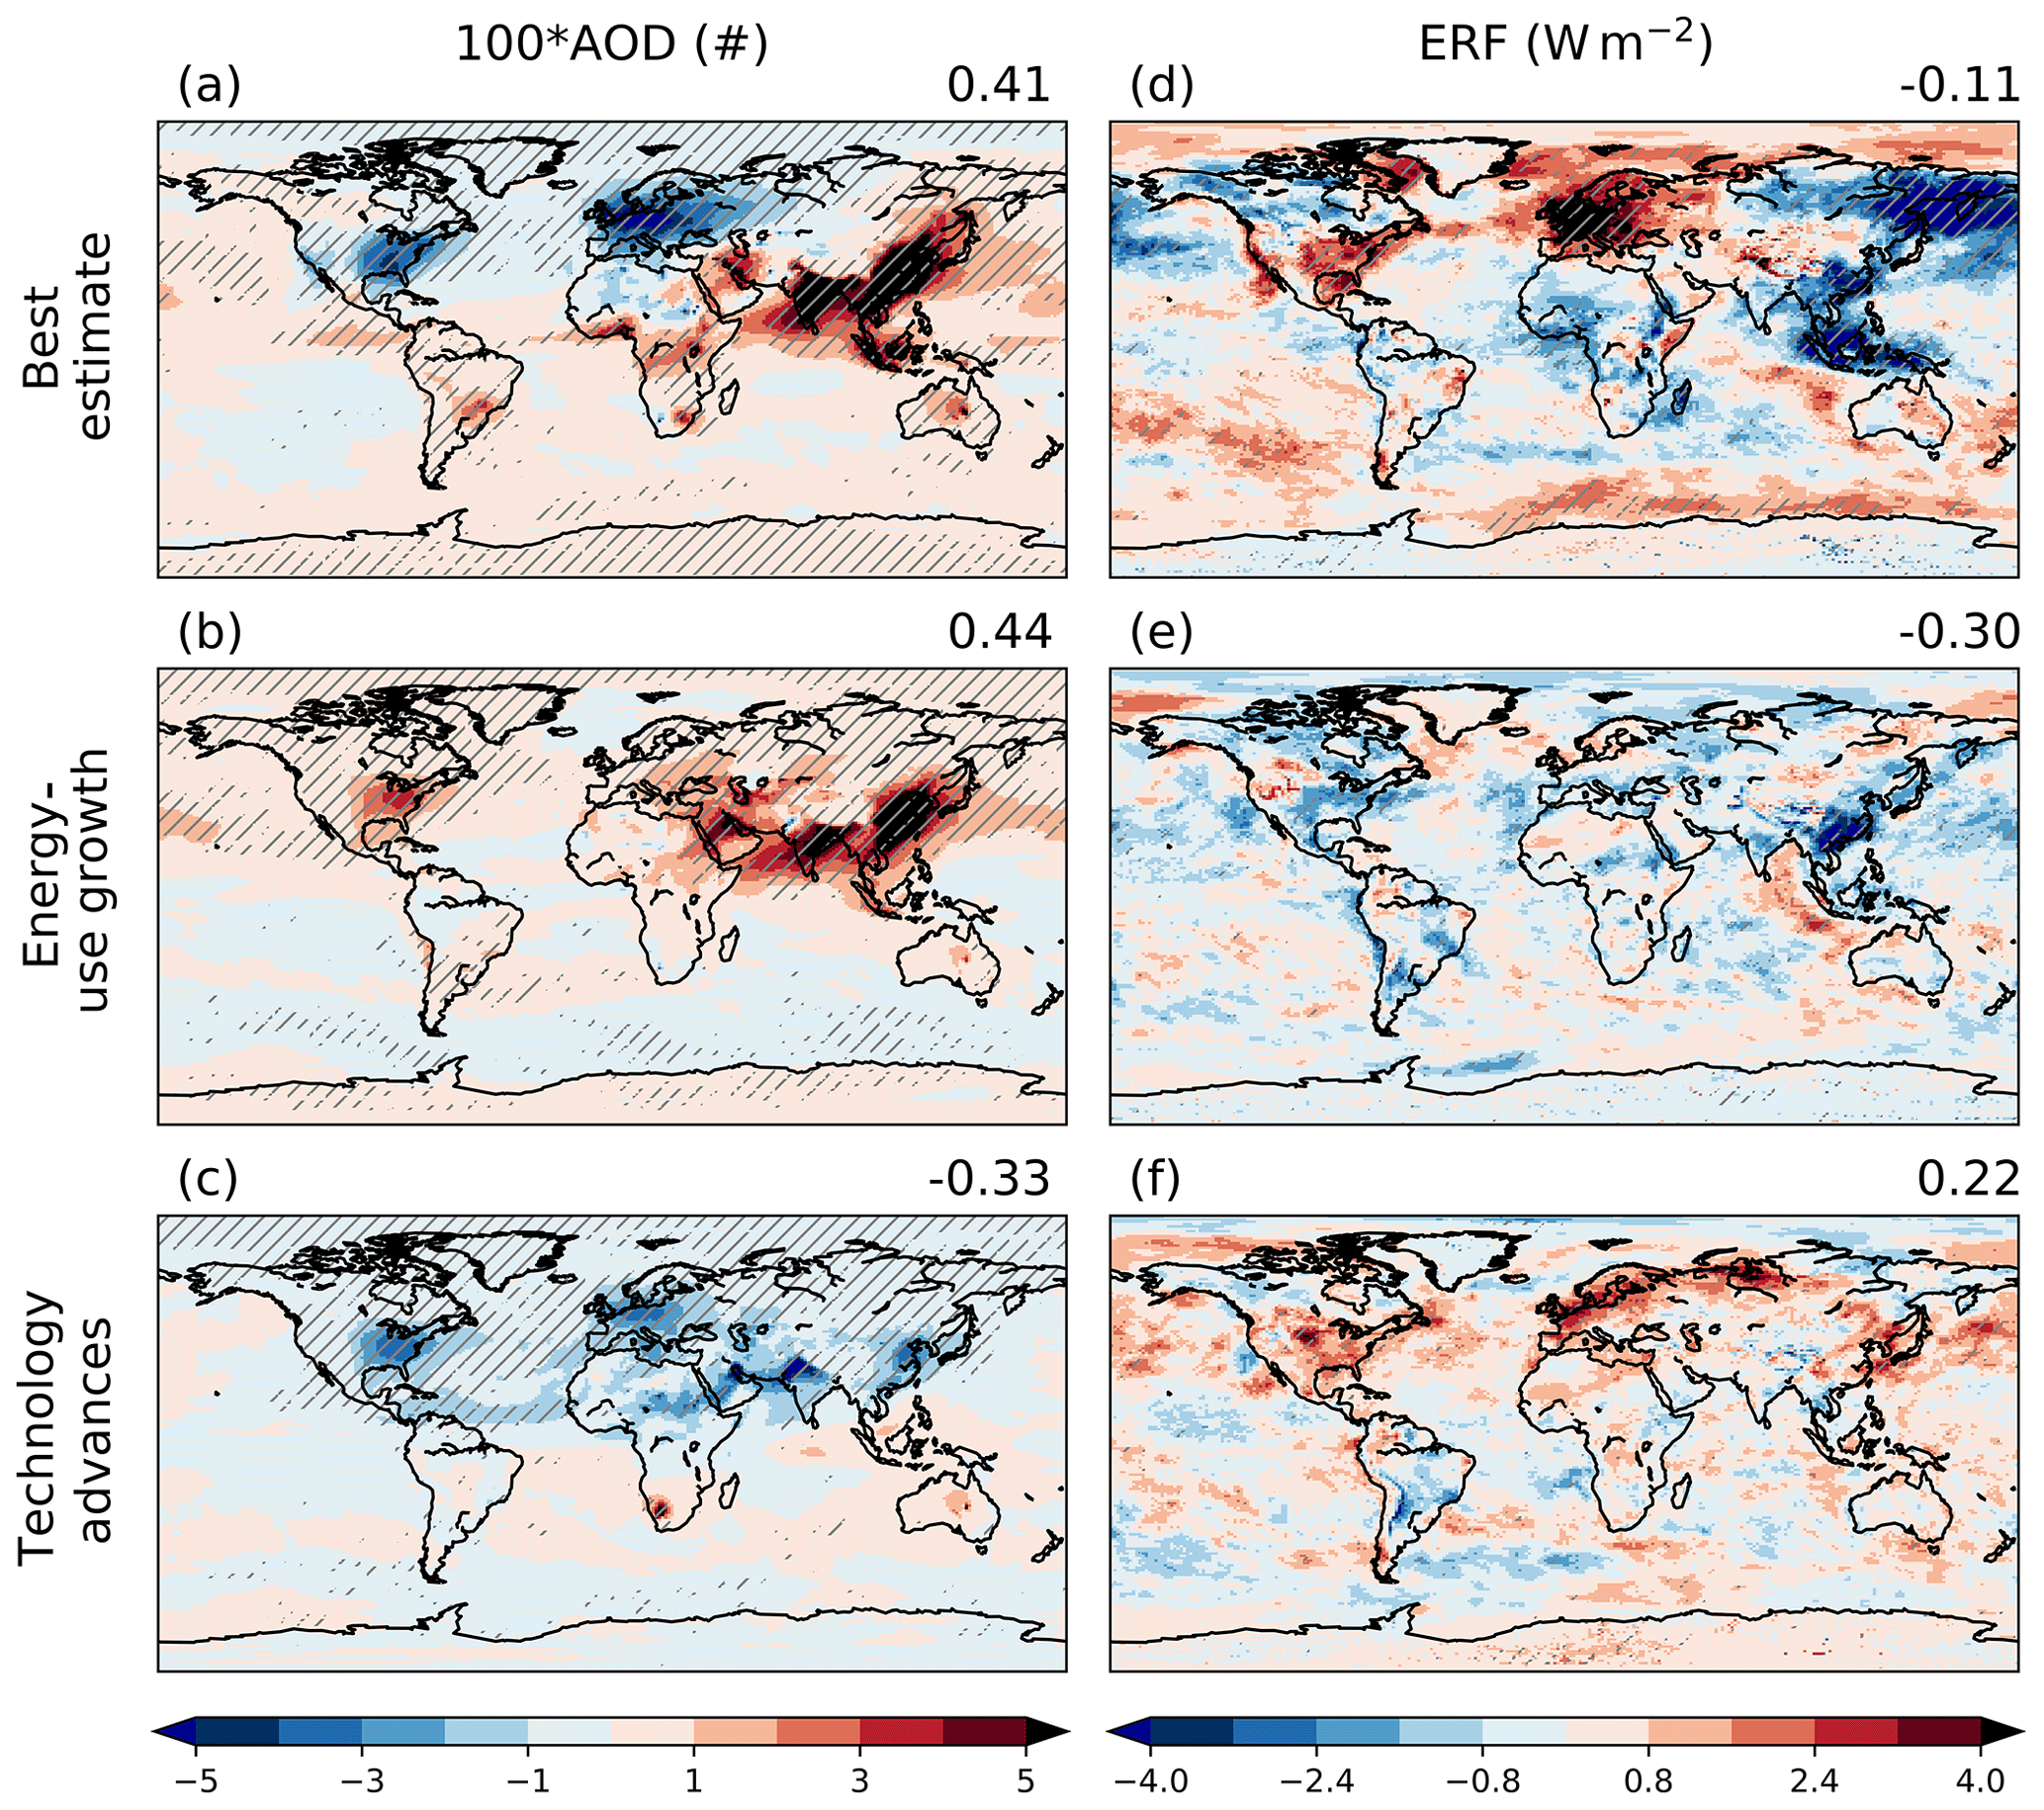
Figure 2Changes in (a–c) 550 nm aerosol optical depth multiplied by a factor of 100 (100 × AOD) and (d–f) the effective radiative forcing (ERF, W m−2) in response to 1970–2010 anthropogenic aerosol emissions changes. They are (a, d) the best estimate of total aerosol emission changes, (b, e) changes due to energy-use growth, and (c, f) changes due to advances in emission control technology. The numbers on the top right of each panel are the global means (NB again the AOD ones are multiplied by a factor of 100). The statistical significance at the 5 % level is calculated using the two-tailed Student's t test, and these areas are denoted by the grey hatching.
The spatial patterns of the changes in the 550 nm aerosol optical depth (AOD) are strongly correlated with those of aerosol burdens (compare Figs. 1a–c to 2a). Therefore, instead of aerosol burdens, we turn to change in the total AOD of all aerosol species for the three scenario experiments where all aerosol species change simultaneously. The total net 1970–2010 AOD changes (Fig. 2a), not surprisingly, display a sharp contrast between Asia (+0.036) and Europe (−0.023) and North America (−0.004). This, as described above, is mainly driven by changes in sulfate aerosols (Fig. 1c). The 1970–2010 aerosol-related emission changes produce a global mean ERF of W m−2, with marked regional values over Europe ( W m−2) and Asia ( W m−2; Fig. 3b). Aerosol changes due to energy-use growth lead AOD to increase almost worldwide (Fig. 2b), resulting in a global mean ERF of W m−2, with the most noticeable negative forcing of W m−2 over Asia followed by W m−2 over North America (Fig. 3b). By contrast, the avoided emissions due to technology advances lead AOD to decrease predominately over the Northern Hemisphere (Fig. 2c) and generate a global mean positive forcing of W m−2 (Fig. 2f). The most noticeable changes are found over Europe ( W m−2) and North America ( W m−2). It is worth noting the AOD increases over southern Africa are due to increases in sea salt and OC, which may be related to the additional warming-induced changes in meteorology in the technology advances experiment.

Figure 3Area-weighted global and regional mean changes in (a) aerosol optical depth (100 × AOD), effective radiative forcing (ERF, W m−2), surface air temperature (SAT, K), and precipitation (Pr, mm d−1). Error bars denote the 25th–75th percentile spread of the model uncertainty. Region definitions are as follows: Arctic (0–360∘ E and 60–0∘ N), Asia (65–145∘ E and 5–45∘ N), Europe (10∘ W–40∘ E and 30–70∘ N), and North America (190–300∘ E and 12–70∘ N). Colour conventions are blue for responses to the best estimate of 1970–2010 anthropogenic aerosol emissions changes, red for responses to aerosol emission changes due to energy-use growth, and green for advances in emission control technology. Note carefully that the AOD values are multiplied by a factor of 100 for legibility.
3.2 Temperature responses
Figure 4 shows the spatial distribution and zonal mean profile of the surface air temperature responses. Also see Fig. 3c for the regional mean values. It can be seen that the majority of statistically significant temperature changes in response to aerosol changes are over the ocean rather than the land. This is particularly true for the energy-use experiment and may reflect the fact that the equilibrium climate response is dominated by the slow response of the ocean. In response to the 1970–2010 aerosol changes, the global mean surface temperature changes by K, while there are confined and weak warming patterns over local regions including eastern Europe and USA (Fig. 4a). The zonal mean temperature changes show significant cooling of the Northern Hemisphere that is amplified over the Arctic ( K), together with a less pronounced cooling in the Southern Hemisphere. The sign of global mean surface temperature change due to 1970–2010 aerosol changes is consistent with that of ERF. Note, however, the inconsistency between regional mean ERFs and temperature responses (e.g. particularly over the Arctic, Europe and, the Southern Ocean). Further analysis shows such an inconsistency may be associated with reductions in Arctic clouds due to a widespread low-tropospheric anomalous anticyclone over the Arctic together with an extensive cyclonic circulation centred over central Europe (Fig. S2a), as well as the resultant decreases in surface net radiation ((Fig. S2b). The anomalous southerlies transport cold air southward (Fig. S1a) and partially oppose the warming associated with the local positive ERF in high latitudes, leading to pronounced high-latitude cooling that is further amplified through the feedback processes related to sea-ice, albedo, and clouds (Kay et al., 2012; Najafi et al., 2015; Sand et al., 2015; Navarro et al., 2016; Dobricic et al., 2019). For more details, please refer to Zhao et al. (2019b).

Figure 4Annual mean surface air temperature change (ΔK) in response to 1970–2010 anthropogenic aerosol emission changes. They are (a) the best estimate of total aerosol emission changes, (b) changes due to energy-use growth, and (c) changes due to advances in emission control technology. The numbers on the top right of each panel are the global mean values. Also shown are the mean (solid) and standard deviation (30 model years; shadings) of the zonal mean temperature response. The statistical significance at the 5 % level is calculated using the two-tailed Student's t test and is denoted by the grey hatching.
Aerosol-related emission changes from energy-use growth result in a more prominent cooling that is statistically significant almost worldwide, and over the oceans in particular (Fig. 4b), with a global mean cooling of K. The cooling is enhanced over the Arctic ( K). The zonal mean temperature response displays significant cooling across all latitude bands, with peak values found at the North Pole (up to −1.5 K). It can be seen that both the spatial pattern and zonal mean of temperature changes due to aerosol changes induced by energy-use growth resemble very well those of the 1970–2010 Best Estimate but with much larger magnitudes of changes. This demonstrates energy use as a major contributor to the climate impacts induced by the 1970–2010 aerosol changes, which is particularly the case over Asia and the Arctic. Changes in sea level pressure and low-level circulation (Fig. S2c) show a further enhanced anomalous Arctic high and anomalous high-latitudinal southerlies compared to the Best Estimate experiment. This seems to be reinforcing the cooling effect due to decreases in surface net radiation as aerosols increase (Fig. S2d) and may explain why the surface cooling is more prominent compared to that in the Best Estimate experiment.
The avoided aerosol-related emissions from technology advances (Fig. 2c) lead the globe to warm by K, with the most pronounced responses over the Arctic ( K) and North America ( K). Yet, the warming effects can also be seen over other regions including Asia, Africa, and South America, despite the relatively smaller aerosol reductions in these regions related to technology advances. Note that all the temperature responses have large uncertainties. The zonal mean temperature response is only distinguishable from zero over the Northern Hemisphere mid-latitudes (∼30∘ N) and the polar regions. There is a noticeable cooling pattern over Europe despite the large positive forcing (+1.16 W m−2; Fig. 2f). This seems to be related to adjustments in the atmospheric circulation that brings cold air from higher latitudes (Fig. S2e), overwhelming the effects of local surface radiation increases (Fig. S2f).
The competition between technology advances (Fig. 4c) and energy-use growth (Fig. 4b) can be clearly seen in modulating the spatial pattern of global temperature changes, with the global mean values (0.10 and −0.35 K, respectively) almost adding up to that in the Best Estimate experiment (−0.26 K). Note, however, that regional mean values do not add up, with northeast Eurasia and the Atlantic Ocean in particular, where the two drivers reinforce each other in changing local temperature changes.
As described above, despite the broad consistency between the patterns of aerosol ERF (Fig. 2) and temperature response (Fig. 4), there are also notable dissimilarities. This is particularly true over the high latitudes, where changes in atmospheric circulation may play important roles in local surface temperature responses. To point this out more clearly, we calculate the temperature response per unit aerosol ERF (temperature sensitivity) over various domains (Fig. 5). It can be seen that the relationship between ERF and temperature response is far from being linear even at the global scale and over latitudinal bands. For example, the global mean sensitivity value ranges from 0.5 K (W m−2)−1 in the technology advances experiment to 2.4 K (W m−2)−1 in the Best Estimate experiment. Also, note the negative temperature sensitivity values for various regions (e.g. the Arctic, Europe, North America, and Asia), questioning ERF as a useful predictor of temperature change for aerosols.

Figure 5Scatterplot of surface air temperature responses (ΔK) vs. effective radiative forcing (ΔW m−2). The error bars represent the 25th–75th percentile spread of the model uncertainty. The dashed slope lines crossing the origin indicate the sensitivities of the temperature response to ERF (K (W m). Region definitions are as follows: Arctic (0–360∘ E and 60–0∘ N), Asia (65–145∘ E and 5–45∘ N), Europe (10∘ W–40∘ E and 30–70∘ N), North America (190–300∘ E and 12–70∘ N), South America (278–326∘ E and 56∘ S–12∘ N), and Africa (20∘ W–60∘ E and −35∘ S–25∘ N) plus latitudinal bands. Colour conventions are the same as in Fig. 3.
3.3 Precipitation responses
Changes in precipitation show complex spatial patterns (Fig. 6) and much larger uncertainties (Fig. 3d) compared to temperature responses. Overall, the 1970–2010 aerosol changes result in a global precipitation reduction ( mm d−1), with the most pronounced changes over Asia ( mm d−1) and adjoining oceans (Fig. 6a). By comparison, precipitation increase can be seen over Europe ( mm d−1) and the North Atlantic Ocean. Despite the large uncertainties, the zonal mean changes show precipitation reductions at almost all latitude bands. The pronounced precipitation reductions over Asia reflect partly the 20th century drying trend of the Asian monsoon (Yihui and Chan, 2005; Lau and Kim, 2006; Bollasina et al., 2011; Ganguly et al., 2012; Polson et al., 2014; Song et al., 2014; Lau and Kim, 2017; Ma et al., 2017), as supported by changes in the low-level circulation patterns (i.e. the prominent anomalous easterlies over the northern Indian Ocean that weaken the South Asian monsoon, as well as the anomalous cyclonic circulations over the tropical Western Pacific Ocean that weaken the East Asian monsoon; Fig. S2a).
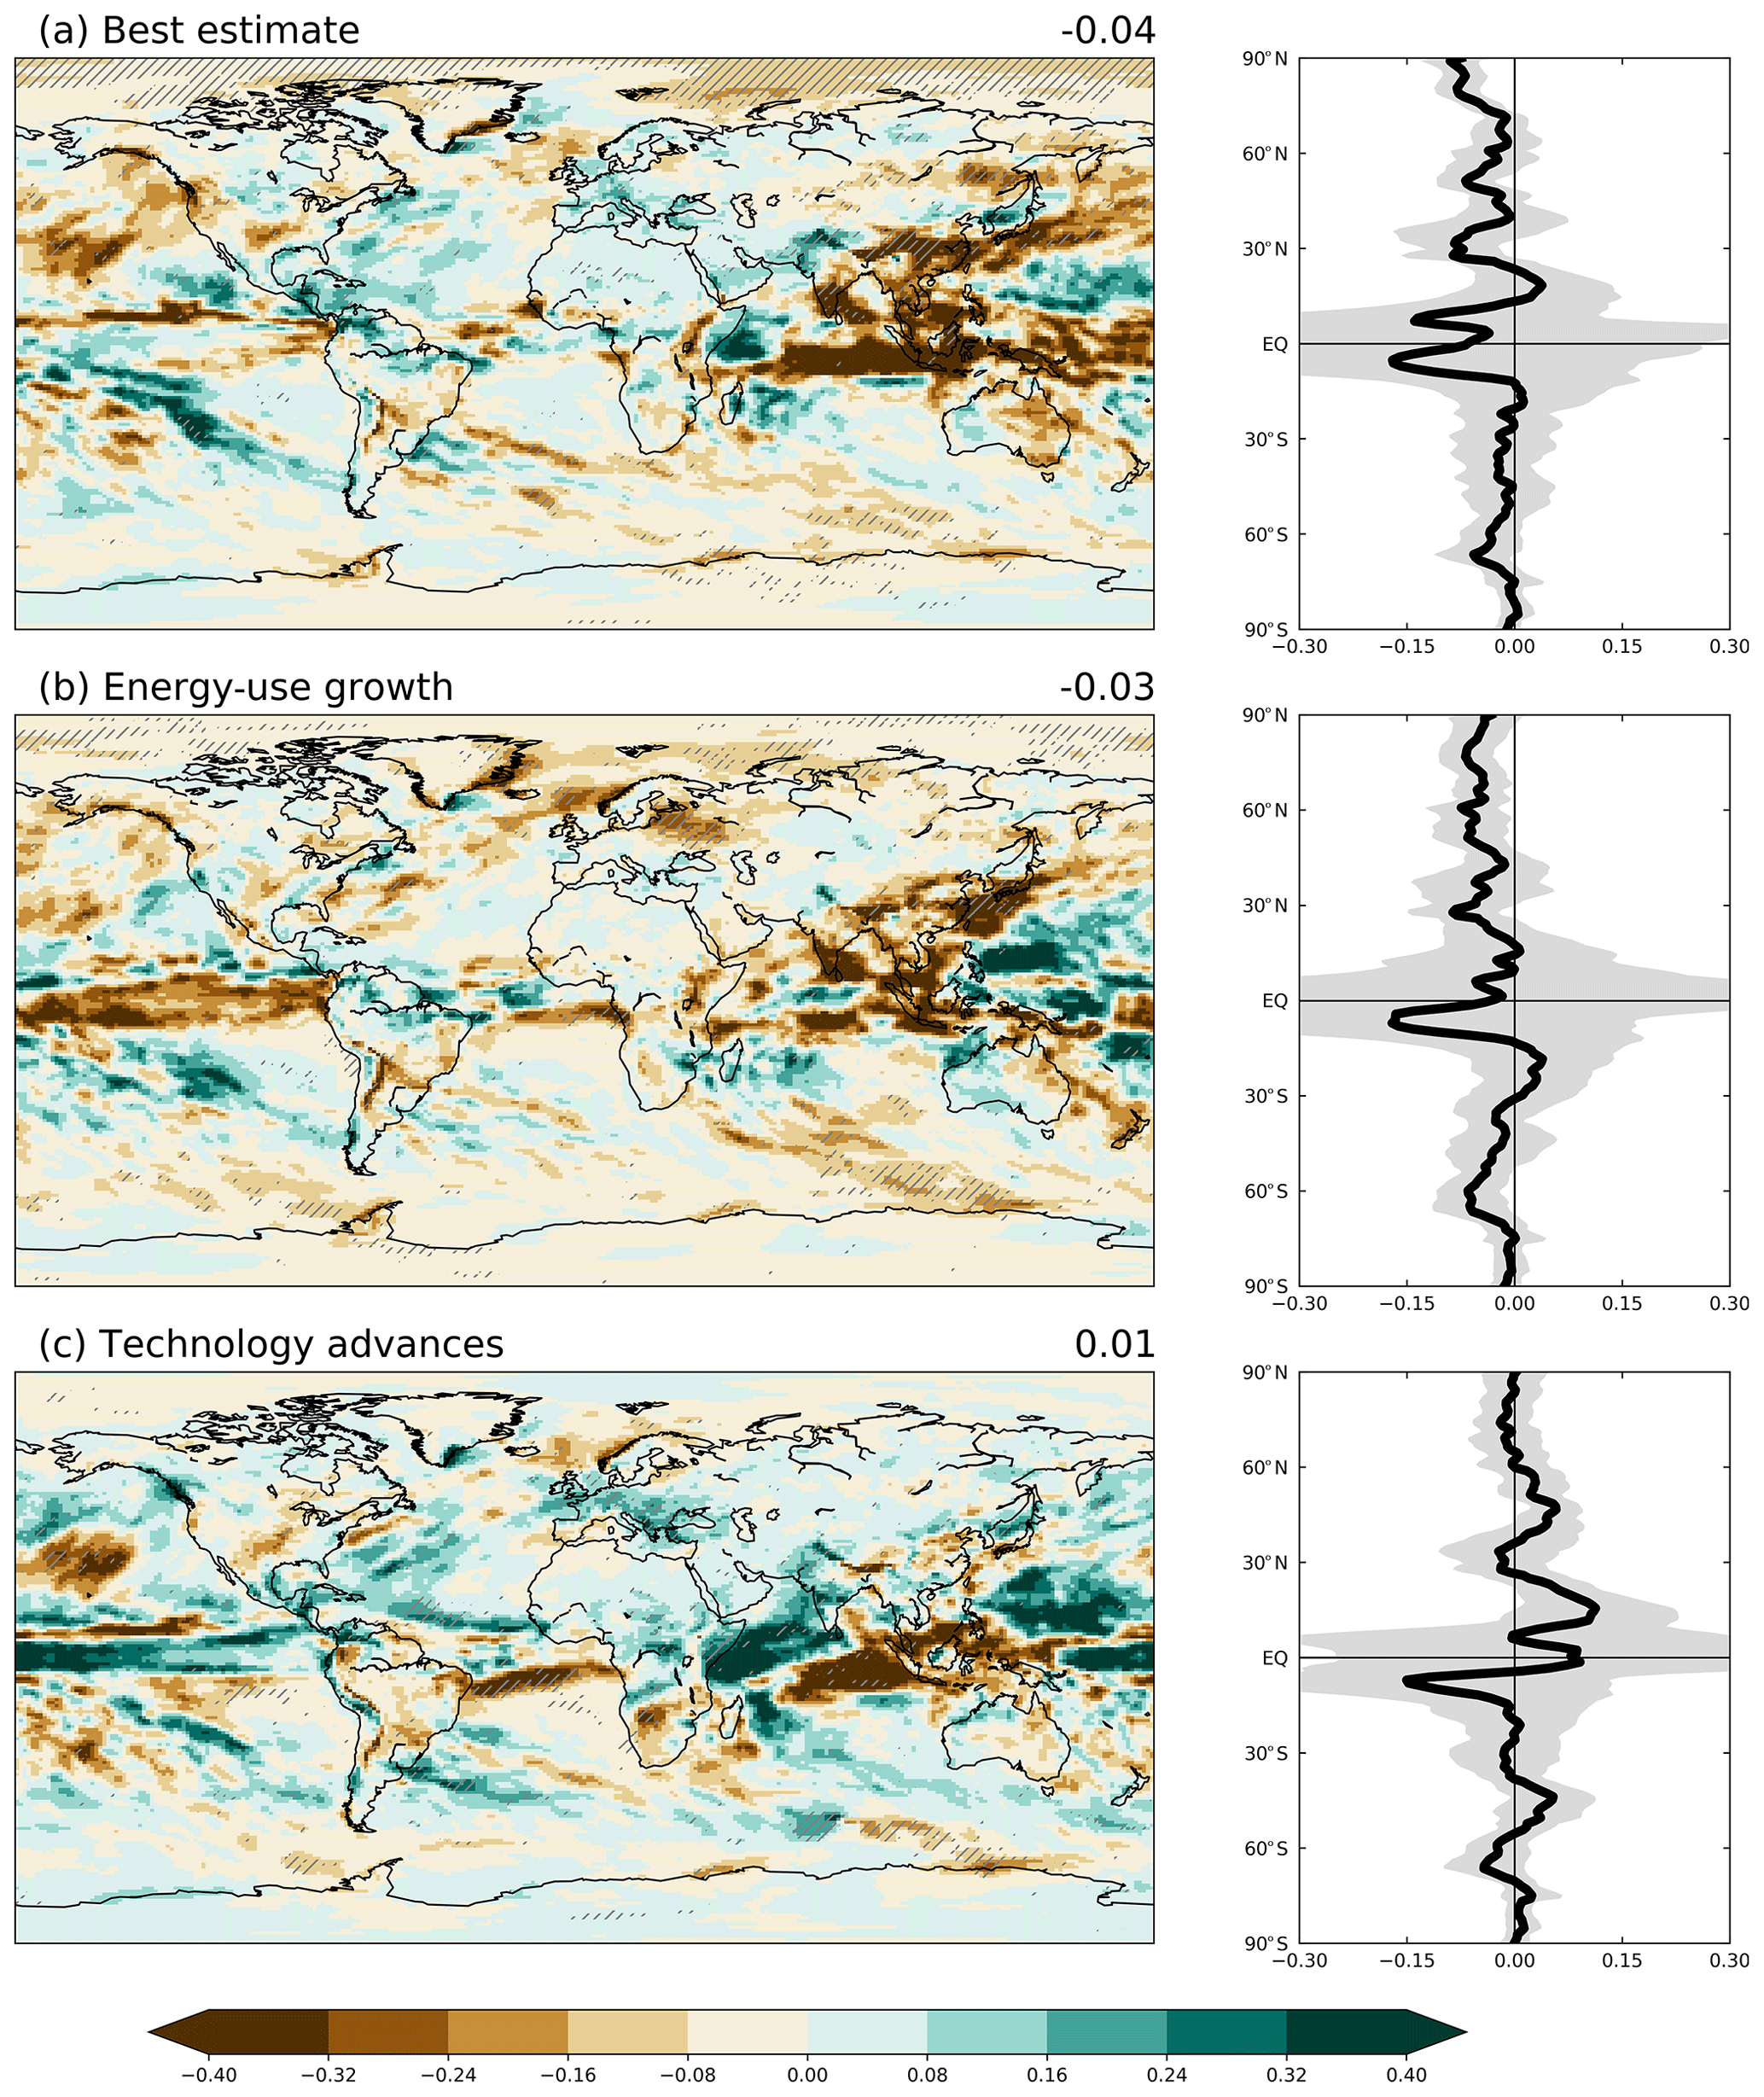
Figure 6The same as Fig. 4 but for precipitation response (Δmm d−1).
The globe, especially land areas, becomes even drier in response to aerosol changes from energy-use growth (Fig. 6b). The precipitation change in Asia ( mm d−1) is close to that associated with the best estimate of 1970–2010 aerosol changes ( mm d−1). This, as also in temperature response, suggests that aerosol changes from energy-use growth exert the predominant control on precipitation changes over Asia. The precipitation reduction is also notable over Europe ( mm d−1). Along with precipitation decreases at almost all latitude bands, and the tropics in particular, zonal mean precipitation changes show a weak but southward shift of the Intertropical Convergence Zone (ITCZ), leading to weak precipitation increases over the Southern Hemisphere subtropics (10–30∘ S). As in the Best Estimate case, changes in low-level circulation (Fig. S2c) also suggest a weakening of the South Asian monsoon. This seems to be consistent with the relatively less-prominent precipitation reduction over South Asia and the North Indian Ocean (Fig. 6b). In contrast, the anomalous cyclonic circulation over the tropical western Pacific is enhanced, leading to further precipitation decreases over East Asia but increases over the adjacent ocean.
Contrary to energy-use growth, technology advances lead precipitation to increase globally ( mm d−1), particularly in the Northern Hemisphere, along with its warming effect (Fig. 4c). There are precipitation increases over Europe, the Mediterranean, and northern Africa (Fig. 6c), along with the anomalous cyclonic circulation that brings moisture from the Atlantic eastward (Fig. S2e), as aerosol reductions result in more radiation reaching the land surface (Fig. S2f). In comparison, prominent precipitation decreases can still be seen over Southeast Asia and the northern Indian Ocean, likely due to the low-level circulation anomalies (i.e. anomalous easterlies over the northern Indian Ocean and westerlies over the equatorial Pacific Ocean) that impede the climatological moisture transport. Meanwhile, the zonal mean precipitation profile shows a marked northward shift of the ITCZ with notable precipitation reductions over the Southern Hemisphere tropics.
Similar to temperature changes, the 1970–2010 precipitation changes induced by aerosol changes also demonstrate competition between the two emission drivers, yet the values do not add up to that in the Best Estimate case even when globally averaged. Generally, the global mean precipitation changes with temperature at a rate of 0.09–0.15 mm d−1 K−1. This is slightly larger than the multi-model mean estimate (∼28.6 mm yr−1 K−1, i.e. ∼0.08 mm d−1 K−1) for the slow climate response component derived from the Precipitation Driver Response Model Intercomparison Project (PDRMIP; Samset et al., 2016). Most of the global and regional mean responses follow to some extent the linear increase (compare Fig. 3c to d), but Asia, Europe, and the Arctic deviate significantly from the linear relationship. This supports previous studies demonstrating that regional precipitation responses are not only linked to temperature through regional energy budget constraints but also depend on other factors such as prevailing circulation patterns and remote teleconnections (Bollasina et al., 2014; Wilcox et al., 2019; Lewinschal et al., 2019). Overall, the above indicates the importance of changes in aerosol-related emissions in both global and regional precipitation changes. This is particularly true for Asia and Europe, which represent the major sources of present-day aerosol-related emissions. In addition, aerosol changes are shown to have important influences on the ITCZ that tend to shift it towards the warmer hemisphere (Allen and Sherwood, 2011; Hwang et al., 2013; Allen and Ajoku, 2016; Acosta Navarro et al., 2017; Liu et al., 2018).
4.1 Non-linearities and the importance of background aerosol levels
Instead of linearly attributing the total aerosol changes into individual contributing factors, a “what-if” approach was adopted to develop the EDGAR retrospective emission scenarios (Crippa et al., 2016). This design is useful to assess the effectiveness of major drivers of emissions and allows us to show explicitly the policy-choice-driven impacts, while accounting for non-linear interplays between individual drivers. However, this approach adds extra non-linearities to the results presented here in that, as discussed throughout this work, aerosol changes from energy-use growth and technology advances do not add up to the total net 1970–2010 emission changes. This may suggest the existence of other factors taking effects, but it is almost impossible to attribute the residuals to such factors. Nevertheless, even when total emissions are linearly decomposed into individual contributing factors, it is reasonable to expect both the radiative forcing and climate responses to not linearly add up because of a variety of intertwined mechanisms. (e.g. the location-dependent lifetime of different aerosol species; Liu et al., 2012, and the forcing efficacies; Kasoar et al., 2016; Aamaas et al., 2017). At the global scale, despite the non-linearities in aerosols and their precursor emissions and AOD changes, the diagnosed global mean ERF and temperature responses roughly add up (Fig. 3). However, this is not the case for precipitation. When averaged regionally, the non-linearities are more pronounced and can be seen through the pathway from emissions to AOD and ERF and to temperature and precipitation responses.
In Sect. 3.1, we diagnosed the ERF associated with changes in each individual aerosol species as the differences between the baseline Fsst simulation (B10) and the ones where the targeted species (e.g. BC) are kept constant at their 1970 levels, while the others are as prescribed in B10. We note that changes in both the spatial pattern and the global mean amount (Fig. S3) of the burden and AOD of the three aerosol species do not show appreciable differences to those in the experiment where all the three species change simultaneously (B10–B70). However, the ERF estimates do not linearly add up to the total. In fact, the residual (0.14 W m−2) is even larger in magnitude than the 1970–2010 total net aerosol ERF (−0.11 W m−2). This reflects partly the non-linear effect associated with the ratio of different aerosol species as well as the importance of background aerosol loadings. This is particularly important for BC, whose effects depend also on the presence of sulfate and organic aerosols (Ramana et al., 2010). That is, given that aerosol species are internally mixed in MAM3 (i.e. different chemical species are mixed within an aerosol particle), the hygroscopicity of aerosol particles is dominated by the volume of soluble species (organic compounds and sulfate). This means that the non-linearity in the isolated aerosol ERF may be a reflection of the aerosol scheme in CESM1. More specifically, BC particles tend to be coated with other species (e.g. sulfate, ammonium, or organic carbon) during ageing, thereby enhancing the absorption and the subsequent impacts on cloud microphysics, as well as amplifying their radiative forcing (Haywood and Ramaswamy, 1998; Kim et al., 2008; Chung et al., 2012; Wu et al., 2016). That is, the radiative forcing of BC may change with the ratio of BC to soluble aerosol species. Here, the ERF of BC is diagnosed as the difference between the baseline experiment (B10) and that with BC held at the 1970 levels, leading the latter experiment to have a smaller ratio of BC to SO4 and therefore smaller ERF. As a consequence, the ERF estimate due to the 1970–2010 changes in BC may be overestimated and may contribute to non-linearities in the ERF of individual species. Note that these non-linearities can be further enhanced by processes related to aerosol–cloud interactions, which are difficult to quantify (Fan et al., 2016; Forster et al., 2016).
Overall, the above discussion illustrates the importance of background aerosol concentrations and how models represent the mixing state in estimating the radiative forcing of aerosols. For example, we speculate that diagnosing the ERF of BC the other way round, namely keeping all other aerosol species at 1970 levels while changing BC to 2010 levels, would likely result in different ERF estimates. Therefore, it is important to carefully bear in mind the model experiment set-up design when interpreting the ERF and climate responses associated with aerosol changes. For example, the single forcing experiments in the Coupled Model Intercomparison Project (CMIP5; Taylor et al., 2012), the PDRMIP, and other idealized aerosol perturbation experiments (Wang et al., 2015; Samset et al., 2016; Kasoar et al., 2018; Liu et al., 2018; Persad and Caldeira, 2018), as well as the upcoming AerChemMIP (Collins et al., 2017) model experiments, all need to be interpreted in the context of their experiment designs.
4.2 Caveats on the use of effective radiative forcing for aerosols
The ERF is generally deemed to be a useful indicator of temperature changes (Shindell and Faluvegi, 2009; Myhre et al., 2013; Shindell et al., 2015; Forster et al., 2016; Lewinschal et al., 2019). Based on ERF, many metrics have been proposed to facilitate comparing the effectiveness of various forcing agents. Also, these metrics are appealing to quickly assess the climate outcomes of possible future emission pathways, and hence they may provide useful information to policy-makers (Aamaas et al., 2017; Lewinschal et al., 2019). However, it is known that forcing and temperature response are not necessarily co-located, due to many other climate processes and feedback processes such as the atmospheric and oceanic heat transport, and atmospheric circulation adjustments (Boer and Yu, 2003; Shindell et al., 2010; Bellouin et al., 2016; Persad and Caldeira, 2018). Specifically, ERF and the associated metrics may work for well-mixed forcing agents such as GHGs (Zhao et al., 2019b). However, they are misleading and may be open to misinterpretation when used for aerosols and some other short-lived climate forcers.
We stress here again that temperature responses do not necessarily follow the ERF of aerosols. In this work, the range (0.5–2.4 K (W m−2)−1) of the global mean temperature response per unit ERF is even larger than that (0.1–1.4 K (W m−2)−1) reported by Persad and Caldeira (2018). Also, our results suggest that the model-simulated temperature response per unit aerosol ERF can differ considerably with even subtle differences in experiment design (e.g. with different amounts of aerosols emitted in different locations at different timings). Further, due to the fact that aerosol schemes are represented differently across the present-generation climate models, it is highly likely that the sensitivities will differ across climate models. Therefore, as also pointed out by recent works (Persad and Caldeira, 2018; Lewinschal et al., 2019), the large divergence in the temperature response per unit ERF from aerosols highlights the need to use ERF and derivative metrics carefully for aerosols.
4.3 Implications for future climate projection
Reliable projections of future climate under different but equally plausible emission pathways are of utmost importance to better constrain the range of possible societal risks and response options. Unfortunately, there are still considerable challenges due to limitations and uncertainties in our understanding of many aspects of the Earth system (Knutti and Sedláček, 2013; Northrop and Chandler, 2014; Marotzke, 2019). Aerosols represent one of the largest sources of uncertainty (Boucher et al., 2013; Lee et al., 2016; Fletcher et al., 2018). Present-day anthropogenic aerosol-related emissions are largely influenced by sectors including power generation, industry, and transport. However, in some of the future emission pathways, e.g. the Tier-1 Shared Socioeconomic Pathways scenarios (SSP1; Gidden et al., 2018), aerosol-related emissions are expected to decline drastically worldwide as we transit to non-fossil-fuel-based sources of energy, together with rapid implementation of air pollution control measures and new technologies. For example, mainly as a result of China's transition to a less energy-intensive society, for the first time the global coal consumption decreased in 2015 since the 1970s (World Energy Council, 2016). However, the timing and rate of such transitions are largely uncertain. On the other hand, it is also likely that aerosol-related emissions will increase, especially over some developing countries, under scenarios where high inequality exists between and within countries. For example, in SSP3, expanding industrial sectors over Southeast Asia may continue to rely on traditional energy sources such as coal for much of the 21st century. Also, it is possible that the world may continue to rely on fossil energy sources more strongly than expected over the coming years, given the concerns about nuclear energy after the Fukushima Daiichi nuclear disaster in March 2011. As a consequence, aerosol-related emissions from energy use in some regions may increase and therefore offset aerosol reductions elsewhere.
The above discussion reflects the large uncertainties (both spatially and temporally) in our understanding and estimates of future aerosol-related emission trajectories, given the possibility that very different future emission pathways may be adopted by different countries to compromise between climate and/or air pollution impacts and economic growth. Our findings may help better assess and interpret such uncertainties in future climate projections associated with changes in aerosols. First of all, the large impacts of present-day aerosol changes from the two competing drivers, as reported in this work, suggest that the major drivers (e.g. future energy structure and efficiency, air pollution control measurements, and technology progresses) of emission changes are likely to continue to play important roles in future climate projections. Secondly, uncertainties in future aerosol-related emission pathways combine with those of other climate forcing agents (e.g. GHG emissions and land-use changes). Such uncertainties influence the impacts of aerosol forcing through changing the background climate state (see Sect. 4.2; e.g. Frey et al., 2017; Nordling et al., 2019; Stolpe et al., 2019). More importantly, our results stress the importance of non-linearities when comparing and assessing the impacts of different future aerosol-related emission pathways. This adds further caveats in interpreting future climate projections related to aerosol changes in addition to uncertainties in emission pathways of both aerosols and their precursors and GHGs.
Using CESM1, time-slice simulations were carried out to investigate the ERF and climate impacts of 1970–2010 aerosol changes, focusing on two major policy-relevant emission drivers that compete: energy-use growth and advances in emission control technology. The 1970–2010 anthropogenic aerosol changes generate a global mean ERF of W m−2. This is dominated by sulfate species, but the ERF estimates resolved into each individual species do not add up linearly to the total. The residual may be associated with the relative ratio of different aerosol species (Kim et al., 2008), as well as many other intertwined non-linear processes linking aerosol changes to radiative forcing, and to temperature and precipitation responses. These non-linearities highlight the importance that one must bear aerosol experiment designs carefully in mind when interpreting aerosol forcing and effects. In particular, the background concentration of both GHGs and aerosols may have strong influences on isolated aerosol effects using climate models (Regayre et al., 2018; Grandey and Wang, 2019).
The 1970–2010 energy-use growth leads aerosols to increase over the Northern Hemisphere and Asia in particular, giving a global mean ERF of W m−2, resulting in a global mean cooling ( K) and precipitation reduction ( mm d−1). On the contrary, the avoided aerosol-related emissions due to technology advances generate a global mean ERF of W m−2, resulting in a global warming ( K) and precipitation increase ( mm d−1). Change in aerosols and the resultant climate impacts are dominated by energy-use growth over Asia but by technology advances over Europe and North America, while the global changes reflect competition between these two drivers. Compared to the rest of the world, temperature responses in the Arctic are noticeably amplified because of feedback processes related to sea ice and albedo (Navarro et al., 2016; Wobus et al., 2016; Dobricic et al., 2019). The large temperature responses are likely to be related to changes in aerosols over Europe and North America, while our results demonstrate that aerosol-related emissions from Asia may also play an important role (Westervelt et al., 2015; Wang et al., 2018; Dobricic et al., 2019). The temperature and precipitation responses to aerosol changes demonstrate the influences of adjustments in atmospheric circulation induced by aerosol changes that can overwhelm the effects of local aerosol forcing. This is particularly important over higher latitudes such as the Arctic and Europe, and it questions the usefulness of ERF as an indicator of the temperature response to aerosol forcing. We acknowledge the caveat of this study in that all our findings may be model dependent, which is particularly the case for aerosols, given the high degree of parameterization and divergence in aerosol schemes across present-generation climate models. We also note that CAM5 has a relatively larger aerosol forcing compared to other CMIP5 models (Allen and Ajoku, 2016; Malavelle et al., 2017; Toll et al., 2017; Zhou and Penner, 2017). These findings, therefore, need to be verified using other models while identifying the possible underlying differences and reasons.
In conclusion, energy-use growth and technology advances represent two major drivers of present-day aerosol changes and have strong and competing impacts on present-day climate. We anticipate that there will be significant but uncertain changes in aerosol-related emissions over the coming decades driven by these two drivers. Also, there are a variety of non-linearities in the effects of aerosols, originating from many factors including aerosol experiment design. All these uncertainties and non-linearities may translate into even larger uncertainties in future climate projections and associated impacts. Given all the findings and implications laid out above, we strongly encourage model groups to better constrain the non-linearities and uncertainties associated with aerosols in their climate models. Also, we encourage the wider research community to verify and further develop our findings in terms of aerosol–climate interactions and projections, as well as policy-relevant aerosol-related changes and their influences on air quality and associated socioeconomic impacts.
This work uses the Community Earth System Model on the ARCHER UK National Supercomputing Service. The model outputs were preprocessed using netCDF Operator (NCO) and Climate Data Operator (CDO). The analysis is carried out using the Python programming language. Data presented here can be freely accessed (embargoed) through Edinburgh DataShare (https://datashare.is.ed.ac.uk/handle/10283/3369, Zhao et al., 2019c).
The supplement related to this article is available online at: https://doi.org/10.5194/acp-19-14517-2019-supplement.
DSS conceptualized the project. MC provided the EDGAR emission scenarios. AZ, MAB, and DSS planned and designed the experiments. AZ carried out all model experiments, analysed the model outputs, and produced all results. The manuscript was drafted by AZ and improved with inputs from all co-authors.
The authors declare that they have no conflict of interest.
This work used the ARCHER UK National Supercomputing Service (http://www.archer.ac.uk, last access: 25 November 2019). The authors thank the Community Earth System Model project at NCAR (National Center for Atmospheric Research). We are grateful to Gary Strand (NCAR) for providing the model dumps. We also thank the four anonymous reviewers for their very valuable comments.
David S. Stevenson was funded from the NERC grants NE/N003411/1 and NE/S009019/1. Massimo A. Bollasina was supported by the UK-China Research and Innovation Partnership Fund through the Met Office Climate Science for Service Partnership (CSSP) China as part of the Newton Fund (grant no. H5438500).
This paper was edited by Pedro Jimenez-Guerrero and reviewed by four anonymous referees.
Aamaas, B., Berntsen, T. K., Fuglestvedt, J. S., Shine, K. P., and Collins, W. J.: Regional temperature change potentials for short-lived climate forcers based on radiative forcing from multiple models, Atmos. Chem. Phys., 17, 10795–10809, https://doi.org/10.5194/acp-17-10795-2017, 2017.
Acosta Navarro, J. C., Ekman, A. M., Pausata, F. S., Lewinschal, A., Varma, V., Seland, Ø., Gauss, M., Iversen, T., Kirkevåg, A., and Riipinen, I.: Future response of temperature and precipitation to reduced aerosol emissions as compared with increased greenhouse gas concentrations, J. Clim., 30, 939–954, 2017.
Allen, R. J. and Sherwood, S. C.: The impact of natural versus anthropogenic aerosols on atmospheric circulation in the Community Atmosphere Model, Clim. Dynam., 36, 1959–1978, 2011.
Allen, R. J. and Ajoku, O.: Future aerosol reductions and widening of the northern tropical belt, J. Geophys. Res.-Atmos., 121, 6765–6786, 2016.
Bartlett, R. E., Bollasina, M. A., Booth, B. B., Dunstone, N. J., Marenco, F., Messori, G., and Bernie, D. J. J. C. d.: Do differences in future sulfate emission pathways matter for near-term climate? A case study for the Asian monsoon, 50, 1863–1880, 2017.
Bellouin, N., Baker, L., Hodnebrog, Ø., Olivié, D., Cherian, R., Macintosh, C., Samset, B., Esteve, A., Aamaas, B., Quaas, J., and Myhre, G.: Regional and seasonal radiative forcing by perturbations to aerosol and ozone precursor emissions, Atmos. Chem. Phys., 16, 13885–13910, https://doi.org/10.5194/acp-16-13885-2016, 2016.
Boer, G. and Yu, B.: Climate sensitivity and response, Clim. Dynam., 20, 415–429, 2003.
Bollasina, M. A., Ming, Y., and Ramaswamy, V.: Anthropogenic aerosols and the weakening of the South Asian summer monsoon, Science, 334, 502–505, 2011.
Bollasina, M. A., Ming, Y., Ramaswamy, V., Schwarzkopf, M. D., and Naik, V.: Contribution of local and remote anthropogenic aerosols to the twentieth century weakening of the South Asian Monsoon, Geophys. Res. Lett., 41, 680–687, 2014.
Boucher, O., Randall, D., Artaxo, P., Bretherton, C., Feingold, G., Forster, P., Kerminen, V.-M., Kondo, Y., Liao, H., and Lohmann, U.: Clouds and aerosols, in: Climate change 2013: the physical science basis, Contribution of Working Group I to the Fifth Assessment Report of the Intergovernmental Panel on Climate Change, Cambridge University Press, 571–657, 2013.
Carslaw, K., Lee, L., Reddington, C., Pringle, K., Rap, A., Forster, P., Mann, G., Spracklen, D., Woodhouse, M., and Regayre, L.: Large contribution of natural aerosols to uncertainty in indirect forcing, Nature, 503, 67–71, 2013a.
Carslaw, K. S., Lee, L. A., Reddington, C. L., Mann, G. W., and Pringle, K. J.: The magnitude and sources of uncertainty in global aerosol, Faraday Discuss., 165, 495–512, 2013b.
Chung, C., Lee, K., and Mueller, D.: Effect of internal mixture on black carbon radiative forcing, Tellus B, 64, 10925, https://doi.org/10.3402/tellusb.v64i0.10925, 2012.
Collins, W. J., Lamarque, J.-F., Schulz, M., Boucher, O., Eyring, V., Hegglin, M. I., Maycock, A., Myhre, G., Prather, M., Shindell, D., and Smith, S. J.: AerChemMIP: quantifying the effects of chemistry and aerosols in CMIP6, Geosci. Model Dev., 10, 585–607, https://doi.org/10.5194/gmd-10-585-2017, 2017.
Conley, A. J., Garcia, R., Kinnison, D., Lamarque, J.-F., Marsh, D., Mills, M., Smith, A. K., Tilmes, S., Vitt, F., and Morrison, H.: Description of the NCAR community atmosphere model (CAM 5.0), NCAR Technical note, available at: https://opensky.ucar.edu/islandora/object/technotes:477 (last access: 25 November 2019), 2012.
Crippa, M., Janssens-Maenhout, G., Dentener, F., Guizzardi, D., Sindelarova, K., Muntean, M., Van Dingenen, R., and Granier, C.: Forty years of improvements in European air quality: regional policy-industry interactions with global impacts, Atmos. Chem. Phys., 16, 3825–3841, https://doi.org/10.5194/acp-16-3825-2016, 2016.
Dobricic, S., Pozzoli, L., Vignati, E., Van Dingenen, R., Wilson, J., Russo, S., and Klimont, Z.: Nonlinear impacts of future anthropogenic aerosol emissions on Arctic warming, Environ. Res. Lett., 14, 034009, https://doi.org/10.1088/1748-9326/aaf8e, 2019.
Fan, J., Wang, Y., Rosenfeld, D., and Liu, X.: Review of aerosol–cloud interactions: Mechanisms, significance, and challenges, J. Atmos. Sci., 73, 4221–4252, 2016.
Feichter, J., Roeckner, E., Lohmann, U., and Liepert, B.: Nonlinear aspects of the climate response to greenhouse gas and aerosol forcing, J. Clim., 17, 2384–2398, 2004.
Fletcher, C. G., Kravitz, B., and Badawy, B.: Quantifying uncertainty from aerosol and atmospheric parameters and their impact on climate sensitivity, Atmos. Chem. Phys., 18, 17529–17543, https://doi.org/10.5194/acp-18-17529-2018, 2018.
Forster, P. M., Richardson, T., Maycock, A. C., Smith, C. J., Samset, B. H., Myhre, G., Andrews, T., Pincus, R., and Schulz, M.: Recommendations for diagnosing effective radiative forcing from climate models for CMIP6, J. Geophys. Res.-Atmos., 121, 460–475, 2016.
Frey, L., Bender, F. A.-M., and Svensson, G.: Cloud albedo changes in response to anthropogenic sulfate and non-sulfate aerosol forcings in CMIP5 models, Atmos. Chem. Phys., 17, 9145–9162, https://doi.org/10.5194/acp-17-9145-2017, 2017.
Ganguly, D., Rasch, P. J., Wang, H., and Yoon, J. h.: Fast and slow responses of the South Asian monsoon system to anthropogenic aerosols, Geophys. Res. Lett., 39, L18804, https://doi.org/10.1029/2012GL053043, 2012.
Gidden, M. J., Riahi, K., Smith, S. J., Fujimori, S., Luderer, G., Kriegler, E., van Vuuren, D. P., van den Berg, M., Feng, L., Klein, D., Calvin, K., Doelman, J. C., Frank, S., Fricko, O., Harmsen, M., Hasegawa, T., Havlik, P., Hilaire, J., Hoesly, R., Horing, J., Popp, A., Stehfest, E., and Takahashi, K.: Global emissions pathways under different socioeconomic scenarios for use in CMIP6: a dataset of harmonized emissions trajectories through the end of the century, Geosci. Model Dev., 12, 1443–1475, https://doi.org/10.5194/gmd-12-1443-2019, 2019.
Grandey, B. S. and Wang, C.: Background Conditions Influence the Estimated Cloud Radiative Effects of Anthropogenic Aerosol Emissions From Different Source Regions, J. Geophys. Res.-Atmos., 124, 2276–2295, 2019.
Hansen, J., Sato, M., Ruedy, R., Nazarenko, L., Lacis, A., Schmidt, G., Russell, G., Aleinov, I., Bauer, M., and Bauer, S.: Efficacy of climate forcings, J. Geophys. Res.-Atmos., 110, D18104, https://doi.org/10.1029/2005JD005776, 2005.
Haywood, J. and Ramaswamy, V.: Global sensitivity studies of the direct radiative forcing due to anthropogenic sulfate and black carbon aerosols, J. Geophys. Res.-Atmos., 103, 6043–6058, 1998.
Hoesly, R. M., Smith, S. J., Feng, L., Klimont, Z., Janssens-Maenhout, G., Pitkanen, T., Seibert, J. J., Vu, L., Andres, R. J., Bolt, R. M., Bond, T. C., Dawidowski, L., Kholod, N., Kurokawa, J.-I., Li, M., Liu, L., Lu, Z., Moura, M. C. P., O'Rourke, P. R., and Zhang, Q.: Historical (1750–2014) anthropogenic emissions of reactive gases and aerosols from the Community Emissions Data System (CEDS), Geosci. Model Dev., 11, 369–408, https://doi.org/10.5194/gmd-11-369-2018, 2018.
Hurrell, J. W., Holland, M. M., Gent, P. R., Ghan, S., Kay, J. E., Kushner, P. J., Lamarque, J.-F., Large, W. G., Lawrence, D., and Lindsay, K.: The community earth system model: a framework for collaborative research, B. Am. Meteorol. Soc., 94, 1339–1360, 2013.
Hwang, Y. T., Frierson, D. M., and Kang, S. M.: Anthropogenic sulfate aerosol and the southward shift of tropical precipitation in the late 20th century, Geophys. Res. Lett., 40, 2845–2850, 2013.
Kasoar, M., Voulgarakis, A., Lamarque, J.-F., Shindell, D. T., Bellouin, N., Collins, W. J., Faluvegi, G., and Tsigaridis, K.: Regional and global temperature response to anthropogenic SO2 emissions from China in three climate models, Atmos. Chem. Phys., 16, 9785–9804, https://doi.org/10.5194/acp-16-9785-2016, 2016.
Kasoar, M., Shawki, D., and Voulgarakis, A.: Similar spatial patterns of global climate response to aerosols from different regions, npj Clim. Atmos. Sci., 1, 12, https://doi.org/10.1038/S41612-018-0022-Z, 2018.
Kay, J., Deser, C., Phillips, A., Mai, A., Hannay, C., Strand, G., Arblaster, J., Bates, S., Danabasoglu, G., and Edwards, J.: The Community Earth System Model (CESM) large ensemble project: A community resource for studying climate change in the presence of internal climate variability, B. Am. Meteorol. Soc., 96, 1333–1349, 2015.
Kay, J. E., Holland, M. M., Bitz, C. M., Blanchard-Wrigglesworth, E., Gettelman, A., Conley, A., and Bailey, D.: The influence of local feedbacks and northward heat transport on the equilibrium Arctic climate response to increased greenhouse gas forcing, J. Clim., 25, 5433–5450, 2012.
Kim, D., Wang, C., Ekman, A. M., Barth, M. C., and Rasch, P. J.: Distribution and direct radiative forcing of carbonaceous and sulfate aerosols in an interactive size-resolving aerosol–climate model, J. Geophys. Res.-Atmos., 113, D16309, https://doi.org/10.1029/2007JD009756, 2008.
Kloster, S., Dentener, F., Feichter, J., Raes, F., Lohmann, U., Roeckner, E., and Fischer-Bruns, I.: A GCM study of future climate response to aerosol pollution reductions, Clim. Dynam., 34, 1177–1194, 2010.
Knutti, R. and Sedláček, J.: Robustness and uncertainties in the new CMIP5 climate model projections, Nat. Clim. Change, 3, D16309, https://doi.org/10.1038/nclimate1716, 2013.
Lamarque, J.-F., Bond, T. C., Eyring, V., Granier, C., Heil, A., Klimont, Z., Lee, D., Liousse, C., Mieville, A., Owen, B., Schultz, M. G., Shindell, D., Smith, S. J., Stehfest, E., Van Aardenne, J., Cooper, O. R., Kainuma, M., Mahowald, N., McConnell, J. R., Naik, V., Riahi, K., and van Vuuren, D. P.: Historical (1850–2000) gridded anthropogenic and biomass burning emissions of reactive gases and aerosols: methodology and application, Atmos. Chem. Phys., 10, 7017–7039, https://doi.org/10.5194/acp-10-7017-2010, 2010.
Lamarque, J.-F., Kyle, G. P., Meinshausen, M., Riahi, K., Smith, S. J., van Vuuren, D. P., Conley, A. J., and Vitt, F.: Global and regional evolution of short-lived radiatively-active gases and aerosols in the Representative Concentration Pathways, Climatic Change, 109, 191–212, 2011.
Lau, K. M. and Kim, K. M.: Observational relationships between aerosol and Asian monsoon rainfall, and circulation, Geophys. Res. Lett., 33, L21810, https://doi.org/10.1029/2006GL027546, 2006.
Lau, W. K.-M. and Kim, K.-M.: Competing influences of greenhouse warming and aerosols on Asian summer monsoon circulation and rainfall, Asia-Pac. J. Atmos. Sci., 53, 181–194, 2017.
Lee, L. A., Reddington, C. L., and Carslaw, K. S.: On the relationship between aerosol model uncertainty and radiative forcing uncertainty, P. Natl. Acad. Sci., 113, 5820–5827, 2016.
Lewinschal, A., Ekman, A. M. L., Hansson, H.-C., Sand, M., Berntsen, T. K., and Langner, J.: Local and remote temperature response of regional SO2 emissions, Atmos. Chem. Phys., 19, 2385–2403, https://doi.org/10.5194/acp-19-2385-2019, 2019.
Li, McLinden, C., Fioletov, V., Krotkov, N., Carn, S., Joiner, J., Streets, D., He, H., Ren, X., and Li, Z.: India is overtaking China as the world's largest emitter of anthropogenic sulfur dioxide, Sci. Rep., 7, 14304, https://doi.org/10.1038/s41598-017-14639-8, 2017.
Lin, L., Wang, Z., Xu, Y., and Fu, Q.: Sensitivity of precipitation extremes to radiative forcing of greenhouse gases and aerosols, Geophys. Res. Lett., 43, 9860–9868, 2016.
Liu, L., Shawki, D., Voulgarakis, A., Kasoar, M., Samset, B., Myhre, G., Forster, P., Hodnebrog, Ø., Sillmann, J., and Aalbergsjø, S.: A PDRMIP Multimodel Study on the impacts of regional aerosol forcings on global and regional precipitation, J. Clim., 31, 4429–4447, 2018.
Liu, S., Aiken, A. C., Gorkowski, K., Dubey, M. K., Cappa, C. D., Williams, L. R., Herndon, S. C., Massoli, P., Fortner, E. C., and Chhabra, P. S.: Enhanced light absorption by mixed source black and brown carbon particles in UK winter, Nat. Commun., 6, 8435, https://doi.org/10.1038/ncomms9435, 2015.
Liu, X., Easter, R. C., Ghan, S. J., Zaveri, R., Rasch, P., Shi, X., Lamarque, J.-F., Gettelman, A., Morrison, H., Vitt, F., Conley, A., Park, S., Neale, R., Hannay, C., Ekman, A. M. L., Hess, P., Mahowald, N., Collins, W., Iacono, M. J., Bretherton, C. S., Flanner, M. G., and Mitchell, D.: Toward a minimal representation of aerosols in climate models: description and evaluation in the Community Atmosphere Model CAM5, Geosci. Model Dev., 5, 709–739, https://doi.org/10.5194/gmd-5-709-2012, 2012.
Liu, X., Ma, P.-L., Wang, H., Tilmes, S., Singh, B., Easter, R. C., Ghan, S. J., and Rasch, P. J.: Description and evaluation of a new four-mode version of the Modal Aerosol Module (MAM4) within version 5.3 of the Community Atmosphere Model, Geosci. Model Dev., 9, 505–522, https://doi.org/10.5194/gmd-9-505-2016, 2016.
Ma, S., Zhou, T., Stone, D. A., Polson, D., Dai, A., Stott, P. A., von Storch, H., Qian, Y., Burke, C., and Wu, P.: Detectable anthropogenic shift toward heavy precipitation over eastern China, J. Clim., 30, 1381–1396, 2017.
Malavelle, F. F., Haywood, J. M., Jones, A., Gettelman, A., Clarisse, L., Bauduin, S., Allan, R. P., Karset, I. H. H., Kristjánsson, J. E., and Oreopoulos, L.: Strong constraints on aerosol–cloud interactions from volcanic eruptions, Nature, 546, 485–490, 2017.
Markandya, A., Sampedro, J., Smith, S. J., Van Dingenen, R., Pizarro-Irizar, C., Arto, I., and González-Eguino, M.: Health co-benefits from air pollution and mitigation costs of the Paris Agreement: a modelling study, Lancet Planet. Health, 2, e126–e133, 2018.
Marotzke, J.: Quantifying the irreducible uncertainty in near-term climate projections, WIRES Clim. Change, 10, e563, https://doi.org/10.1002/wcc.563, 2019.
Marsh, D. R., Mills, M. J., Kinnison, D. E., Lamarque, J.-F., Calvo, N., and Polvani, L. M.: Climate change from 1850 to 2005 simulated in CESM1 (WACCM), J. Clim., 26, 7372–7391, 2013.
Ming, Y. and Ramaswamy, V.: Nonlinear climate and hydrological responses to aerosol effects, J. Clim., 22, 1329–1339, 2009.
Ming, Y. and Ramaswamy, V.: A model investigation of aerosol-induced changes in tropical circulation, J. Clim., 24, 5125–5133, 2011.
Ming, Y., Ramaswamy, V., and Chen, G.: A model investigation of aerosol-induced changes in boreal winter extratropical circulation, J. Clim., 24, 6077–6091, 2011.
Myhre, G., Shindell, D., Bréon, F.-M., Collins, W., Fuglestvedt, J., Huang, J., Koch, D., Lamarque, J.-F., Lee, D., and Mendoza, B.: Anthropogenic and natural radiative forcing, Climate Change, 423, 659–730, 2013.
Myhre, G., Forster, P.M., Samset, B.H., Hodnebrog, Ø., Sillmann, J., Aalbergsjø, S.G., Andrews, T., Boucher, O., Faluvegi, G., Fläschner, D., and Iversen, T: PDRMIP: A precipitation driver and response model intercomparison project – Protocol and preliminary results, B. Am. Meteorol. Soc., 98, 1185–1198, 2017.
Najafi, M. R., Zwiers, F. W., and Gillett, N. P.: Attribution of Arctic temperature change to greenhouse-gas and aerosol influences, Nat. Clim. Change, 5, 246–249, 2015.
Navarro, J. A., Varma, V., Riipinen, I., Seland, Ø., Kirkevåg, A., Struthers, H., Iversen, T., Hansson, H.-C., and Ekman, A.: Amplification of Arctic warming by past air pollution reductions in Europe, Nat. Geosci., 9, 277–281, 2016.
Nordling, K., Korhonen, H., Räisänen, P., Alper, M. E., Uotila, P., O'Donnell, D., and Merikanto, J.: Role of climate model dynamics in estimated climate responses to anthropogenic aerosols, Atmos. Chem. Phys., 19, 9969–9987, https://doi.org/10.5194/acp-19-9969-2019, 2019.
Northrop, P. J. and Chandler, R. E.: Quantifying sources of uncertainty in projections of future climate, J. Clim., 27, 8793–8808, 2014.
Nychka, D., Buchberger, R., Wigley, T., Santer, B., Taylor, K., and Jones, R.: Confidence intervals for trend estimates with autocorrelated observations, available at: http://citeseerx.ist.psu.edu/viewdoc/download?doi=10.1.1.33.6828&rep=rep1&type=pdf (last access: 25 November 2019), 2000.
Pendergrass, A. G., Lehner, F., Sanderson, B. M., and Xu, Y.: Does extreme precipitation intensity depend on the emissions scenario?, Geophys. Res. Lett., 42, 8767–8774, 2015.
Perkins, S. E.: A review on the scientific understanding of heatwaves – their measurement, driving mechanisms, and changes at the global scale, Atmos. Res., 164, 242–267, 2015.
Persad, G. G. and Caldeira, K.: Divergent global-scale temperature effects from identical aerosols emitted in different regions, Nat. Commun. 9, 3289, https://doi.org/10.1038/s41467-018-05838-6, 2018.
Polson, D., Bollasina, M., Hegerl, G., and Wilcox, L.: Decreased monsoon precipitation in the Northern Hemisphere due to anthropogenic aerosols, Geophys. Res. Lett., 41, 6023–6029, 2014.
Ramana, M., Ramanathan, V., Feng, Y., Yoon, S., Kim, S., Carmichael, G., and Schauer, J.: Warming influenced by the ratio of black carbon to sulphate and the black-carbon source, Nat. Geosci., 3, 542–545, 2010.
Regayre, L. A., Johnson, J. S., Yoshioka, M., Pringle, K. J., Sexton, D. M. H., Booth, B. B. B., Lee, L. A., Bellouin, N., and Carslaw, K. S.: Aerosol and physical atmosphere model parameters are both important sources of uncertainty in aerosol ERF, Atmos. Chem. Phys., 18, 9975–10006, https://doi.org/10.5194/acp-18-9975-2018, 2018.
Rosenfeld, D., Lohmann, U., Raga, G. B., O'Dowd, C. D., Kulmala, M., Fuzzi, S., Reissell, A., and Andreae, M. O.: Flood or drought: how do aerosols affect precipitation?, Science, 321, 1309–1313, 2008.
Samset, B., Myhre, G., Forster, P., Hodnebrog, Ø., Andrews, T., Faluvegi, G., Flaeschner, D., Kasoar, M., Kharin, V., and Kirkevåg, A.: Fast and slow precipitation responses to individual climate forcers: A PDRMIP multimodel study, Geophys. Res. Lett., 43, 2782–2791, 2016.
Samset, B., Sand, M., Smith, C., Bauer, S., Forster, P., Fuglestvedt, J., Osprey, S., and Schleussner, C. F.: Climate impacts from a removal of anthropogenic aerosol emissions, Geophys. Res. Lett., 45, 1020–1029, 2018a.
Samset, B., Sand, M., Smith, C., Bauer, S., Forster, P., Fuglestvedt, J., Osprey, S., and Schleussner, C. F.: Climate impacts from a removal of anthropogenic aerosol emissions, Geophys. Res. Lett., 45, 1020–1029, 2018b.
Sand, M., Berntsen, T., von Salzen, K., Flanner, M., Langner, J., and Victor, D.: Response of Arctic temperature to changes in emissions of short-lived climate forcers, Nat. Clim. Change, 2015.
Shindell, D.: Inhomogeneous forcing and transient climate sensitivity, Nat. Clim. Change, 4, 274, 2014.
Shindell, D. and Faluvegi, G.: Climate response to regional radiative forcing during the twentieth century, Nat. Geosci., 2, 294–300, 2009.
Shindell, D. T., Faluvegi, G., Rotstayn, L., and Milly, G.: Spatial patterns of radiative forcing and surface temperature response, J. Geophys. Res.-Atmos., 120, 5385–5403, 2015.
Shindell, D., Schulz, M., Ming, Y., Takemura, T., Faluvegi, G., and Ramaswamy, V.: Spatial scales of climate response to inhomogeneous radiative forcing, J. Geophys. Res.-Atmos., 115, D19110, https://doi.org/10.1088/1748-9326/aae71, 2010.
Sillmann, J., Pozzoli, L., Vignati, E., Kloster, S., and Feichter, J.: Aerosol effect on climate extremes in Europe under different future scenarios, Geophys. Res. Lett., 40, 2290–2295, 2013.
Silver, B., Reddington, C., Arnold, S., and Spracklen, D.: Substantial changes in air pollution across China during 2015–2017, Environ. Res. Lett., 13, 114012, https://doi.org/10.1088/1748-9326/aae718, 2018.
Smith, S. J., van Aardenne, J., Klimont, Z., Andres, R. J., Volke, A., and Delgado Arias, S.: Anthropogenic sulfur dioxide emissions: 1850–2005, Atmos. Chem. Phys., 11, 1101–1116, https://doi.org/10.5194/acp-11-1101-2011, 2011.
Song, F., Zhou, T., and Qian, Y.: Responses of East Asian summer monsoon to natural and anthropogenic forcings in the 17 latest CMIP5 models, Geophys. Res. Lett., 41, 596–603, 2014.
Stevens, B. and Feingold, G.: Untangling aerosol effects on clouds and precipitation in a buffered system, Nature, 461, 607–613, 2009.
Stocker, Qin, D., Plattner, G.-K., Tignor, M., Allen, S. K., Boschung, J., Nauels, A., Xia, Y., Bex, V., and Midgley, P. M.: Climate change 2013: The physical science basis, Intergovernmental Panel on Climate Change, Working Group I Contribution to the IPCC Fifth Assessment Report (AR5)(Cambridge Univ Press, New York), 33–188, 2013.
Stolpe, M. B., Medhaug, I., Beyerle, U., and Knutti, R.: Weak dependence of future global mean warming on the background climate state, Clim. Dynam., in press, 1–21, 2019.
Taylor, K. E., Stouffer, R. J., and Meehl, G. A.: An overview of CMIP5 and the experiment design, B. Am. Meteorol. Soc., 93, 485–498, 2012.
Tilmes, S., Lamarque, J.-F., Emmons, L. K., Kinnison, D. E., Ma, P.-L., Liu, X., Ghan, S., Bardeen, C., Arnold, S., Deeter, M., Vitt, F., Ryerson, T., Elkins, J. W., Moore, F., Spackman, J. R., and Val Martin, M.: Description and evaluation of tropospheric chemistry and aerosols in the Community Earth System Model (CESM1.2), Geosci. Model Dev., 8, 1395–1426, https://doi.org/10.5194/gmd-8-1395-2015, 2015.
Toll, V., Christensen, M., Gassó, S., and Bellouin, N.: Volcano and Ship Tracks Indicate Excessive Aerosol-Induced Cloud Water Increases in a Climate Model, Geophys. Res. Lett., 44, 12492–412500, 2017.
Turnock, S., Butt, E., Richardson, T., Mann, G., Reddington, C., Forster, P., Haywood, J., Crippa, M., Janssens-Maenhout, G., and Johnson, C.: The impact of European legislative and technology measures to reduce air pollutants on air quality, human health and climate, Environ. Res. Lett., 11, 024010, https://doi.org/10.1088/1748-9326/11/2/024010, 2016.
Wang, Z., Lin, L., Yang, M., and Xu, Y.: The effect of future reduction in aerosol emissions on climate extremes in China, Clim. Dynam., 47, 1–15, 2016.
Wang, Y., Jiang, J. H., Su, H., Choi, Y. S., Huang, L., Guo, J., and Yung, Y. L.: Elucidating the role of anthropogenic aerosols in Arctic sea ice variations, J. Clim., 31, 99–114, 2018.
Wang, Y., Jiang, J. H., and Su, H.: Atmospheric responses to the redistribution of anthropogenic aerosols, J. Geophys. Res.-Atmos., 120, 9625–9641, 2015.
Westervelt, D. M., Horowitz, L. W., Naik, V., Golaz, J.-C., and Mauzerall, D. L.: Radiative forcing and climate response to projected 21st century aerosol decreases, Atmos. Chem. Phys., 15, 12681–12703, https://doi.org/10.5194/acp-15-12681-2015, 2015.
Wilcox, L. J., Dunstone, N., Lewinschal, A., Bollasina, M., Ekman, A. M. L., and Highwood, E. J.: Mechanisms for a remote response to Asian anthropogenic aerosol in boreal winter, Atmos. Chem. Phys., 19, 9081–9095, https://doi.org/10.5194/acp-19-9081-2019, 2019.
Wilcox, L. J., Highwood, E. J., and Dunstone, N. J.: The influence of anthropogenic aerosol on multi-decadal variations of historical global climate, Environ. Res. Lett., 8, 024033, https://doi.org/10.1088/1748-9326/8/2/024033, 2013.
Wobus, C., Flanner, M., Sarofim, M. C., Moura, M. C. P., and Smith, S. J.: Future Arctic temperature change resulting from a range of aerosol emissions scenarios, Earth's Future, 4, 270–281, 2016.
World Energy Council: World energy resources 2016, World Energy Council, London, UK, available at: https://www.worldenergy.org/assets/images/imported/2016/10/World-Energy-Resources-Full-report-2016.10.03.pdf (last access: 25 November 2019), 2016.
Wu, Y., Cheng, T., Zheng, L., and Chen, H.: Black carbon radiative forcing at TOA decreased during aging, Sci. Rep., 6, 38592, https://doi.org/10.1038/srep38592, 2016.
Xie, S.-P., Lu, B., and Xiang, B.: Similar spatial patterns of climate responses to aerosol and greenhouse gas changes, Nat. Geosci., 6, 828–832, 2013.
Xu, Y., Lamarque, J.-F., and Sanderson, B. M.: The importance of aerosol scenarios in projections of future heat extremes, Climatic Change, 146, 1–14, 2015.
Yihui, D. and Chan, J. C.: The East Asian summer monsoon: an overview, Meteorol. Atmos. Phys., 89, 117–142, 2005.
Yu, S., Alapaty, K., Mathur, R., Pleim, J., Zhang, Y., Nolte, C., Eder, B., Foley, K., and Nagashima, T.: Attribution of the United States “warming hole”: Aerosol indirect effect and precipitable water vapor, Sci. Rep., 4, 6929, https://doi.org/10.1038/srep06929, 2014.
Zhao, A., Bollasina, M. A., and Stevenson, D. S.: Strong influence of aerosol reductions on future heatwaves, Geophys. Res. Lett., 46, 4913–4923, 2019a.
Zhao, A., Stevenson, D. S., and Bollasina, M. A., Climate forcing and response to greenhouse gases, aerosols and ozone in CESM1, J. Geophys. Res.-Atmos., in review, 2019b.
Zhao, A., Stevenson, D., and Bollasina, M.: Data supportingg the article “Significant climate impacts of aerosol changes driven by growth in energy use and advances in emissions control technology”, University of Edinburgh. School of GeoSciences, available at: https://datashare.is.ed.ac.uk/handle/10283/3369, last access: 14 November 2019c.
Zhao, A. D., Stevenson, D. S., and Bollasina, M. A.: The role of anthropogenic aerosols in future precipitation extremes over the Asian Monsoon Region, Clim. Dynam., 52, 6257–6278, 2018.
Zheng, B., Tong, D., Li, M., Liu, F., Hong, C., Geng, G., Li, H., Li, X., Peng, L., Qi, J., Yan, L., Zhang, Y., Zhao, H., Zheng, Y., He, K., and Zhang, Q.: Trends in China's anthropogenic emissions since 2010 as the consequence of clean air actions, Atmos. Chem. Phys., 18, 14095–14111, https://doi.org/10.5194/acp-18-14095-2018, 2018.
Zhou, C. and Penner, J. E.: Why do general circulation models overestimate the aerosol cloud lifetime effect? A case study comparing CAM5 and a CRM, Atmos. Chem. Phys., 17, 21–29, https://doi.org/10.5194/acp-17-21-2017, 2017.