the Creative Commons Attribution 4.0 License.
the Creative Commons Attribution 4.0 License.
 | 26 Nov 2019
Analysis of summer O3 in the Madrid air basin with the LOTOS-EUROS chemical transport model
Arjo Segers
Richard Kranenburg
Xavier Querol
Andrés Alastuey
Rafael Borge
David de la Paz
Gotzon Gangoiti
Martijn Schaap
Tropospheric O3 remains a major air-quality issue in the Mediterranean region. The combination of large anthropogenic emissions of precursors, transboundary contributions, a warm and dry aestival climate, and topographical features results in severe cases of photochemical pollution. Chemical transport models (CTMs) are essential tools for studying O3 dynamics and for assessing mitigation measures, but they need to be evaluated specifically for each air basin. In this study, we present an optimisation of the LOTOS-EUROS CTM for the Madrid air basin. Five configurations using different meteorological datasets (from the European Centre for Medium-Range Weather Forecast, ECMWF; and the Weather Research and Forecasting Model, WRF), horizontal resolution and number of vertical levels were compared for July 2016. LOTOS-EUROS responded satisfactorily in the five configurations reproducing observations of surface O3 with notable correlation and reduced bias and errors. However, the best-fit simulations for surface O3 were obtained by increasing spatial resolution and using a large number of vertical levels to reproduce vertical transport phenomena and the formation of reservoir layers. Using the optimal configuration obtained in the evaluation, three characteristic events have been described: recirculation (REC) episodes and northern and southern advection (NAD and SAD, respectively) events. REC events were found to produce the highest O3 due to the reduced ventilation associated with low wind speeds and the contribution of reservoir layers formed by vertical transport of O3 formed near the surface in the previous days of the event. NAD events, usually associated with higher wind speeds, present the lowest ground-level O3 concentrations in the region. During SAD episodes, external contributions along with low wind speeds allow O3 to increase considerably but not as much as in REC events because steady southerly winds disperse local emissions and hinder the formation of reservoir layers.
- Article
(16796 KB) - Full-text XML
-
Supplement
(2134 KB) - BibTeX
- EndNote


Ozone (O3) is formed in the troposphere by the interaction of gaseous precursors like nitrogen oxides (NOx) and volatile organic compounds (VOCs) in the presence of sunlight. Much attention has been given to this secondary air pollutant in the last decades due to the variety of negative effects on health, ecosystems, crops, climate and materials associated with it (see review by Monks et al., 2015, and references therein).
The oxidative effect of O3 generates inflammation of airways. Increases in morbidity and mortality and chronic alterations of the cardiovascular and cerebrovascular systems have also been associated with exposure to O3 (WHO, 2006, 2013a, b). Tropospheric O3 is also harmful for vegetation, generating leaf symptoms, reduced growth, senescence, defoliation and reducing crop productivity (Paoletti, 2006; WGE, 2013). Damage to construction materials like plastics, surface coatings and rubber due to O3 has been documented (Lee et al., 1996; Screpanti and Marco, 2009). Moreover, O3 in the troposphere acts as a greenhouse gas with positive global radiative forcing (IPCC, 2013).
It is estimated that 98 % of the urban population in Europe in 2016 was exposed to excessive concentrations of tropospheric O3 according to the World Health Organization (WHO) guideline values, a steady proportion since 2000 (EEA, 2018). However, it is the Mediterranean basin where the most acute episodes are registered (Millán et al., 1997, 2000; Sicard et al., 2013; Querol et al., 2016). In the Iberian Peninsula (IP), located at the western Mediterranean basin, the intense solar radiation, high temperatures and lack of precipitation in spring and summer, associated with persistent anticyclonic conditions, favour the formation of O3 in the area and the accumulation in rural and suburban regions (Escudero et al., 2014, 2016; Querol et al., 2016; Massagué et al., 2019). The emissions of precursors from anthropogenic sources in the Mediterranean basin and the surrounding regions are considerable, especially in some densely populated areas. In addition to that, the amount of biogenic VOCs emitted in southern Europe is considerably higher than in central and northern Europe (Seco et al., 2011). Moreover, during the frequent biomass burning episodes in summer, air-quality problems associated with tropospheric O3 are aggravated (Tressol et al., 2008). In particular, the complex orography of the IP with mountain ranges running parallel to the coast intersected by river basins that penetrate towards the inner continental areas and elevated plateaus in the centre of the peninsula help air masses to recirculate and age under the influence of sea and mountain breezes that develop when synoptic circulation is inhibited by the presence of the Azores high (Millán et al., 2000; Gangoiti et al., 2001; Valverde et al., 2016; Querol et al., 2017). Previous studies also suggest that local strategies designed to meet NO2 ambient air-quality standards may have caused an increase of urban O3 that, in turn, causes an increase in the oxidative capacity of Madrid's atmosphere by increasing OH and NO3 radicals (Saiz-López et al., 2017).
In recent years, several comprehensive summer campaigns with intensive measurements of surface and vertical profiles of O3 concentrations and its precursors have been undertaken near the two main conurbations in Spain: Barcelona (2015, 2017 and 2018) and Madrid (2016) (Querol et al., 2017, 2018; Reche et al., 2018; Carnerero et al., 2018). The main objective of these campaigns was to interpret the phenomenology of high-O3 and ultrafine particles' episodes in Spain.
Another essential objective of retrieving data from these intensive campaigns is related to the validation and optimisation of chemical transport models (CTMs). These models constitute an essential tool for analysing O3 behaviour with high spatial and time resolution, providing air-quality forecasts and supporting the design of policies. This includes the study of the NOx–VOC sensitivity (Sillman, 1999; Sillman and West, 2009) essential for proposing and evaluating potential mitigation measures. Regional CTMs have been used to investigate O3 pollution in Spain in several studies. Most of these studies aimed to describe short-term (rarely exceeding 5 d) pollution events (Toll and Baldasano, 2000; Jiménez et al., 2005, 2006; San José et al., 2005; Carvalho et al., 2006; Valverde et al., 2016; Pay et al., 2018) and, in some cases, to discuss the effectiveness of potential mitigation strategies (Palacios et al., 2002; Soret et al., 2014). Despite these efforts, work is still needed to evaluate the impact of changes in the vertical configuration of CTMs, especially in the Mediterranean region where the atmospheric dynamics in summer is characterised by complex recirculation processes with effective vertical exchange (Millán et al., 1997, 2000; Gangoiti et al., 2001; Borge et al., 2010; Querol et al., 2017, 2018). The lack of an appropriate representation of the vertical variability of O3 has been recognised as one of the shortcomings of the CTMs and in consequence a major challenge in the future development of the models (Hess and Zbinden, 2013; Monks et al., 2015). Moreover, it is strongly recommended to combine modelling with observations because this will bring knowledge from both sources together and permit adequate evaluation procedures of the model outputs (Canepa and Builtjes, 2017).
Air-quality model results vary at different resolutions especially due to the resolution of emissions and the description of the driving meteorology (Fenech et al., 2018). Some authors have found that the impact of higher horizontal resolutions in O3 simulations is more sensitive to the resolution of emissions than to meteorology (Valari and Menut, 2008). Moreover, finer resolution results in less dilution of emissions but also in differences have been found in the O3–NOx interaction (Valari and Menut, 2008; Stock et al., 2014).
In the Iberian Peninsula, the use of fine grids (in the order of 1–5 km× 1–5 km) has been found to be beneficial in the context of complex terrains where mesoscale processes acquire importance for interpreting production and transport of O3 (Toll and Baldasano, 2000; Jiménez-Guerrero et al., 2008). In coastal areas, with complex topography, high-resolution simulations have been generally employed with good results (Carvalho et al., 2006; Jiménez et al., 2006; Gonçalves et al., 2009). Moreover fine grids have been recommended for describing O3 variability especially in urban and industrial areas (Jiménez et al., 2006; Baldasano et al., 2011). In general, the use of finer-resolution simulations in the Iberian Peninsula generally implies benefits in the O3 description such as the improvement in correlation and reduction in bias and errors (Jiménez et al., 2006). Less importance has been given to the vertical resolution mostly because the vertical O3 profile evaluation of CTM is difficult due to the lack of experimental vertical O3 data. In complex domains in the Iberian Peninsula the models may not reproduce O3 concentrations due to a poor representation of mesoscale flows and layering and accumulation of pollutants (Gonçalves et al., 2009). In general, it has been demonstrated that incrementing vertical resolution would help to resolve meteorological phenomena (Carvalho et al., 2006) and would also offer a more realistic vertical exchange between the boundary layer and the free troposphere (Jiménez et al., 2006).
Making use of the results on the O3 episodes' phenomenology from the aforementioned field campaign in Madrid in July 2016, we were able to assess and optimise LOTOS-EUROS CTM v2.0 (Manders et al., 2017) for simulating O3 in this region. Five configurations combining different meteorological input data and vertical structures were employed after identifying these two aspects as key factors for the capability of the model for reproducing O3 levels. We simulated the entire month of July 2016 in accordance with the experimental campaign with a spin-up period of 24 h. The aim of this comparison was to elucidate the optimal configurations for operating with LOTOS-EUROS in the region but also to identify relevant factors to set up other CTMs used in this region.
Moreover, employing the optimal configuration of the modelling system, we discuss the phenomenology of tropospheric O3 in the Madrid air basin (MAB) for the study period. This was done by analysing simulated fields of meteorological variables and pollutants with special emphasis on the vertical variability to test the importance of the up–down transport of O3 in the region.
2.1 Study area
The Madrid metropolitan area (MMA) is a densely populated area with more than 5 million inhabitants. According to Salvador et al. (2015) and Borge et al. (2014), the main sources of pollutants in the region are road traffic, residential heating (which maximise their emissions in winter), a busy airport and minor contributions from industry.
The MMA is located in the centre of the MAB and lies on an elevated plateau (∼700 m above sea level, a.s.l.) in the middle of the IP (Fig. 1). The climate in the area is continental Mediterranean with warm and dry summers and cold and also dry winters. The main orographic features surrounding the basin are, around 120 km to the south of the MMA, the Toledo mountains (altitudes of up to 1600 m a.s.l.) with an E–W axis and the Guadarrama range (maximum heights of 2400 m a.s.l.) which runs diagonally from south-west to north-east, 50 km to the west and north of the MMA. The Guadarrama range is part of the central system that extends until the Ebro valley and, together with the western flank of the Iberian range, delimits a channel to the north-east along the Henares valley (Fig. 1). As a result of this configuration, the circulation in the Madrid basin shows a dominant SW–NE direction (Plaza et al., 1997). Under low-gradient synoptic conditions, the combination of the strong convective conditions and the blocking effect of the mountain ranges induces an important vertical development of the boundary layer and mesoscale recirculation. During the night, north-easterly winds prevail over the basin and, after dawn, the eastern slopes of the Guadarrama range are progressively warmed up, causing a clockwise turning of wind to an east and south direction during the day finalising with a SW component in the late afternoon. The drainage flows at night-time re-establish the north-easterlies. These events are commonly referred to as recirculation (REC) episodes. The presence of the Azores high- or low-pressure systems over the Atlantic in front of the Iberian Peninsula generate advection of Atlantic air masses from the north (we will refer to these as northern advective, or NAD, events) or from the south (southern advective, or SAD, events).
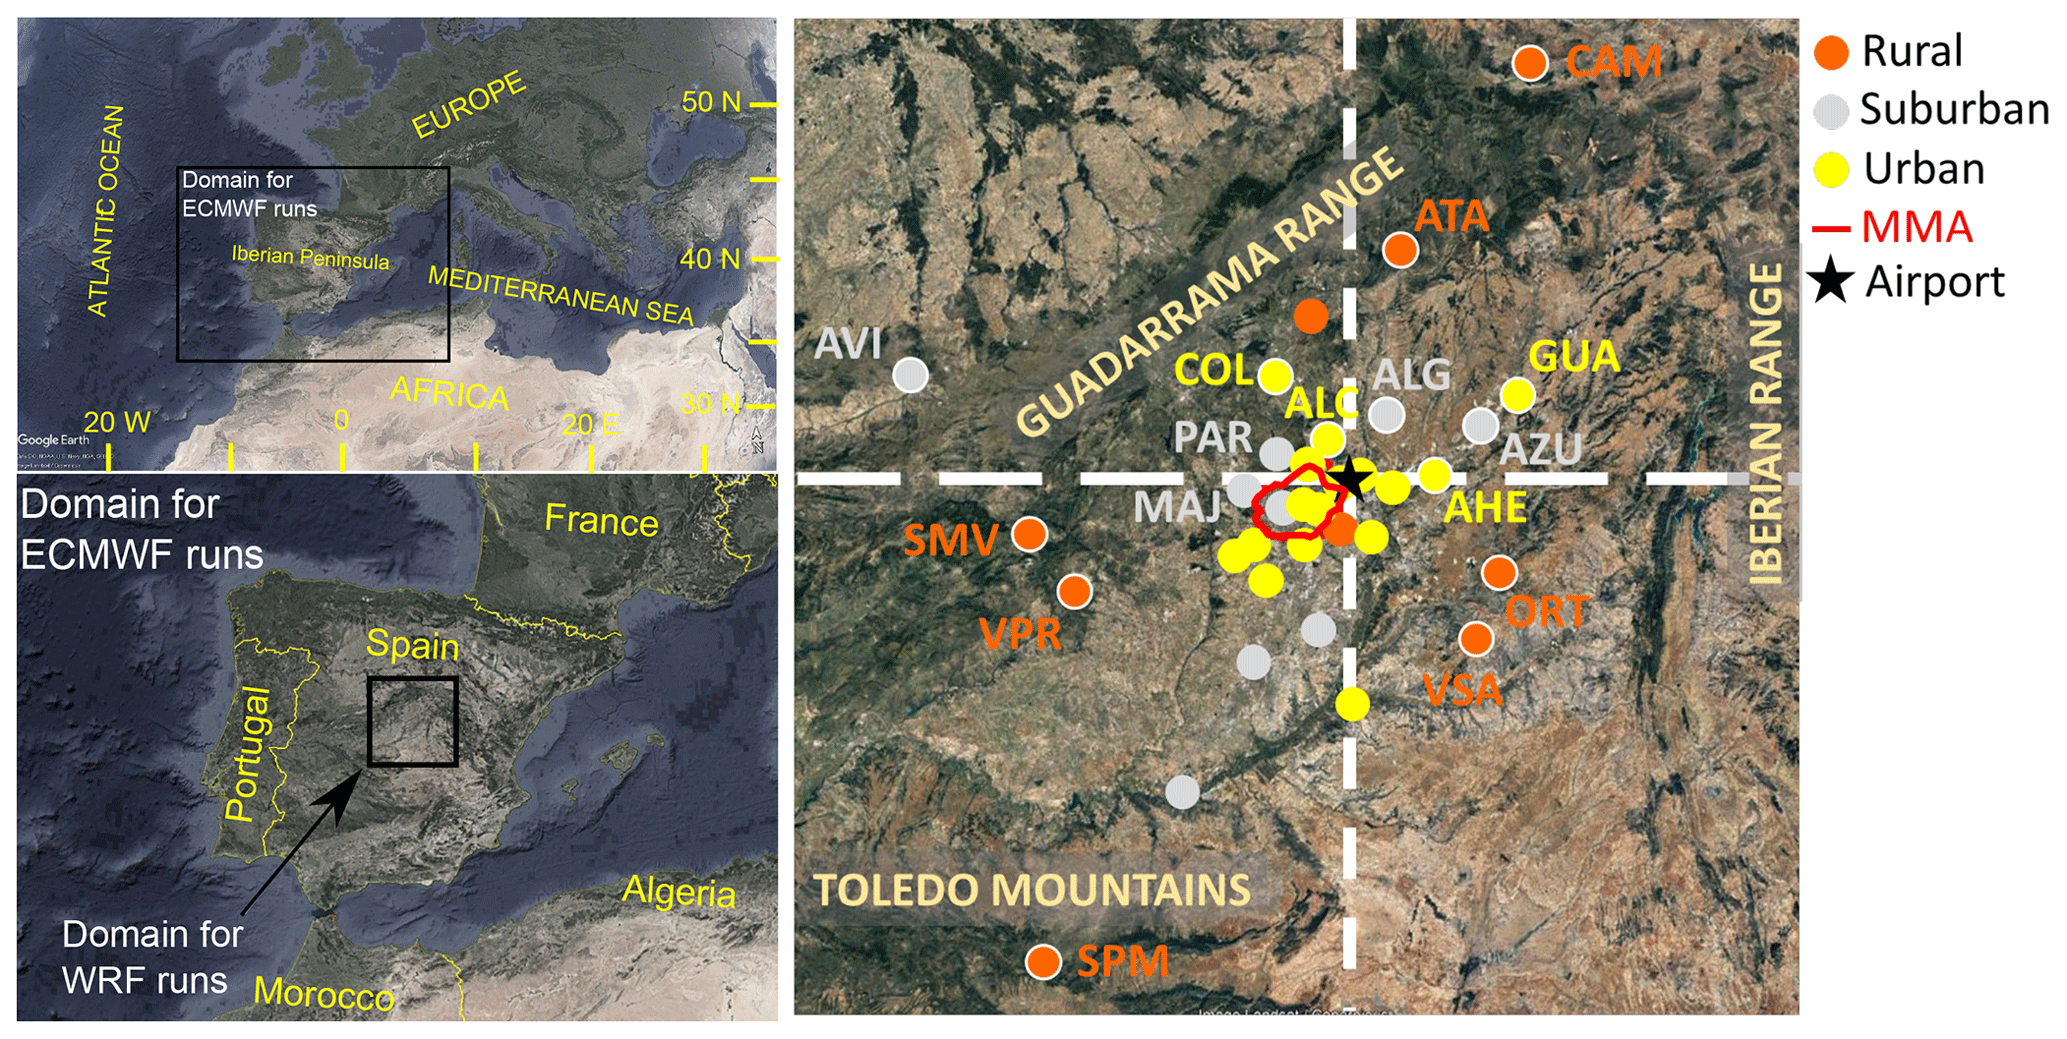
Figure 1Situation maps of the Iberian Peninsula and the MAB with the indication of the domains used for the simulations with LOTOS-EUROS. In the map located on the right side, the selected set of monitoring stations used for illustrating O3 variability in different sectors of the region is shown. Stations' codes: Alcalá de Henares (AHE), Alcobendas (ALC), Algete (ALG), Ávila (AVI), El Atazar (ATA), Azuqueca de Henares (AZU), Campisábalos (CAM), Colmenar Viejo (COL), Guadalajara (GUA), Majadahonda (MAJ), Orusco de Tajuña (ORT), San Martín de Valdeiglesias (SMV), San Pablo de los Montes (SPM), El Pardo (PAR), Villa del Prado (VPR), and Villarejo de Salvanés (VSA). The white dashed lines indicate the E–W and N–S cross sections presented in figures from Sect. 3.2. Basemaps obtained from the US Department of State Office of the Geographer and Landsat/Copernicus; © Google 2018; © GeoBasis-DE/BKG 2009; Data SIO, NOAA, US Navy, NGA, GEBCO.
2.2 The LOTOS-EUROS model
The 3-D CTM LOTOS-EUROS v2.0 and its previous versions have been extensively used in the past for air-quality studies, including NOx (Schaap et al., 2013; Vlemmix et al., 2015), SO2 (Barbu et al., 2009) and particulate matter (PM) (Schaap et al., 2004; Manders et al., 2009; Timmermans et al., 2017). In particular, tropospheric O3 has been the scientific target in different studies carried out with successive versions of LOTOS-EUROS. It has been employed in health-related studies (van Zelm et al., 2008), and, more recently, Beltman et al. (2013) applied LOTOS-EUROS to simulate the response of tropospheric O3 in Europe to a 5 % shift from crop- and grassland into poplar plantations used for biomass production, while Hendriks et al. (2016) tested the response to a decarbonisation scenario in the continent. Although LOTOS-EUROS has been generally employed in a continental domain (mainly in Europe), a sensitivity study to regional changes in emissions in three areas of Europe (Poland, the Po Valley and Flanders) was also performed by Thunis et al. (2015). In addition, LOTOS-EUROS has also been used in a number of intercomparison studies with other CTMs for the simulation of O3 (Hass et al., 1997; van Loon et al., 2007; Cuvelier et al., 2007; Vautard et al., 2007; Solazzo et al., 2012; Im et al., 2015), showing a satisfactory performance. Finally, regarding air-quality predictions, LOTOS-EUROS participates in the CAMS (Copernicus Atmosphere Monitoring Service) ensemble (Curier et al., 2012), which offers operational forecasts for NO2, O3 and PM.
2.3 Model experimental design
A detailed description of the 2.0 version of LOTOS-EUROS can be found in its reference guide (Manders et al., 2016), where all technical issues (processes, schemes, etc.) are described and referenced (accessible at https://lotos-euros.tno.nl/, last access: 15 November 2019). In this section, we provide a brief description focusing on the most relevant aspects for this study.
Initial sensitivity studies were performed with the base configuration (configured similar to the operational forecasts that are part of the CAMS regional ensemble as presented in Marécal et al., 2015) to test the response of the model to changes in the deposition velocity of O3 because night-time dry deposition has been suggested as a factor that could strongly influence the ability of CTMs to simulate tropospheric O3 (Stevenson et al., 2006; Monks et al., 2015). The standard dry deposition velocity, calculated by the resistance approach (Manders et al., 2016), was multiplied by a factor of 1.25 and 0.75 to perform sensitivity tests. The results (not shown here) reflected a minimal effect of this parameter on O3 concentrations in the chosen domain and period, so deepening in this direction was discarded.
As shown in Table 1, two major aspects were modified in the set of five configurations: the meteorological input data and the vertical structure of the model. We fed LOTOS-EUROS with operational data from the reanalysis of the European Centre for Medium-Range Weather Forecast (ECMWF) model (Flemming et al., 2009) retrieved with a spatial resolution of 7 km×7 km. A second meteorological gridded dataset was obtained with the Weather Research and Forecasting Model (WRF; Skamarock et al., 2008) with a resolution of 1 km×1 km over a square domain of side 220 km centred on the city of Madrid (Fig. 1). Data from WRF simulations with similar configurations have been previously used to drive air-quality simulations over the IP and, in particular, in the Madrid area (Borge et al., 2008, 2014). In this case, the WRF model was run on a three-nested-domain configuration as shown in Fig. S1 in the Supplement. Additional information about the WRF model configuration is provided in Table S1 in the Supplement.
Table 1Summary of the LOTOS-EUROS v2.0 model runs and settings performed for this work.
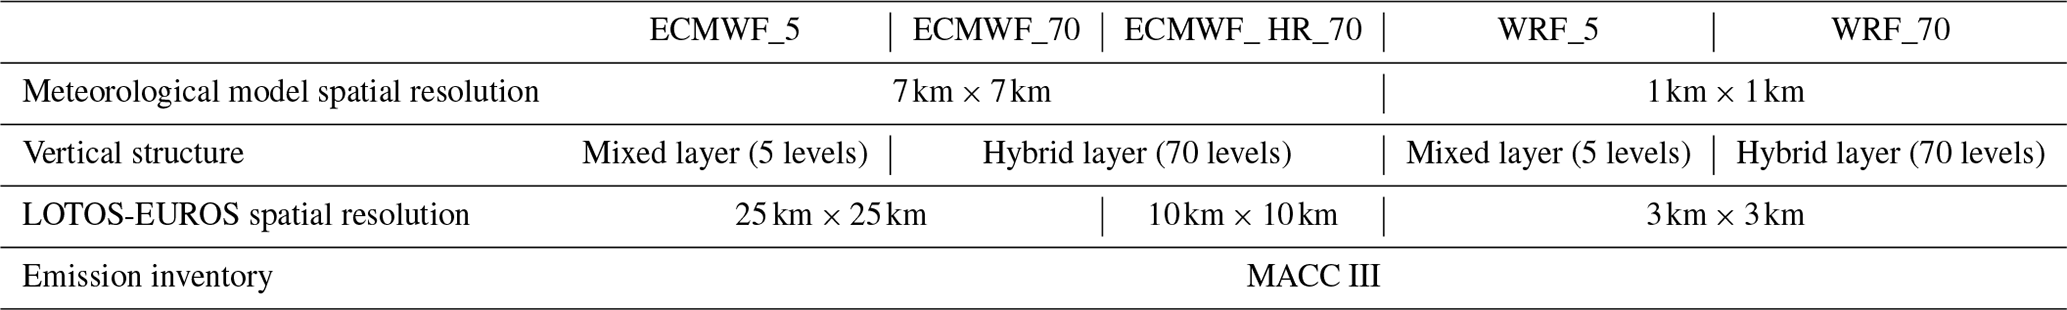
For the vertical structure, we compared the standard five-level mixed-layer configuration (Manders et al., 2017) with a hybrid-layer multilevel scheme. This version uses the lowest 70 layers of the 137 hybrid sigma-pressure layers used by ECMWF for the operational meteorological forecasts in 2016. In such a vertical coordinate system, model layers are defined by pressure boundaries that follow surface pressure at lower altitudes but slowly evolve into fixed pressure levels in the stratosphere (Eckermann, 2009).
Finally, the MACC III emission inventory (reference year 2011) has been used for all set-ups, and initial and boundary concentrations were taken from global simulations produced by and used in CAMS services, as described in Marécal et al. (2015). These include concentrations of the most important trace gases and aerosols.
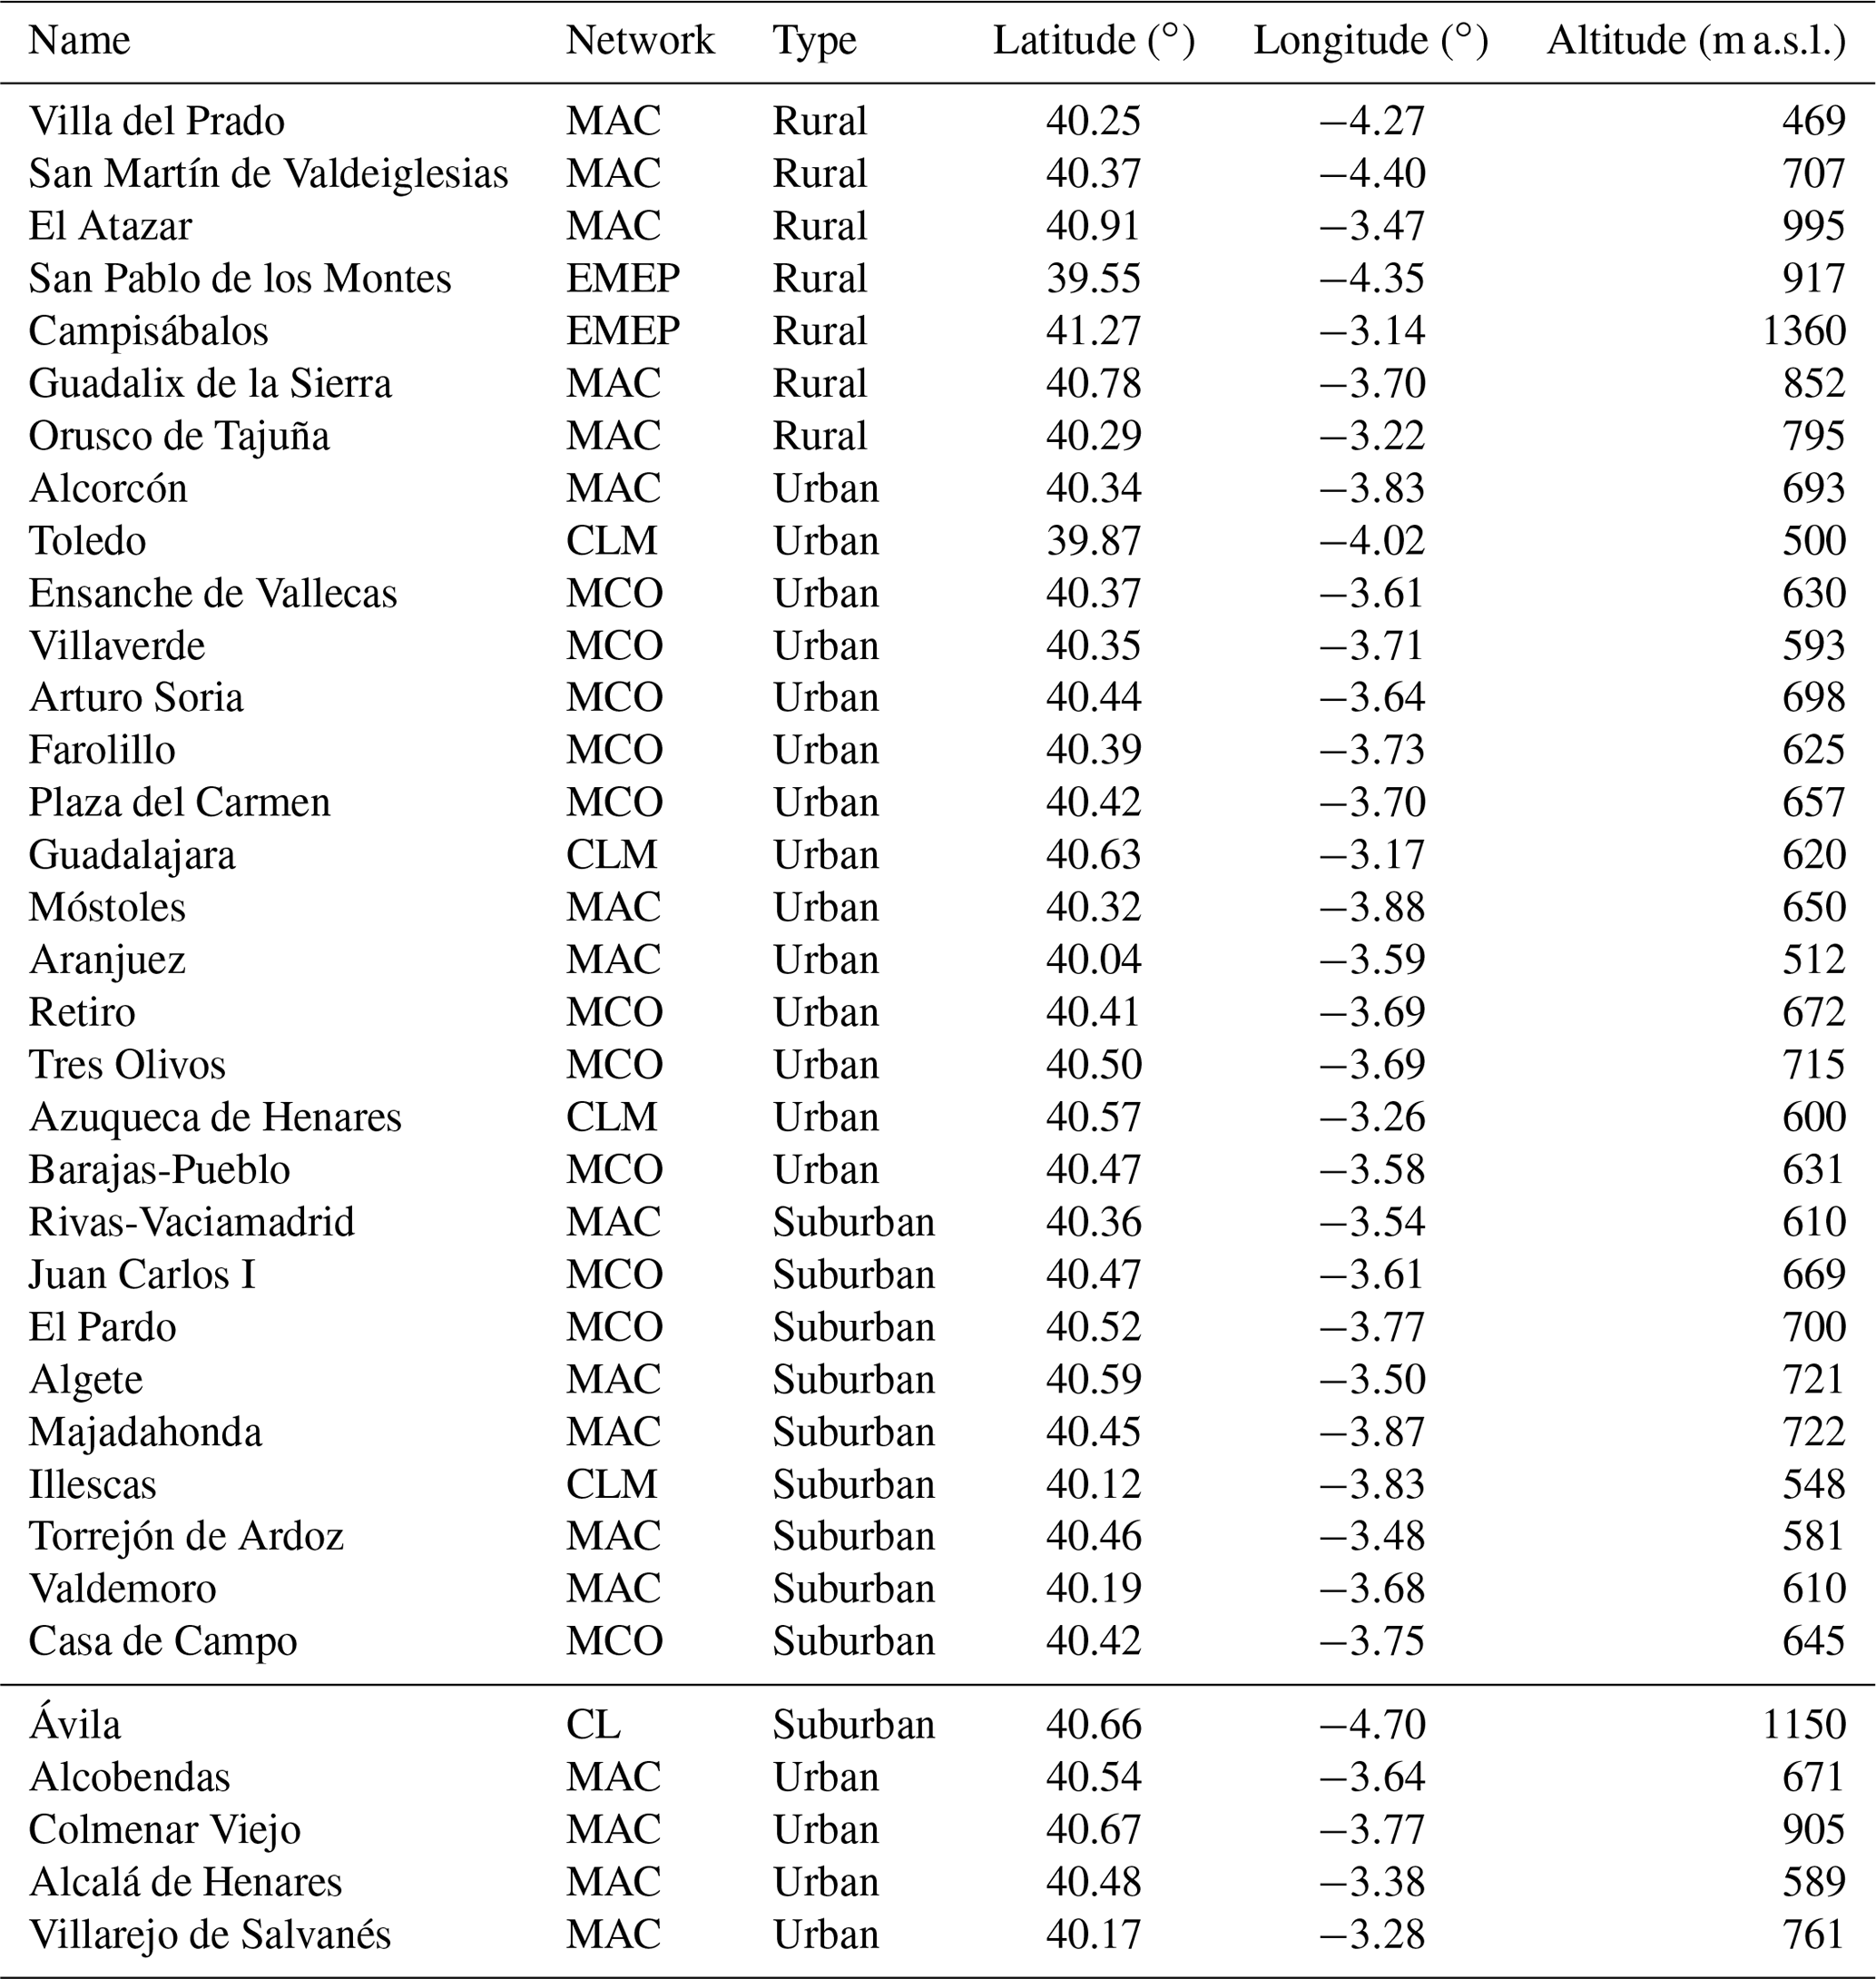
Table 2Details of the air-quality monitoring stations selected for this study. With the exception of the last five, which are classified as traffic sites, all the stations included in this table are located in background locations. Network codes: MCO, Madrid City Council; CL, Castilla y León region; CLM, Castilla–La Mancha region; MAC, Madrid region; and EMEP (European Monitoring and Evaluation Programme).
2.4 Monitoring data
Hourly O3 data for the simulation period (July 2016) were collected from 35 air-quality monitoring sites (17 urban, 9 suburban and 9 rural) located in the MAB (Table 2 and Fig. 1) and its boundary region. Traffic stations were in general discarded for the model evaluation due to their limited spatial representativity, although four traffic sites were also employed. In spite of belonging to different air-quality networks (Table 2), all the O3 monitors are based on ultraviolet photometry according to EN 14625:2012, which is the reference technique for automatic monitoring of O3 established in the European Directive 2008/50/EC.
Several previous studies used modelling techniques to analyse intense short-term O3 episodes (Palacios et al., 2002; San José et al., 2005) and, more specifically, to evaluate the impact of specific environmental policies in the Madrid region (Soret et al., 2014) or the influence of sectoral emissions (Borge et al., 2014; Valverde et al., 2016; de la Paz et al., 2016; Pay et al., 2018). The present work contributes with an evaluation and optimisation of LOTOS-EUROS CTM in the region incorporating a high degree of vertical resolution. The extended simulation period of this study (1 month) is suitable for characterising the typical O3 episodes occurring in the area in summer.
3.1 Model performance
3.1.1 Ground-level O3
The results from the outputs from the five runs were assessed following the suggestions provided by Borrego et al. (2008) on the evaluation of the quality of model simulations. These authors stated that Pearson's correlation coefficient (r), the fractional bias (FB) and the normalised mean square error (NMSE) were the most relevant statistical parameters to be analysed for O3 simulations with CTM. Table 3 shows a coloured grid indicating the values of r, FB and NMSE obtained in the comparison between the observations from background monitoring stations and the simulated O3. The colour scale is independent for each parameter and serves as an indication of the agreement between observations and model predictions.
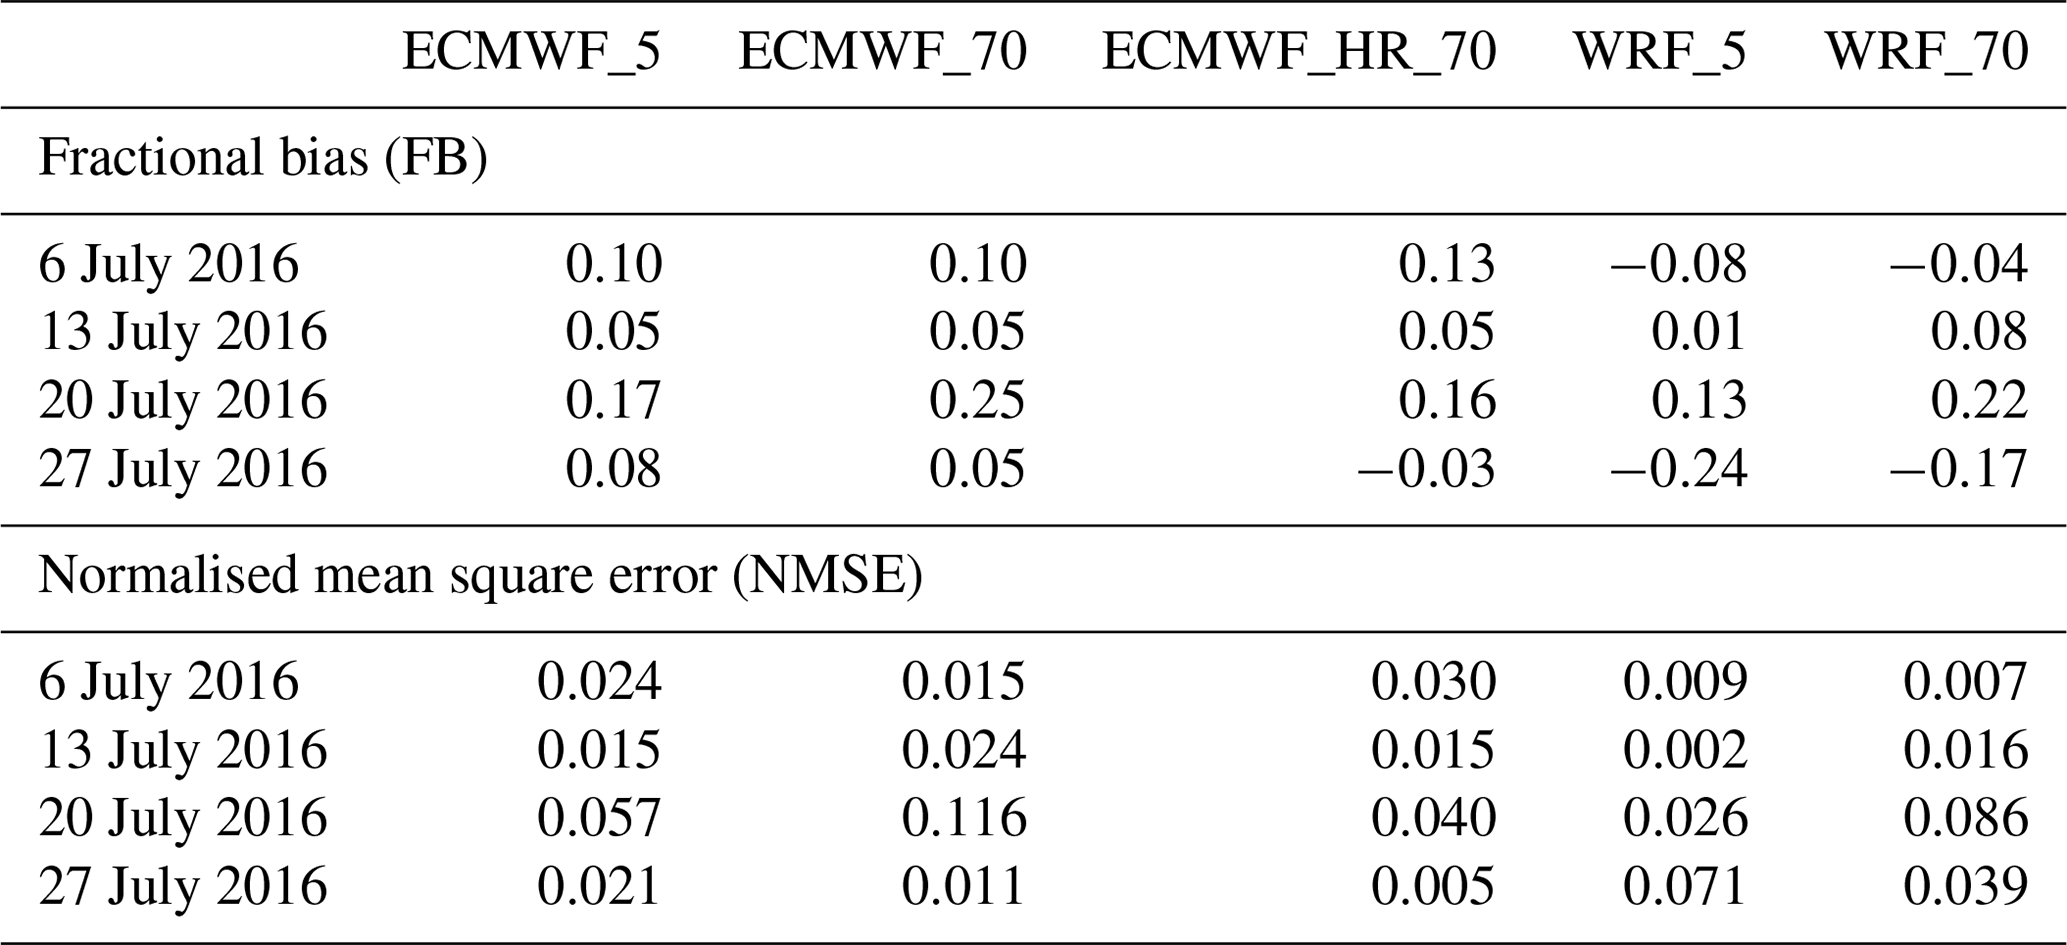
Table 3Values of the Pearson correlation factor (r), fractional bias (FB) and normalised mean standard error (NMSE) of the comparison of the five LOTOS-EUROS simulations with observations of hourly O3 data from 35 background monitoring stations located in the MAB. Colours illustrate the model agreement from blue (worst) to red (best).
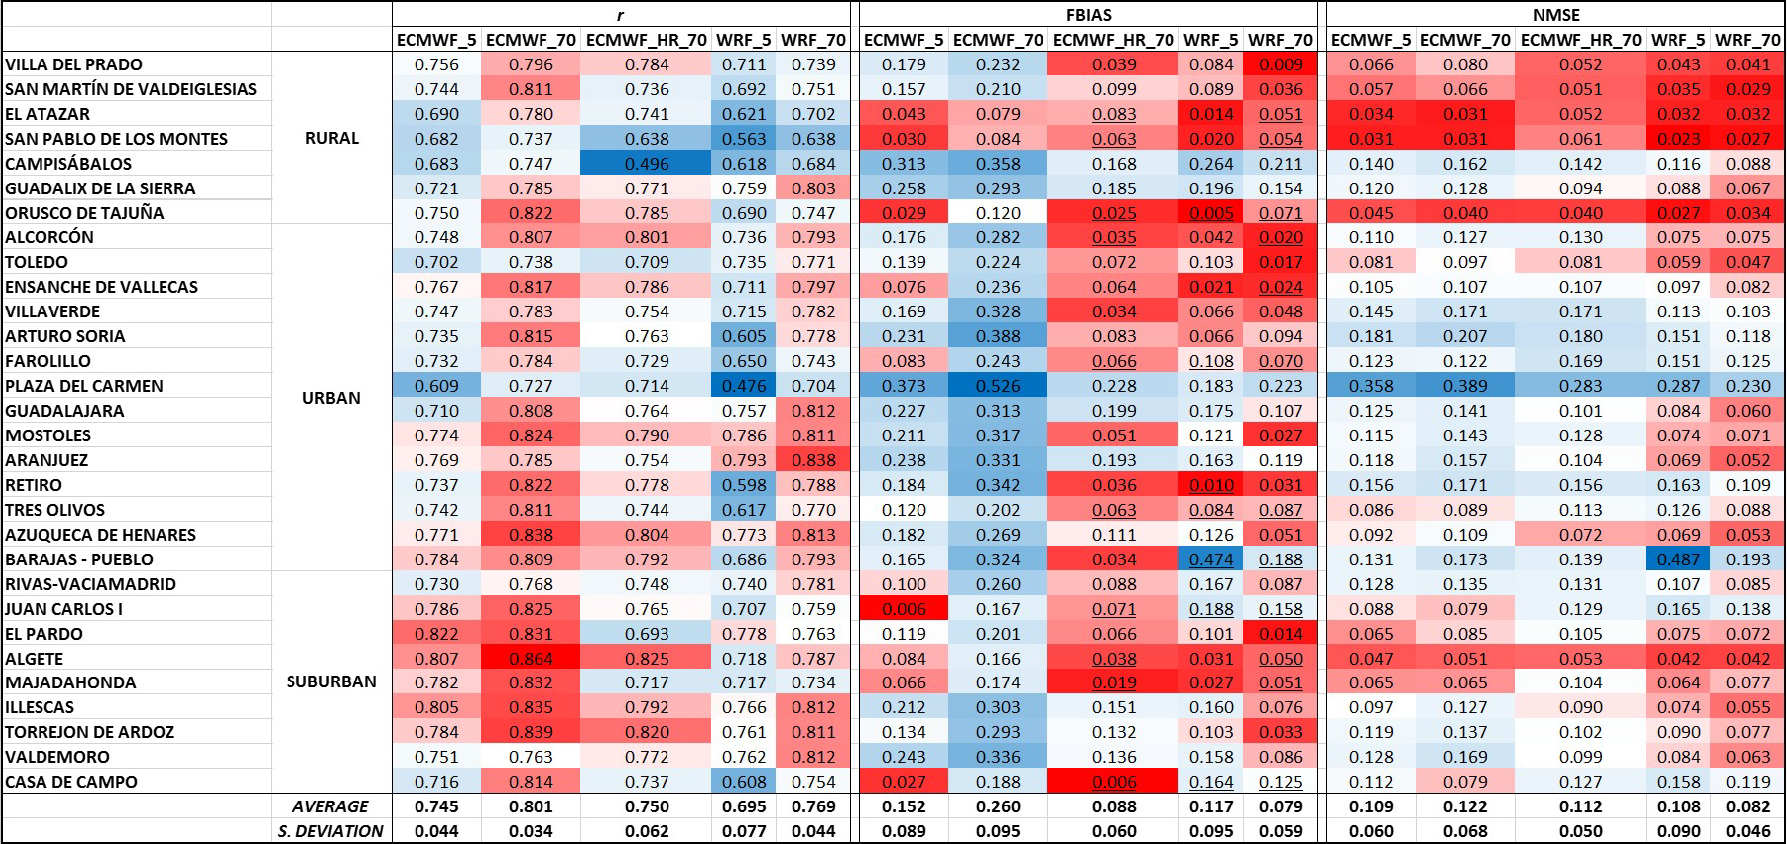
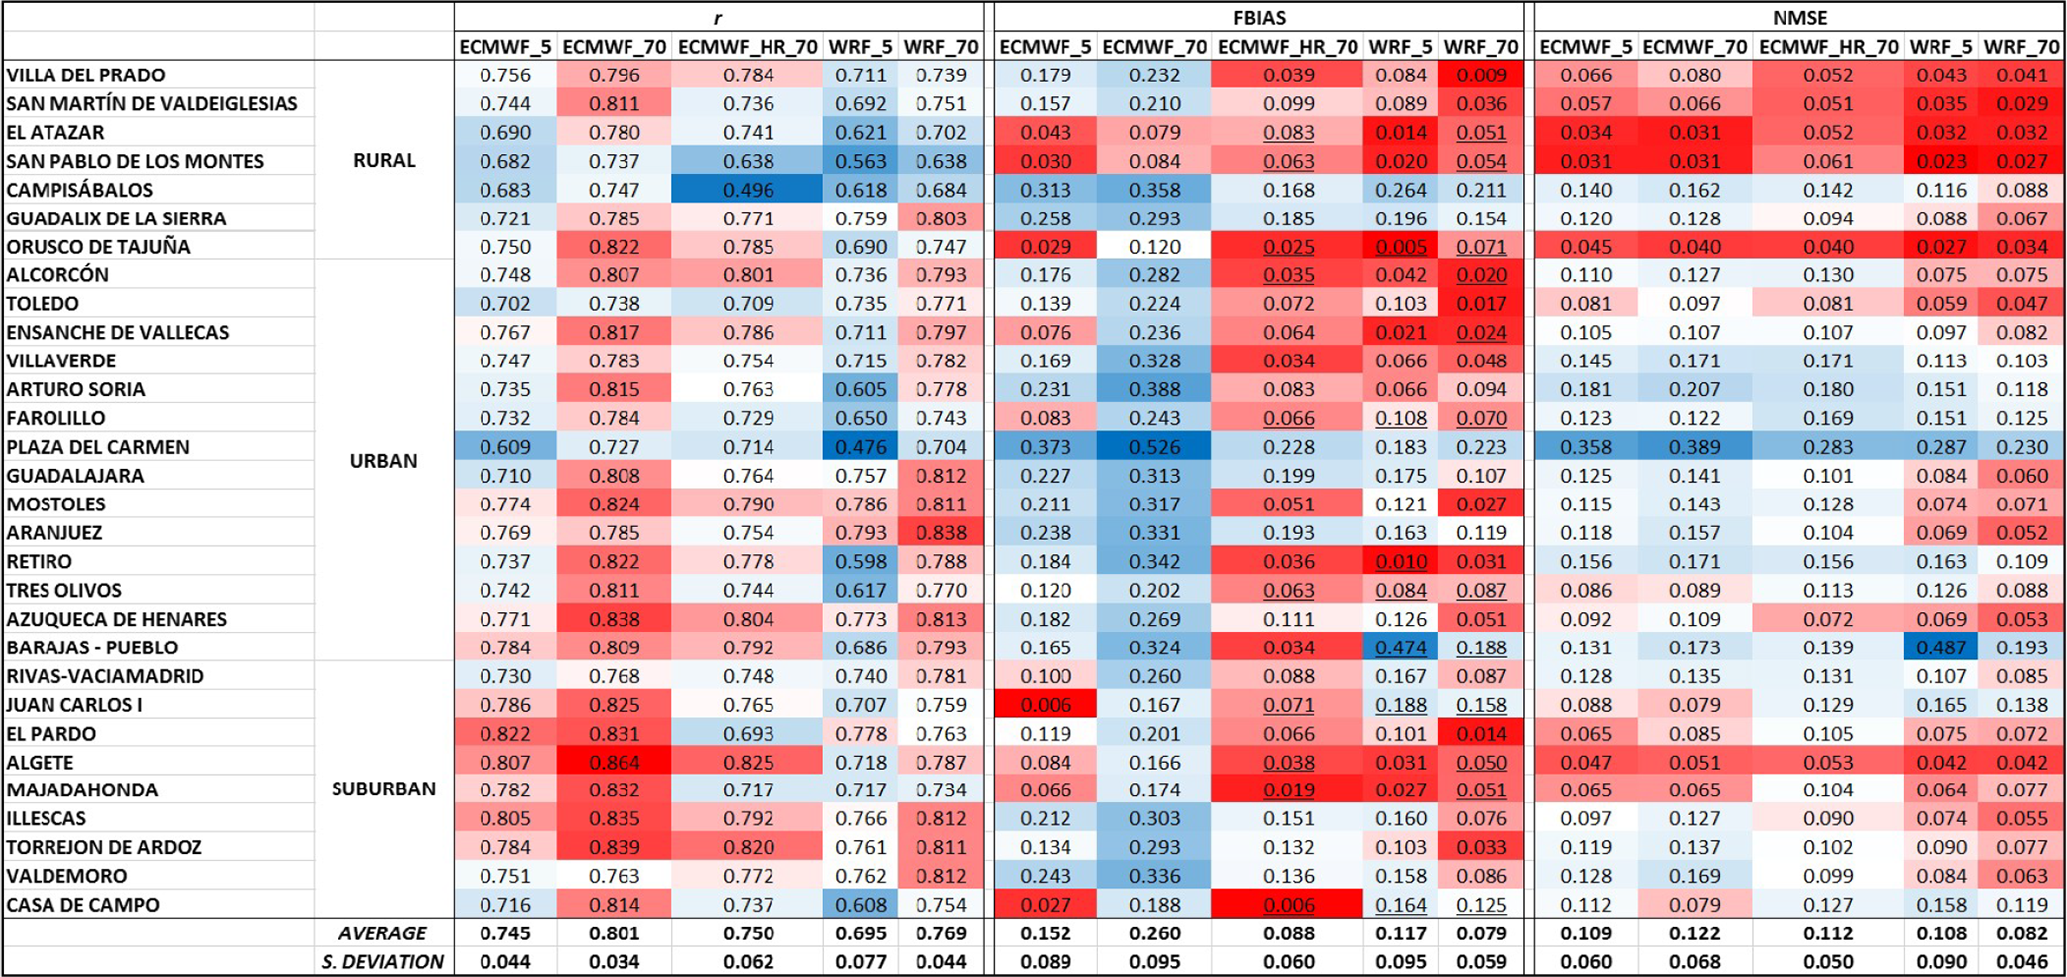
All five configurations presented good correlations with observations with an average r of 0.752, although lower values were obtained for the five-layer schemes (0.695±0.077 and 0.745±0.044) than for the configurations using the hybrid-layer scheme (0.750±0.062–0.801±0.034). Among these multiple-layer-scheme simulations, the one showing the best r is ECMWF_70, which was the configuration with the coarser spatial resolution for LOTOS-EUROS among the three. Therefore, regarding the degree of correlation for multilayer configurations, increasing horizontal resolution to very fine grid sizes in the photochemical model does not improve results (provided that no changes are implemented in the emission inventory). This is known in meteorological modelling as the “double penalty” issue (Mass et al., 2002) and occurs when evaluating simulations using point observations. The high-resolution runs may be penalised twice, for not capturing the occurrence of the event and also for not predicting the right location of the event, while a low-resolution simulation can only fail in predicting the event.
LOTOS-EUROS tends to moderately overestimate ground-level O3 concentrations varying widely in the five set-ups. It was clear that deviations with respect to observations declined with the use of a higher number of vertical levels and finer spatial resolution. The absolute values of the averaged FB for WRF_70 (0.079±0.059) and ECMWF_HR_70 (0.088±0.060) were substantially lower than those of the other three configurations (0.260±0.095–0.117±0.095). Clear improvements were observed using finer spatial resolution in LOTOS-EUROS (either WRF simulations or ECMWF_HR_70), while ECMWF_5 and, especially, ECMWF_70 presented systematic but moderate overestimations (Fig. S3). In consequence, the best configurations for adjusting the model bias were WRF_70 and ECMWF_HR_70.
A major reason for the overestimation detected for ECMWF runs with coarser spatial resolution was associated with an excessive O3 formation in the noon hours of the day in situations of low wind speed as shown in Fig. 2. This plot shows the correlation between the model bias and the modelled wind speed in the location of El Retiro (see location in Table 2) in Madrid for the five runs. In the plots corresponding to ECMWF_5 and ECMWF_70 runs we observe systematic positive bias especially in the period 14:00–20:00 UTC when the formation is strong, although it only spiked with low wind speed. This feature was not so marked in the three remaining configurations, and, in particular, in the two WRF runs the bias values were randomly distributed around zero. The ECMWF_HR_70 run showed a subtler systematic overestimation during daytime, but the correlation with low wind speeds was not observed in this case. Analysing the night-time period (00:00–06:00 UTC) we detect that the systematic overestimation was only present in the ECMWF_70 execution.
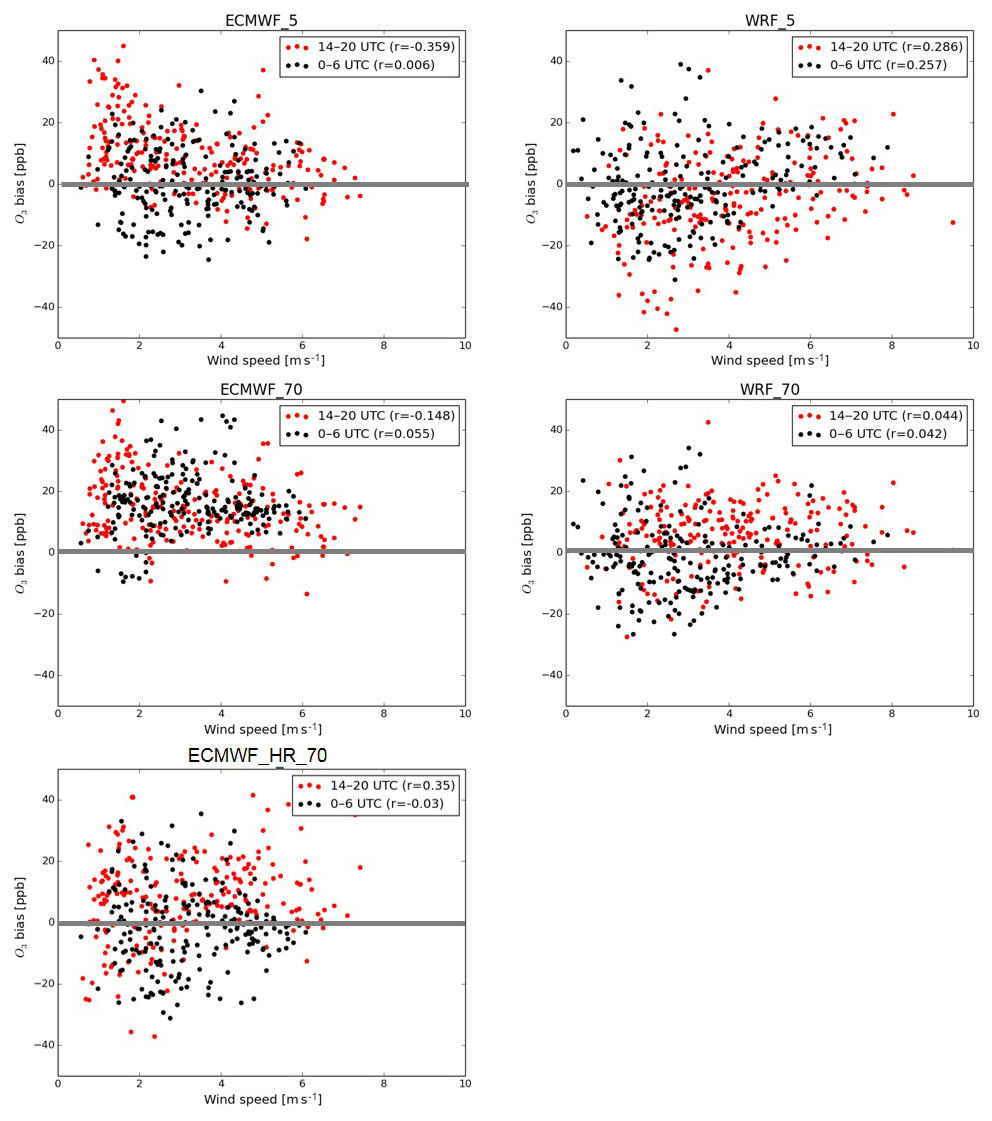
Figure 2Correlation plots between the LOTOS-EUROS bias of surface O3 and simulated wind speed at the station of Retiro disaggregated in 2 d periods: 00:00–06:00 and 14:00–20:00 UTC.
Regarding the simulation errors quantified via the NMSE (Fig. 3), the results were satisfactory because the values of this parameter remained low for the five configurations (means ranging between 0.082±0.046 and 0.122±0.068 with the WRF_70 run showing the best performance). The relevant information extracted from NMSE values in Fig. 3 was that the errors of the model were consistently lower in rural areas (0.063±0.038) than in suburban (0.096±0.033) and urban (0.135±0.077) sites. This might be an effect of the simulation of the interaction between O3 and NOx, which acquires more relevance as a source of errors in the vicinity of traffic sources. Other authors (de la Paz et al., 2016) suggest that the use of an urban canopy model (not used in this simulation) improves model predictions in densely built areas by reducing the overestimation of wind speed.
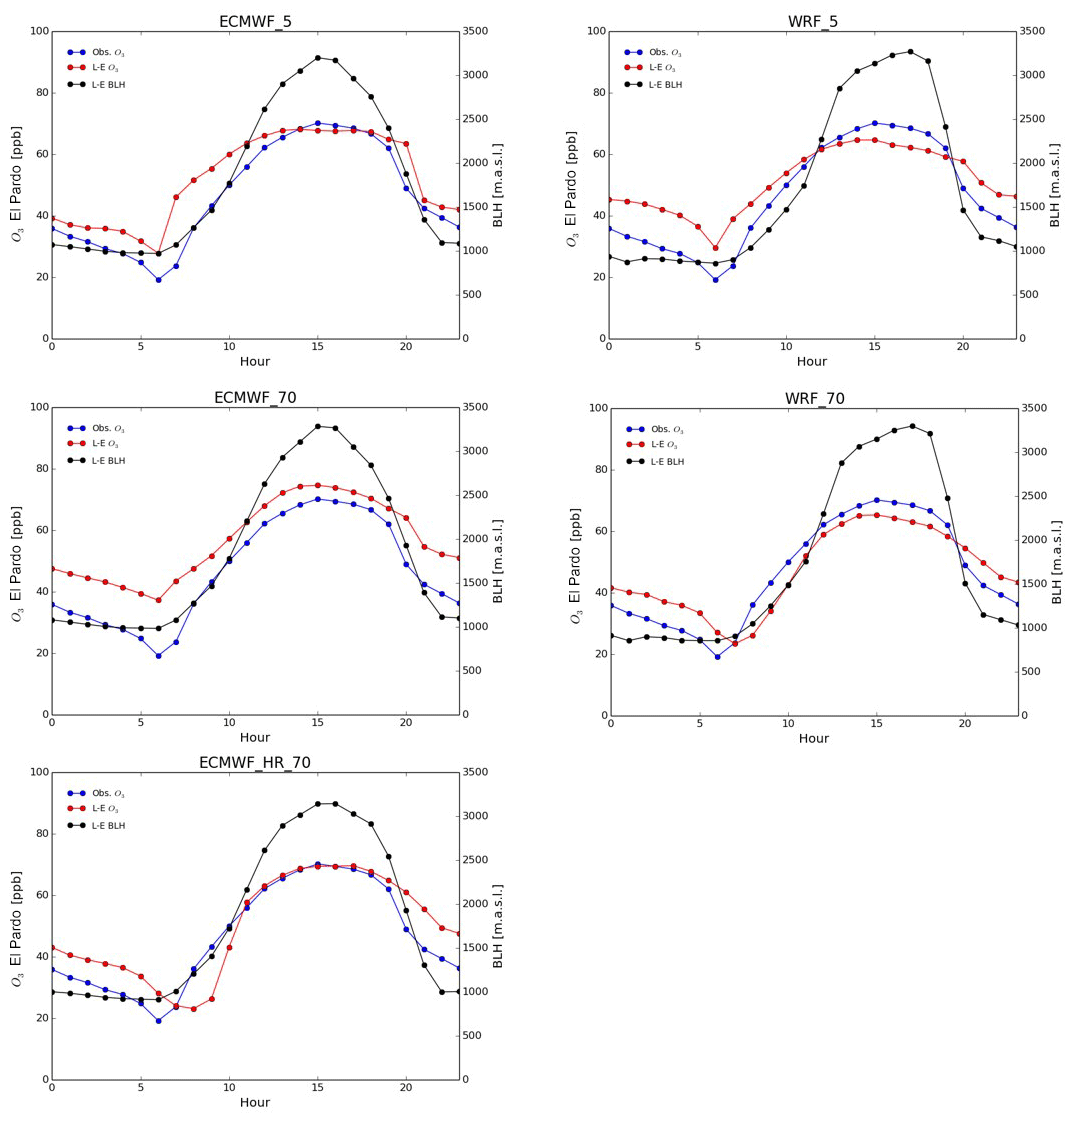
Figure 3Simulated average diurnal cycles obtained from the five LOTOS-EUROS configurations compared with the mean cycle from the observations in the El Pardo background station. The modelled evolution of the boundary layer height is also shown.
Systematic features characterised the modelled mean daily cycles of the 35 stations (Fig. 3 shows the plots for the El Pardo site as a typical example). The daily cycles obtained with the simulations performed with the mixed-layer scheme of five levels (ECMWF_5 and WRF_5) presented a sharp increment in O3 concentrations from 06:00 to 07:00 UTC which was not present in the simulations performed with the hybrid scheme of 70 levels. In these runs, the morning increment of O3 after the rush hour was delayed 1 or 2 h (WRF_70 and ECMWF_HR_70 runs) and clearly smoothed. The observations reflected that the timing of the increase was better represented in the mixed-layer-scheme runs, although the increase was excessively abrupt. The occurrence of this steep increase in the concentrations in the executions performed with the mixed-layer scheme coincided with the first steps of the boundary layer development. In the mixed-layer scheme, a rise of the boundary layer leads immediately to complete mixing of NOx emitted at the surface over the (increased) boundary layer and thus limits titration of ozone; in the 70-layer schemes, however, the mixing over the boundary layer seems to take place more gradually. A more extensive validation including other tracers than the chemically active ozone should provide insight into which scheme performs better under which conditions, and it should preferably lead to better characterisation of the vertical diffusion.
3.1.2 O3 vertical profiles
The evaluation of CTMs in the vertical direction has always been a difficult task due to the small number of high-resolution vertical observations to compare with. In this work, data from O3 free soundings launched from Madrid airport at 12:00 UTC every 7 d on 6, 13, 20 and 27 July 2016 were used for this purpose. Comparisons between the vertical profiles of modelled O3 with the five different set-ups and the observations are presented in Fig. 4. The corresponding profiles of wind direction and speed (modelled data are taken from the input meteorological datasets) can be found in the Supplement (Fig. S4). As suggested by Querol et al. (2018), the enrichment of O3 in the lower troposphere during episodes without ventilation is high as a consequence of the intense photochemical formation and the development of convective circulations. This typically results in vertical profiles in which O3 concentrations are relatively high near the surface up to 2000 m a.s.l. at midday soundings in Madrid, as shown also here in Fig. 4a and d. During venting episodes, the more intense surface dispersion explains why O3 vertical profiles have lower values in the mixing layer (Fig. 4b and c).
The event of 27 July was characteristic of an accumulation scenario with high concentrations near the surface, while on 13 July (a typical venting event), O3 in the lower levels was moderate and increased with altitude as described above. These two profiles were correctly simulated by most runs. However, the modelled profiles for 6 and 20 July showed overestimation in the lower levels with respect to observations, and for the 20 July case, all the high-resolution simulations overestimated the observed values. In Fig. S4, we can also check how the input meteorological data used to feed the simulations (ECMWF and WRF fields) closely reproduced the wind profiles obtained during the soundings of those 4 d both on speed and direction. Because of the complexity of the vertical mechanisms, further research should be conducted to investigate the causes of this mismatch in some events.
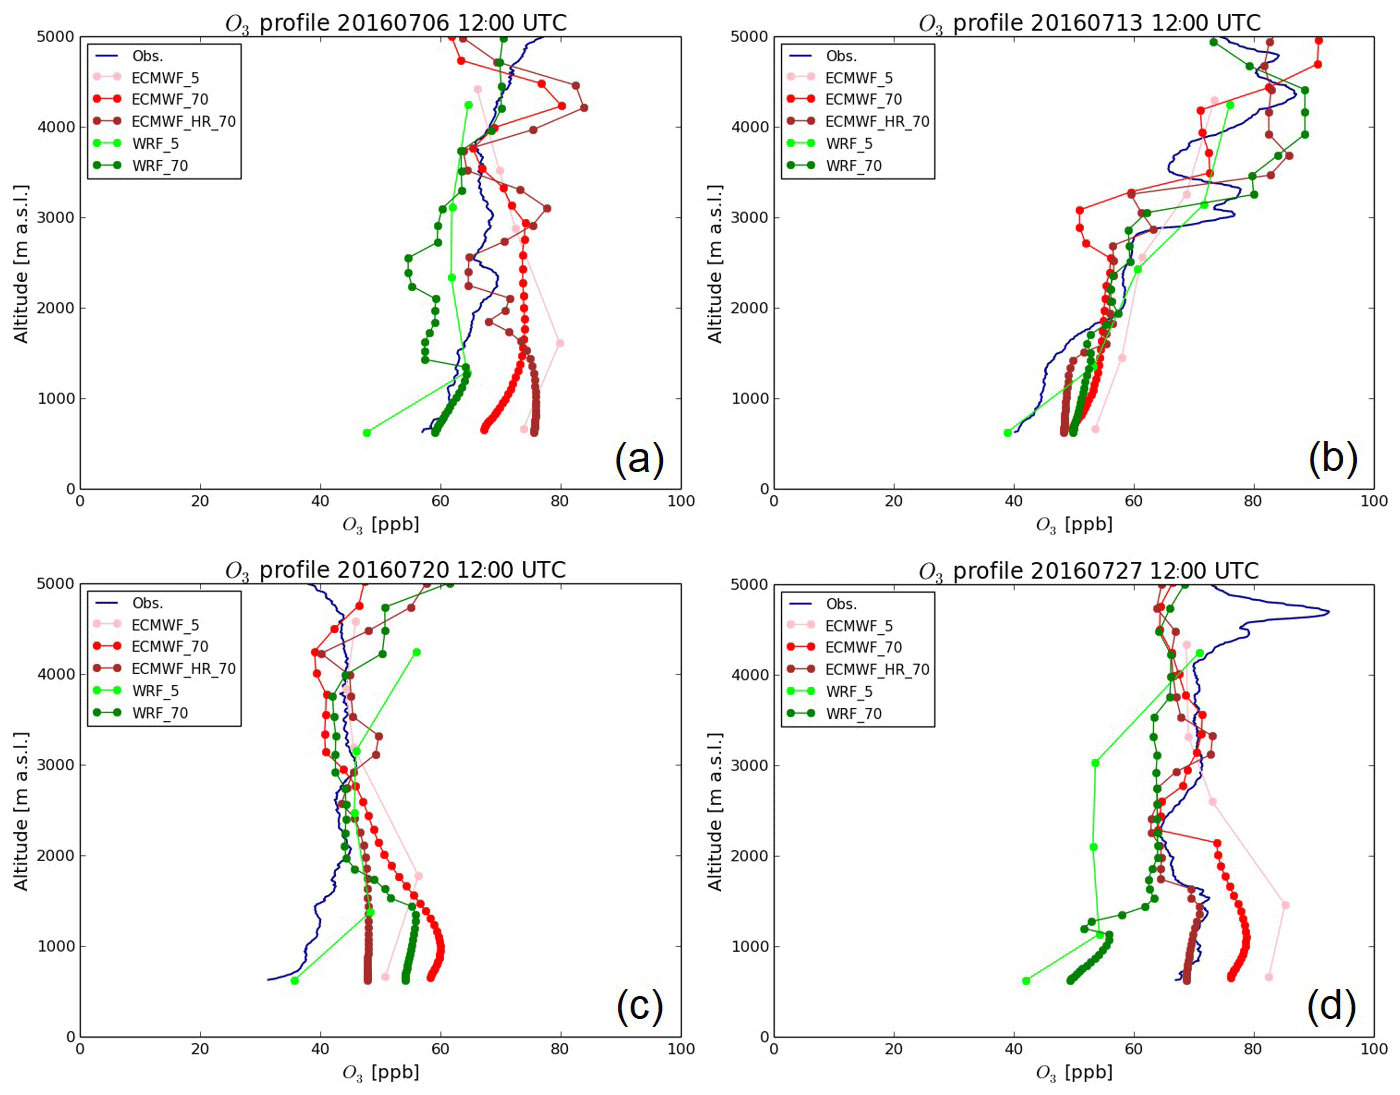
From the qualitative perspective, the first obvious conclusion was that a larger number of vertical levels in the model considerably improved the capability for capturing the vertical gradients of O3 concentrations, with the exception of the lowest level on 20 July. However, even in the simplest vertical scheme (five layers), the model was able to reproduce the general vertical trends. A particular meteorological scenario was present during 13 July. We can observe two O3 layers centred around 3000 and 4300 m a.s.l. The two multilayered WRF runs captured these two layers at, approximately, the correct altitudes, although the 3000 m layer was not as marked as in the observations. The ECMWF runs also presented these two features but were displaced in altitude by around 200–300 m with respect to observations.
In all the WRF_5 runs and on 27 July WRF_70 simulations a steep drop in surface concentrations was noticed. This is probably associated with the emission model configuration, the fine spatial resolution of the runs (3 km×3 km) and the vertical mixing in these set-ups. The O3 soundings were released from Adolfo Suárez Barajas Airport, which is one of the major airports in Europe with more than 53 million passengers and 470 t of goods transported in 2017 (http://www.aena.es/, last access: 15 November 2019) as well as significant NOx emissions. The emission model employed by LOTOS-EUROS allocates at the surface level all the air traffic emissions in the grid cell where the airport is located. These emissions, added to those produced by road traffic, lead to a grid cell that has the highest NOx emissions in the domain. As a consequence, and given the fine size of the grid cells in the WRF runs, O3 levels were excessively reduced compared with reality in the aforementioned cases. Regarding ECMWF runs, the coarser spatial resolution did not allow observation of this feature because the modelled emissions from the airport were distributed on a larger surface.
Quantitatively, the model generally showed the ability to reproduce the same order of magnitude of the concentrations observed in the O3 soundings at all altitude levels. The values of the statistical parameters that indicate the quality of the simulations (FB and NMSE) of the vertical profiles of O3 are shown in Table 4, where generally satisfactory values can be observed with poorer results especially for 20 July. The FB showed a majority of positive values indicating overestimation, although, in most cases, it was moderate (the range of averages for the five configurations was −0.5 to 0.11). The NMSE data in Table 4 support this conclusion because the average errors were small (0.023–0.042).
Table 4FB and NMSE of the comparisons between LOTOS-EUROS simulations of vertical profiles of O3 and data from four O3 soundings performed in Madrid in July 2016.
Summarising, the configuration that presented the best overall performance among the five tested in the previous sections was WRF_70, so it was employed for interpreting the variability of O3 in the MAB during July 2016.
3.2 Interpretation of O3 in the MAB in July 2016
According to the dominant circulation over the MAB, three different episodes were distinguished, and, with the aid of the model outputs, the basic features of the three events were described. Figure S2 shows the location of the selected monitoring stations used to characterise the behaviour of surface O3 in the different sectors of the MAB.
3.2.1 Recirculation events (REC)
These events correspond to the pattern sketched by Plaza et al. (1997) in which wind direction turns clockwise during the day, aided by the effect of the blocking effect of the Guadarrama range, while Querol et al. (2018) described that the mixing layer growth at midday was reduced favouring vertical recirculation at the eastern slopes of the Guadarrama range (see Sect. 2.1). In July 2016 four REC periods were identified: 1–6, 8–11, 15–17 and 25–28. To illustrate the main features of REC episodes, the period 15–17 July will be used as an example (Figs. 5 and 6). A complete pattern of simulated fields of O3, wind and relative humidity (RH) for July 2016 can be consulted in Fig. S5.
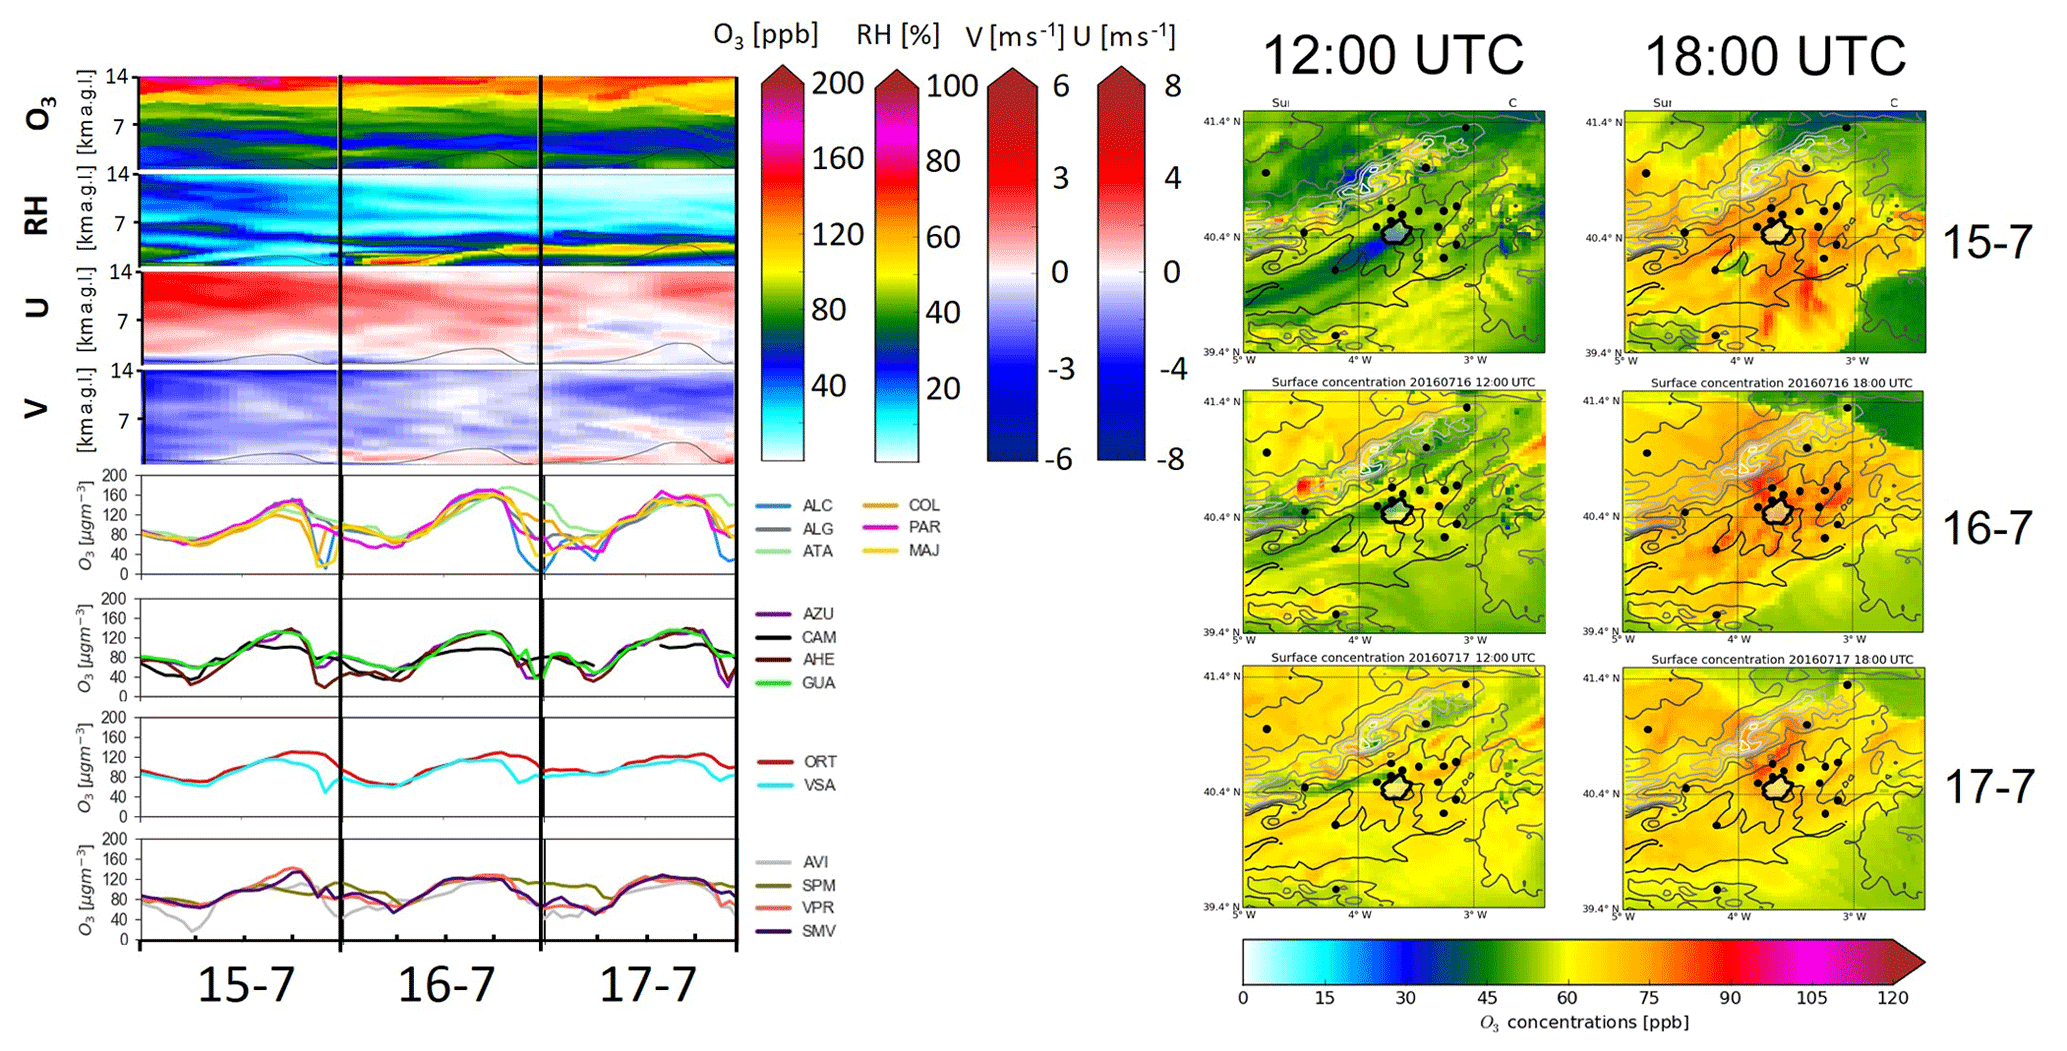
Figure 5Left: hourly O3 concentrations recorded at selected monitoring stations in the MAB and simulated fields of O3 concentration, relative humidity, and U and V components of wind for the period 15–17 July 2016 over the centre of the MAB. Right: surface O3 concentration maps obtained from LOTOS-EUROS simulations at 12:00 and 18:00 UTC of 15, 16 and 17 July 2016. See Fig. 1 to consult the location and typology of the selected stations.
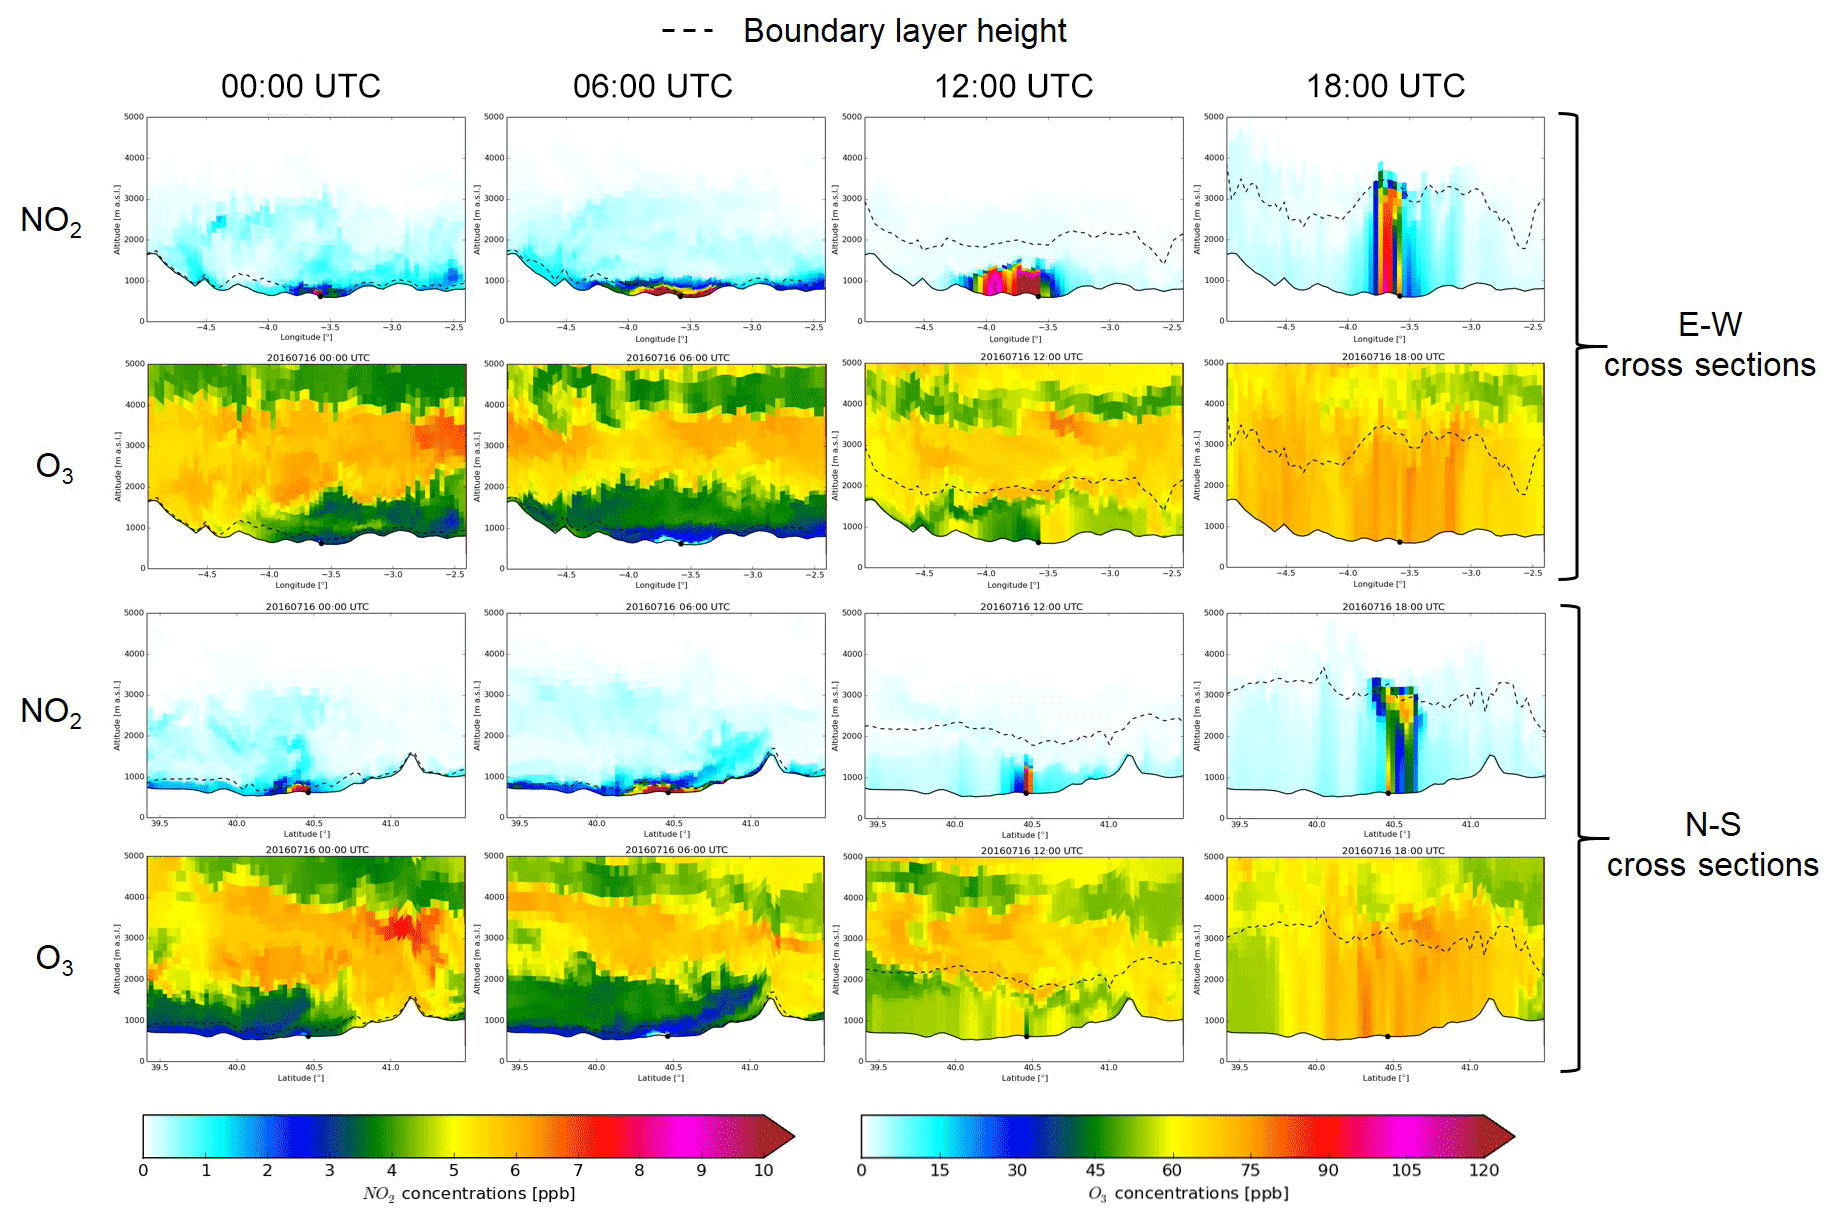
Figure 6Simulated longitudinal and latitudinal vertical cross sections of NO2 and O3 for 16 July 2016 (WRF_70 run). See Fig. 1 to consult the latitudinal and longitudinal cuts.
Surface wind speeds registered during REC episodes were weak (Figs. 5 and S5), and the change in direction associated with recirculation is observed. However, despite the local circulation, air masses remain inside the basin during REC days aided by a relatively thin mixing layer at 12:00 UTC (Fig. S4).
A stable band of high RH centred at around 4000 m is observed in Figs. 5 and S5, which can be associated with the evapotranspiration caused by the intense heating registered during these events. The presence of a high-altitude trough located to the west of the IP during the 3–6 July REC period induced moist south-westerlies at altitude resulting in the development of convective clouds in the evenings (Fig. S5).
Surface O3 concentrations generally reach high values at the central time of the day during REC episodes (Fig. 5). During the 17 REC days registered in July 2016, 37 exceedances of 180 µg m−3 were recorded in all the monitoring stations in the study area. The sectors suffering the greatest impact of O3 are the W–N belt of the MMA (MAJ, PAR, COL, ALC and ALG) and, more episodically, the Henares valley (AZU, AHE and GUA) or the south-east of the basin (ORT and VSA). Occasionally, when SW winds in the evening reached sufficient intensity (for example on 16 July), the O3-enriched air masses reach rural stations located in the north-east of the basin (ATA and CAM) late in the day. LOTOS-EUROS surface concentration maps show that at 12:00 UTC O3 begins to rise, reaching the maximum concentrations around 18:00 UTC. Time series of O3 also support this conclusion because the highest O3 levels are observed in the evening (Fig. 5).
To study the three-dimensional variability of O3 during a typical REC event, Fig. 6 presents longitudinal and latitudinal cross sections of simulated O3 and NO2 for 4 different hours during 16 July. The use of NO2 plots allows observation of the evolution of fresh emissions from the Madrid conurbation in the course of the day. This figure illustrates the strong photochemical formation of O3 followed by the accumulation during a typical REC episode. In the first hours of the day, a very shallow boundary layer combined with the stagnant conditions allows locally emitted precursors to accumulate inside the basin. Ozone is then effectively eliminated by titration with NO coming mainly from traffic emissions. This explains the steep drop in O3 time series during the rush hours (Fig. 5), with the exception of rural stations far from the Madrid conurbation like SPM, which showed a more stable behaviour in their O3 concentrations.
From the simulation results, we can interpret the evolution of O3. At 18:00 UTC of 16 July, we can see how O3 levels increased drastically, and the boundary layer depth grew up to 3500 m a.s.l. aided by convection at 18:00 UTC. Normally, REC events show higher planetary boundary layer (PBL) heights in the evening. Figure 6 shows how the strong convection during REC events injected ground-level pollutants at high altitudes during the late afternoon and the evening reaching up to 3500 m a.s.l. as illustrated in the NO2 plots. When the night-time stable boundary layer forms after sunset, air masses with high O3 that originated near the surface during the previous day were decoupled and remained in the residual layer at altitudes ranging between 2000 and 4000 m a.s.l., forming reservoir layers (00:00 and 06:00 UTC cross sections in Fig. 6) which can fumigate the following day. These reservoir layers can also be observed as a relatively thin band at an altitude of 2000–4000 m a.s.l. during every night of the REC period (Figs. 5 and S5).
3.2.2 Northern advective events (NAD)
We will refer to NAD events as those during which the dominant situation consisted of the advection of air masses coming from the north over the MAB. During July 2016, the following two periods matched that description: 12–14 and 22–24.
During NAD periods, surface wind is channelled following the NE–SW axis parallel to the Guadarrama range resulting in prevailing north-easterlies in the lowest tropospheric layers while in the upper levels the dominant component is north-west (Figs. 7, 8 and S5) and often associated with the passage of cold fronts from the Atlantic. Winds are generally stronger than in REC events, which implies a renovation of air masses and lower temperatures.
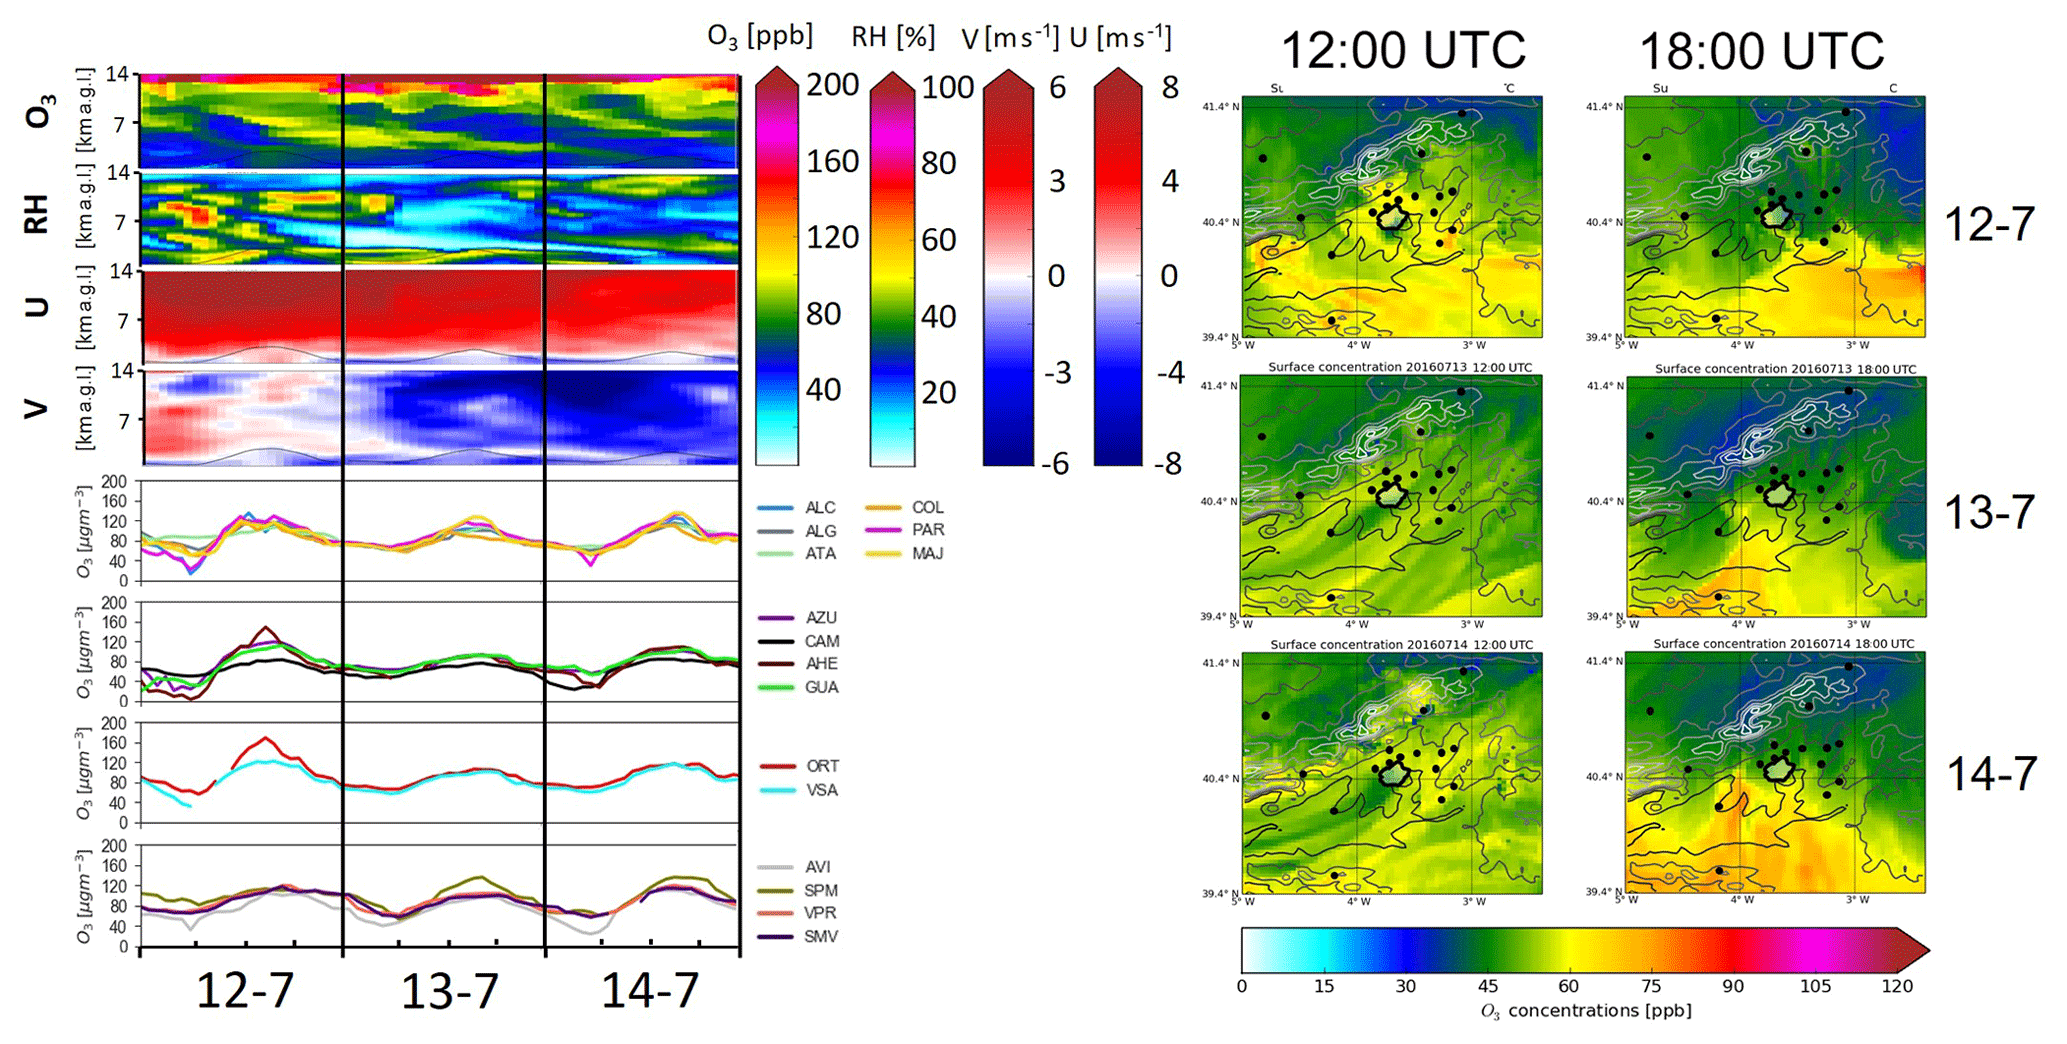
Figure 7Left: hourly O3 concentrations recorded at selected monitoring stations in the MAB and simulated fields of O3 concentration, relative humidity, and U and V components of wind for the period 12–14 July 2016 over the centre of the MAB. Right: surface O3 concentration maps obtained from LOTOS-EUROS simulations at 12:00 and 18:00 UTC of 12, 13 and 14 July 2016 in the MAB. See Fig. 1 to consult the location and typology of the selected stations.

Figure 8Simulated longitudinal and latitudinal vertical cross sections of NO2 and O3 for 13 July 2016 (WRF_70 run). See Fig. 1 to consult the latitudinal and longitudinal cuts.
Humidity during NAD events is conditioned by the arrival of air masses off the Atlantic, which are generally moist. During the period 12–14 July, a band of high RH (in the order of 50 %–60 %) that reaches an altitude of approximately 3000 m a.s.l. can be observed (Fig. 7). Moreover, a diagonal band of low RH can be observed descending from an altitude of 8000–9000 m a.s.l. at around 10:00 UTC on 12 July, reaching the surface by midday of 14 July. This structure was associated with layers of high O3 detached from the lower stratosphere as shown in Fig. 7. These low-RH stratospheric intrusions were observed also on 22 and 23 July during the third NAD episode (Fig. S5).
The northern winds during NAD episodes push surface air masses with high O3 towards the south and south-west of the MAB. However, ground-level O3 concentrations are lower than those observed during REC events. The highest O3 levels were registered on 12 July at the south-eastern part of the domain (AHE and ORT) with concentrations below 160 µg m−3. Meanwhile, the maximum concentrations in the rest of stations that day fell below 130 µg m−3, which is consistent with LOTOS-EUROS surface concentration maps for 12 July (Fig. 7). The next 2 d, winds intensified and veered north, resulting in concentrations that did not exceed 130 µg m−3 along with noteworthy O3 increments in the rural station of SPM located in the southernmost part of the basin, in accordance with LOTOS-EUROS surface concentration maps of 13 and 14 July (Fig. 7). Only one hourly exceedance of 180 µg m−3 was registered during the 6 NAD days in all the air-quality stations in the study area in July 2016.
Figure 8 shows how increased advection reduced the residence time of polluted air masses over the region, resulting in lower and less variable O3 concentrations throughout the day as observed in observations presented in Fig. 7. Moreover, the formation of reservoir layers during NAD episodes was less common due to the lower convection, relative to that of REC cases presented before.
It is also remarkable in Fig. 8 that above 3000–3500 m a.s.l. O3 concentrations were very high (in the order of 100 ppb according to the model). This was associated with the stratospheric intrusion of very dry air described above. LOTOS-EUROS reproduced this stratospheric intrusion that was detected from data obtained with free and tethered O3 soundings for the same period during a field campaign (Querol et al., 2018). The actual impact of this stratospheric intrusion on surface levels remains unclear. In the referenced paper, the authors estimate a possible but limited impact of the intrusion on surface levels assuming that the boundary layer could exceed the 3000 m a.s.l. during the day. As shown in Fig. 8, LOTOS-EUROS predicts that the maximum altitude of the boundary layer according to LOTOS-EUROS reached its maximum values of 2500–2700 m a.s.l. limited by the wind ventilation, so, probably, the impact on the surface should be low (if any) in this case.
3.2.3 Southern advective events (SAD)
Southern transport implies the arrival of warm air masses, sometimes, coming from northern Africa (maximum temperatures at El Retiro during SAD events in the study period varied between 35.1 and 38.1 ∘C while during NAD periods they ranged from 27.1 to 35.1 ∘C). In July 2016, two SAD periods were observed: 18–21 and 29–31. The first of these two periods has been chosen to illustrate the main features of SAD episodes (Figs. 9–11).
SAD events are characterised by constant southerly winds at the surface and at altitude as shown in the simulated fields of U and V (Figs. 9 and S5). Because the southern coast of the IP is a densely populated area (especially in summer due to the strong touristic pressure) and anthropogenic emissions of O3 precursors are high, including industrial emissions around the cities of Huelva, Seville and Algeciras, regional contribution of external O3 may acquire importance at the basin during SAD events.
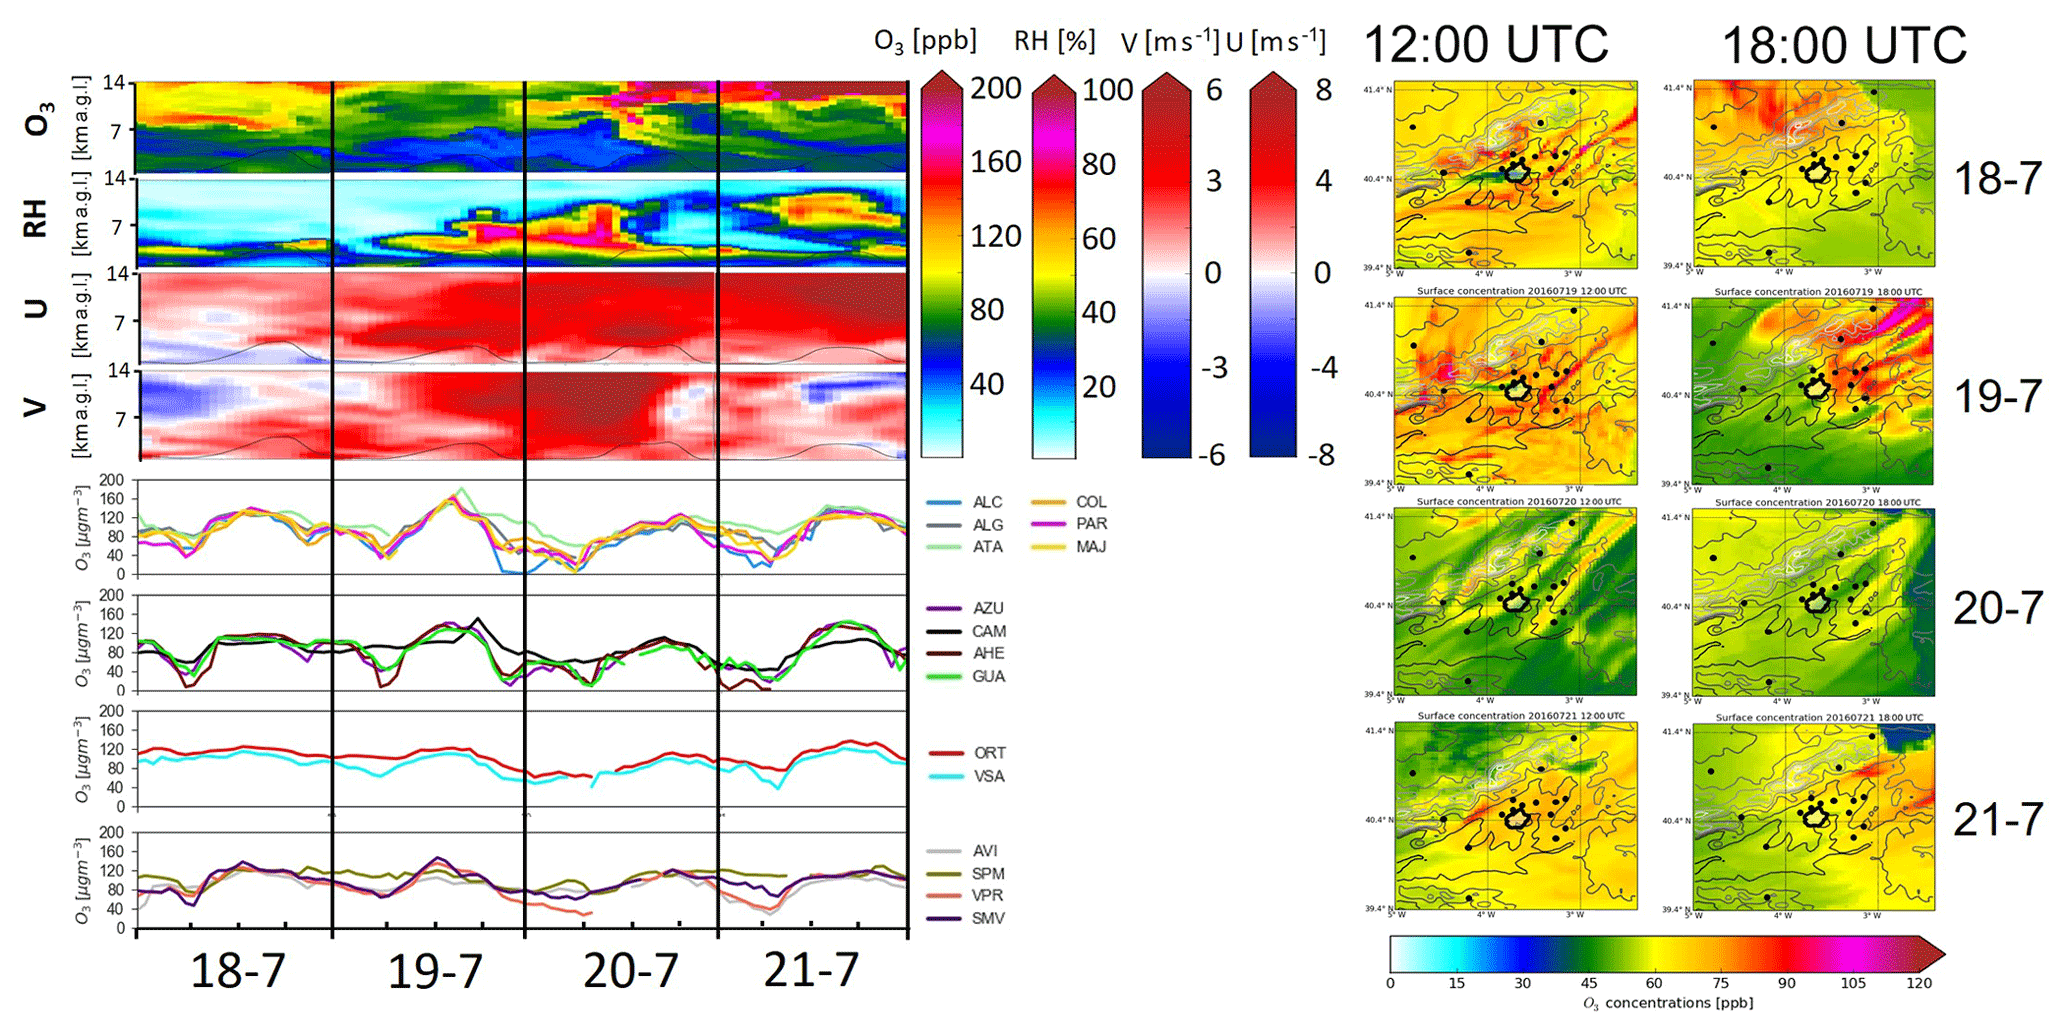
Figure 9Left: hourly O3 concentrations recorded at selected monitoring stations in the MAB and simulated fields of O3 concentration, relative humidity, and U and V components of wind for the period 18–21 July 2016 over the centre of the MAB. Right: surface O3 concentration maps obtained from LOTOS-EUROS simulations at 12:00 and 18:00 UTC of 18, 19, 20 and 21 July 2016 in the MAB. See Fig. 1 to consult the location and typology of the selected stations.
High RH values in the middle troposphere are observed during SAD periods (Figs. 9 and S5) where relevant increments were registered in the period 19–20 July. Although southerly winds are often associated with rain in the MAB, only small amounts of precipitation were collected during this period.
Analysing the 18–21 July case as a typical example of a SAD episode, we observe in the O3 time series that concentrations increased in the entire basin earlier in the day than in the other two scenarios. While ground-level O3 peaks around 18:00 UTC for REC conditions, daily maxima are found around 12:00 UTC under SAD patterns, as confirmed in Fig. 9. After the intense photochemical formation observed at midday, O3 is transported towards the north-east in the afternoon. This explains the concentration peaks registered at the rural stations located on that side of the basin (ATA and CAM) for example on 19 or 29 July (no figure shown of this day). Other days, such as on 18 July, the model still produces a peak in the mid/late afternoon and the shift of the O3 daily maxima is biased by the spatial distribution of stations, which miss the plume that has been advected north-west at 18:00 UTC. SAD episodes are then periods in which O3 produced at the MAB can be exported towards the north of the IP. Less often, if winds blow from the south-east in SAD events, O3 can be transported across the Guadarrama range towards the north-west as happened on 18 July (Fig. 9).
The effect of southern winds ventilating the area and some weak rainfall events limited the increase of O3, although considerable levels were recorded in monitoring stations during SAD events. In general, O3 concentrations during SAD periods are slightly lower than during REC events (with specific exceptions like 19 July) but higher than in NAD episodes. In the stations located in the basin, hourly concentrations rarely exceeded 180 µg m−3 during SAD days (twice in July 2016 in the 7 SAD days), but concentrations above 120 µg m−3 were more frequent (1083 in total in all the stations in the study area or 155 per day) especially in the stations like ATA and CAM located on the north-east of the basin (see 19 July in Fig. 9). This proportion of records above 120 µg m−3 is higher than during NAD events (average of 56 per day) and lower than the rate registered during REC events (203 per day).
Vertical cross sections of O3 and NO2 on 2 consecutive days (18 and 19 July) from a SAD period have been used to illustrate the different behaviours observed (Figs. 10 and 11). The intense accumulation of NO2 observed in the 00:00 and 06:00 UTC plots points out that, on these days, ventilation was not as effective as in NAD events. As a consequence, the O3 daily cycles showed a considerable drop associated with titration in the morning rush hour unlike on NAD days and closer to the situation of REC episodes (Fig. 9). Likewise, for NAD events, vertical mixing is limited as shown in the NO2 vertical cross sections of 18 and 19 July, preventing the formation of reservoir layers during SAD events. The higher O3 registered on 19 July seems to be related to the fact that a deeper boundary layer (maximum heights above 4000 m a.s.l. on 18 July, 3200 m a.s.l. on 19 July) allowed larger dilution, lowering surface concentrations.
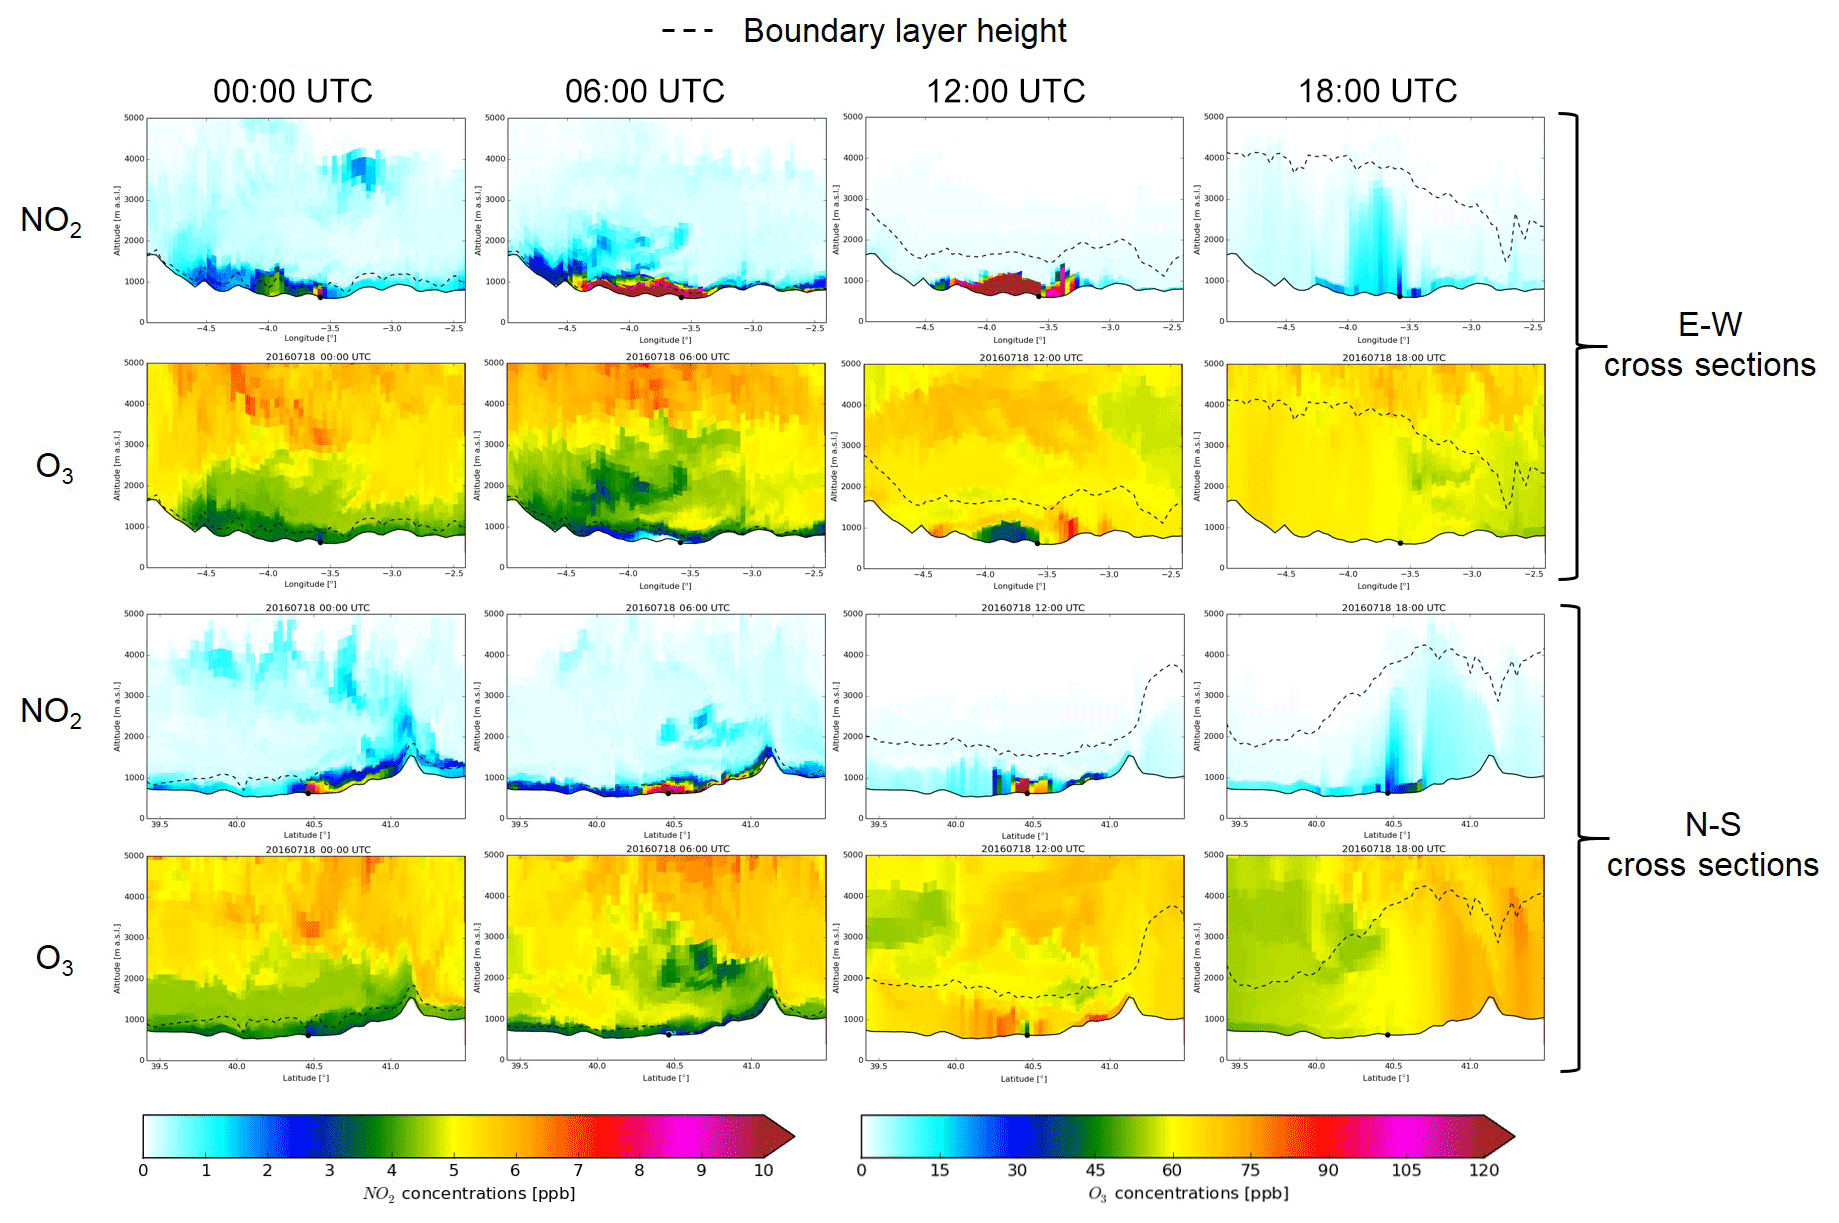
Figure 10Simulated longitudinal and latitudinal vertical cross sections of NO2 and O3 for 18 July 2016 (WRF_70 run). See Fig. 1 to consult the latitudinal and longitudinal cuts.

3.2.4 The role of the boundary layer height (BLH)
Figure 12a presents a comparison between observed (data from Querol et al., 2018) and simulated (WRF_70 configuration) BLH at 12:00 UTC. We can observe that the model tends to overestimate the BLH at midday, although the general trends are captured. In particular, the gradual decrease in the 12:00 UTC BLH from 11 to 14 July that allowed O3 to accumulate smoothly in the basin, which was described in the aforementioned work, is also observed in the simulated data. The overestimation is slight on most days, although larger differences are observed in certain periods (5–10 and 29–31 July).

Figure 12(a) Time series of the estimated and modelled midday BLH over Madrid airport for July 2016. Estimations calculated from the daily AEMET radio soundings using the simple parcel method. (b) Modelled BLH for 13 (NAD event) and 16 (REC event) July 2016.
Querol et al. (2018) describe lower midday BLH in O3 accumulation episodes (equivalent to REC events described here) than in venting episodes (NAD or SAD). The simulations with LOTOS-EUROS confirm that finding as observed in Fig. 12b. The mixing layer is deeper on 13 July (NAD) than on 16 July (REC) from 00:00 to 16:00 UTC, which includes the period of most effective photochemical formation of O3. This allows a more effective formation of reservoir layers during REC events that fumigate to the surface as the diurnal convective circulation develops. After 16:00 UTC the BLH during the REC event grows higher than during the NAD day due to the larger convection in the second scenario.
Evaluation of a CTM is a basic tool for the analysis and forecasting of photochemical processes that give rise to high concentrations of tropospheric O3 that frequently occur in the Mediterranean in summer. A preliminary requirement for the application of CTM for policy decisions is that they could reproduce adequately the processes and mechanisms identified by the field campaigns and reasonably reproduce the observations of the monitoring stations, especially during acute O3 episodes.
In this work, we present the results obtained from a simulation exercise (July 2016) performed with the LOTOS-EUROS CTM over the MAB, representative of summer conditions. Five configurations with different combinations of spatial resolution (25 km×25 km and 3 km×3 km), input meteorological data (ECMWF 7 km×7 km for the IP and WRF, 1 km×1 km for the MAB) and vertical structures (mixed-layer scheme with five altitude levels and hybrid-layer scheme with 70 altitude levels) for model evaluation and optimisation.
The main objective of the paper is to provide a phenomenological interpretation of O3 events in the area after performing a detailed evaluation of the best configuration of the model for the specific area and period. Regarding the specific question of the reasonable number of vertical levels in the model configuration, it is dependent on the objective of the study. In this study the environmental analysis was the main objective, and it was logical and feasible from the perspective of CPU time to employ a considerable number of vertical levels because it allowed a better representation of the vertical variability of O3. In other studies such as air-quality forecasting or long-term analyses in which CPU time may be large, the reasonable number of levels can be less.
Our results show that the LOTOS-EUROS model performs in a satisfactory manner in the five set-ups. However, regarding surface O3, it is clear that the model benefits from finer spatial resolutions in the horizontal and also from the use of multilayered vertical schemes. As a result, WRF_70 and ECMWF_HR_70 were the optimal configurations.
Using multilayered 70-level set-ups, LOTOS-EUROS was able to reproduce the vertical gradients of O3 in the Madrid basin, although in some cases the model presented an overestimation in the lower levels with respect to observations. In most cases, the model was also able to reproduce features like fine O3 layers. The performance of LOTOS-EUROS was partly successful, differentiating the vertical structure of O3 under distinct meteorological conditions so further research is needed to improve CTMs’ performances in this particular aspect with, for example, comparisons with data from O3 soundings under different meteorological scenarios.
Therefore, the modelling system is suitable to be employed for the interpretation of O3 variability in the region. In light of the present study, we suggest using vertical schemes of CTMs with a sufficient number of levels for capturing O3 variability in the simulations of summer episodes in the Mediterranean region.
Employing the WRF_70 configuration of LOTOS-EUROS which has shown the best performance simulating surface and vertical concentrations of O3 in the MAB, we interpreted the variability of O3 in the region. Three episode types have been identified regarding the dominating circulation. Two of them are associated with advection, either from the north (NAD) or from the south (SAD), while the third is associated with local/regional recirculation of air masses (REC). REC events are characterised by low winds that veer during the day from north-east to south-west following the axis of the Guadarrama range. These stagnant conditions combined with the strong insolation and temperature registered during REC events favour the strong photochemical production and accumulation of O3 over the MAB, which is likely to exceed 180 µg m−3 during the afternoon and evening. Moreover, the strong convection helps to form reservoir layers located at 2000–4000 m a.s.l. which contribute to increasing surface O3 in the following days when the upper limit of the boundary layer reaches those altitudes.
Marked differences have been found between the two venting episodes. During SAD episodes, winds are weak and external O3 contributions from the south and south-east of the IP can be relevant, while in the case of NAD events, winds were generally stronger, favouring ventilation. As a consequence, surface O3 during NAD events did not grow excessively (except in specific cases when wind speed is low). During SAD conditions, higher base O3 concentrations (>120 µg m−3) were registered but the 180 µg m−3 threshold is exceeded rarely in both episode types. One of the factors for this is the existence of a steady wind direction avoiding an effective accumulation of O3 in reservoir layers. Both NAD and SAD events are associated with O3 exportation to other air basins on the IP like the Ebro valley (to the north-east) and the Tagus and Guadiana valleys (to the south-west).
Intrusions of stratospheric O3 have been observed with LOTOS-EUROS simulations in the form of bands with a high concentration of O3 and very low humidity. It is unclear whether these intrusions have an impact at the surface and, if so, what is the exact contribution to the O3 observed there. Specific model-based analyses of these episodes should be performed to evaluate their actual impact on surface O3 in the MAB.
The results from this study can be useful to understand the phenomenology of high-O3 episodes in the MAB and to gain knowledge to design appropriate strategies for air-quality management. Further research must be implemented to investigate aspects like the sensitivity to emission reduction scenarios or the role of VOCs with emphasis on the biogenic ones. Moreover, to perform the tasks of validating and optimising CTMs, increasing efforts should be made to conduct more field campaigns in different air basins in the Mediterranean using state-of-the-art equipment to generate data and knowledge about O3 behaviour both on the surface and vertically. Useful parameters to be included in these campaigns are O3; NOx; VOCs; and, when possible, intermediate products like NOy, HNO3 and H2O2 that, according to previous experience (Sillman, 1995), are key parameters for facing model-based NOx–VOC sensitivity studies and the assessment of emission inventories. Some of these parameters (especially NOx) should also be incorporated in vertical measurements.
In future, similar simulations to the one presented in this study should be performed in the different air basins in the IP where O3 exceedances have been recorded (Querol et al., 2016). CTMs should be configured specifically for each region or air basin to assure the best performance by capturing the influence of topography and local circulations. For such studies, we highlight the importance of conducting experimental campaigns that can support the necessary model evaluation.
Finally, it should be noted that when running such fine resolutions for real applications it is also important to work on the emission datasets (out of the scope of this work). Increasing the detail in emission inventory (mainly based on a bottom-up approach) could improve the performance of CTMs when assessing sensitivities or emission scenarios. Moreover, improving time resolution in the emission models can be beneficial for simulating O3 episodes.
Observational datasets and all the data presented in this study are available upon request from the authors.
The supplement related to this article is available online at: https://doi.org/10.5194/acp-19-14211-2019-supplement.
ME conceived the presented idea, carried out the simulations with LOTOS-EUROS, collected and treated experimental data used for model evaluation, and wrote the manuscript. AS, RK and MS supervised LOTOS-EUROS simulations, modified the model code for performing runs with the different configurations and contributed in the post-processing of model outputs. RB and DdlP performed and validated simulations with WRF. XQ, AA and GG contributed especially in the interpretation of O3 phenomenology. All authors discussed the results and contributed to the final manuscript.
The authors declare that they have no conflict of interest.
This work was funded by the Ministry of Economy, Industry and Competitiveness and FEDER funds through the project HOUSE (CGL2016-78594-R); the Ministry of Agriculture, Fishing, Food and Environment; the Madrid City Council; the Madrid Regional Government; and by the Department of Research, Innovation and University of the Aragón Regional Government and the European Social Fund (project E23_17D). The study was also partially supported by the scientific programme TECNAIRE-CM funded by the Directorate General for Universities and Research of the Greater Madrid Region (S2013/MAE-2972). The authors gratefully acknowledge air-quality data provision by the following entities: Ministry for the Ecological Transition (MITECO); Madrid City Council; AEMET; and the autonomous communities of Madrid, Castilla y León and Castilla–La Mancha. Miguel Escudero received a grant from the José Castillejo programme of the Ministry of Education and Science of Spain (ref. CAS17/00108) for a 6-month research visit at TNO.
This research has been supported by the Ministry of Economy, Industry and Competitiveness of Spain and FEDER (grant no. CGL2016-78594-R); the Department of Research, Innovation and University of the Aragón Regional Government and the European Social Fund (grant no. E23_17D); the Directorate General for Universities and Research of the Greater Madrid Region (grant no. S2013/MAE-2972); and the Ministry of Education and Science of Spain (grant no. CAS17/00108).
This paper was edited by Pedro Jimenez-Guerrero and reviewed by three anonymous referees.
Baldasano, J., Pay, M., Jorba, O., Gassó, S., and Jiménez-Guerrero, P.: An annual assessment of air quality with the CALIOPE modeling system over Spain, Sci. Total Environ., 409, 2163–2178, https://doi.org/10.1016/j.scitotenv.2011.01.041, 2011. a
Barbu, A., Segers, A., Schaap, M., Heemink, A., and Builtjes, P.: A multi-component data assimilation experiment directed to sulphur dioxide and sulphate over Europe, Atmos. Environ., 43, 1622–1631, https://doi.org/10.1016/j.atmosenv.2008.12.005, 2009. a
Beltman, J. B., Hendriks, C., Tum, M., and Schaap, M.: The impact of large scale biomass production on ozone air pollution in Europe, Atmos. Environ., 71, 352–363, https://doi.org/10.1016/j.atmosenv.2013.02.019, 2013. a
Borge, R., Alexandrov, V., del Vas, J. J., Lumbreras, J., and Rodríguez, E.: A comprehensive sensitivity analysis of the WRF model for air quality applications over the Iberian Peninsula, Atmos. Environ., 42, 8560–8574, https://doi.org/10.1016/j.atmosenv.2008.08.032, 2008. a
Borge, R., López, J., Lumbreras, J., Narros, A., and Rodríguez, E.: Influence of boundary conditions on CMAQ simulations over the Iberian Peninsula, Atmos. Environ., 44, 2681–2695, https://doi.org/10.1016/j.atmosenv.2010.04.044, 2010. a
Borge, R., Lumbreras, J., Pérez, J., de la Paz, D., Vedrenne, M., de Andrés, J. M., and Rodríguez, M. E.: Emission inventories and modeling requirements for the development of air quality plans. Application to Madrid (Spain), Sci. Total Environ., 466–467, 809–819, https://doi.org/10.1016/j.scitotenv.2013.07.093, 2014. a, b, c
Borrego, C., Monteiro, A., Ferreira, J., Miranda, A., Costa, A., Carvalho, A., and Lopes, M.: Procedures for estimation of modelling uncertainty in air quality assessment, Environ. Int., 34, 613–620, https://doi.org/10.1016/j.envint.2007.12.005, 2008. a
Canepa, E. and Builtjes, P. J.: Thoughts on Earth System Modeling: From global to regional scale, Earth-Sci. Rev., 171, 456–462, https://doi.org/10.1016/j.earscirev.2017.06.017, 2017. a
Carnerero, C., Pérez, N., Reche, C., Ealo, M., Titos, G., Lee, H.-K., Eun, H.-R., Park, Y.-H., Dada, L., Paasonen, P., Kerminen, V.-M., Mantilla, E., Escudero, M., Gómez-Moreno, F. J., Alonso-Blanco, E., Coz, E., Saiz-Lopez, A., Temime-Roussel, B., Marchand, N., Beddows, D. C. S., Harrison, R. M., Petäjä, T., Kulmala, M., Ahn, K.-H., Alastuey, A., and Querol, X.: Vertical and horizontal distribution of regional new particle formation events in Madrid, Atmos. Chem. Phys., 18, 16601–16618, https://doi.org/10.5194/acp-18-16601-2018, 2018. a
Carvalho, A., Carvalho, A., Gelpi, I., Barreiro, M., Borrego, C., Miranda, A., and Pérez-Muñúzuri, V.: Influence of topography and land use on pollutants dispersion in the Atlantic coast of Iberian Peninsula, Atmos. Environ., 40, 3969–3982, https://doi.org/10.1016/j.atmosenv.2006.02.014, 2006. a, b, c
Curier, R., Timmermans, R., Calabretta-Jongen, S., Eskes, H., Segers, A., Swart, D., and Schaap, M.: Improving ozone forecasts over Europe by synergistic use of the LOTOS-EUROS chemical transport model and in-situ measurements, Atmos. Environ., 60, 217–226, https://doi.org/10.1016/j.atmosenv.2012.06.017, 2012. a
Cuvelier, C., Thunis, P., Vautard, R., Amann, M., Bessagnet, B., Bedogni, M., Berkowicz, R., Brandt, J., Brocheton, F., Builtjes, P., Carnavale, C., Coppalle, A., Denby, B., Douros, J., Graf, A., Hellmuth, O., Hodzic, A., Honoré, C., Jonson, J., Kerschbaumer, A., de Leeuw, F., Minguzzi, E., Moussiopoulos, N., Pertot, C., Peuch, V., Pirovano, G., Rouil, L., Sauter, F., Schaap, M., Stern, R., Tarrasón, L., Vignati, E., Volta, M., White, L., Wind, P., and Zuber, A.: CityDelta: A model intercomparison study to explore the impact of emission reductions in European cities in 2010, Atmos. Environ., 41, 189–207, https://doi.org/10.1016/j.atmosenv.2006.07.036, 2007. a
de la Paz, D., Borge, R., and Martilli, A.: Assessment of a high resolution annual WRF-BEP/CMAQ simulation for the urban area of Madrid (Spain), Atmos. Environ., 144, 282–296, https://doi.org/10.1016/j.atmosenv.2016.08.082, 2016. a, b
Eckermann, S.: Hybrid σ−p Coordinate Choices for a Global Model, Mon. Weather Rev., 137, 224–245, https://doi.org/10.1175/2008MWR2537.1, 2009. a
EEA: Air quality in Europe-2017 report, EEA, Luxembourg, Tech. Rep., EEA Report No 12/2018, https://doi.org/10.2800/777411, 2018. a
Escudero, M., Lozano, A., Hierro, J., del Valle, J., and Mantilla, E.: Urban influence on increasing ozone concentrations in a characteristic Mediterranean agglomeration, Atmos. Environ., 99, 322–332, https://doi.org/10.1016/j.atmosenv.2014.09.061, 2014. a
Escudero, M., Lozano, A., Hierro, J., Tapia, O., del Valle, J., Alastuey, A., Moreno, T., Anzano, J., and Querol, X.: Assessment of the variability of atmospheric pollution in National Parks of mainland Spain, Atmos. Environ., 132, 332–344, https://doi.org/10.1016/j.atmosenv.2016.03.006, 2016. a
Fenech, S., Doherty, R. M., Heaviside, C., Vardoulakis, S., Macintyre, H. L., and O'Connor, F. M.: The influence of model spatial resolution on simulated ozone and fine particulate matter for Europe: implications for health impact assessments, Atmos. Chem. Phys., 18, 5765–5784, https://doi.org/10.5194/acp-18-5765-2018, 2018. a
Flemming, J., Inness, A., Flentje, H., Huijnen, V., Moinat, P., Schultz, M. G., and Stein, O.: Coupling global chemistry transport models to ECMWF's integrated forecast system, Geosci. Model Dev., 2, 253–265, https://doi.org/10.5194/gmd-2-253-2009, 2009. a
Gangoiti, G., Millán, M. M., Salvador, R., and Mantilla, E.: Long-range transport and re-circulation of pollutants in the western Mediterranean during the project Regional Cycles of Air Pollution in the West-Central Mediterranean Area, Atmos. Environ., 35, 6267–6276, https://doi.org/10.1016/S1352-2310(01)00440-X, 2001. a, b
Gonçalves, M., Jiménez-Guerrero, P., and Baldasano, J. M.: Contribution of atmospheric processes affecting the dynamics of air pollution in South-Western Europe during a typical summertime photochemical episode, Atmos. Chem. Phys., 9, 849–864, https://doi.org/10.5194/acp-9-849-2009, 2009. a, b
Hass, H., Builtjes, P., Simpson, D., and Sternii, R.: Comparison of model results obtained with several european regional air quality models, Atmos. Environ., 31, 3259–3279, https://doi.org/10.1016/S1352-2310(97)00066-6, 1997. a
Hendriks, C., Forsell, N., Kiesewetter, G., Schaap, M., and Schöpp, W.: Ozone concentrations and damage for realistic future European climate and air quality scenarios, Atmos. Environ., 144, 208–219, https://doi.org/10.1016/j.atmosenv.2016.08.026, 2016. a
Hess, P. G. and Zbinden, R.: Stratospheric impact on tropospheric ozone variability and trends: 1990–2009, Atmos. Chem. Phys., 13, 649–674, https://doi.org/10.5194/acp-13-649-2013, 2013. a
Im, U., Bianconi, R., Solazzo, E., Kioutsioukis, I., Badia, A., Balzarini, A., Baró, R., Bellasio, R., Brunner, D., Chemel, C., Curci, G., Flemming, J., Forkel, R., Giordano, L., Jiménez-Guerrero, P., Hirtl, M., Hodzic, A., Honzak, L., Jorbá, O., Knote, C., Kuenen, J. J., Makar, P. A., Manders-Groot, A., Neal, L., Pérez, J. L., Pirovano, G., Pouliot, G., Jose, R. S., Savage, N., Schroder, W., Sokhi, R. S., Syrakov, D., Torian, A., Tuccella, P., Werhahn, J., Wolke, R., Yahya, K., Zabkar, R., Zhang, Y., Zhang, J., Hogrefe, C., and Galmarini, S.: Evaluation of operational on-line-coupled regional air quality models over Europe and North America in the context of AQMEII phase 2. Part I: Ozone, Atmos. Environ., 115, 404–420, https://doi.org/10.1016/j.atmosenv.2014.09.042, 2015. a
IPCC: Climate Change 2013: The Physical Science Basis. Contribution of Working Group I to the Fifth Assessment Report of the Intergovernmental Panel on Climate Change, Cambridge University Press, Cambridge, UK, 2013. a
Jiménez, P., Parra, R., Gassó, S., and Baldasano, J. M.: Modeling the ozone weekend effect in very complex terrains: a case study in the Northeastern Iberian Peninsula, Atmos. Environ., 39, 429–444, https://doi.org/10.1016/j.atmosenv.2004.09.065, 2005. a
Jiménez, P., Lelieveld, J., and Baldasano, J. M.: Multiscale modeling of air pollutants dynamics in the northwestern Mediterranean basin during a typical summertime episode, J. Geophys. Res., 111, D18306, https://doi.org/10.1029/2005JD006516, 2006. a, b, c, d, e
Jiménez-Guerrero, P., Jorba, O., Baldasano, J. M., and Gassó, S.: The use of a modelling system as a tool for air quality management: Annual high-resolution simulations and evaluation, Sci. Total Environ., 390, 323–340, https://doi.org/10.1016/j.scitotenv.2007.10.025, 2008. a
Lee, D. S., Holland, M. R., and Falla, N.: The potential impact of ozone on materials in the U.K., Atmos. Environ., 30, 1053–1065, https://doi.org/10.1016/1352-2310(95)00407-6, 1996. a
Manders, A., Schaap, M., and Hoogerbrugge, R.: Testing the capability of the chemistry transport model LOTOS-EUROS to forecast PM10 levels in the Netherlands, Atmos. Environ., 43, 4050–4059, https://doi.org/10.1016/j.atmosenv.2009.05.006, 2009. a
Manders, A. M. M., Segers, A. J., and Jonkers, S.: LOTOS-EUROS v2.0 Reference guide, TNO, Tech. Rep. TNO 2016 R10898, 2016. a, b
Manders, A. M. M., Builtjes, P. J. H., Curier, L., Denier van der Gon, H. A. C., Hendriks, C., Jonkers, S., Kranenburg, R., Kuenen, J. J. P., Segers, A. J., Timmermans, R. M. A., Visschedijk, A. J. H., Wichink Kruit, R. J., van Pul, W. A. J., Sauter, F. J., van der Swaluw, E., Swart, D. P. J., Douros, J., Eskes, H., van Meijgaard, E., van Ulft, B., van Velthoven, P., Banzhaf, S., Mues, A. C., Stern, R., Fu, G., Lu, S., Heemink, A., van Velzen, N., and Schaap, M.: Curriculum vitae of the LOTOS–EUROS (v2.0) chemistry transport model, Geosci. Model Dev., 10, 4145–4173, https://doi.org/10.5194/gmd-10-4145-2017, 2017. a, b
Marécal, V., Peuch, V.-H., Andersson, C., Andersson, S., Arteta, J., Beekmann, M., Benedictow, A., Bergström, R., Bessagnet, B., Cansado, A., Chéroux, F., Colette, A., Coman, A., Curier, R. L., Denier van der Gon, H. A. C., Drouin, A., Elbern, H., Emili, E., Engelen, R. J., Eskes, H. J., Foret, G., Friese, E., Gauss, M., Giannaros, C., Guth, J., Joly, M., Jaumouillé, E., Josse, B., Kadygrov, N., Kaiser, J. W., Krajsek, K., Kuenen, J., Kumar, U., Liora, N., Lopez, E., Malherbe, L., Martinez, I., Melas, D., Meleux, F., Menut, L., Moinat, P., Morales, T., Parmentier, J., Piacentini, A., Plu, M., Poupkou, A., Queguiner, S., Robertson, L., Rouïl, L., Schaap, M., Segers, A., Sofiev, M., Tarasson, L., Thomas, M., Timmermans, R., Valdebenito, Á., van Velthoven, P., van Versendaal, R., Vira, J., and Ung, A.: A regional air quality forecasting system over Europe: the MACC-II daily ensemble production, Geosci. Model Dev., 8, 2777–2813, https://doi.org/10.5194/gmd-8-2777-2015, 2015. a, b
Mass, C. F., Ovens, D., Westrick, K., and Colle, B. A.: Does increasing horizontal resolution produce a more skillful forecasts?, B. Am. Meteorol. Soc., 83, 407–430, https://doi.org/10.1175/1520-0477(2002)083<0407:DIHRPM>2.3.CO;2, 2002. a
Massagué, J., Carnerero, C., Escudero, M., Baldasano, J. M., Alastuey, A., and Querol, X.: 2005–2017 ozone trends and potential benefits of local measures as deduced from air quality measurements in the north of the Barcelona metropolitan area, Atmos. Chem. Phys., 19, 7445–7465, https://doi.org/10.5194/acp-19-7445-2019, 2019. a
Millán, M. M., Salvador, R., Mantilla, E., and Kallos, G.: Photooxidant dynamics in the Mediterranean basin in summer: Results from European research projects,J. Geophys. Res., 102, 8811–8823, https://doi.org/10.1029/96JD03610, 1997. a, b
Millán, M. M., Mantilla, E., Salvador, R., Carratalá, A., Sanz, M. J., Alonso, L., Gangoiti, G., and Navazo, M.: Ozone Cycles in the Western Mediterranean Basin: Interpretation of Monitoring Data in Complex Coastal Terrain, J. Appl. Meteorol., 39, 487–508, https://doi.org/10.1175/1520-0450(2000)039<0487:OCITWM>2.0.CO;2, 2000. a, b, c
Monks, P. S., Archibald, A. T., Colette, A., Cooper, O., Coyle, M., Derwent, R., Fowler, D., Granier, C., Law, K. S., Mills, G. E., Stevenson, D. S., Tarasova, O., Thouret, V., von Schneidemesser, E., Sommariva, R., Wild, O., and Williams, M. L.: Tropospheric ozone and its precursors from the urban to the global scale from air quality to short-lived climate forcer, Atmos. Chem. Phys., 15, 8889–8973, https://doi.org/10.5194/acp-15-8889-2015, 2015. a, b, c
Palacios, M., Kirchner, F., Martilli, A., Clappier, A., Martín, F., and Rodríguez, M.: Summer ozone episodes in the Greater Madrid area. Analyzing the ozone response to abatement strategies by modelling, Atmos. Environ., 36, 5323–5333, https://doi.org/10.1016/S1352-2310(02)00590-3, 2002. a, b
Paoletti, E.: Impact of ozone on Mediterranean forests: A review, Environ. Pollut., 144, 463–474, https://doi.org/10.1016/j.envpol.2005.12.051, 2006. a
Pay, M. T., Gangoiti, G., Guevara, M., Napelenok, S., Querol, X., Jorba, O., and Pérez García-Pando, C.: Ozone source apportionment during peak summer events over southwestern Europe, Atmos. Chem. Phys., 19, 5467–5494, https://doi.org/10.5194/acp-19-5467-2019, 2018. a, b
Plaza, J., Pujadas, M., and Artíñano, B.: Formation and Transport of the Madrid Ozone Plume, J. Air Waste Manage., 47, 766–774, https://doi.org/10.1080/10473289.1997.10463938, 1997. a, b
Querol, X., Alastuey, A., Reche, C., Orío, A., Pallarés, M., Reina, F., Diéguez, J., Mantilla, E., Escudero, M., Alonso, L., Gangoiti, G., and Millán, M.: On the origin of the highest ozone episodes in Spain, Sci. Total Environ., 572, 379–389, https://doi.org/10.1016/j.scitotenv.2016.07.193, 2016. a, b, c
Querol, X., Gangoiti, G., Mantilla, E., Alastuey, A., Minguillón, M. C., Amato, F., Reche, C., Viana, M., Moreno, T., Karanasiou, A., Rivas, I., Pérez, N., Ripoll, A., Brines, M., Ealo, M., Pandolfi, M., Lee, H.-K., Eun, H.-R., Park, Y.-H., Escudero, M., Beddows, D., Harrison, R. M., Bertrand, A., Marchand, N., Lyasota, A., Codina, B., Olid, M., Udina, M., Jiménez-Esteve, B., Soler, M. R., Alonso, L., Millán, M., and Ahn, K.-H.: Phenomenology of high-ozone episodes in NE Spain, Atmos. Chem. Phys., 17, 2817–2838, https://doi.org/10.5194/acp-17-2817-2017, 2017. a, b, c
Querol, X., Alastuey, A., Gangoiti, G., Perez, N., Lee, H. K., Eun, H. R., Park, Y., Mantilla, E., Escudero, M., Titos, G., Alonso, L., Temime-Roussel, B., Marchand, N., Moreta, J. R., Revuelta, M. A., Salvador, P., Artíñano, B., García dos Santos, S., Anguas, M., Notario, A., Saiz-Lopez, A., Harrison, R. M., Millán, M., and Ahn, K.-H.: Phenomenology of summer ozone episodes over the Madrid Metropolitan Area, central Spain, Atmos. Chem. Phys., 18, 6511–6533, https://doi.org/10.5194/acp-18-6511-2018, 2018. a, b, c, d, e, f, g
Reche, C., Moreno, T., Amato, F., Pandolfi, M., Pérez, J., de la Paz, D., Diaz, E., Gómez-Moreno, F., Pujadas, M., Artíñano, B., Reina, F., Orio, A., Pallarés, M., Escudero, M., Tapia, O., Crespo, E., Vargas, R., Alastuey, A., and Querol, X.: Spatio-temporal patterns of high summer ozone events in the Madrid Basin, Central Spain, Atmos. Environ., 185, 207–220, https://doi.org/10.1016/j.atmosenv.2018.05.002, 2018. a
Saiz-López, A., Borge, R., Notario, A., Adame, J. A., de la Paz, D., Querol, X., Artíñano, B., Gómez-Moreno, F. J., and Cuevas, C. A.: Unexpected increase in the oxidation capacity of the urban atmosphere of Madrid, Spain, Scientific Reports, 7, 45956, https://doi.org/10.1038/srep45956, 2017. a
Salvador, P., Artíñano, B., Viana, M., Alastuey, A., and Querol, X.: Multicriteria approach to interpret the variability of the levels of particulate matter and gaseous pollutants in the Madrid metropolitan area, during the 1999–2012 period, Atmos. Environ., 109, 205–216, https://doi.org/10.1016/j.atmosenv.2015.03.008, 2015. a
San José, R., Stohl, A., Karatzas, K., Bohler, T., James, P., and Pérez, J.: A modelling study of an extraordinary night time ozone episode over Madrid domain, Environ. Modell. Softw., 20, 587–593, https://doi.org/10.1016/j.envsoft.2004.03.009, 2005. a, b
Schaap, M., van Loon, M., ten Brink, H. M., Dentener, F. J., and Builtjes, P. J. H.: Secondary inorganic aerosol simulations for Europe with special attention to nitrate, Atmos. Chem. Phys., 4, 857–874, https://doi.org/10.5194/acp-4-857-2004, 2004. a
Schaap, M., Kranenburg, R., Curier, L., Jozwicka, M., Dammers, E., and Timmermans, R.: Assessing the Sensitivity of the OMI-NO2 Product to Emission Changes across Europe, Remote Sensing, 5, 4187–4208, https://doi.org/10.3390/rs5094187, 2013. a
Screpanti, A. and Marco, A. D.: Corrosion on cultural heritage buildings in Italy: A role for ozone?, Environ. Pollution, 157, 1513–1520, https://doi.org/10.1016/j.envpol.2008.09.046, 2009. a
Seco, R., Peñuelas, J., Filella, I., Llusià, J., Molowny-Horas, R., Schallhart, S., Metzger, A., Müller, M., and Hansel, A.: Contrasting winter and summer VOC mixing ratios at a forest site in the Western Mediterranean Basin: the effect of local biogenic emissions, Atmos. Chem. Phys., 11, 13161–13179, https://doi.org/10.5194/acp-11-13161-2011, 2011. a
Sicard, P., De Marco, A., Troussier, F., Renou, C., Vas, N., and Paoletti, E.: Decrease in surface ozone concentrations at Mediterranean remote sites and increase in the cities, Atmos. Environ., 79, 705–715, 2013. a
Sillman, S.: The use of NOy, H2O2, and HNO3 as indicators for ozone-NOx-hydrocarbon sensitivity in urban locations, J. Geophys. Res., 100, 14175–14188, https://doi.org/10.1029/94JD02953, 1995. a
Sillman, S.: The relation between ozone, NOx and hydrocarbons in urban and polluted rural environments, Atmos. Environ., 33, 1821–1845, https://doi.org/10.1016/S1352-2310(98)00345-8, 1999. a
Sillman, S. and West, J. J.: Reactive nitrogen in Mexico City and its relation to ozone-precursor sensitivity: results from photochemical models, Atmos. Chem. Phys., 9, 3477–3489, https://doi.org/10.5194/acp-9-3477-2009, 2009. a
Skamarock, W. C., Klemp, J. B., Dudhia, J., Gill, D. O., Barker, D. M., Duda, M. G., Huang, X.-Y., Wang, W., and Powers, J. G.: A Description of the Advanced Research WRF Version 3, Tech. rep., NCAR Tech. Note NCAR/TN-475+STR, https://doi.org/10.5065/D68S4MVH, 2008. a
Solazzo, E., Bianconi, R., Vautard, R., Appel, K. W., Moran, M. D., Hogrefe, C., Bessagnet, B., Brandt, J., Christensen, J. H., Chemel, C., Coll, I., van der Gon, H. D., Ferreira, J., Forkel, R., Francis, X. V., Grell, G., Grossi, P., Hansen, A. B., Jeričević, A., Kraljević, L., Miranda, A. I., Nopmongcol, U., Pirovano, G., Prank, M., Riccio, A., Sartelet, K. N., Schaap, M., Silver, J. D., Sokhi, R. S., Vira, J., Werhahn, J., Wolke, R., Yarwood, G., Zhang, J., Rao, S., and Galmarini, S.: Model evaluation and ensemble modelling of surface-level ozone in Europe and North America in the context of AQMEII, Atmos. Environ., 53, 60–74, https://doi.org/10.1016/j.atmosenv.2012.01.003, 2012. a
Soret, A., Guevara, M., and Baldasano, J.: The potential impacts of electric vehicles on air quality in the urban areas of Barcelona and Madrid (Spain), Atmos. Environ., 99, 51–63, https://doi.org/10.1016/j.atmosenv.2014.09.048, 2014. a, b
Stevenson, D. S., Dentener, F. J., Schultz, M. G., Ellingsen, K., van Noije, T. P. C., Wild, O., Zeng, G., Amann, M., Atherton, C. S., Bell, N., Bergmann, D. J., Bey, I., Butler, T., Cofala, J., Collins, W. J., Derwent, R. G., Doherty, R. M., Drevet, J., Eskes, H. J., Fiore, A. M., Gauss, M., Hauglustaine, D. A., Horowitz, L. W., Isaksen, I. S. A., Krol, M. C., Lamarque, J.-F., Lawrence, M. G., Montanaro, V., Müller, J.-F., Pitari, G., Prather, M. J., Pyle, J. A., Rast, S., Rodriguez, J. M., Sanderson, M. G., Savage, N. H., Shindell, D. T., Strahan, S. E., Sudo, K., and Szopa, S.: Multimodel ensemble simulations of present-day and near-future tropospheric ozone, J. Geophys. Res., 111, D08301, https://doi.org/10.1029/2005JD006338, 2006. a
Stock, Z. S., Russo, M. R., and Pyle, J. A.: Representing ozone extremes in European megacities: the importance of resolution in a global chemistry climate model, Atmos. Chem. Phys., 14, 3899–3912, https://doi.org/10.5194/acp-14-3899-2014, 2014. a
Thunis, P., Pisoni, E., Degraeuwe, B., Kranenburg, R., Schaap, M., and Clappier, A.: Dynamic evaluation of air quality models over European regions, Atmos. Environ., 111, 185–194, https://doi.org/10.1016/j.atmosenv.2015.04.016, 2015. a
Timmermans, R., Kranenburg, R., Manders, A., Hendriks, C., Segers, A., Dammers, E., Zhang, Q., Wang, L., Liu, Z., Zeng, L., van der Gon, H. D., and Schaap, M.: Source apportionment of PM2.5 across China using LOTOS-EUROS, Atmos. Environ., 164, 370–386, https://doi.org/10.1016/j.atmosenv.2017.06.003, 2017. a
Toll, I. and Baldasano, J.: Modeling of photochemical air pollution in the Barcelona area with highly disaggregated anthropogenic and biogenic emissions, Atmos. Environ., 34, 3069–3084, https://doi.org/10.1016/S1352-2310(99)00498-7, 2000. a, b
Tressol, M., Ordonez, C., Zbinden, R., Brioude, J., Thouret, V., Mari, C., Nedelec, P., Cammas, J.-P., Smit, H., Patz, H.-W., and Volz-Thomas, A.: Air pollution during the 2003 European heat wave as seen by MOZAIC airliners, Atmos. Chem. Phys., 8, 2133–2150, https://doi.org/10.5194/acp-8-2133-2008, 2008. a
Valari, M. and Menut, L.: Does an Increase in Air Quality Models' Resolution Bring Surface Ozone Concentrations Closer to Reality?, J. Atmos. Ocean. Tech., 25, 1955–1968, https://doi.org/10.1175/2008JTECHA1123.1, 2008. a, b
Valverde, V., Pay, M. T., and Baldasano, J. M.: Ozone attributed to Madrid and Barcelona on-road transport emissions: Characterization of plume dynamics over the Iberian Peninsula, Sci. Total Environ., 543, 670–682, https://doi.org/10.1016/j.scitotenv.2015.11.070, 2016. a, b, c
van Loon, M., Vautard, R., Schaap, M., Bergström, R., Bessagnet, B., Brandt, J., Builtjes, P., Christensen, J., Cuvelier, C., Graff, A., Jonson, J., Krol, M., Langner, J., Roberts, P., Rouil, L., Stern, R., Tarrasón, L., Thunis, P., Vignati, E., White, L., and Wind, P.: Evaluation of long-term ozone simulations from seven regional air quality models and their ensemble, Atmos. Environ., 41, 2083–2097, https://doi.org/10.1016/j.atmosenv.2006.10.073, 2007. a
van Zelm, R., Huijbregts, M. A., den Hollander, H. A., van Jaarsveld, H. A., Sauter, F. J., Struijs, J., van Wijnen, H. J., and van de Meent, D.: European characterization factors for human health damage of PM10 and ozone in life cycle impact assessment, Atmos. Environ., 42, 441–453, https://doi.org/10.1016/j.atmosenv.2007.09.072, 2008. a
Vautard, R., Builtjes, P., Thunis, P., Cuvelier, C., Bedogni, M., Bessagnet, B., Honoré, C., Moussiopoulos, N., Pirovano, G., Schaap, M., Stern, R., Tarrasón, L., and Wind, P.: Evaluation and intercomparison of Ozone and PM10 simulations by several chemistry transport models over four European cities within the CityDelta project, Atmos. Environ., 41, 173–188, https://doi.org/10.1016/j.atmosenv.2006.07.039, 2007. a
Vlemmix, T., Eskes, H. J., Piters, A. J. M., Schaap, M., Sauter, F. J., Kelder, H., and Levelt, P. F.: MAX-DOAS tropospheric nitrogen dioxide column measurements compared with the Lotos-Euros air quality model, Atmos. Chem. Phys., 15, 1313–1330, https://doi.org/10.5194/acp-15-1313-2015, 2015. a
WGE: Ozone pollution: Impacts on ecosystem services and biodiversity, ICP Vegetation Programme Coordination Centre, Tech. rep., Bangor, UK, available at: https://icpvegetation.ceh.ac.uk/ozone-pollution-impacts-ecosystem-services-and-biodiversity (last access: 15 November 2019), 2013. a
WHO: Air Quality Guidelines for particulate matter, ozone, nitrogen dioxide and sulfur dioxide: Global Update 2005, WHO Regional Office for Europe, Copenhagen, Denmark, 2006. a
WHO: Review of evidence on health aspects of air pollution, REVIHAAP project: technical report, Tech. rep., 301 pp., WHO, Copenhagen, Denmark, available at: http://www.euro.who.int/__data/assets/pdf_file/0004/193108/REVIHAAP-Final-technical-report-final-version.pdf?ua=1 (last access: 15 November 2019), 2013a. a
WHO: Health Risks of Air Pollution in Europe-HRAPIE Project: Recommendations for Concentration-Response Functions for Cost–Benefit Analysis of Particulate Matter, Ozone and Nitrogen Dioxide, Tech. rep., Copenhagen, Denmark, available at: http://www.euro.who.int/__data/assets/pdf_file/0017/234026/e96933.pdf?ua=1 (last access: 15 November 2019), 2013b. a