the Creative Commons Attribution 4.0 License.
the Creative Commons Attribution 4.0 License.
 | 25 Nov 2019
Gaseous, PM2.5 mass, and speciated emission factors from laboratory chamber peat combustion
Junji Cao
L.-W. Antony Chen
Qiyuan Wang
Jie Tian
Xiaoliang Wang
Steven Gronstal
Steven Sai Hang Ho
Adam C. Watts
Judith C. Chow
Peat fuels representing four biomes of boreal (western Russia and Siberia), temperate (northern Alaska, USA), subtropical (northern and southern Florida, USA), and tropical (Borneo, Malaysia) regions were burned in a laboratory chamber to determine gas and particle emission factors (EFs). Tests with 25 % fuel moisture were conducted with predominant smoldering combustion conditions (average modified combustion efficiency (MCE) ). Average fuel-based EF (carbon dioxide) are highest (1400 ± 38 g kg−1) and lowest (1073 ± 63 g kg−1) for the Alaskan and Russian peats, respectively. EFCO (carbon monoxide) and EF (methane) are ∼12 %–15 % and ∼0.3 %–0.9 % of EF, in the range of 157–171 and 3–10 g kg−1, respectively. EFs for nitrogen species are at the same magnitude as EF, with an average of 5.6 ± 4.8 and 4.7 ± 3.1 g kg−1 for EF (ammonia) and EFHCN (hydrogen cyanide); 1.9±1.1 g kg−1 for EF (nitrogen oxides); and 2.4±1.4 and 2.0 ± 0.7 g kg−1 for EF (total reactive nitrogen) and EF (nitrous oxide).
An oxidation flow reactor (OFR) was used to simulate atmospheric aging times of ∼2 and ∼7 d to compare fresh (upstream) and aged (downstream) emissions. Filter-based EF varied by > 4-fold (14–61 g kg−1) without appreciable changes between fresh and aged emissions. The majority of EF consists of EFOC (organic carbon), with EFOC ∕ EF ratios in the range of 52 %–98 % for fresh emissions and ∼14 %–23 % degradation after aging. Reductions of EFOC (∼7–9 g kg−1) after aging are most apparent for boreal peats, with the largest degradation in low-temperature OC1 that evolves at < 140 ∘C, indicating the loss of high-vapor-pressure semivolatile organic compounds upon aging. The highest EFLevoglucosan is found for Russian peat (∼16 g kg−1), with ∼35 %–50 % degradation after aging. EFs for water-soluble OC (EFWSOC) account for ∼20 %–62 % of fresh EFOC.
The majority (> 95 %) of the total emitted carbon is in the gas phase, with 54 %–75 % CO2, followed by 8 %–30 % CO. Nitrogen in the measured species explains 24 %–52 % of the consumed fuel nitrogen, with an average of 35 ± 11 %, consistent with past studies that report to 2∕3 of the fuel nitrogen measured in biomass smoke. The majority (> 99 %) of the total emitted nitrogen is in the gas phase, with an average of 16.7 % as NH3 and 9.5 % as HCN. N2O and NOy constituted 5.7 % and 2.9 % of consumed fuel nitrogen. EFs from this study can be used to refine current emission inventories.
- Article
(3410 KB) - Full-text XML
-
Supplement
(1633 KB) - BibTeX
- EndNote


Globally, peatlands occupy ∼3 % of the Earth's land surface, but they store as much as 610 gigatonnes (i.e., 610×1015 g) of carbon, representing 20 %–30 % of the planet's terrestrial carbon (Page et al., 2011; Rein et al., 2009). Peatland fires can persist for weeks to months and are dominated by the smoldering phase as opposed to the flaming phase of biomass burning (Stockwell et al., 2016; Hu et al., 2018). This results in lower combustion efficiencies, increased particulate matter (PM) emissions, and larger fractions of brown carbon (BrC) compared to black carbon (BC) or soot (Pokhrel et al., 2016). Peat fires emit reduced nitrogen compounds (e.g., ammonia, NH3; and hydrogen cyanide, HCN); volatile and semivolatile organic compounds (VOCs and SVOCs); and PM2.5 (PM with aerodynamic diameters < 2.5 µm) (Akagi et al., 2011; Yokelson et al., 2013). Peat smoke and ash affect ecosystem productivity, soil acidity, biogeochemical cycling, atmospheric chemistry, Earth's radiation balance, and human health. Warmer climates lower the water table in peatlands and change the pattern, frequency, and intensity of the peatland fires causing local- and regional-scale air pollution and visibility impairment (Page et al., 2002; Turetsky et al., 2010, 2015a, b). For Southeast Asia, fire-related regional air pollution and its effects on atmospheric visibility, ecosystems, and human health have been addressed in many studies (e.g., Behera et al., 2015; Betha et al., 2013; Bin Abas et al., 2004; Engling et al., 2014; Heil and Goldammer, 2001; Kundu et al., 2010; Levine, 1999; Hu et al., 2019; Tham et al., 2019; Fujii et al., 2017; Dall'Osto et al., 2014).
Nitrogen, one of the most important plant nutrients, affects global carbon and biogeochemical cycles (Crutzen and Andreae, 1990; Gruber and Galloway, 2008). Deposition of oxidized and reduced nitrogen species from biomass burning, such as gaseous nitric oxide (NO), nitrogen dioxide (NO2), and NH3 as well as particulate nitrate () and ammonium (), alters terrestrial ecosystems (Chen et al., 2010), while nitric acid (HNO3) contributes to soil acidification and excessive nitrification that reduce plant resistance to environmental stresses (Goulding et al., 1998). Gaseous nitrogen oxides (NOx) affect atmospheric chemistry through (1) reactions with hydroxyl (OH) and peroxy (HO2+RO2) radicals; (2) conversion to nitrate radical (NO3), dinitrogen pentoxide (N2O5), and acyl peroxy nitrates (particularly peroxyacetyl nitrate, PAN), which are important NOx reservoirs; and (3) formation of ozone (O3) and secondary organic aerosols (SOA) (Alvarado et al., 2010; Cubison et al., 2011; Ng et al., 2007). While NH3 neutralizes HNO3 to form particulate ammonium nitrate (NH4NO3), it may also react with alkanoic acids to form alkyl amides, nitriles, and ammonium salts that can also contribute to SOA formation (Na et al., 2007; Simoneit et al., 2003; Zhao et al., 2013). In addition, NH3 interacts with SOA to form BrC that further influence the aerosol radiative forcing (Updyke et al., 2012).
This study quantifies peat burning emission factors (EFs) for fresh and aged multipollutant mixtures through controlled burns in a laboratory combustion chamber with atmospheric aging simulated by an oxidation flow reactor (OFR). These tests are applied to peat samples from diverse parts of the world.
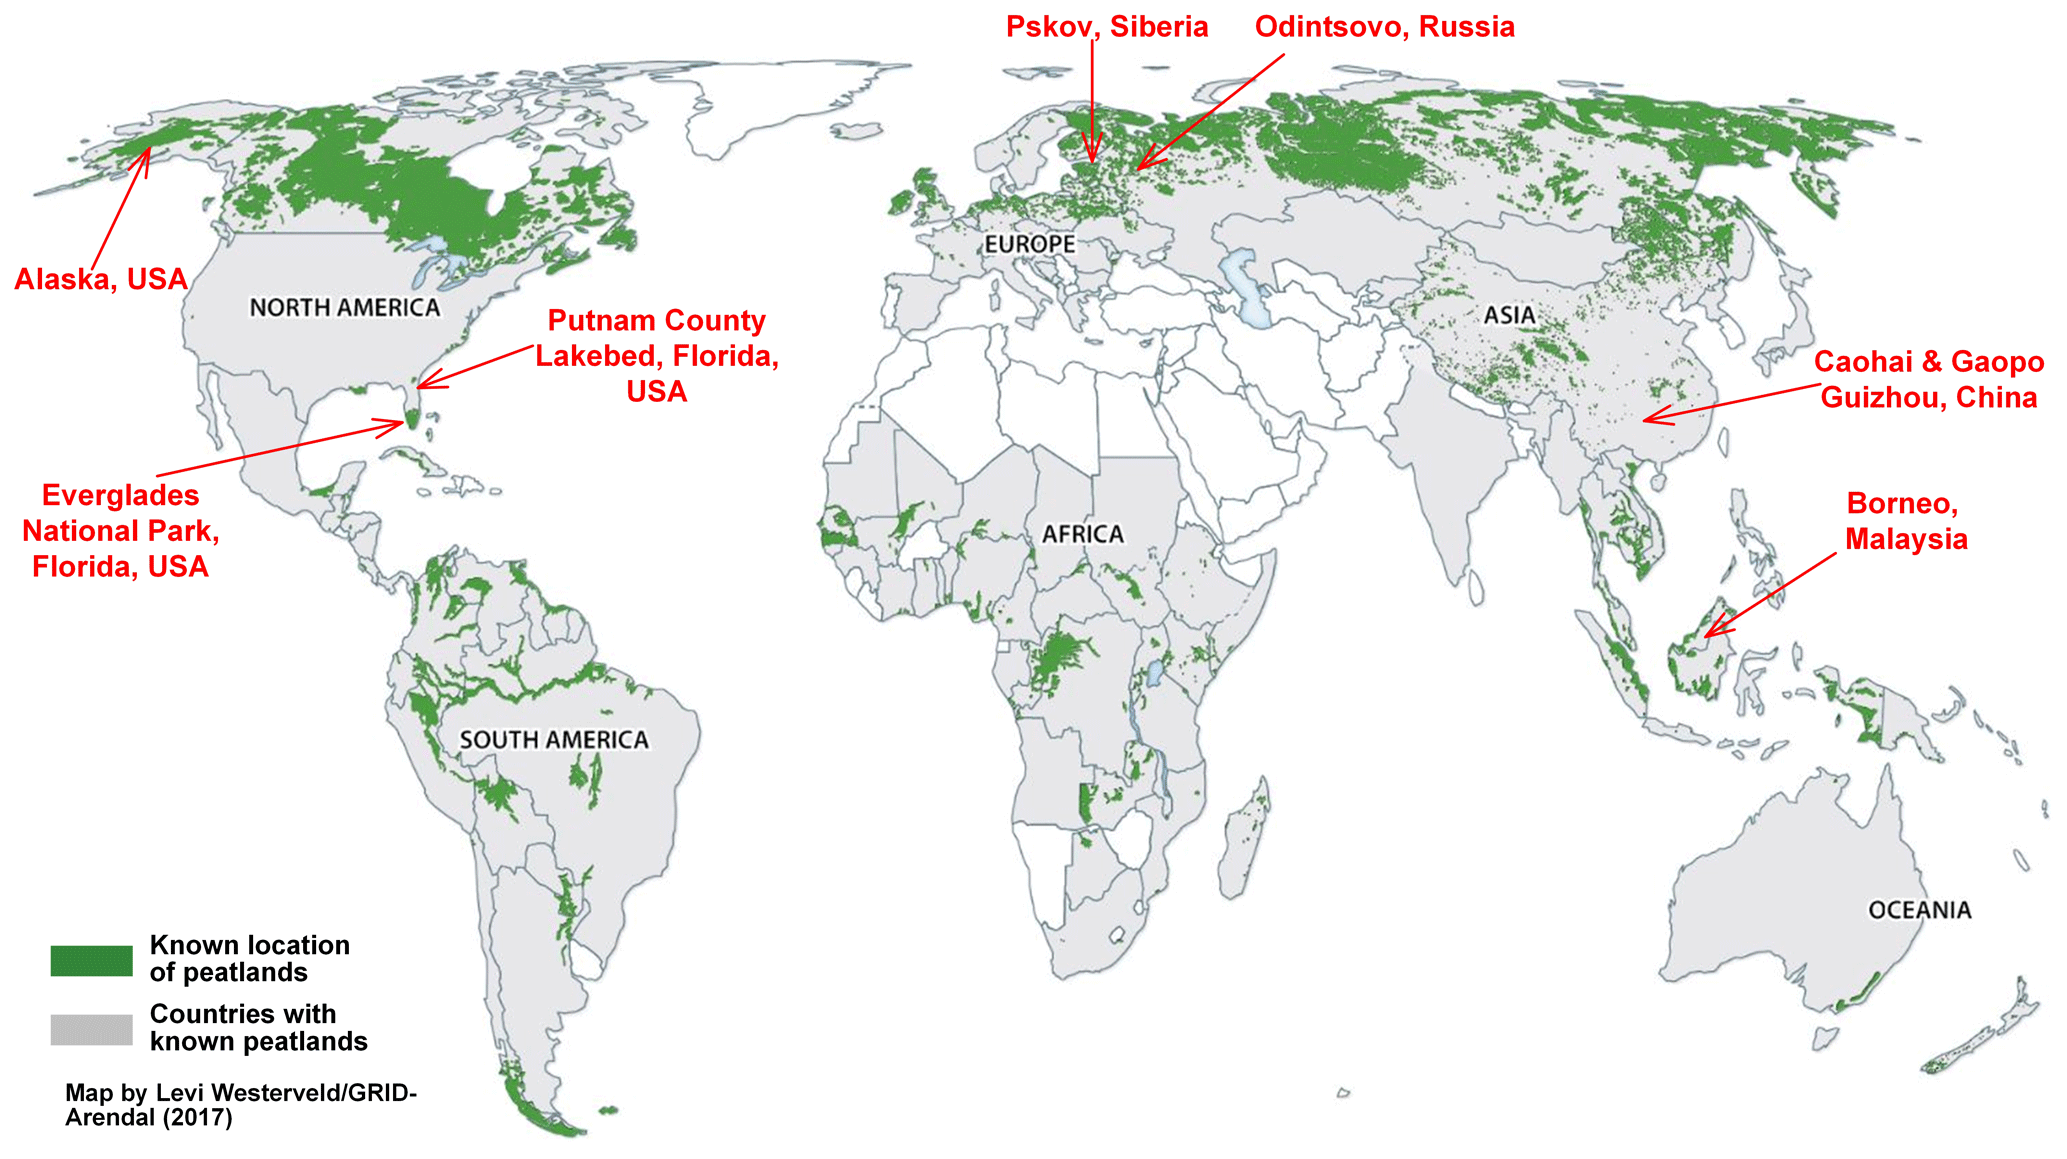
Figure 1Global distribution of peatlands (based on Yu et al., 2010). Samples were obtained from Odintsovo, Russia; Pskov, Siberia; black spruce forest, northern Alaska, USA; Putnam County Lakebed and Everglades National Park, Florida, USA; Caohai and Gaopo, Guizhou, China; and Borneo, Malaysia.
2.1 Fuel types
Peatlands are found all over the world, as illustrated in Fig. 1 (based on Yu et al., 2010), with large deposits found in the northern USA and Canada, northern Europe, Russia/Siberia, and southeast Asia. Eight types of peat fuels from different regions and climates were collected for testing, including boreal (i.e., Odintsovo, Russia; and Pskov, Siberia), temperate (i.e., black spruce forest, northern Alaska, USA), subtropical (i.e., northern (Putnam County Lakebed) and southern (Everglades National Park) Florida, USA; and Caohai and Gaopo, Guizhou, southern China), and tropical (i.e., Borneo, Malaysia) peats.
Representative peat samples of 250–1150 g from the upper 20 cm of the peatland surface were excavated for each region indicated in Fig. 1. As peat is a heterogeneous mixture of decomposed plant material, it can be formed in different wetlands under changing climates and nutrient contents (Turetsky et al., 2015a). Supplement Fig. S1 shows that the appearance of peat fuels varies by region.
To quantify carbon (C), hydrogen (H), nitrogen (N), sulfur (S), and oxygen (O) content, ∼2–3 g of each peat fuel was dried in a vacuum oven (∼105 ∘C) for 2 h prior to elemental analysis (Thermo Flash-EA 1112 CHNS/O Analyzer, Waltham, MA, USA).
Import and export regulations (USDA, 2010) require high-temperature heating of soil/peat fuels as part of the sterilization process. Peat fuels were heated to 90 ∘C and weighed every 24 h to achieve a stable dry mass with ∼0.16 % moisture by weight content (after ∼96 h of heating). The low heating temperature (i.e., below the water boiling point) minimized VOC losses, although some compounds with high volatilities could have been removed at 90 ∘C. To better simulate the field conditions during peat fires, distilled–deionized water (DDW) was added to rehydrate the dry peat and achieve a fuel moisture of ∼25 % (by weight) before each experiment (Yatavelli et al., 2017). To examine the effects of fuel moisture on emissions, additional experiments (n=3) were conducted at 60 % fuel moisture content (by weight) for the Putnam (FL) peat.
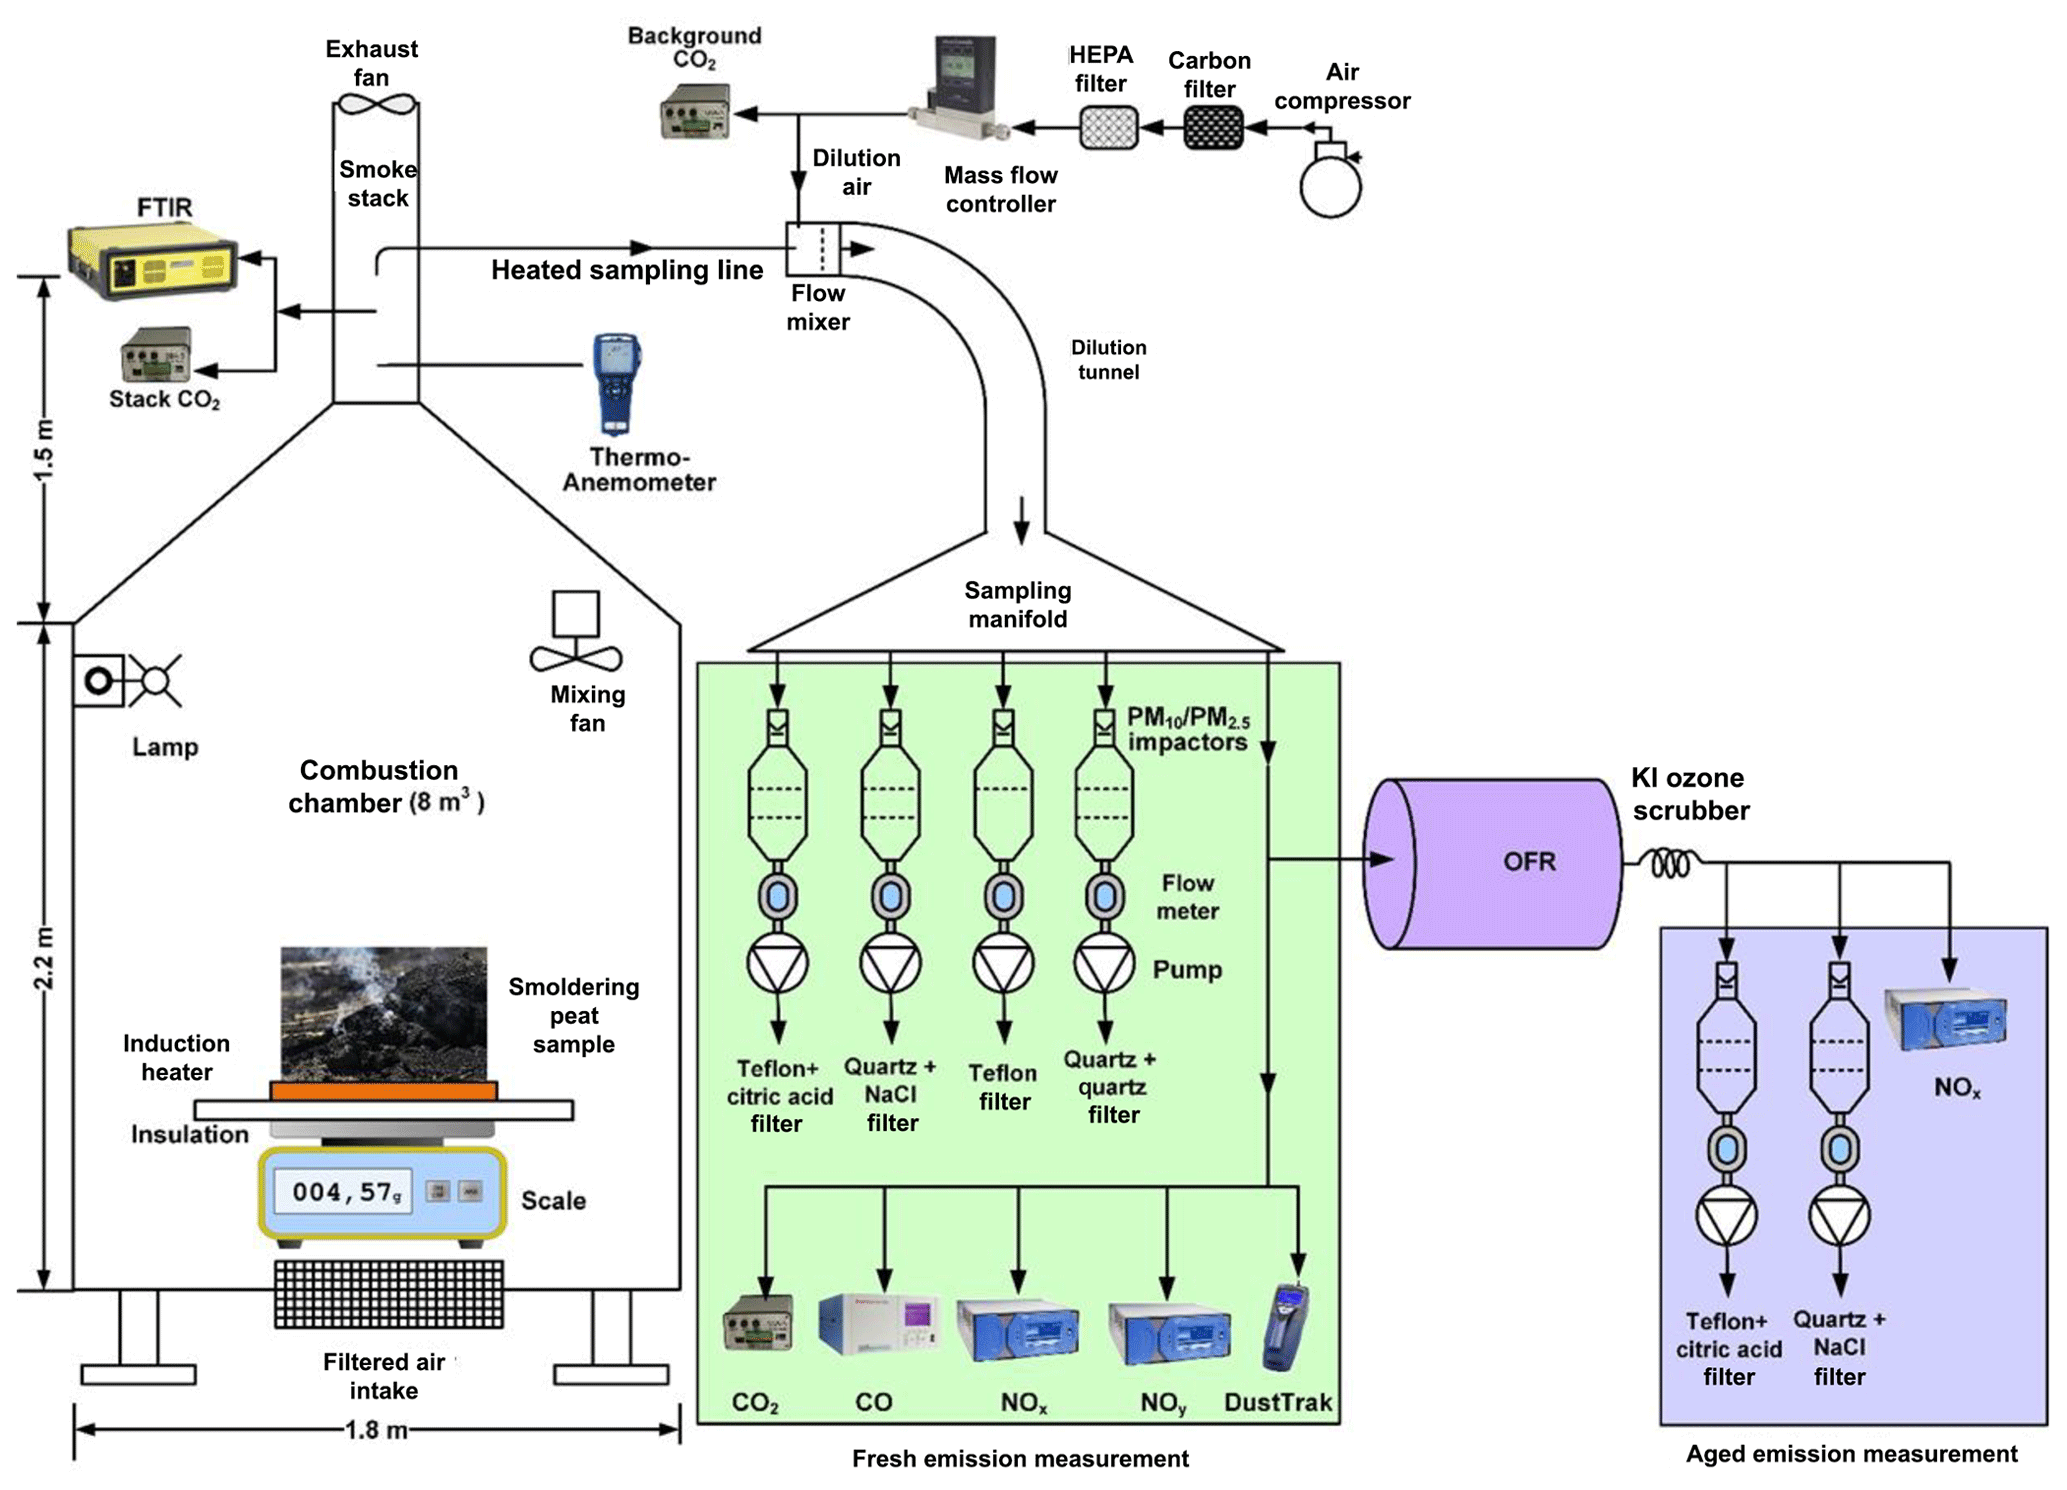
Figure 2Configuration for peat combustion experimental setup. (FTIR: Fourier transform infrared spectrometer; OFR: oxidation flow reactor; OFR lamps were operated at 2 and 3.5 V to simulate aging of ∼2 and 7 d, respectively.)
2.2 Experimental setup
The laboratory setup shown in Fig. 2 used a biomass combustion chamber with a volume of ∼8 m3 (1.8 m (W) × 1.8 m (L) × 2.2 m (H)) (Tian et al., 2015). Instrument specifications and operating principles are shown in Table S1 in the Supplement. The chamber is made of 3 mm thick aluminum to withstand high-temperature heating. A blower supplied air filtered by a charcoal bed and a high-efficiency particulate air (HEPA) filter near the bottom of the chamber to remove background gas and particle contaminants. The ventilation rate was controlled by the blower and exhaust fan at ∼2.65 m3 min−1, resulting in a smoke residence time of ∼3 min in the chamber assuming a well-stirred flow model.
For each test, ∼10–30 g of dried peat was placed in an asbestos-insulated circular container on top of an induction heater that provided heating during the first ∼5–10 min of combustion (see Fig. S2). This method replaced a propane torch used in initial test burns, thereby minimizing non-peat burning emissions. The smoldering process is usually self-propagating and sustained by heat conduction and radiation, with fuel mass continuously monitored by a scale underneath the induction heater (Ohlemiller et al., 1979).
Continuous PM2.5 mass concentrations were monitored with a DustTrak (TSI model 8532, Shoreview, MN, USA) (Wang et al., 2009) (Table S1). When PM2.5 concentrations reached their maximum and started to decline, the induction heater was turned off. The fuel was consumed with diminished smoke emissions after ∼20 min. Preliminary tests were conducted using ∼10–20 g of fuel and a dilution ratio of ∼3 to 5, yielding sufficient particle loadings on the filters (∼150–290 µg per 47 mm filter disc). To achieve higher filter deposits of 300–600 µg per filter that accommodate comprehensive organic speciation, additional fuels (∼15–20 g) were added with the induction heater turned on for another ∼10 min. Sampling continued until the concentrations returned to background level.
Sampling ports for stack concentrations of carbon dioxide (CO2) and multiple gases by Fourier transform infrared (FTIR; model DX 4015; Gasmet Technologies Oy, Finland) spectroscopy were located ∼1 m above the top of the chamber roof in the exhaust duct (Fig. 2). The FTIR spectrometer measured gaseous emissions prior to dilution to obtain enhanced signal-to-noise ratios for trace gases (Jaakkola et al., 1998). An exhaust gas sample was drawn into the FTIR where the infrared (IR) absorption spectra in the wave number range of 900–4200 cm−1 were measured. The instrument software compares the measured absorption spectra with reference gas absorption spectra in the calibration library to identify gas species and calculate concentrations. Examples of reference gas spectra and an Everglades (FL) peat sample spectrum are plotted in Fig. S3.
Smoke from the chamber was drawn through a dilution sampling manifold where the exhaust was diluted with clean air to achieve cooling that allowed for condensation of SVOCs. A portion of the exhaust was directed through a potential aerosol mass (PAM)-OFR (Aerodyne Research Inc., Billerica, MA, USA) to simulate atmospheric aging prior to quantification by the sampling instruments shown in Fig. 2. The 185 and 254 nm (OFR185) ultraviolet (UV) lamps in the OFR were operated at 2 and 3.5 V with 10 L min−1 flow rate to simulate intermediate-aged (∼2 d) and well-aged (∼7 d) emissions, assuming an average daily OH concentration of 1.5×10⁶ molecules cm−3. The estimated OH exposures (OHexp) at 2 and 3.5 V were 2.6×10¹¹ and 8.8×10¹¹ molecules s cm−3 based on the measured decay of sulfur dioxide (SO2) (Cao et al., 2019). Due to external OH reactivity from carbon monoxide (CO), NOx, and other reactants, these OHexp levels represent upper limits of the actual OH exposures inside the OFR (Peng et al., 2015; Li et al., 2015).
Oxides of nitrogen were measured as NOx (the sum of NO and NO2) and total reactive nitrogen (NOy, including NO, NO2, N2O5, HNO3, HNO4, ClONO2, HONO, alkyl nitrates, and PAN) by chemiluminescence NOx and NOy analyzers (Ballenthin et al., 2003; Allen et al., 2018). The NOx analyzers placed upstream and downstream of the OFR determined NOx changes with OHexp in the OFR. There are known interferences for the nonselective catalytic converter in the chemiluminescent NOx analyzer and for spectroscopic absorption in the FTIR (Allen et al., 2018; Prenni et al., 2014; Villena et al., 2012). The chemiluminescence monitor converts most nitrogenous compounds to NO, with HNO3 and PAN being the most important potential interferents (Winer et al., 1974). However, much of the available HNO3 and PAN is removed by the tubing leading to the molybdenum converter in the standard NOx analyzer, which is why the NOy analyzer locates the converter at the inlet. Allen et al. (2018) found no significant differences between NOx measurements of biomass burning plumes when comparing a chemiluminescent analyzer with more specific UV absorption measurements.
The following analyses are based on (1) the commercial NOx analyzers for NO, NO2, and NOx (NO+NO2 as equivalent NO2); (2) the NOy analyzer for total reactive nitrogen; and (3) the FTIR spectrometer for trace gas measurements of methane (CH4), NH3, HCN, nitrous oxide (N2O), and 13 low-molecular-weight carbon compounds (C1–C6).
PM2.5 filter packs were sampled upstream and downstream of the OFR to characterize fresh and aged emissions, respectively, with MiniVol PM2.5 samplers (Airmetrics, Springfield, OR, USA) operated at 5 L min−1 flow rate per channel. PM2.5 mass, elements, carbon, water-soluble organic carbon (WSOC), ions, carbohydrates, organic acids, and gaseous NH3 and HNO3 were obtained from the paired upstream and downstream filter samples to examine changes in speciated EFs and source profiles with photochemical aging. Average filter-based EFs are examined by peat types and aging times (i.e., denoted as fresh 2 vs. aged 2 and fresh 7 vs. aged 7) (Chow et al., 2019).
2.3 Filter pack measurements
PM2.5 mass and major chemical species concentrations were obtained from the parallel Teflon-membrane and quartz-fiber filters (Teflo©, 2 µm pore size, R2PJ047 and Tissuquartz 2500 QAFUP, Pall Life Sciences, Port Washington, NY, USA). Teflon-membrane filters were equilibrated in a temperature (20–23 ∘C) and relative humidity (30 %–40 %) controlled environment for a minimum of 48 h prior to gravimetric analysis by a microbalance with ± 1 µg sensitivity (Watson et al., 2017). This was followed by multielemental analysis by X-ray fluorescence (Watson et al., 1999). Quartz-fiber filters were prefired at 900 ∘C for 4 h to minimize organic artifacts. A portion (0.5 cm2) of the quartz-fiber filter was submitted for organic, elemental, and brown carbon (OC, EC, and BrC) analysis following the IMPROVE_A thermal/optical reflectance (TOR) protocol (Chow et al., 2007, 2015). Half of the quartz-fiber filters was extracted in DDW for ionic speciation (i.e., chloride, Cl−; nitrate, ; nitrite, ; sulfate, ; water-soluble sodium, Na+, and potassium, K+; ammonium, ; 17 carbohydrates; and 10 organic acids) by ion chromatography (Chow and Watson, 2017) and for WSOC by combustion and nondispersive infrared detection. Citric acid and sodium chloride impregnated cellulose-fiber filters placed behind the Teflon-membrane and quartz-fiber filters, respectively, acquired NH3 as and HNO3 as volatilized nitrate, respectively, with analysis by ion chromatography. Details on chemical analyses can be found in Chow et al. (2019).
The open face sampling manifold allows homogenous particle deposits on 47 mm filters (Watson et al., 2017). To test the uniformity of particle deposits, five individual punches were removed from the center and each quadrant of the 47 mm quartz-fiber filter disc for carbon analyses. Table S2 shows total carbon (TC = OC + EC) concentration variations of 1.7 % to 5 % across the filters for the five test burns, within the overall uncertainty of the emission estimates.
2.4 Modified combustion efficiency and fuel-based emission factors
The modified combustion efficiency (MCE) is defined as the ratio of background-subtracted CO2 to the sum of CO2 and CO (Ward and Radke, 1993):
where ΔCO2 and ΔCO are CO2 and CO concentrations above background. MCE provides a real-time indicator of the combustion status (e.g., MCE > ∼0.9 for flaming and MCE < ∼0.85 for smoldering).
Each burn was completed when concentrations of pollutants measured online (i.e., CO, NOx, NOy, and PM2.5) returned to the baseline/background levels. Dilution ratios ranging from 2.7 to 5 were taken into account when calculating EFs. Fuel-based EFs are calculated based on carbon mass balance, expressed as grams of emission per kilogram of dry fuel (g kg−1) burned (Wang et al., 2012). For gaseous and particle species i, the time-integrated EFi is
where CMFfuel is the carbon mass fraction of the fuel in kilograms of carbon per kilogram of fuel; Ci, , CCO, , and are the background-subtracted concentrations for species i (e.g., nitrogen or PM2.5 species), CO2, CO, CH4, and other carbon compound (C1–C6) species j in milligrams per cubic meter (mg m−3) under standard conditions (temperature =293 K and pressure =1 atm), respectively; PMc is the total carbon concentration of PM2.5 in milligrams per cubic meter (mg m−3); MC, , MCO, , and are the atomic or molecular weights of carbon, CO2, CO, CH4, and carbon compound species j in milligrams per mole, respectively; nj is the number of carbon atoms in carbon compound j; and the factor 1000 converts kilograms to grams. All concentrations are converted to stack concentration; i.e., species measured after dilution are adjusted by the dilution ratio. Equation (2) assumes that the carbon mass in unmeasured carbon compounds and other emissions not listed above is negligible compared to that in CO2, CO, CH4, measured carbon compounds (C1–C6), and PM2.5 carbon.
2.5 Estimation of wall losses
Gas and particle wall losses can result in some underestimation of measured EFs, but it is well within the measurement uncertainties of ± 15 %. Losses can occur inside the combustion chamber, in the exhaust stack, sampling lines, and inside the OFR. Due to the low surface-to-volume ratio of the chamber (2.9 m−1) and short residence time (∼3 min) in this study, the gas and particle losses are expected to be low in the combustion chamber. Grosjean (1985) estimated an NH3 loss rate of 4– min−1 in a small Teflon chamber (3.9 m3) with a surface-to-volume ratio of 3.8 m−1, resulting in < 0.5 % NH3 wall loss. Even though the NH3 accommodation coefficient might be higher for aluminum than Teflon (Neuman et al., 1999), the chamber wall loss in this study is expected to be < 5 % for NH3. To reduce wall losses of sticky gases, the FTIR sampled exhaust gas from the stack without dilution, as shown in Fig. 2. Approximately 9 % NH3 would encounter the stack wall due to turbulent diffusion (Hinds, 1999). The maximum NH3 loss in the stack is < 9 %, and the maximum overall NH3 loss is < 14 %. Losses of less sticky gases would be lower.
The particle wall loss rates by McMurry and Grosjean (1985) and Wang et al. (2018) indicate < 5 % particle number losses for 10 nm–2.5 µm in a similar chamber. Particle losses by turbulent diffusion in the stack are also low (< 0.5 %). For a 2 m long horizontal heated sampling line in this study (Fig. 2), particle losses by diffusion and gravitational settling are negligible (< 0.1 %) for 10 nm–1 µm particles and ∼6 % for 2.5 µm particles. Earlier measurements showed that the dilution tunnel had ∼100 % penetration for 0.5–5 µm particles (Wang et al., 2012). Therefore, maximum particle losses in this study are estimated to be < 5 % for 10 nm–1 µm and < 10 % for 2.5 µm. Past studies (Lambe et al., 2011; Bhattarai et al., 2018; Karjalainen et al., 2016) showed that particle number losses through the OFR may be ∼50 % for 20 nm and < 10 % for > 100 nm particles, with a negligible effect on mass concentration.
Table 1Average peat composition* (dry weight percentage) for total carbon (C), hydrogen (H), nitrogen (N), sulfur (S), and oxygen (O).
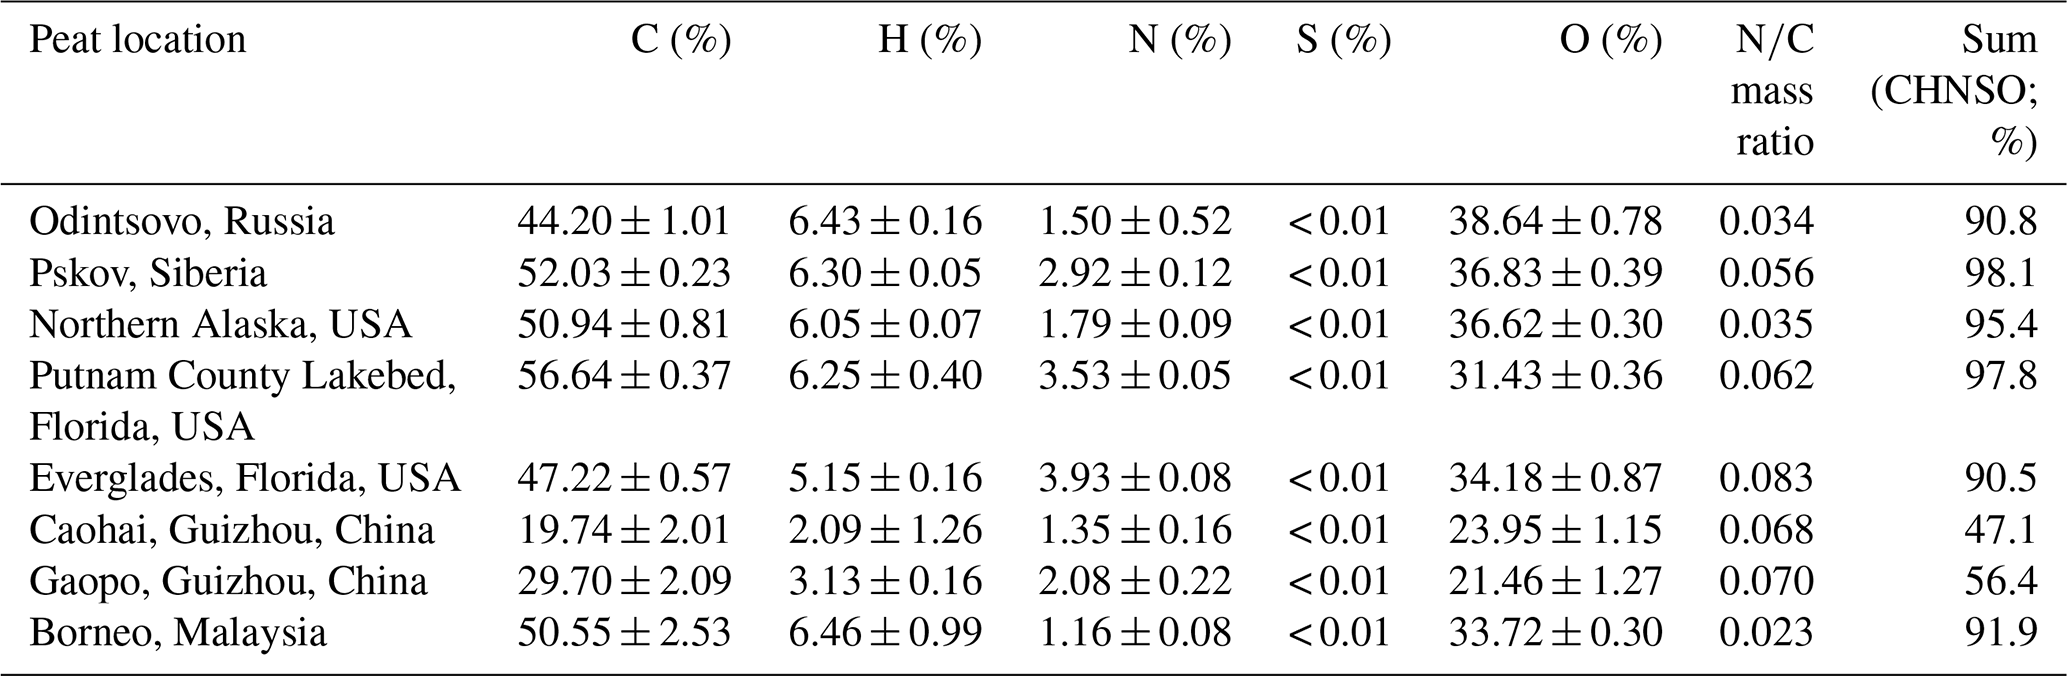
* Elemental analyses were performed using an elemental analyzer (Flash-EA1112 CHNS/O Analyzer, Thermo Fisher Scientific, Waltham, MA, USA). Each dried peat sample (∼2–3 g) was submitted for combustion analysis at 900 ∘C for C, H, N, and S in a helium/oxygen atmosphere and at 1060 ∘C for O in a helium atmosphere. Three to four replicate sample analyses were conducted for each type of peat to obtain the average and standard deviations.
3.1 Fuel composition
Table 1 shows that peat contains 44 % C–57 % C and 31 % O–39 % O with the exception of the two Guizhou, China, peats (20 % C–30 % C and 21 % O–24 % O). The carbon content (50.6 ± 2.5 % C) in the Borneo, Malaysia, peat is within the range of carbon fractions reported for the Kalimantan and Sumatra, Indonesia, peat (44 % C–60 % C) (Christian et al., 2003; Hatch et al., 2015; Iinuma et al., 2007; May et al., 2014; Setyawati et al., 2017). The low carbon content (20 % C–30 % C) of Guizhou peats is similar to the 28 % C–30 % C reported for two eastern North Carolina, USA, peats (Black et al., 2016).
Hydrogen contents of 2 % H–7 % H in Table 1 are consistent with abundances found elsewhere, including (1) ∼6 % H for northern Minnesota, USA, peat (Yokelson et al., 1997); (2) ∼2 % H–3 % H for the eastern North Carolina peat (Black et al., 2016); and (3) ∼5 % H–7 % H for Indonesian peats (Iinuma et al., 2007; Christian et al., 2003; Hatch et al., 2015). Sulfur (S) contents are below detection limits (< 0.01 %), and nitrogen contents are 1 % N–4 % N. Ratios of N∕C are 0.02–0.08, consistent with the reported N∕C ratios of (1) 0.036 for Neustädter Moor, northern Germany (Iinuma et al., 2007); (2) 0.017–0.04 for Ireland and the United Kingdom (Wilson et al., 2015); (3) 0.02–0.03 for Alberta and Ontario, Canada (Stockwell et al., 2014); (4) 0.062 for Minnesota, USA (Yokelson et al., 1997); (5) 0.022–0.03 for the eastern coast of North Carolina, USA (Black et al., 2016); and (6) 0.036–0.039 for Kalimantan and Sumatra, Indonesia (Christian et al., 2003; Hatch et al., 2015).
The sum of elements (i.e., C, H, N, S, and O) accounts for 91 %–98 % of total mass except for the Guizhou peats (47 %–56 %). As Guizhou peats appear to be a mixture of peat and soil, these samples may represent degraded peats (Miettinen et al., 2017) or contain additional minerals or high ash contents, similar to North Carolina peats (44 %–62 % ash, Black et al., 2016). Therefore, these peats were only used for preliminary testing of sample ignition and heating to optimize burning conditions. Overall, the six other peats in Table 1 represent biomes from different regions of the world.
3.2 Emission factors (EFs)
Table S3 summarizes the 40 peat combustion tests with the peat masses before and after each burn. The afterburn residue may have contained unburned peat as well as noncombustible ash. The residues were not analyzed for carbon and nitrogen contents. A few samples were voided due to sampling abnormalities. The following analyses are based on the 32 paired (fresh vs. aged) samples at 25 % fuel moisture and 3 paired samples at 60 % fuel moisture. The amount of fuel consumed per test ranged from 21 to 48 g for all but Russian peat (14–15 g) due to limited supply.
PM2.5 mass concentrations, in the range of 328–2277 µg m−3, are 1 to 2 orders of magnitude higher than those commonly measured at ambient monitoring sites. Typical sample durations from ignition to completion were ∼40–60 min, except for the Everglades (FL) peats that took longer (up to 135 min). Similar particle loadings (mostly within ± 20 %) were found for downstream (aged) and upstream (fresh) samples. The exception is Everglades (FL) peat, where prolonged sample durations and 7 d aging times resulted in higher downstream particle loadings with ratios of aged/fresh mass concentrations ranging from 1.6 to 2.0.
Table 2Peat combustion emission factors (EFs) for CO2, CO, and CH.
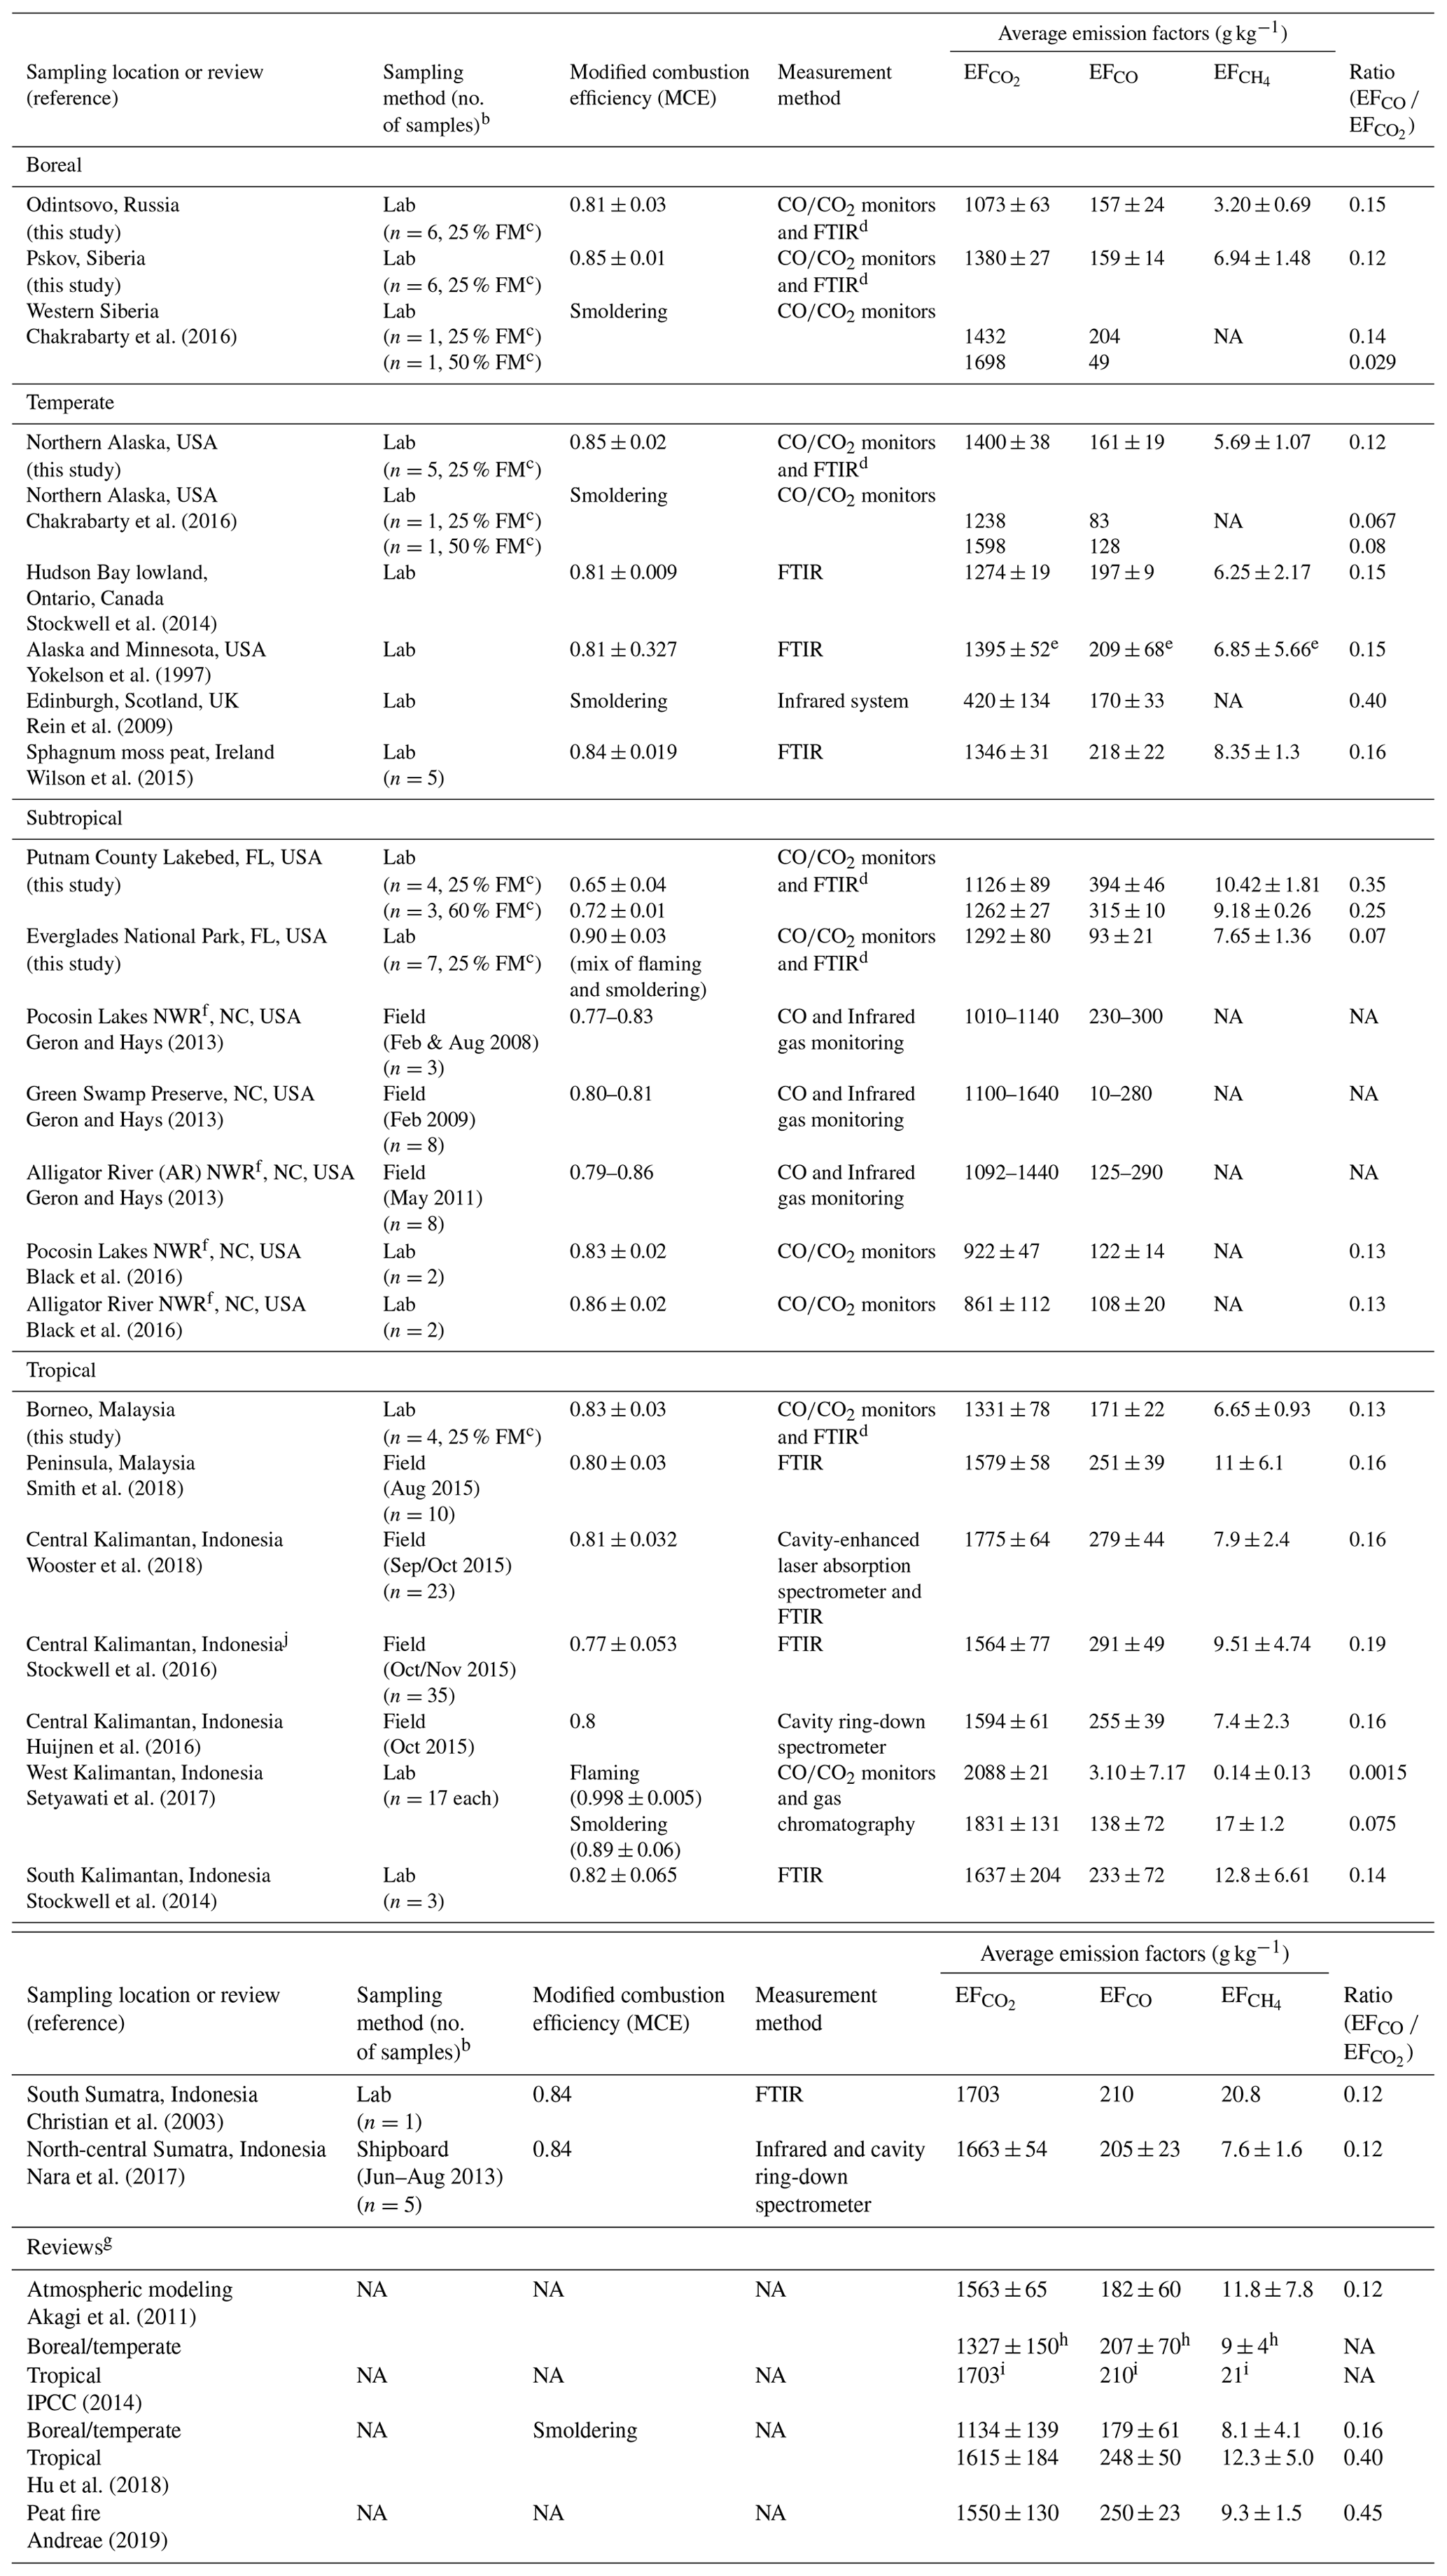
a Data acquired from this study are so designated. b Only included number of samples reported. c FM; fuel moisture content. d FTIR: Fourier transform infrared spectroscopy. CH4 was acquired by FTIR in this study. e Obtained from Stockwell et al. (2014) as only the ratios of moles compound/total moles carbon detected was reported in Yokelson et al. (1997). f NWR: National Wildlife Reserve. g Reviews for atmospheric modeling and emission inventory development. h From Ward and Hardy (1984); Yokelson et al. (1997, 2013). i From Christian et al. (2003) for tropical peats. j Detailed volatile organic gas emission factors for one of these samples are reported by Koss et al. (2018).
3.2.1 Gaseous carbon emission factors
Individual and average carbonaceous gas EFs are summarized in Table S4. As shown in Fig. S4, variations by biome are found among the different peats with relative standard deviations ranging from 2 % to 27 %. The largest EFs are found for CO2 (EF), ranging from 994 to 1455 g kg−1, which are 1 to 2 orders of magnitude higher than the corresponding EFCO and EF. Average EF varied by > 30 % among biomes, ranging from 1073 ± 63 g kg−1 to 1400 ± 38 g kg−1 for the Russian and Alaskan peats, respectively.
Muraleedharan et al. (2000) reported the first laboratory-combustion EFs of 150–185 g kg−1 for EF, 15–37 g kg−1 for EFCO, and 6–11 g kg−1 for EF on a wet mass basis for Brunei peat with a 51.4 % moisture content. Table 2 shows studies conducted over the past decade, with more field monitoring during the 2015 El Niño–Southern Oscillation (ENSO) period in Indonesia. Open path (OP)-FTIR was commonly used to acquire gaseous emissions with MCEs ranging from 0.77 to 0.86, consistent with smoldering combustion. A limited number of burns (n of 1 to 6) were conducted in laboratories using combustion chambers, whereas a larger number of in situ field-burn samples (n of 17 to 35) were acquired for southeast Asian peats (Wooster et al., 2018; Setyawati et al., 2017; Stockwell et al., 2016).
Table 2 exhibits > 2-fold variations in EF among studies. The highest EF with the lowest variability was found for tropical peats (ranges 1331–1831 g kg−1 for smoldering). Average EF (1331 ± 78 g kg−1) for Malaysian peat (n=6) from this study is ∼16 % and ∼18 % lower than the 1579±58 and 1615 ± 184 g kg−1 for Peninsula, Malaysia (Smith et al., 2018), and average boreal/temperate peats (Hu et al., 2018), respectively. Malaysian peat EF measured in this study is 20 % lower than the 1681 ± 96 g kg−1, averaged from seven studies of Kalimantan and Sumatra, Indonesia, peats (Christian et al., 2003; Stockwell et al., 2014; Huijnen et al., 2016; Nara et al., 2017).
Overall average EF values (1269 ± 139 g kg−1, n=32) from this study (Table S4) are ∼19 %–25 % lower than the 1563 ± 65 g kg−1 for peatland fires used in atmospheric models (Akagi et al., 2011), 1550±130 g kg−1 in a recent review (Andreae, 2019), and 1703 g kg−1 (Christian et al., 2003) adopted by the 2014 Intergovernmental Panel on Climate Change (IPCC) for organic soil fire inventories (IPCC, 2014). EFs derived from this study cover four biomes which may improve global emission estimates.
Average EFCO is typically ∼12 %–15 % of EF in the range of 157–171 g kg−1 for all but the two Florida peats with 394 ± 46 g kg−1 (MCE .04) and 93 ± 21 g kg−1 (MCE ) for the Putnam and Everglades peats, respectively (Tables S4 and 2). This is consistent with a higher EFCO under lower MCEs reported by Setyawati et al. (2017) – a 45-fold increase from 3.1 ± 7.2 g kg−1 for flaming (MCE ) to 138 ± 72 g kg−1 for smoldering (MCE ) combustion.
Average EFCO values of 157–161 g kg−1 for boreal and temperate peats are ∼10 % lower than the 179 ± 61 g kg−1 from Hu et al. (2018). The overall average EFCO of 175 ± 92 g kg−1 from this study is ∼4 % lower than the 182 ± 60 g kg−1 in Akagi et al. (2011), ∼30 % lower than the 250 ± 23 g kg−1 in Andreae (2019), and ∼15 % lower than the 207–210 g kg−1 used in IPCC (2014).
Average EF is ∼0.3 %–0.9 % of EF, lowest for cold climates with 3.2–6.9 g kg−1 for the boreal and temperate peats and 6.7–10.4 g kg−1 for the subtropical and tropical peats (Table S4). Table 2 shows that EF values for Malaysian and Indonesian peats exceed ∼10 g kg−1 in five of the eight past studies. These EFs are more in line with the 11.8 ± 7.8 g kg−1 in Akagi et al. (2011), 9.3 ± 1.5 g kg−1 in Andreae (2019), and 9–21 g kg−1 in IPCC (2014) but are higher than the average (6.6 ± 2.4 g kg−1) found in this study.
Emission factors depends on both fuel composition and combustion conditions. Figure S5a shows that total measured gas and particle carbon increases with fuel carbon content for the six types of peat. EF increases with fuel carbon content (Fig. S5b) except for the Putnam (FL) peat, which has the highest fuel carbon (56.6±0.37 %) but low EF. It has high EFCO and EFTC (Fig. S5c–d), consistent with its low MCE (0.65±0.04). EFCO and EFTC do not show a clear trend with fuel carbon content; however, EF increases with fuel carbon (Fig. S5e) but decreases with fuel oxygen content (Fig. S5f).
3.2.2 Gaseous nitrogen emission factors
Individual and average gaseous nitrogen species EFs are summarized in Table S5. EFNO and EF (Fig. S6b) are low in the range of 0.2–2.1 g kg−1. For fresh emissions, most of the NOx (NO+NO2) is present as NO. After the OFR, NO decreased while NO2 increased, as shown in Fig. S7. A low correlation coefficient (r=0.67) between the downstream and upstream EF suggests the changes of NO∕NO2 ratios between the fresh and aged emissions as well as variabilities among tests.
Table 3Peat combustion emission factors (EFs) for gaseous nitrogen speciesa.

a Data acquired from this study are so designated. b Data acquired from Fourier transform infrared (FTIR) spectroscopy for this study. c Data acquired from the NOx instrument upstream of the oxidation flow reactor for this study. d Data acquired from the NOy instrument for this study. e Reported as NOx. f The reported NOx as NO was converted to NOx as NO2 for comparison. g Reviews for atmospheric modeling and emission inventory development.
Table 3 shows that most studies do not report EFNO or EF, partially due to the low concentrations and large variabilities under atmospheric aging. Stockwell et al. (2016, 2014) reported 0.31–1.85 g kg−1 EFNO and 2.31–2.36 g kg−1 EF for Indonesia peats. These levels are much higher than the EF (as NO2) of 0.75 ± 0.10 g kg−1 for Malaysian peat in this study.
Emissions for reactive nitrogen, EF (as NO2), ranged from 0.61 to 6.3 g kg−1 with an average of 2.4 ± 1.4 g kg−1 (Table S5). EF > 2.5 g kg−1 are found for the two Florida peats (Fig. S6c) with an average of 4.3 ± 1.1 g kg−1 for Everglades, which reports the highest nitrogen content (3.93 ± 0.08 %) among peats (Table 1). Figure S5g shows that EFNO increases with fuel nitrogen content, while EF is not dependent on fuel nitrogen content (Fig. S5h). Because EFNO is higher than EF, EF and EF increase with fuel nitrogen content (not shown). Figure S8 shows that ∼74 % of the NOy is NOx with a high correlation coefficient (r=0.93). Nitrogen oxides are typically converted to other oxidized nitrogen species within 24 h after emission (Seinfeld and Pandis, 1998; Prenni et al., 2014). The ratio of NOx∕NOy has been used to infer photochemical aging (Kleinman et al., 2003, 2007; Olszyna et al., 1994; Parrish et al., 1992). The high NOx∕NOy ratios suggest that NOx had not been converted to other reactive nitrogen species in the diluted peat plume.
Nitrous oxide (N2O), an inert form of oxide from nitrogen with an atmospheric lifetime of ∼110 years, commonly emitted from fossil fuel, solid waste fertilizers, and biomass combustion, is a greenhouse gas defined by the U.S. EPA (2016). Table S5 shows that EF are similar to EF except for Everglades (FL) peat with low EF (1.5 ± 0.3 g kg−1), in the range of 1.1–4.4 g kg−1 and average of 2.0 ± 0.7 g kg−1. The highest average EF (3.6 ± 0.6 g kg−1) is found for Putnam (FL) peat (Fig. S6c).
Hydrogen cyanide (HCN), a known emission from biomass burning (Li et al., 2000; Stockwell et al., 2014), exhibits > 7-fold differences (1.8–14 g kg−1) in EFHCN (Table S5). The average EFHCN (11.5±2.3 g kg−1) for Putnam (FL) peat is 2- to 5-fold higher than for the other biomes (Fig. S6a). Table 3 shows large EFHCN variations among studies, from 0.73 ± 0.50 g kg−1 (Ireland, Wilson et al., 2015) to 5.75 ± 1.60 g kg−1 (Indonesia, Stockwell et al., 2016). More consistent EFHCN values are found for tropical peats in the range of 3–6 g kg−1. Average EFHCN values in this study, 4.7 ± 3.1 g kg−1, are in line with the 5.0 ± 4.9 and 4.4 ± 1.2 g kg−1 reported by Akagi et al. (2011) and Andreae (2019).
EF values (0.4–8.3 g kg−1) are of the same magnitude as EFHCN (Fig. S6a) and independent of fuel nitrogen content (Fig. S5i) except for the Everglades (FL) peat (9–18 g kg−1), which has the highest fuel nitrogen content. Total reduced nitrogen emissions, EF EFHCN, for the two Florida peats (12–25 g kg−1) are ∼2- to 3-fold higher than those for other regions. Table 3 also shows high variabilities in EF among studies (1–12 g kg−1). The overall average of 5.6 ± 4.8 g kg−1 in this study is consistent with the 4.2 ± 3.2 g kg−1 in Andreae (2019) but ∼50 % of the 10.8 ± 12.4 g kg−1 in Akagi et al. (2011). The high standard deviations associated with these averages signify large variabilities among experiments.
Figure S9a shows some difference in EF determined by FTIR and the impregnated filter, especially at high concentrations. The regression slope shows that EF by the FTIR was ∼22 % lower than that of filters with a correlation coefficient of 0.76. Variable baselines in the FTIR measurements along with some nitrogen content in the diluted air and breath NH3 (Hibbard and Killard, 2011) in the testing laboratory may have contributed to these variations. The impregnated filter collects all of the NH3 over the sampling period, including amounts that are below the FTIR detection limits, so it is probably better representing the time-integrated EF. Reduction of EF is most apparent after atmospheric aging in Fig. S9b (slope of 0.11), with 2–14 g kg−1 in fresh emissions and reduced to ∼0.5–3 g kg−1 after aging.
3.2.3 PM2.5 mass and carbon emission factors
Continuous PM2.5 from the DustTrak with the factory calibration factor yielded PM2.5 EFs 3 to 5 times higher than of those derived from gravimetric analyses, higher than the 2-fold mass differences by Wooster et al. (2018). This discrepancy is well known as the factory calibration uses Arizona road dust with a size distribution that is much coarser than that of biomass burning. Therefore, EF is calculated from the filter samples. Chow et al. (2019) present the species abundances in PM2.5 mass for this study based on the average fresh and aged profiles, separated by 2 and 7 d photochemical aging times simulated with the OFR (Aerodyne, 2019). The same approach is used in Table S6 to compare fresh and aged particle EFs. Comparisons between combined fresh vs. aged EFs for PM2.5 mass, carbon (OC, EC, and TC), and levoglucosan for individual tests are shown in Table S7.
Figure S10 shows that EF varies > 4-fold (14–61 g kg−1) for different peats without large differences between fresh and aged emissions. EFOC varied from 9 to 44 g kg−1 while EFEC (0.00–2.2 g kg−1) were low (Table S7). The majority of EF values consist of EFOC, with average EFOC ∕ EF ratios of 52 %–98 % by peat type in fresh emissions, followed by ∼14 %–23 % reductions after aging, with the exception of Putnam (FL) peats (remained at 69 %–70 %).
Reductions of EFOC after ∼7 d of photochemical aging are most apparent (∼7–9 g kg−1) for the boreal peats, with the largest degradation for low-temperature OC1 (evolved at 140 ∘C during carbon analysis), indicating losses of high-vapor-pressure SVOCs upon aging (Table S6). The two Florida peats exhibit an initial EFOC decrease of ∼2 g kg−1 after 2 d aging, but with an increase of 1.8–4.0 g kg−1 after 7 d. However, these changes are less than the standard deviations associated with the averages.
EFWSOC varies by 5-fold (3–16 g kg−1) with over a ∼50 % increase for the Putnam (FL) and Malaysian peats after 7 d. Average EFWSOC by peat type accounts for ∼16 %–36 % and ∼20 %–62 % of fresh EF and EFOC, respectively. From 2 to 7 d aging, Fig. S11 shows reduced correlation coefficients (r from 0.86 to 0.76 for PM2.5, from 0.88 to 0.84 for OC, and 0.94 to 0.68 for WSOC).
Table 4Peat combustion emission factors (EFs) for PM2.5 mass and carbona.
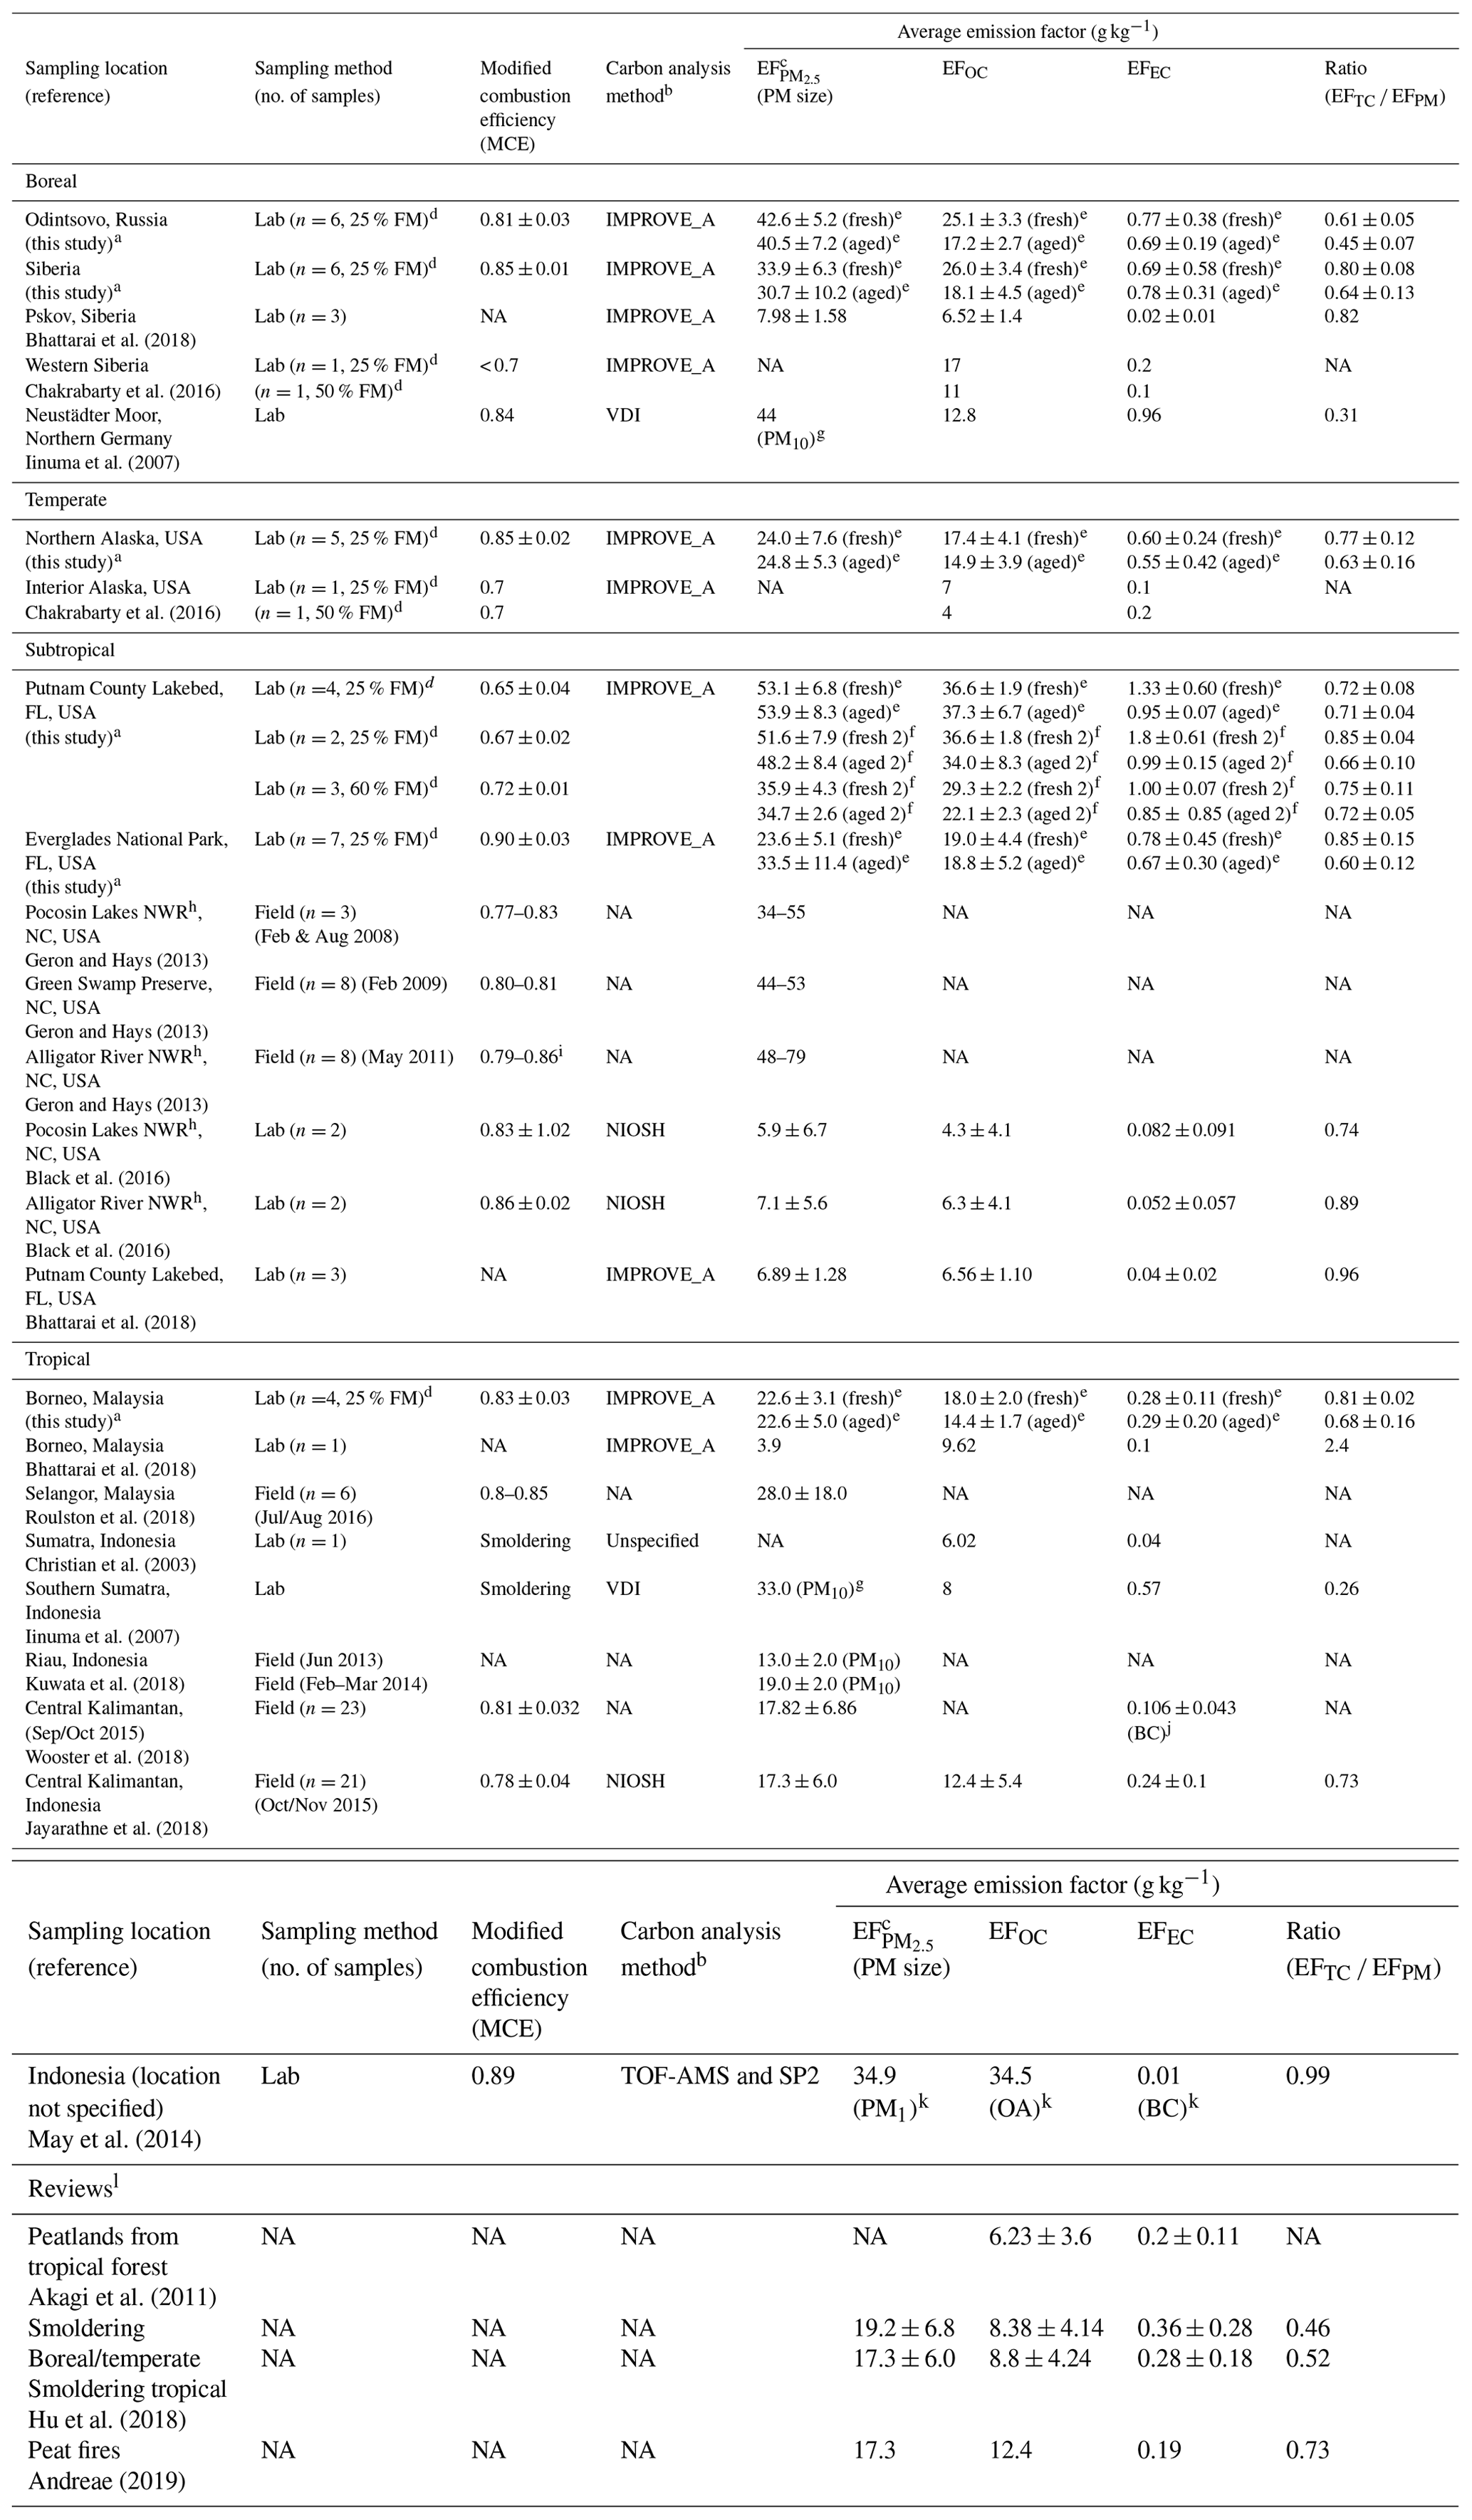
a Data acquired from this study are so designated. b The IMPROVE_A protocol reports OC and EC by thermal/optical reflectance (TOR, Chow et al., 2007); the NIOSH and NIOSH5040 reports OC and EC by thermal/optical transmittance (NIOSH, 1999); VDI is the German Industrial Standard (VDI, 1999); TOF-MS: time-of-flight mass spectrometer (Drewnick et al., 2005); and SP2: single-particle soot photometer (DMT Inc., Boulder, CO, USA) measures black carbon (BC) by laser-induced incandescence technique (Stephens et al., 2003). c Size fraction is PM2.5 except where otherwise noted. d FM; fuel moisture. e Includes averages of all fresh and all aged emission factors (EFs) for the 25 % fuel moisture (i.e., grouped fresh 2 and fresh 7 vs. aged 2 and aged 7 shown in Table S7). f Comparisons between 25 % and 60 % fuel moisture content are only made with fresh 2 vs. aged 2 of Putnam (FL) peats. g Sum of five stages of Berner Impactor with 0.05–0.14, 0.14–0.42, 0.42–1.2, 1.2–3.5, and 3.5–10 µm size ranges. h National Wildlife Refuge, eastern NC. i From Jayarathne et al. (2018). j BC by micro-Aethalometer (AE 51) (Cheng et al., 2013; Wooster et al., 2018). k PM1 and organic aerosol (OA) acquired from TOF-MS measurements (Drewnick et al., 2005). l Reviews for atmospheric modeling and emission inventory development.
As WSOC is part of the OC, the WSOC ∕ OC ratio can be used to illustrate atmospheric aging. Figure S12 shows that WSOC ∕ OC ratios increased by 6 %–16 % after aging. This is attributed to a combination of oxygenation of the aged organic emissions and the reduction of EFOC (Table S7). The increase in WSOC ∕ OC ratios may also be due to photochemical transformation of primary OC to WSOC and/or formation of water-soluble SOA during atmospheric aging (Aggarwal and Kawamura, 2009; Agarwal et al., 2010).
Table 4 compares filter-based PM mass and carbon from different studies. Since different carbon protocols yield different fractions of OC and EC (Watson et al., 2005), the analytical protocols are listed. Most studies follow either IMPROVE_A TOR (Chow et al., 2007) or NIOSH thermal/optical transmittance (TOT) protocols (NIOSH, 1999). As the transmittance pyrolysis correction (i.e., TOT) accounts for charred OC both on the filter surface and organic vapor within the filter substrate, lower EFEC values are expected as compared to TOR (Chow et al., 2004). To remove the OC and EC split uncertainty, TC to PM mass ratios are listed for comparison. Two studies reported BC from a micro-Aethalometer (Wooster et al., 2018) or a single-particle soot photometer (SP2; May et al., 2014). As BC levels are very low, not many differences can be distinguished between BC and EC.
Most studies report EF with a few exceptions for EF (Kuwata et al., 2018; Iinuma et al., 2007) and EF (May et al., 2014). As most of the PM10 is in the PM2.5 fraction for biomass combustion, particle size fractions have a minor effect on PM EFs (Geron and Hays, 2013; Hu et al., 2018).
Table 4 shows that the majority of EF lies in the range of ∼20–50 g kg−1 with the exception of very low EF values of 4–8 and 6–7 g kg−1 reported by Bhattarai et al. (2018) and Black et al. (2016). These are probably due to low filter mass loadings and limited testing (n of 1 to 3), which may result in large uncertainties in gravimetric mass.
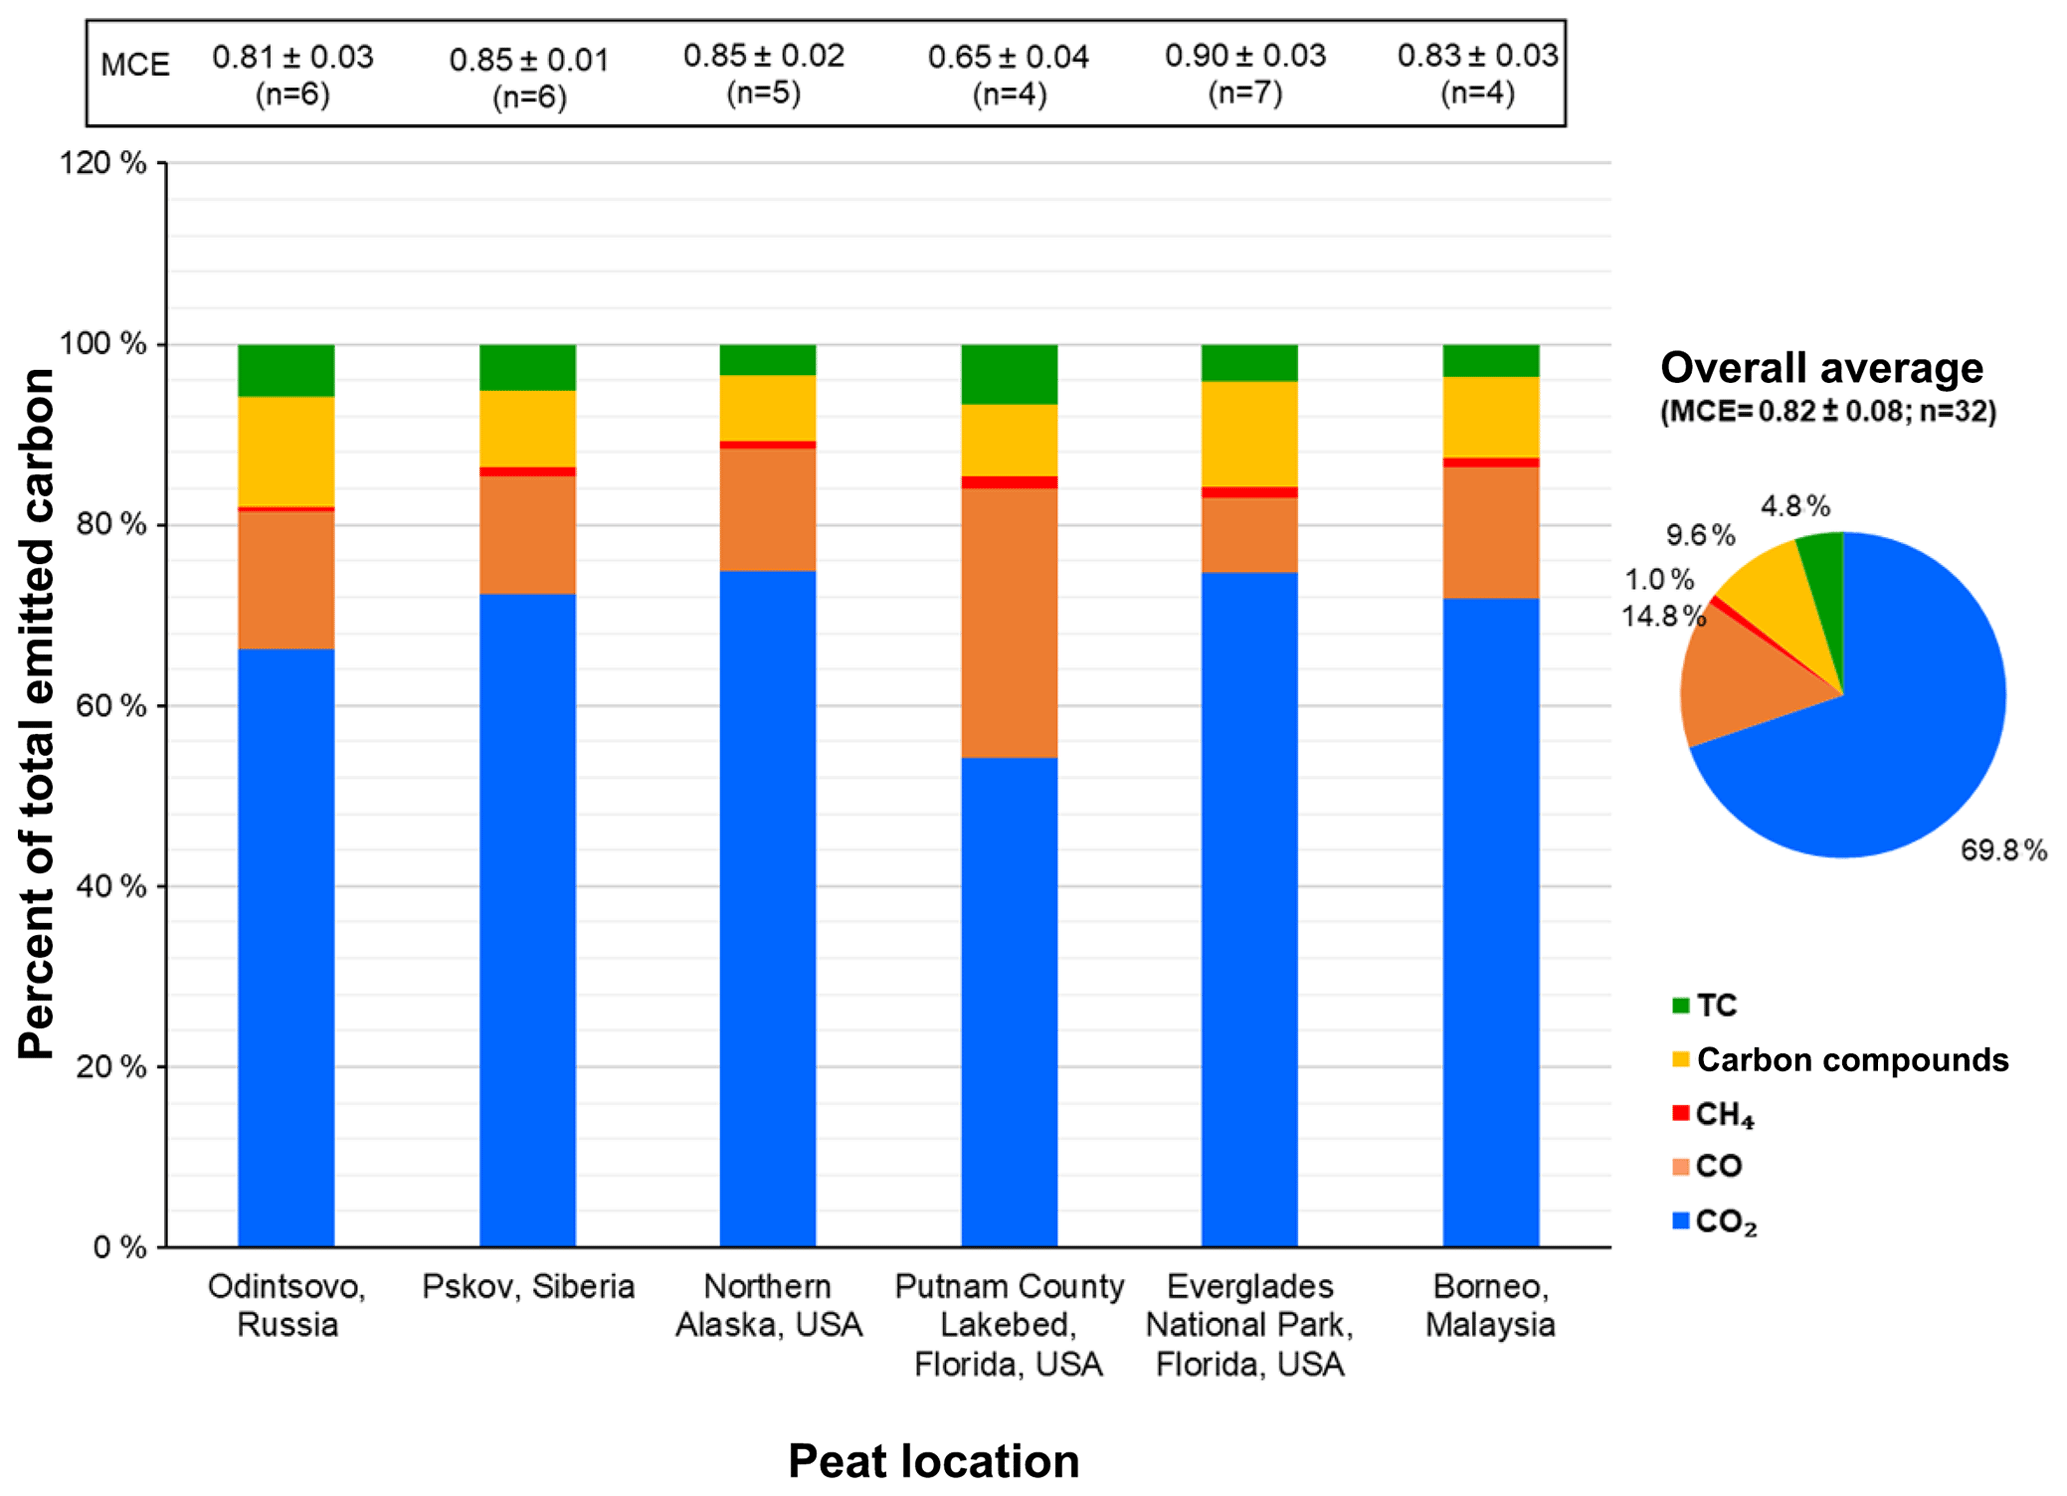
Figure 3Average carbonaceous species abundances in total emitted carbon (the sum of carbon in CO2, CO, CH4, carbon compounds, and PM2.5 total carbon (TC = OC + EC)). Numbers on top of the bars are average modified combustion efficiencies (MCEs) and the number of samples in each average. The carbon compounds include hydrogen cyanide (HCN), formaldehyde (CH2O), methanol (CH3OH), formic acid (HCOOH), carbonyl sulfide (COS), ethylene (C2H4), ethane (C2H6), acetaldehyde (C2H4O), ethanol (C2H5OH), acetic acid (CH3COOH), propane (C3H8), acrolein (C3H4O), acetone (C3H6O), 3-butadiene (C4H6), benzene (C6H6), hexane (C6H14), phenol (C6H5OH), and chlorobenzene (C6H5Cl) acquired by Fourier transform infrared spectrometry.
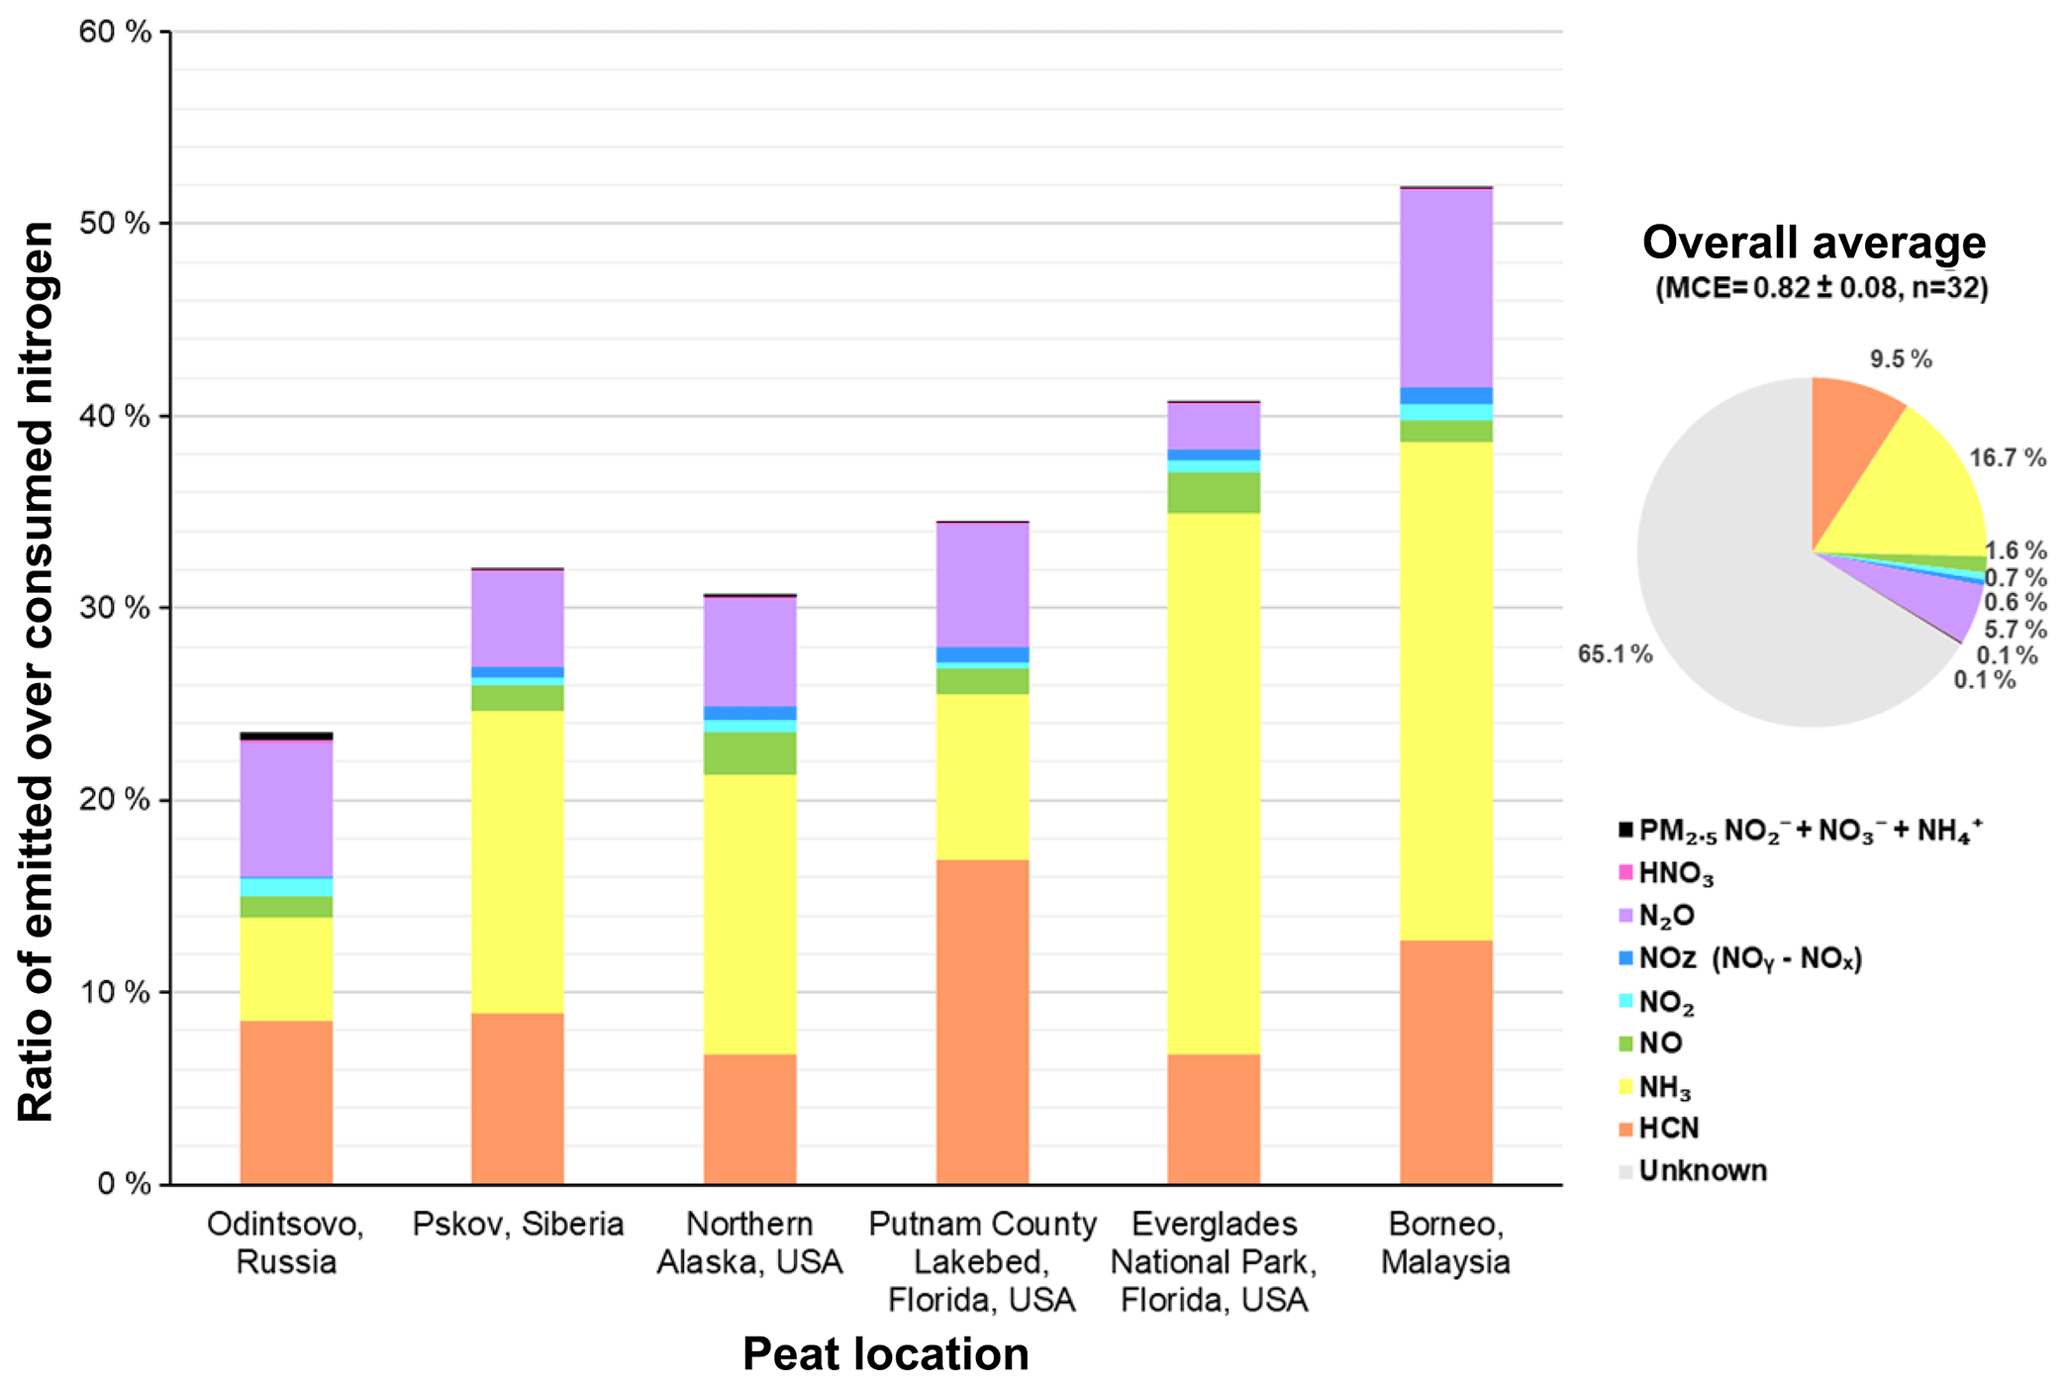
Figure 4Ratio of emitted over consumed nitrogen for each type of peat (emitted nitrogen is the sum of nitrogen in HCN, NH3, NO, NO2, and NOz (NOy-NOx), N2O, HNO3, and PM2.5 ions (); and the consumed nitrogen is the product of percent fuel nitrogen content and mass of fuel burned).
Despite different carbon analysis methods, most EFOC lies in the range of ∼5–30 g kg−1 with the exception of EFOC (37 g kg−1) for Putnam (FL) and EFOA (organic aerosol, 34.5 g kg−1) for Indonesian peat measured by a time-of-flight mass spectrometer (May et al., 2014). Most studies show that EFTC accounts for ∼60 %–85 % of the EF, with low EFEC (0.02–1.3 g kg−1).
EFWSOC values of 6–7 and 4–6 g kg−1 for the Alaskan and Malaysian peats from this study are consistent with the 6.7 and 3.1 g kg−1 from German and Indonesian peats in Iinuma et al. (2007), respectively. EFLevoglucosan exhibits > 2 orders of magnitude variabilities among the biomes with 0.24–16 and 0.24–9.6 g kg−1 in fresh and aged emissions, respectively.
Past studies show that the extent of levoglucosan degradation depends on OH exposure in the OFR, organic aerosol composition, and vapor wall losses (e.g., Bertrand et al., 2018a, b; Hennigan et al., 2010; Hoffmann et al., 2010; May et al., 2012; Lai et al., 2014; Pratap et al., 2019). Potential chemical pathways for the formation of organic species in biomass combustion emissions were proposed by Gao et al. (2003) that suggested the fragmentation of levoglucosan to C3–C5 diacids, followed by oxalic acid, acetic acid, and formic acid. This is consistent with the increases in EForganic acids after atmospheric aging, as shown in Table S6. However, detailed chemical mechanisms need to be further investigated.
The highest EFLevoglucosan is found for the fresh Russian peats (15.8±2.9 g kg−1), and this is diminished by 45 % after 7 d aging (8.8 ± 2.1 g kg−1). Few studies report EFLevoglucosan and results are highly variable. The EFLevoglucosan of 0.57 g kg−1 in PM2.5 (converted from 46 mg g−1 OC) by Jayarathne et al. (2018) is ∼23 % of the 2.5 g kg−1 by Iinuma et al. (2007), both for Indonesia peats. The EFLevoglucosan of 0.5–1.0 g kg−1 from fresh Malaysian peat in this study is comparable to 0.57 g kg−1 by Jayarathne et al. (2018). The 4.6 g kg−1 of EFLevoglucosan for the northern German peat (Iinuma et al., 2007) is higher than the 1.2–4.7 g kg−1 found for the average Siberian and Alaskan peats in this study.
EFs for ionic nitrogen species are low (< 0.1 g kg−1) in fresh emissions. Both EF and EF increase with 7 d aging – > 0.5 g kg−1 EF for all peat and > 1 g kg−1 EF for all but Russian (0.79±0.08 g kg−1) and Putnam (FL) peats (0.66 ± 0.08 g kg−1), consistent with the formation of secondary inorganic aerosol.
3.3 Effect of fuel moisture content on emission factors
Only a few studies examine the effects of fuel moisture on peat emissions with inconsistent results. An early study by McMahon et al. (1980) reported high emissions for total suspended particle (TSP, ∼ < 30–60 µm) of 30 ± 20 g kg−1 for dry (< 11 % moisture) as compared to 4.1 ± 3.8 g kg−1 (after the first 24 h) for wet (53 %–97 % moisture) organic soil. Rein et al. (2009) found higher CO2 (but not CO) yields while increasing fuel moisture to 600 % for tests of boreal Scotland peats in a cone calorimeter which continuously supplies heat to the fuel. Smoldering combustion is possible with high in situ fuel moisture contents when surrounding peat provides insulation and heat from combustion is available for drying just before the advancing front, but such samples will not burn in the laboratory. Watts (2013) sustained lab-based peat smoldering from a cypress swamp (FL) at ∼250 % moisture content, which appears to be a maximum.
Table 2 shows that increasing moisture content from ∼25 % to ∼60 % for the three Putnam (FL) peats resulted in an 11 % increase in EF but reductions of 20 % EFCO and 12 % EF. No consistent variabilities are found for nitrogen species (Table 3), with negligible changes in EF and EFHCN; a 13 %–30 % reduction in EFNO, EF, and EF; and a 45 % increase in EF and 9 % increase in EF. On the other hand, a reduction of ∼30 % EF is found (Table 4) as fuel moisture increased from 25 % to 60 %. Higher fuel moisture contents typically result in less efficient burning conditions, thereby increasing CO and reducing MCE (Chen et al., 2010). However, an opposite trend is found with EFCO reduced from 394 ± 46 to 315 ± 10 g kg−1 and MCEs increased from 0.65 ± 0.04 to 0.72 ± 0.01. It is hypothesized that, at higher fuel moisture contents, combustion residence time is slowed enough so that radiant heat transfer from ignited particles to uncombusted areas of peat can be greater, thus increasing the combustion efficiency. It is also possible that the higher water content results in a water–gas shift reaction that converts CO and water to CO2 and hydrogen. Overall, the EFs for ∼60 % moisture contents are comparable to EFs for the six other peats with ∼25 % moisture content.
Increased (∼25 % to 60 %) fuel moisture yields a ∼20 % reduction in fresh EFOC, much lower than the 35 %–43 % reduction (∼25 % to 50 % moisture) reported by Chakrabarty et al. (2016) for the Siberian and Alaskan peats. By increasing fuel moisture, Chakrabarty et al. (2016) also reported an increase in EF by 20 % but a ∼75 % reduction and 35 % increase in EFCO for Siberian and Alaskan peats, respectively, based on a single sample.
3.4 Distribution of carbon and nitrogen species
Figure 3 shows the distribution of carbonaceous species. Because the EFs are calculated based on the carbon mass balance method (Eq. 2), the total emitted carbon is assumed to be the same as total consumed carbon. The majority (> 90 %) of total emitted carbon is present in the gas phase, with 54 %–75 % CO2, followed by 8 %–30 % CO. On average, emitted carbon includes 69.8 ± 7.5 % CO2, 14.8 ± 6.5 % CO, 1.0 ± 0.3 % CH4, 9.6 ± 2.4 % volatile carbon compounds, and 4.8 ± 1.3 % PM2.5 TC. The highest (30 ± 4 %) and lowest (8.4 ± 1.9 %) CO abundances for the Putnam (FL) and Everglades (FL) peats are consistent with the lowest and highest average MCEs of 0.65 and 0.90, respectively.
The nitrogen budget in Fig. 4 accounts for 24 %–52 % of nitrogen in the consumed fuel. Since burn temperatures are below those at which NOx forms from oxygen reactions with N2 in the air; most of the nitrogen in emissions derives from the nitrogen content of the fuels. Kuhlbusch et al. (1991) found N2 emissions constituted an average of 31 ± 20 % of nitrogen in consumed grass, hay, pine needle, clover, and wood fuels. Since N2 measurements require combustion in N2-free atmosphere (e.g., a He-O2 mixture), N2 was not quantified here, but it was probably emitted in similar quantities. Isocyanic acid (HNCO) is another important nitrogen-containing compound found in biomass burning emissions (Roberts et al., 2011). Koss et al. (2018) report a 0.16 g kg−1 nitrogen-equivalent EF (0.5 g kg−1 for HNCO) for a peat sample, comparable to EFs for several of the measured nitrogen compounds summarized in Table 3. Other nitrogen-containing gases reported by Koss et al. (2018) with EFs > 0.1 g kg−1 include acetonitrile (CH3CN), acetamide (CH3CONH2), benzonitrile (C6H5CN), and pyridine + pentadienenitriles (C5H5N), which could account for part of the unmeasured nitrogen in emissions. Neff et al. (2002) found that organic nitrogen formed from photochemical reactions of hydrocarbon with NOx plays an important role in the global nitrogen cycle. Approximately 30 ± 16 % of Neff et al.'s total nitrogen was from organic nitrogen, similar to the 25 % of total nitrogen deposition flux reported by Jickells et al. (2013). Alkaloids, dissolved organic nitrogen, along with nitroaromatic compounds have been reported (e.g., Benitez et al., 2009; Laskin et al., 2009; Kuhlbusch et al., 1991; Koppmann et al., 2005; Kopacek and Posch, 2011; Stockwell et al., 2015).
The majority (> 99 %) of the measured nitrogen in emissions is in the gas phase. On average, 16.7 % of the fuel nitrogen was emitted as NH3 and 9.5 % was emitted as HCN. N2O and NOy constituted 5.7 % and 2.9 % of nitrogen in the consumed fuel. NH3 emissions accounted for 26 %–28 % of consumed nitrogen for Everglades (FL) and Malaysian peats, while HCN emissions dominated fuel nitrogen(13 %–17 %) for the Putnam (FL) and Malaysian peats. The fraction of N2O emissions in Malaysian peat nitrogen (10.3 ± 1.1 %) was more than twice the fractions found for the other regions, with reactive nitrogen (NOy) only accounting for 2 %–4 % of the fuel nitrogen. The sum of NH3 and HCN nitrogen ranged from 35 % to 39 % of consumed nitrogen for the Malaysian and Everglades (FL) peats, which is about three times the fraction for Russian peat.
Lobert et al. (1990) point out the importance of nitrogen-containing gases in biomass burning for the atmospheric nitrogen balance. On average, the emitted nitrogen includes 17 ± 10 % NH3, 9.5 ± 3.8 % HCN, 5.7 ± 2.5 % N2O, 2.8±1.0 % NOy (including NOx), and 0.14 ± 0.18 % of PM nitrogen (sum of , , and ). The average nitrogen budget accounts for 35 ± 11 % of the total consumed nitrogen, consistent with past studies showing that around one- to two-thirds of the fuel nitrogen is accounted for during biomass combustion.
This paper reports fuel composition and emission factors (EFs) from laboratory chamber combustion of six types of peat fuels representing boreal (Russia and Siberia), temperate (northern Alaska, USA), subtropical (northern and southern Florida, USA), and tropical (Borneo, Malaysia) climate regions. Dried peat fuel contains 44 %–57 % carbon (C), 31 %–39 % oxygen (O), 5 %–6 % hydrogen (H), 1 %–4 % nitrogen (N), and < 0.01 % sulfur (S). The nitrogen to carbon ratios are low, in the range of 0.02–0.08, consistent with peat compositions reported in other studies.
Thirty-two tests with 25 % fuel moisture were reported with predominant smoldering combustion conditions (MCE 8). Average fuel-based EFs for CO2 (EF) are highest (1400 ± 38 g kg−1) and lowest (1073 ± 63 g kg−1) for the Alaskan and Russian peats, respectively. EFCO and EF are ∼12 %–15 % and ∼0.3 %–0.9 % of EF in the range of ∼157–171 and 3–10 g kg−1, respectively. The exception is the two Florida peats, reporting the highest (394 ± 46 g kg−1) and lowest (93 ± 21 g kg−1) EFCO for Putnam and Everglades, respectively.
Filter-based EF varied by > 4-fold (14–61 g kg−1) without appreciable changes between fresh and aged emissions. The majority of EF consists of EFOC, with average EFOC ∕ EF ratios by peat type in the range of 52 %–98 % in fresh emissions, followed by ∼14 %–23 % reduction after aging with the exception of Putnam (FL) peats (retained at 69 %–70 %). Reduction of EFOC (∼7–9 g kg−1) are most apparent for boreal peats with the largest decrease in low-temperature OC1 (evolved at 140 ∘C), suggesting the loss of high-vapor-pressure semivolatile organic compounds during aging. EFs for water-soluble OC (EFWSOC) account for ∼20 %–62 % of EFOC with ∼6 %–16 % increase in EFWSOC ∕ EFOC ratios after aging. The highest EFLevoglucosan is found for Russian peat (15.8 ± 2.9 g kg−1) with a 45 % degradation after aging.
The majority (> 90 %) of the total emitted carbon is in the gas phases with 54 %–75 % CO2, followed by 8 %–30 % CO. The nitrogen budget only explains 24 %–52 % of the consumed nitrogen, with an average of 35 ± 11 %, consistent with past studies that around one- to two-thirds of the total nitrogen is lost upon biomass combustion. The majority (> 99 %) of the total emitted nitrogen is in the gas phase, dominated by the two reduced nitrogen species with 16.7 % for NH3 and 9.5 % for HCN. N2O and NOy are detectable at 5.7 % and 2.9 % abundance. EFs from this study can be used to refine current emission inventories.
The data of this study are available from the authors upon request.
The supplement related to this article is available online at: https://doi.org/10.5194/acp-19-14173-2019-supplement.
JGW, JCC, JC, L-WAC, and XW jointly designed the study, performed the data analyses, and prepared the manuscript. QW, JT, and SSHH carried out the peat combustion experiments. SG conducted emission factor calculations. ACW acquired peat fuels and provided technical advice on the peat fuel process.
The authors declare that they have no conflict of interest.
This research was primarily supported by the National Science Foundation (NSF, AGS-1464501 and CHE-1214163) as well as internal funding from both the Desert Research Institute, Reno, NV, USA, and Institute of Earth Environment, Chinese Academy of Sciences, Xi'an, China. The Caohai and Gaopo peat samples were provided by Pinhua Xia of Guizhou Normal University, Guizhou, China, and Chunmao Zhu of the Japan Agency for Marine-Earth Science and Technology, Yokosuka, Japan.
This research has been supported by the U.S. National Science Foundation (grant nos. AGS-1464501 and CHE-1214163) as well as the National Atmospheric Research Program (2017YFC0212200) and the National Research Program for Key Issues in Air Pollution Control (DQGG0105) in China.
This paper was edited by James Roberts and reviewed by two anonymous referees.
Aerodyne: Potential Aerosol Mass (PAM) oxidation flow reactor, Aerodyne Research Inc., Billerica, MA, 2019.
Agarwal, S., Aggarwal, S. G., Okuzawa, K., and Kawamura, K.: Size distributions of dicarboxylic acids, ketoacids, α-dicarbonyls, sugars, WSOC, OC, EC and inorganic ions in atmospheric particles over Northern Japan: implication for long-range transport of Siberian biomass burning and East Asian polluted aerosols, Atmos. Chem. Phys., 10, 5839–5858, https://doi.org/10.5194/acp-10-5839-2010, 2010.
Aggarwal, S. G. and Kawamura, K.: Carbonaceous and inorganic composition in long-range transported aerosols over northern Japan: Implication for aging of water-soluble organic fraction, Atmos. Environ., 43, 2532–2540, 2009.
Akagi, S. K., Yokelson, R. J., Wiedinmyer, C., Alvarado, M. J., Reid, J. S., Karl, T., Crounse, J. D., and Wennberg, P. O.: Emission factors for open and domestic biomass burning for use in atmospheric models, Atmos. Chem. Phys., 11, 4039–4072, https://doi.org/10.5194/acp-11-4039-2011, 2011.
Allen, C., Carrico, C. M., Gomez, S. L., Andersen, P. C., Turnipseed, A. A., Williford, C., Birks, J. W., Salisbury, D., Carrion, R., Gates, D., Macias, F., Rahn, T., Aiken, A. C., and Dubey, M. K.: NOx instrument intercomparison for laboratory biomass burning source studies and urban ambient measurements in Albuquerque, New Mexico, J. Air Waste Manage., 68, 1175–1189, https://doi.org/10.1080/10962247.2018.1487347, 2018.
Alvarado, M. J., Logan, J. A., Mao, J., Apel, E., Riemer, D., Blake, D., Cohen, R. C., Min, K.-E., Perring, A. E., Browne, E. C., Wooldridge, P. J., Diskin, G. S., Sachse, G. W., Fuelberg, H., Sessions, W. R., Harrigan, D. L., Huey, G., Liao, J., Case-Hanks, A., Jimenez, J. L., Cubison, M. J., Vay, S. A., Weinheimer, A. J., Knapp, D. J., Montzka, D. D., Flocke, F. M., Pollack, I. B., Wennberg, P. O., Kurten, A., Crounse, J., Clair, J. M. St., Wisthaler, A., Mikoviny, T., Yantosca, R. M., Carouge, C. C., and Le Sager, P.: Nitrogen oxides and PAN in plumes from boreal fires during ARCTAS-B and their impact on ozone: an integrated analysis of aircraft and satellite observations, Atmos. Chem. Phys., 10, 9739–9760, https://doi.org/10.5194/acp-10-9739-2010, 2010.
Andreae, M. O.: Emission of trace gases and aerosols from biomass burning – an updated assessment, Atmos. Chem. Phys., 19, 8523–8546, https://doi.org/10.5194/acp-19-8523-2019, 2019.
Ballenthin, J. O., Thorn, W. F., Miller, T. M., Viggiano, A. A., Hunton, D. E., Koike, M., Kondo, Y., Takegawa, N., Irie, H., and Ikeda, H.: In situ HNO3 to NOy instrument comparison during SOLVE, J. Geophys. Res., 108, ACH 7-1–ACH 7-11, https://doi.org/10.1029/2002JD002136, 2003.
Behera, S. N., Betha, R., Huang, X., and Balasubramanian, R.: Characterization and estimation of human airway deposition of size-resolved particulate-bound trace elements during a recent haze episode in Southeast Asia, Environ. Sci. Pollut. Res., 22, 4265–4280, https://doi.org/10.1007/s11356-014-3645-6, 2015.
Benitez, J. M. G., Cape, J. N., Heal, M. R., van Dijk, N., and Diez, A. V.: Atmospheric nitrogen deposition in south-east Scotland: Quantification of the organic nitrogen fraction in wet, dry and bulk deposition, Atmos. Environ., 43, 4087–4094, 2009.
Bertrand, A., Stefenelli, G., Jen, C. N., Pieber, S. M., Bruns, E. A., Ni, H., Temime-Roussel, B., Slowik, J. G., Goldstein, A. H., El Haddad, I., Baltensperger, U., Prévôt, A. S. H., Wortham, H., and Marchand, N.: Evolution of the chemical fingerprint of biomass burning organic aerosol during aging, Atmos. Chem. Phys., 18, 7607–7624, https://doi.org/10.5194/acp-18-7607-2018, 2018a.
Bertrand, A., Stefenelli, G., Pieber, S. M., Bruns, E. A., Temime-Roussel, B., Slowik, J. G., Wortham, H., Prévôt, A. S. H., El Haddad, I., and Marchand, N.: Influence of the vapor wall loss on the degradation rate constants in chamber experiments of levoglucosan and other biomass burning markers, Atmos. Chem. Phys., 18, 10915–10930, https://doi.org/10.5194/acp-18-10915-2018, 2018b.
Betha, R., Pradani, M., Lestari, P., Joshi, U. M., Reid, J. S., and Balasubramanian, R.: Chemical speciation of trace metals emitted from indonesian peat fires for health risk assessment, Atmos. Res., 122, 571–578, 2013.
Bhattarai, C., Samburova, V., Sengupta, D., Iaukea-Lum, M., Watts, A. C., Moosmuller, H., and Khlystov, A. Y.: Physical and chemical characterization of aerosol in fresh and aged emissions from open combustion of biomass fuels, Aerosol Sci. Tech., 52, 1266–1282, https://doi.org/10.1080/02786826.2018.1498585, 2018.
Bin Abas, M. R., Rahman, N. A., Omar, N. Y. M. J., Maah, M. J., Abu Samah, A., Oros, D. R., Otto, A., and Simoneit, B. R. T.: Organic composition of aerosol particulate matter during a haze episode in Kuala Lumpur, Malaysia, Atmos. Environ., 38, 4223–4241, 2004.
Black, R. R., Aurell, J., Holder, A., George, I. J., Gullett, B. K., Hays, M. D., Geron, C. D., and Tabor, D.: Characterization of gas and particle emissions from laboratory burns of peat, Atmos. Environ., 132, 49–57, 10.1016/j.atmosenv.2016.02.024, 2016.
Cao, J. J., Wang, Q. Y., Li, L., Zhang, Y., Tan, J., Chen, L.-W. A., Ho, S. S. H., Wang, X. L., Chow, J. C., and Watson, J. G.: Evaluation of the oxidation flow reactor for particulate matter emission limit certification, Atmos. Environ., accepted, https://doi.org/10.1016/j.atmosenv.2019.117086, 2019.
Chakrabarty, R. K., Gyawali, M., Yatavelli, R. L. N., Pandey, A., Watts, A. C., Knue, J., Chen, L.-W. A., Pattison, R. R., Tsibart, A., Samburova, V., and Moosmüller, H.: Brown carbon aerosols from burning of boreal peatlands: microphysical properties, emission factors, and implications for direct radiative forcing, Atmos. Chem. Phys., 16, 3033–3040, https://doi.org/10.5194/acp-16-3033-2016, 2016.
Chen, L.-W.A., Verburg, P., Shackelford, A., Zhu, D., Susfalk, R., Chow, J.C., Watson, J.G.: Moisture effects on carbon and nitrogen emission from burning of wildland biomass. Atmos. Chem. Phys., 10, 6617–6625, https://doi.org/10.5194/acp-10-6617-2010, 2010.
Cheng, Y. H., Shiu, B. T., Lin, M. H., and Yan, J. W.: Levels of black carbon and their relationship with particle number levels-observation at an urban roadside in Taipei City, Environ. Sci. Pollut. Res., 20, 1537–1545, 2013.
Chow, J. C. and Watson, J. G.: Enhanced ion chromatographic speciation of water-soluble PM2.5 to improve aerosol source apportionment, Aerosol Science and Engineering, 1, 7–24, https://doi.org/10.1007/s41810-017-0002-4, 2017.
Chow, J. C., Watson, J. G., Chen, L.-W. A., Arnott, W. P., Moosmüller, H., and Fung, K. K.: Equivalence of elemental carbon by Thermal/Optical Reflectance and Transmittance with different temperature protocols, Environ. Sci. Technol., 38, 4414–4422, 2004.
Chow, J. C., Watson, J. G., Chen, L.-W. A., Chang, M.-C. O., Robinson, N. F., Trimble, D. L., and Kohl, S. D.: The IMPROVE_A temperature protocol for thermal/optical carbon analysis: Maintaining consistency with a long-term database, J. Air Waste Manage., 57, 1014–1023, 2007.
Chow, J. C., Wang, X. L., Sumlin, B. J., Gronstal, S. B., Chen, L.-W. A., Trimble, D. L., Kohl, S. D., Mayorga, S. R., Riggio, G. M., Hurbain, P. R., Johnson, M., Zimmermann, R., and Watson, J. G.: Optical calibration and equivalence of a multiwavelength thermal/optical carbon analyzer, Aerosol Air Qual. Res., 15, 1145–1159, https://doi.org/10.4209/aaqr.2015.02.0106, 2015.
Chow, J. C., Cao, J., Antony Chen, L.-W., Wang, X., Wang, Q., Tian, J., Ho, S. S. H., Watts, A. C., Carlson, T. B., Kohl, S. D., and Watson, J. G.: Changes in PM2.5 peat combustion source profiles with atmospheric aging in an oxidation flow reactor, Atmos. Meas. Tech., 12, 5475–5501, https://doi.org/10.5194/amt-12-5475-2019, 2019.
Christian, T. J., Kleiss, B., Yokelson, R. J., Holzinger, R., Crutzen, P. J., Hao, W. M., Saharjo, B. H., and Ward, D. E.: Comprehensive laboratory measurements of biomass-burning emissions: 1. Emissions from Indonesian, African, and other fuels, J. Geophys. Res., 108, ACH3-1–ACH3-13, https://doi.org/10.1029/2003JD003704, 2003.
Crutzen, P. J. and Andreae, M. O.: Biomass burning in the tropics: Impact on atmospheric chemistry and biogeochemical cycles, Science, 250, 1669–1678, 1990.
Cubison, M. J., Ortega, A. M., Hayes, P. L., Farmer, D. K., Day, D., Lechner, M. J., Brune, W. H., Apel, E., Diskin, G. S., Fisher, J. A., Fuelberg, H. E., Hecobian, A., Knapp, D. J., Mikoviny, T., Riemer, D., Sachse, G. W., Sessions, W., Weber, R. J., Weinheimer, A. J., Wisthaler, A., and Jimenez, J. L.: Effects of aging on organic aerosol from open biomass burning smoke in aircraft and laboratory studies, Atmos. Chem. Phys., 11, 12049–12064, https://doi.org/10.5194/acp-11-12049-2011, 2011.
Dall'Osto, M., Hellebust, S., Healy, R. M., O'Connor, I. P., Kourtchev, I., Sodeau, J. R., Ovadnevaite, J., Ceburnis, D., O'Dowd, C. D., and Wenger, J. C.: Apportionment of urban aerosol sources in Cork (Ireland) by synergistic measurement techniques, Sci. Total Environ., 493, 197–208, 2014.
Drewnick, F., Hings, S. S., DeCarlo, P., Jayne, J. T., Gonin, M., Fuhrer, K., Weimer, S., Jimenez, J. L., Demerjian, K. L., Borrmann, S., and Worsnop, D. R.: A new time-of-flight aerosol mass spectrometer (TOF-AMS) – Instrument description and first field deployment, Aerosol Sci. Tech., 39, 637–658, 2005.
Engling, G., He, J., Betha, R., and Balasubramanian, R.: Assessing the regional impact of indonesian biomass burning emissions based on organic molecular tracers and chemical mass balance modeling, Atmos. Chem. Phys., 14, 8043–8054, https://doi.org/10.5194/acp-14-8043-2014, 2014.
Fujii, Y., Tohno, S., Amil, N., and Latif, M. T.: Quantitative assessment of source contributions to PM2.5 on the west coast of Peninsular Malaysia to determine the burden of Indonesian peatland fire, Atmos. Environ., 171, 111–117, https://doi.org/10.1016/j.atmosenv.2017.10.009, 2017.
Gao, S., Hegg, D. A., Hobbs, P. V., Kirchstetter, T. W., Magi, B. I., and Sadilek, M.: Water-soluble organic components in aerosols associated with savanna fires in southern Africa: Identification, evolution and distribution, J. Geophys. Res., 108, SAF27-21–SAF27-16, https://doi.org/10.1029/2002JD002324, 2003.
Geron, C. and Hays, M.: Air emissions from organic soil burning on the coastal plain of North Carolina, Atmos. Environ., 64, 192–199, 2013.
Goulding, K. W. T., Bailey, N., Bradbury, N. J., Hargreaves, P., Howe, M., Murphy, D. V., Poulton, P. R., and Willison, T. W.: Nitrogen deposition and its contribution to nitrogen cycling and associated soil processes, New Phytol., 139, 49–58, 1998.
Grosjean, D.: Wall loss of gaseous pollutants in outdoor Teflon chambers, Environ. Sci. Technol., 19, 1059–1065, https://doi.org/10.1021/es00141a006, 1985.
Gruber, N. and Galloway, J. N.: An Earth-system prespective of the global nitrogen cycle, Nature, 451, 293–296, 2008.
Hatch, L. E., Luo, W., Pankow, J. F., Yokelson, R. J., Stockwell, C. E., and Barsanti, K. C.: Identification and quantification of gaseous organic compounds emitted from biomass burning using two-dimensional gas chromatography–time-of-flight mass spectrometry, Atmos. Chem. Phys., 15, 1865–1899, https://doi.org/10.5194/acp-15-1865-2015, 2015.
Heil, A. and Goldammer, J. G.: Smoke-haze pollution: a review of the 1997 episode in Southeast Asia, Reg. Environ. Change, 2, 24–37, 2001.
Hennigan, C. J., Sullivan, A. P., Collett Jr., J. L., and Ronbinson, A. L.: Levoglucosan stability in biomass burning particles exposed to hydroxyl radicals, Geophys. Res. Lett., 37, 1–4, 2010.
Hibbard, T. and Killard, J.: Breath ammonia levels in a normal human population study as determined by photoacoustic laser spectroscopy, Juornal of Breath Research, 5, 1–8, 2011.
Hinds, W. C.: Aerosol Technology: Properties, Behavior, and Measurement of Airborne Particles, 2nd Ed., John Wiley and Sons, Inc., New York, NY, 1999.
Hoffmann, D., Tilgner, A., Iinuma, Y., and Herrmann, H.: Atmospheric stability of levoglucosan: A detailed laboratory and modeling study, Environ. Sci. Technol., 44, 694–699, 2010.
Hu, Y. Q., Fernandez-Anez, N., Smith, T. E. L., and Rein, G.: Review of emissions from smouldering peat fires and their contribution to regional haze episodes, Int. J. Wildland Fire, 27, 293–312, https://doi.org/10.1071/wf17084, 2018.
Hu, Y. Q., Christensen, E., Restuccia, F., and Rein, G.: Transient gas and particle emissions from smouldering combustion of peat, P. Combust. Inst., 37, 4035–4042, https://doi.org/10.1016/j.proci.2018.06.008, 2019.
Huijnen, V., Wooster, M. J., Kaiser, J. W., Gaveau, D. L. A., Flemming, J., Parrington, M., Inness, A., Murdiyarso, D., Main, B., and van Weele, M.: Fire carbon emissions over maritime southeast Asia in 2015 largest since 1997, Sci. Rep., 6, 26886, https://doi.org/10.1038/srep26886, 2016.
Iinuma, Y., Bruggemann, E., Gnauk, T., Muller, K., Andreae, M. O., Helas, G., Parmar, R., and Herrmann, H.: Source characterization of biomass burning particles: The combustion of selected European conifers, African hardwood, savanna grass, and German and Indonesian peat, J. Geophys. Res.-Atmos., 112, D08209, https://doi.org/10.129/2006JD007120, 2007.
IPCC: 2013 supplement to th 2006 IPCC guidelines for national greenhouse gas inventories: Wetlands, Switzerland, 2014.
Jaakkola, P. T., Vahlman, T. A., Roos, A. A., Saarinen, P. E., and Kauppinen, J. K.: On-line analysis of stack gas composition by a low resolution FT-IR gas analyzer, Water Air Soil Poll., 101, 79–92, 1998.
Jayarathne, T., Stockwell, C. E., Gilbert, A. A., Daugherty, K., Cochrane, M. A., Ryan, K. C., Putra, E. I., Saharjo, B. H., Nurhayati, A. D., Albar, I., Yokelson, R. J., and Stone, E. A.: Chemical characterization of fine particulate matter emitted by peat fires in Central Kalimantan, Indonesia, during the 2015 El Niño, Atmos. Chem. Phys., 18, 2585–2600, https://doi.org/10.5194/acp-18-2585-2018, 2018.
Jickells, T., Baker, A. R., Cape, J. N., Cornell, S. E., and Nemitz, E.: The cycling of organic nitrogen through the atmosphere, Philos. T. Roy. Soc. B, 368, 1–7, 2013.
Karjalainen, P., Timonen, H., Saukko, E., Kuuluvainen, H., Saarikoski, S., Aakko-Saksa, P., Murtonen, T., Bloss, M., Dal Maso, M., Simonen, P., Ahlberg, E., Svenningsson, B., Brune, W. H., Hillamo, R., Keskinen, J., and Rönkkö, T.: Time-resolved characterization of primary particle emissions and secondary particle formation from a modern gasoline passenger car, Atmos. Chem. Phys., 16, 8559–8570, https://doi.org/10.5194/acp-16-8559-2016, 2016.
Kleinman, L. I., Daum, P. H., Lee, Y.-N., Nunnermacker, L. J., Springston, S. R., Weinstein-Lloyd, J., Hyde, P., Doskey, P. V., Rudolph, J., Fast, J., and Berkowitz, C.: Photochemical age determinations in the Phoenix metropolitan area, J. Geophys. Res., 108, ACH5-1–ACH5-14, https://doi.org/10.1029/2002JD002621, 2003.
Kleinman, L. I., Daum, P. H., Lee, Y. N., Senum, G. I., Springston, S. R., Wang, J., Berkowitz, C., Hubbe, J., Zaveri, R. A., Brechtel, F. J., Jayne, J., Onasch, T. B., and Worsnop, D. R.: Aircraft observations of aerosol composition and ageing in New England and Mid-Atlantic States during the summer 2002 New England Air Quality Study field campaign, J. Geophys. Res.-Atmos., 112, D09310, https://doi.org/10.1029/2006JD007786, 2007.
Kopacek, J. and Posch, M.: Anthropogenic nitrogen emissions during the Holocene and their possible effects on remote ecosystems, Global Biogeochem. Cy., 25, 1–17, 2011.
Koppmann, R., von Czapiewski, K., and Reid, J. S.: A review of biomass burning emissions, part I: gaseous emissions of carbon monoxide, methane, volatile organic compounds, and nitrogen containing compounds, Atmos. Chem. Phys. Discuss., 5, 10455–10516, https://doi.org/10.5194/acpd-5-10455-2005, 2005.
Koss, A. R., Sekimoto, K., Gilman, J. B., Selimovic, V., Coggon, M. M., Zarzana, K. J., Yuan, B., Lerner, B. M., Brown, S. S., Jimenez, J. L., Krechmer, J., Roberts, J. M., Warneke, C., Yokelson, R. J., and de Gouw, J.: Non-methane organic gas emissions from biomass burning: identification, quantification, and emission factors from PTR-ToF during the FIREX 2016 laboratory experiment, Atmos. Chem. Phys., 18, 3299–3319, https://doi.org/10.5194/acp-18-3299-2018, 2018.
Kuhlbusch, T. A., Lobert, J. M., Crutzen, P. J., and Warneck, P.: Molecular nitrogen emissions from denitrification during biomass burning, Nature, 351, 135–137, 1991.
Kundu, S., Kawamura, K., Andreae, T. W., Hoffer, A., and Andreae, M. O.: Molecular distributions of dicarboxylic acids, ketocarboxylic acids and α-dicarbonyls in biomass burning aerosols: implications for photochemical production and degradation in smoke layers, Atmos. Chem. Phys., 10, 2209–2225, https://doi.org/10.5194/acp-10-2209-2010, 2010.
Kuwata, M., Neelam-Naganathan, G. G., Miyakawa, T., Khan, M. F., Kozan, O., Kawasaki, M., Sumin, S., and Latif, M. T.: Constraining the emission of particulate matter from Indonesian peatland burning using continuous observation data, J. Geophys. Res.-Atmos., 123, 9828–9842, https://doi.org/10.1029/2018jd028564, 2018.
Lai, C. Y., Liu, Y. C., Ma, J. Z., Ma, Q. X., and He, H.: Degradation kinetics of levoglucosan initiated by hydroxyl radical under different environmental conditions, Atmos. Environ., 91, 32–39, 2014.
Lambe, A. T., Ahern, A. T., Williams, L. R., Slowik, J. G., Wong, J. P. S., Abbatt, J. P. D., Brune, W. H., Ng, N. L., Wright, J. P., Croasdale, D. R., Worsnop, D. R., Davidovits, P., and Onasch, T. B.: Characterization of aerosol photooxidation flow reactors: heterogeneous oxidation, secondary organic aerosol formation and cloud condensation nuclei activity measurements, Atmos. Meas. Tech., 4, 445–461, https://doi.org/10.5194/amt-4-445-2011, 2011.
Laskin, A., Smith, J. S., and Laskin, J.: Molecular Characterization of Nitrogen-Containing Organic Compounds in Biomass Burning Aerosols Using High-Resolution Mass Spectrometry, Environ. Sci. Technol., 43, 3764–3771, 2009.
Levine, J. S.: The 1997 fires in Kalimantan and Sumatra, Indonesia: Gaseous and particulate emissions, Geophys. Res. Lett., 26, 815–818, 1999.
Li, Q., Jacob, B. D. J., Bey, I., Yantosca, R. M., Zhao, Y. J., Kondo, Y., and Notholt, J.: Atmospheric hydrogen cyanide (HCN): Biomass burning source, ocean sink?, Geophys. Res. Lett., 27, 357–360, 2000.
Li, R., Palm, B. B., Ortega, A. M., Hlywiak, J., Hu, W., Peng, Z., Day, D. A., Knote, C., Brune, W. H., de Gouw, J. A., and Jimenez, J. L.: Modeling the Radical Chemistry in an Oxidation Flow Reactor: Radical Formation and Recycling, Sensitivities, and the OH Exposure Estimation Equation, J. Phys. Chem. A, 119, 4418–4432, https://doi.org/10.1021/jp509534k, 2015.
Lobert, J. M., Scharffe, D. H., Hao, W. M., and Crutzen, P. J.: Importance of biomass burning in the atmopsheric budgets of nitrogen-containing gases, Nature, 346, 552–554, 1990.
May, A. A., Saleh, R., Hennigan, C. J., Donahue, N. M., and Robinson, A. L.: Volatility of organic molecular markers used for source apportionment analysis: Measurements and implications for atmospheric lifetime, Environ. Sci. Technol., 46, 12435–12444, 2012.
May, A. A., McMeeking, G. R., Lee, T., Taylor, J. W., Craven, J. S., Burling, I., Sullivan, A. P., Akagi, S., Collett, J. L., Flynn, M., Coe, H., Urbanski, S. P., Seinfeld, J. H., Yokelson, R. J., and Kreidenweis, S. M.: Aerosol emissions from prescribed fires in the United States: A synthesis of laboratory and aircraft measurements, J. Geophys. Res.-Atmos., 119, 11826–11849, 2014.
McMahon, C. K., Wade, D. D., and Tsoukalas, S. N.: Combustion characteristics and emissions from burning organic soils, in: Proceedings, 73rd Annual Meeting of the Air Pollution Control Association, Air & Waste Management Association, Pittsburgh, PA, 22–27 June, 1980.
McMurry, P. H. and Grosjean, D.: Gas and aerosol wall losses in Teflon film smog chambers, Environ. Sci. Technol., 19, 1176–1182, https://doi.org/10.1021/es00142a006, 1985.
Miettinen, J., Hooijer, A., Vernimmen, R., Liew, S. C., and Page, S. E.: From carbon sink to carbon source: Extensive peat oxidation in insular Southeast Asia since 1990, Environ. Res. Lett., 12, 024014, https://doi.org/10.1088/1748-9326/aa5b6, 2017.
Muraleedharan, T. R., Radojevic, M., Waugh, A., and Caruana, A.: Emissions from the combustion of peat: An experimental study, Atmos. Environ., 34, 3033–3035, 2000.
Na, K., Song, C., Switzer, C., and Cocker, D. R.: Effect of ammonia on secondary organic aerosol formation from alpha-Pinene ozonolysis in dry and humid conditions, Environ. Sci. Technol., 41, 6096–6102, 2007.
Nara, H., Tanimoto, H., Tohjima, Y., Mukai, H., Nojiri, Y., and Machida, T.: Emission factors of CO2, CO and CH4 from Sumatran peatland fires in 2013 based on shipboard measurements, Tellus B, 69, 1–14, https://doi.org/10.1080/16000889.2017.1399047, 2017.
Neff, J. C., Holland, E. A., Dentener, F. J., McDowell, W. H., and Russell, K. M.: The origin, composition and rates of organic nitrogen deposition: a missing piece of the nitrogen cycle?, Biogeochemistry, 57/58, 99–136, 2002.
Neuman, J. A., Huey, L. G., Ryerson, T. B., and Fahey, D. W.: Study of Inlet Materials for Sampling Atmospheric Nitric Acid, Environ. Sci. Technol., 33, 1133–1136, https://doi.org/10.1021/es980767f, 1999.
Ng, N. L., Chhabra, P. S., Chan, A. W. H., Surratt, J. D., Kroll, J. H., Kwan, A. J., McCabe, D. C., Wennberg, P. O., Sorooshian, A., Murphy, S. M., Dalleska, N. F., Flagan, R. C., and Seinfeld, J. H.: Effect of NOx level on secondary organic aerosol (SOA) formation from the photooxidation of terpenes, Atmos. Chem. Phys., 7, 5159–5174, https://doi.org/10.5194/acp-7-5159-2007, 2007.
NIOSH: Method 5050, Elemental carbon (diesel particulate), in: NIOSH Manual of Analytical Methods, 4th ed., National Institute of Occupational Safety and Health, Cincinnati, OH, 1999.
Ohlemiller, T. J., Bellan, J., and Rogers, F.: A model of smoldering combustion applied to flexible polyurethane foams, Combust. Flame, 36, 197–215, 1979.
Olszyna, K. J., Bailey, E. M., Simonaitis, R., and Meagher, J. F.: O3 and NOy relationships at a rural site, J. Geophys. Res., 99, 14557–14563, 1994.
Page, S. E., Siegert, F., Rieley, J. O., Boehm, H. D. V., Jaya, A., and Limin, S.: The amount of carbon released from peat and forest fires in Indonesia during 1997, Nature, 420, 61–65, https://doi.org/10.1038/nature01131, 2002.
Page, S. E., Rieley, J. O., and Banks, C. J.: Global and regional importance of the tropical peatland carbon pool, Glob. Change Biol., 17, 798–818, 2011.
Parrish, D. D., Hahn, C. J., Williams, E. J., Norton, E. B., and Fehsenfeld, F. C.: Indications of photochemical histories of Pacific air masses from measurements of atmospheric trace species at Point Arena, California, J. Geophys. Res. Lett., 97, 15833–15901, 1992.
Peng, Z., Day, D. A., Stark, H., Li, R., Lee-Taylor, J., Palm, B. B., Brune, W. H., and Jimenez, J. L.: HOx radical chemistry in oxidation flow reactors with low-pressure mercury lamps systematically examined by modeling, Atmos. Meas. Tech., 8, 4863–4890, https://doi.org/10.5194/amt-8-4863-2015, 2015.
Pokhrel, R. P., Wagner, N. L., Langridge, J. M., Lack, D. A., Jayarathne, T., Stone, E. A., Stockwell, C. E., Yokelson, R. J., and Murphy, S. M.: Parameterization of single-scattering albedo (SSA) and absorption Ångström exponent (AAE) with EC / OC for aerosol emissions from biomass burning, Atmos. Chem. Phys., 16, 9549–9561, https://doi.org/10.5194/acp-16-9549-2016, 2016.
Pratap, V., Bian, Q. J., Kiran, S. A., Hopke, P. K., Pierce, J. R., and Nakao, S.: Investigation of levoglucosan decay in wood smoke smog-chamber experiments: The importance of aerosol loading, temperature, and vapor wall losses in interpreting results, Atmos. Environ., 199, 224–232, https://doi.org/10.1016/j.atmosenv.2018.11.020, 2019.
Prenni, A. J., Levin, E. J. T., Benedict, K. B., Sullivan, A. P., Schurman, M. I., Gebhart, K. A., Day, D. E., Carrico, C. M., Malm, W. C., Schichtel, B. A., Collett, J. L., and Kreidenweis, S. M.: Gas-phase reactive nitrogen near Grand Teton National Park: Impacts of transport, anthropogenic emissions, and biomass burning, Atmos. Environ., 89, 749–756, 2014.
Rein, G., Cohen, S., and Simeoni, A.: Carbon emissions from smouldering peat in shallow and strong fronts, P. Combust. Inst., 32, 2489–2496, https://doi.org/10.1016/j.proci.2008.07.008, 2009.
Roberts, J. M., Veres, P. R., Cochran, A. K., Warneke, C., Burling, I. R., Yokelson, R. J., Lerner, B., Gilman, J. B., Kuster, W. C., Fall, R., and de Gouw, J.: Isocyanic acid in the atmosphere and its possible link to smoke-related health effects, P. Natl. Acad. Sci. USA, 108, 8966–8971, 2011.
Roulston, C., Paton-Walsh, C., Smith, T. E. L., Guerette, E. A., Evers, S., Yule, C. M., Rein, G., and Van der Werf, G. R.: Fine particle emissions from tropical peat fires decrease rapidly with time since ignition, J. Geophys. Res.-Atmos., 123, 5607–5617, https://doi.org/10.1029/2017jd027827, 2018.
Seinfeld, J. H. and Pandis, S. N.: Atmospheric Chemistry and Physics: From Air Pollution to Climate Change, John Wiley & Sons, New York, NY, 1998.
Setyawati, W., Damanhuri, E., Lestari, P., and Dewi, K.: Emission factor from small scale tropical peat combustion, in: 1st Annual Applied Science and Engineering Conference, edited by: Abdullah, A. G., Nandiyanto, A. B. D., and Danuwijaya, A. A., IOP Conference Series-Materials Science and Engineering, 2017.
Simoneit, B. R. T., Rushdi, A. I., Bin Abas, M. R., and Didyk, B. M.: Alkyl amides and nitriles as novel tracers for biomass burning, Environ. Sci. Technol., 37, 16–21, 2003.
Smith, T. E. L., Evers, S., Yule, C. M., and Gan, J. Y.: In situ tropical peatland fire emission factors and their variability, as determined by field measurements in peninsula Malaysia, Global Biogeochem. Cy., 32, 18–31, https://doi.org/10.1002/2017gb005709, 2018.
Stephens, M., Turner, N., and Sandberg, J.: Particle identification by laser-induced incandescence in a solid-state laser cavity, Appl. Optics, 42, 3726–3736, https://doi.org/10.1364/ao.42.003726, 2003.
Stockwell, C. E., Yokelson, R. J., Kreidenweis, S. M., Robinson, A. L., DeMott, P. J., Sullivan, R. C., Reardon, J., Ryan, K. C., Griffith, D. W. T., and Stevens, L.: Trace gas emissions from combustion of peat, crop residue, domestic biofuels, grasses, and other fuels: configuration and Fourier transform infrared (FTIR) component of the fourth Fire Lab at Missoula Experiment (FLAME-4), Atmos. Chem. Phys., 14, 9727–9754, https://doi.org/10.5194/acp-14-9727-2014, 2014.
Stockwell, C. E., Veres, P. R., Williams, J., and Yokelson, R. J.: Characterization of biomass burning emissions from cooking fires, peat, crop residue, and other fuels with high-resolution proton-transfer-reaction time-of-flight mass spectrometry, Atmos. Chem. Phys., 15, 845–865, https://doi.org/10.5194/acp-15-845-2015, 2015.
Stockwell, C. E., Jayarathne, T., Cochrane, M. A., Ryan, K. C., Putra, E. I., Saharjo, B. H., Nurhayati, A. D., Albar, I., Blake, D. R., Simpson, I. J., Stone, E. A., and Yokelson, R. J.: Field measurements of trace gases and aerosols emitted by peat fires in Central Kalimantan, Indonesia, during the 2015 El Niño, Atmos. Chem. Phys., 16, 11711–11732, https://doi.org/10.5194/acp-16-11711-2016, 2016.
Tham, J., Sarkar, S., Jia, S. G., Reid, J. S., Mishra, S., Sudiana, I. M., Swarup, S., Ong, C. N., and Yu, L. Y. E.: Impacts of peat-forest smoke on urban PM2.5 in the Maritime Continent during 2012–2015: Carbonaceous profiles and indicators, Environ. Pollut., 248, 496–505, https://doi.org/10.1016/j.envpol.2019.02.049, 2019.
Tian, J., Chow, J. C., Cao, J. J., Han, Y. M., Ni, H. Y., Chen, L.-W. A., Wang, X. L., Huang, R. J., Moosmüller, H., and Watson, J. G.: A biomass combustion chamber: Design, evaluation, and a case study of wheat straw combustion emission tests, Aerosol Air Qual. Res., 15, 2104–2114, 2015.
Turetsky, M. R., Kane, E. S., Harden, J. W., Ottmar, R. D., Manies, K. L., Hoy, E., and Kasischke, E. S.: Recent acceleration of biomass burning and carbon losses in Alaskan forests and peatlands, Nat. Geosci., 4, 27–31, 2010.
Turetsky, M. R., Benscoter, B., Page, S., Rein, G., van der Werf, G. R., and Watts, A.: Global vulnerability of peatlands to fire and carbon loss, Nat. Geosci., 8, 11–14, https://doi.org/10.1038/ngeo2325, 2015a.
Turetsky, M. R., Benscoter, B., Page, S. E., Rein, G., van der Werf, G. R., and Watts, A. C.: Global vulnerability of peatlands to fire and carbon loss, Nat. Geosci., 8, 1–14, 2015b.
Updyke, K. M., Nguyen, T. B., and Nizkorodov, S. A.: Formation of brown carbon via reactions of ammonia with secondary organic aerosols from biogenic and anthropogenic precursors, Atmos. Environ., 63, 22–31, 2012.
USDA: How to import foreign soil and how to move soil within the United States, U.S. Department of Agriculture, Washington, DC, 2010.
U.S. EPA: Inventory of U.S. greenhouse gas emissions and sinks, U.S. Environmental Protection Agency, Washington, DC, 2016.
VDI: Measurement of soot (ambient air) – Thermographic determination of elemental carbon after thermal desorption of organic carbon, Verein Deutscher Ingenieure, Dusseldorf, Germany 2465 Part 2, 1999.
Villena, G., Bejan, I., Kurtenbach, R., Wiesen, P., and Kleffmann, J.: Interferences of commercial NO2 instruments in the urban atmosphere and in a smog chamber, Atmos. Meas. Tech., 5, 149–159, https://doi.org/10.5194/amt-5-149-2012, 2012.
Wang, N., Jorga, S. D., Pierce, J. R., Donahue, N. M., and Pandis, S. N.: Particle wall-loss correction methods in smog chamber experiments, Atmos. Meas. Tech., 11, 6577–6588, https://doi.org/10.5194/amt-11-6577-2018, 2018.
Wang, X. L., Chancellor, G., Evenstad, J., Farnsworth, J. E., Hase, A., Olson, G. M., Sreenath, A., and Agarwal, J. K.: A novel optical instrument for estimating size segregated aerosol mass concentration in real time, Aerosol Sci. Tech., 43, 939–950, 2009.
Wang, X. L., Watson, J. G., Chow, J. C., Gronstal, S., and Kohl, S. D.: An efficient multipollutant system for measuring real-world emissions from stationary and mobile sources, Aerosol Air Qual. Res., 12, 145–160, 2012.
Ward, D. E, and Hardy, C. C.: Advances in the characterization and control of emissions from prescribed fires, 77th Annual Meeting of the Air pollution Control Association, San Francisco, CA, 24–29 June, 1984.
Ward, D. E. and Radke, L. F.: Emissions measurements from vegetation fires: A comparative evaluation of methods and results, Fire in the Environment: The Ecological, Atmospheric and Climatic Importance of Vegetation Fires, 13, 53–76, 1993.
Watson, J. G., Chow, J. C., and Frazier, C. A.: X-ray fluorescence analysis of ambient air samples, in: Elemental Analysis of Airborne Particles, Vol. 1, edited by: Landsberger, S. and Creatchman, M., Advances in Environmental, Industrial and Process Control Technologies, Gordon and Breach Science, Amsterdam, the Netherlands, 67–96, 1999.
Watson, J. G., Chow, J. C., and Chen, L.-W. A.: Summary of organic and elemental carbon/black carbon analysis methods and intercomparisons, Aerosol Air Qual. Res., 5, 65–102, 2005.
Watson, J. G., Tropp, R. J., Kohl, S. D., Wang, X. L., and Chow, J. C.: Filter processing and gravimetric analysis for suspended particulate matter samples, Aerosol Sci. Eng., 1, 193–205, 2017.
Watts, A. C.: Organic soil combustion in cypress swamps: Moisture effects and landscape implications for carbon release, Forest Ecol. Manag., 294, 178–187, https://doi.org/10.1016/j.foreco.2012.07.032, 2013.
Wilson, D., Dixon, S. D., Artz, R. R. E., Smith, T. E. L., Evans, C. D., Owen, H. J. F., Archer, E., and Renou-Wilson, F.: Derivation of greenhouse gas emission factors for peatlands managed for extraction in the Republic of Ireland and the United Kingdom, Biogeosciences, 12, 5291–5308, https://doi.org/10.5194/bg-12-5291-2015, 2015.
Winer, A. M., Peters, J. W., Smith, J. P., and Pitts Jr., J. N.: Response of commercial chemiluminescence NO-NO2 analyzers to other nitrogen-containing compounds, Environ. Sci. Technol., 8, 1118–1121, 1974.
Wooster, M. J., Gaveau, D. L. A., Salim, M. A., Zhang, T. R., Xu, W. D., Green, D. C., Huijnen, V., Murdiyarso, D., Gunawan, D., Borchard, N., Schirrmann, M., Main, B., and Sepriando, A.: New tropical peatland gas and particulate emissions factors indicate 2015 Indonesian fires released far more particulate matter (but less methane) than current inventories imply, Remote Sensing, 10, 1–31, https://doi.org/10.3390/rs10040495, 2018.
Yatavelli, R. L. N., Chen, L.-W. A., Knue, J., Samburova, V., Gyawali, M., Watts, A. C., Chakrabarty, R. K., Moosmuller, H., Hodzic, A., Wang, X. L., Zielinska, B., Chow, J. C., and Watson, J. G.: Emissions and partitioning of intermediate-volatility and semi-volatile polar organic compounds (I/SV-POCs) during laboratory combustion of boreal and sub-tropical peat, Aerosol Sci. Eng., 1, 25–32, 2017.
Yokelson, R. J., Susott, R., Ward, D. E., Reardon, J., and Griffith, D. W. T.: Emissions from smoldering combustion of biomass measured by open- path Fourier transform infrared spectroscopy, J. Geophys. Res., 102, 18865–18877, 1997.
Yokelson, R. J., Burling, I. R., Gilman, J. B., Warneke, C., Stockwell, C. E., de Gouw, J., Akagi, S. K., Urbanski, S. P., Veres, P., Roberts, J. M., Kuster, W. C., Reardon, J., Griffith, D. W. T., Johnson, T. J., Hosseini, S., Miller, J. W., Cocker III, D. R., Jung, H., and Weise, D. R.: Coupling field and laboratory measurements to estimate the emission factors of identified and unidentified trace gases for prescribed fires, Atmos. Chem. Phys., 13, 89–116, https://doi.org/10.5194/acp-13-89-2013, 2013.
Yu, Z. C., Loisel, J., Brosseau, D. P., Beilman, D. W., and Hunt, S. J.: Global peatland dynamics since the Last Glacial Maximum, Geophys. Res. Lett., 37, L13402, https://doi.org/10.1029/2010gl043584, 2010.
Zhao, Y. L., Kreisberg, N. M., Worton, D. R., Isaacman, G., Weber, R. J., Liu, S., Day, D. A., Russell, L. M., Markovic, M. Z., VandenBoer, T. C., Murphy, J. G., Hering, S. V., and Goldstein, A. H.: Insights into secondary organic aerosol formation mechanisms from measured gas/particle partitioning of specific organic tracer compounds, Environ. Sci. Technol., 47, 3781–3787, 2013.