the Creative Commons Attribution 4.0 License.
the Creative Commons Attribution 4.0 License.
 | 22 Nov 2019
The Elbrus (Caucasus, Russia) ice core record – Part 1: reconstruction of past anthropogenic sulfur emissions in south-eastern Europe
Susanne Preunkert
Michel Legrand
Stanislav Kutuzov
Patrick Ginot
Vladimir Mikhalenko
Ronny Friedrich
This study reports on the glaciochemistry of a deep ice core (182 m long) drilled in 2009 at Mount Elbrus in the Caucasus, Russia. Radiocarbon dating of the particulate organic carbon fraction in the ice suggests that the basal ice dates to 280±400 CE (Common Era). Based on chemical stratigraphy, the upper 168.6 m of the core was dated by counting annual layers. The seasonally resolved chemical records cover the years 1774–2009 CE, thus being useful to reconstruct many aspects of atmospheric pollution in south-eastern Europe from pre-industrial times to the present day. After having examined the extent to which the arrival of large dust plumes originating from the Sahara and Middle East modifies the chemical composition of the Elbrus (ELB) snow and ice layers, we focus on the dust-free sulfur pollution. The ELB dust-free sulfate levels indicate a 6- and 7-fold increase from 1774–1900 to 1980–1995 in winter and summer, respectively. Remaining close to 55±10 ppb during the 19th century, the annual dust-free sulfate levels started to rise at a mean rate of ∼3 ppb per year from 1920 to 1950. The annual increase accelerated between 1950 and 1975 (8 ppb per year), with levels reaching a maximum between 1980 and 1990 (376±10 ppb) and subsequently decreasing to 270±18 ppb at the beginning of the 21st century. Long-term dust-free sulfate trends observed in the ELB ice cores are compared with those previously obtained in Alpine and Altai (Siberia) ice, with the most important differences consisting in a much earlier onset and a more pronounced decrease in the sulfur pollution over the last 3 decades in western Europe than south-eastern Europe and Siberia.
- Article
(3548 KB) - Full-text XML
- Companion paper
- BibTeX
- EndNote


It is now well recognized that the present climate change is not only related to the change of long-lived greenhouses gases but also of short-lived climate forcers, with one of the most important components being aerosol, particularly at regional scales. In this way, it has been suggested that aerosols may have weakened the rate of global warming during the second part of the last century (Andreae et al., 2005). However, uncertainties still exist in quantifying the climatic impact of aerosols. The spatial distribution of aerosols is very heterogeneous and therefore requires numerous observations to make these parameters useful as inputs and constraints for transport and chemistry models. An important gap is also related to the fact that direct atmospheric observations are available only from long after (starting with the appearance of the acid rain phenomena in the late 1960s) man-made activities started to impact the pre-industrial atmosphere. However, to predict future climate, knowledge of atmospheric changes in aerosol load and composition from the present-day polluted atmosphere back to pre-industrial times is required. Chemical records of species trapped in snow deposited on cold glaciers provide a unique and powerful way to reconstruct past atmospheric chemistry changes including aerosol load and composition (see Legrand and Mayewski, 1997, for a review).
In Eurasia, a largely industrialized continent, ice cores were extracted from high-elevation glaciers located at various places, including the Alps (Preunkert and Legrand, 2013; Schwikowski et al., 2004), the continental Siberian Altai (Eichler et al., 2009, 2012; Olivier et al., 2006), and Kamchatka (Kawamura et al., 2012). In the Alps, intimately connected to western European emissions, ice cores have been investigated at Col du Dôme (CDD, Mont Blanc, Preunkert, 2001), Fiescherhorn (Bernese Alps, Jenk et al., 2006), and Colle Gnifetti (CG) in the Monte Rosa region (Schwikowski, 2006; Wagenbach et al., 2012) in order to examine various aspects of atmospheric pollution. The exceptionally high net snow accumulation at the CDD site permitted the extraction of seasonally resolved records of various chemical species over the last 100 years (Preunkert and Legrand, 2013). In older ice layers preservation of winter layers at CDD becomes very limited and summer layers become very thin. Conversely, the low and incomplete net snow accumulation rate at CG, which is controlled by wind erosion, highly limits the preservation of winter ice layers (Wagenbach et al., 2012) but is low enough to provide access to an extended time period, at least over the last millennium. Using the EMEP (European Monitoring and Evaluation Programme) regional chemistry–transport model and past emission inventories of SO2 in Europe, observed CDD long-term trends of sulfate were fairly well reproduced, leading Fagerli et al. (2007) to conclude that the seasonal changes seen at the CDD alpine site are associated with geographical changes in source regions impacting the site. This is a strong argument for a separate examination of summer and winter data, extracted from alpine ice cores. However, until now, Alpine ice cores document only the last hundred years (at the best back to 1890, Legrand et al., 2018) on a seasonal basis, whereas the early stage of the industrialization time period, which is generally considered to have started around 1850, is missed. An ice core recently extracted from the Elbrus (the highest summit of the Caucasus) indicated excellent preservation of summer and winter layers at least back to 1820 (Mikhalenko et al., 2015). Thus, the ELB ice may contain very valuable information on past atmospheric pollution in south-eastern Europe since the beginning of industrialization.
Here we report on the glaciochemistry of a deep ice core in 2009 in the Caucasus, Russia. Seasonally resolved chemical records were obtained back to 1774 (i.e. well prior to the onset of the industrial period). Data are discussed in two companion papers of which this one. The present paper examines first of all the impact of large dust plumes, which arrive sporadically from the Sahara and Middle East, on the chemical composition of the Elbrus (ELB) snow and ice layers. It then focuses on long-term dust-free sulfate trends in relation to growing sulfur pollution. The long-term summer and winter trends of dust-free sulfate are discussed with respect to past SO2 emissions in south-eastern Europe and compared to those extracted at the Alpine site of CDD and the Siberian Altai (Belukha glacier) in relation to SO2 emissions from western and eastern Europe, respectively. The second paper focuses on the calcium (a dust tracer) long-term trend (Kutuzov et al., 2019), discussing its past changes in relation to natural variability, as well as climatic and land use changes in the dust source regions of the Middle East and North Africa.
A deep ice core was drilled to bedrock (182.6 m, i.e. 142.1 m water equivalent, m.w.e.) in 2009 on the western plateau of Mt Elbrus (43∘21′ N, 42∘26′ E; 5115 m above sea level) in the Caucasus, Russia (Fig. 1). Glaciological settings of the drill site are detailed in Mikhalenko et al. (2015). In brief, the surface of the glacier plateau is about 0.5 km2, and the surface snow accumulation at the drill site is about 1.5 m.w.e. yr−1. Ice-penetrating radar measurements made in 2007 and 2009 revealed a maximum glacier thickness of 255±8 m at the central part of the plateau and minimum values of ∼60 m near the western border of the glacier. Borehole measurements indicated temperatures of −17 ∘C at 10 m depth and −2.4 ∘C at 181.8 m depth. Occasionally, melting of surface snow can occur; however, the thickness of the infiltration ice layers, which do not form every year, does not exceed 10 mm. After the overall presentation from Mikhalenko et al. (2015), two other studies of the ELB ice core were dedicated to black carbon (Lim et al., 2017) and water stable isotope composition on the 126 m upper layers (Kozachek et al., 2017).
2.1 Discrete subsampling of firn and ice, as well as chemical analysis
Ice cores were subsampled and decontaminated at −15 ∘C using the electric plane tool methodology described in Preunkert and Legrand (2013). In brief, in a first step, ice samples were cut with a band saw. After that, all surfaces of the cut samples were decontaminated by removing ∼3 mm with a pre-cleaned electric plane tool under a clean air bench. A total of 3724 subsamples were obtained along the upper 168.6 m (131.6 m.w.e.) of the Elbrus core. As expected from glacier ice flow (e.g. Paterson and Waddington, 1984), a decrease in the annual ice thickness with depth is observed (Fig. 2). Annual layer thickness decreases from 1.5 m.w.e. (0.8 m.w.e. in summer and 0.7 m.w.e. in winter) near the surface to 0.46 m.w.e. at ∼100 m (i.e. 75 m.w.e.) (0.35 m.w.e. in summer and 0.11 m.w.e. in winter), 0.21 m.w.e. at 155 m (i.e. 120 m.w.e.) (0.12 m.w.e. in summer and 0.09 m.w.e. in winter), and 0.18 m.w.e. (0.15 m.w.e. in summer and 0.03 m.w.e. in winter) at 157 m (i.e. 122 m.w.e.) depth. To minimize the loss of temporal resolution with depth along the core, the sample depth resolution was decreased from 10 cm at the top to 5 cm at 70 m (47 m w.e.) and 2 cm at 157 m (122 m.w.e.) depth and below. In this way, an average of 9 summer samples per year were sampled at 157 m depth (compared to 15 summer samples per year near the surface). The large decrease in the net snow accumulation in winter below 155 m (Fig. 2), likely due to more wind erosion of winter than summer snow layers upstream of the drill site as already observed at other high-altitude glacier sites (e.g. Preunkert et al., 2000), leads to a more pronounced loss of resolution in these winter layers compared to the surface layers (12 samples per winter near the surface and 1–2 samples per winter at 157 m depth).

Figure 1Map showing the location of the Elbrus site (red star) and dust sources (orange shading, based on Kutuzov et al., 2019, and references therein).
For measurements of cations (Na+, K+, Mg2+, Ca2+, and ), a Dionex ICS-1000 chromatograph equipped with a CS12 separator column was used. For anions, a Dionex 600 equipped with an AS11 separator column was run with a quaternary gradient of eluents (H2O and NaOH at 2.5 and 100 mM, as well as CH3OH). A gradient pump system allows the determination of inorganic species (Cl−, , and ) as well as short-chain carboxylates. Investigated carboxylates include formate (), lactate (), acetate (), glycolate (), glyoxylate (), oxalate (), malate (), malonate (), succinate (), and glutarate (). Details on working conditions are reported in Legrand et al. (2013). For all investigated ions, blanks of the ice decontamination procedure were found to be insignificant with respect to the respective levels found in the ice cores.
During the drill operations, an incident occurred at the depth of 31 m and a fluid (Havoline XLC, Texaco company) was poured in the hole to liberate the drill device. This has led to the contamination of the firn at 31 m down to the firn–ice transition located at 55.7 m depth. Samples covering the 1983–1997 years were contaminated for sodium (124±87 ppb compared to 26±28 ppb over the 16 preceding years) and potassium (35±25 ppb compared to 16±15 ppb over the 1966–1982 years). One core section (denoted ELB-140) that covers winter 1875/1876, summer 1876, and winter 1876/1877 was not analysed. Finally, a part of the ELB-138 ice core section that covers winter 1877/1878 was of poor quality (split ice).

Figure 2(a) and (b) show mean summer (a) and winter (b) half-year ice thickness along the Elbrus deep ice core. (c) shows mean annual ice thickness and (d) summer-to-winter ratio of ice thickness.
2.2 Annual layer counting
As discussed by Mikhalenko et al. (2015), dating of the Elbrus ice can be done by annual layer counting on the basis of the stratigraphic ammonium and succinic acid records, both exhibiting well-marked winter minima. As previously seen in alpine ice cores, ammonium reveals a well-marked maximum in summer due to a maximum of NH3 emission together with an efficient upward transport in summer (Maupetit et al., 1995; Preunkert et al., 2000, Eichler et al., 2000). Succinic acid is a light dicarboxylic acid for which a strong summer maximum and a quasi-null winter level can be observed in the present-day atmosphere in Europe (Legrand et al., 2007). The very low winter levels of this organic compound are related to the absence of a winter source of this species, which is mainly photochemically produced from biogenic precursors. Mikhalenko et al. (2015) assumed a concentration limit of 100 ppb ammonium and 5 ppb of succinate to separate winter and summer in the upper layers down to 75.6 m depth (i.e. 1963). To account for an observed decreasing trend of ammonium concentrations with depth (i.e. due to a post-1950 increase as also seen for species like nitrate and sulfate; see below), the ammonium winter criterion was adjusted to 50 ppb between 75.6 and 86.8 m depth (i.e. 1950–1963) and 30 ppb below. Since no systematic change of succinate with depth is observed, the succinate concentration limit of 5 ppb was also applied in deeper layers. Requiring that at least one of the criteria is fulfilled and the value of the other is below or close to the limit (< 10 % above), the annual counting was found to be very accurate dating (a 1-year uncertainty) over the last hundred years when anchored with the stratigraphy of the 1912 Katmai horizon (Mikhalenko et al., 2015). A good agreement (a 2-year discrepancy) was also found when comparing this dating with the chronology achieved by annual layer counting of the water stable 18O isotope back to 1900 (Kozachek et al., 2017). Though the annual counting becomes less evident prior to 1860, Mikhalenko et al. (2015) reported an ice age of 1825 at 156.6 m depth, which is still consistent with the presence of a volcanic horizon at around 1833–1840 such as Cosigüina (1835).
We here extended the annual counting down to 168.5 m depth (i.e. 131.6 m.w.e.) by considering a concentration limit of 30 ppb for ammonium and 5 ppb for succinate. With that, ice dates to 1774 CE at the depth of 168.5 m. In Fig. 3 we report the obtained chronology for three different sequences including the deepest one (1774–1784). It could be seen that, in the years prior to 1850, quite often a winter layer is made up of only one or two samples, whereas summer layers are made up of more than six samples. Below 168.5 m depth, the ice core quality becomes rather bad (numerous small pieces of broken ice) rendering subsampling and ice decontamination not evident. Furthermore, as seen in Fig. 4, in contrast to what is observed above 168.5 m, the 30 subsamples obtained along a 1 m long core section at 176.3–177.3 m depth reveal an absence of samples with ammonium and succinate concentrations below the applied winter criterion. This hampered the dating of the basal ice layers of the core by annual counting, and therefore another dating approach based on 14C of particulate organic carbon (POC) was made for this part of the core.
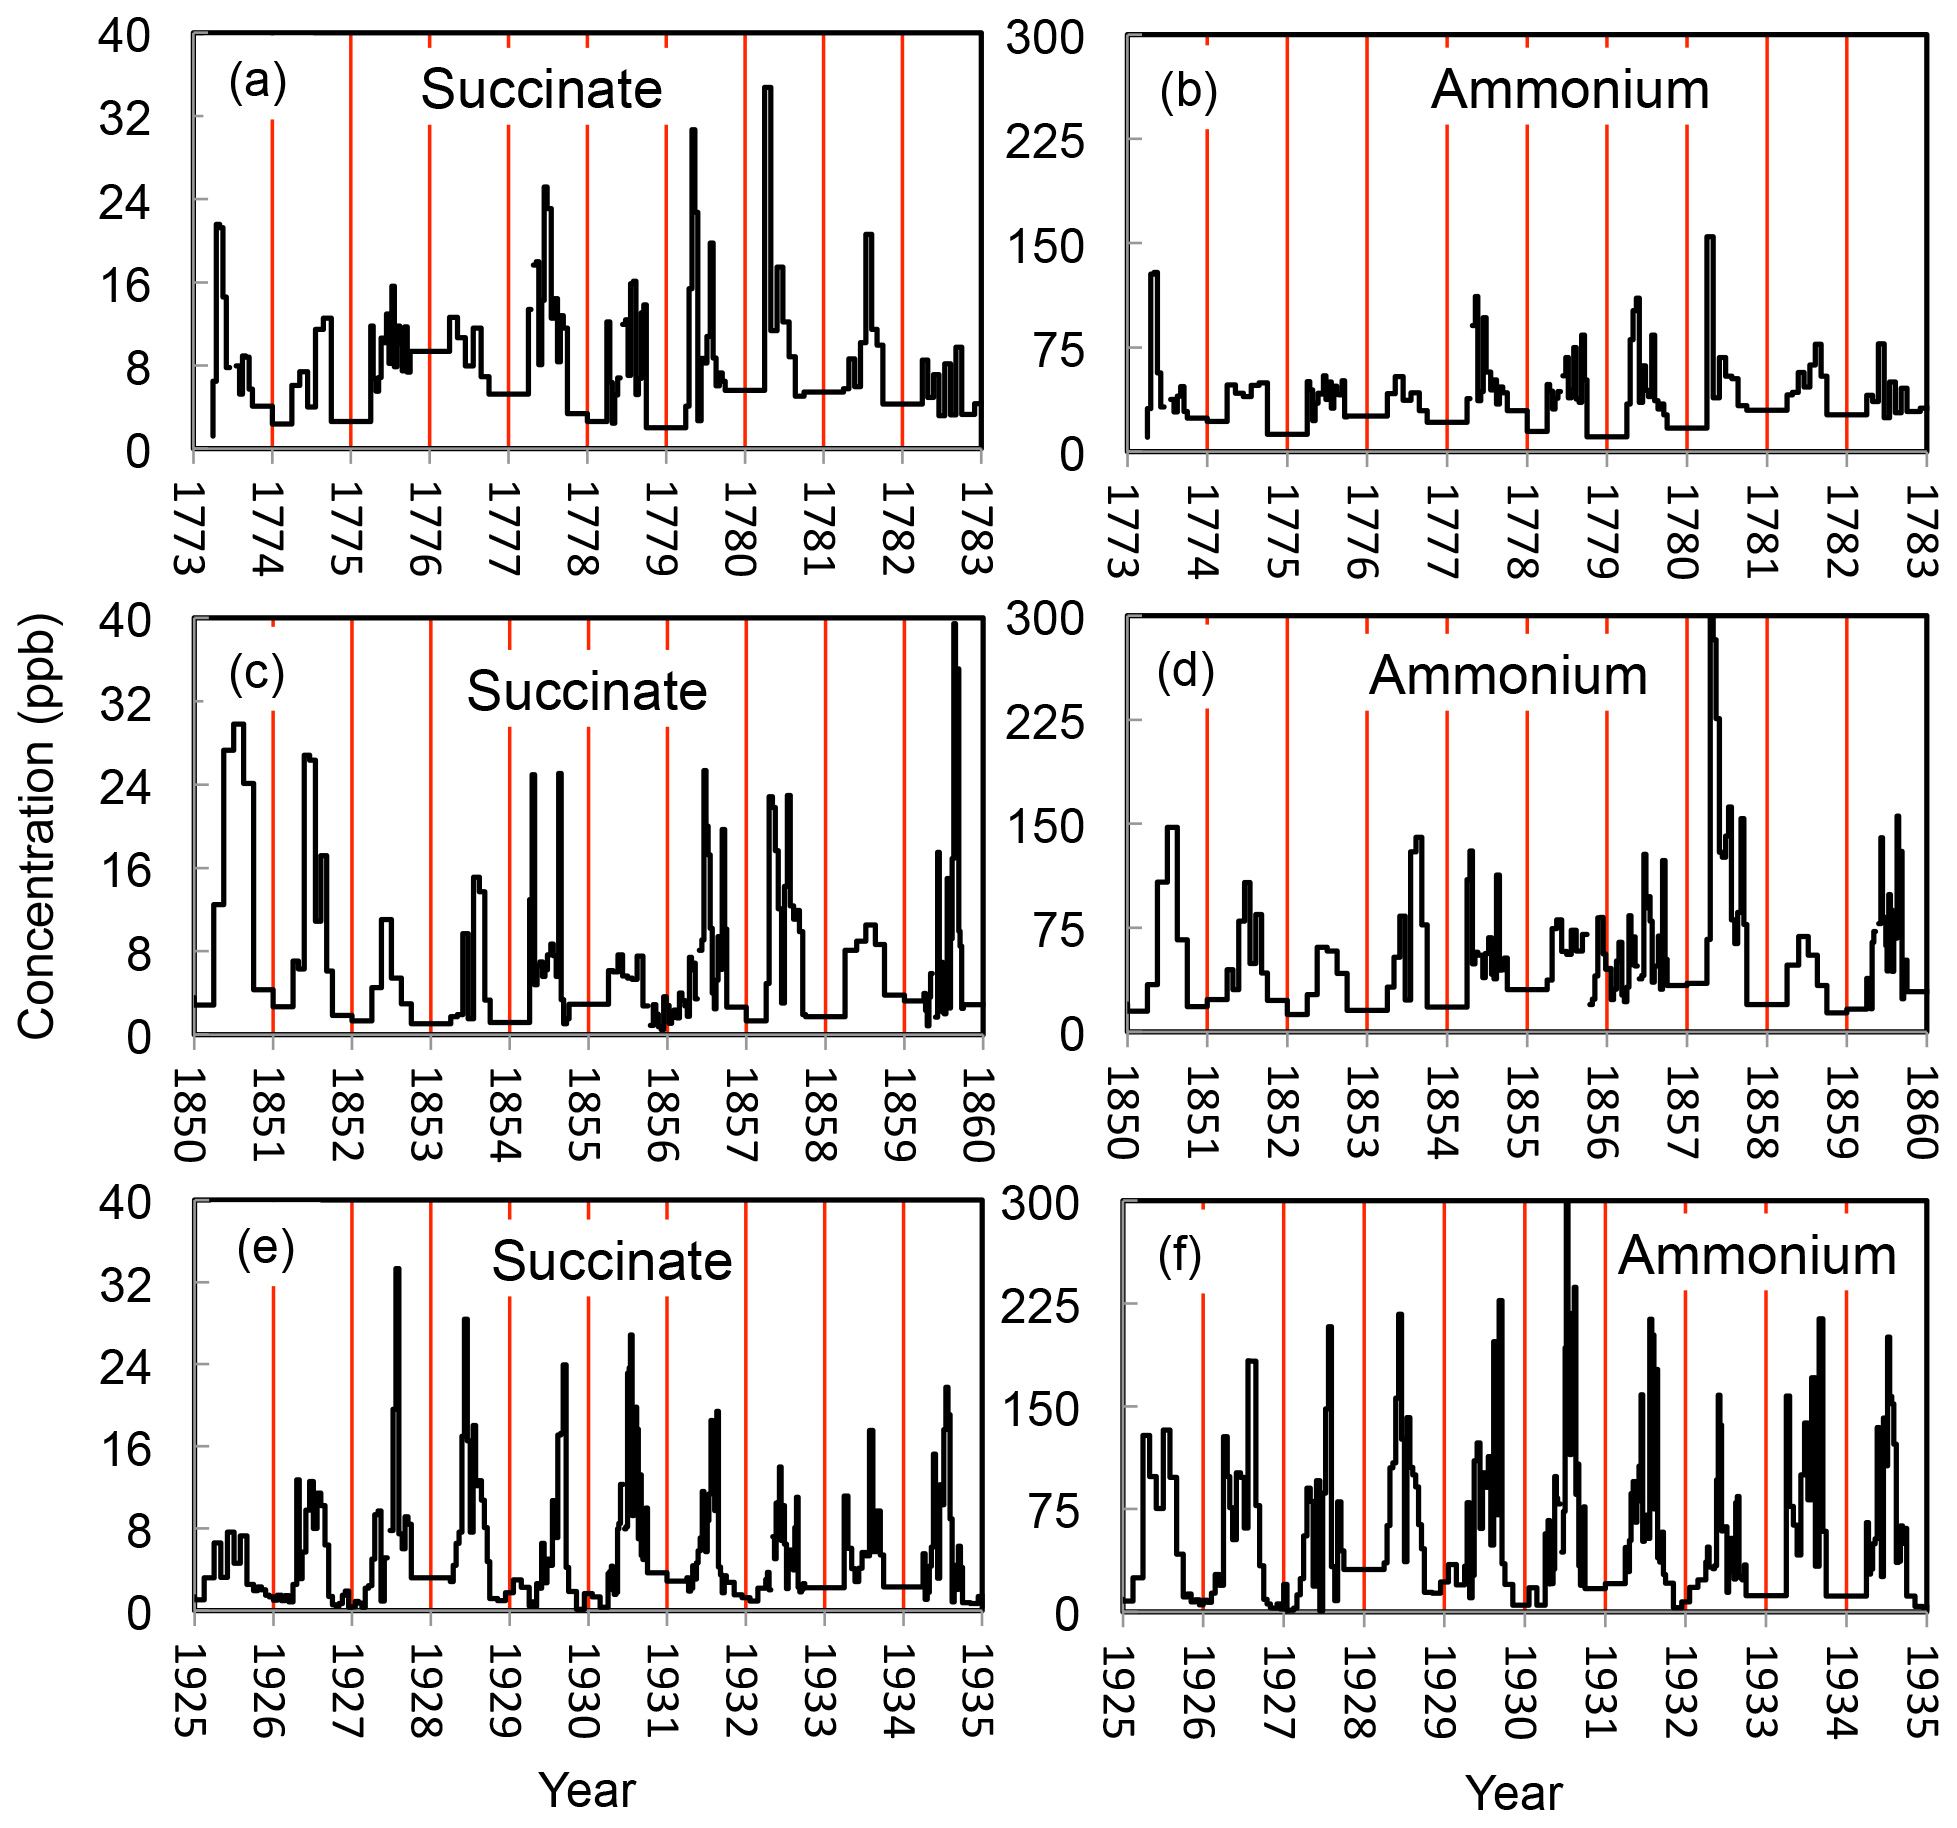
Figure 3ELB ice chronology at depth intervals of 166.2 to 168.5 m (a, b), 154.4 to 156.5 m (c, d), and 99.8 to 107.3 m (e, f), based on the ammonium and succinate stratigraphy. Vertical red lines denote yearly dissection based on identification of winter layers (see Sect. 2.2). For the two oldest time periods (1773–1782 and 1850–1859), each sample was 2 cm long, whereas for the most recent time period (1925–1934) one sample was on average 4 cm long. Note that, although not coherent with the intra-seasonal precipitation distribution (see Kozachek et al., 2017), we here assumed that the accumulation is equally distributed within the summer and winter seasons.
2.3 Basal ice dating
Four ice samples located along the deepest 6 m of the core (bottom at 182.65 m, 142.1 m.w.e.) were analysed for radiocarbon in particulate organic carbon (PO14C). The lowest 0.5 m of the core was not analysed due to a large presence of macro-size inorganic particles. To minimize the time interval covered by each sample, sample lengths were kept as short as possible with respect to the detection limit related to working conditions during sampling and analysis. A typical sample length of 26–40 cm (available ice core section of 14–21 cm2) was used, leading to an initial ice sample mass of 430–580 g. After having decontaminated the ice sample (using a DOC decontamination method according to Preunkert et al., 2011), melted ice was filtered and combusted at 340 ∘C at the Institut de Géophysique Externe (Grenoble) using the in-line filtration–oxidation unit REFILOX (Reinigungs-Filtrations-Oxidationssystem, Hoffmann et al., 2018). Hereby, the resulting ice mass was reduced to 260–320 g containing 4.4 to 6.5 µgC of POC (Table 1). After cryogenic extraction of the CO2 content, radiocarbon analyses were done at the accelerator mass spectrometer facility at the Curt Engelhorn Centre for Archaeometry (CEZA) in Mannheim equipped with a Gas Interface System (GIS) (Hoffmann et al., 2017). Calibration of the retrieved 14C ages was done using OxCal version 4.3 (Bronk Ramsey, 1995, 2009).

Figure 4Distribution of succinate and ammonium concentrations observed in the deepest ice layers for which annual counting was possible (i.e. above 168.5 m depth, a, b) and 10 m below (c, d). The vertical red dashed bars denote the values of the winter criteria.
Table 1Overview of masses (corrected for blanks but not for combustion efficiency) and conventional 14C ages of the Elbrus ice core samples combusted in the REFILOX system. Calibrated date ranges are shown at 68.2 % confidence level and are rounded according to Millard (2014).
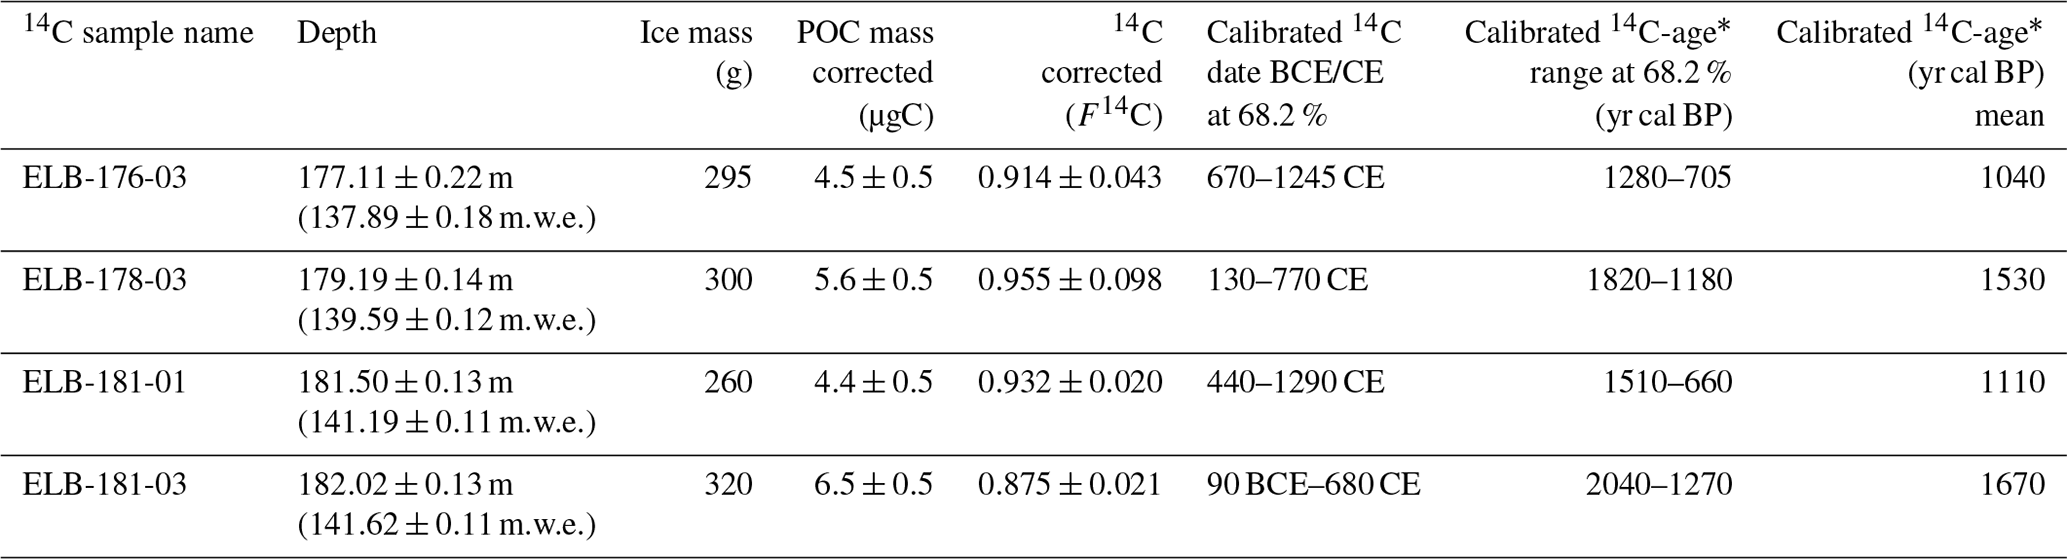
* Age before 1950 CE.
To test the reliability of the DOC decontamination method (Preunkert et al., 2011) for POC analysis, a 340 ∘C REFILOX mass combustion comparison was made between ultrapure water and decontaminated blank ice (three samples of 200 to 500 mL). To achieve an impurity-free solid ice the ultrapure water was slowly frozen in polyethylene (PE) foil (Hoffmann et al., 2018, and references therein). The comparison showed that whatever the blank ice volume, the blank values were in the same range as the ultrapure water POC blanks ( µgC) which were determined during the course of the ELB radiocarbon sample measurements. Thus, the ice decontamination procedure used for DOC ice measurement is also valid for POC ice decontamination.
Since the CO2 collection line was recently extended to allow sample pooling, we were now able to directly determine the fraction of modern carbon (F14C) in blanks done with ultrapure water. A F14C value of 0.71±0.07 was found, measured on three blank samples in total (each consisting of four pooled samples). This value is in agreement with F14C blank values found in previous studies (as reviewed and adopted in Hoffmann et al., 2018). In Table 1, we report ice sample data after blank correction, including correction of the F14C value as well as correction of the extracted POC mass with the respective ultrapure water blank determined before each ice sample extraction.
Using a mean mass-related combustion efficiency of the device of 0.7 (Hoffmann et al., 2018), the mean POC concentration of the four samples obtained by combustion at 340 ∘C is 25.4±3.1 ngC g−1 with a highest concentration of 29.0 ngC g−1 for the lowest sample analysed at 141.6 m.w.e. (182.0 m). These values are in good agreement with those observed by Hoffmann et al. (2018) in the 340 ∘C POC fraction of the lowest 8 m.w.e. of a CG ice core (37±16 ngC g−1). Since a similarity between CG and ELB was also observed for their pre-industrial black carbon content (Lim et al., 2017), we thus exclude significant age errors due to a POC contamination during 14C sample preparation and analysis.
As seen in Table 1, the mean age of the ELB-178-03 sample (1530 yr cal BP, i.e. 1530 years before 1950) is older than the mean age of sample ELB-181-01 located 2.3 m below the ELB-178-03 sample. However, given age uncertainties, it is difficult to conclude that, as observed previously at other mid-latitude glacier sites such as CG (Hoffmann et al., 2018), the ELB radiocarbon ages do not increase monotonically with depth as would be expected from well-behaved ice flow. PO14C measurements suggest that the ELB ice core extends to yr cal BP (Table 1). This is younger than basal ice ages found at Alpine sites, i.e. ∼5000 yr BP for Col du Dome (Preunkert et al., 2019), ∼4000 yr BP (Hoffmann et al., 2018) and > 10 000 yr BP (Jenk et al., 2009) for two CG ice cores, and ∼7000 yr BP for Mt Ortles (3905 m a.s.l.) (Gabrielli et al., 2016). From the observed temperature gradient in the borehole ELB site, Mikhalenko et al. (2015) calculated a heat flux at the bottom glacier that is presently 4–5 times larger than the mean value for the Earth's surface, possibly due to a heat magma chamber of the Elbrus volcano, leading to potential basal ice melting when ice thicknesses exceeds 220 m. Though the ice at the drill site and upstream is at present frozen to bedrock, we can not exclude that in the past, assuming a more active heat chamber due to the eruption of 50±50 CE (located 1.6 km away from the eastern Elbrus plateau), a temporary basal ice melting had occurred at the drill site. If so, that may explain the young age of basal ice at the volcanic crater site compared to other non-volcanic mountain glaciers. The age of the basal ELB ice is nevertheless largely greater than expected by ice flow model calculations, estimating a basal ice age of less than 400 years at the drill site (Mikhalenko et al., 2015). Figure 5 summarizes the extended depth–age relation, including annual layer counting back to 1774 CE, the prominent time horizons, and PO14C data. To interpolate data to a continuous age–depth relation, a two-parameter fit (based on a simple analytical expression for the decrease in the annual layer thickness with depth) was used (Nye, 1963; Jenk et al., 2009; Preunkert et al., 2019).
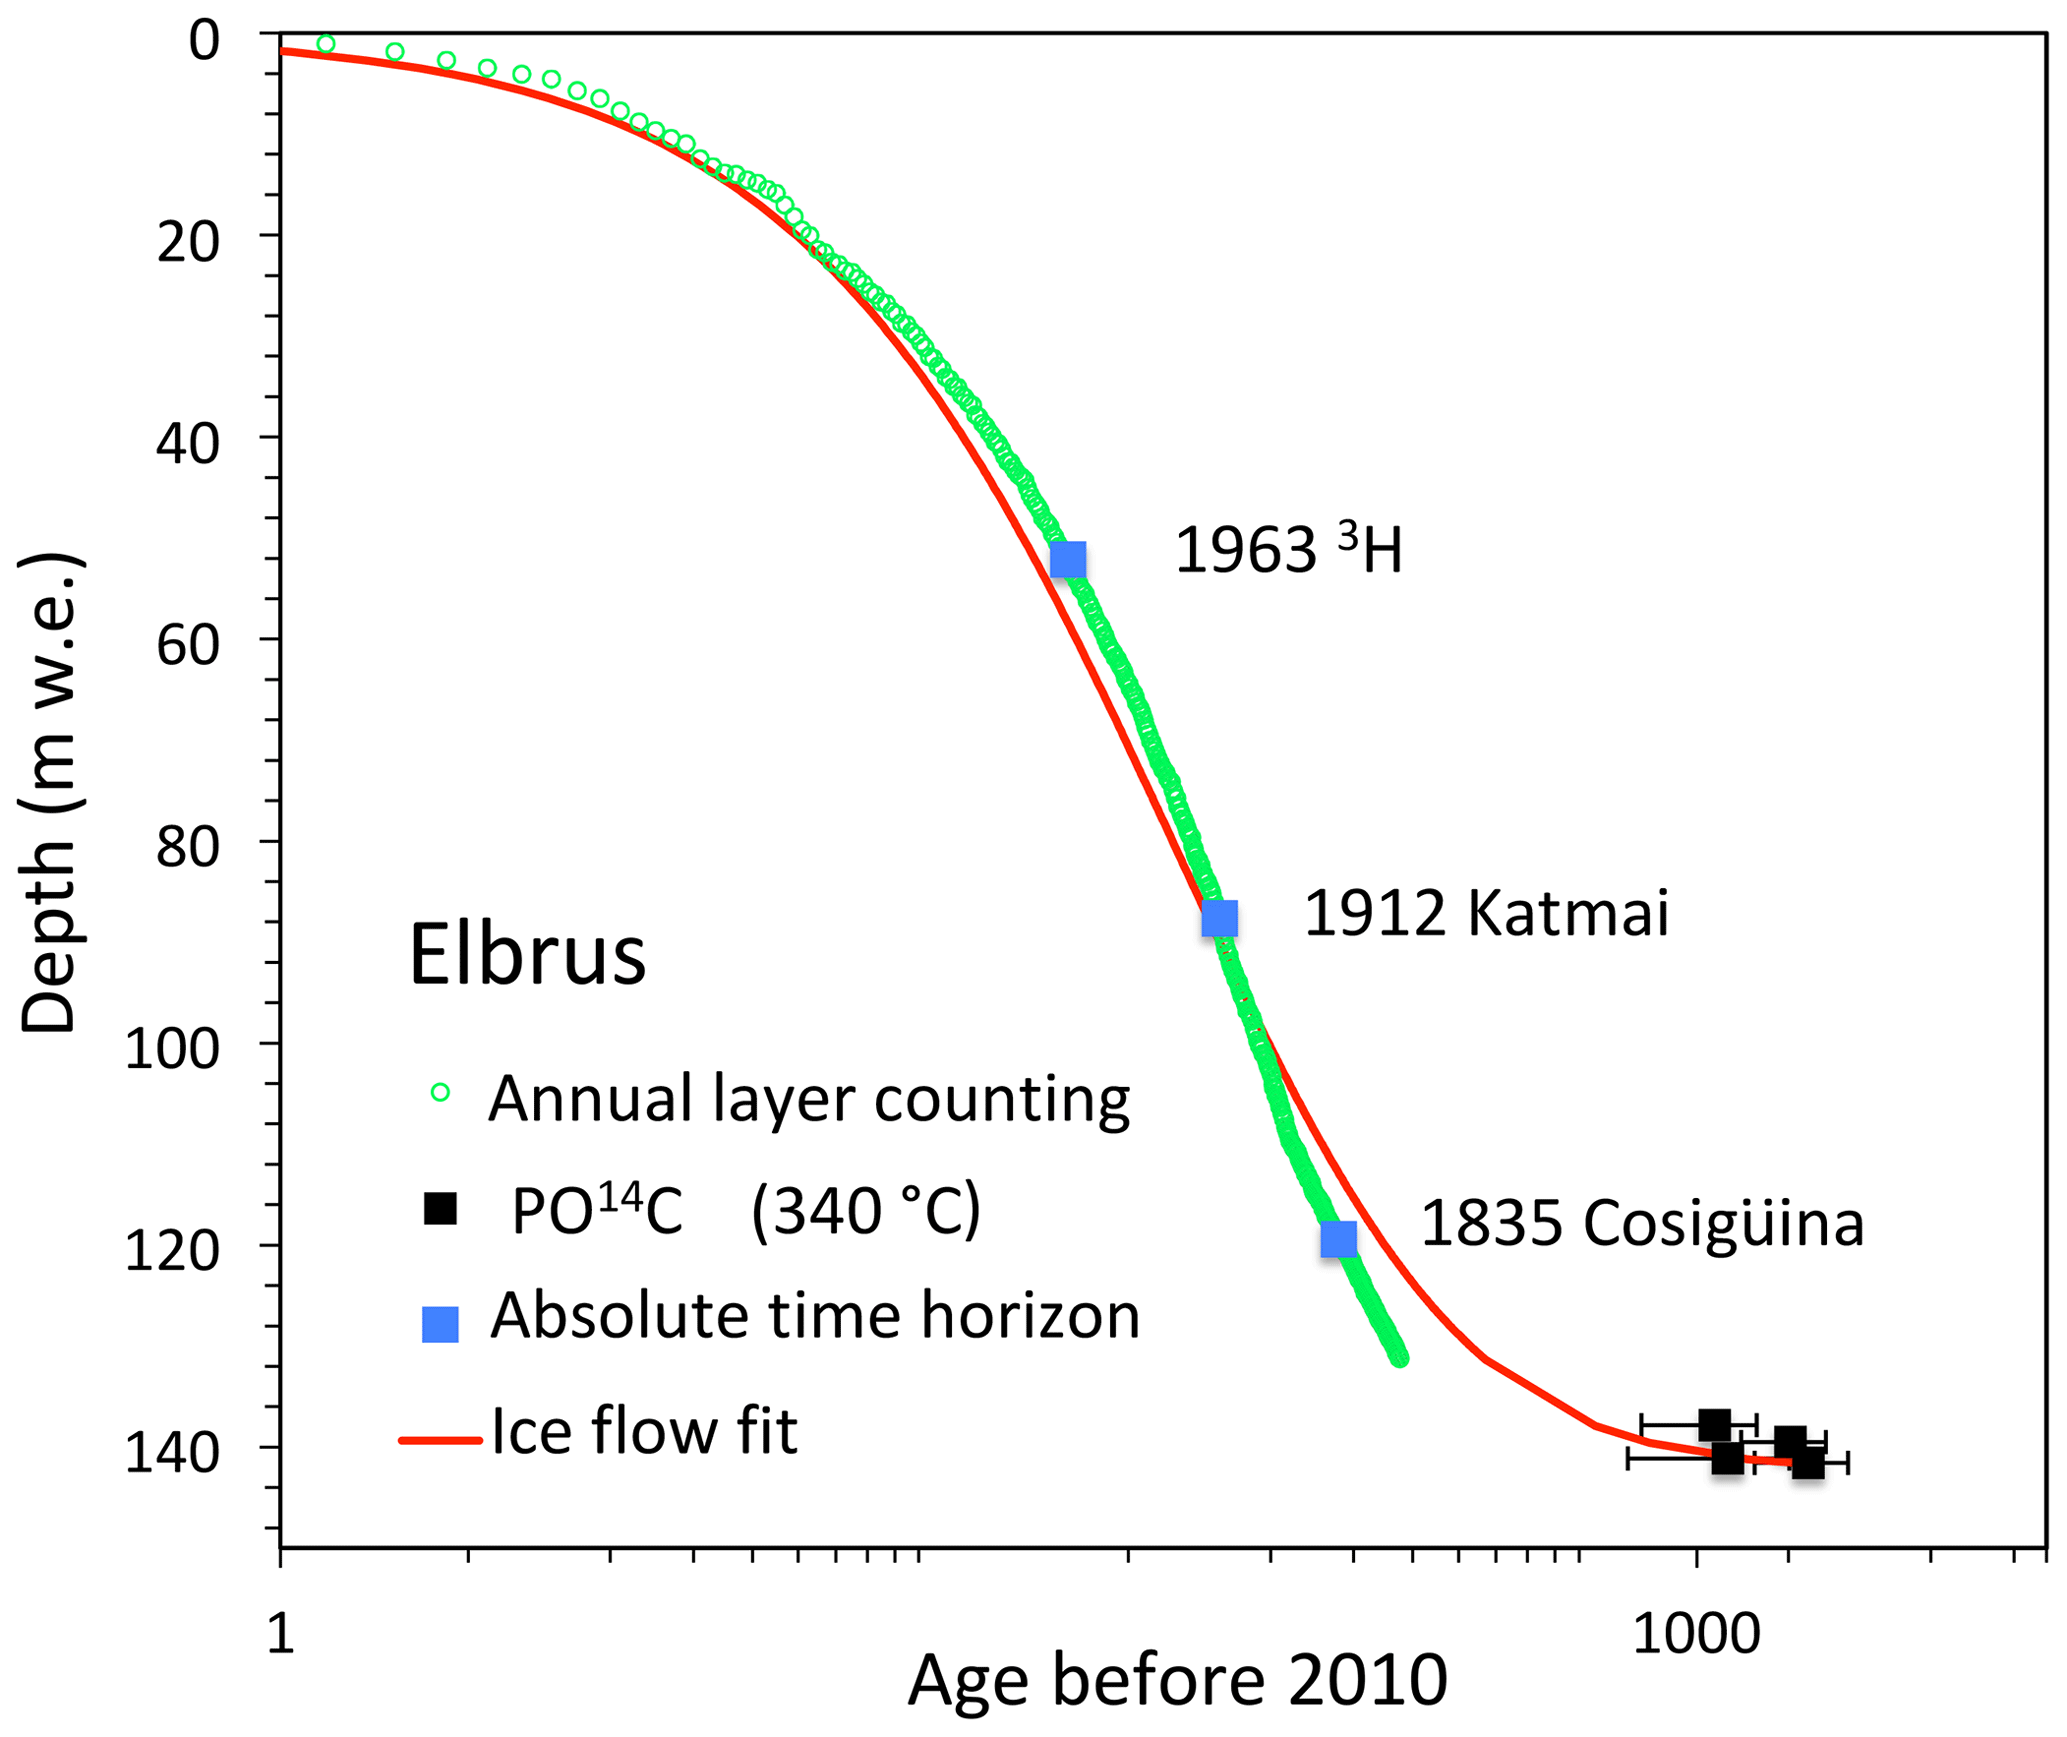
Figure 5Depth (in m.w.e.) and age relation of the ELB ice core derived from annual layer counting, prominent time horizons, and mean blank-corrected and calibrated PO14C data with 1σ age ranges. To interpolate data to a continuous age–depth relation a two-parameter fit was used following Nye (1963).
Large dust plumes originating from the Middle East and less frequently from the Sahara reach the Caucasus (Kutuzov et al., 2013). As seen in the Alps, these dust events modify the chemistry of snow deposits, in particular with calcium-rich alkaline snow layers (Wagenbach et al., 1996). Depositions of these plumes enhance the level of numerous chemical species in Alpine ice because either they are present in dust at the emission stage or, being acidic, they were taken up by the alkaline dust material during transport (Usher et al., 2003). Preunkert (2001) showed that the arrival of dust plumes at CDD enhanced depositions of several cations (sodium, potassium, magnesium, and sodium) as well as acidic anions (sulfate, nitrate, chloride, fluoride, and carboxylates). To identify these layers in the ELB snow and ice we have estimated the acidity (or alkalinity) of samples by checking the ionic balance between anions and cations with concentrations expressed in micro-equivalents per litre, µEq L−1):
In this work, samples that are below the 25 % quartile of a robust spline through the calculated raw acidity profile and contain more than 120 ppb of calcium were considered to be impacted by dust events. In this way, 616 (out of a total of 2524) summer and 67 (out of a total of 1150) winter samples were considered to contain a large amount of dust. Note that the results are quite similar when changing the calcium concentration criteria from 120 ppb to 100 or 140 ppb. Since the frequency of these events has changed over time (Kutuzov et al., 2019) the significance of their impact on the deposition of chemical species is examined. Figure 6 shows the mean ionic budget of samples considered to be contaminated by dust and containing a high and moderate content of calcium compared to samples assumed to be free of dust events, over the 1950–1980 period. For the largest events (Ca2+ > 30 µEq L−1, Fig. 6a), the increase in calcium, accompanied by a strong increase in the alkalinity, reaches a factor of 7.4 compared to dust-free samples (Fig. 6c). In addition, this calcium enhancement is accompanied by an increase of a factor close to 8 for chloride, sodium, potassium, and magnesium, whereas ammonium, nitrate, sulfate, and carboxylates are, at the most, enhanced by a factor of 2. When comparing dust samples containing weaker calcium contents (i.e. Ca2+ < 30 µEq L−1, Fig. 6b) with dust-free samples (Fig. 6c), in addition to the increase in calcium (factor of 2) the most significant changes are seen for magnesium (×1.5), sodium and chloride (×1.6), and potassium (×1.3).
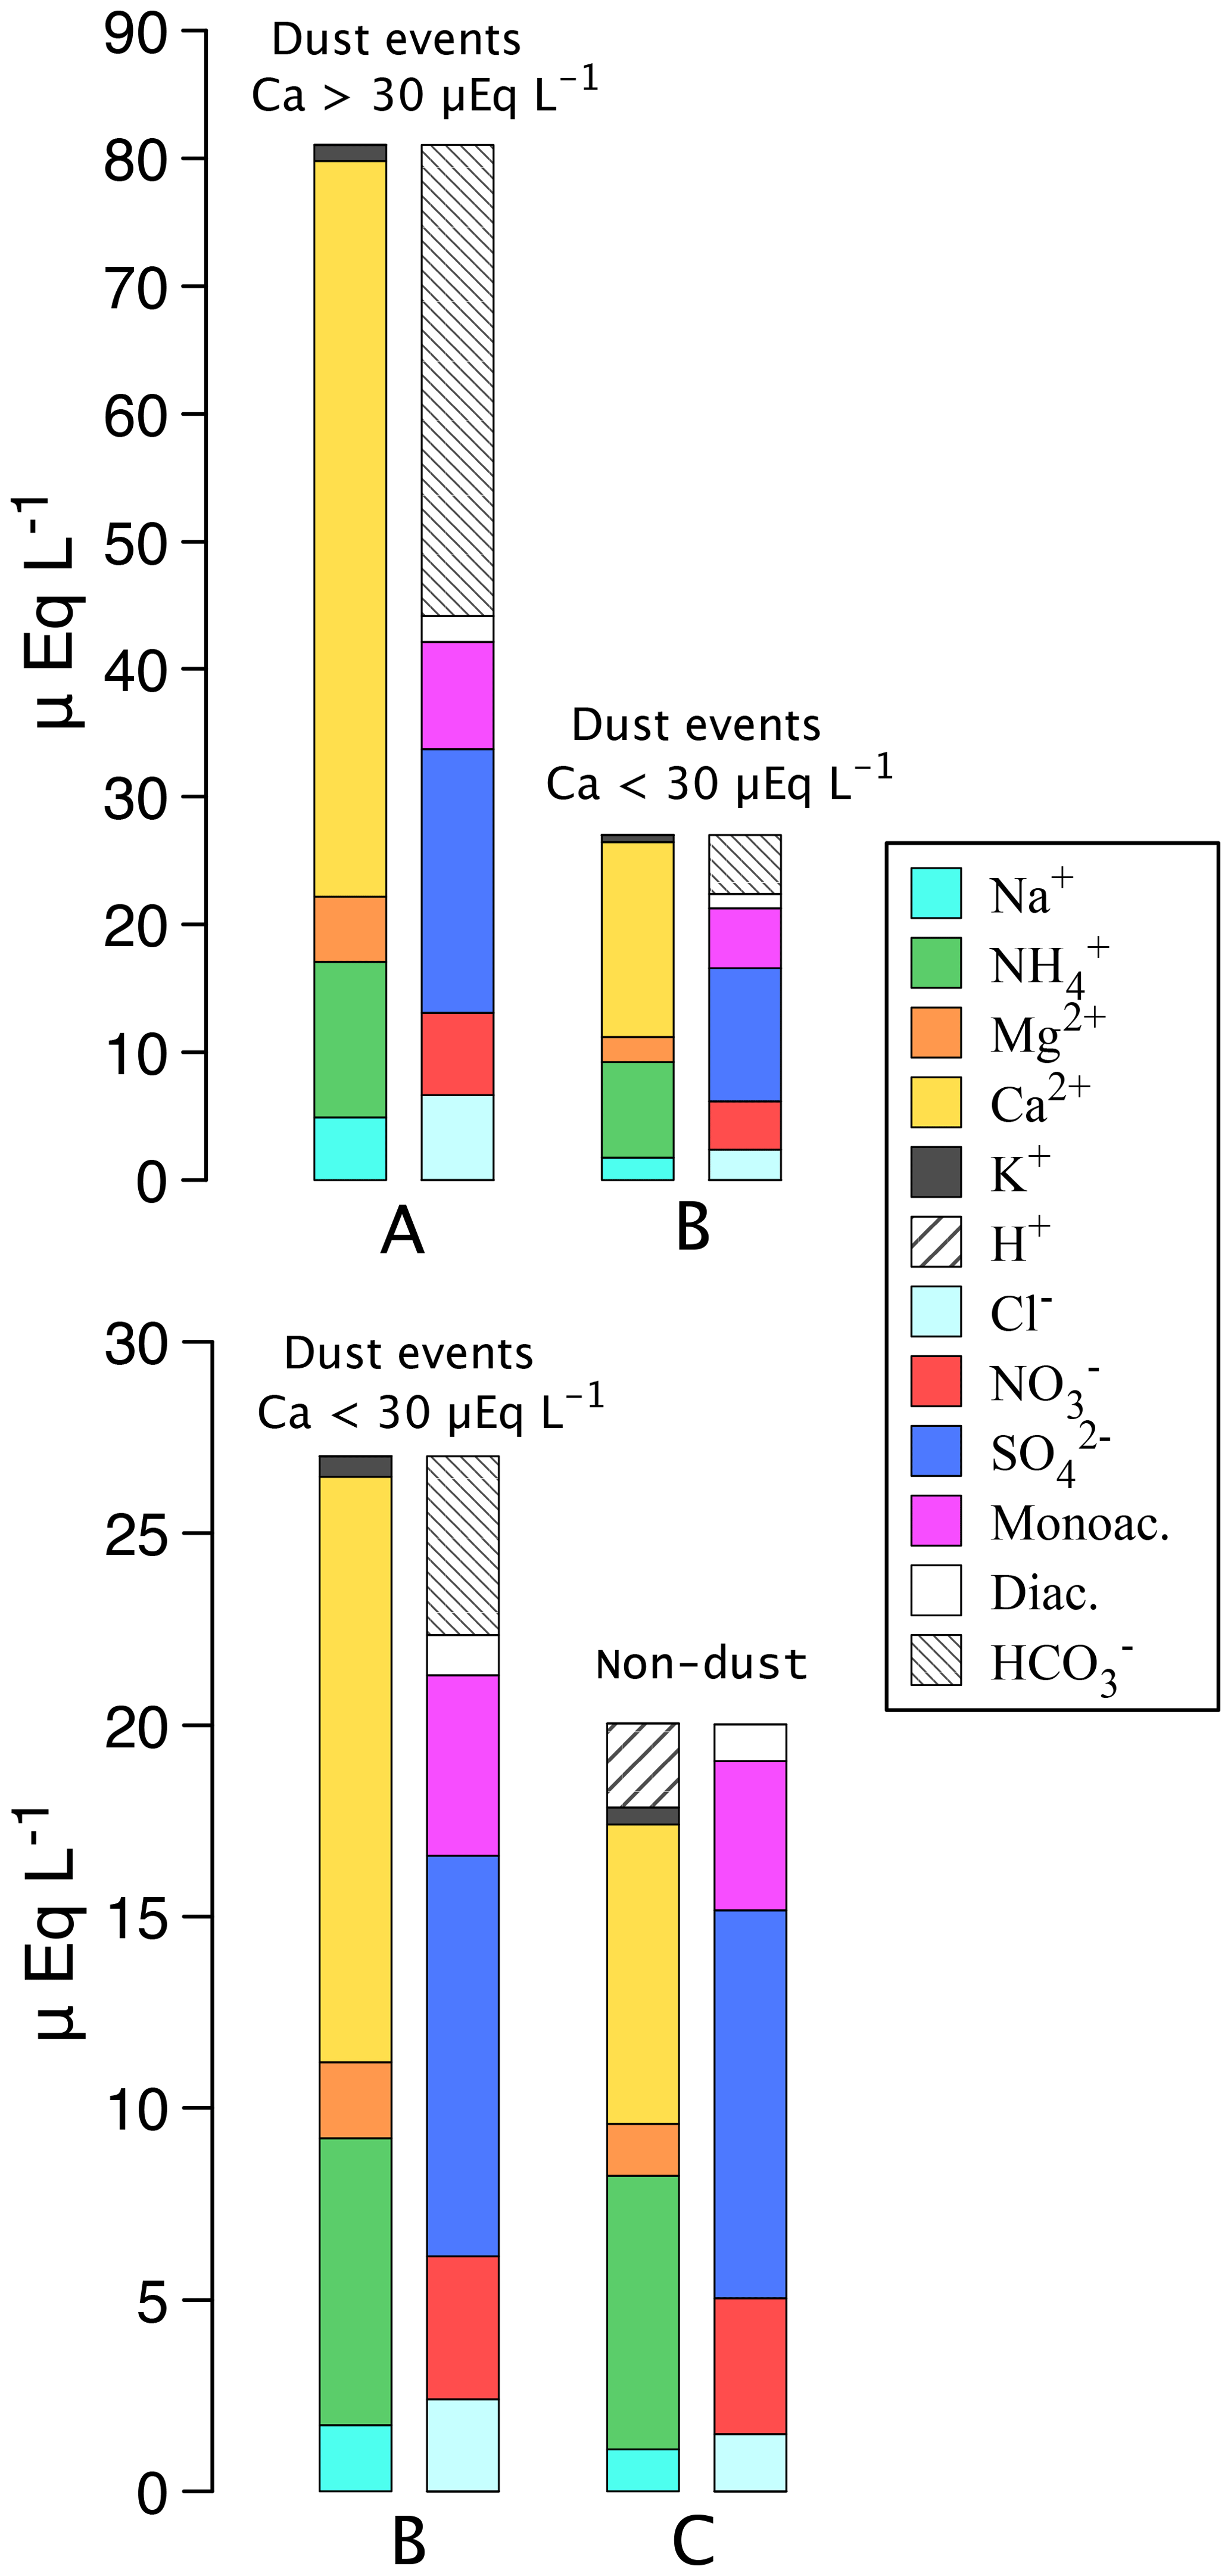
Figure 6Mean ionic content of ELB layers deposited between 1950 and 1980.
textbf(a) and (b) mean composition of dust event samples containing more and less
than 600 ppb (i.e. 30 µEq L−1) of calcium. (b) and (c) mean
composition of dust event samples containing less than 600 ppb of calcium
compared to samples free of dust. Abbreviations Monoac. and Diac. stand for
C1–C3 monocarboxylates and C2–C5 dicarboxylates,
respectively (see Eqs. 2 and 3 in Sect. 3).
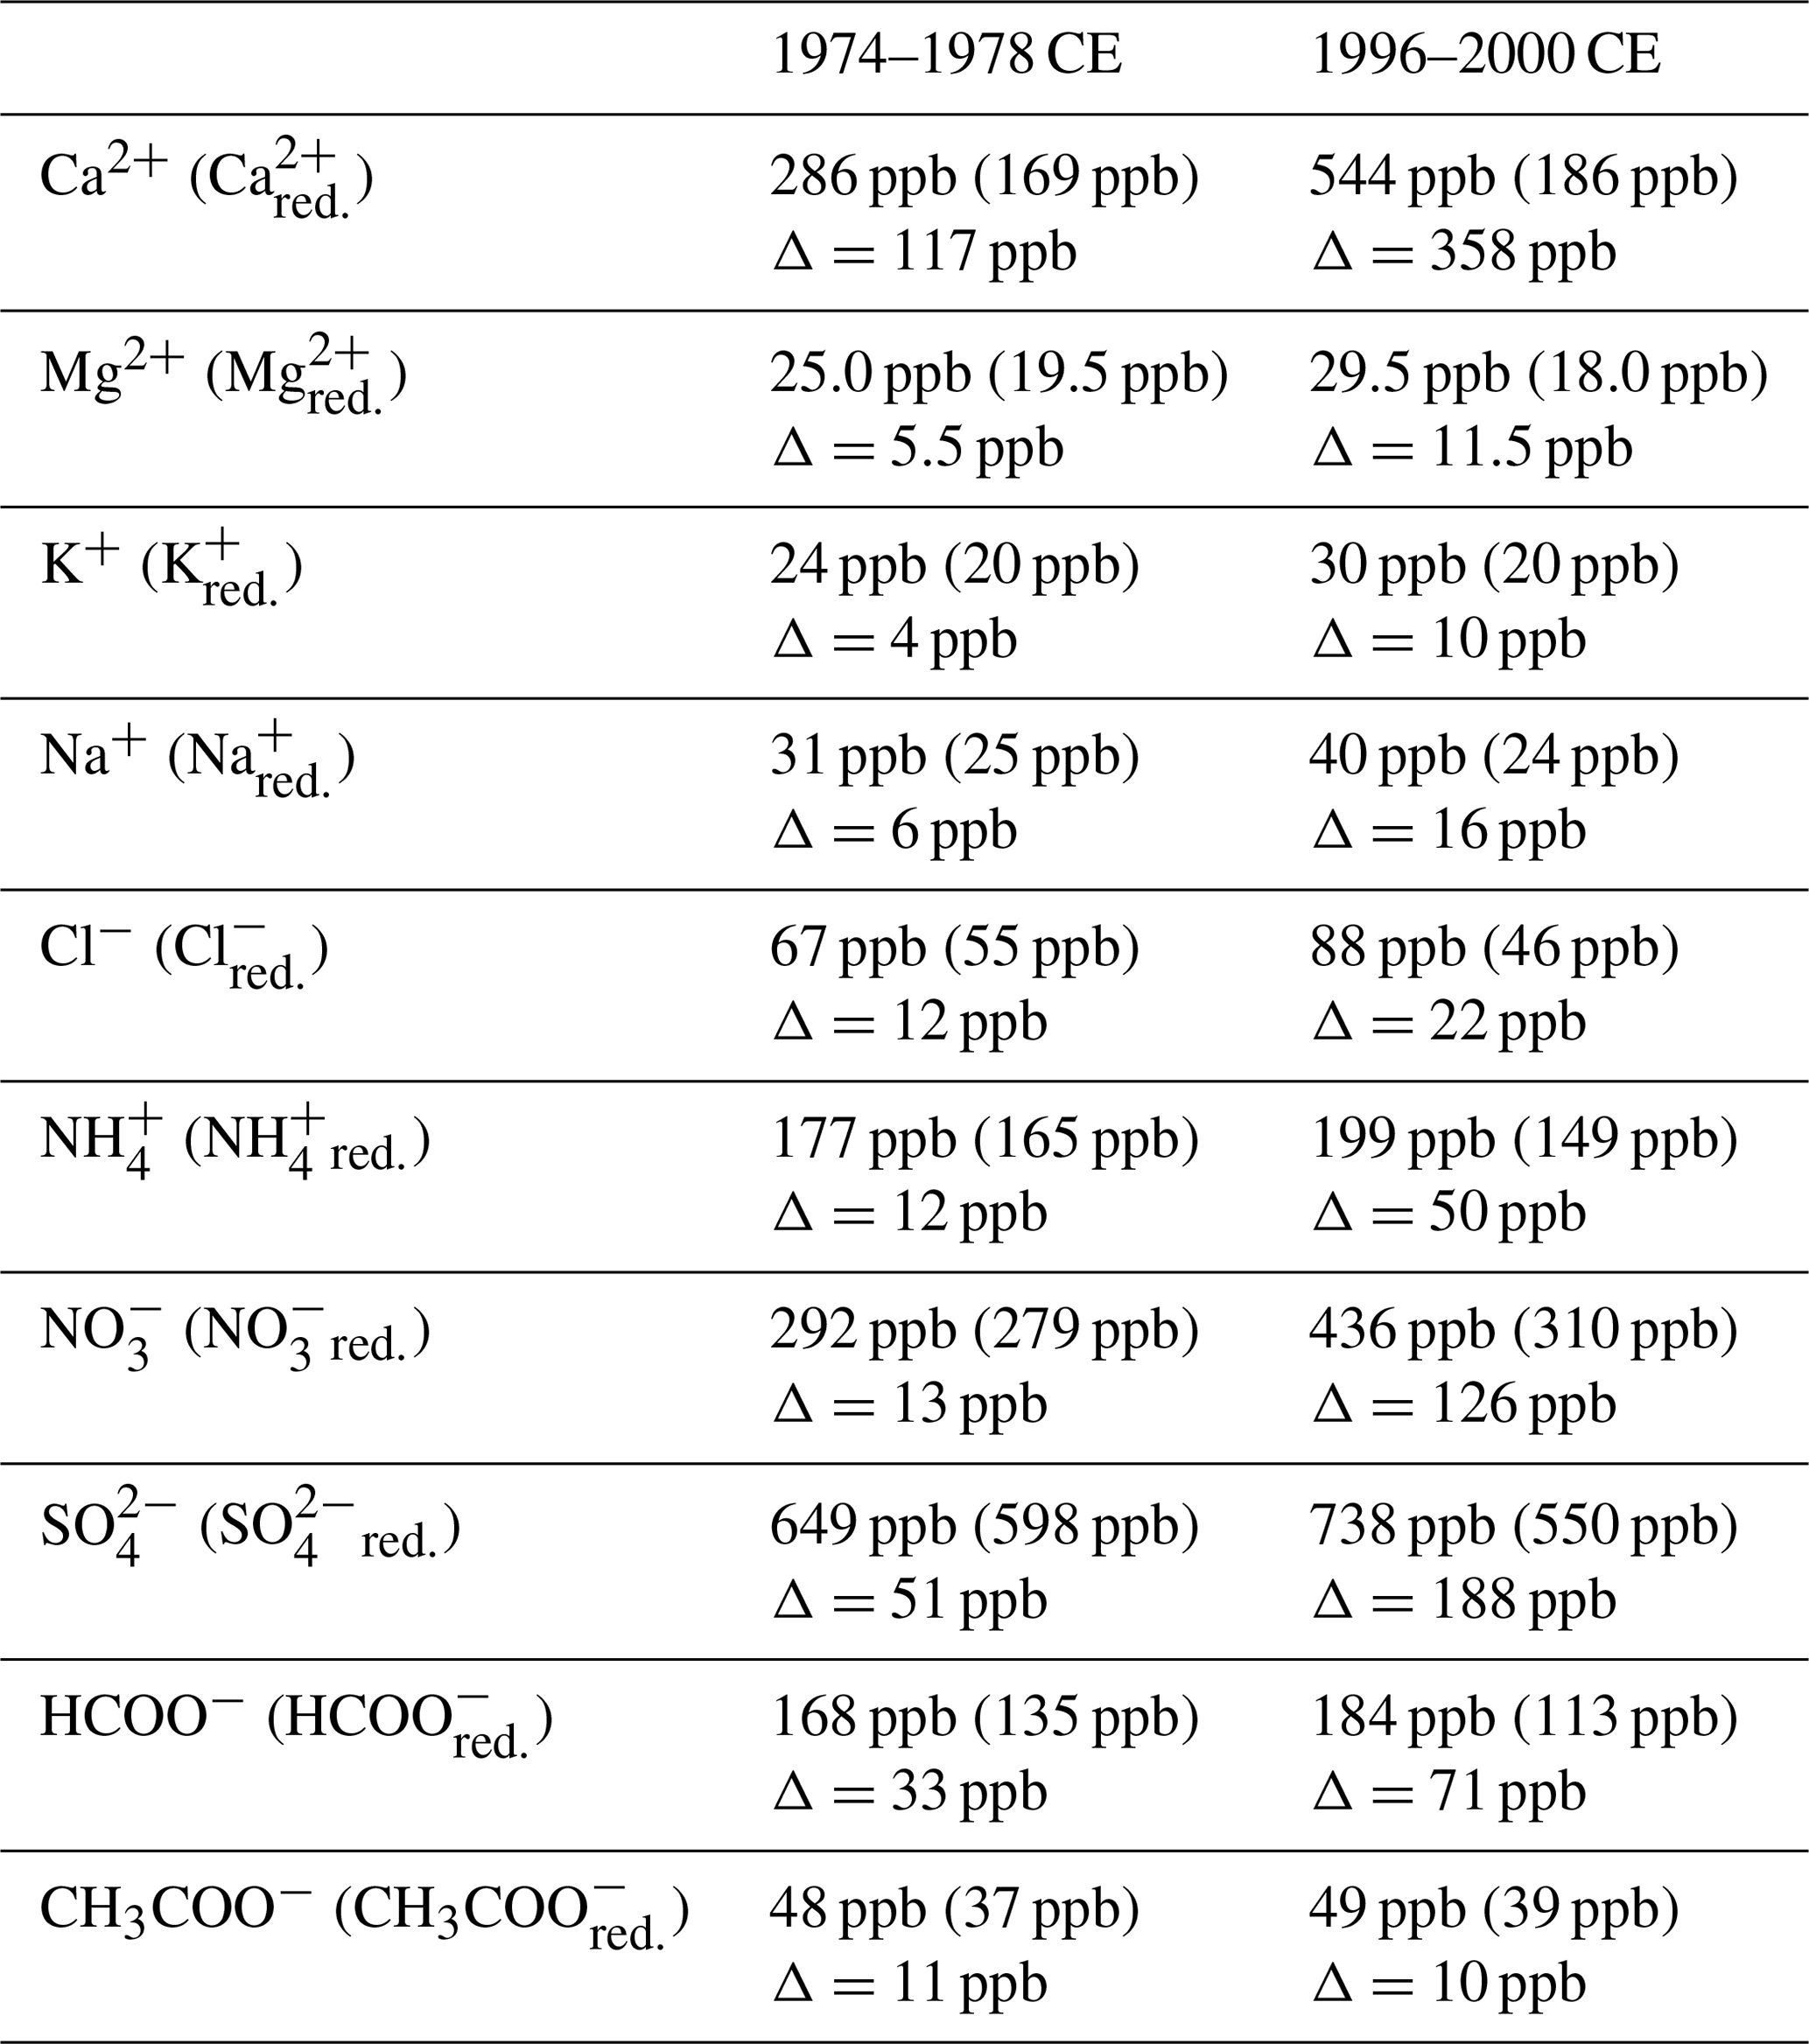
To evaluate the effect of dust events on the deposition of chemical species, we compare in Table 2 averaged chemical concentrations of all samples with those not impacted by dust (denoted Xred.). Averages were obtained on the base of half-year summers over the half-decades 1996–2000 and 1974–1978 characterized by high and low dust content, respectively (Kutuzov et al., 2019). Though the main impact of dust is as expected, on cations (except ammonium) and chloride, i.e. the constituents of dust particles, the impact is also significant for acidic species like nitrate and sulfate. For instance, the increase in nitrate from 1974–1978 to 1996–2000 CE (144 ppb) in the whole data set is largely (three quarters) related to the increase in dust as indicated by the smaller increase after removal of dust samples (increase of 31 ppb for the red. value). Same is true for sulfate, for which the apparent increase between the two periods (90 ppb) is not due to an increase in pollution but of dust, as indicated by the drop of values when the dust-free data set is considered (decrease of 48 ppb for the red. value). The effect of changing dust inputs over time therefore has to be considered when discussing long-term trends in order to relate them to growing anthropogenic emissions (see Sect. 5 for sulfate in relation to SO2 emissions). Finally, the large effect of dust seen for formate (HCOO−) and not for acetate (CH3COO−) is in agreement with previous observations made by Legrand et al. (2003) in Alpine ice and by Legrand and De Angelis (1995) in Greenland ice. These studies showed that the presence of formate and acetate in ice follows the uptake of formic and acetic acid from the atmospheric gas phase and that the incorporation of these weak acids into hydrometeors is pH dependent with a stronger dependence for formic acid, which is a stronger acid than acetic acid. In conclusion, large dust events significantly influence the chemistry of ELB ice for many species, requiring a case-by-case examination depending on the nature of the dust contribution: primary emissions for sodium and other cations (except ammonium), neutralization of the alkaline material during atmospheric transport for nitrate, and both primary gypsum emissions and neutralization of the alkaline material by acidic sulfur during atmospheric transport for sulfate, for instance.
Table 2Mean chemical composition of snow layers deposited in periods characterized by low and high dust inputs (1974–1978 and 1996–2000, respectively). Values in parentheses are mean values calculated after removal of samples containing dust (denoted red.). Δ refers to the difference between total and dust-reduced (red.) values (i.e., for the X species).
A few outliers of unknown origin were observed in the sulfate raw data set including 22 ppm at 166.65 m depth (summer 1780 CE), 2248 ppb at 146.38 m depth (summer 1862 CE), 1080 ppb at 146.11 m depth (summer 1863 CE), and 864 ppb at 154.73 m depth (winter 1833/1834 CE) (Fig. 7). These individual values were removed when calculating the corresponding half-year summer and winter means reported in Fig. 8. In addition, single winter samples with sulfate levels of 815 ppb at 160.62 m depth (winter 1810/1811 CE) and three data points from 150 to 230 ppb corresponding to the winters 1786–1787, 1827–1828, and 1844–1845 were not considered, and corresponding half-year winter values were not reported.
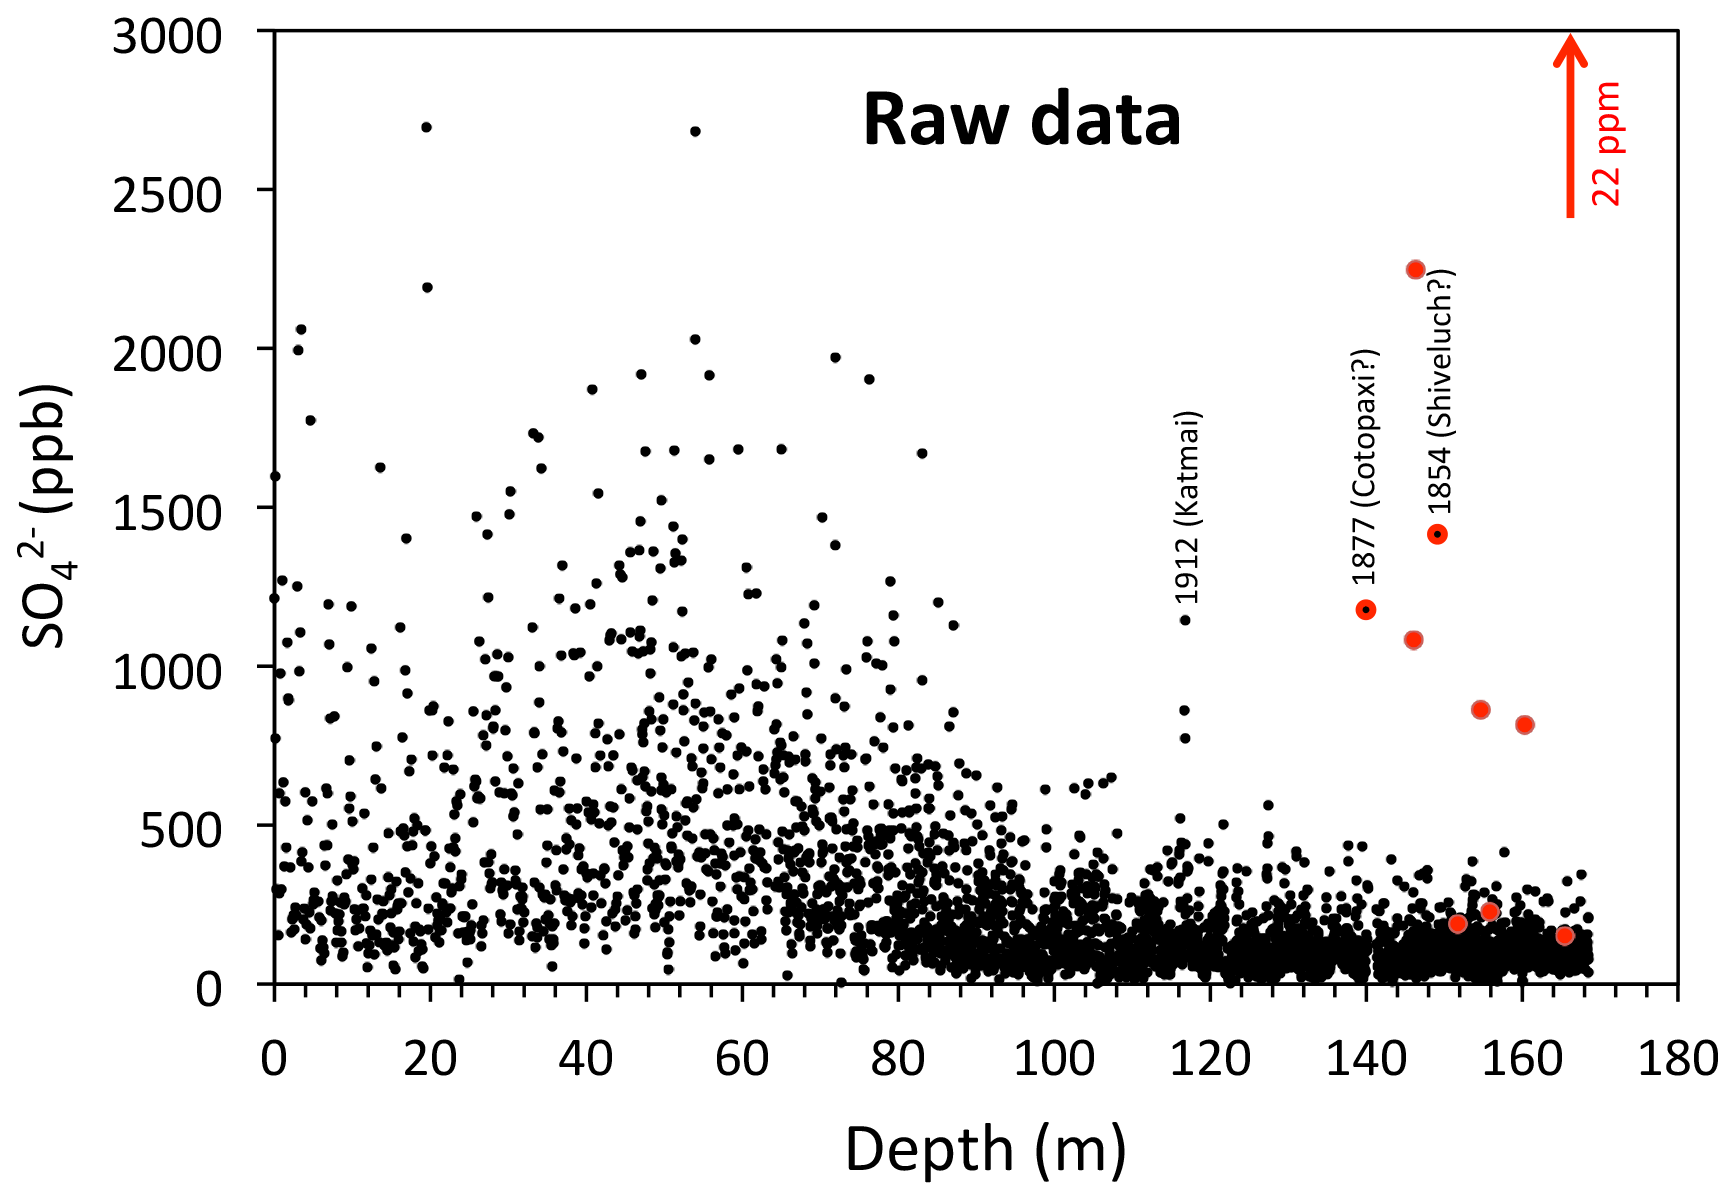
Figure 7Raw sulfate data. The red dots denote the outliers, which were removed prior to calculation of the half-year summer and winter means. We also indicate samples possibly impacted by the volcanic eruptions of Cotopaxi and Shiveluch (see text).
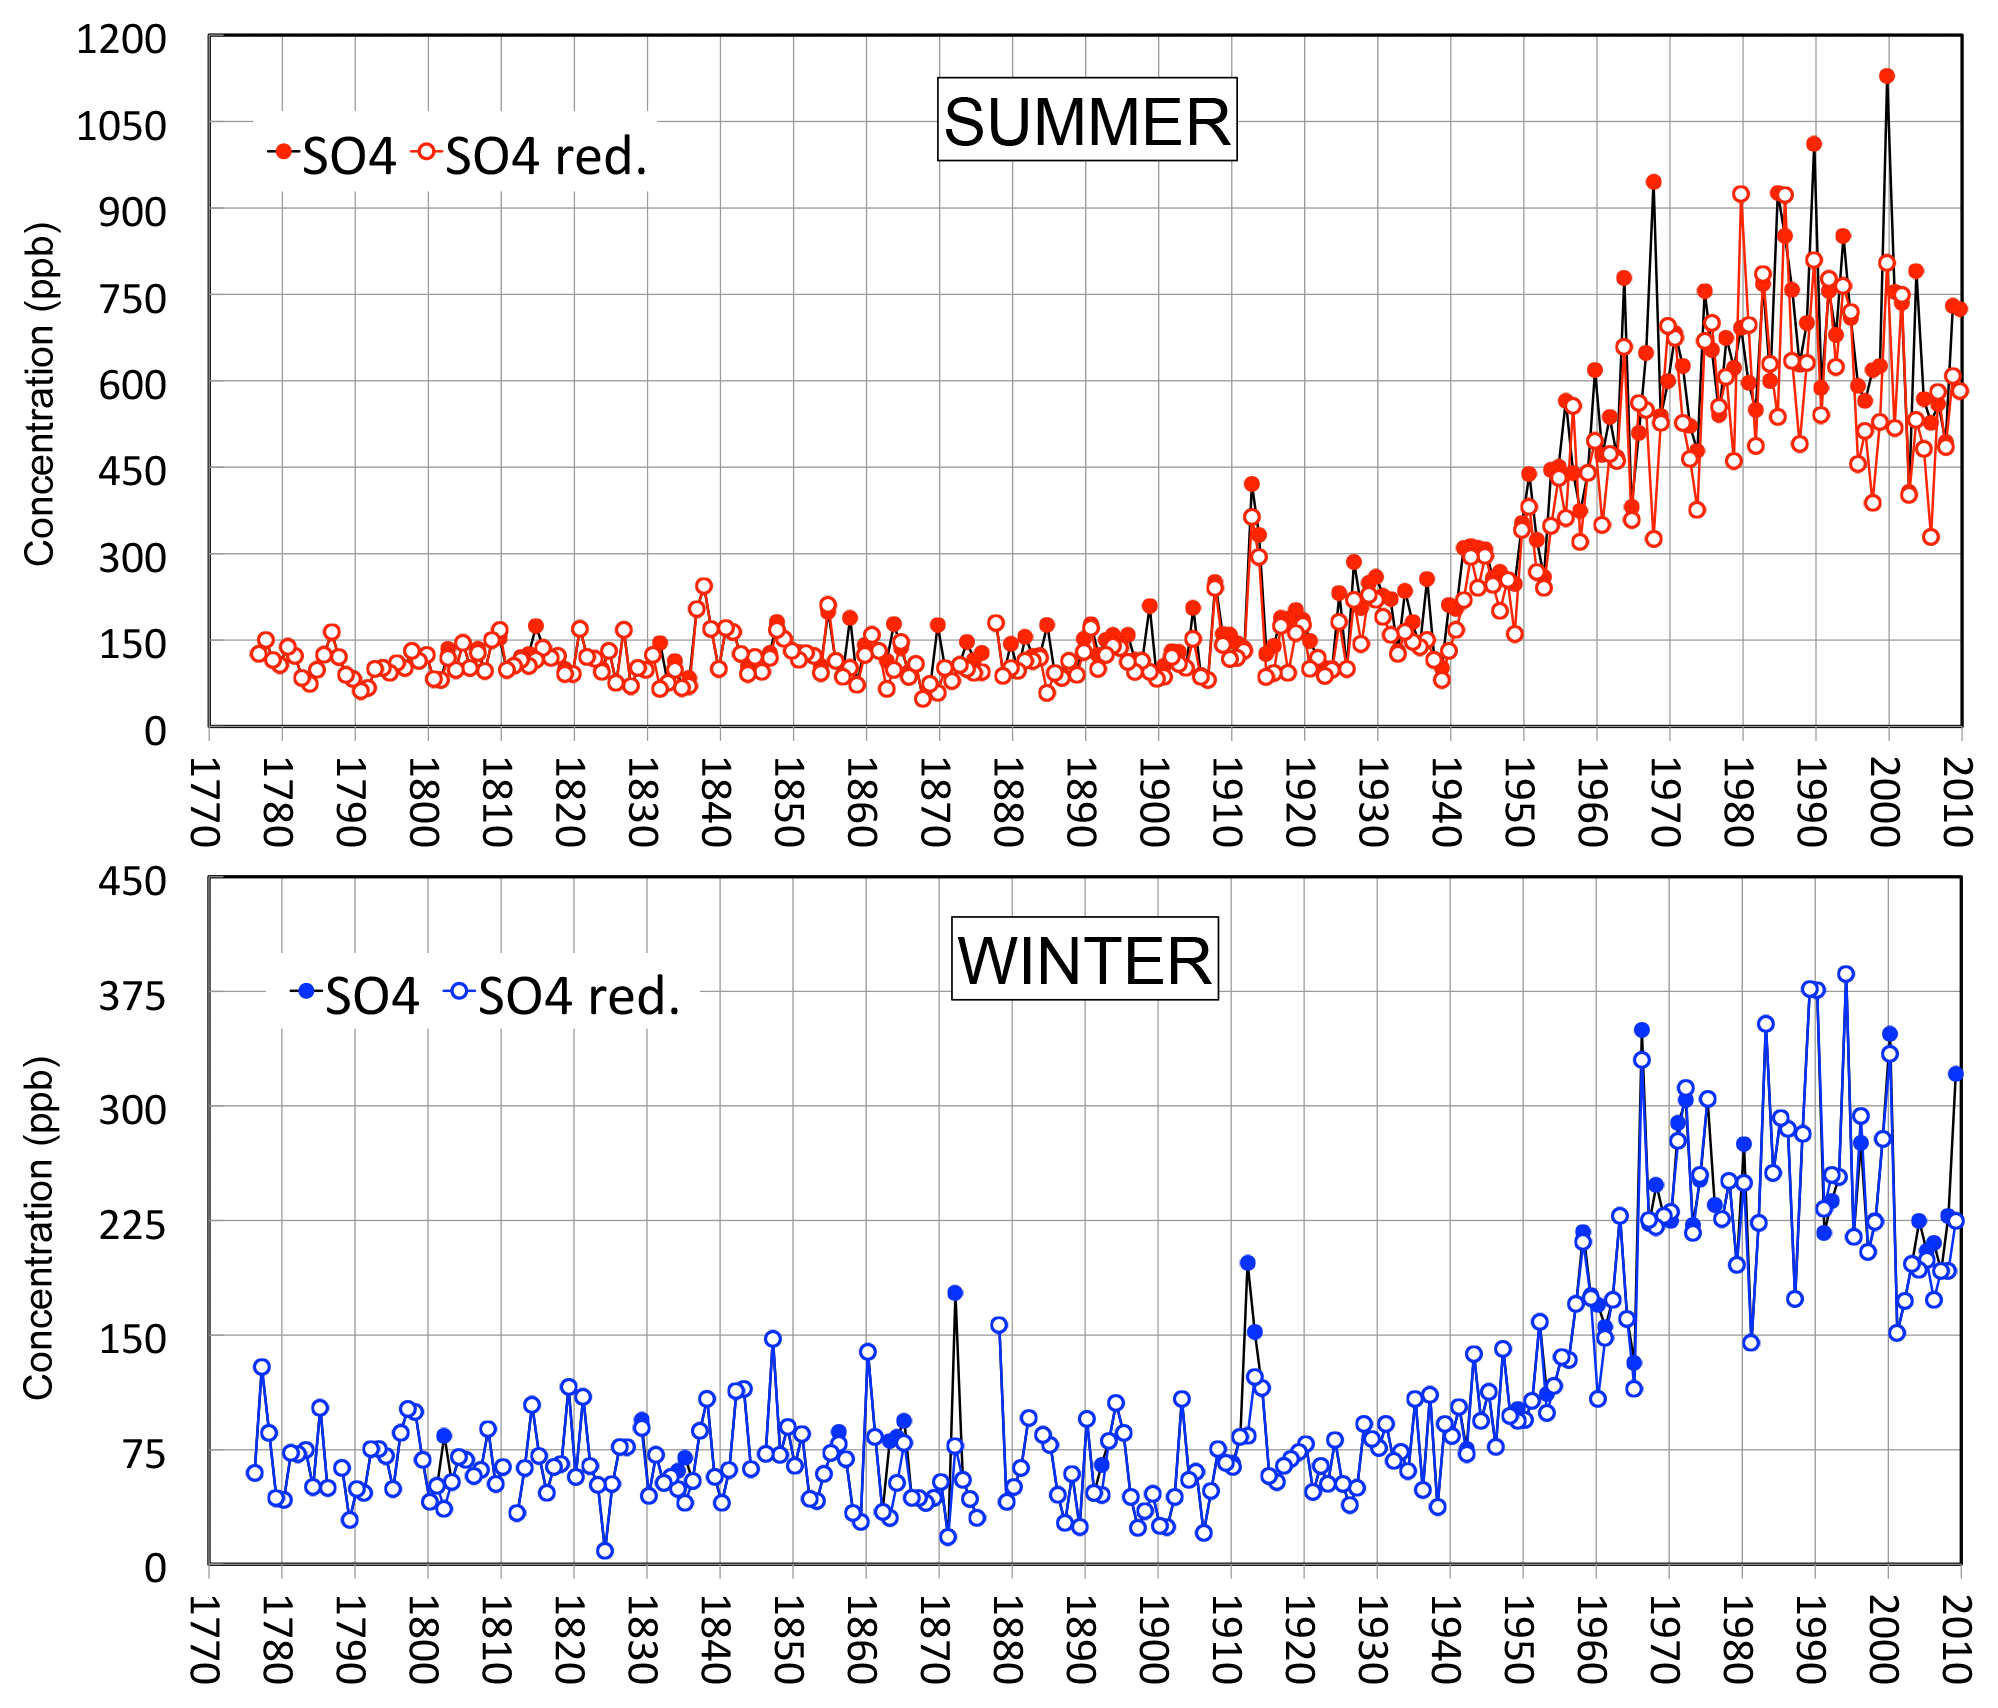
Figure 8Individual summer (red) and winter (blue) half-year means of sulfate along the ELB ice core. Solid circles refer to values calculated considering all samples. Open circle data (SO4red.) were calculated after having removed samples considered to be impacted by large dust events (see Sect. 3).
A few ELB snow and ice layers are impacted by known volcanic eruptions. As discussed by Mikhalenko et al. (2015), ice layers dated to 1911 and 1913 were probably impacted by the 1912 CE Katmai eruption, and summer layers of 1836 and 1837 were probably impacted by the 1835 CE Cosigüina eruption. In addition, we suspect the 1854 CE Shiveluch eruption to have impacted the summer 1854 ice layer and finally, although less evident since this part of the core is made up of split ice (see Sect. 2), the Cotopaxi 1877 CE eruption may have influenced the winter 1877/1878 layer. To discuss the long-term trends of sulfate in relation to the growing SO2 emissions, these half-year summer and winters means, suspected to contain volcanic debris, were discarded in Fig. 9. To minimize the effect of year-to-year variability due to meteorological transport conditions we added the first component of single spectra analysis (SSA) with a 5-year time window in Fig. 9.
As discussed in Sect. 3, large dust events significantly enhanced the sulfate level of the ELB ice. Since, as detailed in Kutuzov et al. (2019), their occurrence has changed in the past with more frequent events after 1950, we have examined to what extent they contribute to the sulfate trend. It is difficult to accurately directly correct sulfate concentration from the large dust event contribution since the amount of sulfur trapped by the alkaline material during atmospheric transport towards the site would be very different from event to event. For instance, Koçak et al. (2012) reported non-sea-salt-sulfate to non-sea-salt-calcium mass ratios in aerosol collected in the eastern Mediterranean ranging between 0.25 (in the case of direct arrival at the site of air mass from the Sahara) and 1.15 (when mineral dust passed through polluted sites located in the Balkans and Turkey before arriving at the site). Instead of corrected sulfate values for the large dust events, we therefore have reported in Fig. 8 individual values of total sulfate and sulfate calculated after having removed from the average samples suspected to contain a large amount of dust (red. values). The influence of large dust events on the long-term SSA winter trend is rather insignificant and if existing remains limited (i.e. effect of < 10 ppb) around 1870 and to the 2000–2010 decade (Fig. 9). Remaining negligible prior to 1850, the large dust event effect on the summer trend gradually increases after 1950, reaching often 100 ppb after 1960. This change in large dust events results from the change in the occurrence of drought in North Africa and the Middle East regions (Kutuzov et al., 2019).

Figure 9ELB half-year summer and winter sulfate trends from 1774 to 2010 (the first SSA component with a 5-year time window; see text). The black lines refer to raw sulfate values, the dashed lines to sulfate means calculated after removal of dust samples (SO4red.), and the solid red and blue lines to sulfate values after having corrected SO4red. values from the background dust contribution (see Sect. 3). Samples suspected to be impacted by volcanoes were removed.
In addition to the enhanced frequency of large dust events after 1950, the calcium background concentrations (i.e., Ca2+red.) also changed over time with an increase from 68±21 ppb prior to 1900 CE to 194±61 ppb after 1960 CE. As discussed by Kutuzov et al. (2019), this change may result from changes in precipitation and soil moisture content in the Levant region (Syria and Iraq). In order to discuss the dust-free sulfate changes with respect to anthropogenic emissions, we make an attempt to correct the sulfate record from this increase in the background level of dust. To do so, we examined in Fig. 10 the relationship between calcium and sulfate concentration in individual summer samples corresponding to pre-industrial time (1774–1900 CE). Despite being poor (R2=0.32), the correlation suggests a mean slope of the linear SO4red-Cared relationship close to 1. The use of this value to correct sulfate from background dust emissions would lead to an overestimation of the sulfate dust contribution. Indeed, as seen in Fig. 10, there are numerous samples that contain more sulfate than what is expected with respect to the presence of pure calcium sulfate (gypsum; see the blue line reported in Fig. 10), likely to due the presence of sulfate as ammonium sulfate or sulfuric acid. To correct sulfate from the background dust contribution we here have used a sulfate-to-calcium ratio close to 0.63 (see the red line drawn as the lower envelope of the relationship in Fig. 10) and subtracted this contribution from the red. values by using the Ca2+red. values. As seen in Fig. 9, the derived mean summer and winter pre-industrial dust-free sulfate levels in ELB ice (taken as the mean value observed from 1774 to 1850) are 70 and 40 ppb, respectively. In summer as in winter, the dust-free sulfate values remained close to the pre-industrial values until 1910–1920 (81 ppb instead of 70 ppb in summer, 47 ppb in winter). After 1920, dust-free sulfate levels increased at a mean rate of 5 ppb yr−1 in summer and 1 ppb yr−1 in winter. The sulfate increase then accelerated between 1950 and 1975 (10 ppb yr−1 in summer, 5 ppb yr−1 in winter), until a maximum of 530 ppb in summer (255 ppb in winter) was reached at the end of the 1980s. After 1990, sulfate levels decreased to 390 ppb in summer (154 ppb in winter) during the first decade of the 21st century.
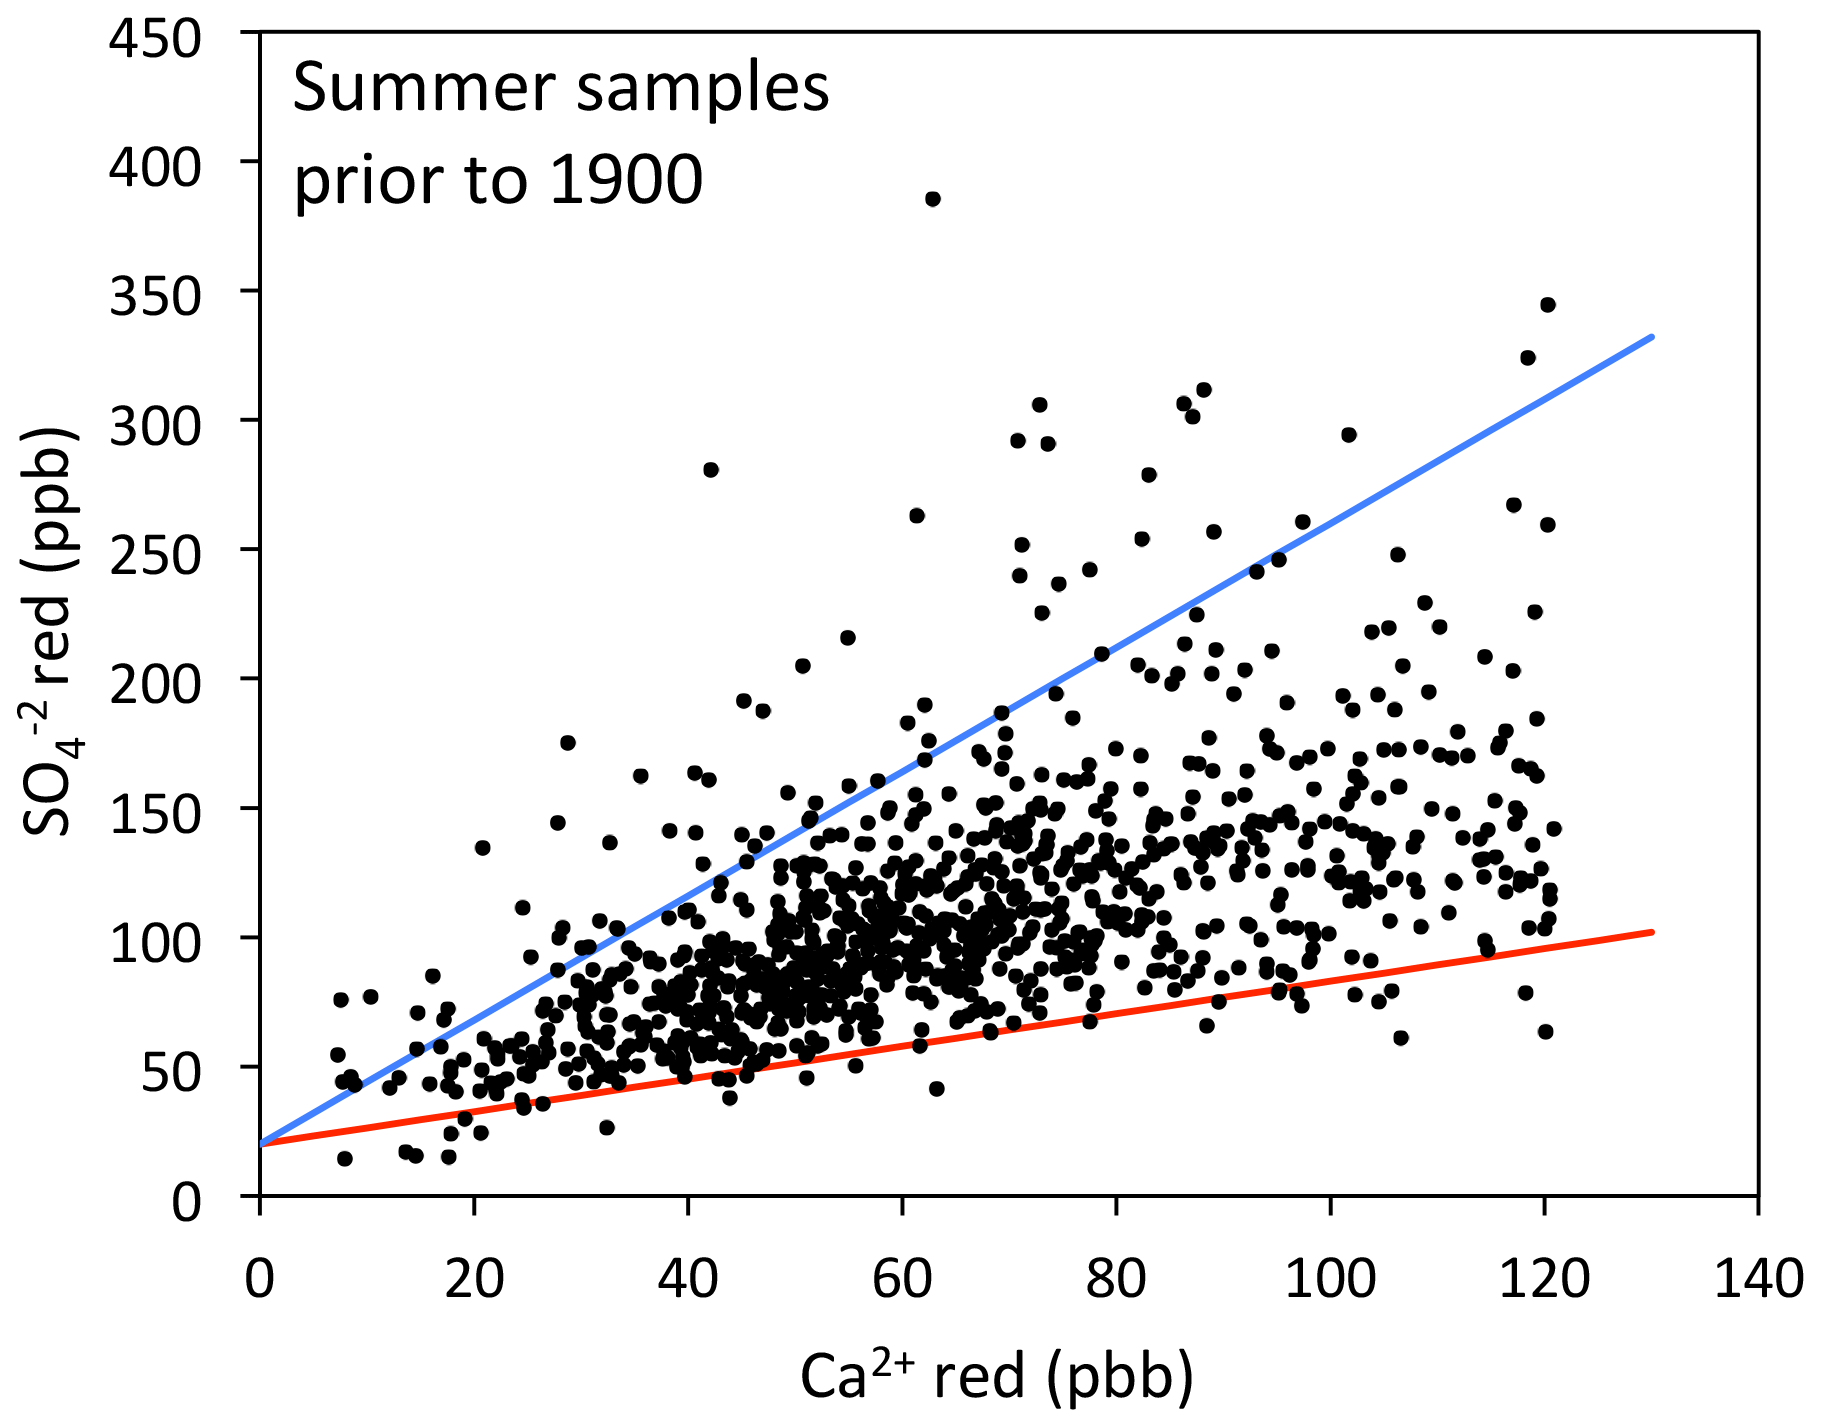
Figure 10Sulfate versus calcium concentrations in summer samples free of large dust events (red. values) in ice deposited prior to 1900. The blue line refers to a pure gypsum composition. The red line illustrates a lower envelope of the sulfate-to-calcium relationship.
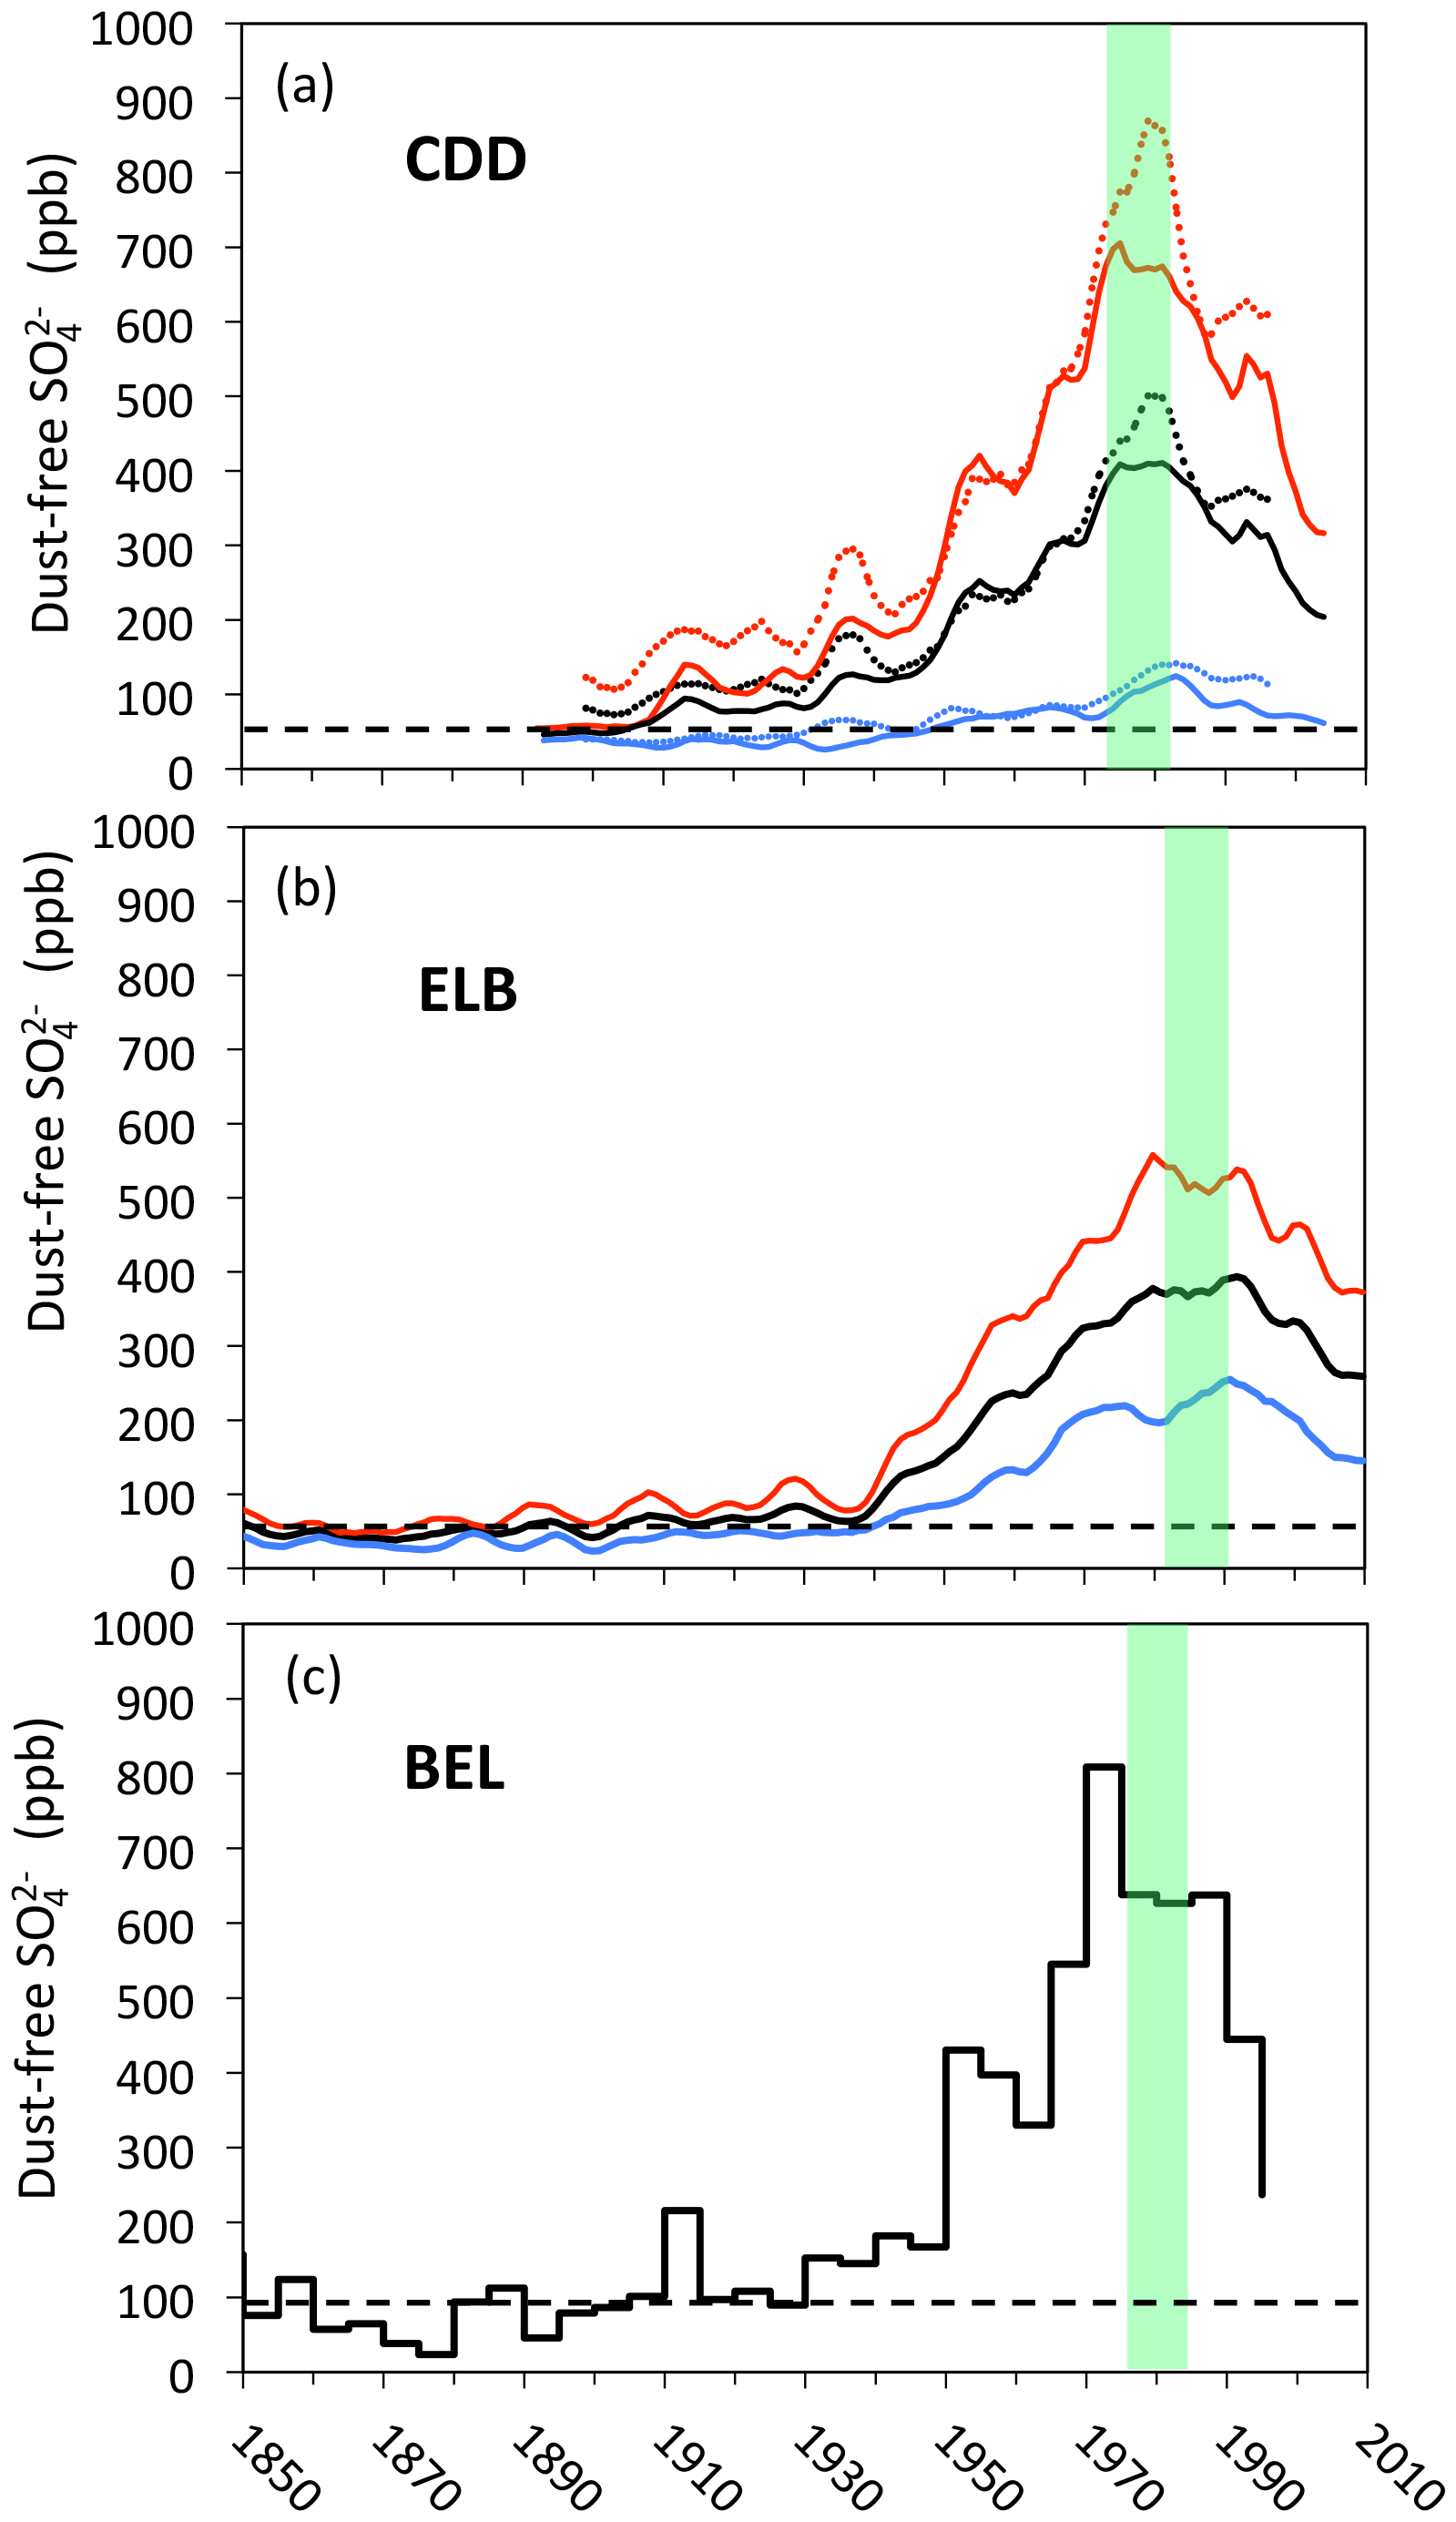
Figure 11Dust-free sulfate (annual values in black, summer in red, and winter in blue) trends at the CDD (a), ELB (b), and BEL (c) sites. For CDD we report the records derived from the C10 (dashed lines) and CDK (solid lines) ice cores (see Sect. 5.1). Green areas indicate the decades in which the sulfate levels reached their maxima.
5.1 The Alpine CDD and Siberian Altai (Belukha, BEL) ice core sulfate records
The ELB dust-free sulfate long-term trend is compared with those previously extracted from the Alpine CDD site (ice cores denoted C10 and CDK in Fig. 11). C10 sulfate data were presented in Preunkert et al. (2001) and those from CDK in Legrand et al. (2013). Since winter data from CDD are more limited (only a few pure winter layers are available between 1890 and 1930, Legrand et al., 2018), we here focus on the comparison of summer levels. The two CDD cores were dated by annual layer counting using the pronounced seasonal variations of ammonium. The two chronologies were in excellent agreement over their overlapping period from 1925 to 1990 (Legrand et al., 2013; Preunkert et al., 2000). A re-evaluation of the C10 chronology based on very recently made continuous measurements of heavy metals, as well as a comparison to a well-dated Greenland ice core record (McConnell and Edwards, 2008), resulted in a revised C10 chronology (Legrand et al., 2018). As for C10, continuous measurements of heavy metals are also available in the lowest part of CDK (Preunkert et al., 2019). It was thus possible to identify the distinct Greenland increases in thallium, lead, and cadmium associated with the widespread start of coal burning at the beginning of the Industrial Revolution in 1890 CE also in the CDK core (at 117.8 m, 90.5 m.w.e.). This time marker was then used to constrain a revised annual layer counting in the early 20th century part of the CDK record. The dust-free ELB sulfate long-term trend is also compared with the one previously extracted from the Siberian Altai (Belukha glacier, denoted BEL in Fig. 11) by Eichler et al. (2009, 2012).
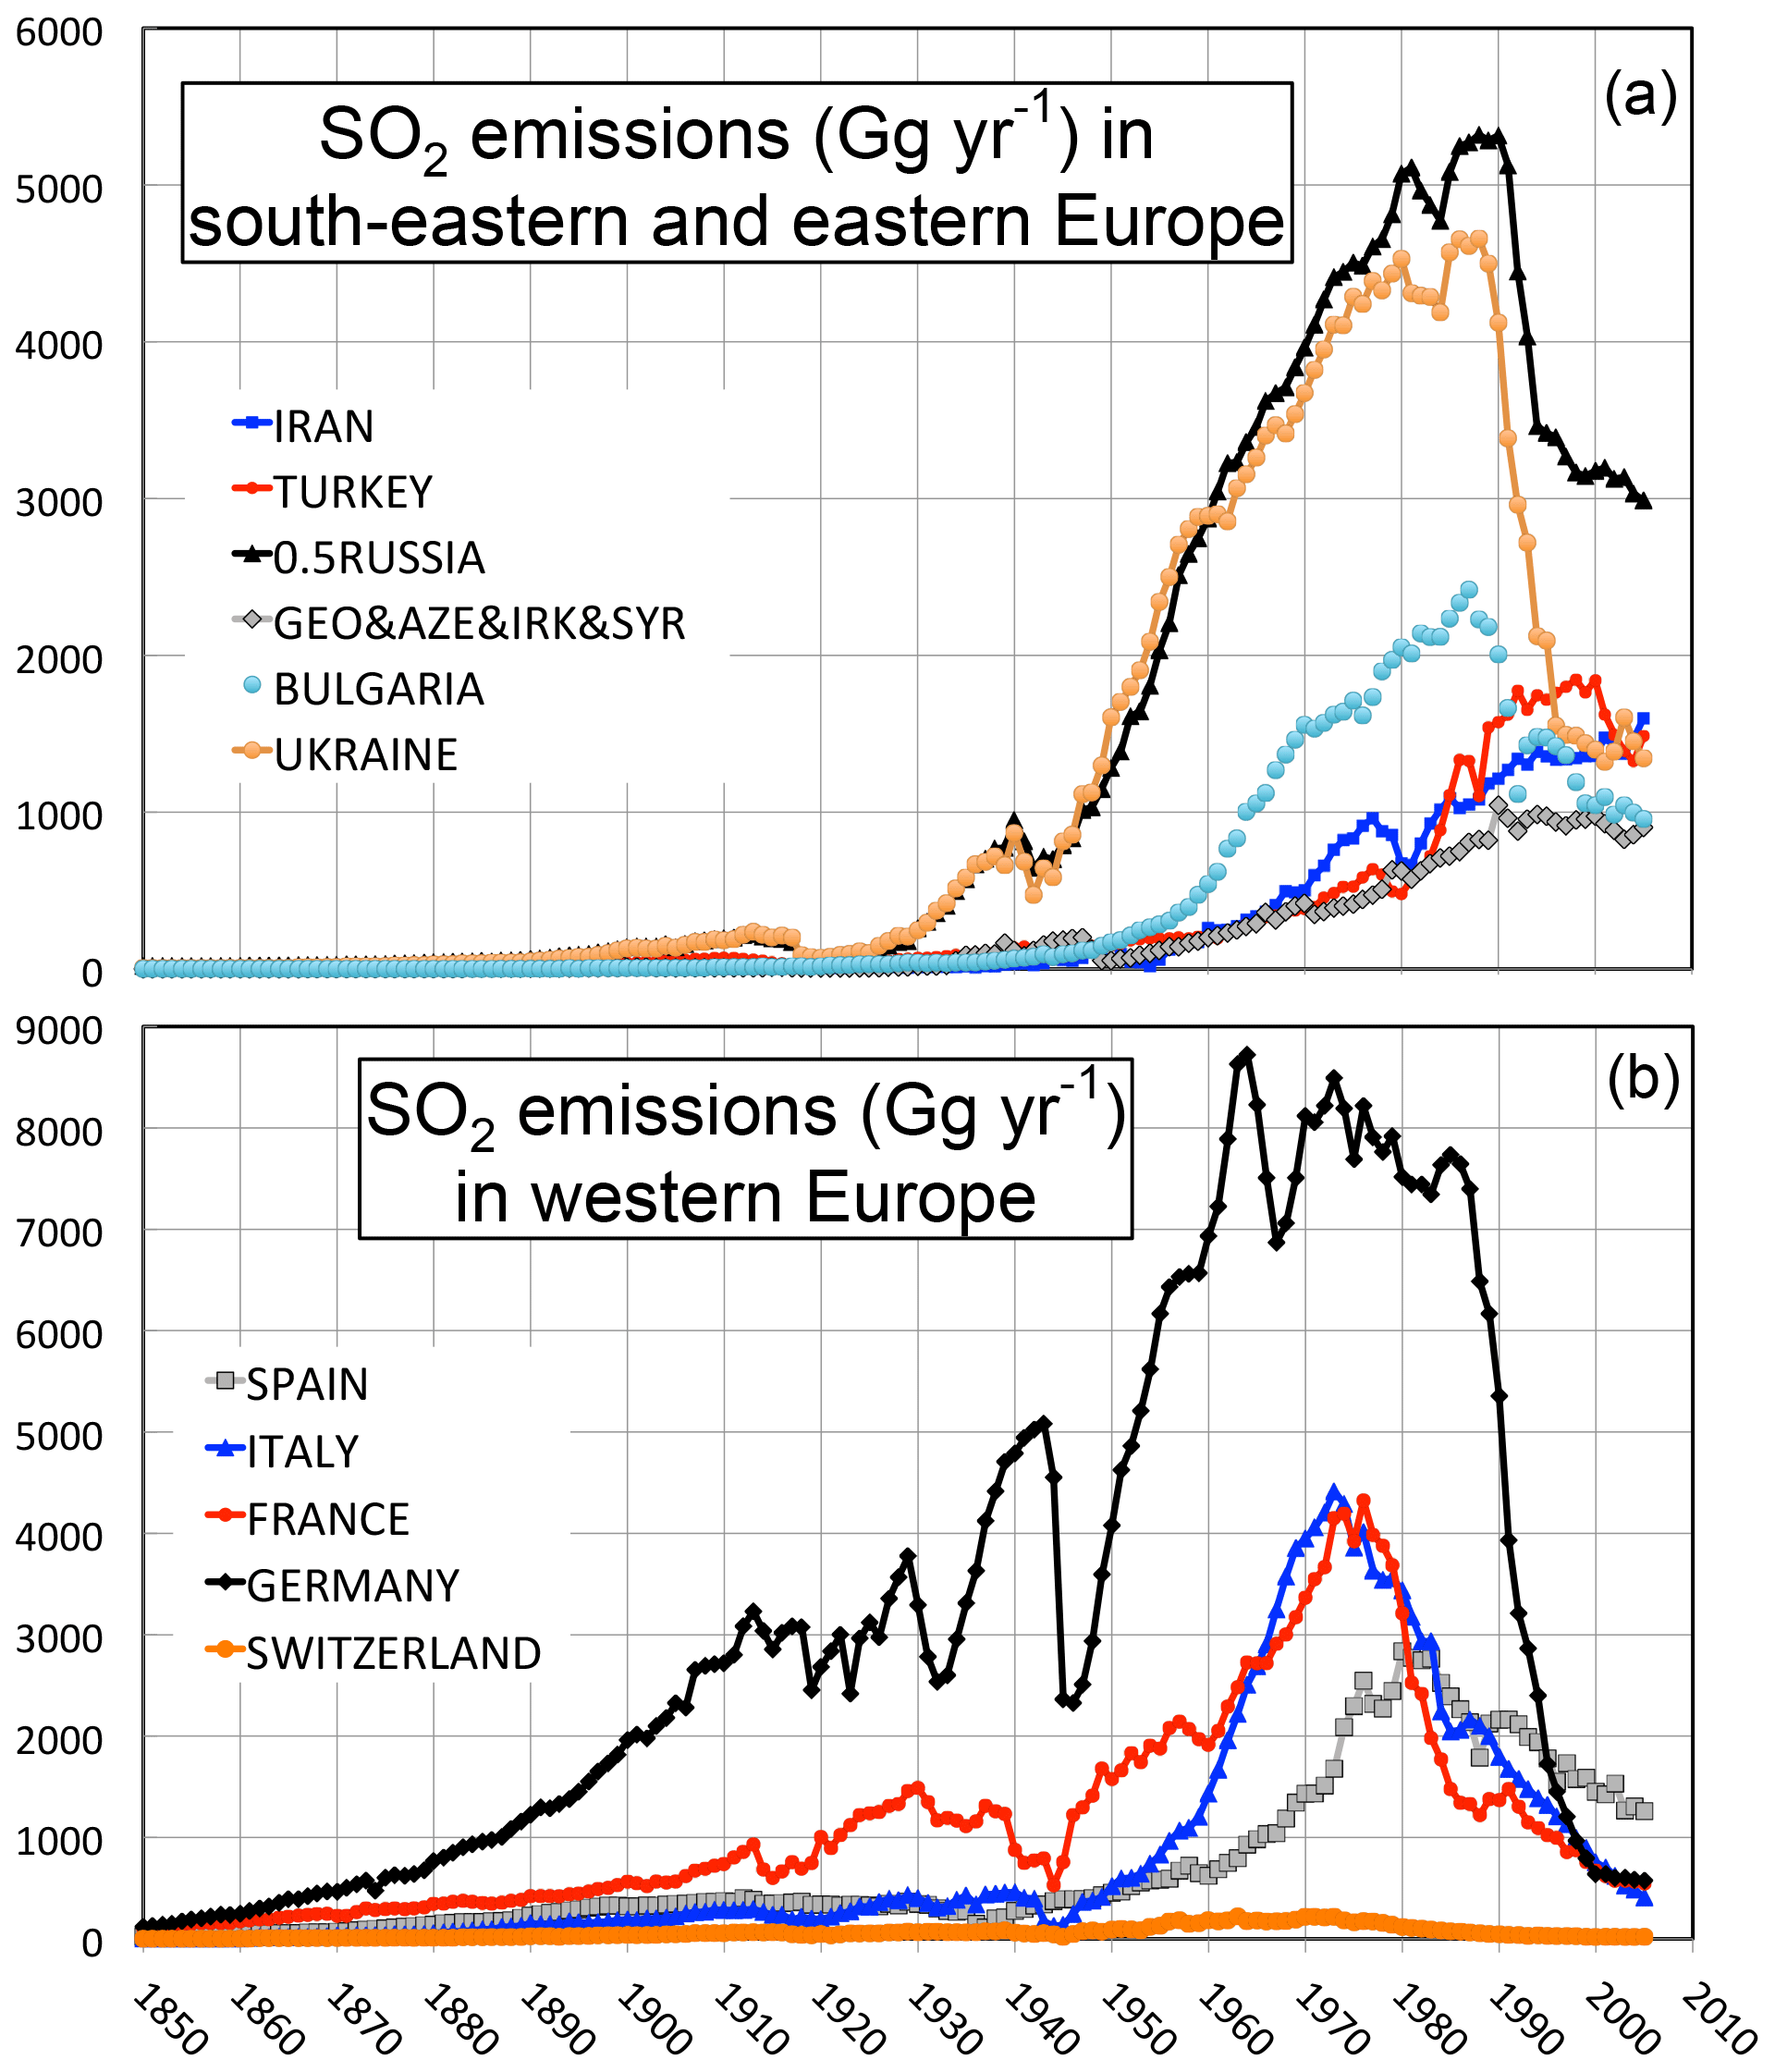
Figure 12SO2 emissions (from 1850 to 2005) from various countries located around the Caucasus (a) and the Alps (b). GEO&AZE&IRK&SYR denotes emissions from Georgia, Azerbaijan, Iraq, and Syria. Data are from Smith et al. (2011).
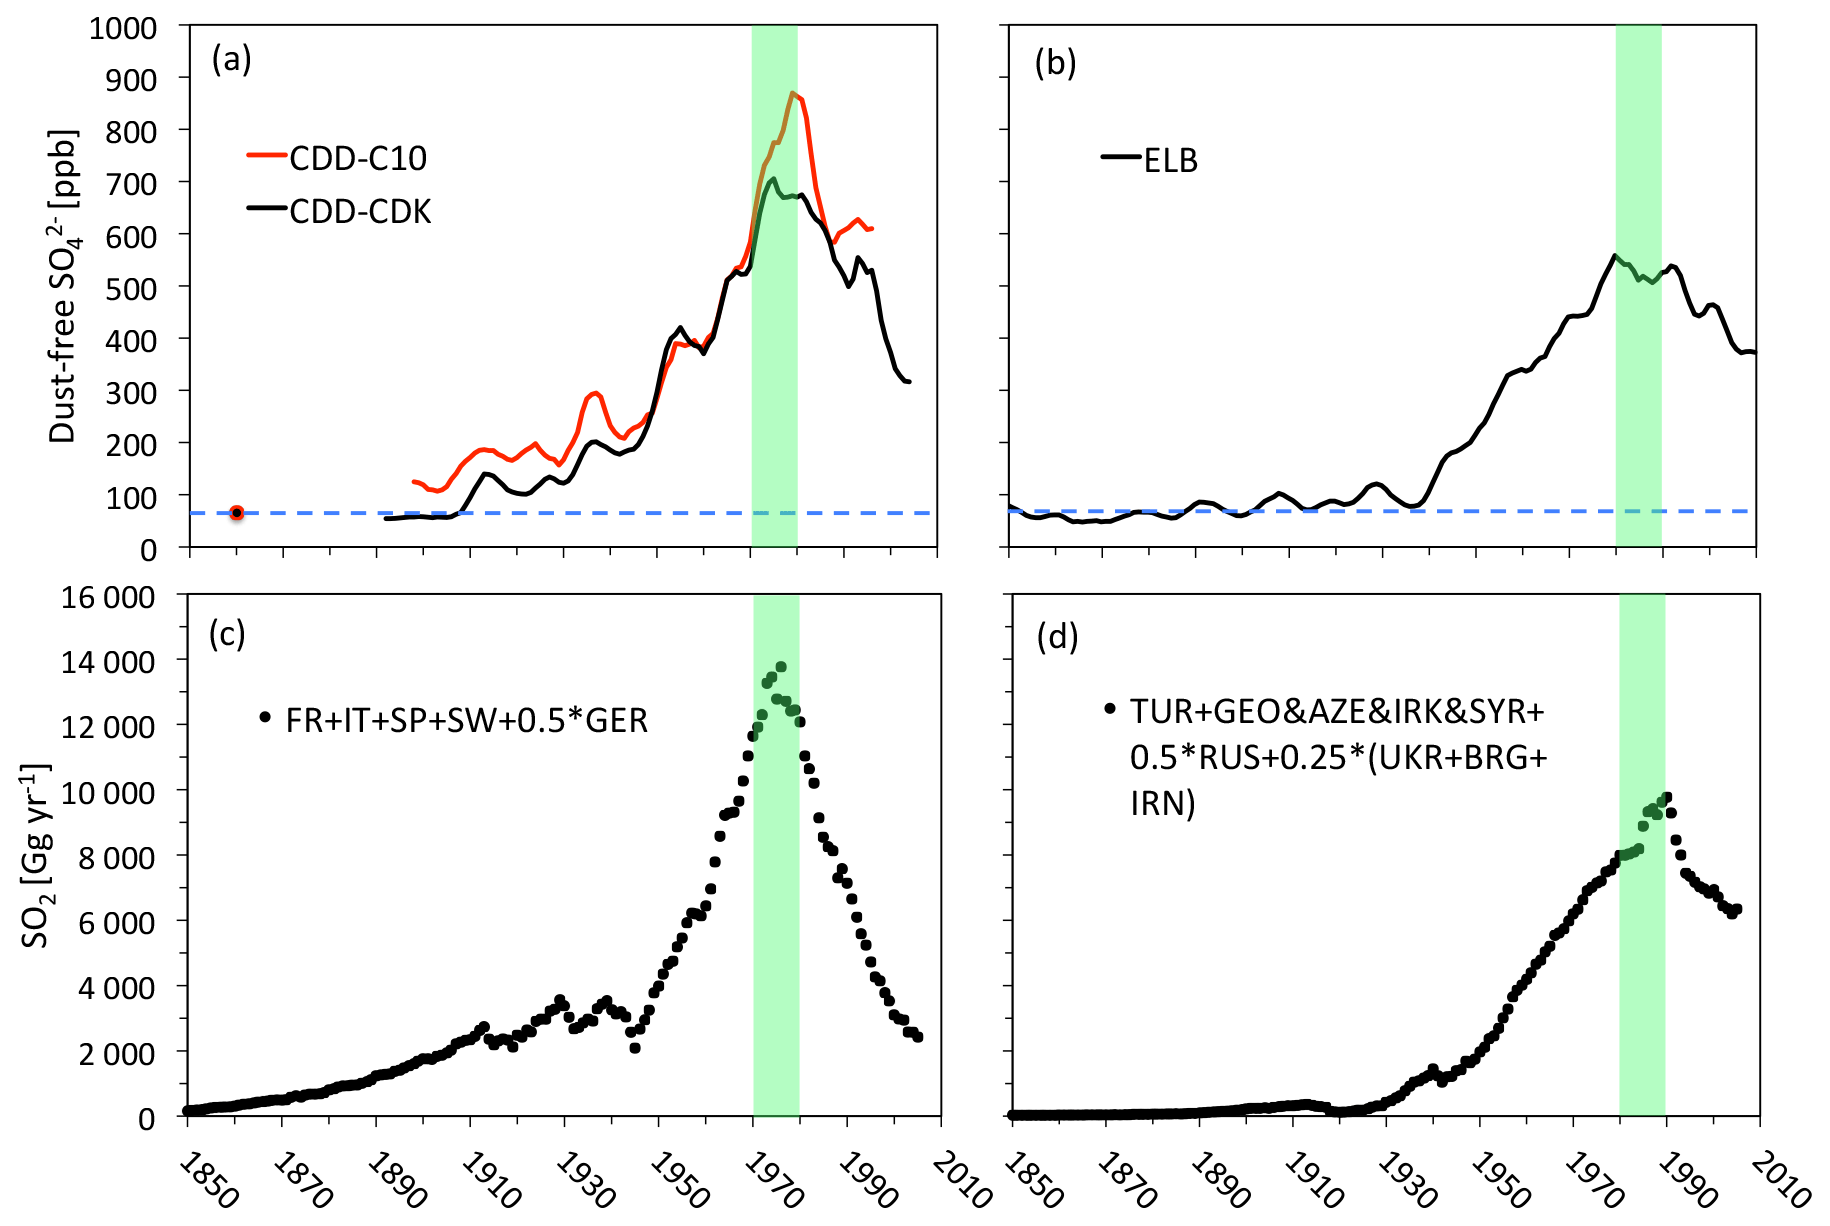
Figure 13Comparison of the dust-free sulfate summer trends (red. values) from two CDD ice cores (C10 and CDK) (a) and the ELB ice core (b) with SO2 emissions from countries suspected to contribute to sulfate depositions at the two sites (c for CDD, d for ELB; see discussions in Sect. 5.2). (a, b) Solid lines refer to the first SSA component with a 5-year time window. Horizontal dashed blue lines refer to the respective pre-industrial sulfate levels. (c) SO2 emissions from France, Italy, Spain, Switzerland, and half from Germany. (d) SO2 emissions from Turkey, Georgia, and Azerbaijan; half from Russia; and a quarter from Ukraine, Bulgaria, and Iran. Green areas indicate the decades in which the sulfate levels reached their maxima.
5.2 ELB versus CDD and BEL sulfate trends
Since they are available at all three sites, we compared in Fig. 11 the annual long-term trends of dust-free sulfate from ELB, CDD, and BEL. The ELB and CDD annual values were calculated as the arithmetic mean from 5-year-SSA winter and summer records, whereas the BEL annual data refer to 5-year-averaged raw data. Examination of the three annual records reveals three major differences between the three sites: (1) an impact of anthropogenic emissions already significant in 1910–1930 at CDD but neither at ELB nor at BEL, (2) a maximum of the anthropogenic perturbation which is reached in 1970–1980 at CDD and later at the two other sites (10 years after at ELB, and a few years after at BEL), and (3) a far less pronounced re-decrease at the beginning of the 21st century at ELB compared to CDD. The re-decrease in sulfate over the very recent decades is somewhat stronger at BEL than at ELB.
Using data from Smith et al. (2011), available at http://sedac.ciesin.columbia.edu/data/set/haso2-anthro-sulfur-dioxide-emissions-1850-2005-v2-86 (last access: 30 July 2015), we report in Fig. 12 emissions of SO2 from countries located near the ELB site: Georgia, Azerbaijan, Syria, Iraq, Turkey, Russia, Iran or located further north (Ukraine) and west (Bulgaria). In these countries SO2 emissions became significant after 1930 and reached a maximum in the late 1980s or later (for Turkey and Iran). This feature clearly differs from the situation at CDD where emissions from countries located around the site (France, Italy, Spain, Switzerland, and Germany) were already significant in 1930 and exhibited a maximum between the early 1970s and the early 1980s (Fig. 10). For BEL, Eichler et al. (2009) demonstrated the importance of emissions from eastern Europe for the dust-free sulfate annual record at that site.
Finally, we tentatively examine the cause of the recent decrease in sulfate, focusing on the summer season for which the most relevant source regions are limited to countries located near the site. As discussed by Kutuzov et al. (2019), 10 d backward air mass trajectories calculated for the ELB site using the NOAA HYSPLIT-4 model suggest that, in summer, air masses arriving at ELB mainly originate from Georgia, Azerbaijan, Syria, and Iraq, as well as from Turkey, southern Russia, and north of Iran. As previously discussed by Fagerli et al. (2007), the CDD site in summer is mainly influenced by emissions from France, western Germany, Italy, and Spain. Consistent with SO2 emission changes, the recent sulfate decrease is more pronounced at CDD than ELB, with a recovered 2005 level (316 ppb) close to the 1950 one (296 ppb) (Fig. 13). At the ELB site this is not the case; here the 2005 level (380 ppb in 2005) is found to be still almost 2 times higher than the one of 1950 (227 ppb in 1950). An intermediate pattern is seen at BEL, likely due to a weak impact of countries like Turkey that significantly contribute to the ELB record but not the BEL one, as well as a stronger contribution of emissions from Russia at BEL (see also Eichler et al., 2009) than at ELB.
Based on the ammonium and succinate stratigraphy, the upper 168.6 m of the deep ice core extracted at Mt Elbrus (Caucasus) in 2009 was dated by counting annual layers back to 1774 CE. The derived seasonally resolved chemical records cover the years 1774–2009, making this ice core particularly useful to reconstruct many aspects of atmospheric pollution in south-eastern Europe from pre-industrial times (1850 CE) to the present day. Below 169 m depth the annual counting is not possible, but radiocarbon analysis of the particulate organic carbon fraction in the basal ice of the glacier suggests an age of cal yr BP. We have examined the impact on the chemical composition of the Elbrus ice layers of arrival at the site of large dust plumes originating from the Sahara and Middle East. We then report on the dust-free sulfate records. The ELB dust-free sulfate record indicates a 6- and 7-fold increase from prior to 1900 to 1980–1995 in winter and summer, respectively. Still moderate at the beginning of the 20th century, the sulfate increase accelerated after 1950, with dust-free annual levels reaching a maximum in 1980–1990 (376±10 ppb) and subsequently decreasing to 270±18 ppb at the beginning of the 21st century. These long-term sulfate changes observed in the ELB ice cores are compared with those previously obtained in Alpine and Siberian Altai ice. Consistent with past SO2 emission inventories, a much earlier onset and a more pronounced decrease in the sulfur pollution over the last 3 decades are observed in western Europe than in south-eastern and eastern Europe.
Sulfate and calcium data can be made available for scientific purposes upon request to the authors (contact: suzanne.preunkert@univ-grenoble-alpes.fr or michel.legrand@univ-grenoble-alpes).
SP and ML performed research, analysed ice samples and data, and wrote the original manuscript. SK performed research, analysed data, and commented on the original manuscript. PG and VM performed the analysis and commented on the original manuscript. RF analysed ice samples and commented on the original manuscript.
The authors declare that they have no conflict of interest.
We would like to thank Simon Escalle for preparing the blank ice for the PO14C measurements. We thank Margit Schwikowski and the anonymous reviewer for their very useful comments, which significantly improved the quality of the manuscript.
This research has been supported by the Russian Science Foundation (grant no. 17-17-01270), the CNRS programme “Evolution séculaire de la charge et composition de l'aérosol organique au dessus de l'Europe” with the support of “Agence de l'Environnement et de la Maîtrise de l'Energie” (grant no. 1262c008 – ESCCARGO), and the French–Russian International Associated Laboratory – VOSTOK.
This paper was edited by Frank Dentener and reviewed by Margit Schwikowski and one anonymous referee.
Andreae, M. O., Jones, C. D., and Cox, P. M.: Strong present-day aerosol cooling implies a hot future, Nature, 435, 1187–1190, https://doi.org/10.1038/nature03671, 2005.
Bronk Ramsey, C.: Radiocarbon Calibration and Analysis of Stratigraphy: The OxCal Program, Radiocarbon, 37, 425–430, https://doi.org/10.1017/S0033822200030903, 1995.
Bronk Ramsey, C.: Bayesian analysis of radiocarbon dates, Radiocarbon, 51, 337–360, 2009.
Eichler, A., Schwikowski, M., Gaeggeler, H., Furrer, V., Synal, H.-A., Beer, J., Saurer, M., and Funk, M.: Glaciochemical dating of an ice core from upper Grenzgletscher (4200 m a.s.l.), J. Glaciol., 46, 507–515, https://doi.org/10.3189/172756500781833098, 2000.
Eichler, A., Brütsch, S., Olivier, S., Papina, T., and Schwikowski, M.: A 750 year ice core record of past biogenic emissions from Siberian boreal forests, Geophys. Res. Lett., 36, L18813, https://doi.org/10.1029/2009GL038807, 2009.
Eichler, A., Tobler, L., Eyrikh, S., Gramlich, G., Malygina, N., Papina, T., and Schwikowski, M.: Three Centuries of Eastern European and Altai Lead Emissions Recorded in a Belukha Ice Core, Environ. Sci. Technol., 46, 4323–4330, https://doi.org/10.1021/es2039954, 2012.
Fagerli, H., Legrand, M., Preunkert, S., Vestreng, V., Simpson, D., and Cerqueira, M.: Modeling historical long-term trends of sulfate, ammonium, and elemental carbon over Europe: A comparison with ice core records in the Alps, J. Geophys. Res., 112, D23S13, https://doi.org/10.1029/2006JD008044, 2007.
Gabrielli, P., Barbante, C., Bertagna, G., Bertó, M., Binder, D., Carton, A., Carturan, L., Cazorzi, F., Cozzi, G., Dalla Fontana, G., Davis, M., De Blasi, F., Dinale, R., Dragà, G., Dreossi, G., Festi, D., Frezzotti, M., Gabrieli, J., Galos, S., Ginot, P., Heidenwolf, P., Jenk, T. M., Kehrwald, N., Kenny, D., Magand, O., Mair, V., Mikhalenko, V., Lin, P. N., Oeggl, K., Piffer, G., Rinaldi, M., Schotterer, U., Schwikowski, M., Seppi, R., Spolaor, A., Stenni, B., Tonidandel, D., Uglietti, C., Zagorodnov, V., Zanoner, T., and Zennaro, P.: Age of the Mt. Ortles ice cores, the Tyrolean Iceman and glaciation of the highest summit of South Tyrol since the Northern Hemisphere Climatic Optimum, Cryosphere, 10, 2779–2797, https://doi.org/10.5194/tc-10-2779-2016, 2016.
Hoffmann, H., Friedrich, R., Kromer, B., and Fahrni, S.: Status report: Implementation of gas measurements at the MAMS 14C AMS facility in Mannheim, Germany, Nucl. Instrum. Meth. B, 410, 184–187, https://doi.org/10.1016/j.nimb.2017.08.018, 2017.
Hoffmann, H., Preunkert, S., Legrand, M., Leinfelder, D., Bohleber, P., Friedrich, R., and Wagenbach, D.: A New Sample Preparation System for Micro-14C Dating of Glacier Ice with a First Application to a High Alpine Ice Core from Colle Gnifetti (Switzerland), Radiocarbon, 60, 517–533, https://doi.org/10.1017/RDC.2017.99, 2018.
Jenk, T., Szidat, S., Schwikowski, M., Gaeggeler, H., Brütsch, S., Wacker, L., Synal, H.-A., and Saurer, M.: Radiocarbon analysis in an Alpine ice core: Record of anthropogenic and biogenic contributions to carbonaceous aerosols in the past (1650–1940), Atmos. Chem. Phys., 6, 5381–5390, https://doi.org/10.5194/acpd-6-5905-2006, 2006.
Jenk, T. M., Szidat, S., Bolius, D., Sigl, M., Gäggeler, H. W., Wacker, L., Ruff, M., Barbante, C., Boutron, C. F., and Schwikowski, M.: A novel radiocarbon dating technique applied to an ice core from the Alps indicating late Pleistocene ages, J. Geophys. Res.-Atmos., 114, 1–8, https://doi.org/10.1029/2009JD011860, 2009.
Kawamura, K., Izawa, Y., Mochida, M., and Shiraiwa, T.: Ice core records of biomass burning tracers (levoglucosan and dehydroabietic, vanillic and p-hydroxybenzoic acids) and total organic carbon for past 300 years in the Kamchatka Peninsula, Northeast Asia, Geochim. Cosmochim. Ac., 99, 317–329, https://doi.org/10.1016/j.gca.2012.08.006, 2012.
Koçak, M., Theodosi, C., Zarmpas, P., Séguret, M. J. M., Herut, B., Kallos, G., Mihalopoulos, N., Kubilay, N., and Nimmo, M.: Influence of mineral dust transport on the chemical composition and physical properties of the Eastern Mediterranean aerosol, Atmos. Environ., 57, 266–277, https://doi.org/10.1016/j.atmosenv.2012.04.006, 2012.
Kozachek, A., Mikhalenko, V., Masson-Delmotte, V., Ekaykin, A., Ginot, P., Kutuzov, S., Legrand, M., Lipenkov, V., and Preunkert, S.: Large-scale drivers of Caucasus climate variability in meteorological records and Mt El'brus ice cores, Clim. Past, 13, 473–489, https://doi.org/10.5194/cp-13-473-2017, 2017.
Kutuzov, S., Shahgedanova, M., Mikhalenko, V., Ginot, P., Lavrentiev, I., and Kemp, S.: High-resolution provenance of desert dust deposited on Mt. Elbrus, Caucasus in 2009–2012 using snow pit and firn core records, Cryosphere, 7, 1481–1498, https://doi.org/10.5194/tc-7-1481-2013, 2013.
Kutuzov, S., Legrand, M., Preunkert, S., Ginot, P., Mikhalenko, V., Shukurov, K., Poliukhov, A., and Toropov, P.: The Elbrus (Caucasus, Russia) ice core record – Part 2: history of desert dust deposition, Atmos. Chem. Phys., 19, 14133–14148, https://doi.org/10.5194/acp-19-14133-2019, 2019.
Legrand, M. and De Angelis, M.: Origins and variations of light carboxylic acids in polar precipitation, J. Geophys. Res.-Atmos., 100, 1445–1462, https://doi.org/10.1029/94JD02614, 1995.
Legrand, M. and Mayewski, P.: Glaciochemistry of polar ice cores: A review, Rev. Geophys., 35, 219–243, https://doi.org/10.1029/96RG03527, 1997.
Legrand, M., Preunkert, S., Wagenbach, D., Cachier, H., and Puxbaum, H.: A historical record of formate and acetate from a high-elevation Alpine glacier: Implications for their natural versus anthropogenic budgets at the European scale, J. Geophys. Res.-Atmos., 108, 2001–2015, https://doi.org/10.1029/2003JD003594, 2003.
Legrand, M., Preunkert, S., Oliveira, T., Pio, C. A., Hammer, S., Gelencsér, A., Kasper-Giebl, A., and Laj, P.: Origin of C2–C5 dicarboxylic acids in the European atmosphere inferred from year-round aerosol study conducted at a west-east transect, J. Geophys. Res., 112, D23S07, https://doi.org/10.1029/2006JD008019, 2007.
Legrand, M., Preunkert, S., May, B., Guilhermet, J., Hoffman, H., and Wagenbach, D.: Major 20th century changes of the content and chemical speciation of organic carbon archived in Alpine ice cores: Implications for the long-term change of organic aerosol over Europe, J. Geophys. Res.-Atmos., 118, 3879–3890, https://doi.org/10.1002/jgrd.50202, 2013.
Legrand, M., McConnell, J. R., Preunkert, S., Arienzo, M., Chellman, N., Gleason, K., Sherwen, T., Evans, M. J., and Carpenter, L. J.: Alpine ice evidence of a three-fold increase in atmospheric iodine deposition since 1950 in Europe due to increasing oceanic emissions, P. Natl. Acad. Sci. USA, 115, 12136–12141, https://doi.org/10.1073/pnas.1809867115, 2018.
Lim, S., Faïn, X., Ginot, P., Mikhalenko, V., Kutuzov, S., Paris, J.-D., Kozachek, A., and Laj, P.: Black carbon variability since preindustrial times in the eastern part of Europe reconstructed from Mt. Elbrus, Caucasus, ice cores, Atmos. Chem. Phys., 17, 3489–3505, https://doi.org/10.5194/acp-17-3489-2017, 2017.
Maupetit, F., Wagenbach, D., Weddeling, P., and Delmas, R.: Seasonal fluxes of major ions to a high altitude cold alpine glacier, Atmos. Environ., 29, 1–9, https://doi.org/10.1016/1352-2310(94)00222-7, 1995.
McConnell, J. R. and Edwards, R.: Coal burning leaves toxic heavy metal legacy in the Arctic, P. Natl. Acad. Sci. USA, 105, 12140–12144, https://doi.org/10.1073/pnas.0803564105, 2008.
Mikhalenko, V., Sokratov, S., Kutuzov, S., Ginot, P., Legrand, M., Preunkert, S., Lavrentiev, I., Kozachek, A., Ekaykin, A., Fain, X., Lim, S., Schotterer, U., Lipenkov, V., and Toropov, P.: Investigation of a deep ice core from the Elbrus western plateau, the Caucasus, Russia, Cryosphere, 9, 2253–2270, https://doi.org/10.5194/tc-9-2253-2015, 2015.
Millard, A. R.: Conventions for Reporting Radiocarbon Determinations, Radiocarbon, 56, 555–559, https://doi.org/10.1017/S0033822200049596, 2014.
Nye, J.: Correction factor for accumulation measured by the thickness of the annual layers in an ice sheet, J. Glaciol., 4, 785–788, 10.3189/s0022143000028367, 1963.
Olivier, S., Blaser, C., Brütsch, S., Frolova, N., Gäggeler, H. W., Henderson, K. A., Palmer, A. S., Papina, T., and Schwikowski, M.: Temporal variations of mineral dust, biogenic tracers, and anthropogenic species during the past two centuries from Belukha ice core, Siberian Altai, J. Geophys. Res., 111, D05309, https://doi.org/10.1029/2005JD005830, 2006.
Paterson, W. S. B. and Waddington, E. D.: Past precipitation rates derived from ice core measurements: methods and data analysis, Rev. Geophys. Space Phys., 22, 123–130, 1984.
Preunkert, S.: L'histoire de la pollution atmosphérique Européenne reconstituée à partir des carottes de glace Alpine, Univ. Joseph Fourier de Grenoble, France, 240 pp., 2001.
Preunkert, S. and Legrand, M.: Towards a quasi-complete reconstruction of past atmospheric aerosol load and composition (organic and inorganic) over Europe since 1920 inferred from Alpine ice cores, Clim. Past, 9, 1403–1416, https://doi.org/10.5194/cp-9-1403-2013, 2013.
Preunkert, S., Wagenbach, D., Legrand, M., and Vincent, C.: Col du Dôme (Mt Blanc Massif, French Alps) suitability for ice-core studies in relation with past atmospheric chemistry over Europe, Tellus B, 52, 993–1012, https://doi.org/10.3402/tellusb.v52i3.17081, 2000.
Preunkert, S., Legrand, M., and Wagenbach, D.: Sulfate trends in a Col du Dôme (French Alps) ice core: A record of anthropogenic sulfate levels in the European midtroposphere over the twentieth century, J. Geophys. Res., 106, 31991–32004, https://doi.org/10.1029/2001JD000792, 2001.
Preunkert, S., Legrand, M., Stricker, P., Bulat, S., Alekhina, I., Petit, J. R., Hoffmann, H., May, B., and Jourdain, B.: Quantification of Dissolved Organic Carbon at Very Low Levels in Natural Ice Samples by a UV-Induced Oxidation Method, Environ. Sci. Technol., 45, 673–678, https://doi.org/10.1021/es1023256, 2011.
Preunkert, S., MConnell, J., Hoffmann, H., Legrand, M., Wilson, A., Eckhardt, S., Stohl, A., Chellman, N., Arienzo, M., and Friedrich, R.: Lead and antimony in basal ice from Col du Dome (French Alps) dated with radiocarbon: A record of pollution during Antiquity, Geophys. Res. Lett., 46, 4953–4961, https://doi.org/10.1029/2019GL082641, 2019.
Smith, S. J., van Aardenne, J., Klimont, Z., Andres, R. J., Volke, A., and Delgado Arias, S.: Anthropogenic sulfur dioxide emissions: 1850–2005, Atmos. Chem. Phys., 11, 1101–1116, https://doi.org/10.5194/acp-11-1101-2011, 2011.
Schwikowski, M.: Paleoenvironmental reconstruction from Alpine ice cores, PAGES news, 14, 16–18, https://doi.org/10.22498/pages.14.1.16, 2006.
Schwikowski, M., Barbante, C., Doering, T., Gaeggeler, H. W., Boutron, C., Schotterer, U., Tobler, L., Van de Velde, K., Ferrari, C., Cozzi, G., Rosman, K., and Cescon, P.: Post-17th-Century Changes of European Lead Emissions Recorded in High-Altitude Alpine Snow and Ice, Environ. Sci. Technol., 38, 957–964, https://doi.org/10.1021/es034715o, 2004.
Usher, C. R., Michel, A. E., and Grassian, V. H.: Reactions on Mineral Dust, Chem. Rev., 103, 4883–4940, https://doi.org/10.1021/cr020657y, 2003.
Wagenbach, D., Preunkert, S., Schäfer, J., Jung, W., and Tomadin, L.: Northward Transport of Saharan Dust Recorded in a Deep Alpine Ice Core, in: The Impact of Desert Dust Across the Mediterranean, edited by: Guerzoni, S. and Chester, R., Springer Netherlands, Dordrecht, 291–300, 1996.
Wagenbach, D., Bohleber, P., and Preunkert, S.: Cold, alpine ice bodies revisited: what may we learn from their impurity and isotope content?, Geogr. Ann. Ser. A, 94, 245–263, https://doi.org/10.1111/j.1468-0459.2012.00461.x, 2012.
- Abstract
- Introduction
- Methods and dating
- The effect of large dust events on the chemistry of ELB ice
- Long-term summer and winter trends of sulfate in the Elbrus ice
- Comparison between Elbrus, Alpine, and Siberian Altai long-term sulfate trends
- Conclusions
- Data availability
- Author contributions
- Competing interests
- Acknowledgements
- Financial support
- Review statement
- References