the Creative Commons Attribution 4.0 License.
the Creative Commons Attribution 4.0 License.
 | 22 Nov 2019
Wintertime aerosol dominated by solid-fuel-burning emissions across Ireland: insight into the spatial and chemical variation in submicron aerosol
Chunshui Lin
Darius Ceburnis
Ru-Jin Huang
Teresa Spohn
Damien Martin
Paul Buckley
John Wenger
Stig Hellebust
Matteo Rinaldi
Maria Cristina Facchini
Colin O'Dowd
Jurgita Ovadnevaite
To gain insight into the spatial and chemical variation in submicron aerosol, a nationwide characterization of wintertime PM1 was performed using an aerosol chemical speciation monitor (ACSM) and aethalometer at four representative sites across Ireland. Dublin, the capital city of Ireland, was the most polluted area with an average PM1 concentration of 8.6 µg m−3, ranging from < 0.5 to 146.8 µg m−3 in December 2016. The PM1 in Dublin was mainly composed of carbonaceous aerosol (organic aerosol (OA) + black carbon (BC)), which, on average, accounted for 80 % of total PM1 mass during the monitoring period. Birr, a small town in the midlands area of Ireland with a population < 1 % of that in Dublin, showed an average PM1 concentration (4.8 µg m−3, ranging from < 0.5 to 63.0 µg m−3 in December 2015) of around half that (56 %) in Dublin. Similarly, the PM1 in Birr was also mainly composed of carbonaceous aerosol, accounting for 77 % of total PM1 mass. OA source apportionment results show that local emissions from residential heating were the dominant contributors (65 %–74 % of the OA) at the two sites, with solid fuel burning, on average, contributing 48 %–50 % of the total OA. On the other hand, Carnsore Point and Mace Head, which are both regional background coastal sites, showed lower average PM1 concentrations (2.2 µg m−3 for Carnsore Point in December 2016 and 0.7 µg m−3 for Mace Head in January 2013) due to the distance from emission sources. Both sites were dominated by secondary aerosol comprising oxygenated OA (OOA), nitrate, sulfate, and ammonium. This nationwide source apportionment study highlights the large contribution of residential solid fuel burning to urban air pollution and identifies specific sources that should be targeted to improve air quality. On the other hand, this study also shows that rural and coastal areas are dominated by secondary aerosol from regional transport, which is more difficult to tackle. Detailed characterization of the spatial and chemical variation in submicron aerosol in this relatively less studied western European region has significant implications for air quality policies and mitigation strategies, as well as for regional-transport aerosol modeling.
- Article
(4074 KB) - Full-text XML
-
Supplement
(1089 KB) - BibTeX
- EndNote


Atmospheric aerosol particles such as PM2.5 (particulate matter with diameter less than 2.5 µm) have adverse effects on human health including deterioration of the respiratory system, asthma, pulmonary disease, and even premature mortality (Pope III et al., 2002; Pope III and Dockery, 2006; Sandström et al., 2005). Aerosol particles also influence the earth's radiative budget directly through absorbing and scattering sunlight and indirectly by acting as cloud condensation nuclei (Charlson et al., 1992; O'Dowd et al., 2004; Hallquist et al., 2009; Fuzzi et al., 2015). PM is a highly complex mixture in constant evolution, emitted from various sources such as road vehicles, wood burning, and cooking. PM is also formed from the oxidation of gas-phase precursors (e.g., NOx, SO2, and volatile organic compounds (VOCs)) in the atmosphere. Therefore, a better understanding of aerosol sources in a specific region or country can help inform policymakers to develop more cost-effective abatement strategies for PM.
Ireland, located in the west of Europe, is home to ∼ 5 million people with over 1 million people living in the capital city of Dublin (CSO, 2016). In the 1980s, Ireland experienced severe air pollution after a switch from oil to cheaper solid fuels such as bituminous coal for domestic space and water heating (Goodman et al., 2009). In Dublin, citywide averages of the black smoke concentration exceeded 750 µg m−3 during one particular pollution event in January 1982 (Kelly and Clancy, 1984). The Irish government subsequently introduced a ban on the marketing, sale, and distribution of bituminous coal in Dublin in 1990. The coal ban led to a 70 % reduction in black smoke concentration and 10 %–16 % reduction in respiratory and cardiovascular mortality cases over the 6 years after the ban (Clancy et al., 2002). The ban was later extended to 29 low smoke zones (http://www.dccae.gov.ie/, last access: February 2019) across Ireland including Cork and Galway.
In recent years, a number of studies have suggested that the ban on bituminous coal alone was not sufficient because other solid fuels such as peat and wood emit similar or higher amounts of PM when burned (Kourtchev et al., 2011; Dall'Osto et al., 2013; Lin et al., 2017; Lin et al., 2018). For example, in Cork city, Kourtchev et al. (2011) attributed ∼ 75 % of measured OC mass concentration to domestic solid fuel burning during wintertime through analyzing molecular markers on filter samples using gas chromatography–mass spectrometry. However, filter-based studies often suffer from low time resolution and relatively large uncertainty due to the filter sampling artifacts. The introduction of near-real-time monitoring of the chemical composition of PM using the Aerodyne aerosol mass spectrometer (AMS) (Canagaratna et al., 2007) and aerosol chemical speciation monitor (ACSM) (Ng et al., 2011) has improved the characterization and source apportionment of PM. For example, in Cork city, Dall'Osto et al., (2013) attributed 23 % of organic aerosol (OA) mass to wood burning and 21 % to peat and coal burning by positive matrix factorization (PMF) analysis of the AMS organic mass spectra. In Galway city, Lin et al. (2017) attributed up to 39 % of OA to peat burning and 11 % to wood burning during winter by PMF analysis of the ACSM spectra using the Multilinear Engine (ME-2). In a later study in Dublin city, up to 70 % of PM1 was attributed to peat and wood burning during pollution episodes (Lin et al., 2018). However, most of these studies were conducted in urban areas, and the magnitude of PM pollution and the sources of PM in rural areas remain unknown. Moreover, simultaneous measurements at both the urban and rural sites are insightful for investigating the spatial and chemical variation in the aerosol and to evaluate local and regional aerosol sources.
In this study, ACSMs were deployed to characterize PM1 chemical composition at four sites across Ireland during wintertime. These sites include an urban background location in Dublin in December 2016, a site in the small town of Birr in the midlands in December 2015, and two regional background sites, one located on the east coast (Carnsore Point in December 2016) and the other on the west coast (Mace Head in January 2013). The chemical composition data were used to investigate the major pollution sources and assess their impact on air quality at each site (Sect. 3.1). The comparison of the simultaneous measurements conducted in Dublin and Carnsore Point was conducted to investigate the local and regional sources of PM1 (Sect. 3.2). Finally, in Sect. 3.3, we compared the chemical composition of PM1 and OA source apportionment results at these four sites to provide an overview of the spatial and chemical variation in PM1 across Ireland.
2.1 Sampling sites
Four representative sites across Ireland were selected (Fig. S1). The sampling site in Dublin is located in a residential area (i.e., University College Dublin (UCD), 53.3053∘ N, 6.2207∘ W) in South Dublin, ∼ 5 km away from the downtown area. Measurements in Dublin were conducted on the roof of the science building (∼ 30 m above the ground) at UCD. The nearest road is ∼ 500 m away, minimizing the influences of direct traffic emissions. Based on these characteristics, the sampling site in UCD, Dublin, is defined as the “urban background site”. Birr is a small town which lies in the midlands area of Ireland with a population of ∼ 5000 and is ∼ 150 km west of Dublin. The sampling site in Birr is located at the council yard in St. John's Place (53∘05′47.1′′ N, 7∘54′29.9′′ W) ∼ 100 m from the central square in the town. Mace Head Atmospheric Research Station (53∘33′ N, 9∘54′ W) is located on the west coast of Ireland (Jennings et al., 2003), ∼ 250 km west of Dublin. Carnsore Point (52.19∘ N, 6.34∘ W) is located on the southeast coast of Ireland, ∼ 150 km south of Dublin. The measurements in Dublin and Carnsore Point were conducted simultaneously in December 2016 while the campaigns in Birr and Mace Head were carried out in December 2015 and January 2013, respectively.
2.2 Instruments
An ACSM (Aerodyne Research Inc.) was deployed at each site to measure the composition and mass of non-refractory submicron aerosol (NR-PM1) with a time resolution of 30 min (Ng et al., 2011). A detailed description of the ACSM is given by Ng et al. (2011). Briefly, the ambient air was drawn into the cyclone with a size cutoff of 2.5 µm at a flow rate of 3 L min−1 to remove coarse particles. The air was dried by passing through a Nafion dryer before reaching the ACSM inlet. In the ACSM, the dried aerosol particles were focused into a narrow beam by the aerodynamic lens and entered a vacuum chamber. Ionization efficiencies (IEs) and relative ionization efficiencies (RIEs) for sulfate and ammonium were determined through the calibration with ammonium nitrate and ammonium sulfate following the procedure described by Ng et al. (2011). IEs and RIEs at each site were provided in Table S1.
ACSM standard data analysis software (v1.6.0.3) in Igor Pro 6.37 (WaveMetrics Inc.) was utilized to process the mass concentrations of organic aerosol (OA), sulfate, nitrate, ammonium, and chloride. An OA mass spectra matrix and error matrix were also extracted using this software for subsequent source apportionment studies. For all ACSM measurements, a collection efficiency (CE) of 1 was applied for all the measured species. This CE was validated against a collocated scanning mobility particle sizer (SMPS), which shows the sum of the calculated ACSM volume and black carbon (BC) volume correlated well (r= 0.96 and slope ) with the SMPS volume (size ranged from 14.6 to 685.4 nm) at the sampling sites in Dublin during the winter of 2016 (Lin et al., 2018). Note that the same ACSM was also deployed in Birr in December 2015 and Mace Head in January 2013 under similar weather conditions and thus a CE of 1 was also applied for the datasets at these two sites. For the ACSM at Carnsore Point, the similar magnitude of increase in PM1 in continental air masses (See Sect. 3.2) confirmed that the application of CE of 1 for the Carnsore Point dataset was physically meaningful. Also, note that a CE of 1 provided a lower limit for all ACSM-measured mass concentration.
The aethalometers (AE-33, Magee Scientific) were deployed to measure black carbon (BC) at the sampling site in Dublin, Birr, and Carnsore Point with a time resolution of 1 min while a multi-angle absorption photometer (MAAP) was deployed at Mace Head to measure BC with a time resolution of 5 min. Aethalometers measure light absorption at seven wavelengths (370, 470, 520, 590, 660, 880, and 950 nm) (Drinovec et al., 2015). BC mass concentration was calculated from the change in optical attenuation at 880 nm in the selected time interval using the mass absorption cross section 7.77 m2 g−1 (Drinovec et al., 2015). BC was apportioned to wood-burning-related BC (BCwb) and traffic-related BC (BCtr) based on their spectral dependence using the Ångström exponent model (Sandradewi et al., 2008; Zotter et al., 2017). Briefly, the spectral dependence of the BC absorption is described by the power law , where babs is the aerosol absorption coefficient at the wavelength λ while α is the absorption Ångström exponent. BC absorbs light over the entire visible wavelength range with only a weak spectral dependence (α for BC ∼ 1). Specifically, vehicular emissions contain mostly BC and its absorption is less dependent on the wavelength with αtr of ∼ 1 because traffic emissions basically contain no light-absorbing compounds other than BC (Sandradewi et al., 2008). In contrast, aerosol particles produced from biomass burning contain a substantial amount of light-absorbing organic compounds in addition to BC, which show a strong increase in absorption in the near-ultraviolet and blue parts of the light spectrum but have no contribution to the absorption at the near-infrared wavelength, resulting in a greater αwb than αtr (Sandradewi et al., 2008; Zotter et al., 2017). Based on this, the measured absorption coefficients at wavelengths 470 and 950 nm were used as input to the Ångström exponent model for the apportionment of BCwb and BCtr (Sandradewi et al., 2008). In the original aethalometer two-source model, α (470–950 nm) values of 1 and 2 were used for fossil fuel and biomass burning, respectively (Sandradewi et al., 2008). However, the most recent evaluation recommends values of αtr=0.9 and αwb=1.68 (Zotter et al., 2017). These latter α values have been used here.
2.3 OA source apportionment
Positive matrix factorization (PMF) was employed to analyze the contributions of different sources to measured OA concentrations. The PMF model assumes that the measured concentrations at the receptor site can be explained as a linear combination of a source matrix and a contributing matrix (Paatero and Tapper, 1994). Moreover, the PMF model requires all the elements of the model outputs to be non-negative. The output from the PMF model is a set of factors representing source profiles and source contributions to the measured concentrations at the receptor sites. However, the number of factors in PMF is determined by the user and the solutions of the model are not mathematically unique, due to rotational ambiguity.
Unconstrained PMF or free PMF was initially conducted on the OA matrix with a range of solutions and a different number of factors (e.g., from two to eight factors). The solutions were carefully examined and compared with known reference profiles (i.e., mass spectra), derived from literature and/or mass spectra databases (e.g., the AMS spectral database; http://cires1.colorado.edu/jimenez-group/AMSsd/, last access: October 2019). Moreover, a comparison of factor time series with tracers (e.g., BC) and their diurnal patterns were also important in identifying and evaluating the potential sources.
However, the unconstrained PMF (or free PMF) has difficulties in separating the aerosol sources of temporal covariations. For example, free PMF often fails to separate emissions from different types of solid fuels, which concurrently increase in the evening (Dall'Osto et al., 2013; Lin et al., 2017). Multilinear Engine (ME-2) was utilized to constrain the reference profiles to direct the source apportionment towards an environmentally meaningful solution (Lanz et al., 2008; Canonaco et al., 2013; Crippa et al., 2014; Reyes-Villegas et al., 2016; Lin et al., 2018). Both free PMF and ME-2 analysis were performed using SourceFinder (SoFi version 6.3, http://www.psi.ch/acsm-stations/me-2, last access: October 2019), developed by Canonaco et al. (2013). The a value approach of the ME-2 solver was employed to constrain the reference profiles, where the constrained reference profiles were allowed to vary within the scalar value “a” (Canonaco et al., 2013). For example, an a value of 0.1 corresponds to 10 % variation. The reference profile of hydrogen-carbon like OA (HOA) was obtained from the literature (Crippa et al., 2013) while the reference profiles of solid fuel factors (i.e., wood, peat, and coal) were taken from our previous fingerprinting experiments conducted in a typical Irish stove with no emission controls (Lin et al., 2017). To explore the solution space, a sensitivity analysis was conducted by varying a values (0 %–0.5 % or 0 %–50 % variation) to evaluate the OA factor contribution at different levels of constraint on the reference factor. At the coastal sites (i.e., Mace Head and Carnsore Point), the reference sea salt profile (Ovadnevaite et al., 2012) was also included to constrain the solution (see more details in Sect. 3.1).

Figure 1Time series of organic aerosol (OA), sulfate (SO4), nitrate (NO3), ammonium (NH4), chloride (Chl), and black carbon (BC) at the urban background site in Dublin (a), the rural site at Carnsore Point (b), the midland town site in Birr (c), and the coastal site at Mace Head (d). The measurements at the Dublin site and Carnsore Point were conducted simultaneously in December 2016. The campaign in Birr was carried out in December 2015, and Mace Head was carried out in January 2013. BC, measured by AE-33 with 1 min resolution or by MAAP with 5 min resolution, was averaged to 30 min to match the time stamp of the ACSM. Pollution periods (P1–P3) and clean periods (C1–C3) in Dublin are marked – see text for further discussion.
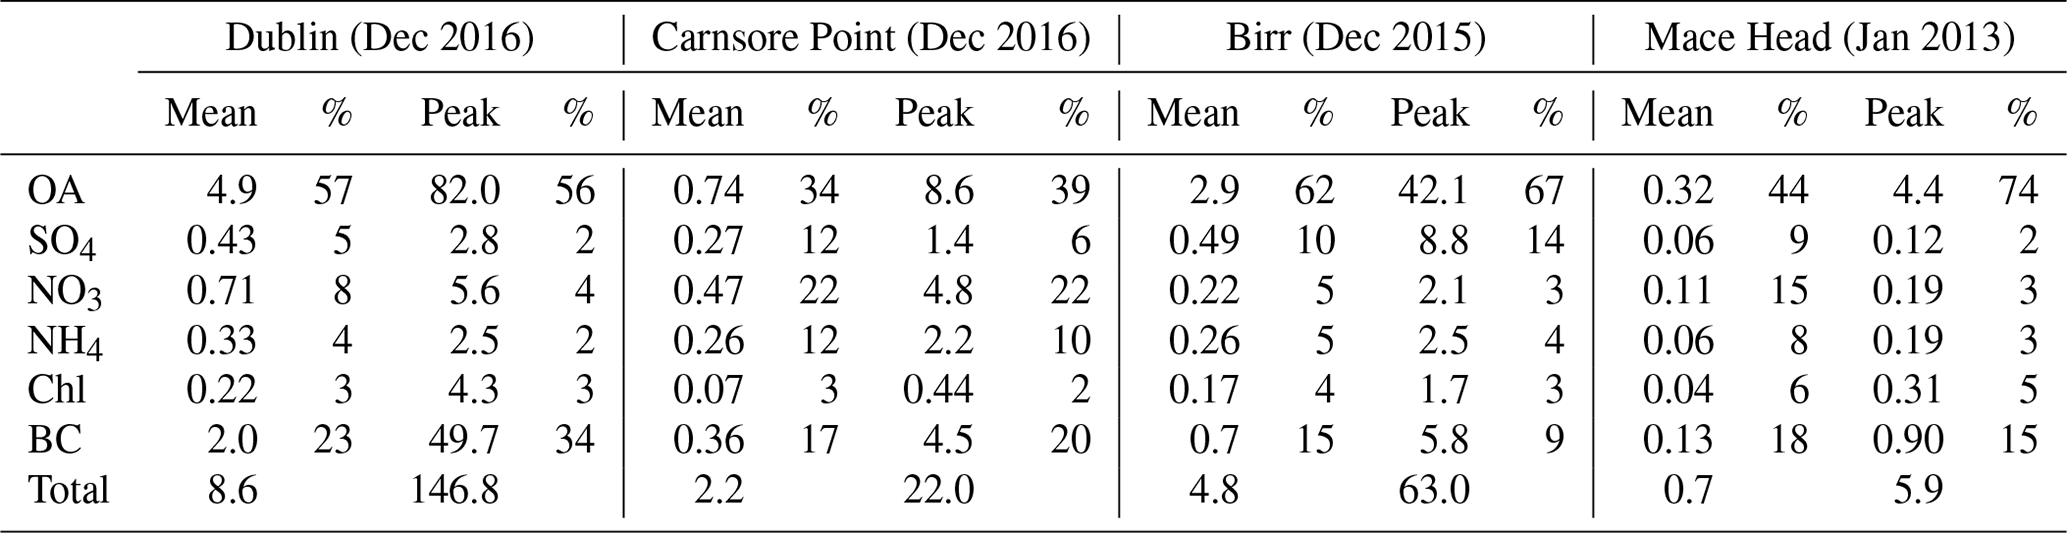
Table 1Average and peak concentrations of organic aerosol (OA), sulfate (SO4), nitrate (NO3), ammonium (NH4), chloride (Chl), and black carbon (BC), as well as relative contribution (%) to total PM1 at the four measurement sites across Ireland.
3.1 Chemical composition and sources of PM1
3.1.1 Dublin
Figure 1a shows the time series of PM1 components measured by ACSM (i.e., OA, sulfate, nitrate, ammonium, and chloride) and AE-33 (i.e., BC) in Dublin during December 2016. The campaign-averaged PM1 concentration was 8.6 µg m−3, ranging from < 0.5 to 146.8 µg m−3 (Table 1). The chemical composition of PM1 was dominated by OA, which on average accounted for 57 % (4.9 µg m−3) of the total PM1 mass, followed by BC, accounting for 23 % (2.0 µg m−3) of the total PM1 mass. Nitrate (8 % or 0.7 µg m−3), sulfate (5 % or 0.4 µg m−3), ammonium (4 % or 0.3 µg m−3), and chloride (3 % or 0.2 µg m−3) accounted for minor fractions of PM1.
Frequent pollution spikes with high OA and BC concentration (> 8.0 µg m−3) were observed in the evening during the pollution periods (P1–P3), while, during clean periods (C1–C3), all PM1 components were below 6.0 µg m−3 (Fig. 1). For one particulate pollution peak in the evening on 2 December 2016, the OA concentration increased up to 82.0 µg m−3, ∼ 17 times the OA average concentration, while BC concentration increased to 49.7 µg m−3, ∼ 25 times the BC average (Table 1). The simultaneous increase in both BC and OA during evening hours is a strong indication that these pollutants were emitted from a similar source, i.e., residential heating. In addition to emission sources, meteorological conditions such as wind speed and temperature were also important parameters in driving particulate air pollution. The temperature was ∼ 1.5 times lower during the pollution periods (5.9 ∘C, on average) than during the clean periods (8.7 ∘C; Fig. S2). In addition, the wind speed was ∼ 2.5 times lower (2.8 m s−1 vs. 7.3 m s−1) during pollution periods than during clean periods. These conditions commonly lead to increased air pollution in winter months due to a shallower boundary layer and less dispersion of primary emissions. The dominance of OA highlights the importance of its source apportionment to identify and quantify the major pollution sources.
To investigate the sources of the OA, unconstrained PMF (i.e., free PMF) was first applied to the ambient organic mass spectra. Hydrocarbon-like OA (HOA), solid-fuel-burning OA (SFOA), and oxygenated OA (OOA) were identified in the free PMF runs (see Fig. S3–S4 and more details in the Supplement). The free PMF solutions with higher numbers of factors provided no new meaningful factors. HOA is usually associated with traffic emission and its diurnal pattern is expected to show morning and/or evening rush hour peaks as found in other European cities, e.g., in London (Allan et al., 2010) and Paris (Crippa et al., 2013). However, HOA was mixed with SFOA in this three-factor solution because the HOA profile contained a higher-than-expected contribution from m∕z 60 (0.006), which is regarded as a marker fragment for biomass burning (BB) (Alfarra et al., 2007). Moreover, both HOA and SFOA showed diurnal patterns with peak concentrations occurring in the evening and going into the night, indicating significant contributions from residential heating sources. Solid fuels like peat, wood, and coal have been reported to be the primary heating sources by a small proportion of households in Dublin (e.g., < 5 % of the household using solid fuels vs. ∼ 95 % of the households using electricity or natural gas) according to census data by the Central Statistics Office (CSO, 2016). However, free PMF was not capable of separating these three types of solid fuels at the same time if they were contributing to the nighttime peaks with temporal covariation (Lin et al., 2017). Therefore, SFOA in the free PMF solution contained mixed contributions from peat, wood, and coal burning.
To reduce the mix between HOA and SFOA, and to evaluate the contribution of different types of solid fuels, the reference profiles of HOA (Crippa et al., 2013), peat, wood, and coal (Lin et al., 2017) were constrained with the a value approach using ME-2 (Canonaco et al., 2013). A sensitivity test by varying the a values from 0 to 0.5 with an interval of 0.1 was performed and the correlation between the resolved factors with BC measurements was evaluated and compared to choose the best solution (Fig. S5). The HOA reference profile was taken from the Paris study (Crippa et al., 2013) and a small a value (e.g., 0–0.2) or tight constraint was expected because the HOA profiles do not show significant variability when compared to different cities in Europe (Canonaco et al., 2013; Crippa et al., 2014). The reference profiles of peat, wood, and coal were taken from our previous study in which an ACSM was used to characterize the primary OA emissions directly from burning these fuels (Lin et al., 2017). High a values (e.g., 0.3–0.5) or a loose constraint led to potential mixing between these heating-related factors, especially when their time series showed temporal covariation (i.e., all showed higher concentration at night). At high a values, the mixing between these factors was evidenced by the sudden drop of correlation coefficient between the time series of the peat factor and BCwb, with R dropping from 0.82 at an a value of 0.3 to the R of 0.47 at an a value of 0.4 (Fig. S5), while the correlation between the corresponding profile of peat also dropped from 0.96 to 0.90, confirming the mixing between peat and other factors (e.g., wood). In contrast, a lower a value (e.g., 0–0.2) reduced mixing and improved the separation by tightly constraining their individual profiles. As shown in Fig. S5, at an a value of 0.1, the time series of peat showed a good correlation with BCwb (R= 0.88), while the profile of peat was also tightly correlated with the reference peat profile (R= 0.99). Therefore, an a value of 0.1 was chosen as the most optimal ME-2 solution.
The mass spectra and time series of HOA, peat, coal, wood, and OOA are shown in Fig. 3. The HOA profile is dominated by signals at m∕z 27, 29, 41, 43, 55, and 57, characteristic of aliphatic hydrocarbons. Many studies have shown that HOA is usually associated with traffic emissions in urban environments (Canagaratna et al., 2004; Schneider et al., 2005; Platt et al., 2017) and the HOA ∕ BCtr ratio has been reported to be an important parameter to determine the type of fuels used (e.g., diesel or gasoline) (DeWitt et al., 2015). For example, HOA ∕ BCtr ratios in the range of 0.03–0.61 have been reported to be associated with diesel vehicular emission, while the range of 0.9–1.7 for HOA ∕ BCtr ratios is associated with gasoline vehicular emissions (DeWitt et al., 2015). In this study, the average HOA ∕ BCtr ratio was 0.69±0.09 during the day (08:00–15:00, all times are in local time; Fig. S6). This ratio is close to the HOA ∕ BCtr range (0.03–0.61) associated with the diesel vehicular emission and very similar to the ratio (0.61) reported in Paris (Crippa et al., 2013). Therefore, during the day, HOA was likely to be associated with diesel vehicular emissions. However, from 16:00 in the afternoon, the HOA ∕ BCtr ratio started to increase and the ratio increased up to ∼ 9.0 in the evening, which was significantly higher than the values associated with gasoline vehicular emissions (0.9–1.7). Therefore, HOA during the night could not be attributed to the emissions from diesel- or gasoline-powered vehicles. Instead, both the diurnal cycle of HOA and HOA ∕ BCtr ratio indicate the HOA in the evening was mainly associated with heating sources. According to the census data from CSO (2016), natural gas, electricity, oil, wood, coal, and peat were the major types of heating sources in Dublin. Among these fuels, oil is most likely to be the source of HOA during the night because oil, gasoline, and diesel are expected to have similar mass spectra as indicated by various ambient measurement and lab experiments (Canagaratna et al., 2004; Schneider et al., 2005; Platt et al., 2017). Assuming HOAs were merely from traffic during the day and the traffic HOA ∕ BCtr ratio (0.69) were stable, the traffic HOA associated with traffic during the evening (18:00–23:00) was estimated at 16 % of total HOA, with the other 84 % being associated with oil heating. Over the whole period, 28 % of HOA was attributed to traffic. As shown in Fig. 2, HOA, on average, accounted for 25 % of OA over the entire period. It was, therefore, estimated that traffic-related HOA accounted for 7 % of the total OA, and oil-related HOA accounted for 18 % of the total OA.

Figure 2Average mass concentration and composition of PM1 and the fractions of the OA factors in Dublin (top), Carnsore Point (right), Birr (bottom), and Mace Head (left).
Despite Dublin being a large city, the impact from traffic also depends on the distance from the roads, wind speed, wind direction, etc. Therefore, the traffic impact is not very pronounced at the residential measurement location. Actually, to further evaluate the impact of traffic emissions on urban air quality, a recent campaign was conducted in Dublin by simultaneously measuring the chemical composition of PM1 at both the curbside and at the same urban background site in this study. It was found that, while the diurnal cycle of HOA at the curbside shows typical rush hour peaks, the HOA at the same urban background shows no clear traffic-related patterns. The latter confirms our conclusion that the traffic emission contribution to HOA at the urban background site is minor (Lin et al., 2019).
Wood, peat, and coal are three types of solid fuels and their profiles were highly associated with their composition (Lin et al., 2017). In the mass spectral signatures for the wood and peat OA factors, the contribution of the signal at m∕z 60 (that is, f60) and 73 (f73) to the total organics is associated with fragmentation of levoglucosan. f60 and f73 are, therefore, often regarded as tracers for biomass burning emissions (Alfarra et al., 2007; Cubison et al., 2011; Dall'Osto et al., 2013). In contrast, the mass spectral signature for the coal OA factor does not have any contribution from m/z 60 due to the lack of levoglucosan in this fossil fuel (Zhang et al., 2008). The time series of wood, peat, and coal all showed peak concentrations in the evening (Fig. 3b), corresponding to the time of residential heating activities. The solid fuel factors (the sum of wood, peat, and coal), on average, accounted for 50 % of OA, highlighting its important role in driving the pollution events in Dublin (Fig. 2). Among these solid fuels, peat (30 %) shows a contribution 2.5–3.8 times higher than that of wood (12 %) and coal (8 %).
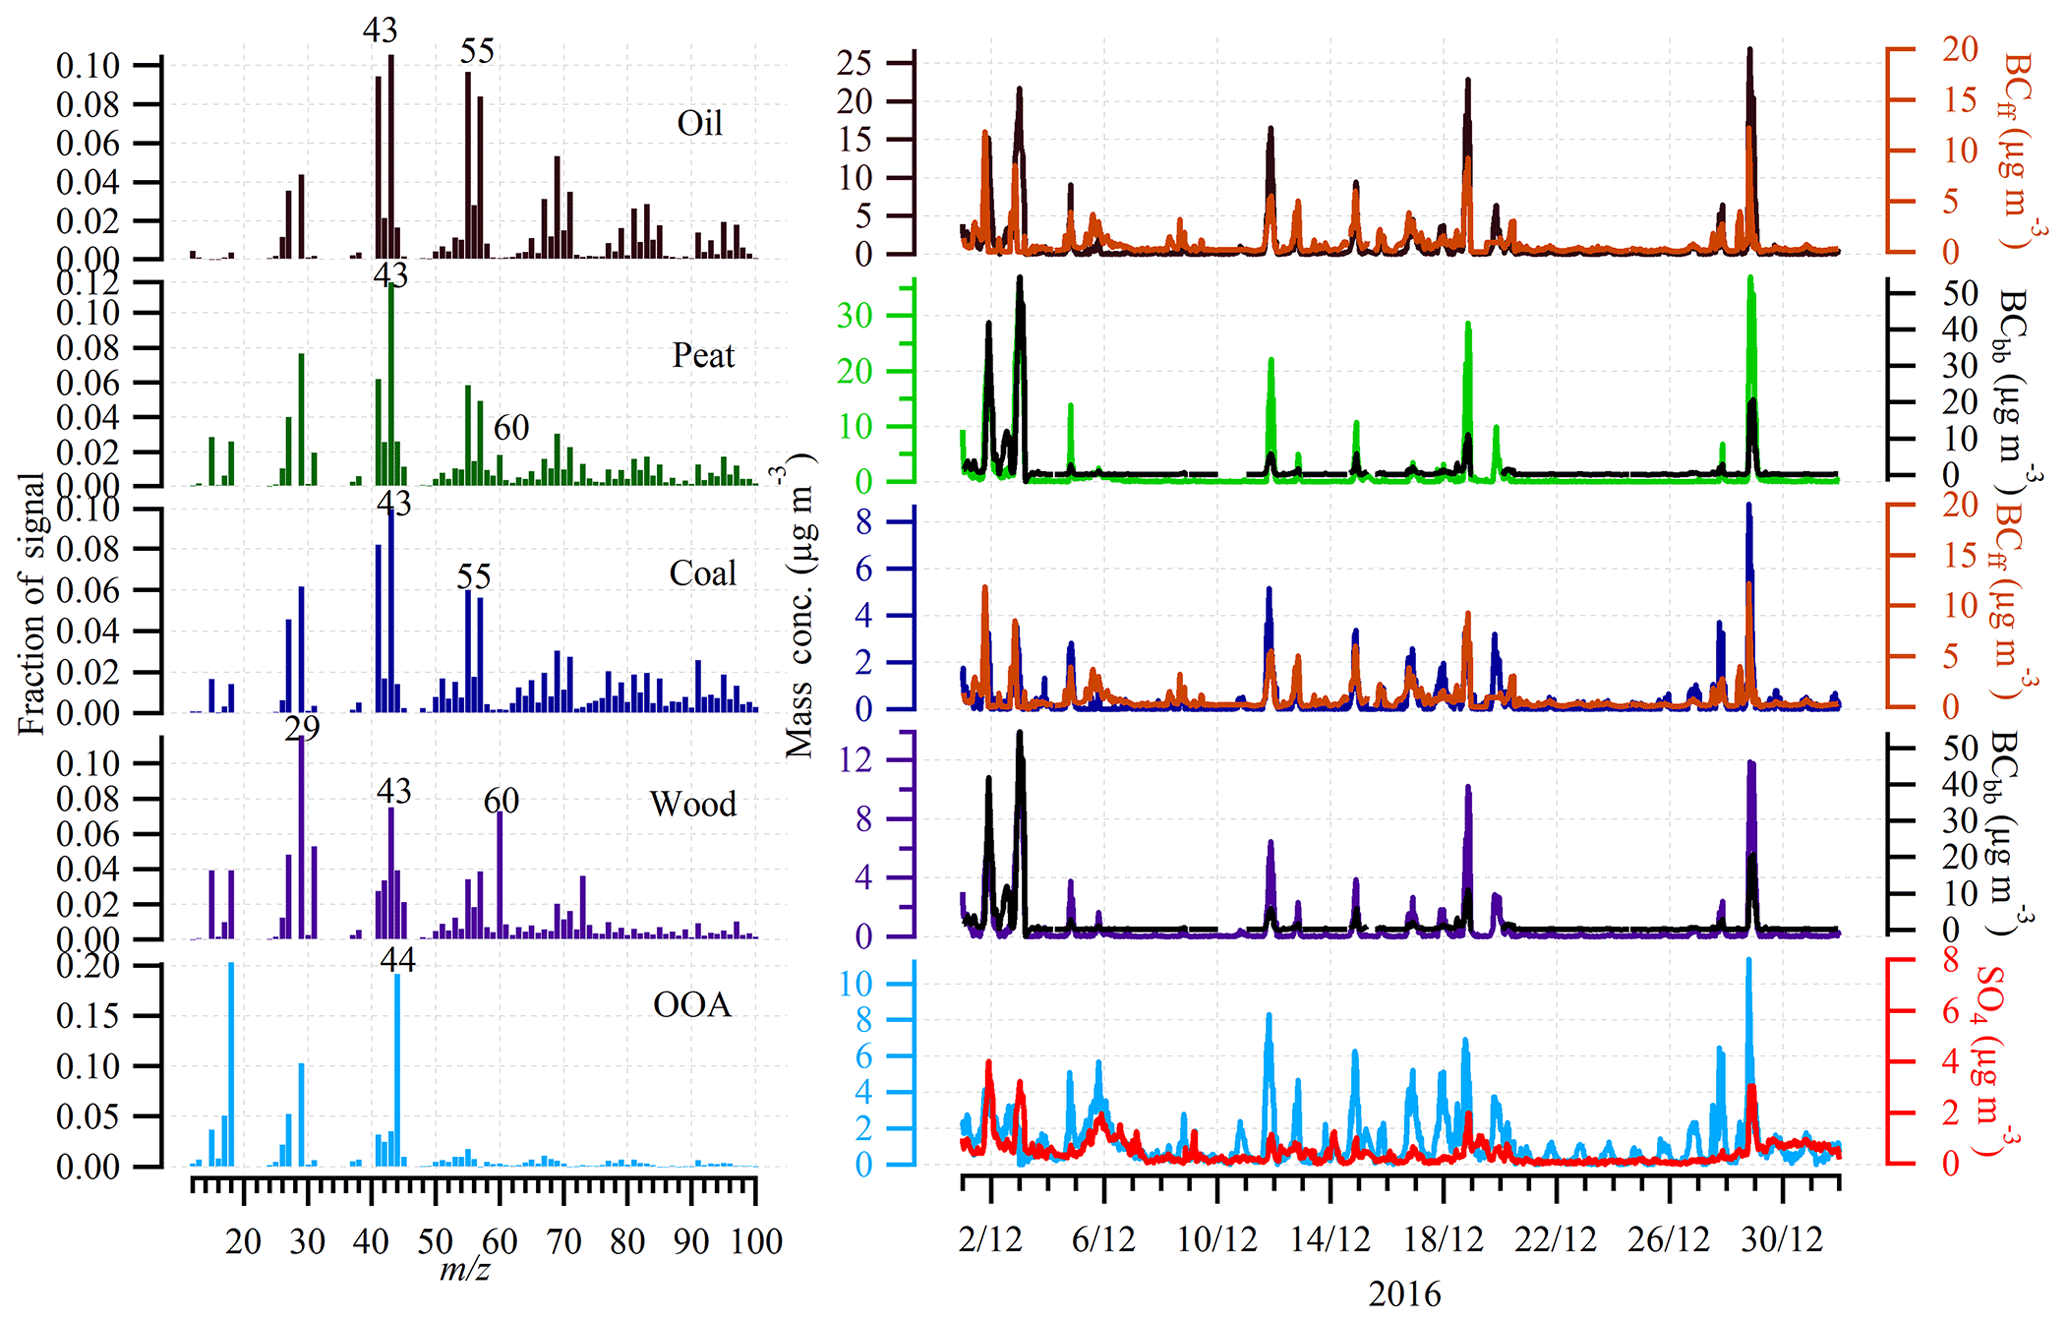
Figure 3Profiles and time series of HOA, peat, coal, wood, and oxygenated OA (OOA) at the urban site in Dublin in December 2016. The time series of BC from traffic (BCtr), BC from wood burning (BCwb), and sulfate (SO4) were also included to support OA source apportionment.
In addition to the primary factors, an OOA factor was also resolved and its profile was characterized by a significant contribution from f44, which is higher than other primary factors. However, similar to other primary factors, OOA also showed peak concentrations during the evening, indicating OOA was dominated by local sources from residential heating. This is further confirmed by the wind rose, which shows higher concentrations of OOA were associated with the lower wind speed from the north-northwest direction, consistent with that for the BC polar plots (Fig. S7). The local contribution from heating sources to OOA was probably associated with the condensation of semi-volatile species and/or aging of primary aerosol emitted from biomass burning (Tiitta et al., 2016). The local and regional sources of OOA will be further discussed below. OOA, on average, accounted for 26 % of OA, comparable to HOA (25 %) and peat (30 %).
3.1.2 Carnsore Point
Carnsore Point is located in a rural area on the southeast coast of Ireland, ∼ 150 km south of Dublin. The campaign at Carnsore Point was conducted over the same period as that in Dublin during December 2016 (Fig. 1b). However, the average PM1 concentration was only 2.2 µg m−3, ∼ 4 times lower than that in Dublin. OA was the most dominant component, on average accounting for 34 % (0.7 µg m−3) of PM1, followed by nitrate (22 % or 0.5 µg m−3), BC (17 % or 0.4 µg m−3), sulfate (12 % or 0.3 µg m−3), ammonium (12 % or 0.3 µg m−3), and chloride (3 % or 0.1 µg m−3). The fraction of inorganic secondary aerosol (the sum of nitrate, sulfate, and ammonium) was 46 %, indicating that secondary formation over long-range transport was important at this rural site. This is consistent with the wind rose of sulfate and nitrate, which shows that higher sulfate and nitrate concentrations were associated with wind from the east-southeast direction, pointing to a major source from the UK and/or mainland Europe (Fig. S7). BC is associated with solid fuel combustion and/or biomass combustion. The wind rose of BC shows a major source from northwest areas, pointing to sources from the nearby villages and towns. Therefore, the aerosol measured at Carnsore Point was impacted by both international long-range transport and the emissions from nearby villages and towns, highly associated with the wind direction.
To investigate the sources of OA, free PMF was first conducted on the organic mass spectra. Three factors were identified, including two organic factors (i.e., OOA and SFOA) and one inorganic factor of sea salt (see Fig. S8 and more details in the Supplement). The profile of the sea salt factor was characterized by its fragments of m∕z 37 (37Cl+), 58 (23Na35Cl+), 60 (23Na37Cl+), and 83 (), which were typical of sea salt fragmentation as found in our previous study where sea salt solution was atomized and directly characterized by AMS (Ovadnevaite et al., 2012). Note that other m∕z values that belonged to sea salt, like m∕z 23 (23Na+) or 81 (), did not appear in the OA factor profile as they were mainly associated with inorganic ions, which were not included in the OM matrix for PMF analysis. Also, the standard fragmentation table (Allan et al., 2004) in ACSM does not include sea salt, which is, however, ubiquitous in the marine environment. As a result, all the sea salt fragmentation ions (i.e., m∕z 37, 58, 60, and 83) were included as “organic”. Therefore, the true OAs were corrected by subtracting the sea salt contribution at Carnsore Point. However, the profile of sea salt factor resolved by free PMF was not “clean” with some interference from other mass spectral fragments even at solutions with a higher number of factors (Fig. S8). To better quantify the contribution of sea salt, ME-2 was utilized to constrain its reference profile. A tight constraint (a value of 0.05) was applied because the sea salt factor was not expected to vary significantly.
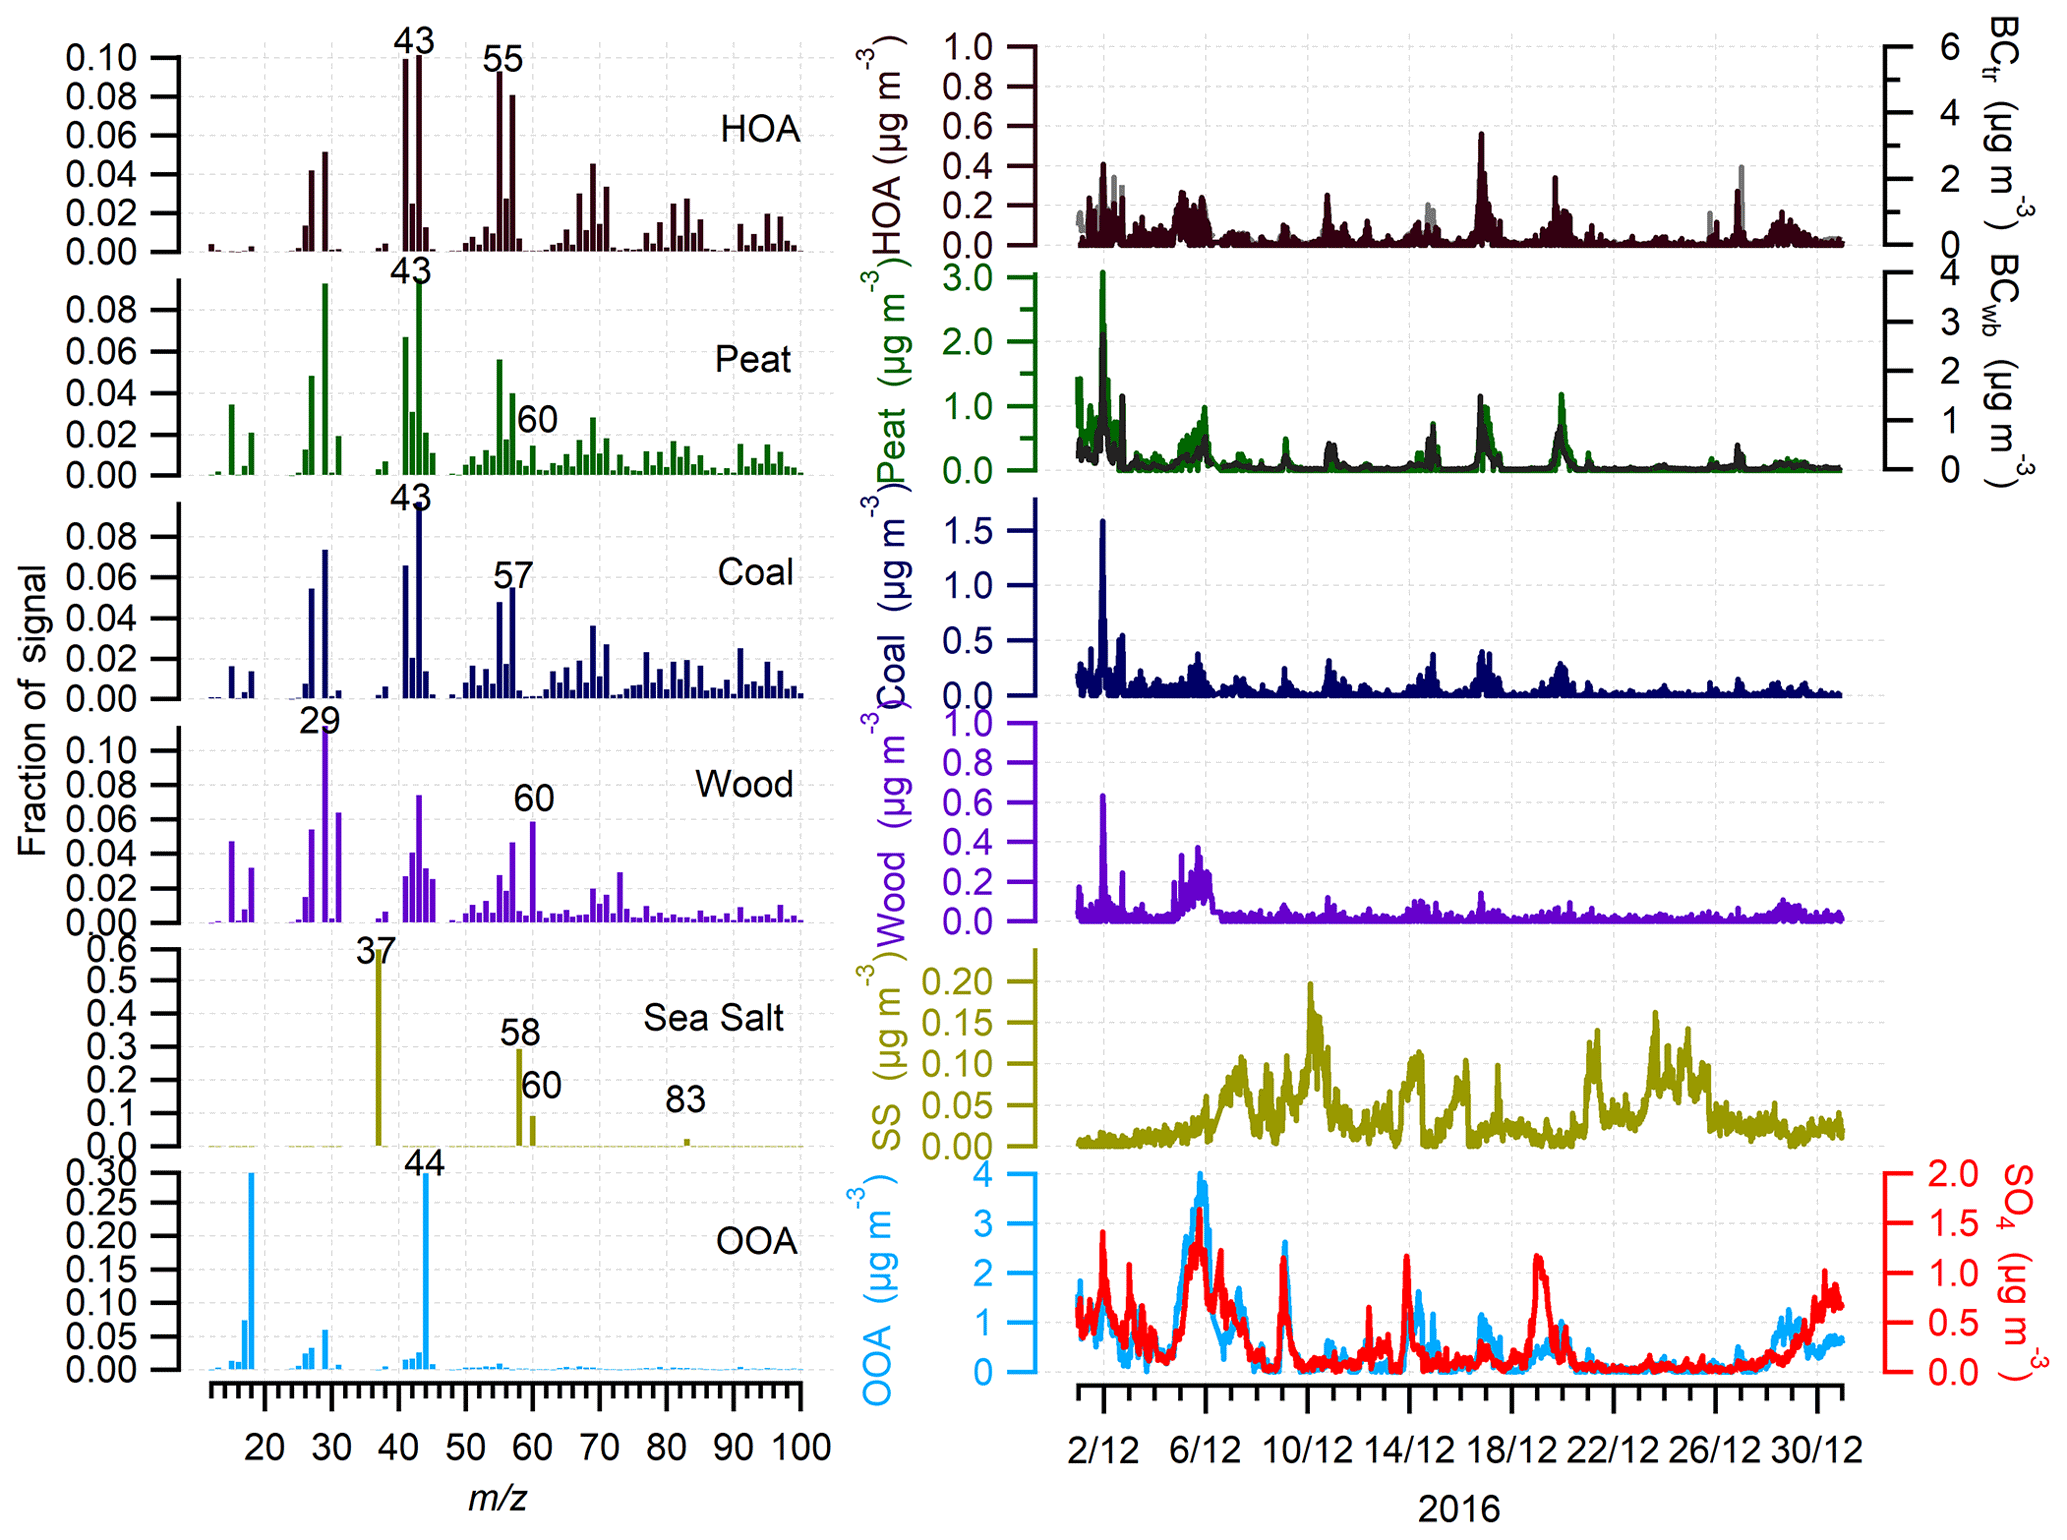
Figure 4Profiles and time series of HOA, peat, coal, wood, sea salt, and oxygenated OA (OOA) at the rural site of Carnsore Point in December 2016. The time series of BCtr, BCwb, and sulfate (SO4) were also included to support OA source apportionment.
To evaluate the contribution from different solid fuels to the total SFOA factor, as well as the oil heating factor, the reference profiles of wood, peat, coal, and HOA were also constrained with the a value approach using ME-2. The sensitivity test with varying a values (0–0.5) shows the average relative contribution of the factors did not vary significantly (only by a few percent) within the considered a values (Fig. S9). Figure 4 shows the reference profile and time series of all the factors obtained using the a value of 0.1. The profiles of the HOA, wood, peat, and coal were similar to those found in Dublin as expected because a tight constraint was applied with ME-2 at both locations. HOA, peat, coal, and wood were the primary OA factors. Among these primary factors, the peat factor was dominant, accounting for 16 % of the total OA mass. The wind rose for the peat factor shows higher concentrations were associated with wind direction from the northwest at a wind speed of 2–4 m s−1, indicating a source region from nearby villages and towns, consistent with that for BC (Fig. S7). HOA, coal, and wood were the minor OA factors, accounting for 4 %, 6 %, and 3 % of OA, respectively. In addition to these primary OA factors, an OOA factor was resolved. The profile of OOA featured an f44 of 0.29, which was higher than f44 of 0.19 for the OOA in Dublin, suggesting the OOA was more oxidized and had undergone more photochemical processing before reaching Carnsore Point. OOA, on average, accounted for 71 % of OA at Carnsore Point, more than twice that in Dublin (26 %), again suggesting the importance of secondary formation and/or aging of primary aerosol at this rural site. The wind rose of OOA shows higher concentrations (1–2 µg m−3) of OOA were associated with the wind from the east and southeast directions (Fig. S7), pointing to a source from the UK and/or other European countries.
The profile of the sea salt factor was characterized by the prominent signals at m∕z 37, 58, 60, and 83, corresponding to sea salt fragmentation (Ovadnevaite et al., 2012). Sea salt particles are formed at the sea surface through wave breaking and higher wind speed is usually associated with higher sea salt concentrations (Ovadnevaite et al., 2012). The time series of sea salt showed higher concentration at higher wind speed when the concentration of other factors including peat and OOA factors was very low (Fig. 4). Note that a scaling factor of 11 should be applied to calculate the real sea salt concentration from PMF–ACSM results after comparing with HR-AMS sea salt (SS) concentration (Fig. S10) because the sea salt was not calibrated in the ACSM system. The wind rose for sea salt shows higher concentrations were associated with wind from the south to west at a wind speed of 6–12 m s−1 (Fig. S11), pointing to a source from the oceanic direction instead of the continental direction. In contrast, the sea salt showed a very low concentration (< 0.1 µg m−3) at low wind speed (< 6 m s−1), suggesting insufficient sea salt production at low wind speed.
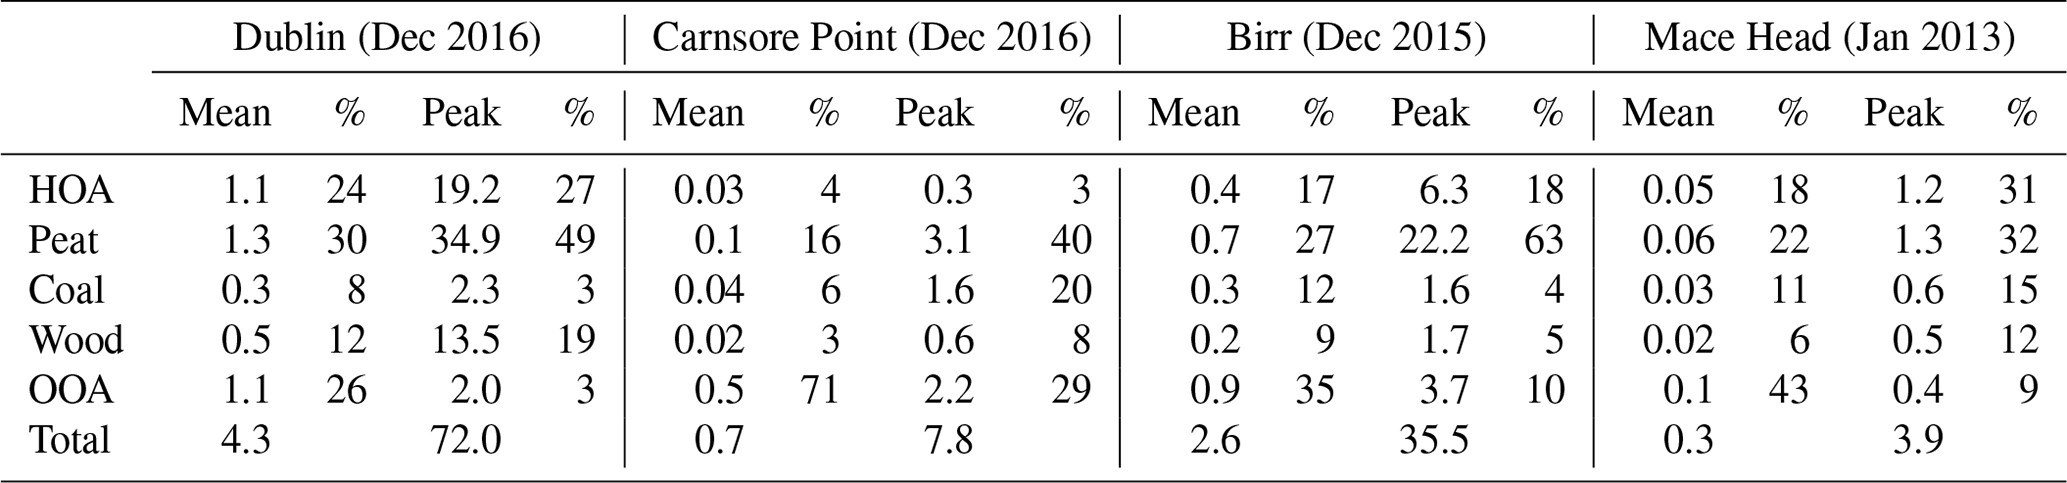
Table 2Average and peak concentrations of HOA, peat, coal, wood, and oxygenated organic aerosol (OOA), as well as their relative contribution (%) to the total OA mass at the four measurement sites across Ireland.
3.1.3 Birr
Figure 1c shows the time series of PM1 composition measured by an ACSM and AE-33 in Birr during December 2015. The campaign-averaged PM1 concentration was 4.8 µg m−3, ranging from < 0.5 to 63.0 µg m−3 (Table 1). The PM1 chemical composition was dominated by OA, on average, accounting for 62 % (2.9 µg m−3) of OA, followed by BC (15 % or 0.7 µg m−3), sulfate (10 % or 0.5 µg m−3), ammonium (5 % or 0.3 µg m−3), nitrate (4 % or 0.2 µg m−3), and chloride (4 % or 0.2 µg m−3). The time series of OA and BC both showed spike concentrations in the evening, indicating a source from nearby heating activities. The peak OA concentration was 42.1 µg m−3, observed in the evening on 13 December 2015, accompanied by a peak concentration of BC (5.8 µg m−3), sulfate (8.8 µg m−3), ammonium (2.5 µg m−3), nitrate (2.1 µg m−3), and chloride (1.7 µg m−3). Source apportionment of OA using ME-2 showed the spikes were mainly due to solid fuel burning (Fig. S12). On average, solid fuels (the sum of peat, coal, and wood) accounted for 48 % (1.2 µg m−3) of OA (Table 2). The peat factor was the most dominant solid fuel factor, on average, accounting for 27 % (0.7 µg m−3) of OA. During the pollution peak, the contribution from peat increased to 66 % (or 22.2 µg m−3), highlighting its dominance. Coal and wood factors, on average, accounted for 12 % (or 0.3 µg m−3) and 9 % (or 0.2 µg m−3) of the OA, respectively. During the pollution peak, the coal and wood factor concentrations increased to 1.6 and 1.7 µg m−3, respectively. However, the fractions of coal and wood factors were only 4 % and 5 %, respectively. Similarly, the OOA contribution was higher during the pollution peaks than its average value (3.7 vs. 0.9 µg m−3), but its fraction was only 10 % compared to the average of 35 %. The wind roses for OOA, peat, and BC all showed that their higher concentrations were associated with low wind speed (< 5 m s−1) from no specific wind direction (Fig. S7), consistent with fact that the measurement site was surrounded by residential households.
3.1.4 Mace Head
Figure 1d shows the time series of PM1 components at Mace Head in January 2013. The average PM1 concentration was 0.7 µg m−3, which was the lowest among the four sites, primarily due to the dominant influence of marine air masses at this location. OA dominated the chemical composition of PM1, on average, accounting for 44 % (or 0.3 µg m−3) of OA, followed by BC (18 %, 0.1 µg m−3) and nitrate (15 % or 0.1 µg m−3). Sulfate (9 % or < 0.1 µg m−3), ammonium (8 % or < 0.1 µg m−3), and chloride (6 % or < 0.1 µg m−3) accounted for the other 24 % of PM1. OA spikes with a concentration of ∼ 5 µg m−3 were observed in the evening on 1 January and 5 January 2013. Source apportionment of OA with ME-2 shows these spikes were from the heating sources oil, peat, coal, and wood (Fig. S13). Among these primary sources, peat was the greatest OA factor, on average, accounting for 22 % (or 0.06 µg m−3) of OA. The contribution from the peat factor increased to 32 % (1.3 µg m−3) during the pollution peak (Table 2). The wind dependency of the peat factor showed that higher concentration of peat was associated with wind from the east at wind speeds < 5 m s−1 (Fig. S7), pointing to a source from nearby villages and towns. OOA, on average, accounted for 43 % of OA, making it the most dominant OA factor at Mace Head. The wind rose for OOA, sulfate, and nitrate showed that their highest contributions were associated with easterly wind at relatively high wind speed (> 5 m s−1), suggesting strong regional transport sources. Finally, an inorganic factor of sea salt was resolved at Mace Head. The wind rose for sea salt shows its highest contribution was associated with westerly wind at high wind speed (> 15 m s−1), pointing to sea salt production in the Atlantic Ocean during periods with high wind speeds (Fig. S11).
3.2 Comparison between Dublin and Carnsore Point
The simultaneous measurements performed at Dublin and Carnsore Point can be compared to gain insight into local versus regional aerosol sources and to assess their impact on air quality. Primary OA factors including HOA, peat, coal, and wood were directly emitted from their corresponding sources and were mainly associated with local emissions. As shown in Fig. 2, on average, 74 % of OA was primary in Dublin while only 29 % of OA was primary in Carnsore Point. Thus, the air quality in wintertime Dublin was heavily influenced by local sources, while secondary formation and/or long-range transport was more important in Carnsore Point. Secondary organic aerosol and secondary inorganic aerosol (e.g., sulfate, nitrate, and ammonium) were formed from their precursor gases such as NOx, SO2, and VOCs, which could be emitted from sources such as solid fuel burning and traffic. However, secondary aerosol can be formed locally from corresponding precursor gases or formed over long-range transport.

Figure 5Comparison of the time series of sulfate (SO4), nitrate (NO3), ammonium (NH4), and oxygenated organic aerosol (OOA) at the urban site in Dublin (Du) and the rural site in Carnsore Point (CRP). The light red highlighted periods on 5–6 December 2016 were continental air mass periods, while the light blue highlighted periods on 22–27 December 2016 were marine air mass periods. The back trajectories (BTs) in (b) and (c) were calculated using the Hybrid Single-Particle Lagrangian Integrated Trajectory (HYSPLIT; Stein et al., 2015). The BTs were calculated for an arrival height of 500 m at the length of 72 h. BTs were calculated every 6 h for continental air masses during 5–6 December (b) and every 12 h for marine air masses during 22–27 December (c).
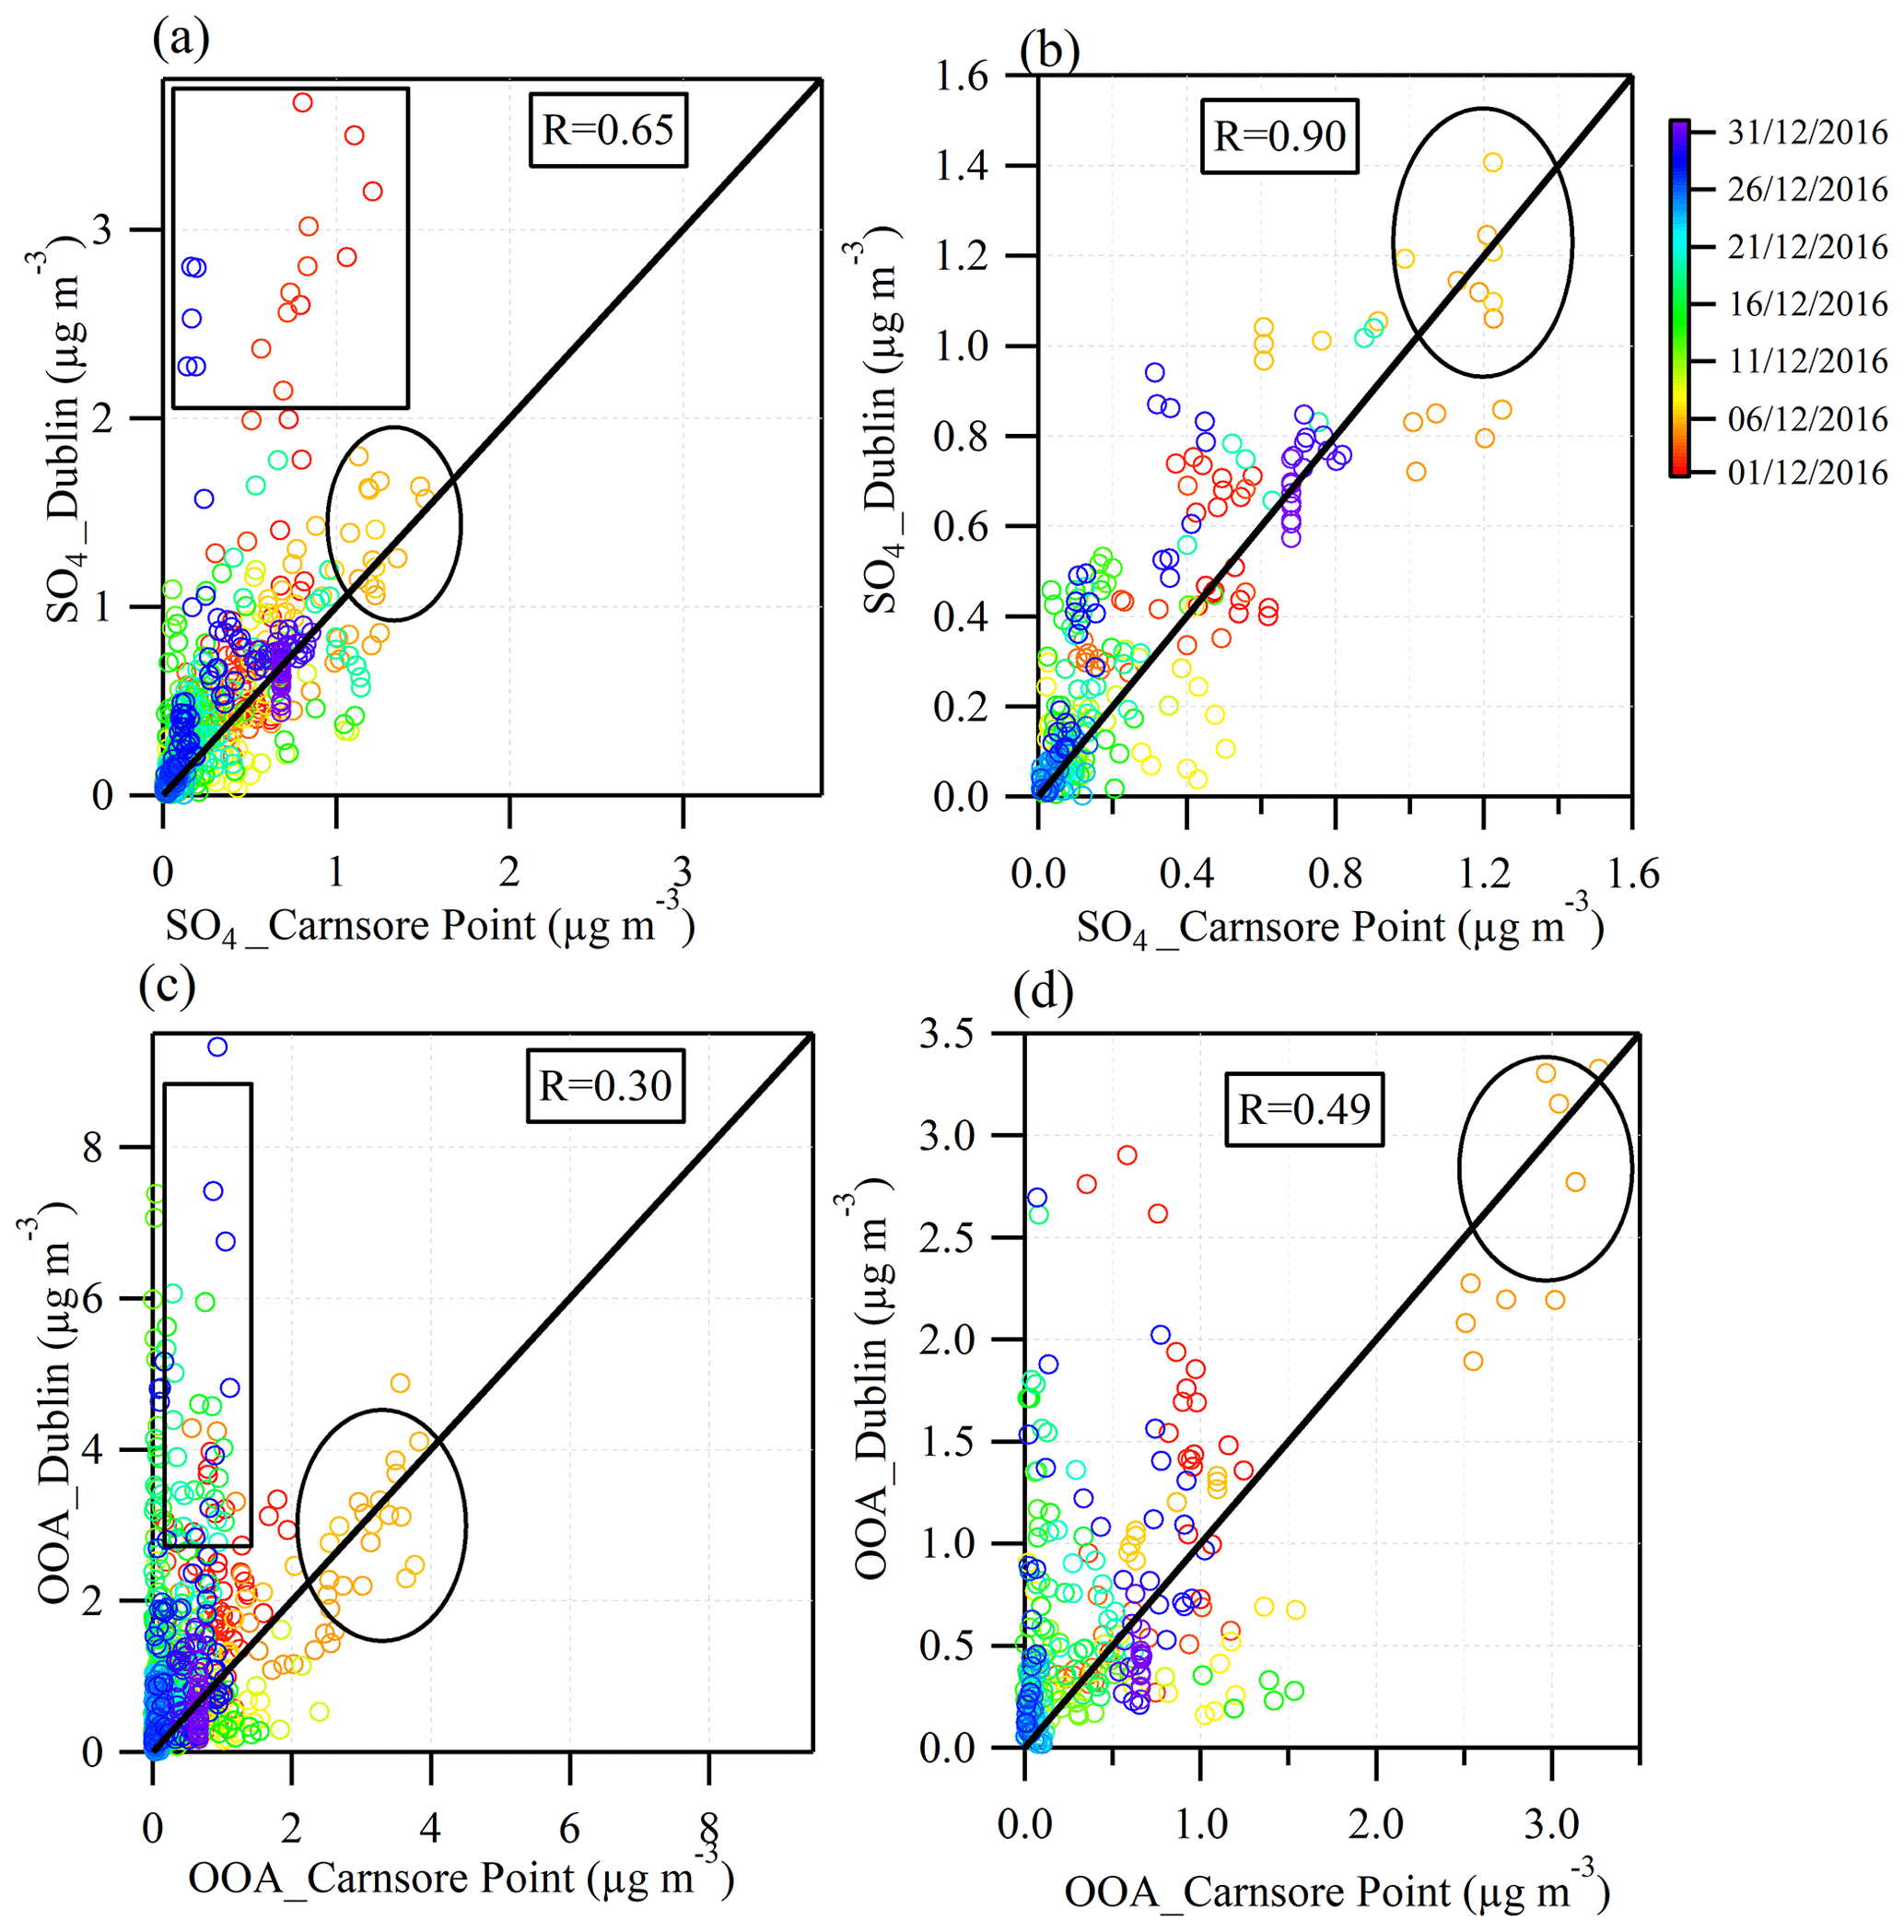
Figure 6Scatter plots to compare sulfate (SO4) and oxygenated organic aerosol (OOA) at the urban site in Dublin (y axis) with the rural site in Carnsore Point (x axis). The rectangle highlights data obtained during periods of local pollution in Dublin. After removing these points, the correlation coefficients increase for sulfate and OOA. The circle highlights points that mark the continental events on 5–6 December 2016.
Figure 5 shows the comparison of sulfate, nitrate, ammonium, and OOA concentration between Dublin and Carnsore Point. Despite the long distance (∼ 150 km) between the two sites, the sulfate time series showed a moderate correlation (R= 0.65), indicating similar sources and/or formation processes (Fig. 6a). However, sulfate also showed some evening spikes (∼ 3 µg m−3; e.g., in the evening on 1, 3, and 29 December) in Dublin, which was not observed at Carnsore Point. The sulfate spikes in Dublin can thus be attributed to local sources. The formation of sulfate through photochemical reaction pathways was not likely in the evening. In contrast, the high RH (85 %–100 %) during evening hours could enhance sulfate formation via aqueous-phase processing (Sun et al., 2013). As shown in Fig. S14, the evening sulfate spikes simultaneously increased with the precursor gas SO2, indicating a common source, likely the burning of peat and/or coal. In our previous fingerprinting experiments, sulfate was detected from the direct measurement of peat and coal combustion emissions using an ACSM (Lin et al., 2017). Sulfur, as organic or inorganic compounds in peat or coal, is oxidized to SO2 when burned. Part of SO2 is further oxidized to SO3 by the atomic oxygen formed in flames at a temperature of ∼ 500 ∘C (Srivastava et al., 2004). The resulting SO3 rapidly reacts with H2O to form H2SO4 at high RH levels. Thereafter, H2SO4 can form NH4SO4 through interaction with ammonia in the gas phase or ammonium in particles. Therefore, the observed spikes of sulfate concentrations in Dublin were likely directly emitted from peat and/or coal burning via fast oxidation of SO2 gas to form particle-phase . After removing the evening spikes, the correlation between sulfate in Dublin and Carnsore Point increased to 0.9 (Fig. 6b) with a slope close to unity, suggesting sulfate was strongly associated with regional transport during the daytime (08:00–16:00, local time).
The time series of nitrate in Dublin also showed some spikes in the evening, likely due to rapid oxidation of the precursor gases NOx emitted from solid fuel burning. The nitrate in Carnsore Point, however, most likely originated from regional transport because of a lack of the local sources of precursor gases of NOx. Similarly, OOA in Dublin also showed spikes in concentration during the evening, which was associated with local formation, likely from the condensation of semi-volatile organic species emitted from heating sources. In contrast, OOA in Carnsore Point was most likely of regional origin due to the lack of local sources of its precursor gases as indicated by a relatively low POA fraction. This was consistent with the poor correlation coefficient (R= 0.3) of OOA between the two sites (Fig. 6c). Even after removing the evening OOA spikes, the correlation of OOA time series between the two sites did not improve significantly (from 0.3 to 0.49) compared to the magnitude for sulfate (Fig. 6c and d). The overall poor correlation of OOA between the two sites indicates the locally produced OOA dominated the secondary organic aerosol (SOA) concentrations in Dublin.
Continental and marine air masses alternately arrived at the measurement sites, bringing aerosols with different composition. As shown in Fig. 5, on 5–6 December 2016, air masses with origins from mainland Europe arrived at the measurement sites. As a result, secondary aerosol such as sulfate, nitrate, ammonium, and OOA concentrations showed a simultaneous increase at the Dublin site and Carnsore Point. For example, nitrate concentration reached a peak of ∼ 6 µg m−3 simultaneously at the two sites. Similarly, OOA concentration peaked at ∼ 4 µg m−3, and sulfate concentration peaked at ∼ 1.5 µg m−3 simultaneously. The temporal covariation in secondary aerosols at the two sites indicates that the outflow of European aerosol had a great impact, covering an area with a radius of at least 150 km. Averaged over this period, the total PM1 concentration was 8.0–9.0 µg m−3 (Table 3) with 75 %–83 % of PM1 being secondary. Among PM1 species, nitrate was the most dominant, accounting, on average, for 29 %–30 % of PM1, followed by OOA, representing 22 %–26 % of PM1.
Table 3Average concentrations of secondary organic aerosol (OOA), primary organic aerosol (POA), sulfate (SO4), nitrate (NO3), ammonium (NH4), chloride (Chl), black carbon (BC), and sea salt (SS), as well as their standard deviation (SD) and relative contribution (%) to the total PM1, during continental air mass events on 5–6 December 2016 and marine air mass events on 22–27 December 2016 at the urban background site of Dublin and the rural site of Carnsore Point.
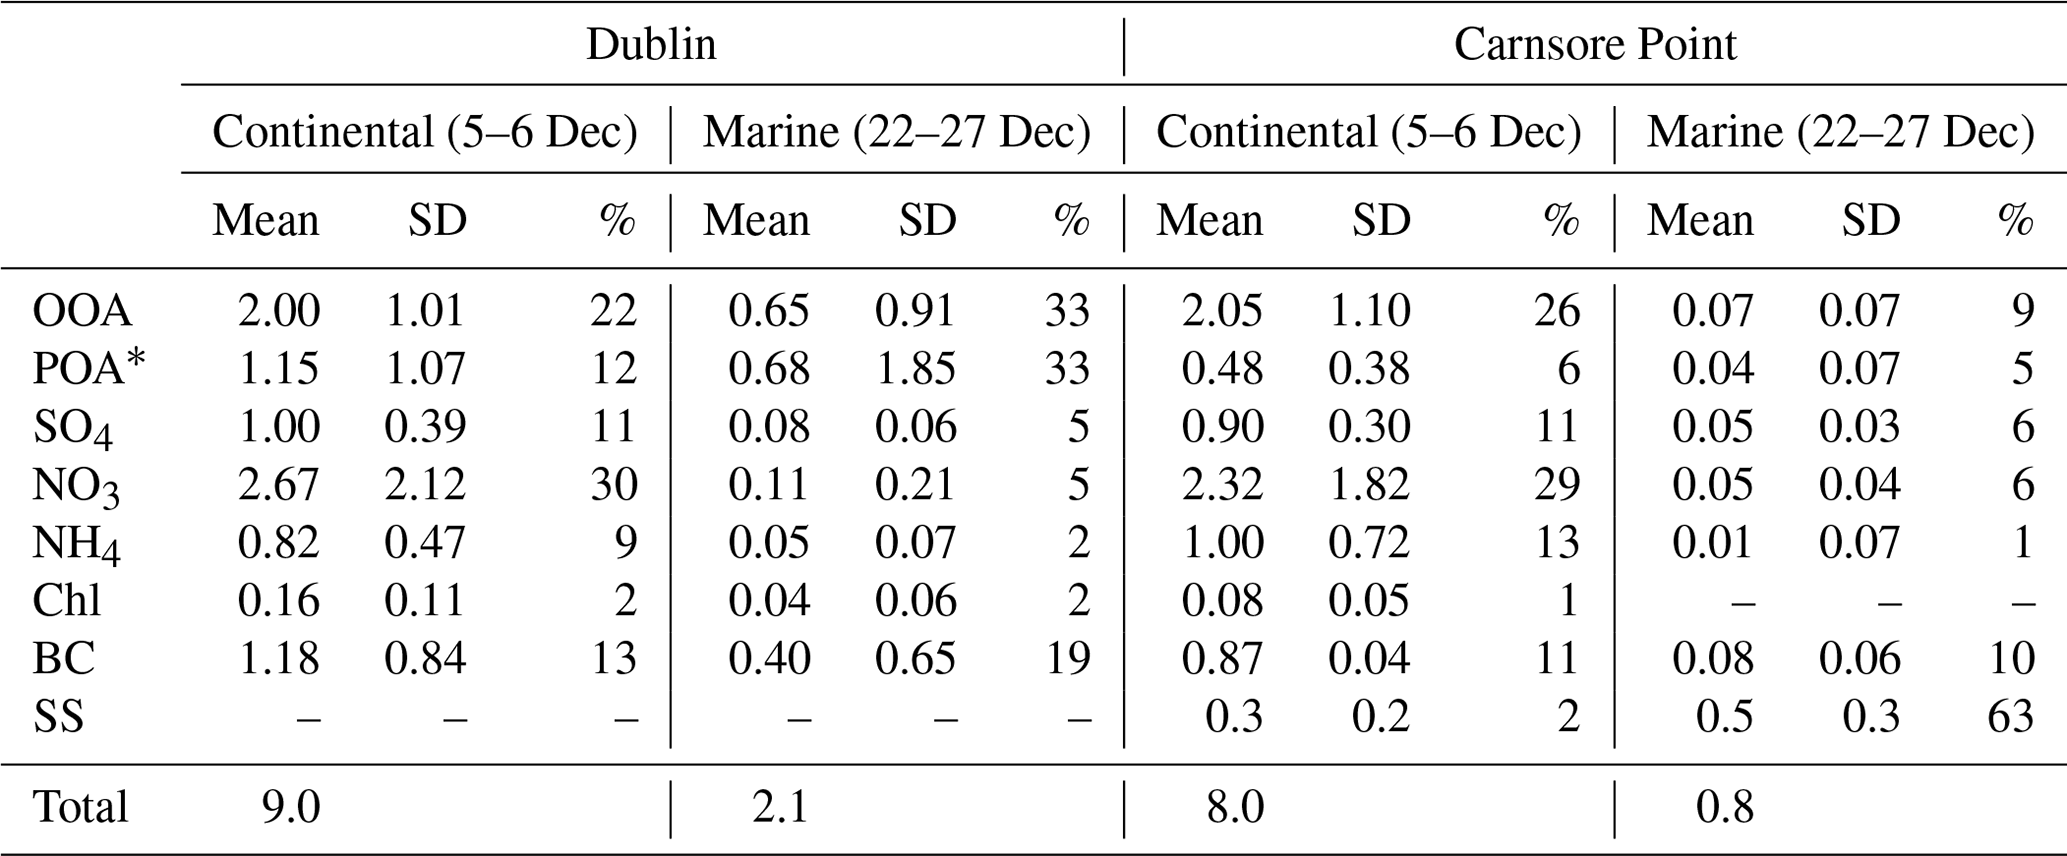
* POA is the sum of HOA, peat, coal, and wood factors.
On 22–27 December 2016, PM1 concentrations were more than 10 times lower than during other periods due to the influence of clean marine air masses (Fig. 5). The average BC concentration was 0.08 µg m−3 and the median BC concentration was 0.06 µg m−3 at Carnsore Point, indicating a very low impact from anthropogenic aerosol sources. However, the BC concentration at the Dublin site was higher than Carnsore Point, with a mean concentration of 0.40 µg m−3 and a median of 0.23 µg m−3. The higher BC concentrations in Dublin are attributed to local emissions. Similarly, other non-sea-salt PM1 species concentrations were higher at the Dublin site than Carnsore Point. For example, the average OOA concentration was 0.07 µg m−3 at Carnsore Point and 0.65 µg m−3 in Dublin. Overall, sea salt dominated the PM1 mass during marine events at Carnsore Point, on average accounting for 65 % of the total PM1. As discussed above, this was due to strong winds (> 8 m s−1) during marine events, which resulted in more sea spray.
3.3 Spatial distribution of and chemical variation in PM1
Dublin was the most polluted area with an average PM1 concentration 2–12 times higher than in the other locations. Birr, a small town in the midlands, was the second most polluted area with an average PM1 concentration about half of that in Dublin. Note that Birr has a population ∼ 200 times smaller than that of Dublin. At the rural coastal sites Carnsore Point and Mace Head, the average PM1 concentration was 4–12 times lower than that in Dublin. However, PM1 spikes due to residential heating emissions from nearby villages were also observed. Overall, the chemical composition of PM1 in Dublin and Birr was very similar, with both locations dominated by carbonaceous aerosol (OA + BC), which accounted for ∼ 80 % of PM1. During the pollution events, the fraction of carbonaceous aerosol increased up to 90 % of PM1. Therefore, reducing carbonaceous aerosol emissions is important to improve air quality in the cities and towns of Ireland. In contrast, the chemical composition of PM1 at Carnsore Point and Mace Head was similar, with inorganic secondary aerosol becoming important and accounting, on average, for 31 %–46 % of PM1.
In agreement with POA being locally emitted rather than regionally transported, urban locations (Dublin and Birr) had higher POA concentrations than the background sites (Mace Head and Carnsore Point). POA, on average, accounted for 65 %–74 % of the total OA in the urban areas while background sites were dominated by OOA, which accounted for 43 %–72 % of OA. Among POA factors, solid-fuel-burning sources were dominant. Consistently, solid fuel contribution was higher in urban areas (48 %–50 % or 1.2–2.2 µg m−3) than the background sites (25 %–39 % or 0.1–0.2 µg m−3) due to proximity to the emission sources. Among these solid fuels, the peat contribution was the most prominent, on average accounting for 16 %–30 % of the total OA (or 0.06–1.3 µg m−3). During the pollution periods, its contribution increased significantly to 32 %–63 % (or 1.3–34.9 µg m−3). These results indicate that, in order to cost-efficiently improve the air quality in urban areas, emissions from solid fuel burning and especially peat burning should be tackled.
The results also show that sulfate, nitrate, ammonium, and OOA could originate from local and regional sources. However, we could not exclusively apportion these components into specific sources (e.g., peat or coal burning). The evening spikes of sulfate, nitrate, ammonium, and OOA with other POA factors suggests a similar local source from residential heating. Therefore, the contribution from solid fuel burning could be higher than solely represented by the POA fraction as discussed above. Although OOA shows a higher average contribution (43 %–71 %) at background sites than in the city or the town (26 %–35 %), the absolute OOA concentration (0.1–0.5 µg m−3) at background sites was considerably lower than that in Dublin and Birr (0.9–1.1 µg m−3). This was due to the contribution of locally formed OOA in urban areas while most of OOA at the background sites was regionally formed and transported. Note that the measurements in Birr and Mace Head were conducted in different years (Birr in 2015 and Mace Head in 2013) than those in Dublin and Carnsore Point (both in 2016). Therefore, the absolute ratios of the PM1 concentrations between these sites in the same year might vary to a certain degree depending on the strengths of emission sources. However, our findings about the dominance of solid fuel burning in urban areas are consistent with previous studies conducted in other Irish cities in different years (e.g., Cork city in 2008–2009, Kourtchev et al., 2011; Dall'Osto et al., 2013, and Galway city in 2015, Lin et al., 2017). Thus, the conclusion from our study still has significant implications for the air quality policies and mitigation strategies in Ireland, as well as for modeling of regional aerosol transport.
An ACSM and AE-33 were deployed to characterize the PM1 mass, chemical composition, and sources during wintertime across Ireland. The results show that Dublin city was the most polluted area. Birr, a midland town with a population less than 1 % of that of Dublin, had PM1 concentrations around half of those in Dublin but with similar chemical composition. The OA source apportionment results show that pollution at urban locations was due to local emissions from residential heating with peat, on average, accounting for 27 %–30 % of the total OA mass and even 49 %–63 % during pollution events. Therefore, in order to reduce wintertime particulate air pollution, primary emissions from solid fuel burning, especially peat, should be the primary target of policy regulations. On the contrary, PM1 at Carnsore Point, a regional background site on the southeast coast of Ireland, was dominated by secondary aerosol, with OOA accounting, on average, for 71 % of OA. Mace Head, another regional background site on the west coast of Ireland, shows a similar chemical composition to that of Carnsore Point, but the PM1 concentration (0.6 µg m−3) was more than 3 times lower due to the longer distance from mainland Europe and greater exposure to the northeast Atlantic Ocean. The simultaneous measurements in Dublin and Carnsore Point proved that secondary aerosol could be of both local and regional origins. The regional transport of mainland European aerosol featured a simultaneous increase in nitrate, sulfate, ammonium, and OOA concentration, the sum of which accounted for 79 %–81 % of PM1, while in marine air masses PM1 concentration was more than 10 times lower. This nationwide source apportionment study identifies specific sources that should be targeted to improve air quality across Ireland and provides significant implications for regional-transport aerosol modeling.
All data needed to evaluate the conclusions in the paper are present in the paper and/or the Supplement. Also, all data used in the study are available from the corresponding author upon request.
The supplement related to this article is available online at: https://doi.org/10.5194/acp-19-14091-2019-supplement.
JO, DC, MR, MCF, JW, RJH, and CO'D conceived and designed the experiments; CL, JO, DC, and PB performed the experiments; CL, RJH, JO, WX, PB, TS, DM, SH, JP, and CO'D analyzed the data; CL prepared the paper with input from all co-authors.
The authors declare that they have no conflict of interest.
This work was supported by EPA Ireland, Department of Communications, Climate Action and Environment (DCCAE), the National Natural Science Foundation of China (NSFC), and the Chinese Scholarship Council (CSC, no. 201506310020). The authors would also like to acknowledge the contribution of the COST Action CA16109 (COLOSSAL) and MaREI, the SFI Research Centre for Energy, Climate and Marine. The team from University College Cork acknowledges support from the Environmental Protection Agency and Department of Environment Community and Local Government in Ireland. The CNR “Joint Laboratories” Air-Sea Lab project is also acknowledged.
This research has been supported by the EPA Ireland AEROSOURCE (grant no. 2016-CCRP-MS-31), the National Natural Science Foundation of China (NSFC) (grant nos. 91644219 and 41877408), the China Scholarship Council (grant no. 201506310020), the COST Action (grant no. CA16109), the SAPPHIRE project (grant no. 2013-EH-MS-15), and the Irish Research Council (grant no. GOIPG/2015/3051).
This paper was edited by Timothy Bertram and reviewed by two anonymous referees.
Alfarra, M. R., Prevot, A. S. H., Szidat, S., Sandradewi, J., Weimer, S., Lanz, V. A., Schreiber, D., Mohr, M., and Baltensperger, U.: Identification of the mass spectral signature of organic aerosols from wood burning emissions, Environ. Sci. Technol., 41, 5770–5777, 2007.
Allan, J. D., Delia, A. E., Coe, H., Bower, K. N., Alfarra, M. R., Jimenez, J. L., Middlebrook, A. M., Drewnick, F., Onasch, T. B., Canagaratna, M. R., Jayne, J. T., and Worsnop, D. R.: A generalised method for the extraction of chemically resolved mass spectra from Aerodyne aerosol mass spectrometer data, J. Aerosol Sci., 35, 909–922, 2004.
Allan, J. D., Williams, P. I., Morgan, W. T., Martin, C. L., Flynn, M. J., Lee, J., Nemitz, E., Phillips, G. J., Gallagher, M. W., and Coe, H.: Contributions from transport, solid fuel burning and cooking to primary organic aerosols in two UK cities, Atmos. Chem. Phys., 10, 647–668, https://doi.org/10.5194/acp-10-647-2010, 2010.
Canagaratna, M. R., Jayne, J. T., Ghertner, D. A., Herndon, S., Shi, Q., Jimenez, J. L., Silva, P. J., Williams, P., Lanni, T., Drewnick, F., Demerjian, K. L., Kolb, C. E., and Worsnop, D. R.: Chase Studies of Particulate Emissions from in-use New York City Vehicles, Aerosol Sci. Tech., 38, 555–573, https://doi.org/10.1080/02786820490465504, 2004.
Canagaratna, M. R., Jayne, J. T., Jimenez, J. L., Allan, J. D., Alfarra, M. R., Zhang, Q., Onasch, T. B., Drewnick, F., Coe, H., Middlebrook, A., Delia, A., Williams, L. R., Trimborn, A. M., Northway, M. J., DeCarlo, P. F., Kolb, C. E., Davidovits, P., and Worsnop, D. R.: Chemical and microphysical characterization of ambient aerosols with the Aerodyne aerosol mass spectrometer, Mass Spectrom. Rev., 26, 185–222, https://doi.org/10.1002/mas.20115, 2007.
Canonaco, F., Crippa, M., Slowik, J. G., Baltensperger, U., and Prévôt, A. S. H.: SoFi, an IGOR-based interface for the efficient use of the generalized multilinear engine (ME-2) for the source apportionment: ME-2 application to aerosol mass spectrometer data, Atmos. Meas. Tech., 6, 3649–3661, https://doi.org/10.5194/amt-6-3649-2013, 2013.
Charlson, R. J., Schwartz, S., Hales, J., Cess, R. D., Coakley, J. J., Hansen, J., and Hofmann, D.: Climate forcing by anthropogenic aerosols, Science, 255, 423–430, 1992.
Clancy, L., Goodman, P., Sinclair, H., and Dockery, D. W.: Effect of air-pollution control on death rates in Dublin, Ireland: an intervention study, The Lancet, 360, 1210–1214, 2002.
Crippa, M., DeCarlo, P. F., Slowik, J. G., Mohr, C., Heringa, M. F., Chirico, R., Poulain, L., Freutel, F., Sciare, J., Cozic, J., Di Marco, C. F., Elsasser, M., Nicolas, J. B., Marchand, N., Abidi, E., Wiedensohler, A., Drewnick, F., Schneider, J., Borrmann, S., Nemitz, E., Zimmermann, R., Jaffrezo, J.-L., Prévôt, A. S. H., and Baltensperger, U.: Wintertime aerosol chemical composition and source apportionment of the organic fraction in the metropolitan area of Paris, Atmos. Chem. Phys., 13, 961–981, https://doi.org/10.5194/acp-13-961-2013, 2013.
Crippa, M., Canonaco, F., Lanz, V. A., Äijälä, M., Allan, J. D., Carbone, S., Capes, G., Ceburnis, D., Dall'Osto, M., Day, D. A., DeCarlo, P. F., Ehn, M., Eriksson, A., Freney, E., Hildebrandt Ruiz, L., Hillamo, R., Jimenez, J. L., Junninen, H., Kiendler-Scharr, A., Kortelainen, A.-M., Kulmala, M., Laaksonen, A., Mensah, A. A., Mohr, C., Nemitz, E., O'Dowd, C., Ovadnevaite, J., Pandis, S. N., Petäjä, T., Poulain, L., Saarikoski, S., Sellegri, K., Swietlicki, E., Tiitta, P., Worsnop, D. R., Baltensperger, U., and Prévôt, A. S. H.: Organic aerosol components derived from 25 AMS data sets across Europe using a consistent ME-2 based source apportionment approach, Atmos. Chem. Phys., 14, 6159–6176, https://doi.org/10.5194/acp-14-6159-2014, 2014.
CSO: Central Statistics Office, Private Households in Permanent Housing Units, available at: https://www.cso.ie (last access: October 2019), 2016.
Cubison, M. J., Ortega, A. M., Hayes, P. L., Farmer, D. K., Day, D., Lechner, M. J., Brune, W. H., Apel, E., Diskin, G. S., Fisher, J. A., Fuelberg, H. E., Hecobian, A., Knapp, D. J., Mikoviny, T., Riemer, D., Sachse, G. W., Sessions, W., Weber, R. J., Weinheimer, A. J., Wisthaler, A., and Jimenez, J. L.: Effects of aging on organic aerosol from open biomass burning smoke in aircraft and laboratory studies, Atmos. Chem. Phys., 11, 12049–12064, https://doi.org/10.5194/acp-11-12049-2011, 2011.
Dall'Osto, M., Ovadnevaite, J., Ceburnis, D., Martin, D., Healy, R. M., O'Connor, I. P., Kourtchev, I., Sodeau, J. R., Wenger, J. C., and O'Dowd, C.: Characterization of urban aerosol in Cork city (Ireland) using aerosol mass spectrometry, Atmos. Chem. Phys., 13, 4997–5015, https://doi.org/10.5194/acp-13-4997-2013, 2013.
DeWitt, H. L., Hellebust, S., Temime-Roussel, B., Ravier, S., Polo, L., Jacob, V., Buisson, C., Charron, A., André, M., Pasquier, A., Besombes, J. L., Jaffrezo, J. L., Wortham, H., and Marchand, N.: Near-highway aerosol and gas-phase measurements in a high-diesel environment, Atmos. Chem. Phys., 15, 4373–4387, https://doi.org/10.5194/acp-15-4373-2015, 2015.
Drinovec, L., Močnik, G., Zotter, P., Prévôt, A. S. H., Ruckstuhl, C., Coz, E., Rupakheti, M., Sciare, J., Müller, T., Wiedensohler, A., and Hansen, A. D. A.: The ”dual-spot” Aethalometer: an improved measurement of aerosol black carbon with real-time loading compensation, Atmos. Meas. Tech., 8, 1965–1979, https://doi.org/10.5194/amt-8-1965-2015, 2015.
Fuzzi, S., Baltensperger, U., Carslaw, K., Decesari, S., Denier van der Gon, H., Facchini, M. C., Fowler, D., Koren, I., Langford, B., Lohmann, U., Nemitz, E., Pandis, S., Riipinen, I., Rudich, Y., Schaap, M., Slowik, J. G., Spracklen, D. V., Vignati, E., Wild, M., Williams, M., and Gilardoni, S.: Particulate matter, air quality and climate: lessons learned and future needs, Atmos. Chem. Phys., 15, 8217–8299, https://doi.org/10.5194/acp-15-8217-2015, 2015.
Goodman, P. G., Rich, D. Q., Zeka, A., Clancy, L., and Dockery, D. W.: Effect of air pollution controls on black smoke and sulfur dioxide concentrations across Ireland, J. Air Waste Manag. Assoc., 59, 207–213, 2009.
Hallquist, M., Wenger, J. C., Baltensperger, U., Rudich, Y., Simpson, D., Claeys, M., Dommen, J., Donahue, N. M., George, C., Goldstein, A. H., Hamilton, J. F., Herrmann, H., Hoffmann, T., Iinuma, Y., Jang, M., Jenkin, M. E., Jimenez, J. L., Kiendler-Scharr, A., Maenhaut, W., McFiggans, G., Mentel, Th. F., Monod, A., Prévôt, A. S. H., Seinfeld, J. H., Surratt, J. D., Szmigielski, R., and Wildt, J.: The formation, properties and impact of secondary organic aerosol: current and emerging issues, Atmos. Chem. Phys., 9, 5155–5236, https://doi.org/10.5194/acp-9-5155-2009, 2009.
Jennings, S. G., Kleefeld, C., O Dowd, C. D., Junker, C., Spain, T. G., O Brien, P., Roddy, A. F., and O'Connor, T. C.: Mace Head Atmospheric Research Station-characterization of aerosol radiative parameters, Boreal Environ. Res., 8, 303–314, 2003.
Kelly, I. and Clancy, L.: Mortality in a general hospital and urban air pollution, Irish Med. J., 77, 322–324, 1984.
Kourtchev, I., Hellebust, S., Bell, J. M., O'Connor, I. P., Healy, R. M., Allanic, A., Healy, D., Wenger, J. C., and Sodeau, J. R.: The use of polar organic compounds to estimate the contribution of domestic solid fuel combustion and biogenic sources to ambient levels of organic carbon and PM2.5 in Cork Harbour, Ireland, Sci. Total Environ., 409, 2143–2155, 10.1016/j.scitotenv.2011.02.027, 2011.
Lanz, V. A., Alfarra, M. R., Baltensperger, U., Buchmann, B., Hueglin, C., Szidat, S., Wehrli, M. N., Wacker, L., Weimer, S., Caseiro, A., Puxbaum, H., and Prevot, A. S. H.: Source attribution of submicron organic aerosols during wintertime inversions by advanced factor analysis of aerosol mass spectra, Environ. Sci. Technol., 42, 214–220, 2008.
Lin, C., Ceburnis, D., Hellebust, S., Buckley, P., Wenger, J., Canonaco, F., Prévôt, A. S. H., Huang, R.-J., O'Dowd, C., and Ovadnevaite, J.: Characterization of primary organic aerosol from domestic wood, peat, and coal burning in Ireland, Environ. Sci. Technol., 51, 10624–10632, 2017.
Lin, C., Huang, R.-J., Ceburnis, D., Buckley, P., Preissler, J., Wenger, J., Rinaldi, M., Facchini, M. C., O'Dowd, C., and Ovadnevaite, J.: Extreme air pollution from residential solid fuel burning, Nature Sustain., 1, 512–517, 2018.
Lin, C., Ceburnis, D., Huang, R.-J., Xu, W., Buckley, P., Wenger, J., Gallagher, J., O'Dowd, C., and Ovadnevaite, J.: The impact of traffic on air quality in Ireland: insights from simultaneous curbside and sub-urban monitoring of sub-micron aerosols, in preparation, 2019.
Ng, N. L., Canagaratna, M. R., Jimenez, J. L., Zhang, Q., Ulbrich, I. M., and Worsnop, D. R.: Real-time methods for estimating organic component mass concentrations from aerosol mass spectrometer data, Environ. Sci. Technol., 45, 910–916, 2011.
O'Dowd, C. D., Facchini, M. C., Cavalli, F., Ceburnis, D., Mircea, M., Decesari, S., Fuzzi, S., Yoon, Y. J., and Putaud, J.-P.: Biogenically driven organic contribution to marine aerosol, Nature, 431, 676–680, 2004.
Ovadnevaite, J., Ceburnis, D., Canagaratna, M., Berresheim, H., Bialek, J., Martucci, G., Worsnop, D. R., and O'Dowd, C.: On the effect of wind speed on submicron sea salt mass concentrations and source fluxes, J. Geophys. Res. Atmos., 117, D16201, https://doi.org/10.1029/2011JD017379, 2012.
Paatero, P. and Tapper, U.: Positive matrix factorization: A non-negative factor model with optimal utilization of error estimates of data values, Environmetrics, 5, 111–126, https://doi.org/10.1002/env.3170050203, 1994.
Platt, S. M., El Haddad, I., Pieber, S. M., Zardini, A. A., Suarez-Bertoa, R., Clairotte, M., Daellenbach, K. R., Huang, R. J., Slowik, J. G., Hellebust, S., Temime-Roussel, B., Marchand, N., de Gouw, J., Jimenez, J. L., Hayes, P. L., Robinson, A. L., Baltensperger, U., Astorga, C., and Prévôt, A. S. H.: Gasoline cars produce more carbonaceous particulate matter than modern filter-equipped diesel cars, Sci. Rep., 7, 4926, https://doi.org/10.1038/s41598-017-03714-9, 2017.
Pope III, C. A. and Dockery, D. W.: Health effects of fine particulate air pollution: lines that connect, J. Air Waste Manag. Assoc., 56, 709–742, 2006.
Pope III, C. A., Burnett, R. T., Thun, M. J., Calle, E. E., Krewski, D., Ito, K., and Thurston, G. D.: Lung cancer, cardiopulmonary mortality, and long-term exposure to fine particulate air pollution, Jama, 287, 1132–1141, 2002.
Reyes-Villegas, E., Green, D. C., Priestman, M., Canonaco, F., Coe, H., Prévôt, A. S. H., and Allan, J. D.: Organic aerosol source apportionment in London 2013 with ME-2: exploring the solution space with annual and seasonal analysis, Atmos. Chem. Phys., 16, 15545–15559, https://doi.org/10.5194/acp-16-15545-2016, 2016.
Sandradewi, J., Prévôt, A. S. H., Szidat, S., Perron, N., Alfarra, M. R., Lanz, V. A., Weingartner, E., and Baltensperger, U.: Using aerosol light absorption measurements for the quantitative determination of wood burning and traffic emission contributions to particulate matter, Environ. Sci. Technol., 42, 3316–3323, 2008.
Sandström, T., Nowak, D., and van Bree, L.: Health effects of coarse particles in ambient air: messages for research and decision-making, Eur. Respir. J., 26, 187–188, 2005.
Schneider, J., Hock, N., Weimer, S., Borrmann, S., Kirchner, U., Vogt, R., and Scheer, V.: Nucleation particles in diesel exhaust: Composition inferred from in situ mass spectrometric analysis, Environ. Sci. Technol., 39, 6153–6161, 10.1021/es049427m, 2005.
Srivastava, R. K., Miller, C. A., Erickson, C., and Jambhekar, R.: Emissions of Sulfur Trioxide from Coal-Fired Power Plants, J. Air Waste Manag. Assoc., 54, 750–762, https://doi.org/10.1080/10473289.2004.10470943, 2004.
Stein, A. F., Draxler, R. R., Rolph, G. D., Stunder, B. J. B., Cohen, M. D., and Ngan, F.: NOAA's HYSPLIT Atmospheric Transport and Dispersion Modeling System, B. Am. Meteor. Soc., 96, 2059–2077, https://doi.org/10.1175/bams-d-14-00110.1, 2015.
Sun, Y., Wang, Z., Fu, P., Jiang, Q., Yang, T., Li, J., and Ge, X.: The impact of relative humidity on aerosol composition and evolution processes during wintertime in Beijing, China, Atmos. Environ., 77, 927–934, https://doi.org/10.1016/j.atmosenv.2013.06.019, 2013.
Tiitta, P., Leskinen, A., Hao, L., Yli-Pirilä, P., Kortelainen, M., Grigonyte, J., Tissari, J., Lamberg, H., Hartikainen, A., Kuuspalo, K., Kortelainen, A.-M., Virtanen, A., Lehtinen, K. E. J., Komppula, M., Pieber, S., Prévôt, A. S. H., Onasch, T. B., Worsnop, D. R., Czech, H., Zimmermann, R., Jokiniemi, J., and Sippula, O.: Transformation of logwood combustion emissions in a smog chamber: formation of secondary organic aerosol and changes in the primary organic aerosol upon daytime and nighttime aging, Atmos. Chem. Phys., 16, 13251–13269, https://doi.org/10.5194/acp-16-13251-2016, 2016.
Zhang, Y., Schauer, J. J., Zhang, Y., Zeng, L., Wei, Y., Liu, Y., and Shao, M.: Characteristics of Particulate Carbon Emissions from Real-World Chinese Coal Combustion, Environ. Sci. Technol., 42, 5068–5073, https://doi.org/10.1021/es7022576, 2008.
Zotter, P., Herich, H., Gysel, M., El-Haddad, I., Zhang, Y., Močnik, G., Hüglin, C., Baltensperger, U., Szidat, S., and Prévôt, A. S. H.: Evaluation of the absorption Ångström exponents for traffic and wood burning in the Aethalometer-based source apportionment using radiocarbon measurements of ambient aerosol, Atmos. Chem. Phys., 17, 4229–4249, https://doi.org/10.5194/acp-17-4229-2017, 2017.