the Creative Commons Attribution 4.0 License.
the Creative Commons Attribution 4.0 License.
 | 19 Nov 2019
Estimation of NOx and SO2 emissions from Sarnia, Ontario, using a mobile MAX-DOAS (Multi-AXis Differential Optical Absorption Spectroscopy) and a NOx analyzer
Zoe Y. W. Davis
Sabour Baray
Chris A. McLinden
Aida Khanbabakhani
William Fujs
Csilla Csukat
Jerzy Debosz
Sarnia, Ontario, experiences pollutant emissions disproportionate to its relatively small size. The small size of the city limits traditional top-down emission estimate techniques (e.g., satellite) but a low-cost solution for emission monitoring is the mobile MAX-DOAS (Multi-AXis Differential Optical Absorption Spectroscopy). Measurements were made using this technique from 21 March 2017 to 23 March 2017 along various driving routes to retrieve vertical column densities (VCDs) of NO2 and SO2 and to estimate emissions of NOx and SO2 from the Sarnia region. A novel aspect of the current study was the installation of a NOx analyzer in the vehicle to allow real time measurement and characterization of near-surface NOx∕NO2 ratios across the urban plumes, allowing improved accuracy of NOx emission estimates. Confidence in the use of near-surface-measured NOx∕NO2 ratios for estimation of NOx emissions was increased by relatively well-mixed boundary layer conditions. These conditions were indicated by similar temporal trends in NO2 VCDs and mixing ratios when measurements were sufficiently distant from the sources. Leighton ratios within transported plumes indicated peroxy radicals were likely disturbing the NO–NO2–O3 photostationary state through VOC (volatile organic compound) oxidation. The average lower-limit emission estimate of NOx from Sarnia was 1.60±0.34 t h−1 using local 10 m elevation wind-speed measurements. Our estimates were larger than the downscaled annual 2017 NPRI-reported (National Pollution Release Inventory) industrial emissions of 0.9 t NOx h−1. Our lower-limit estimate of SO2 emissions from Sarnia was 1.81±0.83 t SO2 h−1, equal within uncertainty to the 2017 NPRI downscaled value of 1.85 t SO2 h−1. Satellite-derived NO2 VCDs over Sarnia from the ozone monitoring instrument (OMI) were lower than mobile MAX-DOAS VCDs, likely due to the large pixel size relative to the city's size. The results of this study support the utility of the mobile MAX-DOAS method for estimating NOx and SO2 emissions in relatively small, highly industrialized regions, especially when supplemented with mobile NOx measurements.
- Article
(27054 KB) - Full-text XML
-
Supplement
(1344 KB) - BibTeX
- EndNote


Differential optical absorption spectroscopy (DOAS) is a remote sensing technique that quantifies tropospheric trace gases using light spectra and the unique spectral absorption cross sections of trace gases. DOAS has been used since its introduction by Platt et al. (1979) to measure small molecular species including NO2, SO2, OH, BrO, NO3, NH3, ClO, and others. One advantage of the technique is the potential for simultaneous quantification of multiple trace gases (e.g., SO2 and NO2) (Platt et al., 2008). The Multi-AXis DOAS (MAX-DOAS) method allows for sensitive quantification of tropospheric pollutants by measuring scattered sunlight spectra at multiple viewing directions and/or elevation angles. Spectra measured at elevation angles close to horizon-pointing angles have high sensitivity to ground-level gases since the light paths are longer near the surface (Hönninger et al., 2004). Ground-based MAX-DOAS measurements quantify total boundary layer pollution loading by determining tropospheric vertical column densities (VCDs) of trace gases. These measurements are, therefore, well suited to measuring total emissions into an air mass. VCDs are independent of boundary layer height, unlike mixing ratios, and are spatially averaged (horizontally and vertically) on the order of a few kilometres along the light path. Ground-based MAX-DOAS can also retrieve vertical profiles of aerosol extinction and trace gases by combining MAX-DOAS data with radiative transfer modelling (Friess et al., 2006; Heckel et al., 2005; Hönninger et al., 2004; Honninger and Platt, 2002; Irie et al., 2008; Wagner et al., 2004, 2011).
The recently developed mobile MAX-DOAS technique allows for measurement of trace-gas emissions from a region of interest by driving the instrument around the region. The method can estimate emissions on a nearly hourly basis in a region with a spatial resolution of ∼1 km. Mobile MAX-DOAS has been used to estimate NOx emissions from shipping and industrial areas (Rivera et al., 2010), power plants (Wu et al., 2017), and cities (Ibrahim et al., 2010; Shaiganfar et al., 2011, 2017); validate satellite and air quality modelled VCDs (Dragomir et al., 2015; Shaiganfar et al., 2015); estimate surface NO2 mixing ratios from NO2 VCDs (Shaiganfar et al., 2011); and determine the horizontal variability in trace-gas VCDs within satellite pixels (Wagner et al., 2010). Mobile MAX-DOAS is a top-down approach for quantifying real-world emissions that can be used to validate bottom-up emission inventories (Shaiganfar et al., 2011).
Sarnia, Ontario, a small Canadian city, experiences pollutant emissions due to a large number of industrial chemical- and oil-processing facilities; vehicular exhaust from the Canada-USA international border crossing; emissions from large ships travelling through the St Clair River; vehicular traffic; residential heating and other anthropogenic emissions from the city populace; and transnational air pollution from Ohio, Illinois, and Michigan (Oiamo et al., 2011). These sources contribute to increased levels of air pollutants such as NOx, VOCs (volatile organic compounds), and SO2, which are precursors of PM2.5 and O3 (Ministry of the Environment and Climate Change, 2015). Traditional top-down methods for quantifying pollutant emissions from small cities (e.g., satellite monitoring, aircraft studies) are limited by the small footprint. Additionally, in situ air quality monitoring stations are limited by the bias towards near-surface emissions and undersampling of elevated emissions (Tokarek et al., 2018).
The mobile MAX-DOAS method has advantages over satellite, aircraft, and in situ techniques. Major advantages over satellite techniques include (1) the fact that emissions can be estimated without the need for an a priori vertical profile, (2) accuracy of estimates can increase rather than decrease for smaller source regions, and (3) emissions may be estimated many times per day. Satellite retrievals are useful for estimating top-down emissions on regional and global scales over long periods of time (Huang et al., 2014; Kim et al., 2014; Liu et al., 2016; McLinden et al., 2012). However, accuracy over small regions can be limited by insufficient pixel resolution due to horizontal averaging and retrieval reliance on modelled a priori vertical profiles that may not resolve small regions (Heckel et al., 2011). Aircraft studies can quantify emissions from cities but are relatively expensive. The major advantage of emissions estimates using aircraft measurements is that one can in principle fully characterize the vertical profile of trace-gas concentration as well as the vertical profile of wind vectors for an accurate horizontal flux measurement downwind of a source (Baray et al., 2018; Gordon et al., 2015). Major advantages of the mobile MAX-DOAS method over aircraft techniques are that (1) MAX-DOAS VCDs are already vertically integrated, reducing the uncertainties due to interpolation of measurements at multiple flight altitudes and (2) MAX-DOAS studies are logistically easier to conduct. However, one is still left with the uncertainty in the vertical profile of wind vector fields. The mobile MAX-DOAS technique is a solution for quantifying pollutant emissions that complements the aforementioned techniques as well as in situ monitoring through the ability to observe localized surface-based and elevated emissions.
An uncertainty associated with MAX-DOAS and satellite methods when estimating NOx emissions from NO2 measurements is the assumptions concerning the NOx∕NO2 relationship in the air mass, which can be variable both spatially and temporally. The NOx∕NO2 ratio is often assumed to be spatially constant, taken from literature based on the season, estimated using atmospheric modelling, or occasionally taken from aircraft measurements when available (Rivera et al., 2010). In this study, we combined the mobile MAX-DOAS method with simultaneous mobile NOx measurements (NO, NO2, NOx) to increase knowledge of the NOx∕NO2 ratio in the air mass spatially and temporally in order to improve the accuracy of the NOx emission estimates obtained from NO2 measurements. A stationary modular meteorological station was deployed in the airshed and provided auxiliary meteorological information, typically a major source of uncertainty in mobile MAX-DOAS emission estimations. Hourly wind data measured at 10 m elevation above ground level (a.g.l.) were also available from local, permanent monitoring stations. Vertical wind profiles were modelled in high resolution (1 km×1 km) using version 3.9.1 of the Weather Research and Forecasting model (WRF) centered on Sarnia (42.9745∘ N, 82.4066∘ W) in an attempt to improve upon emissions values calculated using near-surface wind speed, since wind speeds are expected to increase with altitude. However, intercomparison of WRF modelled winds with measured near-surface winds during the study period indicated poor model performance (see the Supplement S2.2 for detailed results). Emissions in this study were therefore calculated using the 10 m measured winds to provide lower-limit estimates of the hourly emissions.
Our study objectives were to (1) examine the relationship between the NO2 near-ground mixing ratios and the NO2 tropospheric VCDs, (2) determine NOx and SO2 emissions from the city of Sarnia including industrial sources, (3) determine the impact of NOx∕NO2 variability on the accuracy of NOx emission estimates, and (4) examine ozone monitoring instrument (OMI) satellite intrapixel NO2 homogeneity. This study aims to demonstrate the utility of this method for determining trace-gas emissions and monitoring pollutant transportation in Sarnia and similar urban and industrial areas.
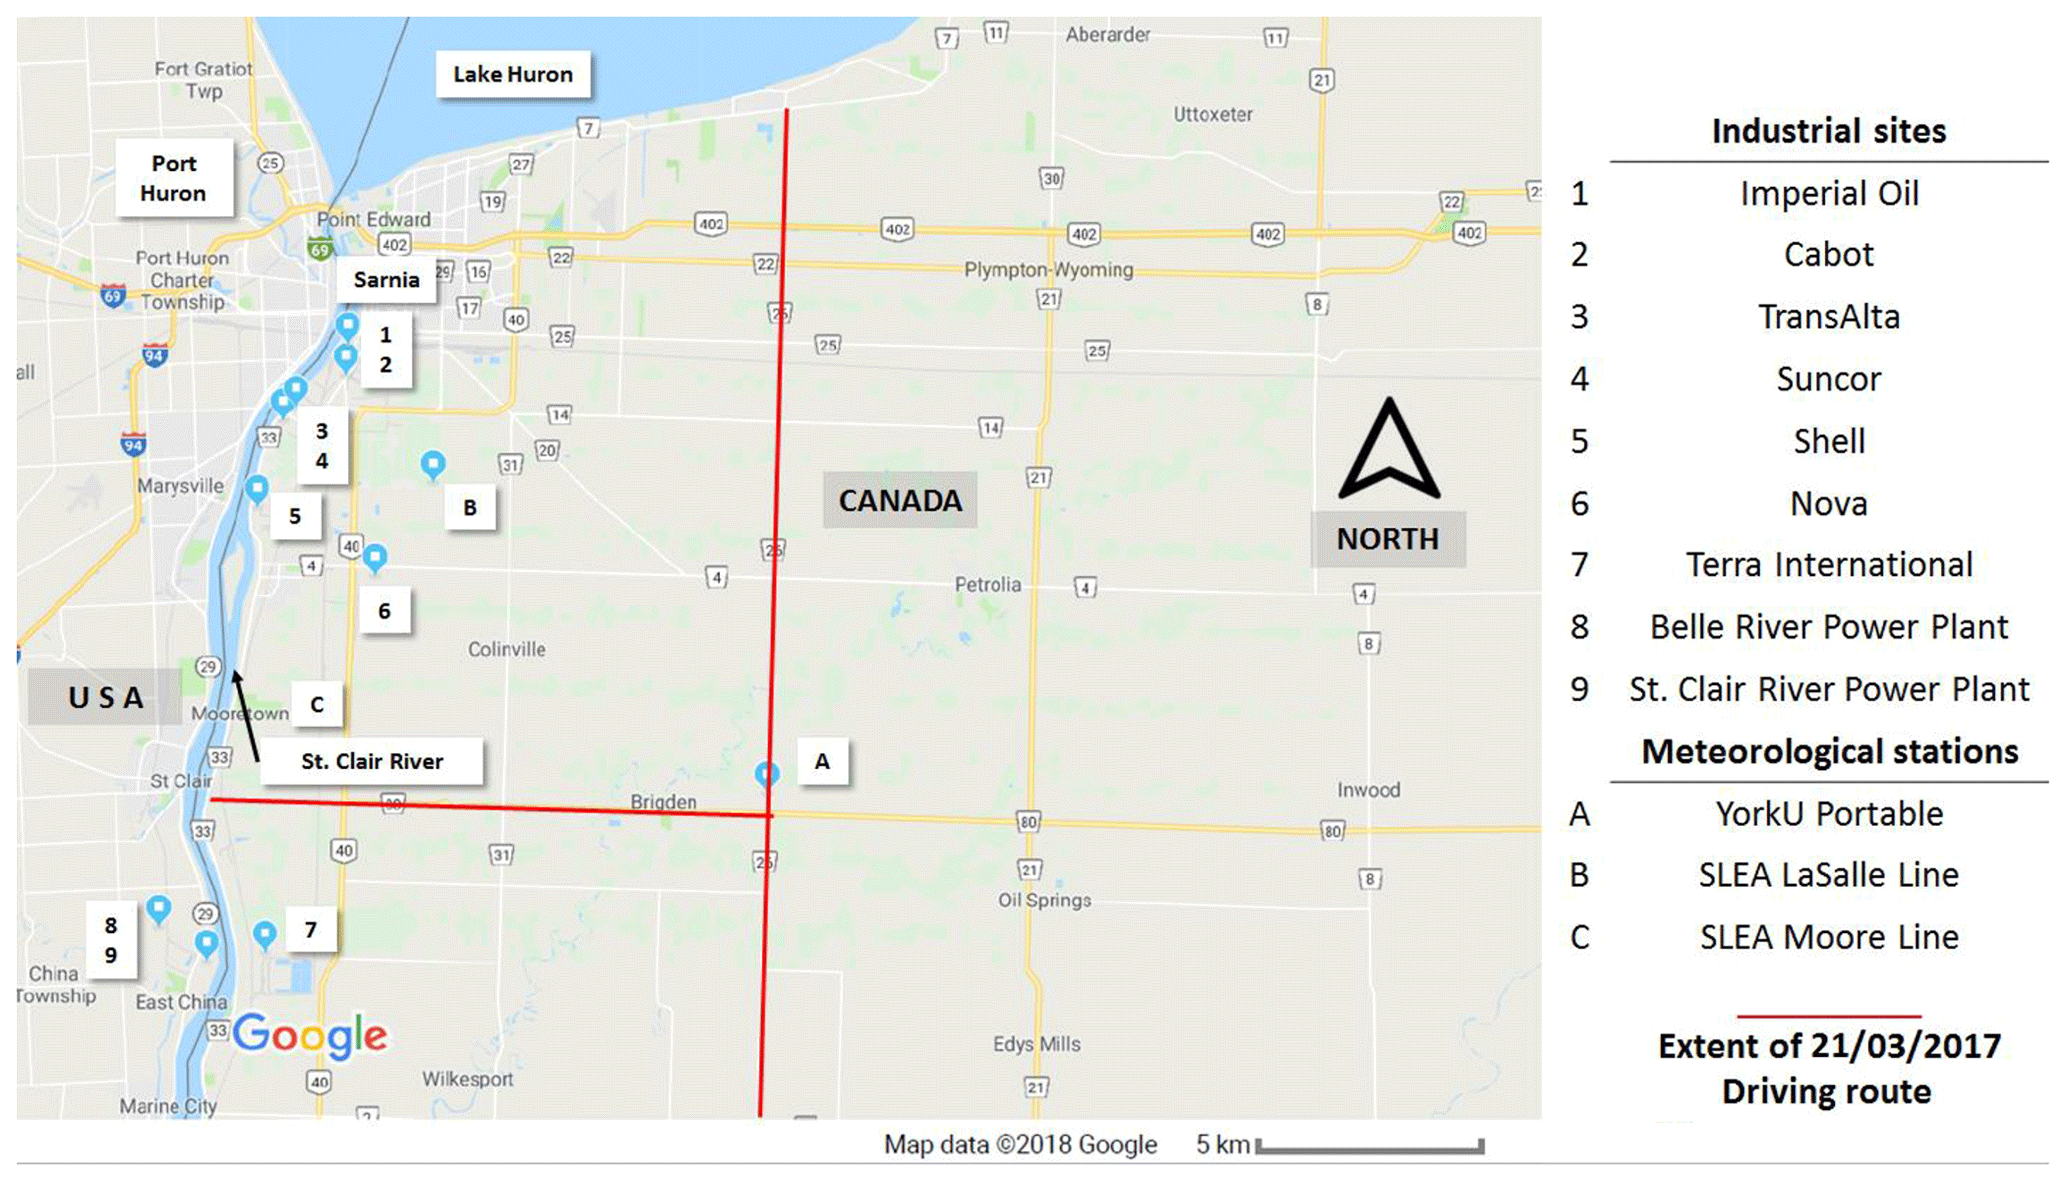
Figure 1Location of industrial NOx and SO2 emission sources and meteorological stations in the Sarnia area.
2.1 Location and instruments
Measurements were conducted in and around the city of Sarnia (42.9745∘ N, 82.4066∘ W), located in southwestern Ontario, Canada, at the border with Port Huron, MI, USA (Fig. 1). The routes driven (Table 1) in the vehicle aimed to capture major NOx and SO2 emission sources at different distances downwind, dependent on the prevailing wind conditions. The metro area has a population of ∼72 000 (2016 census) and an area of ∼165 km2. Sources of air pollution in this region include emissions from large ships, anthropogenic emissions from the cities of Sarnia and Port Huron, transport from the cities of Windsor and Detroit (60 km SW), the St Clair and Belle River power plants (20 km SSW), oil refineries and chemical industry in Sarnia, and the cross-border traffic between Canada and the USA along Highway 402. Emissions from ships along the St. Clair River, normally a major source, were absent during the time of our study since the canal had not opened for the season.
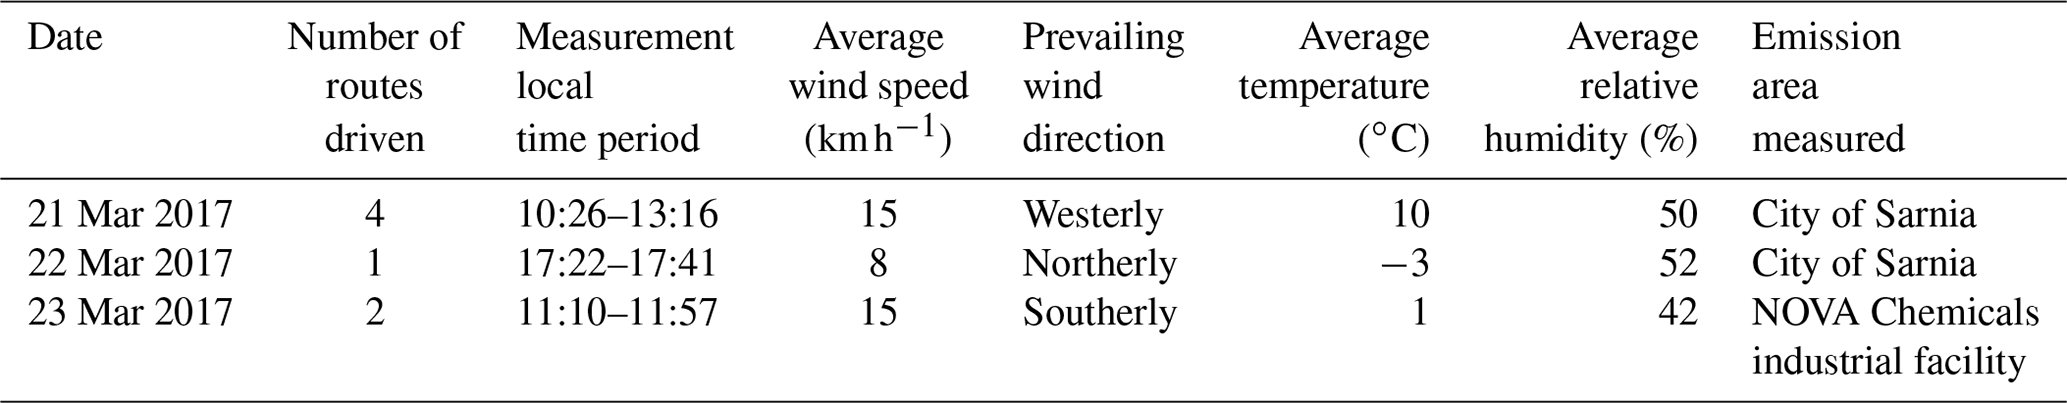
Table 1Daily meteorological conditions, number of routes, and time period of routes driven. Wind speed from SLEA LaSalle Road; temperature and relative humidity from portable meteorological station Day 1 and Day 2 and from Moore Line station Day 2.
A mini-MAX-DOAS instrument (Hoffmann Messtechnik GmbH) measured scattered sunlight spectra during 3 d: 21 March 2017 to 23 March 2017 (“Days 1 to 3”) while mounted on top of a car in a backwards-pointing direction. The instrument has a sealed metal box containing entrance optics, UV fibre coupled with a spectrometer, and electronics. Incident light is focused on a cylindrical quartz lens (focal length =40 mm) into a quartz fibre optic that transmits light into the spectrometer (Ocean Optics USB2000) with a field of view of approximately 0.6∘. The spectrometer has a spectral range of 290–433 nm and a 50 µm wide entrance slit, yielding a spectral resolution of ∼0.6 nm. The spectrometer is cooled and stabilized by a Peltier cooler. Spectrometer data were transferred to a laptop computer via USB cable. Spectra were obtained with an integration time of ∼1 min with the continuously repeating sequence of viewing elevation angles (30, 30, 30, 30, 40, 90∘). The vehicle was driven at a low but safe target speed of 50 km h−1 when possible to provide a spatial resolution of ∼1 km, but speeds were occasionally up to 80 km h−1 when necessary. Tropospheric VCDs were estimated from the 30 and 40∘ elevation angle spectra. The 40∘ spectra allow for verification that aerosol levels were sufficiently low to determine VCDs without radiative transfer modelling since VCDs obtained from both angles should be equal within ±15 % under low to moderate aerosol loading conditions (Wagner et al., 2010). The cool temperatures in March aided in this as secondary organic aerosol loading tends to be low in this season due to an absence of biogenic emissions.
A model 42 chemiluminescence NO–NO2–NOx analyzer (Thermo Environmental Instruments Inc.) mounted in the vehicle measured NO, NO2, and NOx (NO+NO2) near-surface mixing ratios. A PTFE inlet tube (5 m length and in.) was mounted above the front vehicle window on the passenger side (∼1.5 m above ground). The instrument alternately recorded average NO–NO2–NOx mixing ratios with a temporal resolution of 1 min. Most of the routes were driven downwind of Sarnia on rural remote roads with little to no traffic such that NOx emissions from other vehicles were not a concern. When NOx from other vehicles was a potential concern, data were filtered out via careful note taking. The instrument indirectly measures NO2 by subtracting the NO chemiluminescence signal obtained when air bypasses a heated molybdenum (Mo) convertor from the successive total NOx chemiluminescence signal obtained when air passes over the Mo convertor. The NOx analyzer can overestimate NOx and NO2 due to the potential contribution of other non-NOx reactive nitrogen oxides (NOz) other than NO2 that can also be reduced to NO by the Mo converter (HNO3, HONO, organic nitrates, etc.), leading to an overestimation (Dunlea et al., 2007). Since this overestimation is more important in low NOx regions, only data with NOx mixing ratios >3 ppb were used. Mixing ratios of <3 ppb NO2 were only measured outside of plume-impacted regions when NO2 VCDs were also low. The potential error in NOx∕NO2 ratios is addressed further in Sect. 3.2. NOx mixing ratios can also have an error when successive NO and NOx measurements occurred in areas with a significant temporal gradient in the NOx emissions. Such gradients were seen due to passing vehicles or localized industrial NOx plumes. These data were removed based on records of passing vehicles and other local near-surface sources or whenever the NO2 mixing ratios were reported as negative. Few data points were removed because the routes driven were primarily rural roads with extremely low traffic density.
Aura satellite ozone monitoring instrument (OMI) data were obtained for overpasses of the Sarnia, Ontario, area for Days 1 and 3. Tropospheric NO2 VCDs are the NASA Standard Product Version 3.0 with AMFs (air-mass factors) recalculated using the Environment and Climate Change Canada regional air quality forecast model GEM-MACH. The OMI instrument makes UV–Vis solar backscatter radiation measurements with a spatial resolution of 13 km×24 km at nadir and up to 28 km×150 km at swath edges (Ialongo et al., 2014). The NO2 detection limit of OMI is 5×10¹⁴ (Ialongo et al., 2016). The OMI data used were screened for row anomalies that have affected OMI data since June 2007 (Boersma et al., 2007).
2.2 MAX-DOAS determination of VCDs
Trace-gas differential slant column densities (DSCDs) were obtained using the DOAS technique (Platt et al., 2008) with the spectral fitting range of 410–435 nm for NO2 at 293 K and 307.5–318 nm for SO2 at 293 K. All trace-gas cross sections used were from Bogumil et al. (2003). For both gases, spectral fits also included a Fraunhofer reference spectrum (FRS), ring spectrum created from the FRS, O3 cross sections at 223 and 297 K, and a 3rd-order polynomial. The NO2 cross section was included in the SO2 fits. Formaldehyde (HCHO) was not included in the fits for SO2 as it was expected to be very low and did not affect the residuals for the SO2 fits. NO2 DSCDs from Day 1 were fit against a single, same-day FRS obtained in a low-pollutant region near solar-noon time. These DSCDs were corrected for SCD(FRS) and SCD(solar zenith angle (SZA)) contributions using the DSCDoffset method (Wagner et al., 2010). The SCD(FRS) is the constant tropospheric trace-gas SCD component present in the FRS that causes an underestimation in the fitted DSCD. The SCD(SZA) is the difference between the stratospheric trace-gas component in the FRS and the measured non-zenith spectra. SCD(SZA) varies over time of day (ti), maximizing overestimation in the DSCD early and late in the day. The sum of SCD(FRS) and SCD(SZA) is collectively known as the DSCDoffset. The DSCDoffset(ti) function was estimated by fitting a 2nd-order polynomial to multiple pairs of DSCDs of spectra (non-zenith and zenith from the same sequence), described in detail in Wagner et al. (2010).
The DSCDoffset polynomial is most accurate when successive spectra in each sequence observe similar mixing ratio fields, and measurements obtained many data points over most of the daylight hours. However, routes on Days 2 and 3 included driving in and out of both high- and low-NOx regions within short time periods and thus met neither of the requirements listed above for the DSCDoffset method. On these days, a second method was used where NO2 DSCDs were fit against an FRS spectrum obtained close in time (<25 min) along each respective route in a low-pollutant region. The impacts of SCD(FRS) and SCD(SZA) on the retrieved DSCDs can be assumed to be negligible since each FRS was from a low-pollutant area and obtained close in time, respectively. This method was also used for the Day 1 SO2 route since limited data were available but included background SO2 measurements close in time.
For all routes, trace-gas tropospheric VCDs were determined by assuming a single scattering event occurred for each photon such that the air-mass factor (AMF) depended only on the viewing elevation angle, α, . (Brinksma et al., 2008; Wagner et al., 2010). This “geometric approximation” is most valid under low to moderate aerosol loading and has been shown to deviate from the typically more accurate radiative transfer modelling by up to ±20 % under moderate aerosol loading (Shaiganfar et al., 2011). Day 1 VCDs were calculated following Eq. (1):
Days 2 and 3 NOx and Day 1 SO2 VCDs were calculated following Eq. (2):
The VCD of SO2 was above detection limit on only two occasions in this study (both on Day 1), in contrast to NO2. The detection limit of SO2 is higher than NO2 for several reasons; first, it's differential cross section is less than that of NO2; second, its absorption features are in the UV wavelength region where scattered sunlight intensity is much less than that in the visible region. The fast measurements required in mobile DOAS also allow for limited averaging of spectra compared to stationary measurements (Davis et al., 2019), where detection of industrial SO2 plumes is easier. Therefore, SO2 DSCDs were only above detection limits for Day 1 routes 3 and 4 when the light levels were highest, and the vehicle observed the combined plumes of the largest SO2 sources in the area.
2.3 Estimating trace-gas emissions from MAX-DOAS VCDs
Trace-gas emission estimates were calculated following a flux integral approximation Eq. (3):
where VCDoutflow,i is the VCD measured at position i along the route s for distance ds, VCDinflux,i is either the measured influx values or the estimated background VCD value, wi is the wind speed, βi is the angle between the driving direction and the wind direction, MW is the molecular weight of the target gas, and Av is Avogadro's number. Transect routes were designed to observe both within and beyond emission-impacted areas since routes encircling the emission sources were often not possible. Flux integrals were calculated using portions of the transects impacted only by the Sarnia urban and industrial plume in cases where plumes from other sources impacted the transect (i.e., Day 1; USA power plant plumes). In these cases, the endpoints of integration were chosen judiciously where NO2 VCDs and surface mixing ratios decreased to a minimum at the edge of the Sarnia emissions. This method assumes that the wind field and trace-gas emission rates are constant during the time required to drive a route. The validity of this assumption improves with decreased time for driving route completion. The Sarnia region is ideal for this method since a small geographical area contains the majority of the emissions and is surrounded on three sides by rural regions with low anthropogenic emissions.
A potential source of uncertainty in mobile MAX-DOAS emission estimates is variation in the wind fields and/or source emission rates while driving (Ibrahim et al., 2010; Wu et al., 2017). Previous studies have estimated wind fields from local meteorology stations (Ibrahim et al., 2010), meteorological models (Shabbir et al., 2016; Shaiganfar et al., 2011, 2017), or lidar measurements (Wu et al., 2017). In our study, wind field information was obtained from a modular weather station (Nova Lynx 110-WS-25DL-N) that we deployed near one of the driving routes (42.8148, −82.2381) (Fig. 1) and from meteorological ground stations in the area (Fig. 1, Table S1, Fig. S1 in the Supplement). The modular weather station measured wind speed and direction, temperature, relative humidity, and barometric pressure at 2 m above the surface every 30 s. Wind data were available from the Sarnia-Lambton Environmental Association (SLEA) LaSalle Road (42.911330, −82.379900) and Moore Line (42.83954, −82.4208) meteorological stations that are located near the driving routes (Fig. 1). These stations were surrounded by flat fallow farmland for at least 4 km on each side and thus should reflect total boundary layer for plumes transported away from the city more than the urban stations (Fig. S1). The hourly wind direction data from the modular and permanent stations exhibited similar values (±10∘) and trends on Day 1 (Fig. S2). Wind directions for Days 2 and 3 were obtained by determining the angle of a vector drawn between the geographical locations of the maximum NO2 VCD enhancements and the industrial facilities expected to have emitted the plumes. These map-determined wind directions were consistent (±10∘) with the data from the station(s) closest to the driving route. Comparison of wind-speed data on Days 2 and 3 was not possible due to a technical issue with the modular weather station on these days.
The NO2 VCD influx (background VCD) was estimated on Day 1 since measurement was impossible along the western border of Sarnia due to the road configuration and proximity of industrial emissions. A NO2 VCD was estimated based on OMI VCDs of ∼1.5–3.5×10¹⁵ from the area east of Sarnia that are expected to be similar to the NO2 regime west of Sarnia. These pixels are expected to be unaffected by other sources. The influx would be expected to be impacted by vehicular and residential emissions from the small city of Port Huron, USA, on the west side of the St Clair River (Fig. 1), which has limited industry but a moderate level of commercial vehicle activity due to border crossings. A 1st-order emission estimate of vehicular NOx emissions from Port Huron from daily-reported traffic counts results in an upper limit of NO2 influx VCD of (see the Supplement S4). True influx would vary along the length of the measurement transect, depending on what sources are upwind of the location. Halla et al. (2011) measured NO2 tropospheric VCDs using MAX-DOAS in a similar region approximately 70 km southeast of Sarnia. The observed NO2 VCDs in that study ranged from 0.01×10¹⁶ to 1.25×10¹⁶ with a median value of 2×10¹⁵ , which is expected to be representative of background NO2 columns in this region. The highest VCD in that study was attributed to the transport of industrial emissions from the Sarnia area and/or from Detroit, MI, to the northwest and west of the site, respectively (Halla et al., 2011). Based on the range of VCDs from literature, vehicular emission estimates, and satellite measurements, a background VCD of 2×10¹⁵ is a reasonable estimate, and emissions sensitivity tests were conducted using influx VCDs of 0.5–3×10¹⁵ (the Supplement S5). In contrast, the NO2 VCDinflux on Days 2 and 3 and SO2 VCDinflux on Day 1 were determined from the average VCDs measured in the low-pollution area of each transect.
Determination of NOx emission estimates from NO2 measurements
NOx emissions were estimated using Eq. (4) from the NO2 flux integral and the average NOx∕NO2 ratio (NOx>3 ppb) measured by the NOx analyzer along the route. The emission values were then corrected for expected NOx loss during transport using a NOx lifetime, τ. NOx emission estimates were calculated as follows:
where τ is NOx lifetime, w is wind speed, and y is the distance between the NOx source and the measurement location. For routes where individual NOx∕NO2 ratios deviated significantly from the route average, the NOx emission estimates were calculated by applying (1) the route-averaged NOx∕NO2 ratio and (2) individual NOx∕NO2 ratios associated with each NO2 VCD point by point. Multiple factors determine NOx lifetime in a plume. A NOx lifetime of 6 h was used in this study based on considerations given in Sect. 3.3. A sensitivity analysis was performed varying the lifetimes between 4 and 8 h (the Supplement S7). The conversion factors used to calculate NOx emissions for each route can be found in Table S8. The NOx∕NO2 ratios are more fully addressed in Sect. 3.2 and the NOx lifetime is addressed in Sect. 3.3.
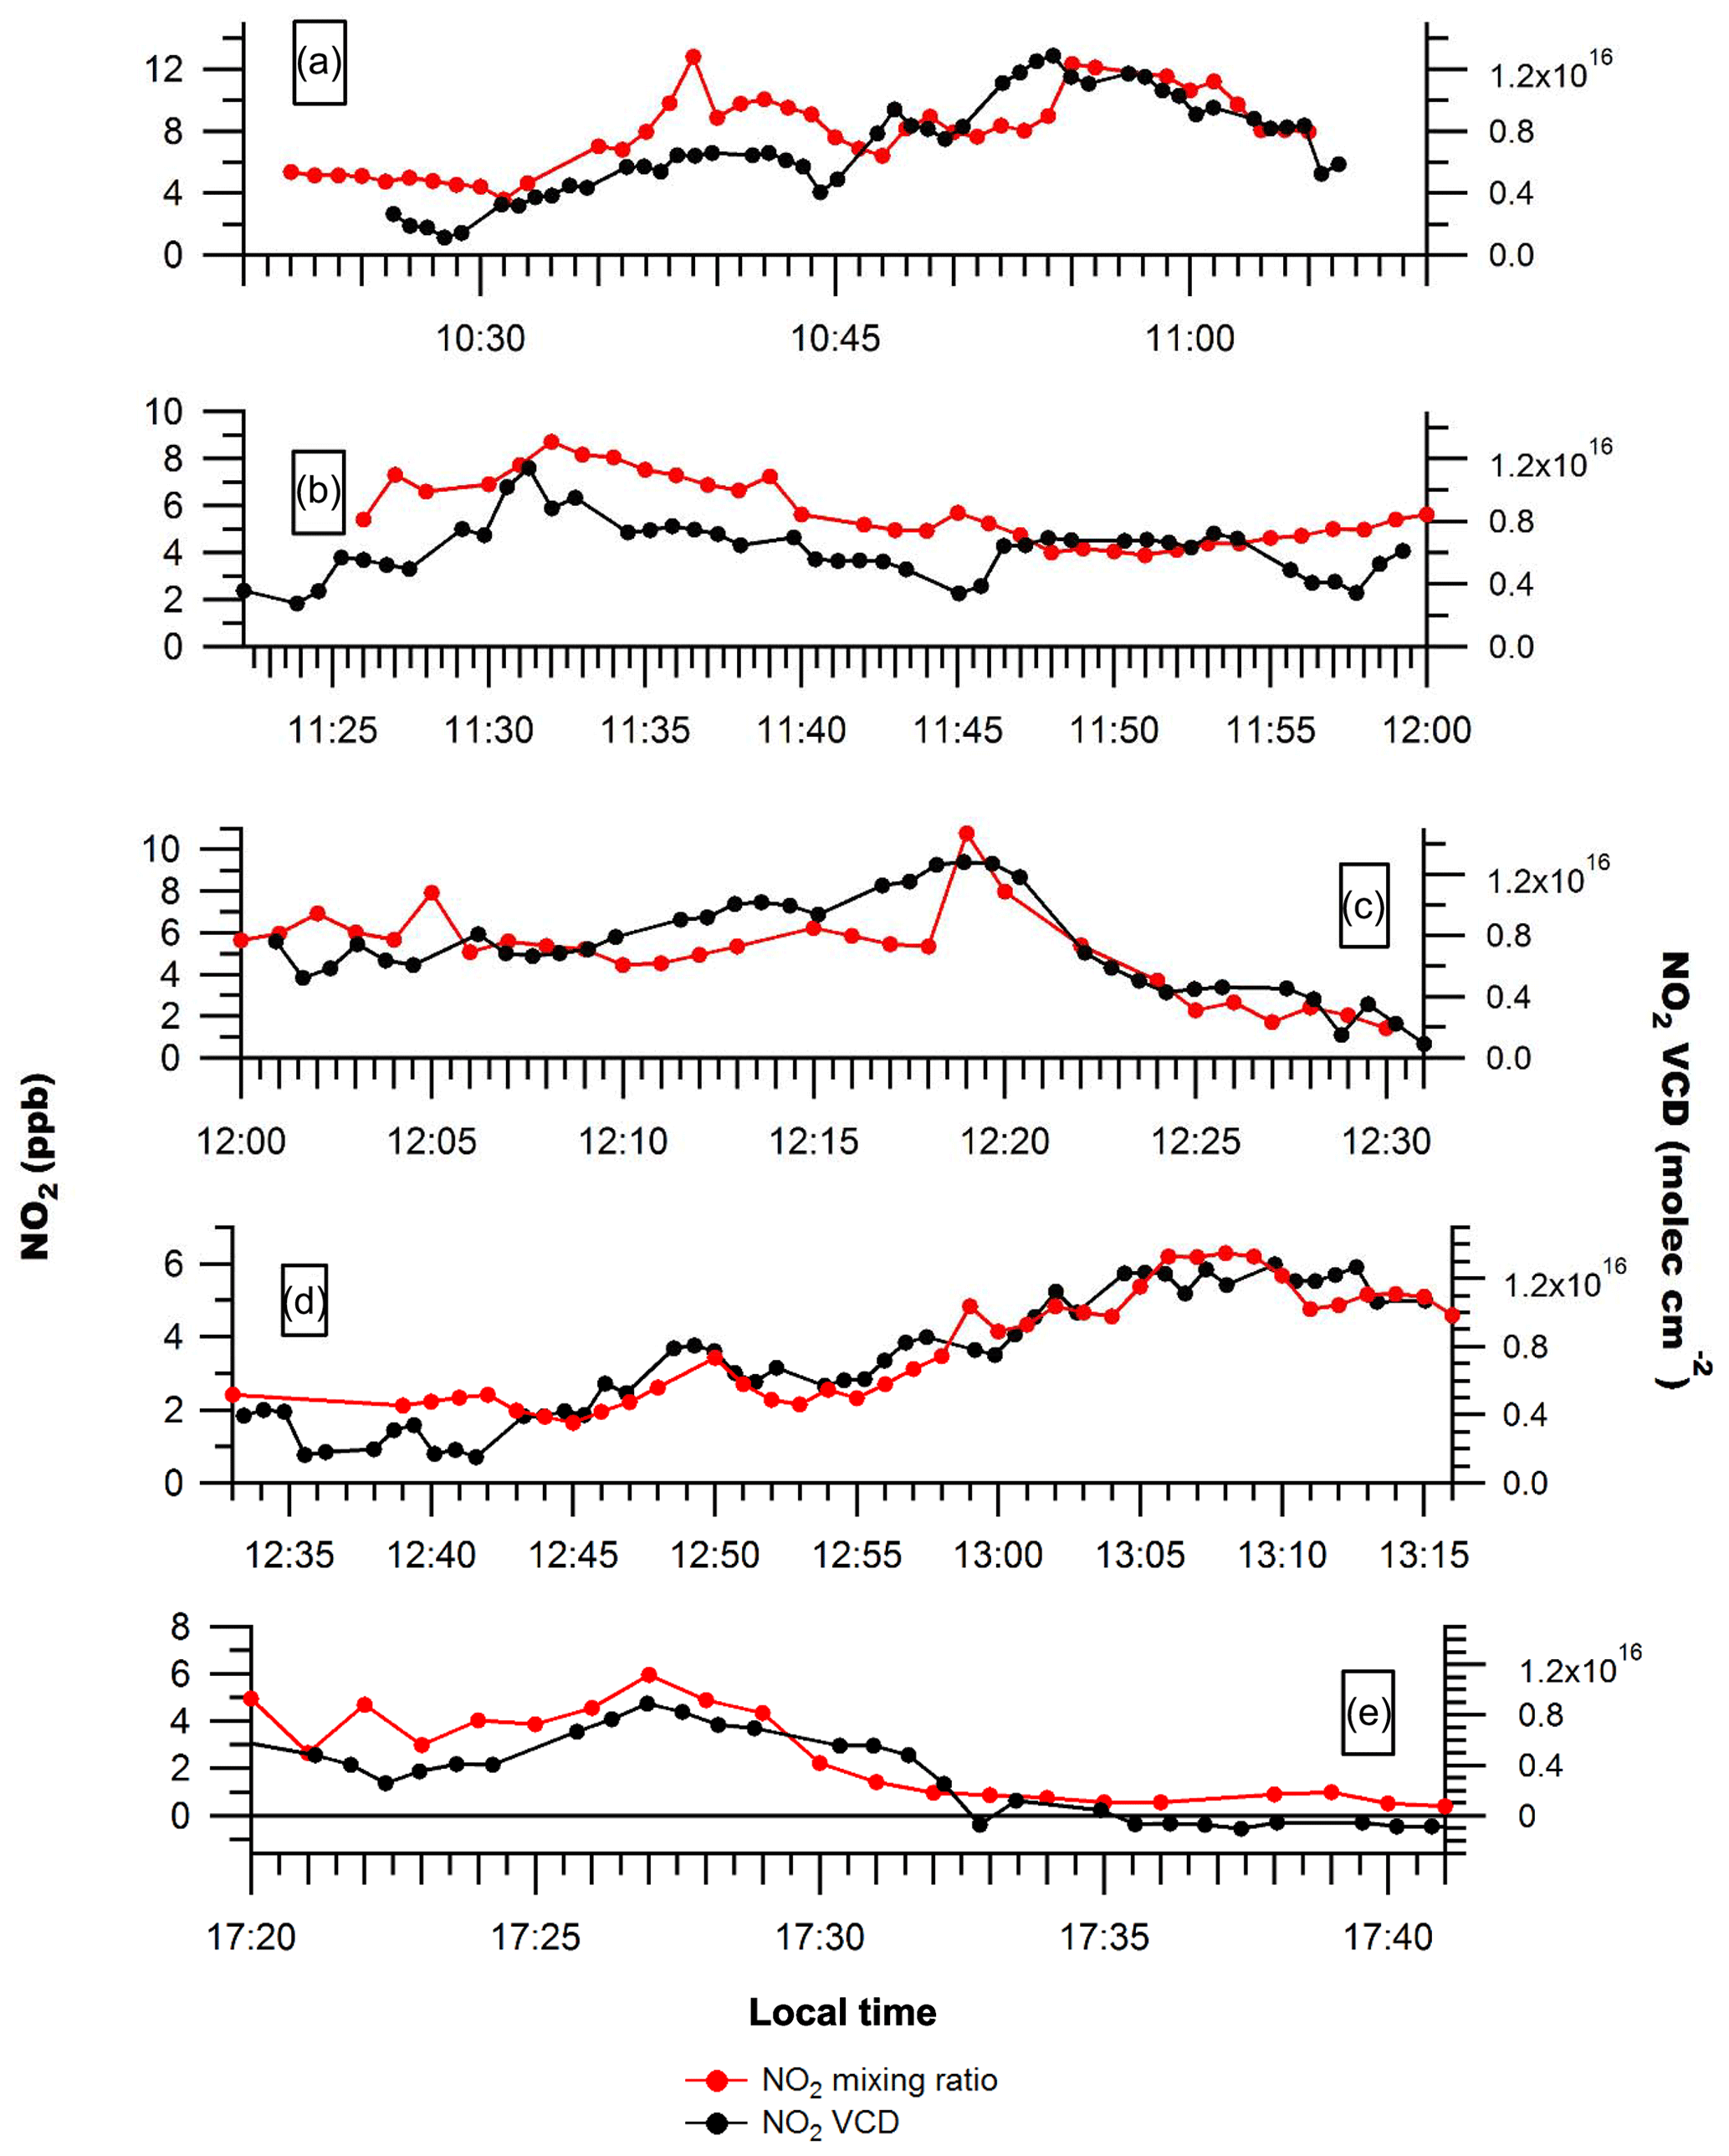
Figure 2NO2 mixing ratios and NO2 VCDs along routes 1–4 on Day 1 (a–d) and route 1 on Day 2 (e). Uncertainties in measured NO2 mixing ratios are ±0.5 ppb. Uncertainties in the NO2 VCD are given by .
3.1 Relationship between NO2 VCDs and NO–NO2–NOx analyzer measurements
Figure 2 shows that the enhancements in NO2 VCDs downwind of Sarnia were generally associated with NO2 surface mixing ratio enhancements during Days 1 and 2. This suggests that pollution from Sarnia was well-mixed within the boundary layer at the measurement locations, typically 14–23 km downwind of sources (Figs. 3 and 4). However, the ratio of NO2 VCD to NO2 mixing ratio was sometimes variable even during relatively short time periods when the boundary layer height was expected to be constant (Fig. 2a). This variability was probably due to the presence of multiple NOx plumes that had originated from sources with different heights (i.e., stacks and surface sources) and emission rates.

Figure 3Day 1 driving routes used to estimate NOx emissions from Sarnia: (a) route 1, (b) route 2, and (c) route 3.
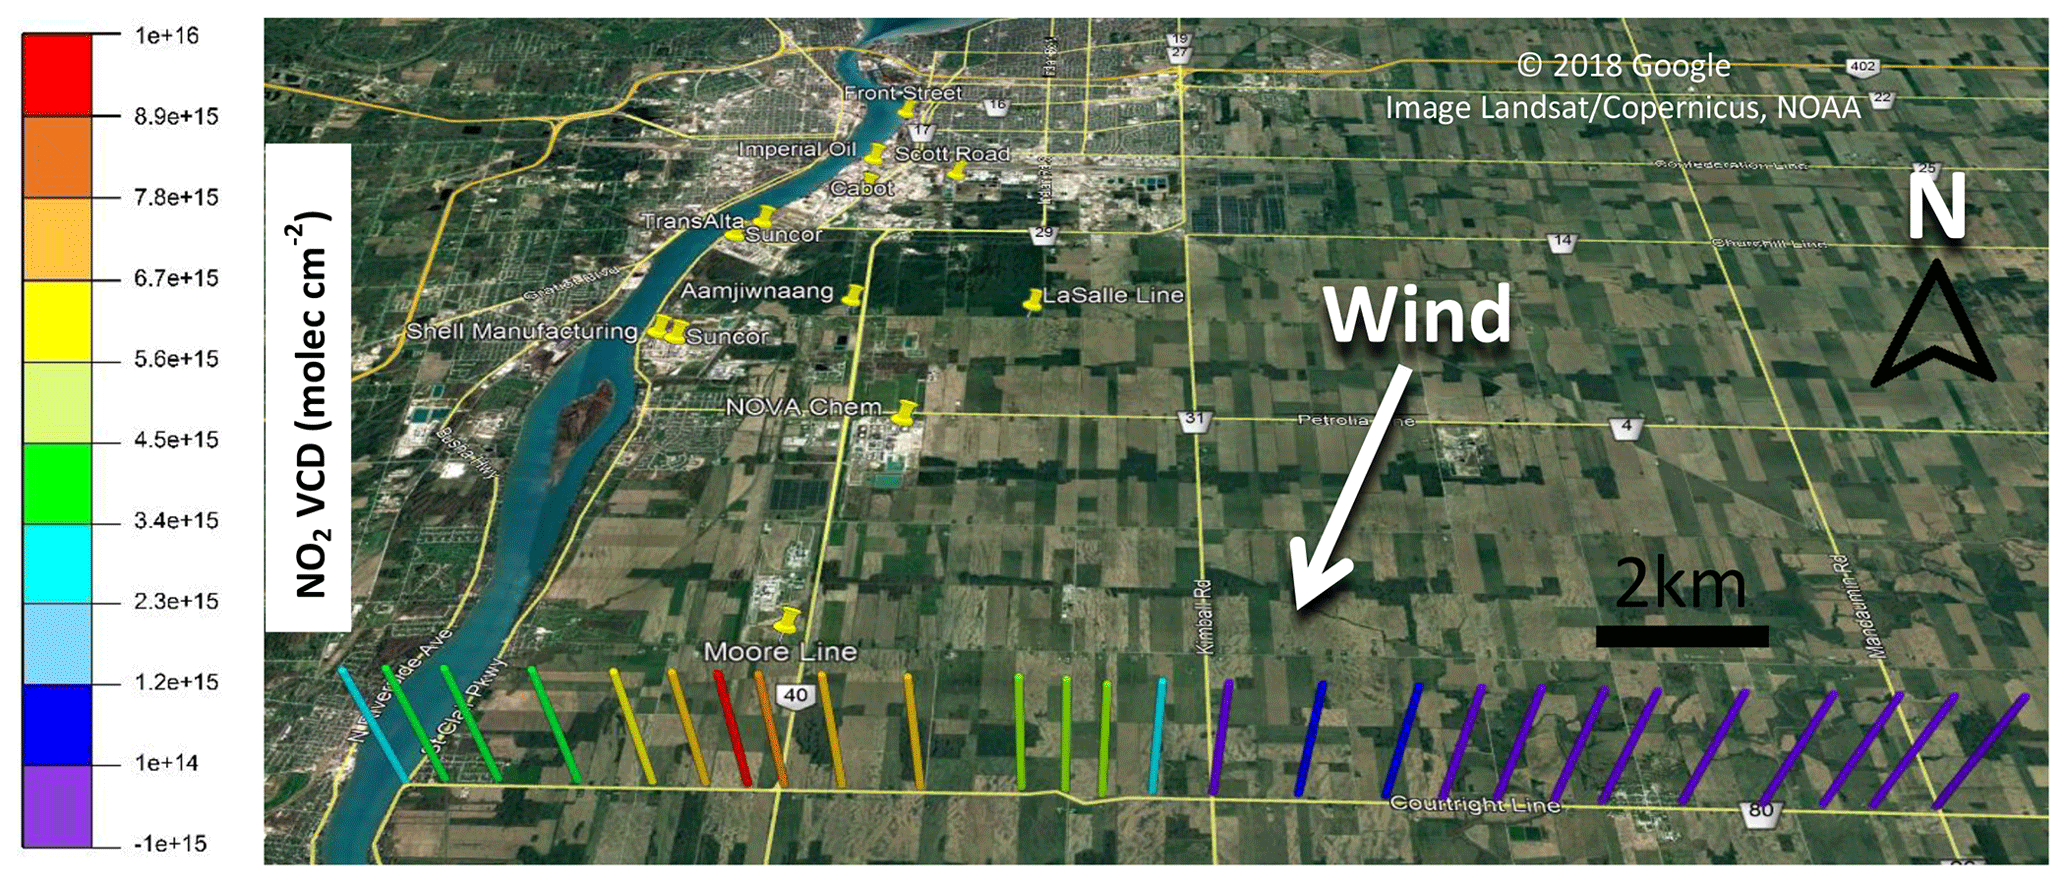
Figure 4NO2 VCDs measured on Day 2 route 1.
In contrast to Days 1 and 2, NO2 VCD enhancements on Day 3 were not consistently associated with NO2 surface mixing ratio enhancements (Figs. 5 and 6). A large surface enhancement (NOx=22 ppb) was observed at the location of the VCD NO2 enhancements ( ) associated with the NOVA Chemicals industrial plume on route 2 (Figs. 5b and 6b) but not on route 1 (Figs. 5a and 6a). This discrepancy is likely due to the closer proximity of the driving route to the source compared with Day 1, combined with limited vertical mixing of the plume. The relatively long sampling time of the NOx analyzer with a relatively fast driving speed on this route may also have led to an underestimation of the true NOx values for this localized plume.
Table 2NOx∕NO2 ratios for routes driven.
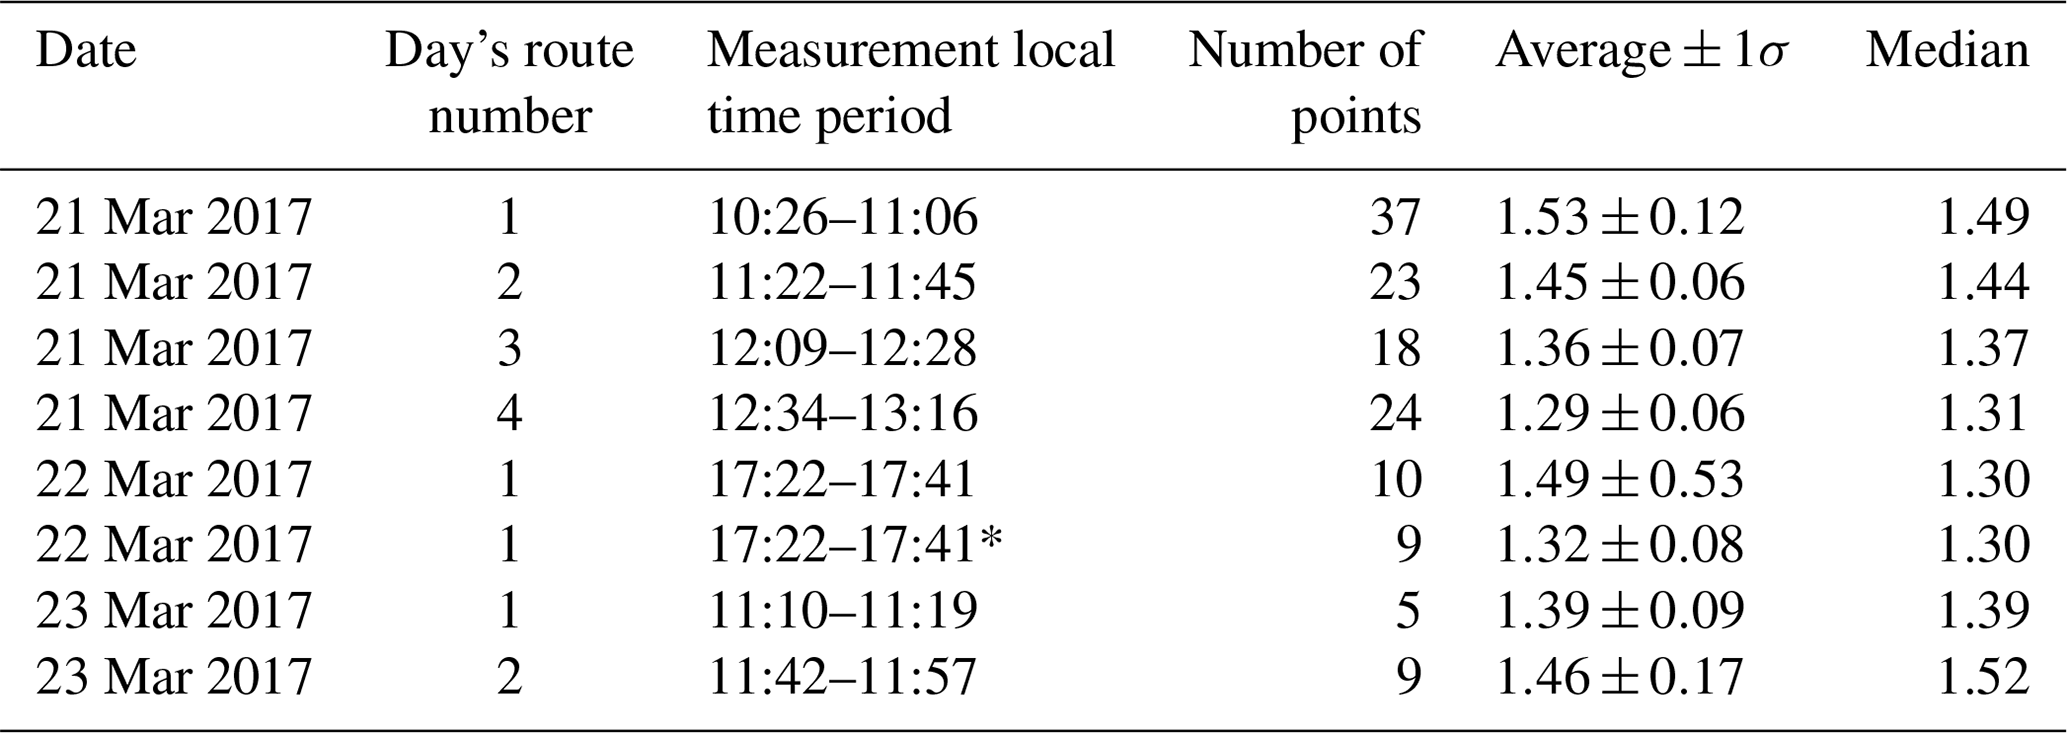
The 22 March 2017 17:22–17:41* data had the peak NO2 plume location NOx∕NO2 value removed.
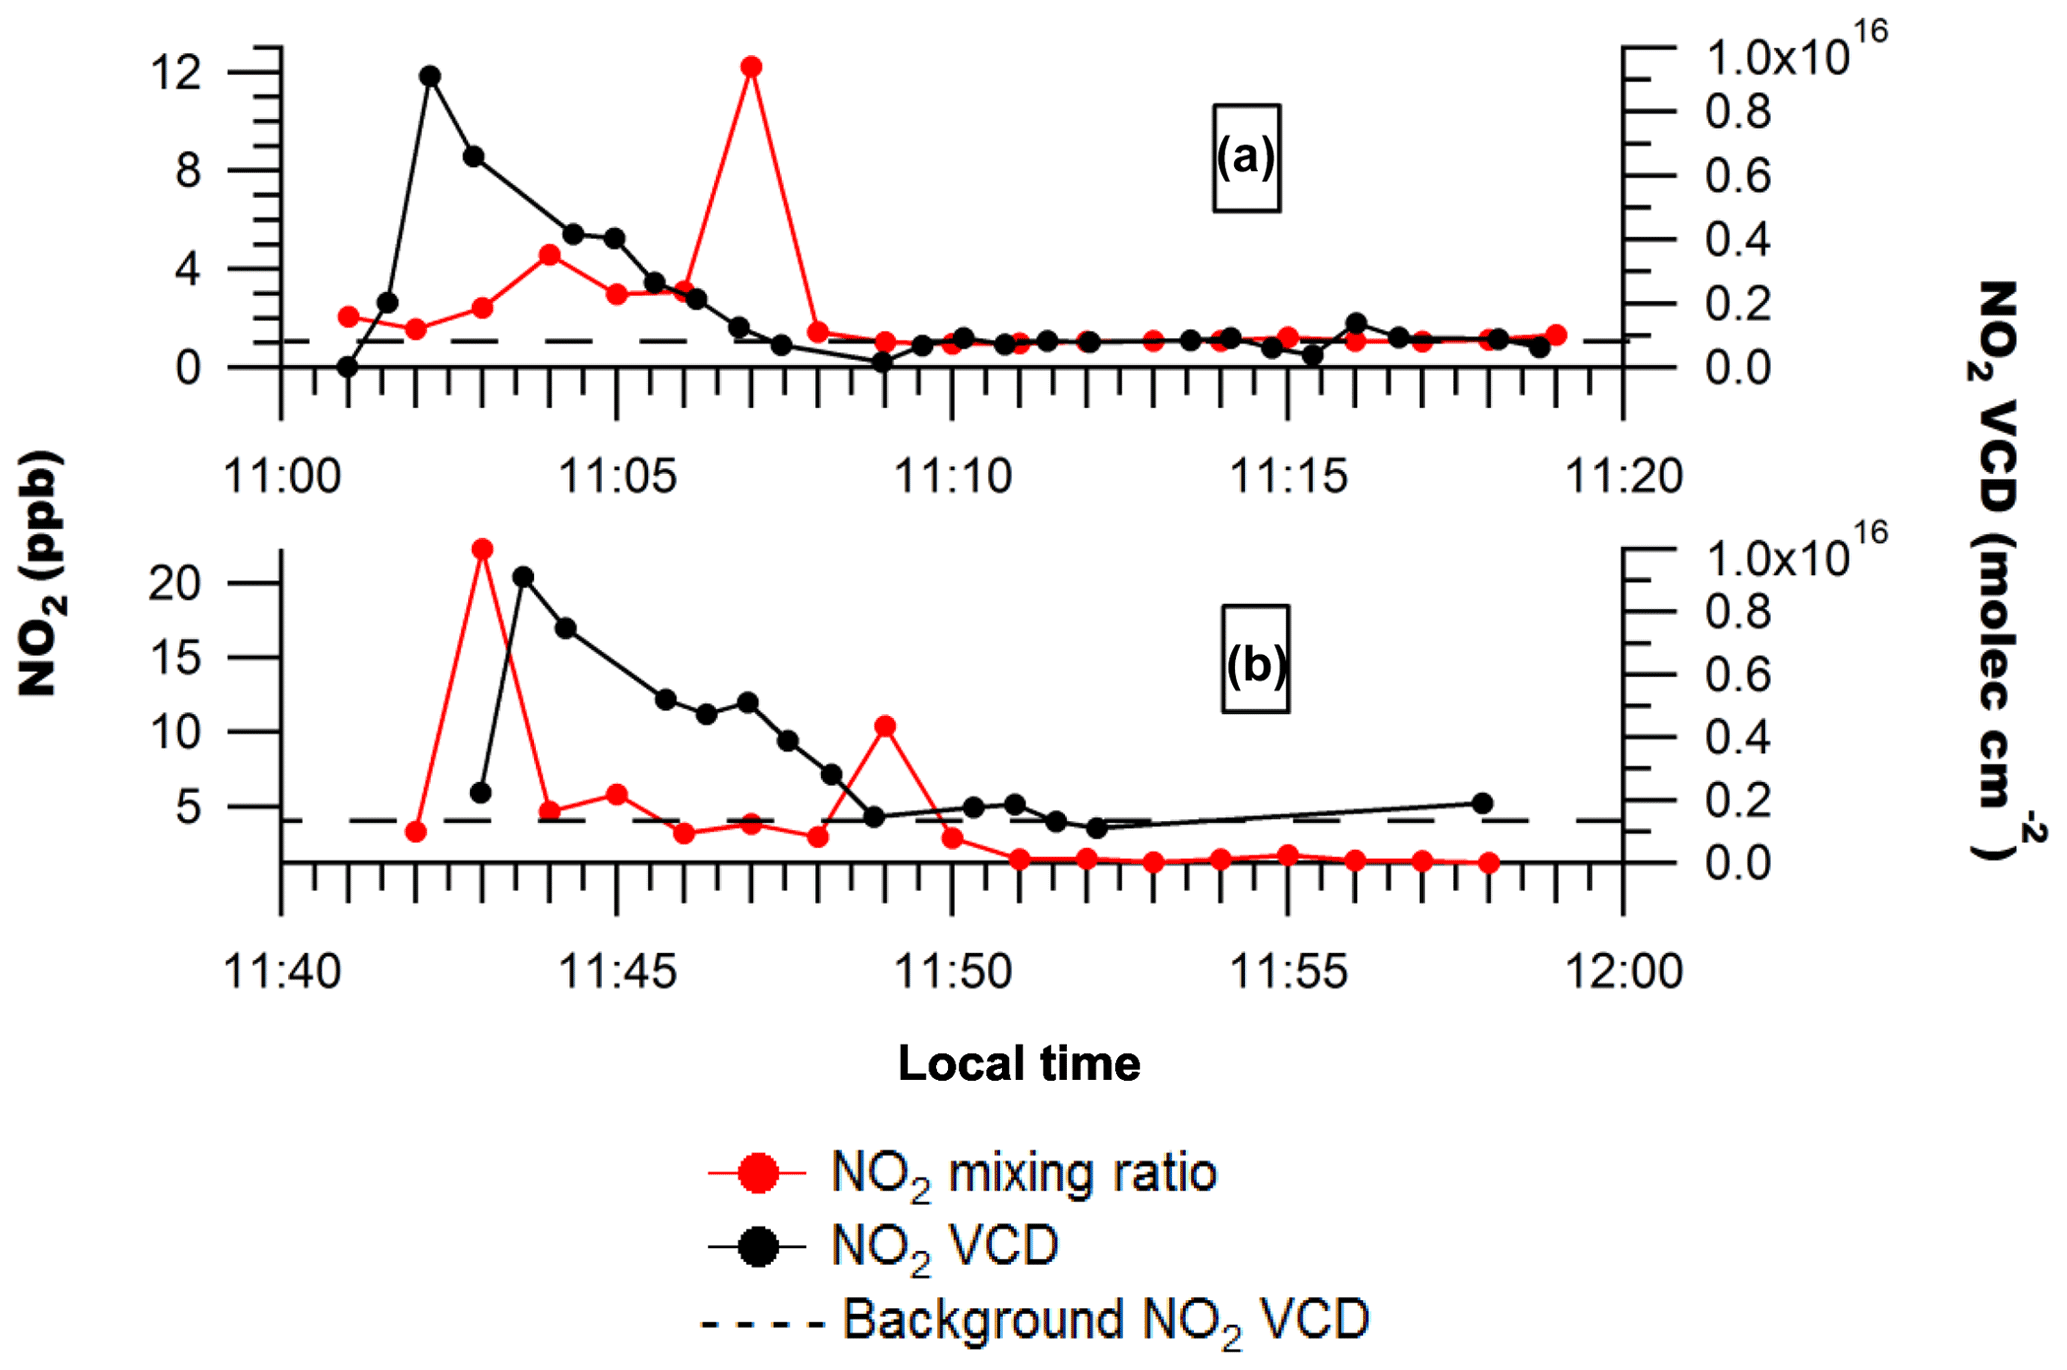
Figure 5NO2 mixing ratios and NO2 VCDs measured on Day 3 along (a) driving route 1 and (b) driving route 2. Uncertainties in measured NO2 mixing ratios are ±0.5 ppb. Uncertainties in the NO2 VCD are given by .

Figure 6NO2 VCDs measured on Day 3 along (a) driving route 1 and (b) driving route 2.
3.2 NOx∕NO2 ratios
The NOx∕NO2 ratio is necessary to estimate NOx emissions from the source, given measurements of NO2 VCDs (Eq. 4). Ratios of NOx∕NO2 (Table 2) measured along the routes on Days 1 and 3 were within 20 % of the route-averaged value with a relative standard deviation of less than 12 %. NOx∕NO2 ratios tended to increase at locations associated with transported plume centerlines, as expected due to an increase in NO emissions from the sources (see Fig. 7), and exhibited the greatest variability in air masses affected by sources with different altitudes and emission rates. Day 1, route 1 exhibited variable NOx∕NO2 ratios due to emissions from the power plants across the river in Michigan, residential and vehicular traffic, and industrial emissions (Figs. 3a and 7).
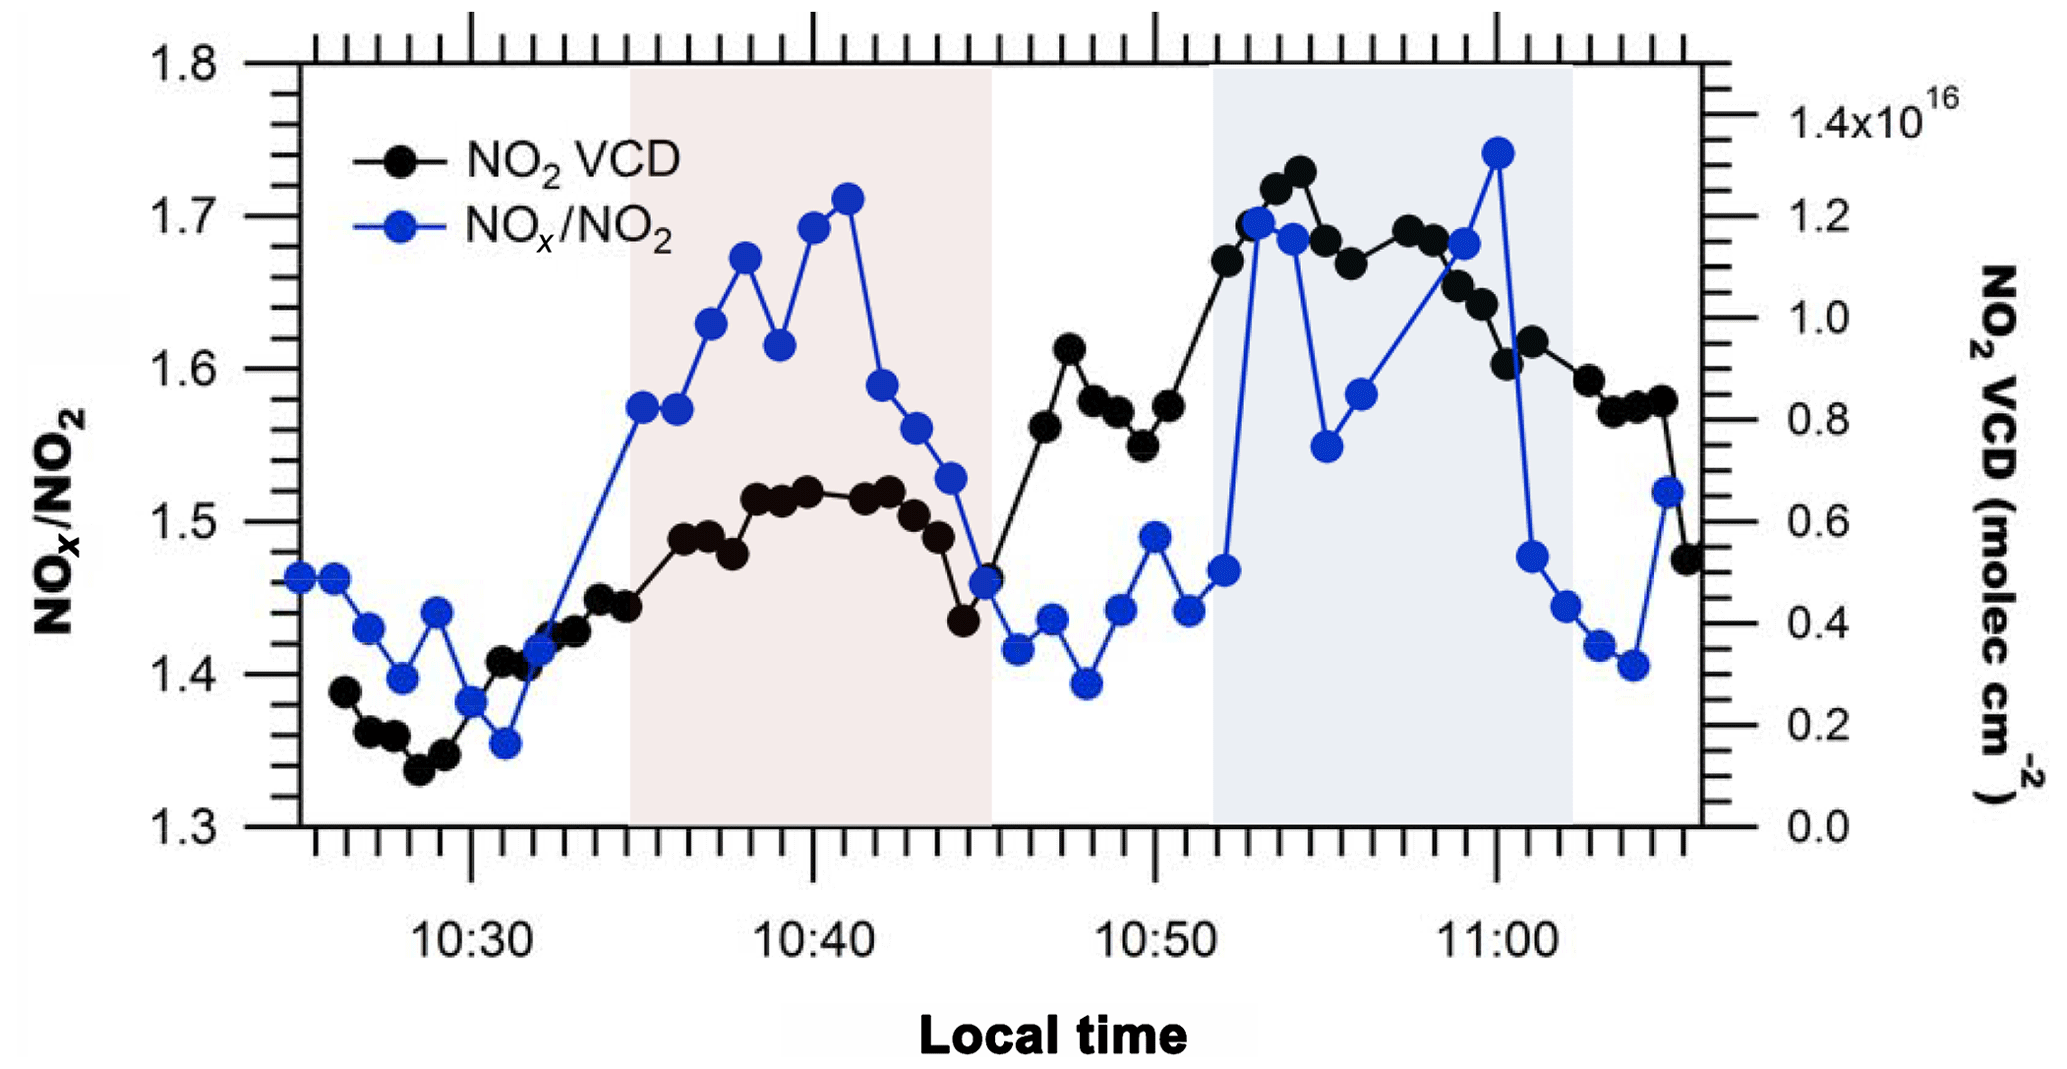
Figure 7NO2 VCDs and NOx∕NO2 ratios on Day 1 route 1. Detection of Michigan power plants' plume(s) (left) on east–west transect and Sarnia plume (right) on north–south transect are highlighted in pink and blue, respectively. Uncertainties in measured NOx∕NO2 ratios are ±5 % (). Uncertainties in the NO2 VCD are given by .
Potential errors may exist in the NOx∕NO2 ratio due to the presence of other NOz species in the air mass (e.g., HNO3, HONO, NO3, N2O5, organic nitrates, etc.) that are also converted to NO by the Mo convertor in addition to NO2 (Dunlea et al., 2007). However, these errors are smaller than might be expected due to the presence of the error in both the numerator and the denominator of the ratio, , thus partially offsetting each other. For example, at an apparent NOx∕NO2 ratio of 1.40 (average in Table 2), a 10 % and 30 % error in the reported NO2 due the presence of other NOz species gives rise to errors of only −2.6 % and −6.6 % in the measured NOx∕NO2 ratio, respectively. Mathematically, the error in the NOx∕NO2 ratio becomes larger as the percentage of NO in the total NOx increases. However, since most of the interfering NOz species are generated photochemically, or only at night (NO3, N2O5) increasing with reaction time and distance away from the source, the percentage of interfering species is smaller at higher values of total NO and NOx. Under significantly intense photochemical conditions in the Mexico City metropolitan area (MCMA) field campaign in 2003, the interference in the chemiluminescence monitors resulted in average NO2 concentrations being 22 % higher than those determined from spectroscopic measurements (Dunlea et al., 2007), which would give rise to an error in the NOx∕NO2 ratio of <5 %. In the current study we estimate that the resultant negative bias in the measured NOx∕NO2 ratio does not exceed −5 % for several reasons: (i) we filter out low-NOx data (<3 ppb), (ii) the emission integral is dominated by regions with high NOx that are spatially and temporally close to the sources, and (iii) photochemistry was reduced during this spring campaign. The uncertainty that arises from potential errors in the NOx∕NO2 ratio is insignificant compared to other errors (see Table S9). It is also worth noting that NO2 measurements by the NOx analyzer are not directly used for the calculation of emissions; only the NOx∕NO2 ratio is used.
Previous mobile MAX-DOAS studies have relied on literature estimates of the NOx∕NO2 ratio (Shabbir et al., 2016; Shaiganfar et al., 2011) or estimated the ratio from a Leighton ratio calculated using local air quality station data (Ibrahim et al., 2010). In regions with many pollutant sources throughout (e.g., megacities), this ratio is expected to be horizontally and vertically inhomogeneous. The ratio can therefore be challenging to estimate and can increase the uncertainty in the NOx emission estimate. Estimation of NOx∕NO2 ratios from near-surface monitoring stations can be problematic because the ratios are applied to a VCD but may reflect only local emissions (e.g., nearby vehicular exhaust) rather than the total boundary layer. In this study, NOx data impacted by local emissions were removed. Also, the Sarnia emissions were expected to be well mixed compared to the surface since most of the transects were driven sufficiently far from the sources. Therefore, the near-surface NOx∕NO2 ratios should be representative for the altitude range of the dispersed NOx plume(s). This hypothesis is supported by the similarity between the NO2 surface and VCD temporal trends during the study, especially on Days 1 and 2 (Fig. 2).
3.3 NOx lifetime
Various lifetimes of NOx, τ, have been used in previous mobile MAX-DOAS studies for the calculation of NOx emissions from NO2 measurements: 6 h in Germany (Ibrahim et al., 2010), 5 h in Delhi (Shaiganfar et al., 2011), 5 h in China (Wu et al., 2017), and 3 h in summer and 12 h in winter in Paris (Shaiganfar et al., 2017). In Beirle et al. (2011), the daytime lifetime of NOx was quantified by analyzing the downwind patterns of NO2 measured by satellite instruments and shown to vary from ∼4 h in low- to midlatitude locations (e.g., Riyadh, Saudia Arabia) to ∼8 h in northern locations in wintertime (e.g., Moscow, Russia). In a follow-up study, Valin et al. (2013) showed that one cannot assume that τ is independent of wind speed and derived values of τ from the satellite observations over Riyadh to be 5.5 to 8 h, corresponding to OH levels of 5–8×10⁶ at high and low wind speeds.
Multiple factors determine NOx lifetime in a plume, including season (e.g., insolation) (Liu et al., 2016); latitude; wind-driven dilution (Nunnermacker et al., 2000; Valin et al., 2013); NOx emission rate and initial dilution (Nunnermacker et al., 2000); temperature; hydroxyl radical levels (OH); and precursors to OH including O3, H2O, and HONO. Very importantly, the daytime lifetime of NOx is a nonlinear function of the NOx concentration itself, having longer lifetimes at high and low concentrations with the shortest lifetimes at intermediate NOx concentrations due to the impact on OH levels in a nonlinear feedback on its own lifetime (Valin et al., 2013). The NOx lifetime is ultimately dependent on the OH levels since this dictates the loss rate of NO2 to its terminal sink (). However, the presence of VOCs in the urban plume, which are catalytically oxidized forming O3 in the presence of NOx and HOx (OH+HO2), can decrease the NOx lifetime due to their acceleration of the conversion of NO to NO2 via peroxy radical reactions (). Therefore, NOx lifetimes can vary both spatially and temporally (Liu et al., 2016), even within the same plume (Valin et al., 2013). Underestimation of the true NOx lifetime leads to overestimation of the NOx emissions, while an overestimate leads to an underestimation of the emissions.
While photolysis of HONO is often the major source of OH in the morning boundary layer (Platt et al., 1980; Alicke et al., 2002), midday production of OH via photolysis of O3 and subsequent reaction of O (1D) with water is frequently the dominant source of OH. Assuming O(1D) is in steady state, it can be shown that when ozone photolysis is the main source of OH, the product of the mixing ratios of H2O and O3 is proportional to the production rate of OH. In this study, the [H2O]⋅[O3] product was calculated using surrounding station measurements (see the Supplement S8.1). The [H2O]⋅[O3] product indicates that midday OH production under the spring conditions for Days 1 and 2 is only 10 %–25 % of the expected OH production under warmer, more humid summer conditions, presuming that O3 photolysis predominates. This might suggest OH levels were lower in our study than during summer, and hence NOx lifetimes longer. However, we assume this with caution as the HONO production is not known nor are the loss rates of OH.
As mentioned, the presence of VOCs can decrease the lifetime of NOx under conditions where NOx is sufficiently high to dominate the peroxy radical reaction path. To test for the presence of VOCs in the plumes (in the absence of measurements), Leighton ratios, φ (Leighton, 1961), were calculated at locations of maximum NO2 VCD associated with Sarnia plumes. Leighton ratios were calculated following Eq. (5) (see the Supplement S8.2 for details):
where is the NO2 photolysis rate, k8 is the temperature-dependent rate constant for the reaction between NO and O3. Leighton ratios equal to 1.0 indicate that NO, NO2, and O3 are in steady state with no significant interference from other species, while ratios of φ greater than 1.0 imply the role of other peroxy radical species (e.g., RO2, HO2) in the conversion of NO to NO2 (Finlayson-Pitts and Pitts, 2000). The NO2∕NO ratios were obtained from the NOx analyzer measurements; O3 mixing ratios were obtained from local monitoring stations during the same daytime periods as the transects. Values of were estimated using SLEA Moore Line station solar irradiance data (Fig. 1; Table S1) and solar zenith angle following the method in Wiegand and Bofinger (2000).
Table 3Calculated Leighton ratios for selected plume maximums on Day 1 and Day 2.
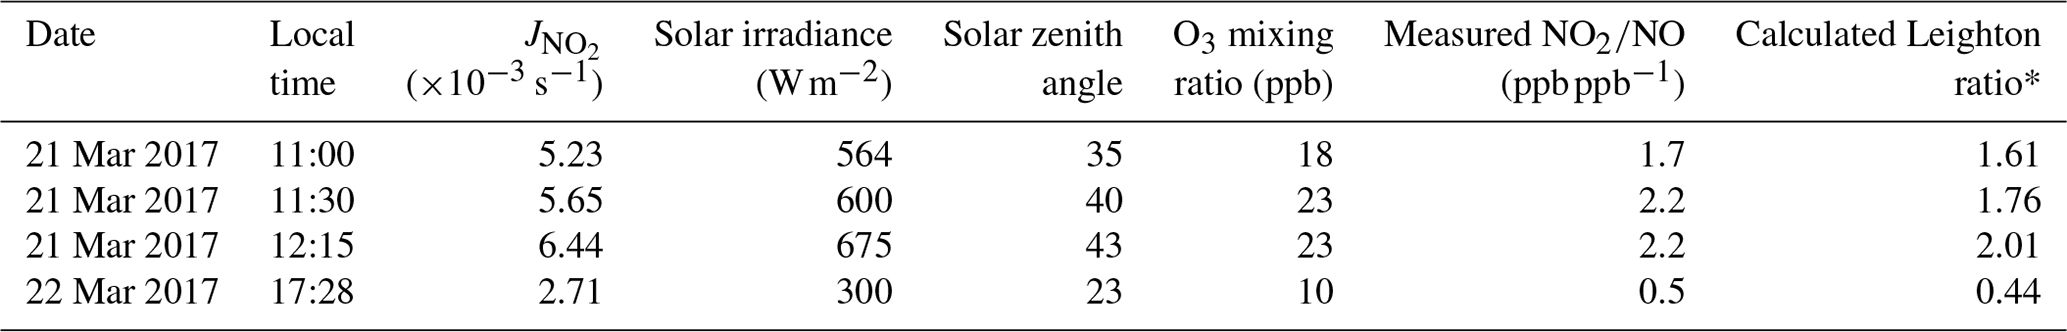
* Note that Leighton ratios, φ, could be biased high by as much as +20 % from the NOz component of NOy measured by the NOx analyzer but likely much lower due to it being a fresh urban and industrial NOx plume.
Table 3 shows Leighton ratios calculated at the locations of maximum NO2 VCD enhancements. Calculated Leighton ratios were significantly greater than 1 (φ=1.7–2.3) at peak NOx locations on Day 1 (Table 3). Even if we consider a potential bias of +20 % in the NO2 measurements by the NOx analyzer for reasons outlined in Sect. 3.2 (highly unlikely in a fresh NOx plume), a +20 % bias in the Leighton ratio would still give φ=1.4–1.9. We interpret this as an indication that significant levels of peroxy radicals were present in the plume, presumably from VOC oxidation by the OH radical. This is consistent with high VOC emissions from the petrochemical facilities in Sarnia, with emission rates >300 t yr−1 each for four of the top six industrial NOx emitters in Sarnia (Environment and Climate Change Canada, 2018d). The Day 2 Leighton ratio of less than 1.0 in Table 3 suggests a relatively fresh plume (only 4 km downwind of a facility) that had not come to photostationary state.
Thus we have indications that OH production may be lower than summer time leading to longer NOx lifetimes and we have indications that VOC oxidation in the plume may be significant leading to shorter NOx lifetimes than air masses where the photostationary state in NOx is valid. Without further information, we have opted to assume a central NOx lifetime of ∼6 h. Sensitivity calculations were conducted for NOx emission estimates using a range of lifetimes of 4–8 h (the Supplement S7). Varying the lifetime from ±2 h changed the emission estimates by <15 % for all routes except for Day 1 route 1 due to low wind speeds during that route (30 % change).
For the calculation of SO2 emissions, SO2 was assumed to have a sufficiently long lifetime in the boundary layer so as to be conserved between the emission and measurement location. Note that cloud processing of SO2 was assumed to be negligible since SO2 measurements were completed on a mostly cloud-free day.
Table 4Lower-limit NOx emission estimates from 10 m elevation wind speeds.
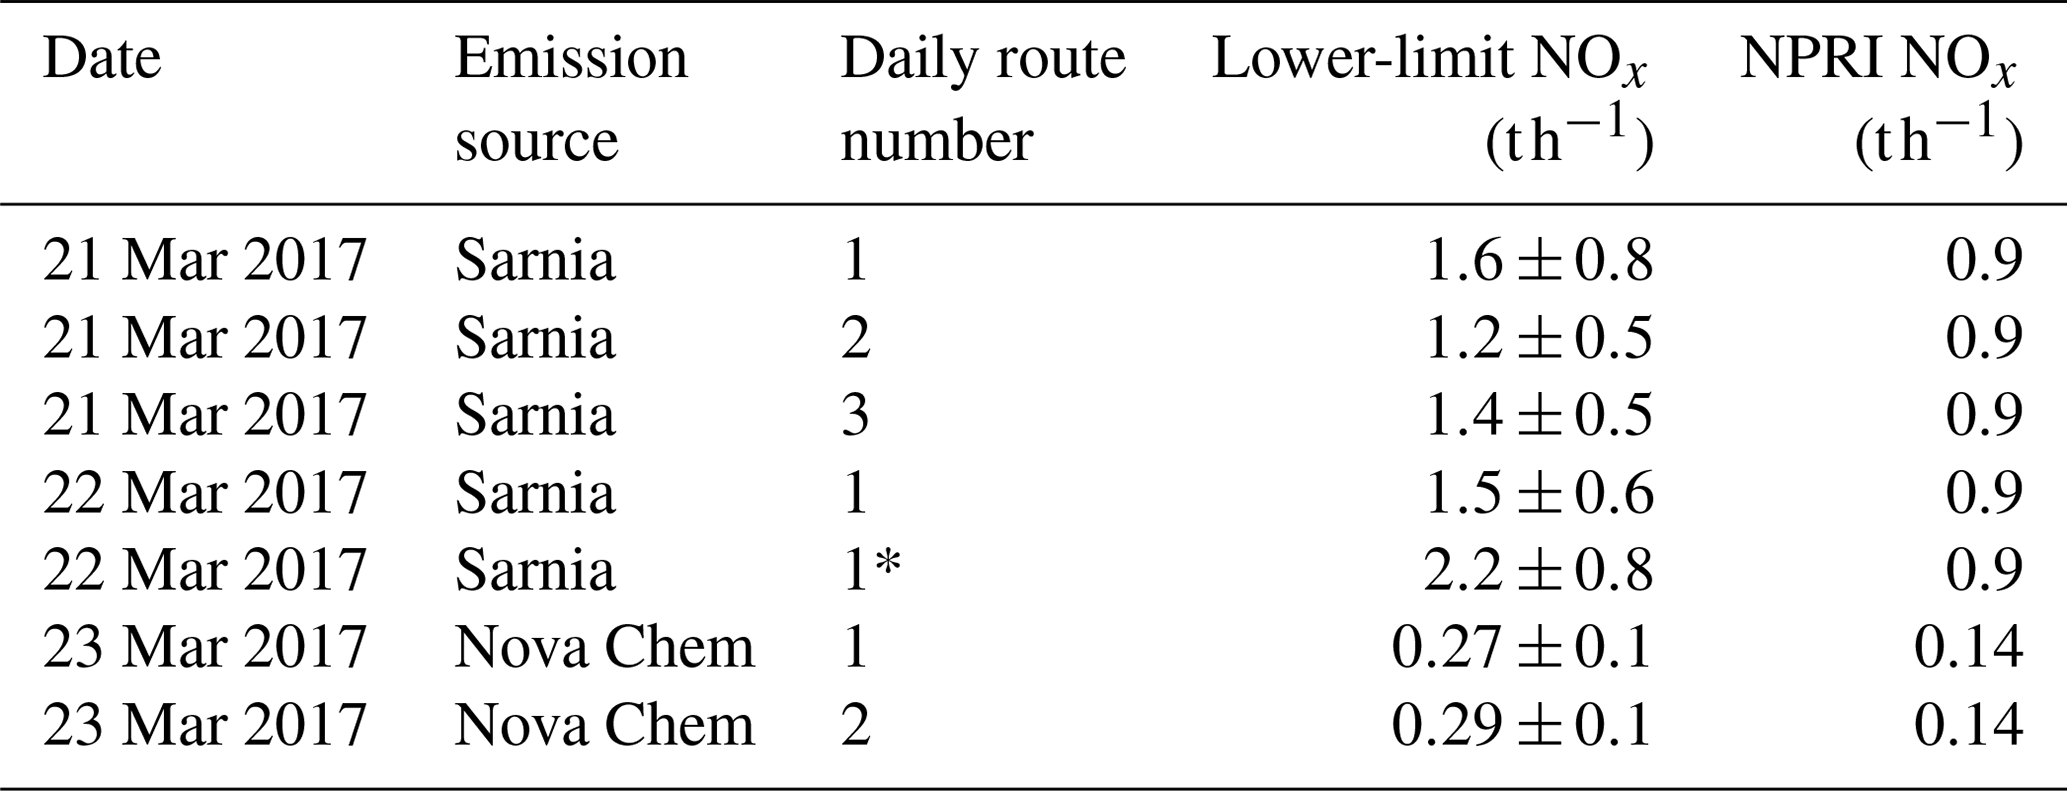
* Calculated using individual NOx∕NO2 ratios.
3.4 Emission estimates
3.4.1 Emission estimates of Sarnia
The VCDs measured are shown in Figs. 3–6, while the NOx emissions calculated using Eqs. (3) and (4) are shown in Table 4. The values of VCDinflux required for the calculations were typically determined from measurements of VCD in low-pollution transect areas. However, the VCDinflux on Day 2 was not determined in this way since these DSCDs were close to zero within error (Figs. 2 and 4). The VCDinflux is expected to be low on Day 2 because the north wind direction indicates that the air masses originated from over Lake Huron. These low values were probably due to low light levels during measurement, insufficiently long integration times (low signal to noise ratio), and NO2 background VCD values below the instrument's limit of detection. A low value of VCD was therefore assumed.
The emissions were calculated in two ways: (i) using a route-average NOx∕NO2 ratio value for each route estimate and (ii) using individual NOx∕NO2 ratios co-located with each VCD measurement. For Day 1 route 1, the route average NOx∕NO2 ratio was 1.53±0.12 ppb ppb−1 with the difference between the calculated emission rates using the two methods being only 3 %. Day 1 routes 2–4 exhibited small variability in NOx∕NO2 (Table 2), and the variation in the NOx∕NO2 ratio impacted emission estimates by less than 5 %.
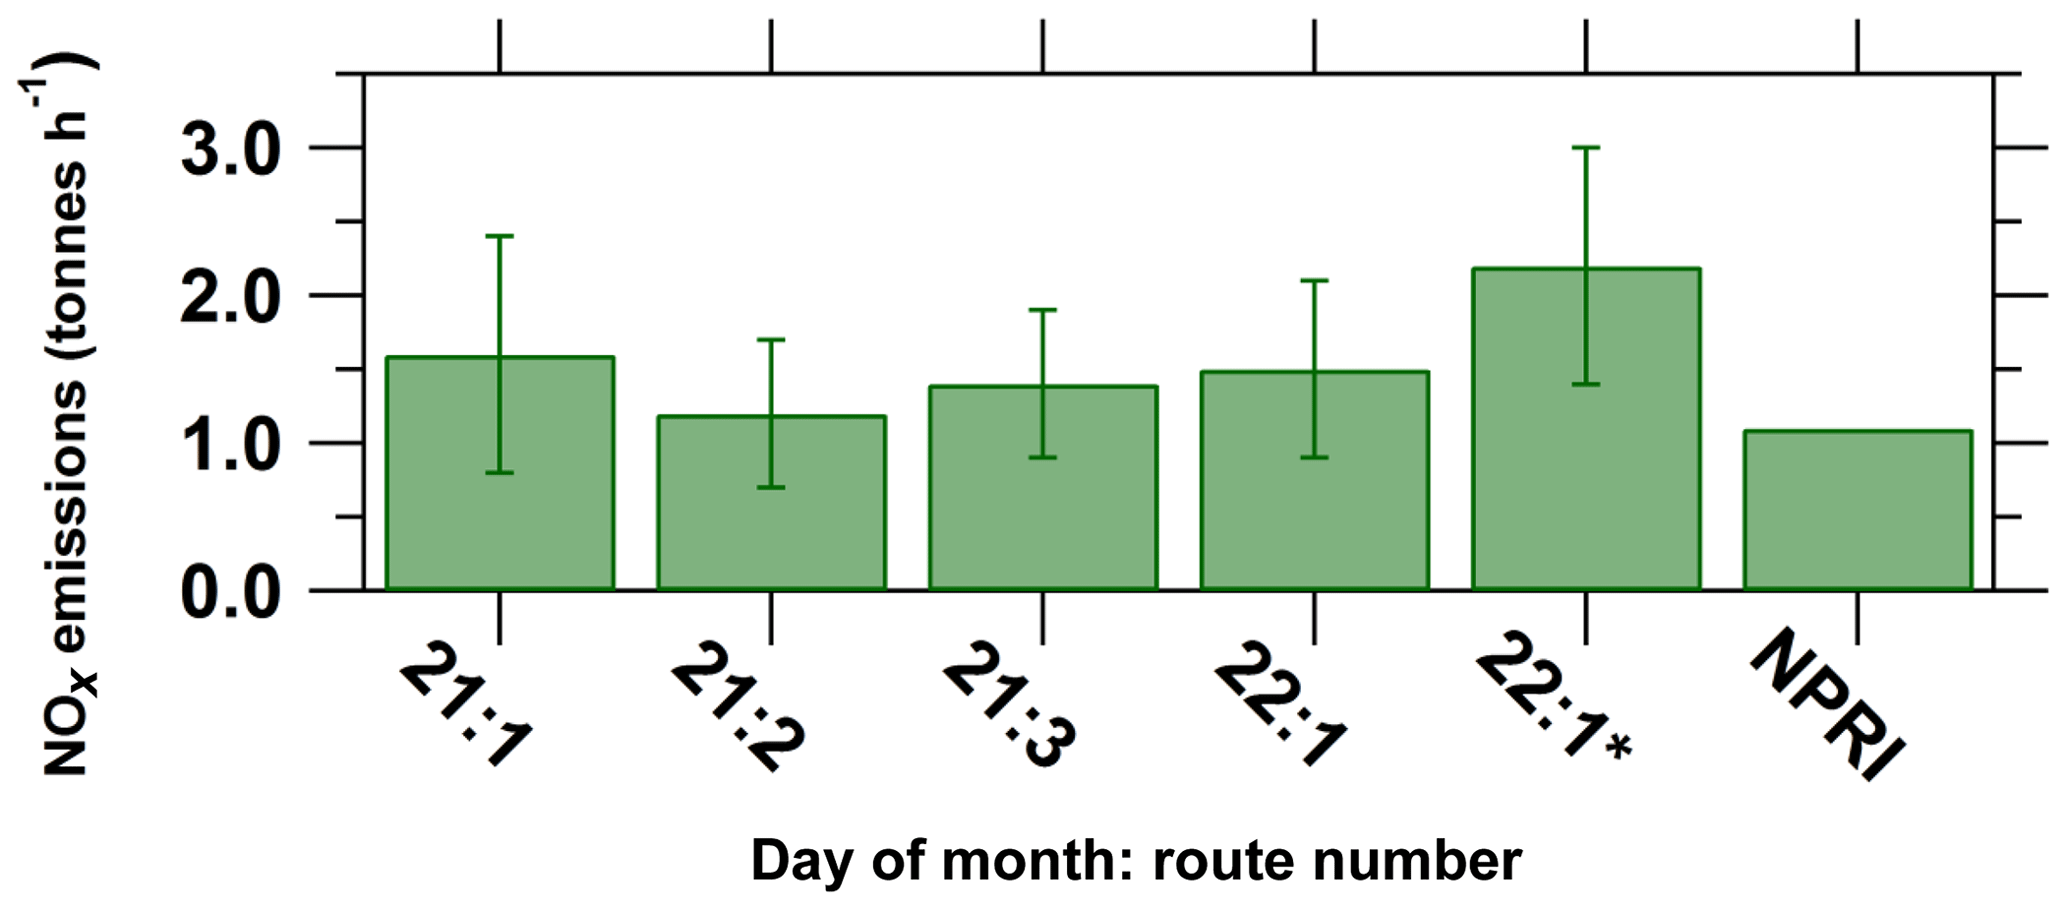
Figure 8Lower-limit estimates of NOx emissions from Sarnia on Day 1 and Day 3 and 2016 NPRI emissions. The 22:1* NOx emission estimate used individual NOx∕NO2 ratio values for each VCDs rather than a single average ratio.
However, the difference between emission estimates calculated using individual NOx∕NO2 ratios versus a route-averaged value can be nontrivial, as observed with the Day 2 route 1. Day 2 had consistent northerly wind conditions, and east–west transects were driven south of Sarnia to capture the urban plume and background regions to the east (Fig. 4). The resultant Sarnia NOx emission using the first method is consistent with the first three Day 1 emission estimates but the application of the second method (individual NOx∕NO2 ratios collocated with each VCD) increased the emission estimate by ∼50 % (Table 4 and Fig. 8). The NOx∕NO2 ratio was generally consistent with the averaged value of 1.3 (maximum NOx∕NO2 removed) but increased to 3 in the region of maximum NO2 VCD enhancements 7 km south of the NOVA Chemicals facility (Table 2). The calculated Leighton ratio for this peak NOx∕NO2 ratio location is less than 1 (see Sect. 3.3 and Table 3). The Leighton ratio suggests the plume from the NOVA Chemical facility had significant NO that had not had sufficient time to come to a photostationary state. The emission estimate using individual NOx∕NO2 ratios is considered the more accurate value for this route compared to the emission value calculated using the route-averaged ratio.
The importance of measuring the local NOx∕NO2 ratio is also illustrated by observing variation in the ratio due to the impact of the Michigan power plant plumes, apparent in the Day 1 route 1 east–west transect (Fig. 3a). The NOx∕NO2 ratio along this transect increased to ∼1.7 (Fig. 7), higher than the maximum NOx∕NO2 ratio observed in the north–south transect downwind of Sarnia. A higher ratio is somewhat unexpected because the distance between the source and receptor measurement for the power plant source was greater than the source–receptor distance for the Sarnia sources. Thus, the power plant plume would have been expected to be more aged, but the results suggest that the power plant plumes had a slower conversion of NO to NO2 perhaps due to higher initial mixing ratios of NOx (Nunnermacker et al., 2000). Very high NO mixing ratios in a power plant plume (i.e., >40 ppb) could completely titrate the ambient O3 in the air entrained into the plume, an observation previously seen in power plant plumes (Brown et al., 2012).
The east–west transect appears to have captured approximately half of the power plant plume since the NO2 VCDs and the NO2 mixing ratios increase from background to a plateau at a maximum (Fig. 2a). A preliminary estimation of the NOx and SO2 emissions from the power plants can be determined by scaling up the flux integral from the appropriate section of the east–west transect by a factor of 2. While this is highly uncertain, we do this to make a 1st-order estimate of the power plant plumes on the US side of the border. In this case, we have used VCDinflux=2–3×10¹⁵ for NOx and zero for SO2 since the background region SO2 DSCDs were at or below detection limits. The NOx estimate used individual NOx∕NO2 ratios because the NOx∕NO2 ratio was significantly higher in the plume than outside the plume. This illustrates the importance of in situ instruments of NOx∕NO2, especially when close to the source where plume NOx∕NO2 ratios can be variable (Valin et al., 2013). Given the above assumptions, a tentative 1st-order estimate of the total emissions from the power plants are 0.31–0.46 t NOx h−1 and 0.77 t SO2 h−1, respectively. The hourly emissions of the power plants from reported 2015 annual values are 0.74 t NOx h−1 and 2.56 t SO2 h−1 (United States EPA, 2018). Our hourly estimates are only preliminary since only half of the plume (approximately) was captured by the measurement transect.
The NOx emission estimates from Sarnia from Day 1 are consistent within 25 % and are consistent with the Day 2 estimates within the calculated error of approximately ±45 % (Fig. 8, Table 4). Some variability between the emission estimates is expected due to wind data uncertainties, NOx∕NO2 vertical profile variability, errors introduced by using a constant VCDinflux and NOx lifetime, and temporal variations in emissions from the source.
Conversion of the hourly-measured emissions to annual emissions would require knowledge and application of daily, weekly, and seasonal emission profiles, which is beyond the scope of this work. The mobile MAX-DOAS emission estimates are reported in units of tonnes per hour since routes were completed within <40 min. Events such as flaring can significantly increase the instantaneous emission rate but are excluded from the annual emission inventory data. However, there was no reported flaring during the measurement period (Ontario Ministry of the Environment, Conservation and Parks – MOECC, personal communication, 2017). NOx emissions from petrochemical facilities, excluding flaring, typically have low variability during periods of continuous operation. According to Ryerson et al. (2003), variation in average hourly NOx emissions from a petrochemical facility reported by industry (continuous emissions monitoring system data) was <10 % from an average of the hourly-averaged emissions over 11 d in Houston, Texas. However, this trend may be different for the chemical industry. A 1st-order comparison to the 2017 National Pollution Release Inventory (NPRI) values (downscaled by assuming constant emissions) was made to determine whether our measured Sarnia emissions are reasonable. The NPRI value is the sum of the NOx emissions from the top nine industrial emitters of NOx in Sarnia, whose emissions would have been captured along the driving routes. The NPRI requires significant point-source industrial facilities to report their pollutant emissions, but the method of estimating emissions can vary by facility (Environment and Climate Change Canada, 2015). The NPRI emission value does not include mobile and area sources from the Sarnia region. Thus, the NPRI emission inventory values for Sarnia would be expected to be smaller than our measured emissions because of this exclusion. The measured NOx emissions are larger than the 2017 NPRI value but not statistically so (Fig. 8; Table 4). The exception is the Day 1 route 1* value, which is statistically higher. The average of the four NOx emission estimates from Sarnia is greater than the 2017 NPRI value. These results demonstrate that our measured emission rates are reasonable. Future mobile MAX-DOAS studies could focus on determining diurnal trends in emissions by driving multiple routes at as many times of the day as possible on multiple days, seasons, and weekdays or weekends. Measurements of vertical wind profiles could reduce emission uncertainty to allow for identification of temporal trends by comparing same-day measurements.
Table 5Average emission estimates from mobile MAX-DOAS using 10 m wind speeds and from NPRI.
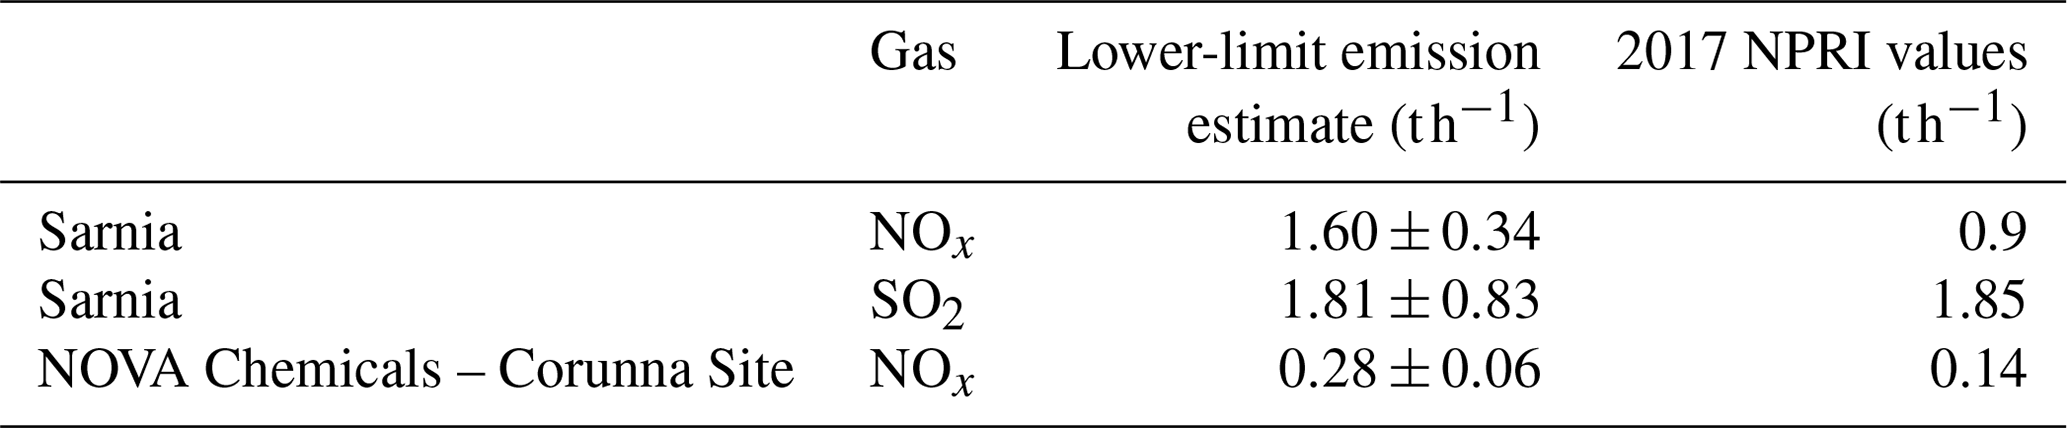
Apart from NOx, we were also able to estimate SO2 emissions from the Sarnia urban and industrial region during one route when the SO2 DSCDs were detectable, Day 1 route 3 (Table 5). Our SO2 emission estimate using the 10 m wind speed is consistent within error with the 2017 NPRI value (Table 5). We expect our SO2 emission estimate to be closer to the NPRI values compared to the NOx estimates because SO2 emissions from area and mobile sources in Sarnia are expected to be small relative to industrial sources (Ministry of the Environment and Climate Change, 2017). Since ships were not operating in the St Clair River at this time of year, shipping emissions of SO2 were absent. Thus SO2 plumes in this region are localized to the major industrial emission sources. Therefore, the VCDs from the areas unaffected by the Sarnia plumes are representative of background values, VCDinflux. While the mobile MAX-DOAS was able to capture these plumes (Fig. 9), only one of seven local monitoring stations (LaSalle Road, Fig. S1) observed elevated levels of SO2 during this period. The undersampling by stations is due to the highly localized nature of the SO2 plumes that are from stacks where the plume is frequently elevated above the surface. These results illustrate the complementary nature of mobile MAX-DOAS and in situ measurements and the importance of monitoring techniques that can capture localized plumes independent of the wind direction.
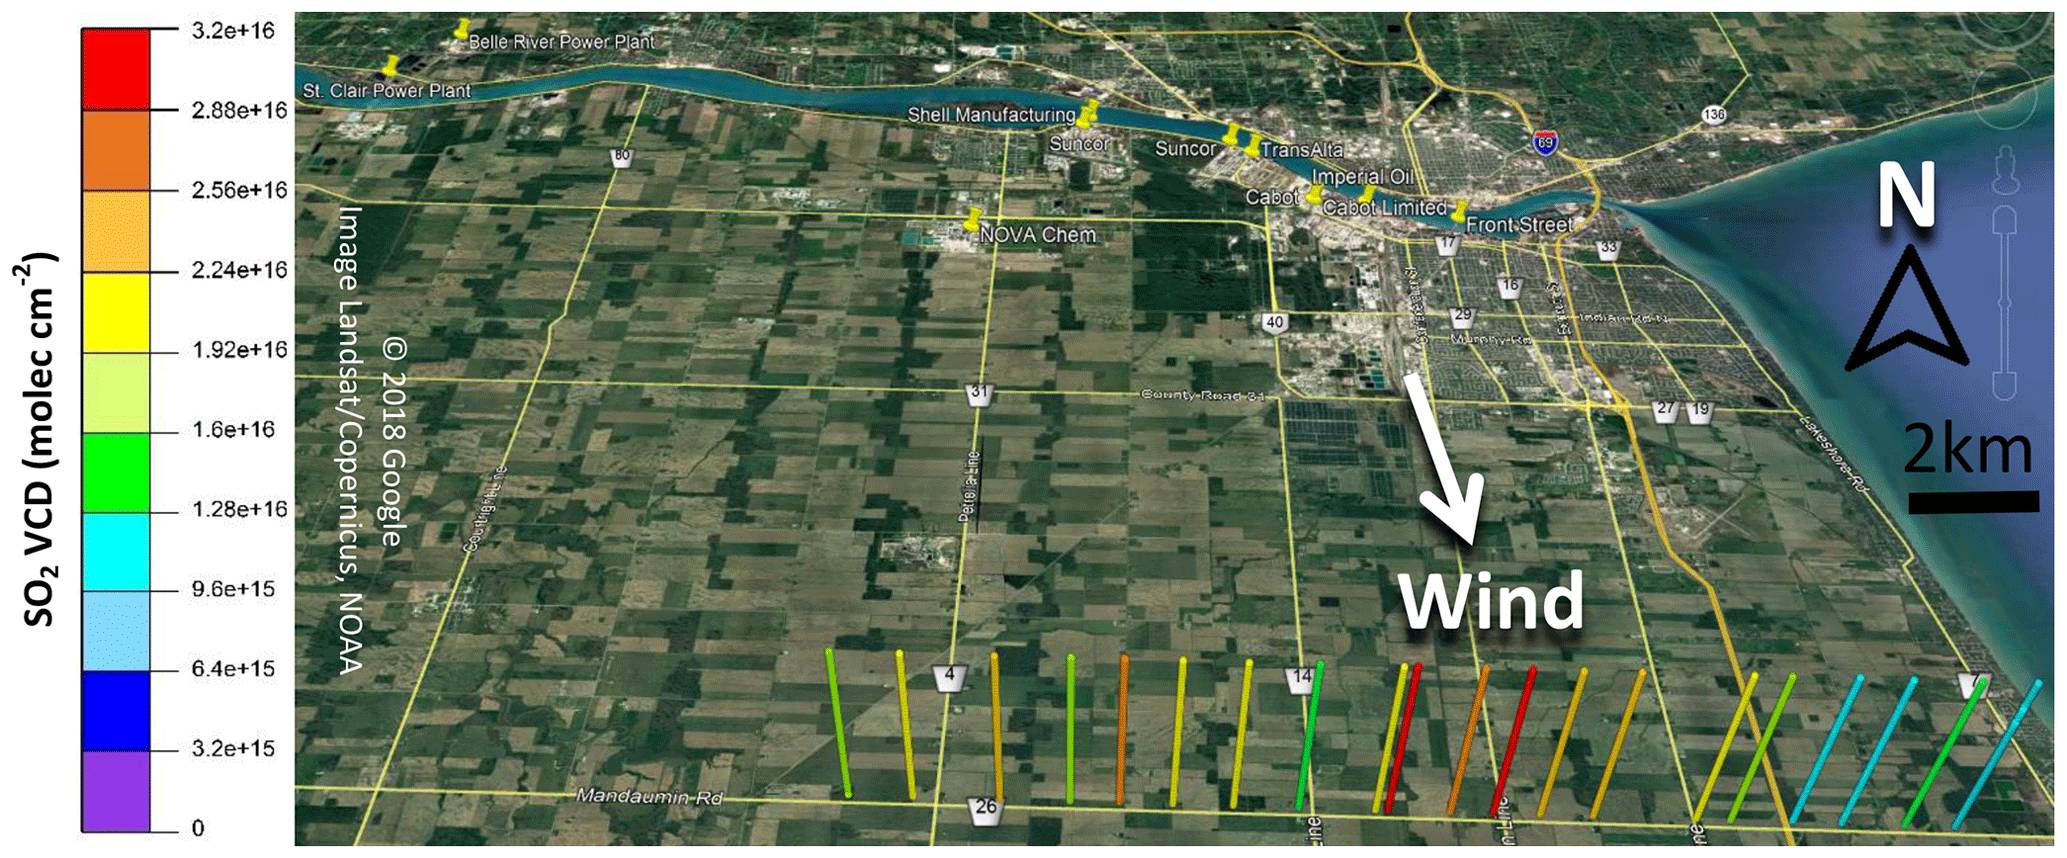
Figure 9SO2 VCDs along route for emission estimate (Day 1 route 3).
3.4.2 Emission estimates of NOVA Chemicals industrial facility
NOx emissions were opportunistically measured from a single facility on Day 3 because the southerly wind directions isolated this plume (Environment and Climate Change Canada, 2018b) from other industrial sources in Sarnia. The plume originated from Nova Chemicals (labelled Nova Chem), the second highest emitter of NOx in the region in 2017. These conditions allowed us to test the mobile MAX-DOAS method in isolating a single plume. The wind direction on Day 3 indicated that the air masses originated from rural areas south of Sarnia and the VCDinflux was expected to be low, .
The emission estimates of NOx from the two routes on Day 3 from the NOVA Chemicals industrial site (Tables 4 and 5) are consistent with each other within 10 %. The consistency increases confidence in fitting the spectra in each transect against a local FRS and removing influx using the average background VCDs rather than using the DSCDOffset method in this case. The use of background VCDs is appropriate because vehicular traffic upwind of the measurement transect is minimal in the local area. Upwind emissions were unlikely to have contributed significantly to the total measured emissions. The emission estimates from NOVA Chemicals are larger than the 2017 NPRI values (Tables 4 and 5). This comparison merely indicates that the mobile MAX-DOAS values are reasonable given that there was likely diurnal variability and the measurements were taken only during a single hour on a single day.
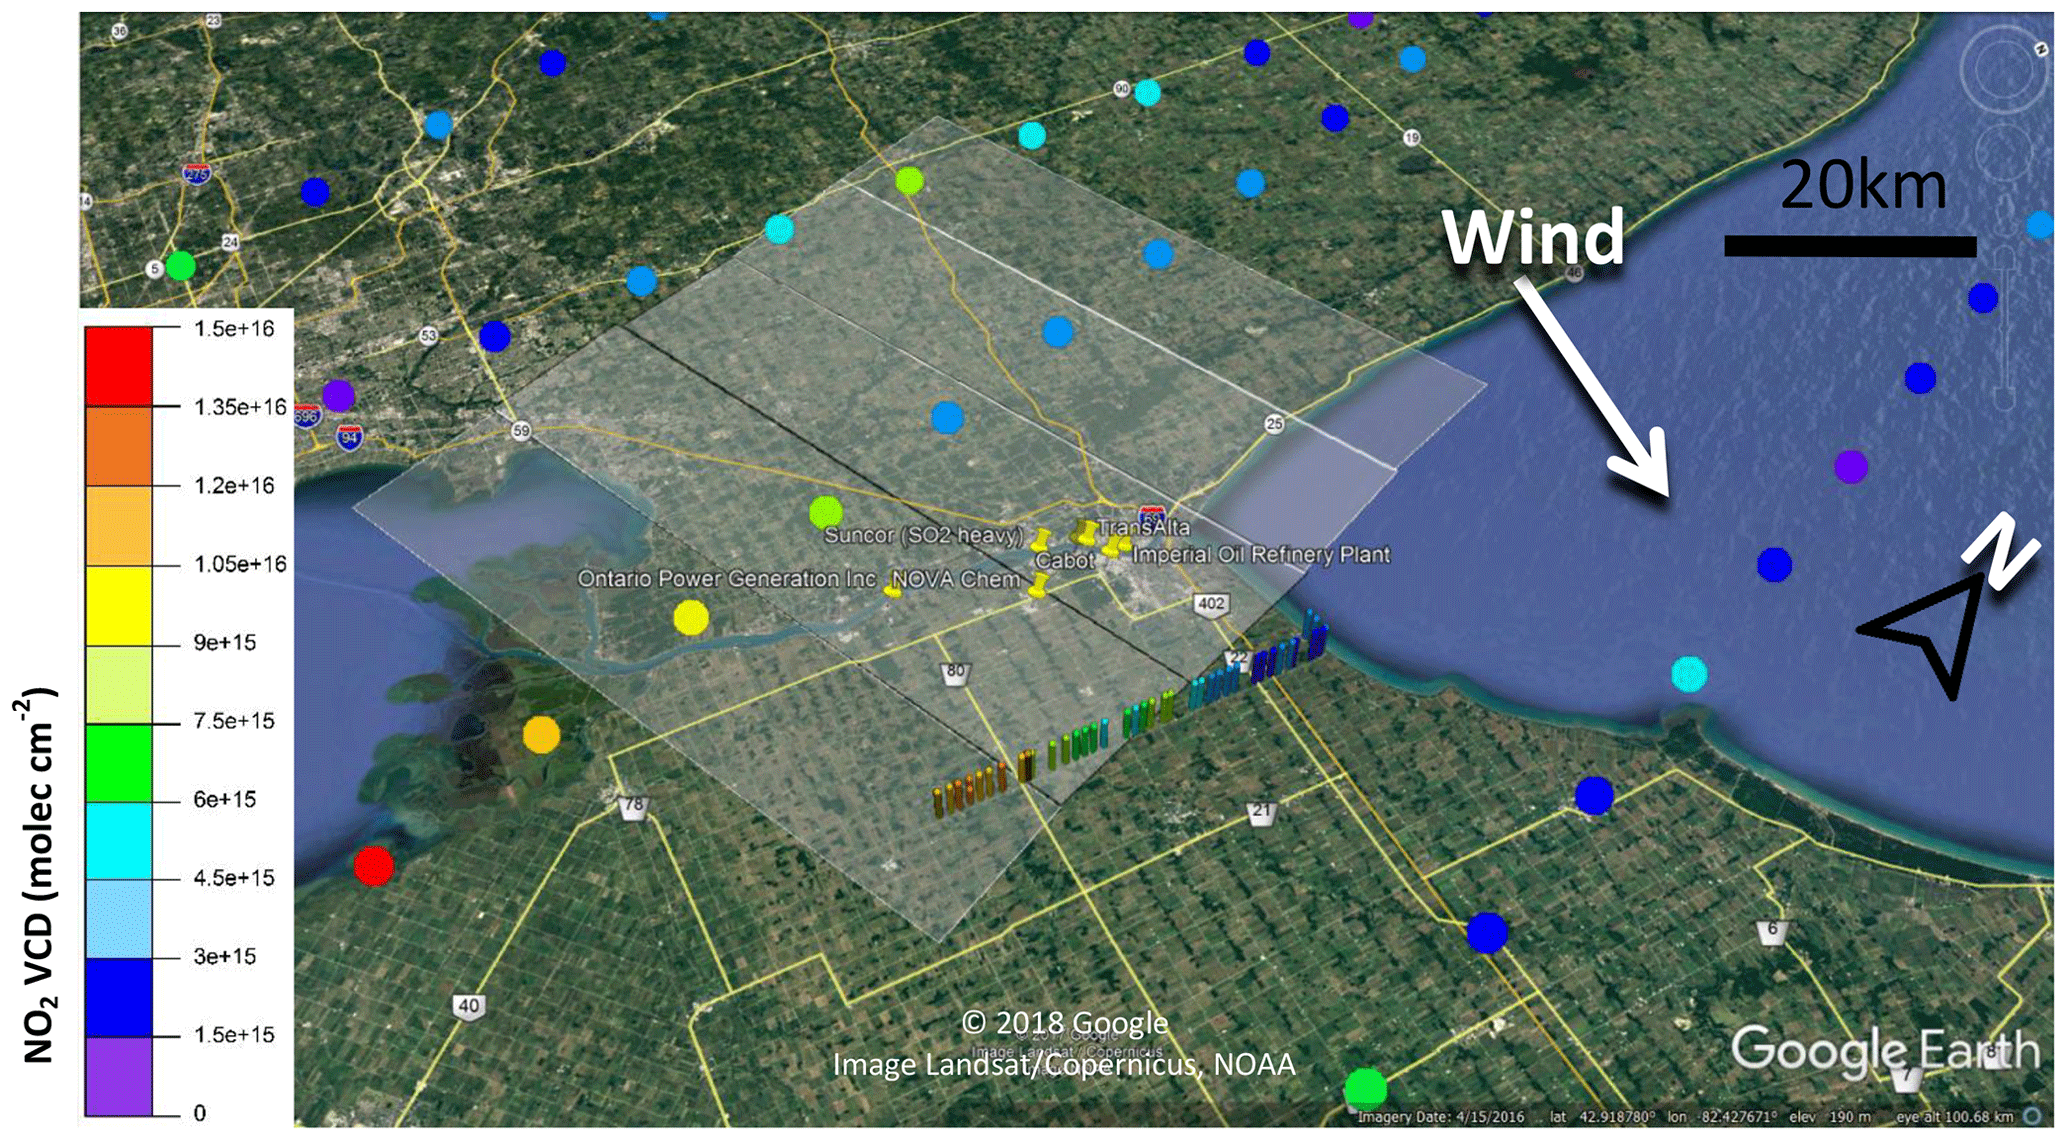
Figure 10Day 1 NO2 VCDs from OMI satellite VCDs and mobile MAX-DOAS route 4. OMI satellite pixels closest to Sarnia were measured at ∼18:00 local time. Semiopaque rectangles centered on the coloured dots (indicating satellite VCD value) indicate the spatial extent of the pixel.
3.5 Comparison of OMI satellite and MAX-DOAS VCDs
The satellite and MAX-DOAS NO2 VCDs on Day 1 exhibit similar spatial trends in the simple sense that NO2 VCDs increase towards the south from the background regions north of Sarnia (Fig. 10). This trend is probably due to a combination of emissions from USA power plants, the Detroit area, and Sarnia. The NO2 VCD of the pixel containing the majority of the Sarnia industrial facilities is comparable to rural area VCDs to the northwest of Sarnia. Only 1∕8 of the Sarnia pixel's footprint region is likely to be impacted by Sarnia emissions, and the remainder observes mostly rural to semirural regions. The OMI pixel from Day 3 (Fig. 11) containing Sarnia exhibits a minimal increase in NO2 VCD (1–2×10¹⁵ ) compared to the surrounding background regions (Fig. 11). In contrast, the mobile MAX-DOAS measurements observed VCD enhancements of up to 1×10¹⁶ within this pixel. The averaging due by the large pixel size (24 km×84 km) causes underestimation of the maximum VCDs. Identification of Sarnia-only emissions without error due to horizontal averaging or inclusion of other sources may require satellite measurements with nadir-viewing pixels centered on Sarnia and/or extremely large averaging times.
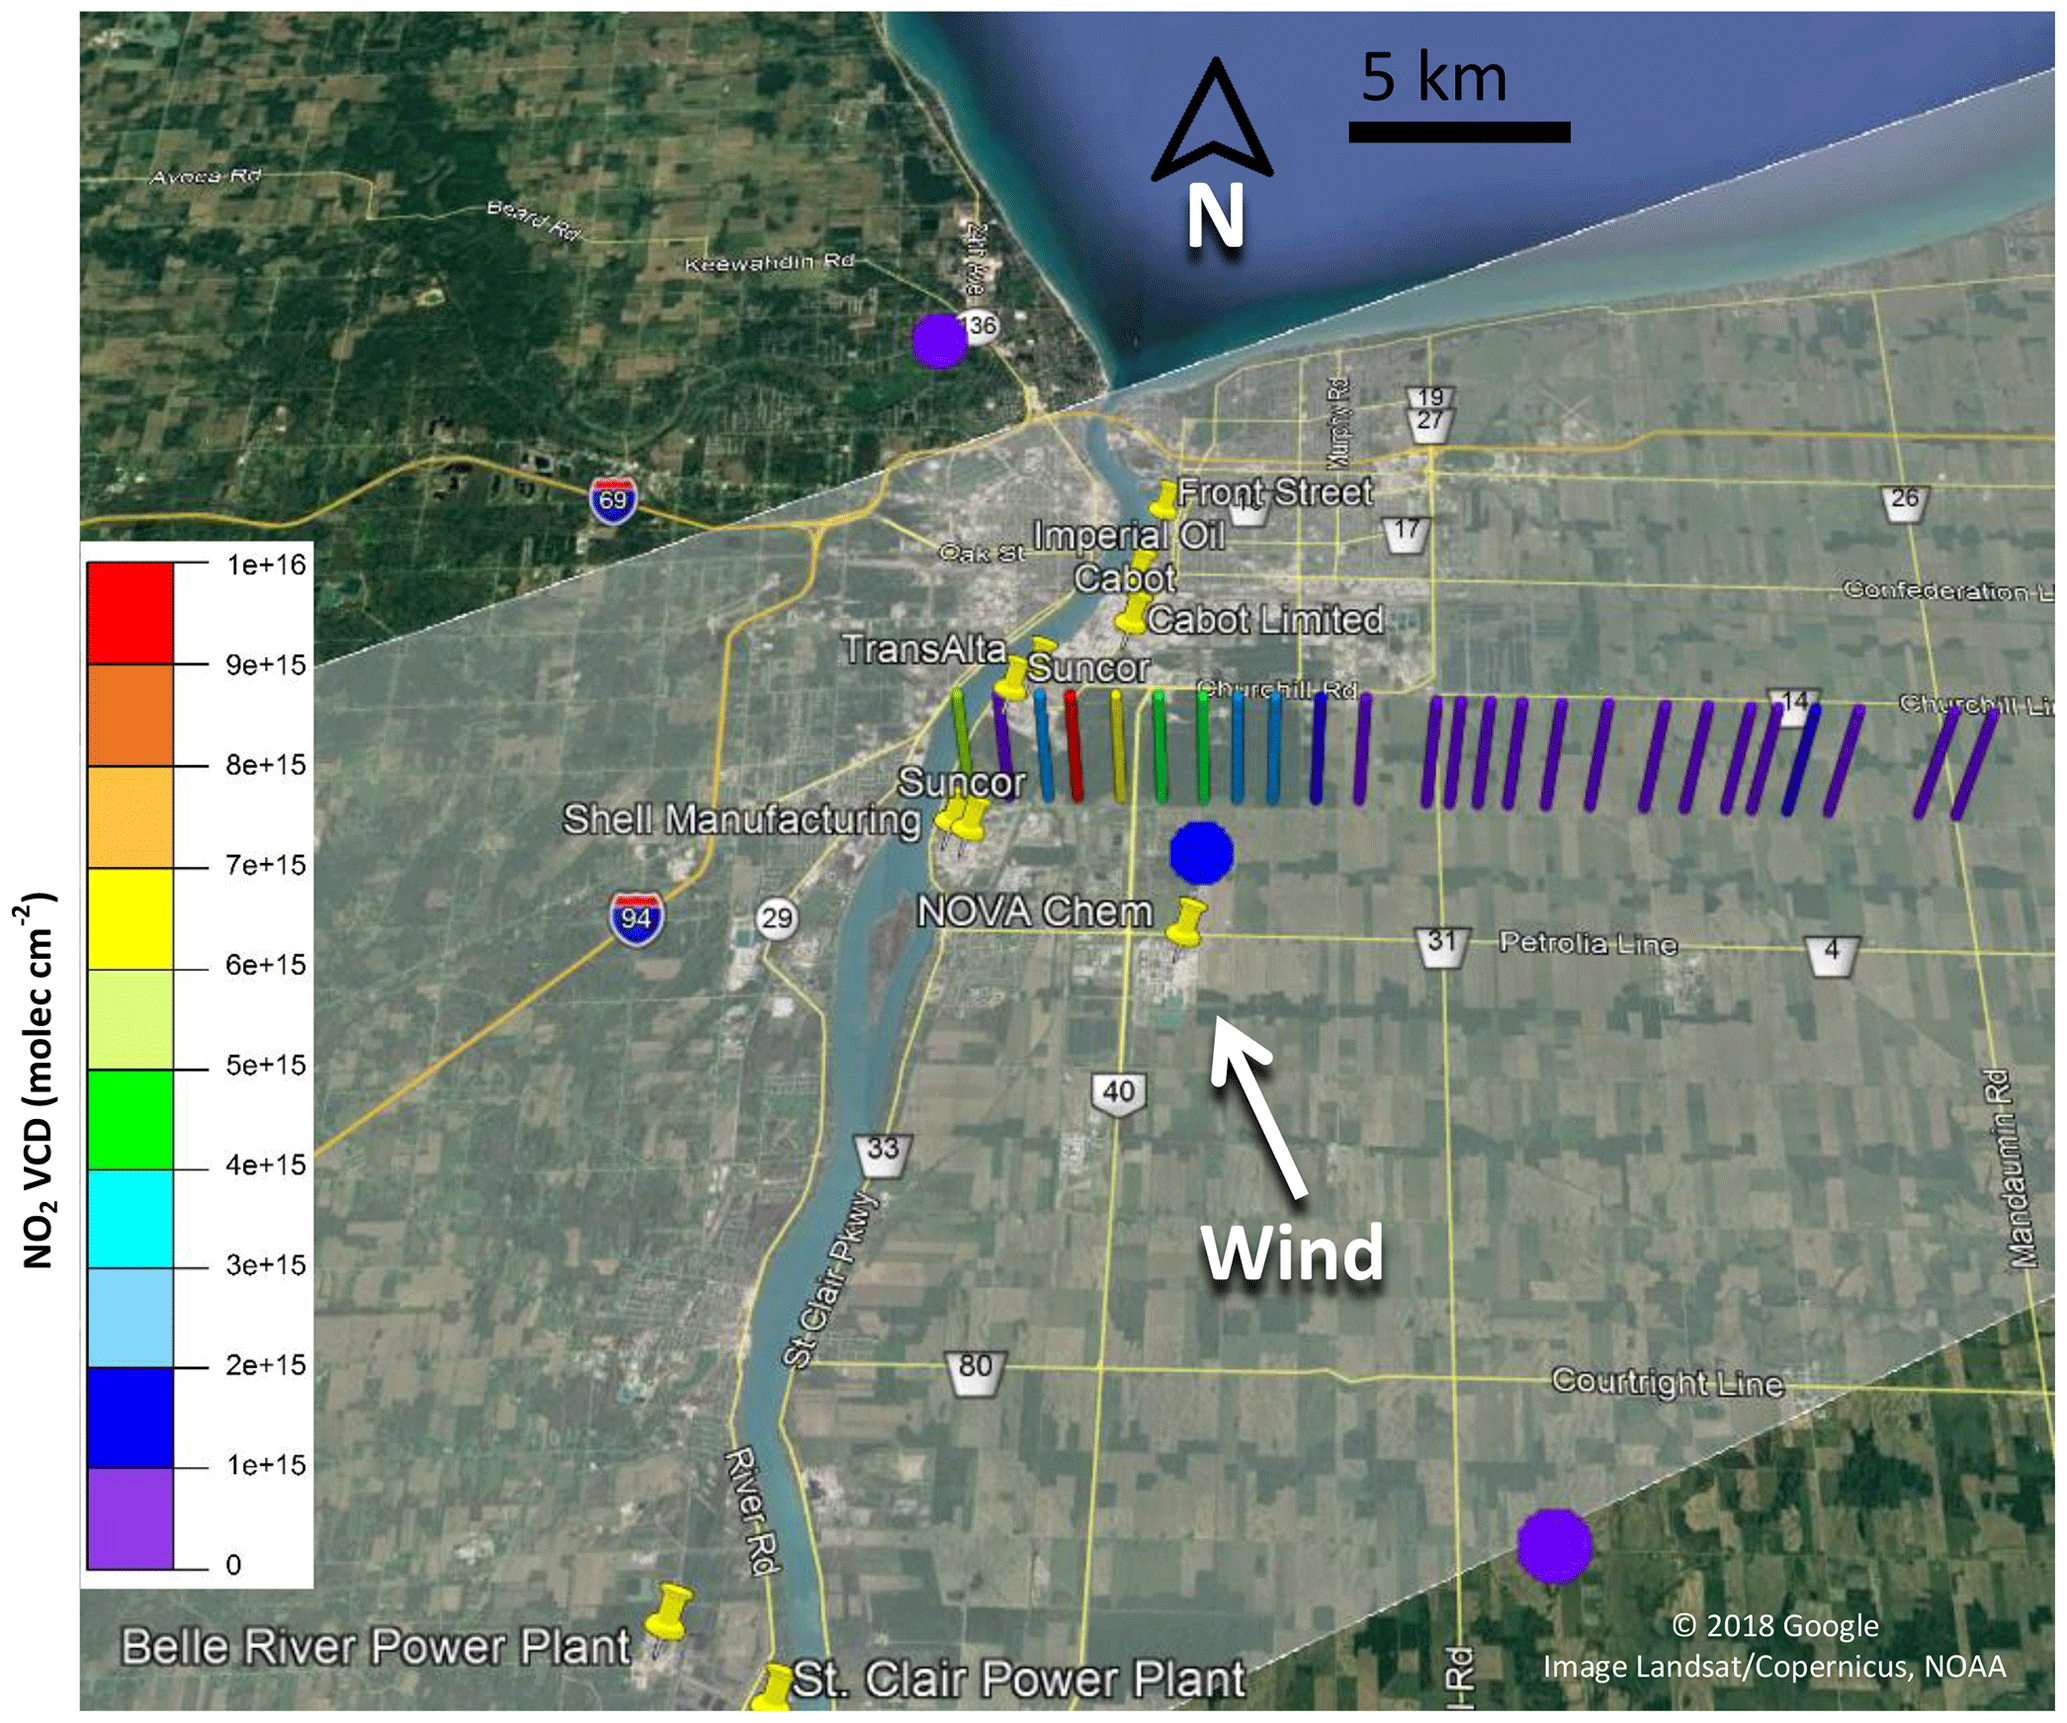
Figure 11Day 3 NO2 VCDs from OMI satellite and mobile MAX-DOAS route 1. OMI pixels shown were measured at ∼18:00 local time. Semiopaque rectangle centered on the coloured dots indicates the spatial extent of the pixel.
3.6 Uncertainties in this study and recommended improvements for mobile MAX-DOAS measurements
Many of the factors that increased the uncertainty in the emission values in this study can be significantly reduced in future through relatively small changes in the method. The many factors have been addressed in the Supplement (Sect. S7) and summarized in Table S9. Ideally accurate horizontal flux measurements would require knowledge of the vertical and horizontal profile of pollutant concentrations as well as the vertical and horizontal profile of wind vectors. Lack of knowledge of the vertical profile of wind speed increases uncertainty in mobile MAX-DOAS emission estimates since elevated plumes and well-mixed plumes are transported by winds with typically higher speeds than those near the surface. Future studies could focus on reducing uncertainty by using measurements from sodar, lidar, tall towers, balloon soundings, or a radio acoustic meteorological profiler. In this study, uncertainty was increased (18 %–30 % based on sensitivity analysis; see Supplement S5 and S7) because driving routes could not always include measurements along influx regions (Day 1) due to road proximity to sources or obstructions to the viewing field. Future experiments could measure influx values while stationary at multiple locations along the upwind region chosen for an unobstructed viewing field. Very low background trace-gas levels also resulted in SO2 DSCDs that were below detection limit most of the time, while being occasionally below detection limit for NO2 (Fig. 2e). A spectrometer with higher sensitivity giving lower detection limits could solve this issue. Increased averaging of spectra would also improve detectability but at the expense of worse spatial resolution, unless measurements can be made at a slower driving speed. Uncertainty in the NOx lifetime was a small contribution to uncertainty in this study (up to ±12 %) because the distances and transport times between source and measurement locations were relatively small (<25 km). The exception was Day 1 route 1 where uncertainty was up to 30 % due to low wind speeds. The error contribution of NOx lifetime could be nontrivial if driving routes are far from the sources (e.g., large cities). This error could also be nontrivial if the lifetime that one assumes does not account for the multiple factors discussed in Sect. 3.3. Bias in the emission estimates from an incorrect lifetime could be avoided by determining NOx lifetimes from photochemical modelling or, for large cities, satellite observations (Beirle et al., 2011) but taking into account wind speeds (Valin et al., 2013).
In this study, we combined mobile MAX-DOAS techniques with mobile NOx measurements and a modular meteorological station to measure emissions of NOx and SO2 from the Sarnia region, a relatively small urban and industrial city. Trace-gas VCDs were determined using the DSCDoffset method (Wagner et al., 2010) or by fitting measured spectra against a route-local low-pollution spectrum. Both methods provided good results, which suggest that the first method is ideal if there are many hours of measurements and the second method is ideal when short routes contain low-pollution regions. Average lower-limit mobile MAX-DOAS emissions of NOx from Sarnia were measured to be 1.60±0.34 t h−1 using 10 m elevation measured wind speeds. The estimates were larger than the downscaled 2017 NPRI-reported industrial emissions of 0.9 t h−1 (Environment and Climate Change Canada, 2018b) but the NPRI estimate excludes area and mobile emissions. Our lower-limit SO2 emission measurement for Sarnia was 1.81±0.83 t h−1 using 10 m wind speeds, which is equal within uncertainty to the 2017 NPRI value of 1.85 t h−1 (Environment and Climate Change Canada, 2018c). Our average lower-limit NOx emission measurement from the NOVA Chemicals facility was 0.28±0.06 t h−1, the same order of magnitude as the 2016 NPRI value of 0.14 t h−1 (Environment and Climate Change Canada, 2018a).
Simultaneous measurements of NO–NO2–NOx improved the accuracy of NOx emission estimates when plumes of varying ages were observed. The NOx results from Days 1 and 2 suggest that accurate mobile MAX-DOAS NOx emission measurements from routes that observe plumes with differing ages require accurate knowledge of the localized NOx∕NO2 ratio.
The variability in the ratio of the NO2 VCDs and mixing ratios indicates that surface NO2 mixing ratios cannot be reliably estimated from NO2 VCDs and boundary layer height alone when pollution is emitted from sources of varying heights and chemical composition. A NOx analyzer can be an essential component of mobile MAX-DOAS NO2 measurements. The addition of this instrument allows the method to characterize the boundary layer fully and accurately estimate NOx emissions from NO2 measurements when multiple NOx sources are present and when transects are sufficiently distant from the sources.
The modular meteorological station improved knowledge of local wind essential to identify time periods of low temporal variability, ensuring low error due to wind estimation. These time periods would have been difficult to identify with only hourly-averaged or modelled wind data. Accurate knowledge of the vertical wind profile would significantly enhance the accuracy of the mobile MAX-DOAS emission estimates. Future studies could obtain vertical wind profiles using sodar, lidar, windRASS, and radiosonde on a weather balloon or local aircraft soundings.
Mobile MAX-DOAS measurements identified significant OMI intrapixel inhomogeneity and observed industrial pollution enhancements that were poorly captured by the in situ ground stations. These results suggest that mobile MAX-DOAS has clear advantages in similar industrial regions over other remote sensing techniques used for estimating emissions (e.g., using aircraft or satellite): higher spatial resolution, the potential for multiple emission estimates per day (i.e., observations of diurnal trends), and much lower operational costs. Mobile MAX-DOAS is a top-down low-cost solution for validating bottom-up inventories that complements in situ monitoring and has significant utility in smaller regions with significant emissions where satellite applications are limited. Future mobile MAX-DOAS studies in such regions can focus on measuring temporal trends in emissions.
The MAX-DOAS data collected from this study are publicly available with the following DOI: https://doi.org/10.5683/SP2/8C4CLX (Davis and McLaren, 2019).
The supplement related to this article is available online at: https://doi.org/10.5194/acp-19-13871-2019-supplement.
ZYWD conceived of and organized the field campaign with aid from RM. ZYWD, SB, AK, WF, CC, and RM carried out the experiments in Sarnia. CAM modelled conditions for the satellite retrievals of NO2 in the region of Sarnia and provided useful advice. ZYWD and RM prepared the manuscript, with contributions from all co-authors.
The authors declare that they have no conflict of interest.
This study was completed with collaborative support from the Ontario Ministry of the Environment and Climate Change (MOECC). Zoe Y. W. Davis would like to acknowledge support from the York University Faculty of Graduate Studies and would like to thank Barry Duffey at the Ontario Ministry of Environment and Climate Change for his support at the project start. We also thank Tony Munoz of MOECC for his continued support of our research.
This research has been supported by the Natural Sciences and Engineering Research Council of Canada (Discovery grant no. RGPIN-2018-05898) and Collaborative Research and Training Experience (grant no. 398061-2011).
This paper was edited by Robert Harley and reviewed by two anonymous referees.
Alicke, B., Platt, U., and Stutz, J.: Impact of nitrous acid photolysis on the total hydroxyl radical budget during the limitation of oxidant production/Pianura Padana Produzione di Ozono study in Milan, J. Geophys. Res., 107, 8196, https://doi.org/10.1029/2000JD000075, 2002.
Baray, S., Darlington, A., Gordon, M., Hayden, K. L., Leithead, A., Li, S.-M., Liu, P. S. K., Mittermeier, R. L., Moussa, S. G., O'Brien, J., Staebler, R., Wolde, M., Worthy, D., and McLaren, R.: Quantification of methane sources in the Athabasca Oil Sands Region of Alberta by aircraft mass balance, Atmos. Chem. Phys., 18, 7361–7378, https://doi.org/10.5194/acp-18-7361-2018, 2018.
Beirle, S., Boersma, K. F., Platt, U., Lawrence, M. G., and Wagner, T.: Megacity Emissions and Lifetimes of Nitrogen Oxides Probed from Space, Science, 333, 1737–1739, https://doi.org/10.1126/science.1207824, 2011.
Boersma, K. F., Eskes, H. J., Veefkind, J. P., Brinksma, E. J., van der A, R. J., Sneep, M., van den Oord, G. H. J., Levelt, P. F., Stammes, P., Gleason, J. F., and Bucsela, E. J.: Near-real time retrieval of tropospheric NO2 from OMI, Atmos. Chem. Phys., 7, 2103–2118, https://doi.org/10.5194/acp-7-2103-2007, 2007.
Bogumil, K., Orphal, J., Homann, T., Voigt, S., Spietz, P., Fleischmann, O. C., Vogel, A., Hartmann, M., Kromminga, H., Bovensmann, H., Frerick, J., and Burrows, J. P.: Measurements of molecular absorption spectra with the SCIAMACHY pre-flight model: instrument characterization and reference data for atmospheric remote-sensing in the 230–2380 nm region, J. Photochem. Photobiol. Chem., 157, 167–184, https://doi.org/10.1016/S1010-6030(03)00062-5, 2003.
Brinksma, E. J., Pinardi, G., Volten, H., Braak, R., Richter, A., Schoenhardt, A., van Roozendael, M., Fayt, C., Hermans, C., Dirksen, R. J., Vlemmix, T., Berkhout, A. J. C., Swart, D. P. J., Oetjen, H., Wittrock, F., Wagner, T., Ibrahim, O. W., de Leeuw, G., Moerman, M., Curier, R. L., Celarier, E. A., Cede, A., Knap, W. H., Veefkind, J. P., Eskes, H. J., Allaart, M., Rothe, R., Piters, A. J. M., and Levelt, P. F.: The 2005 and 2006 DANDELIONS NO2 and aerosol intercomparison campaigns, J. Geophys. Res.-Atmos., 113, D16S46, https://doi.org/10.1029/2007JD008808, 2008.
Brown, S. S., Dube, W. P., Karamchandani, P., Yarwood, G., Peischl, J., Ryerson, T. B., Neuman, J. A., Nowak, J. B., Holloway, J. S., Washenfelder, R. A., Brock, C. A., Frost, G. J., Trainer, M., Parrish, D. D., Fehsenfeld, F. C., and Ravishankara, A. R.: Effects of NOx control and plume mixing on nighttime chemical processing of plumes from coal-fired power plants, J. Geophys. Res.-Atmos., 117, D07304, https://doi.org/10.1029/2011JD016954, 2012.
Davis, Z. Y. W. and McLaren, R.: Replication Data for: Estimation of NOx and SO2 emissions from Sarnia, Ontario, using a mobile MAX-DOAS and a NOx analyzer, Scholars Portal Dataverse, https://doi.org/10.5683/SP2/8C4CLX, 2019.
Davis, Z. Y. W., Frieß, U., Strawbridge, K. B., Aggarwaal, M., Baray, S., Schnitzler, E. G., Lobo, A., Fioletov, V. E., Abboud, I., McLinden, C. A., Whiteway, J., Willis, M. D., Lee, A. K. Y., Brook, J., Olfert, J., O'Brien, J., Staebler, R., Osthoff, H. D., Mihele, C., and McLaren, R.: Validation of MAX-DOAS retrievals of aerosol extinction, SO2 and NO2 through comparison with lidar, sun photometer, Active-DOAS and aircraft measurements in the Athabasca Oil Sands Region, Atmos. Meas. Tech. Discuss., https://doi.org/10.5194/amt-2019-296, in review, 2019.
Dragomir, C. M., Constantin, D.-E., Voiculescu, M., Georgescu, L. P., Merlaud, A., and Van Roozendael, M.: Modeling results of atmospheric dispersion of NO2 in an urban area using METI-LIS and comparison with coincident mobile DOAS measurements, Atmos. Pollut. Res., 6, 503–510, https://doi.org/10.5094/APR.2015.056, 2015.
Dunlea, E. J., Herndon, S. C., Nelson, D. D., Volkamer, R. M., San Martini, F., Sheehy, P. M., Zahniser, M. S., Shorter, J. H., Wormhoudt, J. C., Lamb, B. K., Allwine, E. J., Gaffney, J. S., Marley, N. A., Grutter, M., Marquez, C., Blanco, S., Cardenas, B., Retama, A., Ramos Villegas, C. R., Kolb, C. E., Molina, L. T., and Molina, M. J.: Evaluation of nitrogen dioxide chemiluminescence monitors in a polluted urban environment, Atmos. Chem. Phys., 7, 2691–2704, https://doi.org/10.5194/acp-7-2691-2007, 2007.
Environment and Climate Change Canada.: Using and interpreting data from the National Pollutant Release Inventory, aem, available at: https://www.canada.ca/en/environment-climate-change/services/national-pollutant-release-inventory/using-interpreting-data.html (last access: 1 August 2018), 2015.
Environment and Climate Change Canada: NPRI Data Search – Facility and Substance Information – NOVA Chemicals (Canada) Ltd. – Corunna Site 2017, available at: https://pollution-waste.canada.ca/national-release-inventory/archives/index.cfm, last access: 17 September 2018a.
Environment and Climate Change Canada: NPRI Data Search – Facility Search Results Nitrogen oxides (expressed as NO2) (11104-93-1), available at: https://pollution-waste.canada.ca/national-release-inventory/archives/index.cfm, last access: 17 September 2018b.
Environment and Climate Change Canada: NPRI Data Search – Facility Search Results Sulphur Dioxide (7446-09-5), available at: https://pollution-waste.canada.ca/national-release-inventory/archives/index.cfm, last access: 17 September 2018c.
Environment and Climate Change Canada: NPRI Facility Search Results – Volatile Organic Compounds (VOCs) (NA-M16), available at: https://pollution-waste.canada.ca/national-release-inventory/archives/index.cfm, last access: 17 September 2018d.
Finlayson-Pitts, B. J. and Pitts, J. N.: Chemistry of the Upper and Lower Atmosphere, Academic Press, San Diego CA, 969 pp., 2000.
Friess, U., Monks, P. S., Remedios, J. J., Rozanov, A., Sinreich, R., Wagner, T., and Platt, U.: MAX-DOAS O4 measurements: A new technique to derive information on atmospheric aerosols: 2. Modeling studies, J. Geophys. Res.-Atmos., 111, D14203, https://doi.org/10.1029/2005JD006618, 2006.
Gordon, M., Li, S.-M., Staebler, R., Darlington, A., Hayden, K., O'Brien, J., and Wolde, M.: Determining air pollutant emission rates based on mass balance using airborne measurement data over the Alberta oil sands operations, Atmos. Meas. Tech., 8, 3745–3765, https://doi.org/10.5194/amt-8-3745-2015, 2015.
Halla, J. D., Wagner, T., Beirle, S., Brook, J. R., Hayden, K. L., O'Brien, J. M., Ng, A., Majonis, D., Wenig, M. O., and McLaren, R.: Determination of tropospheric vertical columns of NO2 and aerosol optical properties in a rural setting using MAX-DOAS, Atmos. Chem. Phys., 11, 12475–12498, https://doi.org/10.5194/acp-11-12475-2011, 2011.
Heckel, A., Richter, A., Tarsu, T., Wittrock, F., Hak, C., Pundt, I., Junkermann, W., and Burrows, J. P.: MAX-DOAS measurements of formaldehyde in the Po-Valley, Atmos. Chem. Phys., 5, 909–918, https://doi.org/10.5194/acp-5-909-2005, 2005.
Heckel, A., Kim, S.-W., Frost, G. J., Richter, A., Trainer, M., and Burrows, J. P.: Influence of low spatial resolution a priori data on tropospheric NO2 satellite retrievals, Atmos. Meas. Tech., 4, 1805–1820, https://doi.org/10.5194/amt-4-1805-2011, 2011.
Honninger, G. and Platt, U.: Observations of BrO and its vertical distribution during surface ozone depletion at Alert, Atmos. Environ., 36, 2481–2489, https://doi.org/10.1016/S1352-2310(02)00104-8, 2002.
Hönninger, G., von Friedeburg, C., and Platt, U.: Multi axis differential optical absorption spectroscopy (MAX-DOAS), Atmos. Chem. Phys., 4, 231–254, https://doi.org/10.5194/acp-4-231-2004, 2004.
Huang, M., Bowman, K. W., Carmichael, G. R., Chai, T., Pierce, R. B., Worden, J. R., Luo, M., Pollack, I. B., Ryerson, T. B., Nowak, J. B., Neuman, J. A., Roberts, J. M., Atlas, E. L., and Blake, D. R.: Changes in nitrogen oxides emissions in California during 2005-2010 indicated from top-down and bottom-up emission estimates, J. Geophys. Res.-Atmos., 119, 12928–12952, https://doi.org/10.1002/2014JD022268, 2014.
Ialongo, I., Hakkarainen, J., Hyttinen, N., Jalkanen, J.-P., Johansson, L., Boersma, K. F., Krotkov, N., and Tamminen, J.: Characterization of OMI tropospheric NO2 over the Baltic Sea region, Atmos. Chem. Phys., 14, 7795–7805, https://doi.org/10.5194/acp-14-7795-2014, 2014.
Ialongo, I., Herman, J., Krotkov, N., Lamsal, L., Boersma, K. F., Hovila, J., and Tamminen, J.: Comparison of OMI NO2 observations and their seasonal and weekly cycles with ground-based measurements in Helsinki, Atmos. Meas. Tech., 9, 5203–5212, https://doi.org/10.5194/amt-9-5203-2016, 2016.
Ibrahim, O., Shaiganfar, R., Sinreich, R., Stein, T., Platt, U., and Wagner, T.: Car MAX-DOAS measurements around entire cities: quantification of NOx emissions from the cities of Mannheim and Ludwigshafen (Germany), Atmos. Meas. Tech., 3, 709–721, https://doi.org/10.5194/amt-3-709-2010, 2010.
Irie, H., Kanaya, Y., Akimoto, H., Iwabuchi, H., Shimizu, A., and Aoki, K.: First retrieval of tropospheric aerosol profiles using MAX-DOAS and comparison with lidar and sky radiometer measurements, Atmos. Chem. Phys., 8, 341–350, https://doi.org/10.5194/acp-8-341-2008, 2008.
Kim, N. K., Kim, Y. P., Morino, Y., Kurokawa, J., and Ohara, T.: Verification of NOx emission inventories over North Korea, Environ. Pollut., 195, 236–244, https://doi.org/10.1016/j.envpol.2014.06.034, 2014.
Leighton, P. A.: Photochemistry of air pollution, Academic Press, New York, 1961.
Liu, F., Beirle, S., Zhang, Q., Dörner, S., He, K., and Wagner, T.: NOx lifetimes and emissions of cities and power plants in polluted background estimated by satellite observations, Atmos. Chem. Phys., 16, 5283–5298, https://doi.org/10.5194/acp-16-5283-2016, 2016.
McLinden, C. A., Fioletov, V., Boersma, K. F., Krotkov, N., Sioris, C. E., Veefkind, J. P., and Yang, K.: Air quality over the Canadian oil sands: A first assessment using satellite observations, Geophys. Res. Lett., 39, L04804, https://doi.org/10.1029/2011GL050273, 2012.
Ministry of the Environment and Climate Change: Air Quality in Ontario 2014 Report, available at: https://www.ontario.ca/page/air-quality-ontario-2014-report (last access: 17 September 2019), 2015.
Ministry of the Environment and Climate Change: Air Quality in Ontario 2016 Report, available at: https://www.ontario.ca/document/air-quality-ontario-2016-report (last access: 17 September 2019), 2017.
Nunnermacker, L. J., Kleinman, L. I., Imre, D., Daum, P. H., Lee, Y.-N., Lee, J. H., Springston, S. R., Newman, L., and Gillani, N.: NOy lifetimes and O3 production efficiencies in urban and power plant plumes: Analysis of field data, J. Geophys. Res.-Atmos., 105, 9165–9176, https://doi.org/10.1029/1999JD900753, 2000.
Oiamo, T. H., Luginaah, I. N., Atari, D. O., and Gorey, K. M.: Air pollution and general practitioner access and utilization: a population based study in Sarnia, “Chemical Valley,” Ontario, Environ. Health, 10, 71, https://doi.org/10.1186/1476-069X-10-71, 2011.
Platt, U., Perner, D., and Patz, H.: Simultaneous Measurement of Atmospheric CH2O, O3, and NO2 by Differential Optical-Absorption, J. Geophys. Res.-Oceans Atmos., 84, 6329–6335, https://doi.org/10.1029/JC084iC10p06329, 1979.
Platt, U., Perner, D., Harris, G. W., Winer, A. M., and Pitts Jr., J. N.: Observations of nitrous acid in an urban atmosphere by differential optical absorption, Nature, 285, 312–314, 1980.
Platt, U., Stutz, J., and Springer E-books – York University and SpringerLink (Online service): Differential optical absorption spectroscopy: principles and applications, Springer Verlag, Berlin, available at: http://www.library.yorku.ca/eresolver/?id=1261530 (last access: 17 October 2018), 2008.
Rivera, C., Mellqvist, J., Samuelsson, J., Lefer, B., Alvarez, S., and Patel, M. R.: Quantification of NO2 and SO2 emissions from the Houston Ship Channel and Texas City industrial areas during the 2006 Texas Air Quality Study, J. Geophys. Res.-Atmos., 115, D08301, https://doi.org/10.1029/2009jd012675, 2010.
Ryerson, T. B., Trainer, M., Angevine, W. M., Brock, C. A., Dissly, R. W., Fehsenfeld, F. C., Frost, G. J., Goldan, P. D., Holloway, J. S., Hubler, G., Jakoubek, R. O., Kuster, W. C., Neuman, J. A., Nicks, D. K., Parrish, D. D., Roberts, J. M., Sueper, D. T., Atlas, E. L., Donnelly, S. G., Flocke, F., Fried, A., Potter, W. T., Schauffler, S., Stroud, V., Weinheimer, A. J., Wert, B. P., Wiedinmyer, C., Alvarez, R. J., Banta, R. M., Darby, L. S., and Senff, C. J.: Effect of petrochemical industrial emissions of reactive alkenes and NOx on tropospheric ozone formation in Houston, Texas, J. Geophys. Res.-Atmos., 108, 4249, https://doi.org/10.1029/2002JD003070, 2003.
Shabbir, Y., Khokhar, M. F., Shaiganfar, R., and Wagner, T.: Spatial variance and assessment of nitrogen dioxide pollution in major cities of Pakistan along N5-Highway, J. Environ. Sci., 43, 4–14, https://doi.org/10.1016/j.jes.2015.04.038, 2016.
Shaiganfar, R., Beirle, S., Sharma, M., Chauhan, A., Singh, R. P., and Wagner, T.: Estimation of NOx emissions from Delhi using Car MAX-DOAS observations and comparison with OMI satellite data, Atmos. Chem. Phys., 11, 10871–10887, https://doi.org/10.5194/acp-11-10871-2011, 2011.
Shaiganfar, R., Beirle, S., Petetin, H., Zhang, Q., Beekmann, M., and Wagner, T.: New concepts for the comparison of tropospheric NO2 column densities derived from car-MAX-DOAS observations, OMI satellite observations and the regional model CHIMERE during two MEGAPOLI campaigns in Paris 2009/10, Atmos. Meas. Tech., 8, 2827–2852, https://doi.org/10.5194/amt-8-2827-2015, 2015.
Shaiganfar, R., Beirle, S., Denier van der Gon, H., Jonkers, S., Kuenen, J., Petetin, H., Zhang, Q., Beekmann, M., and Wagner, T.: Estimation of the Paris NOx emissions from mobile MAX-DOAS observations and CHIMERE model simulations during the MEGAPOLI campaign using the closed integral method, Atmos. Chem. Phys., 17, 7853–7890, https://doi.org/10.5194/acp-17-7853-2017, 2017.
Tokarek, T. W., Odame-Ankrah, C. A., Huo, J. A., McLaren, R., Lee, A. K. Y., Adam, M. G., Willis, M. D., Abbatt, J. P. D., Mihele, C., Darlington, A., Mittermeier, R. L., Strawbridge, K., Hayden, K. L., Olfert, J. S., Schnitzler, E. G., Brownsey, D. K., Assad, F. V., Wentworth, G. R., Tevlin, A. G., Worthy, D. E. J., Li, S.-M., Liggio, J., Brook, J. R., and Osthoff, H. D.: Principal component analysis of summertime ground site measurements in the Athabasca oil sands with a focus on analytically unresolved intermediate-volatility organic compounds, Atmos. Chem. Phys., 18, 17819–17841, https://doi.org/10.5194/acp-18-17819-2018, 2018.
United States EPA: Air Pollutant Report | ECHO | US EPA, Air Pollut. Rep., available at: https://echo.epa.gov/air-pollutant-report?fid=110000404740, last access: 2 August 2018.
Valin, L. C., Russell, A. R., and Cohen, R. C.: Variations of OH radical in an urban plume inferred from NO2 column measurements, Geophys. Res. Lett., 40, 1856–1860, https://doi.org/10.1002/grl.50267, 2013.
Wagner, T., Dix, B., von Friedeburg, C., Friess, U., Sanghavi, S., Sinreich, R., and Platt, U.: MAX-DOAS O4 measurements: A new technique to derive information on atmospheric aerosols – Principles and information content, J. Geophys. Res.-Atmos., 109, D22205, https://doi.org/10.1029/2004JD004904, 2004.
Wagner, T., Ibrahim, O., Shaiganfar, R., and Platt, U.: Mobile MAX-DOAS observations of tropospheric trace gases, Atmos. Meas. Tech., 3, 129–140, https://doi.org/10.5194/amt-3-129-2010, 2010.
Wagner, T., Beirle, S., Brauers, T., Deutschmann, T., Frieß, U., Hak, C., Halla, J. D., Heue, K. P., Junkermann, W., Li, X., Platt, U., and Pundt-Gruber, I.: Inversion of tropospheric profiles of aerosol extinction and HCHO and NO2 mixing ratios from MAX-DOAS observations in Milano during the summer of 2003 and comparison with independent data sets, Atmos. Meas. Tech., 4, 2685–2715, https://doi.org/10.5194/amt-4-2685-2011, 2011.
Wiegand, A. N. and Bofinger, N. D.: Review of empirical methods for the calculation of the diurnal NO2 photolysis rate coefficient, Atmos. Environ., 34, 99–108, https://doi.org/10.1016/S1352-2310(99)00294-0, 2000.
Wu, F., Li, A., Xie, P., Chen, H., Hu, Z., Zhang, Q., Liu, J., and Liu, W.: Emission Flux Measurement Error with a Mobile DOAS System and Application to NOx Flux Observations, Sensors, 17, 231, https://doi.org/10.3390/s17020231, 2017.