the Creative Commons Attribution 4.0 License.
the Creative Commons Attribution 4.0 License.
 | 19 Nov 2019
Model-measurement consistency and limits of bioaerosol abundance over the continental United States
Maria A. Zawadowicz
Karl D. Froyd
Anne E. Perring
Daniel M. Murphy
Dominick V. Spracklen
Colette L. Heald
Peter R. Buseck
Daniel J. Cziczo
Due to low concentrations and chemical complexity, in situ observations of bioaerosol are geographically and temporally sparse, and this limits the accuracy of current emissions inventories. In this study, we apply a new methodology, including corrections for misidentification of mineral dust, to measurements of single particles over four airborne sampling campaigns to derive vertical profiles of bioaerosol over the continental United States. The new methodology is based on single-particle mass spectrometry (SPMS); it can extend historic datasets to include measurements of bioaerosol, it allows comparisons to other techniques, and it generally agrees with a global aerosol model. In the locations sampled, bioaerosols were at least a factor of 10 less abundant than mineral dust. Below 2 km, bioaerosol concentrations were measured between 6×10³ and 2×10⁴ m−3. Between 2 and 8 km, bioaerosol concentrations were between 0 and 2×10⁴ m−3, and above 8 km, bioaerosol concentrations were between 0 and 1×10³ m−3. Between 30 % and 80 % of single bioaerosol particles detected were internally mixed with dust. A direct comparison of the SPMS methodology with a co-located wideband integrated bioaerosol sensor (WIB) fluorescence sensor on a mountaintop site showed agreement to within a factor of 3 over the common size range.
- Article
(1688 KB) - Full-text XML
- BibTeX
- EndNote


The effects of aerosols, clouds, and their mutual interactions on the climate system are more uncertain than those of greenhouse gases (Boucher et al., 2013). Aerosols can influence Earth's radiative budget both directly, by scattering and absorbing incoming solar radiation, and indirectly, by nucleating clouds. Clouds can then scatter solar radiation and trap terrestrial heat with a balance that depends on their specific properties (Boucher et al., 2013). Water droplets and ice crystals nucleate on pre-existing particles termed cloud condensation nuclei (CCN) and ice nucleating particles (INPs), respectively. Bioaerosol can act as efficient CCN and, because certain bacteria have been shown to be efficient INPs in laboratory studies (Möhler et al., 2008), it has been proposed that bioaerosol could play a significant role in atmospheric ice nucleation (Möhler et al., 2007). Real-time and in situ measurements of atmospheric ice nuclei are scarce, which makes it difficult to directly observe and quantify this effect (Cziczo et al., 2013; Ebert et al., 2011). Because of high activation temperature ( ∘C) of bioaerosol (Möhler et al., 2008), they are expected to have the strongest influence on mixed-phase clouds, which form in this temperature regime (Hoose et al., 2010). However, modeling studies suggest that this effect is most important locally, and it is difficult to capture the variability of bioaerosol using emissions inventories based on sparse measurements (Hoose et al., 2010; Sesartic et al., 2012). In order to evaluate the importance of bioaerosol, spatial, temporal and altitude-resolved measurements are necessary, but so far are lacking. Most available observations are from ground level and abundances above the planetary boundary layer are therefore poorly resolved. Observations made at high-altitude research stations (Ebert et al., 2011) can extend above the planetary boundary layer, but they have low spatial resolution.
Bioaerosols originate from a myriad of sources, including, but not limited to, microbes, fungal spores, pollen, and small fragments of vegetation (Després et al., 2012). Prior to the development of portable field sensors, measurements of atmospheric bioaerosol used off-line methods on collected aerosol, such as cultivation, fluorescent labeling, optical and electron microscopy (EM), and DNA amplification (Després et al., 2012; Burrows et al., 2009). These techniques yield estimates of bacteria concentrations near-surface between 1×10⁴ and 7×10⁵ m−3, depending on the ecosystem (Burrows et al., 2009). Data for fungal spore abundances place their concentrations between 40 and 1.3×10⁴ m−3, depending on the ecosystem (Sesartic and Dallafior, 2011). Recent flow cytometry measurements at a remote mountain site reported bacterial concentrations between 1×10³ and 1×10⁵ m−3, depending on the season, corresponding to, on average, 22 % of all particles greater than 0.5 µm diameter (Bowers et al., 2012). Scanning electron microscopy and optical microscopy measurements, averaged over 1 year, found 6×10⁵ m−3 bioaerosol in the remote atmosphere (20 % of all particles greater than 0.4 µm diameter) (Matthias-Maser et al., 2000) and 3×10⁶ m−3 in a semi-rural location (24 % of all particles greater than 0.4 µm diameter) (Jaenicke, 2005). In the marine atmosphere, transmission electron microscopy measurements reported 1 % of all particles greater than 0.2 µm diameter to be bacteria (Jaenicke, 2005) coupled to accumulation mode aerosol measurements at a nearby location (Brechtel et al., 1998), which corresponds to an approximate concentration of m−3. These off-line studies generally target surface measurements of bioaerosol, in part because faster sampling was needed to constrain abundances above the boundary layer (i.e., from an airborne platform). Additionally, off-line methods can be susceptible to contamination during sample preparation (Salter et al., 2014).
In situ and real-time detection of bioaerosol is now possible with commercial monitors, such as the Wideband Integrated Bioaerosol Sensor (WIBS). These methods utilize fluorescence when excited with UV radiation, which is common for, but not exclusive to, bioaerosol (Kaye et al., 2005). There are numerous examples of recent WIBS field deployments (Crawford et al., 2016; Fernández-Rodríguez et al., 2018; Gosselin et al., 2016; Perring et al., 2015) and efforts to improve particle characterization using clustering techniques (Savage and Huffman, 2018). Recently, the WIBS was deployed on an aircraft in the southeastern US and reported between 1×10⁴ and 3×10⁵ m−3 (at standard conditions) fluorescent particles in vertical profiles from surface level to the upper troposphere (5 %–10 % of total particles in the 0.6–5 µm diameter range) (Ziemba et al., 2016). A similar aircraft WIBS deployment derived vertical profiles of fluorescent particles over the US Great Plains (Twohy et al., 2016). Concentrations up to 1×10³ m−3 (at ambient conditions) of fluorescent particles in the 0.8–12 µm diameter range were found in the mid- to upper troposphere (Twohy et al., 2016).
In contrast to the only recently available fluorescence sensors, ground- and aircraft-deployable single-particle mass spectrometers have existed since the mid-1990s and have generated an extensive record of atmospheric aerosol composition (Murphy, 2007). If bioaerosol can be accurately identified, these data offer an opportunity to extend our knowledge of bioaerosol abundance and link historic measurements and modern instrumentation specifically designed for their detection. Recently, bioaerosols have been detected in single-particle mass spectra using the presence and relative magnitude of phosphorous and organic ion peaks (Zawadowicz et al., 2017). Using this new method, we have derived vertical profiles from the boundary layer to the free troposphere from four airborne measurement campaigns. These datasets span the continental United States and two seasons and compare favorably with a global aerosol model output. Additionally, our bioaerosol detection technique was found to compare well with a co-located WIBS sensor during a 2015 mountaintop study.
2.1 Particle analysis by laser mass spectrometry (PALMS)
The PALMS instrument has been discussed in detail elsewhere (Cziczo et al., 2006; Thomson et al., 2000). Briefly, the PALMS instrument uses an aerodynamic lens inlet to sample aerosols and impart them with a size-dependent velocity distribution (Zhang et al., 2002, 2004). The aerodynamic particle diameter is measured by timing the particle time of flight between two continuous-wave laser beams (532 nm Nd:YAG in laboratory PALMS and 405 nm diode in flight PALMS). The particles are ablated and ionized in one step by a 193 nm excimer laser. A unipolar reflectron time-of-flight mass spectrometer is then used to acquire the mass spectra. Due to the laser fluence used for desorption and ionization (∼ 109 W cm−2), PALMS spectra show both atomic ions and ion clusters. This type of technique, generally called single-particle mass spectrometry, is considered semi-quantitative because the ion signal depends on the ionization potential of the substance and its abundance (Murphy, 2007). Additionally, the ionization potentials can depend on the overall chemical composition of the particle (i.e., the particle matrix) (Murphy, 2007). The lower particle size threshold for the PALMS instrument is set by the amount of detectable scattered light at ∼200 nm, and the upper size threshold is set by the aerodynamic lens at ∼4 µm (Cziczo et al., 2006). The 193 nm excimer laser can ionize all atmospherically relevant particles within this size range with minimal detection biases (Murphy, 2007). Currently, there are two versions of the PALMS instrument. The flight PALMS, which is more compact, is aircraft deployable (Thomson et al., 2000), and it has been used to collect the field datasets analyzed in this study.
2.2 Wideband Integrated Bioaerosol Sensor (WIBS)
The WIBS (Droplet Measurement Technologies, Boulder, CO) is a commercial sensor that measures the optical size and fluorescence of individual particles which are used as a proxy for bioaerosol. Briefly, the particles scatter light during transit of a 635 nm laser beam, which triggers the sequential firing of xenon flash lamps filtered to emit at 280 and 370 nm. The resulting emissions are imaged onto photomultiplier tubes (PMTs) filtered to detect fluorescent light in two bands: 310–400 nm (the FL1 detector) and 420–650 nm (the FL2 detector). For data collected in 2015 at the Storm Peak Laboratory in Colorado, the WIBS was run at an increased gain such that it was able to count, size and retrieve fluorescent information for particles between 0.4 and 10 µm. The counting efficiency in this size window was assessed by comparison with a co-located Laser Aerosol Spectrometer (LAS, TSI Incorporated, Shoreview, MN), and the agreement between the two instruments was within 10 %.
The excitation and emission wavelengths were chosen to target fluorescence expected from tryptophan, an amino acid, and NADH, a by-product of bacterial metabolism (Gabey et al., 2010; Kaye et al., 2000, 2005). The FL1 detector detects fluorescence resulting from the 280 nm excitation and is saturated by the 370 nm flash, while the FL2 detector detects fluorescence resulting from both flashes.
In WIBS data analysis, it is necessary to define the threshold above which a particle is considered fluorescent in a given channel. Here, the instrument was run in “forced trigger” mode (lamps flash in the absence of particles) once daily, and a particle is considered to be fluorescent in a given channel if the resulting signal is more than 3 standard deviations above the mean of the corresponding forced trigger signal. Day-to-day variations in the calculated fluorescent threshold were minimal.
2.3 Field data
Four flight datasets were used in this study (Fig. 1). These included the New England Air Quality Study (NEAQS) consisting of 17 research flights on WP-3D aircraft in the summer of 2004 (Peltier et al., 2007). The flights were concentrated around New England and they were the lowest in altitude compared to the others used in this work. The 2012 Deep Convective Clouds and Chemistry (DC3) campaign was aimed at understanding the effect of convective storms on the upper troposphere (Barth et al., 2015). The PALMS instrument was flown on the NASA DC-8 aircraft, and the flights were concentrated around Colorado, Kansas, and Oklahoma. During the 2013 Studies of Emissions and Atmospheric Composition, Clouds and Climate Coupling by Regional Surveys (SEAC4RS) field mission, the PALMS instrument was also deployed on the DC-8, and the flights included western and central US (Toon et al., 2016). The 2011 Mid-latitude Airborne Cirrus Properties Experiment (MACPEX) campaign was based in Houston, TX, and it was focused on cirrus cloud properties (Cziczo et al., 2013). The PALMS was deployed on the WB-57 aircraft. Flights focused on central US, and they reached higher altitudes than the other three campaigns used in this work. Overall, 539 589 total particle spectra were analyzed: 232 545 for NEAQS, 6335 for MACPEX, 127 835 for DC3 and 172 874 for SEAC4RS. The ground dataset used to compare the WIBS and PALMS was acquired as a part of the Fifth Ice Nucleation Workshop–phase 3 (FIN03). The flight PALMS instrument was used to sample ambient air at Storm Peak Laboratory, a high-altitude site atop Mt. Werner in Colorado (elevation: 3220 m a.s.l.) in the North-central Colorado during September, 2015. The WIBS was used to sample the ambient air using the same inlet.

Figure 1Flight tracks (a) and altitude-resolved concentrations of particles categorized as bioaerosol (b) during four aircraft studies: MACPEX, NEAQS, DC3, and SEAC4RS. The PALMS size range is 0.3–2 µm for MACPEX and 0.3–4 µm for all other campaigns. Note there were no MACPEX data for altitudes less than 2 km. The error bars on PALMS data correspond to particle type assignment confidence estimated using laboratory data and SVMs algorithm. Results are shown for the GLOMAP model using year 2000 meteorology sampled at the measurement locations. Error bars on model results correspond to standard deviations in the model estimates in each altitude bin. Concentrations for both model and PALMS measurements are reported in particles per ambient cubic meter. Typical literature values are estimated using Burrows et al. (2009) for surface values (<1 km), Twohy et al. (2016) and Bowers et al. (2012) for 2–5 km, and Twohy et al. (2016) for 5–12 km.
2.4 Data analysis
2.4.1 PALMS
The PALMS spectra considered for bioaerosol classification are negative-polarity only, as successful classification of bioaerosol can only be performed in the negative mode. Phosphate ions, and , are key features used in the classification (Zawadowicz et al., 2017), and they are prominent only in the negative PALMS spectra. Definitions and methods for classification of single-particle spectra of bioaerosol and inorganic phosphorus-rich particles were described previously (Zawadowicz et al., 2017). Briefly, a library of single-particle phosphorus-rich PALMS spectra of known composition was constructed, including biological, mineral and combustion aerosols. Those spectra were plotted in a vs. space, according to the relative abundances of phosphate and organic nitrate ions. Peak ratios are used instead of absolute peak signals to better account for instrumental drifts. A two-dimensional boundary for a binary classifier was calculated using support vector machines (SVMs), a machine learning algorithm. This trained classifier can now be used on unknown data which contain phosphate and organic nitrate ions. The uncertainties reported in this paper are a result of fitting the SVMs scores to a probability distribution using Platt scaling, as outlined in Zawadowicz et al. (2017). The result are probabilities of correct classification for the field data. Classification probabilities lower than 80 % are flagged as uncertain and reported as error bars.
Number concentrations and particle fractions were calculated by combining PALMS composition data with coincident size distribution data from the LAS instrument or a similar optical particle spectrometer. The average fraction of particles identified as bioaerosol, inorganic phosphate, and silicate particles were determined as a function of size at 3–5 min sampling intervals. PALMS and LAS data were identically binned according to particle size. Within each size bin, the average fraction of each PALMS particle type was multiplied by the absolute number concentration measured by LAS to give number distributions for each type. These were integrated over size to yield absolute number concentrations of bioaerosol, inorganic phosphate, and mineral and/or metallic particles. Particle type concentrations were divided by total particle concentration to give number fractions. Results were binned according to sampling altitude for the aircraft studies or averaged of the entire measurement period for the FIN03 ground study.
2.4.2 WIBS
We use the categorization scheme described in Perring et al. (2015), along with laboratory results of known bioaerosol (Hernandez et al., 2016), to interpret fluorescent aerosol concentrations. Hernandez et al. (2016) report, for example, that bacteria generally have signal in the FL1 detector following 280 nm excitation, denoted channel A in Perring et al. (2015), and do not have signal in either of the other channels. Similarly, fungal spores all tend to have signal in channel A and sometimes have signal detected by the FL2 detector following 280 nm excitation (channel B) and 370 nm excitation (channel C). Using the Perring et al. (2015) categorization,this would be denoted as a mixture of types A, AB, and ABC. Pollen tends to always have signal in channel C and sometimes has signal in channels A and B; in other words, pollen appears as a mixture of types C, BC and ABC. Type B particles (i.e., particles for which the only fluorescent signal is seen by FL2 following 280 nm excitation) are very rarely found in tests of known bioaerosol and are, instead, frequently observed in ambient data during periods of biomass burning influence. Thus, for the present study, we derive our implied bioaerosol concentrations from the WIBS as the sum of all observed particles of types A, AB, ABC, BC, or C, and we exclude particles exhibiting type B fluorescence. Very few type AC particles are observed in the lab or in ambient data, however they are also excluded from reported bioaerosol concentrations in this study.
In typical applications, size is also used as an identifying factor to further reduce the likelihood of non-biological fluorescent interferences. Non-biological interferences in the accumulation mode can affect derived bioaerosol concentrations substantially even if only a small fraction of the accumulation mode number contributes. Therefore, submicron fluorescent particles are often excluded from analysis. Here, in order to maximize the size range of overlap between the PALMS and the WIBS, we have not excluded particles based on size, though we note that there are known interferences in the accumulation mode associated with various particle types including black and brown carbon and humic material (Savage et al., 2017; Pöhlker et al., 2012). These are spectrally similar to known bioaerosol and likely contribute to our reported concentrations at the smaller sizes.
2.5 Modeling
The global aerosol microphysics model used in this study is the modal version of the Global Model of Aerosol Processes (GLOMAP-mode) with incorporated fungal spore and bacteria emissions, as described previously (Heald and Spracklen, 2009; Spracklen and Heald, 2014). Fungal spore emissions are driven by leaf area index (LAI) and water vapor concentrations (Heald and Spracklen, 2009). Bacteria emissions are implemented following the ecosystem-dependent scheme of Hoose et al (2010). The model is driven by ECMWF meteorology and is run at a horizontal resolution of with 31 vertical levels between the surface and 10 hPa.These simulations are described in greater detail in Spracklen and Heald (2014). We note that while the model is sampled for the location of the airborne measurements, the simulation is performed for the year 2000 and thus not matched to the specific year of each campaign. Here we focus on the model's ability to capture the vertical profile and the average concentration, features which we do not expect to exhibit substantial interannual variability.
Flight tracks of the four campaigns analyzed in this study are shown in Fig. 1. The datasets were filtered for particles matching bioaerosol chemistry according a previously described method (Zawadowicz et al., 2017). Figure 2 shows a typical bioaerosol spectrum and size distribution (Fig. 2a and b). Note that inorganic phosphorus-bearing aerosol (Fig. 2c and d) and bioaerosol have many of the same chemical features and overlapping size distributions and may have been previously confused (Zawadowicz et al., 2017). Internal mixing, where silicate mineral (Fig. 2e) and bioaerosol features coexist, may represent particles derived from fertile soils (Zawadowicz et al., 2017). Depending on the campaign, 30 %–82 % of all bioaerosols also had silicate features (Table 1). The MACPEX campaign had a very high proportion of particles with silicate features (82 %), likely owing to flights over Texas. All three particle types shown in Fig. 2 have similar size distributions and have to be discriminated on the basis of chemistry rather than size alone.
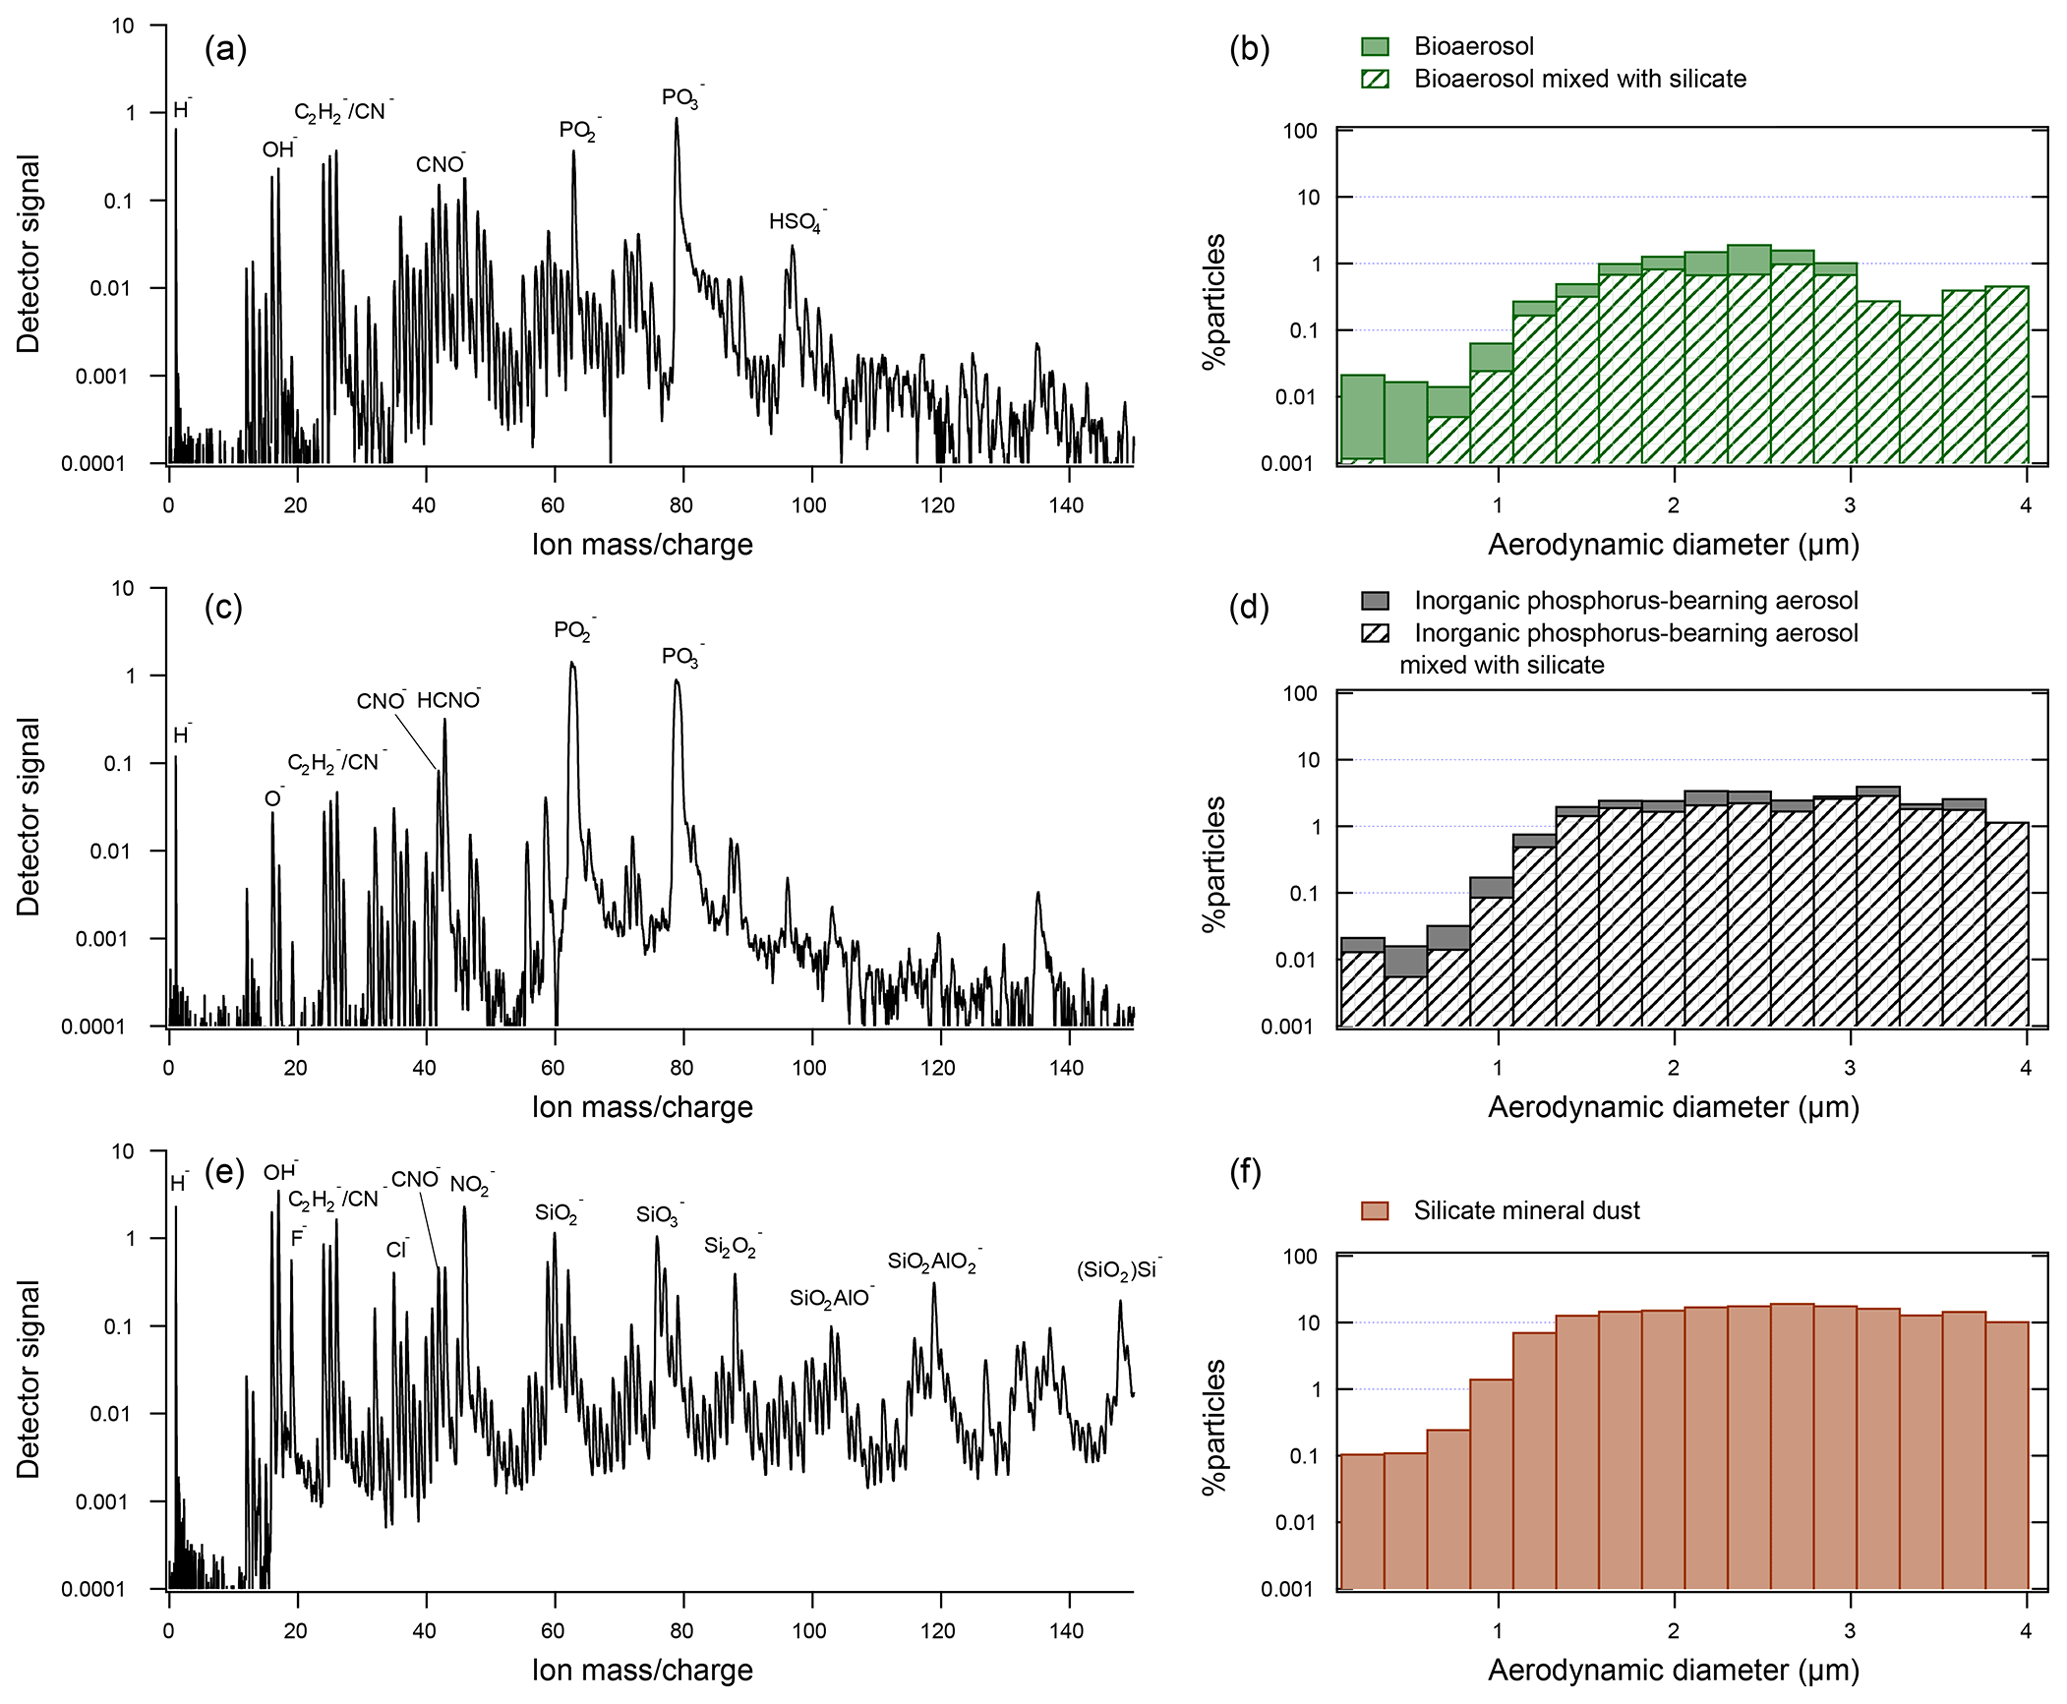
Figure 2Representative spectra and size distributions of the three types of particles considered in this study: (a) representative spectrum of bioaerosol (DC3 campaign). (b) Size distribution of bioaerosol particles in DC3, SEAC4RS, NEAQS, MACPEX, and FIN03. The hatched pattern indicates the percentage of particles that also exhibited silicate mineral markers. (c) Representative spectrum of an inorganic phosphorous-rich particle (DC3 campaign). (d) Size distributions of inorganic phosphorous-rich particles in DC3, SEAC4RS, NEAQS, MACPEX, and FIN03 campaigns. (e) Representative spectrum of a silicate mineral dust particle (DC3 campaign). (f) Size distributions of mineral dust particles in DC3, SEAC4RS, NEAQS, MACPEX, and FIN03 campaigns.
Table 1Internal mixing of bioaerosol particles described in this study. Bioaerosol markers as defined in Zawadowicz et al. (2017) can be co-located with silicate markers (Fig. 2) or sea salt markers (Cl− and other NaCl-derived clusters) in the same particle, indicating internal mixing.

Vertical profiles of bioaerosol from the four flight campaigns are shown in Fig. 1. They are compared to previously measured concentrations derived from literature (Bowers et al., 2012; Burrows et al., 2009; Twohy et al., 2016). The literature estimates are approximate ranges due to sparse data above ground level and different measurement techniques used. Near the ground (<2 km), bioaerosol concentrations were measured between 6×10³ and 2×10⁴ m−3 (at ambient conditions). At intermediate altitudes (between 2 and 8 km), bioaerosol concentrations were between 0 and 2×10⁴ m−3 (at ambient conditions). At high altitudes, in the free troposphere, (between 8 and 14 km) bioaerosol concentrations were between 0 and 1×10³ m−3 (at ambient conditions). Note that Fig. 1 uses a log-scale x axis to capture large ranges of observed and modeled concentrations, but this obscures instances where PALMS-derived concentrations were 0 (i.e., no bioaerosols detected in this altitude bin), for instance during the MACPEX campaign at 4–8 km. Those instances should be interpreted as being below the instrument detection limit.
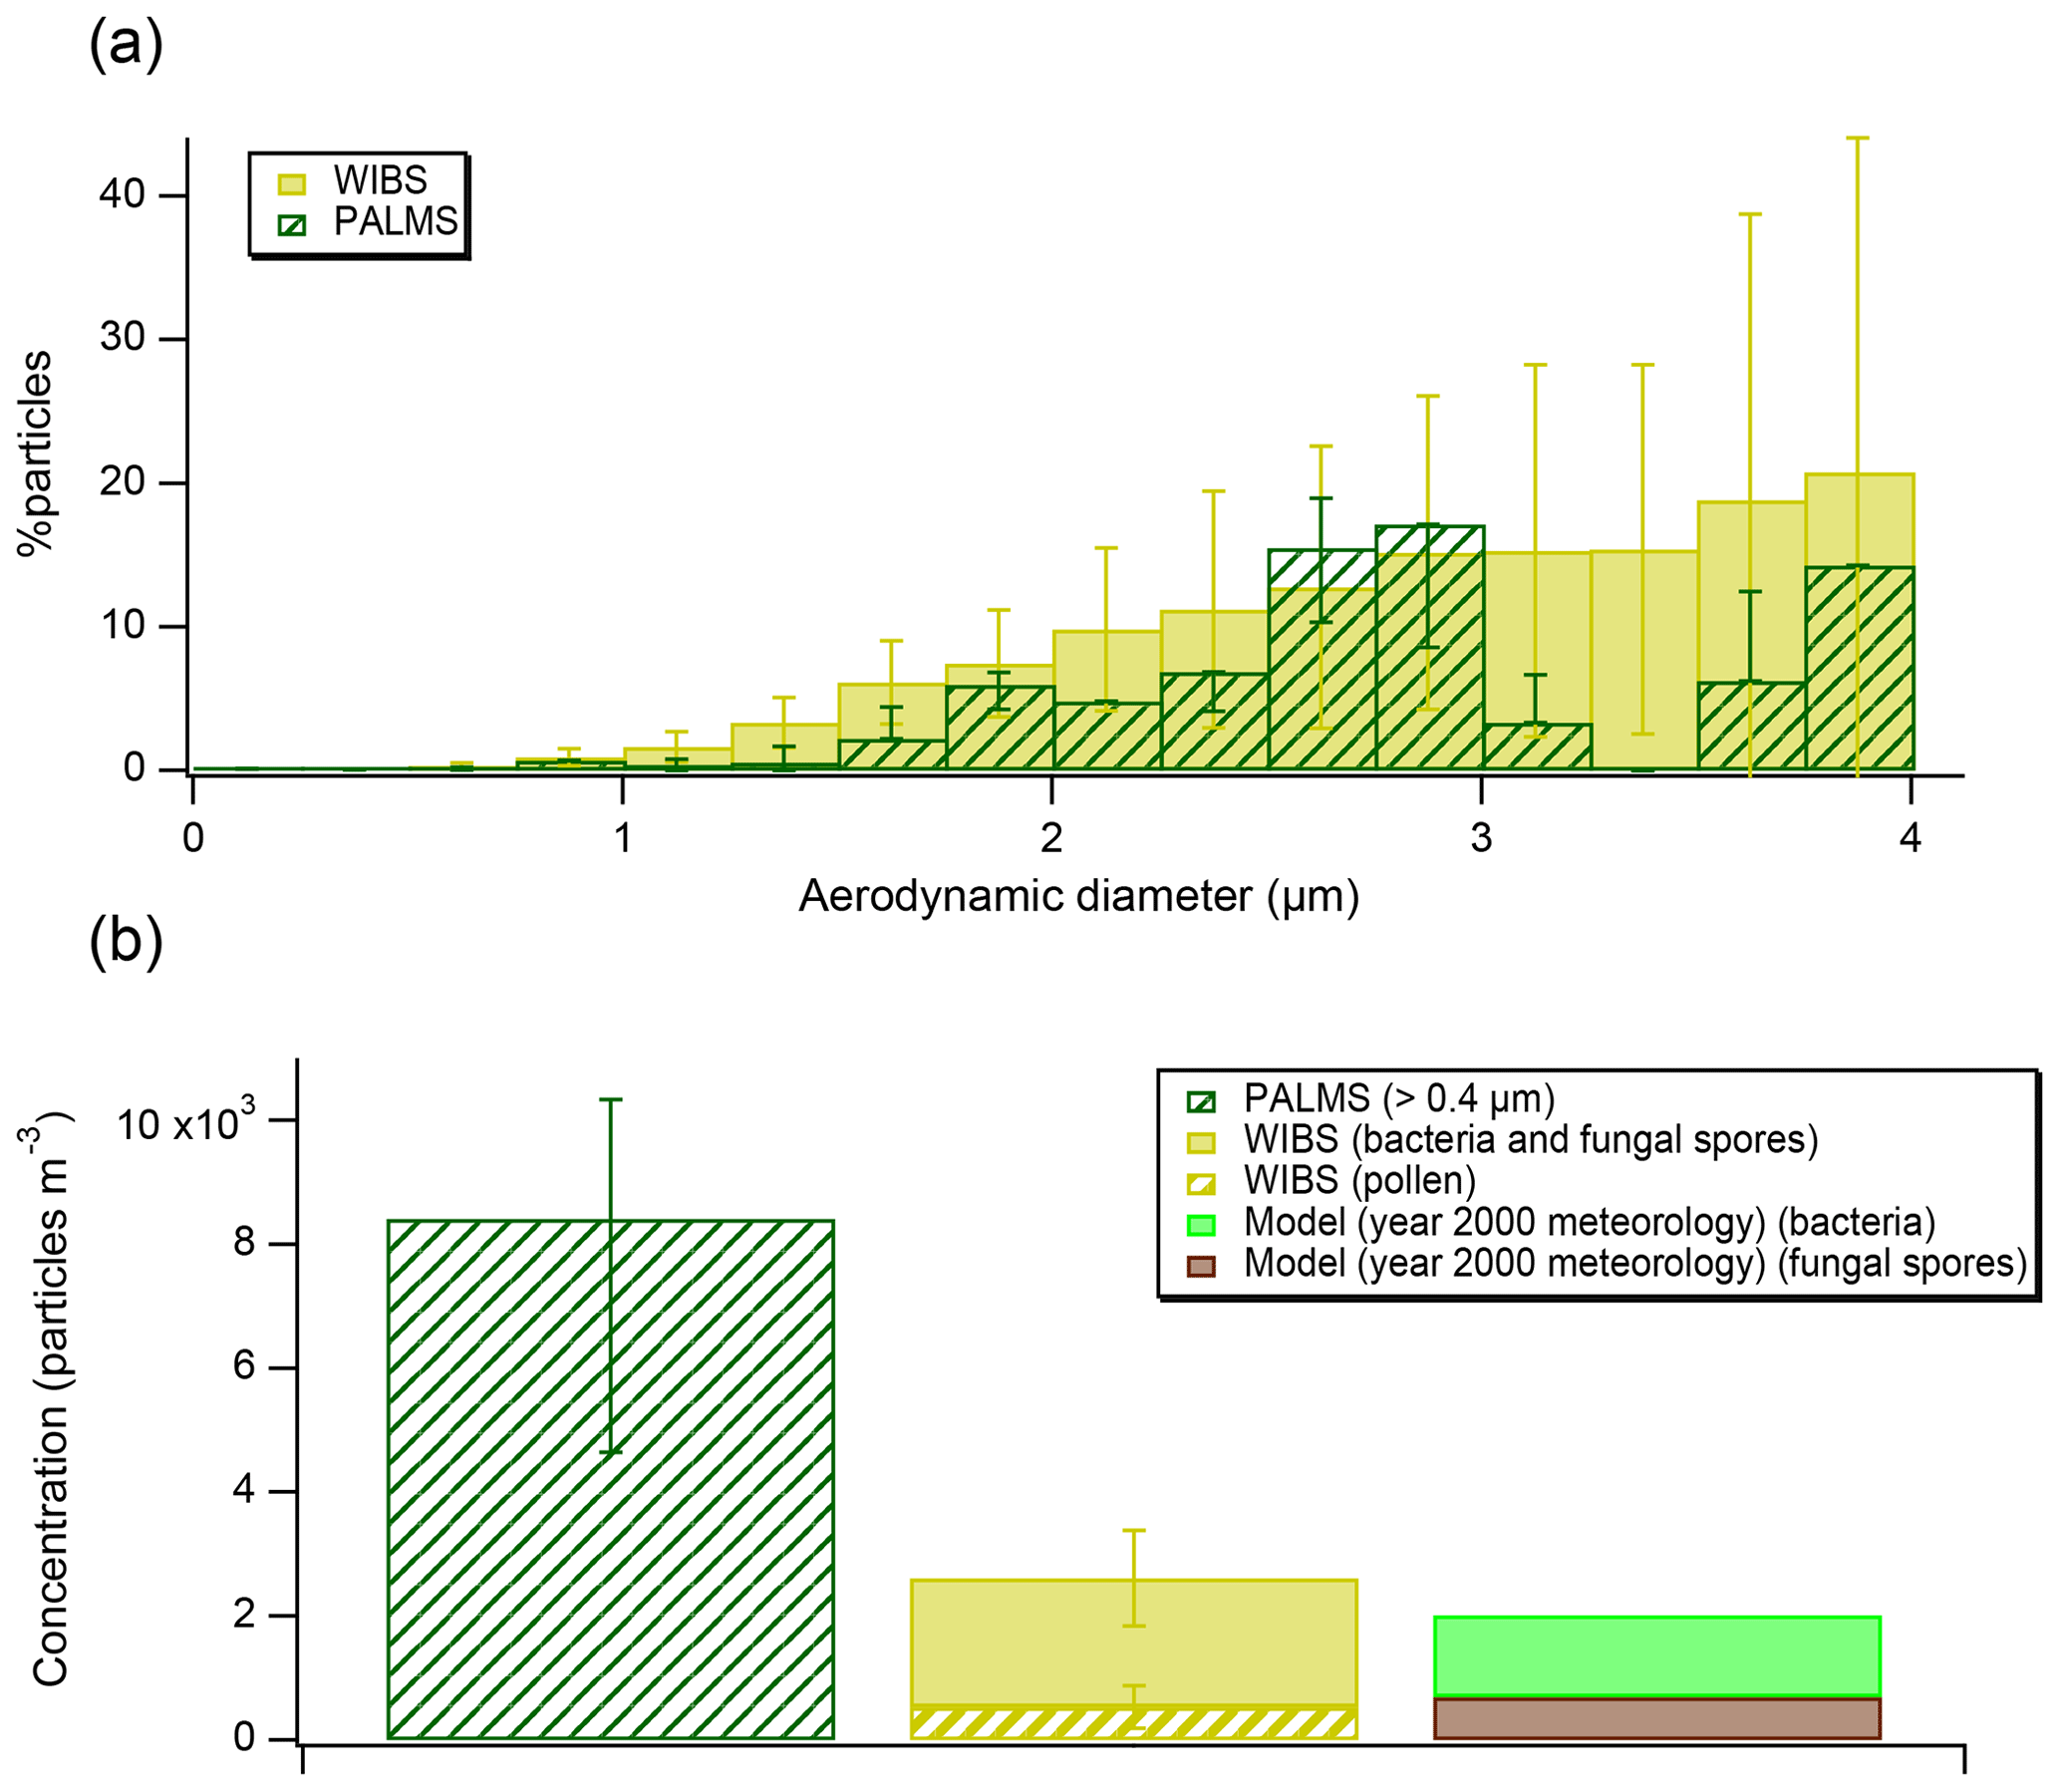
Figure 3(a) Bioaerosol abundances (as percent of all particles) detected by PALMS and WIBS, grouped into size bins. The error bars on PALMS data correspond to particle type assignment confidence estimated using laboratory data and SVMs algorithm. The error bars on WIBS data represent standard deviations of the hourly average in each size bin. (b) A comparison of measured concentrations from FIN03 and aerosol model results (note, model was initialized using year 2000 meteorology). A lower cut-off size of 0.4 µm has been used to report PALMS concentrations to match the WIBS size range.
The vertical profiles derived here (Fig. 1b) are also compared with the GLOMAP simulation described in Sect. 2.5 here and in Spracklen and Heald (2014). Model results generally captured the decrease in bioaerosol concentrations with altitude, except for the DC3 campaign, which targeted intense vertical motion (i.e., convective systems), and to a lesser extent the SEAC4RS campaign. The model does not capture the influence of convective systems during these campaigns because it is driven by year 2000 meteorology. With the exception of convective features and concentrations below the detection limit in MACPEX for intermediate altitudes, the model and observations tend to agree within an order of magnitude throughout the profiles. A more detailed investigation matching the meteorological year and the size range measured could help provide quantitative insights into the deficiencies in the model description of bioaerosol emissions, removal, and vertical transport by convection, and we suggest this is as possible future work.
Concentrations of bioaerosols should always be interpreted noting the instrumental size range, ∼0.3–4 µm for PALMS (Cziczo et al., 2006). The WIBS, in contrast, can report diameters between 0.5 and 16 µm (Gabey et al., 2010) and there is no technical upper limit for microscopy. Bioaerosol can be relatively large; for example, some pollen grains range from 10 to greater than 100 µm in diameter (Emberlin, 2008), although the atmospheric lifetime of ∼100 µm particles is short due to both gravitational settling and wet-depositional processes (Seinfeld and Pandis, 2006). We compare the PALMS and the WIBS during the FIN03 study over the 0.5–4 µm diameter size range (Fig. 3a). Because fluorescence is not unique to bioaerosol and is impacted by non-biological interferences (Hernandez et al., 2016), data from the WIBS are interpreted in conjunction with size and shape information to minimize potential interferences (Hernandez et al., 2016; Perring et al., 2015), as described in the Data Analysis section. We note that the interferences are likely worse at smaller sizes, which is why some previous studies (Perring et al., 2015) only consider super-micrometer fluorescent particle loadings. The percentages reported by the fluorescence sensor are similar, on average 1.8 times higher, over the common instrument range. The average concentrations during FIN03 reported by both instruments agree within a factor of 3 (Fig. 3b). Exact comparisons between those two instruments are complicated because concentration calculations are sensitive to the instrumental size ranges. Additionally, the fluorescence sensor reports optical particle size, while the mass spectrometer reports aerodynamic particle size. The overall bioaerosol abundance reported by both instruments, <1 % of total particles in the size range, is consistent with the historic EM results (Pósfai et al., 2003).

Figure 4(a) Vertical profiles expressed as particle number fractions for particles identified as bioaerosol, inorganic phosphorus-bearing aerosol and mineral and/or metallic aerosol for the MACPEX (a), NEAQS (b), DC3 (c), and SEAC4RS (d) campaigns. Note that the x axis for the mineral and/or metallic profiles is 10 times the x axis for bioaerosol and inorganic phosphorus-bearing aerosol. Patterned bars indicate particles with uncertain assignment, as determined using laboratory data and SVMs algorithm.
Vertical profiles of bioaerosol derived in this study can be compared with profiles of particles with similar chemical features and size distributions: inorganic phosphorus-bearing aerosol (see also Fig. 2c and d) and mineral and/or metallic aerosol. The mineral and/or metallic category used here is consistent with previous studies (Cziczo et al., 2013). In our data, bioaerosols comprise up to 0.08 % of particles in the 0.3–4 µm diameter size range (Fig. 4). By comparison, inorganic phosphorus-bearing aerosol comprises up to 0.9 % of particles, and mineral and/or metallic particles comprise 0.6 %–10 % of particles. Vertical profiles of inorganic phosphorous-rich aerosol align with those of silicate mineral dust, which likely reflects similar surface sources such as saltation or phosphorous-rich fertilizer use (Koppelaar and Weikard, 2013). It should be noted that inorganic phosphorus-bearing mineral dust abundances can be 2–10 times higher than bioaerosol, which illustrates the importance of distinguishing between those chemical classes.
The PALMS technique applied here requires the presence of CN−, CNO−, , and markers to classify a particle as biological. It is calibrated against laboratory reference material containing bacteria, fungi and their spores, and pollen fragments. It is therefore sensitive to those microorganisms and their fragments, but it does not necessarily detect pure saccharides, such as cellulose, or other pure biogenic components once they are decomposed into their fundamental constituents. The definition of “bioaerosol” used here and in Zawadowicz et al. (2017) encompasses microorganisms directly released into the atmosphere, their fragments and reproductive dispersal units (e.g., pollen and spores). This technique also does not address speciation of these bioaerosols. However, based on the sizes of biological material detected, observed mixing states, and comparison with the WIBS during FIN03, the presence of both soil-derived bacteria and fungal spores is likely. Bacteria derived from soils can range from submicron up to 5 µm in diameter, but the majority were found to be less than 1.2 µm (Portillo et al., 2013). Fungal spores are bigger than soil bacteria, between 2 and 10 µm (Yamamoto et al., 2012), and can be common in forested areas (Zhu et al., 2016). At FIN03, the majority of bioaerosols measured with the WIBS were bacteria and fungal spores according to the Perring et al. (2015) classification, and only a small fraction were identified as pollen fragments (Fig. 3). In the light of this, the comparison to GLOMAP-mode is also valid, as bacteria and fungal spores are both included.
Internal mixing of single particles detected with PALMS can reveal some information about particle sources. However, some caution is warranted, as coagulation is also likely during long-range transport of aerosols. Many particles analyzed in this study were internally mixed with dust components (Table 1 and Fig. 2), which could indicate a soil origin. Prior studies have shown that dust and microorganisms are often ejected into the atmosphere together, suggesting a similarity of sources (Hallar et al., 2011; Mazar et al., 2016; Tang et al., 2018). A smaller portion of detected bioaerosol particles also had sea salt markers (Table 1). Those might indicate bioaerosols that have been lofted into the marine atmosphere, or transported over the ocean, but it is not enough to suggest bioaerosols ejected from the ocean. Generally, concentrations of bioaerosols over the ocean are lower than over the continents (Burrows et al., 2009), and in studies of marine bioaerosols that included genetic typing a large portion of bioaerosols detected over the ocean were terrestrial in origin (Seifried et al., 2015; Xia et al., 2015).
Single-particle mass spectrometry is a real-time, in situ technique that can be used for measurement of bioaerosol. By mining historic data, this method can provide measurements with wider temporal and spatial coverage than previous culturing and microscopy techniques (Burrows et al., 2009), and it is free of contamination that can critically impact laboratory-intensive off-line identification techniques, such as DNA amplification (Salter et al., 2014). In this study, we compare mass spectrometry measurements with the WIBS, showing an agreement to within a factor of 3 in the common 0.5–4 µm size range. The measurements also exhibit agreement with an aerosol microphysics model within a few factors in the upper troposphere and within an order of magnitude under all conditions. The agreement between two different measurement techniques and a model is an important step in constraining global abundances of this poorly understood but possibly important source of atmospheric aerosol. This offers the potential to use past datasets over different seasons, locations, and altitudes to build long-term trends in bioaerosol to both constrain and compare to models. Overall, these studies found bioaerosol to be consistently present in the upper troposphere but an order of magnitude less abundant than mineral and/or metallic aerosol. These bioaerosols, despite their low abundance, could be important for some atmospheric processes, such as the nucleation of ice at high temperatures ( ∘C), where they are more likely than mineral dust to activate. As both dust and bioaerosol have been shown to nucleate ice in the laboratory (Atkinson et al., 2013; Möhler et al., 2008), this technique can be further applied to studies aimed at constraining the importance of bioaerosol on cloud formation.
Data used to generate the figures are included in a Harvard Dataverse dataset with the same name as this paper (Zawadowicz, 2019).
MAZ was responsible for AIDA and SPL studies, single particle mass spectrometry, data analysis, and paper writing. DJC was responsible for AIDA, SPL and aircraft studies, single particle mass spectrometry, data analysis, and paper writing. KDF and DMM contributed to aircraft and laboratory studies, single particle mass spectrometry, and data analysis. AEP collected and analyzed the WIBS data. CLH and DVS provided GLOMAP-mode model runs. PRB provided EM advice.
The authors declare that they have no conflict of interest.
We thank the DRI SPL staff and the FIN03 team for their logistical support and scientific discussions of the fieldwork at SPL. We thank the aircraft crews, support staff, and scientists of the DC3, SEAC4RS, NEAQS, and MACPEX studies for assistance with data acquisition. We acknowledge funding from NSF and DOE, which allowed our participation in CARES and FIN03 (grant nos. AGS-1461347 and DE-SC0014487, respectively). We acknowledge NASA for funding data analysis (grant no. NNX13AO15G) and DC3, SEAC4RS, and MACPEX campaigns. We thank NOAA for funding the NEAQS studies. Maria A. Zawadowicz acknowledges the support of NASA Earth and Space Science Fellowship. Daniel J. Cziczo acknowledges the support of Victor P. Starr Career Development Chair. Colette L. Heald acknowledges NSF funding (ATM-1564495). Anne E. Perring was supported by the NOAA Health of the Atmosphere Program and the NOAA Atmospheric Composition and Climate Program.
This research has been supported by the National Science Foundation (grants nos. AGS-1461347 and ATM-1564495), the U.S. Department of Energy (grant no. DE-SC0014487), the National Aeronautics and Space Administration (grant nos. NNX13AO15G and NESSF), NOAA Health of the Atmosphere Program and NOAA Atmospheric Composition and Climate Program.
This paper was edited by Paul Zieger and reviewed by two anonymous referees.
Atkinson, J. D., Murray, B. J., Woodhouse, M. T., Whale, T. F., Baustian, K. J., Carslaw, K. S., Dobbie, S., O'Sullivan, D., and Malkin, T. L.: The importance of feldspar for ice nucleation by mineral dust in mixed-phase clouds, Nature, 498, 355–358, https://doi.org/10.1038/nature12278, 2013.
Barth, M. C., Cantrell, C. A., Brune, W. H., Rutledge, S. A., Crawford, J. H., Huntrieser, H., Carey, L. D., MacGorman, D., Weisman, M., Pickering, K. E., Bruning, E., Anderson, B., Apel, E., Biggerstaff, M., Campos, T., Campuzano-Jost, P., Cohen, R., Crounse, J., Day, D. A., Diskin, G., Flocke, F., Fried, A., Garland, C., Heikes, B., Honomichl, S., Hornbrook, R., Huey, L. G., Jimenez, J. L., Lang, T., Lichtenstern, M., Mikoviny, T., Nault, B., O'Sullivan, D., Pan, L. L., Peischl, J., Pollack, I., Richter, D., Riemer, D., Ryerson, T., Schlager, H., St. Clair, J., Walega, J., Weibring, P., Weinheimer, A., Wennberg, P., Wisthaler, A., Wooldridge, P. J., and Ziegler, C.: The Deep Convective Clouds and Chemistry (DC3) Field Campaign, B. Am. Meteorol. Soc., 96, 1281–1309, https://doi.org/10.1175/bams-d-13-00290.1, 2015.
Boucher, O., Randall, D., Artaxo, P., Bretherton, C., Feingold, G., Forster, P., Keminen, V.-M., Kondo, Y., Liao, H., Lohmann, U., Rasch, P., Satheesh, S. K., Sherwood, S., Stevens, B., and Zhang, X. Y.: Clouds and Aerosols, in: Climate Change 2013: The Physical Science Basis. Contribution of Working Group I to the Fifth Assessment Report of the Intergovernmental Panel on Climate Change, Cambridge, UK and New York, NY, USA, 2013.
Bowers, R. M., McCubbin, I. B., Hallar, A. G., and Fierer, N.: Seasonal variability in airborne bacterial communities at a high-elevation site, Atmos. Environ., 50, 41–49, https://doi.org/10.1016/j.atmosenv.2012.01.005, 2012.
Brechtel, F. J., Kreidenweis, S. M., and Swan, H. B.: Air mass characteristics, aerosol particle number concentrations, and number size distributions at Macquarie Island during the First Aerosol Characterization Experiment (ACE 1), J. Geophys. Res.-Atmos., 103, 16351–16367, https://doi.org/10.1029/97jd03014, 1998.
Burrows, S. M., Elbert, W., Lawrence, M. G., and Pöschl, U.: Bacteria in the global atmosphere – Part 1: Review and synthesis of literature data for different ecosystems, Atmos. Chem. Phys., 9, 9263–9280, https://doi.org/10.5194/acp-9-9263-2009, 2009.
Crawford, I., Lloyd, G., Herrmann, E., Hoyle, C. R., Bower, K. N., Connolly, P. J., Flynn, M. J., Kaye, P. H., Choularton, T. W., and Gallagher, M. W.: Observations of fluorescent aerosol–cloud interactions in the free troposphere at the High-Altitude Research Station Jungfraujoch, Atmos. Chem. Phys., 16, 2273–2284, https://doi.org/10.5194/acp-16-2273-2016, 2016.
Cziczo, D. J., Thomson, D. S., Thompson, T. L., DeMott, P. J., and Murphy, D. M.: Particle analysis by laser mass spectrometry (PALMS) studies of ice nuclei and other low number density particles, Int. J. Mass Spectrom., 258, 21–29, https://doi.org/10.1016/j.ijms.2006.05.013, 2006.
Cziczo, D. J., Froyd, K. D., Hoose, C., Jensen, E. J., Diao, M., Zondlo, M. A., Smith, J. B., Twohy, C. H., and Murphy, D. M.: Clarifying the dominant sources and mechanisms of cirrus cloud formation, Science, 340, 1320–1324, https://doi.org/10.1126/science.1234145, 2013.
Després, V., Huffman, J. A., Burrows, S. M., Hoose, C., Safatov, A., Buryak, G., Fröhlich-Nowoisky, J., Elbert, W., Andreae, M., Pöschl, U., and Jaenicke, R.: Primary biological aerosol particles in the atmosphere: a review, Tellus B, 64, 15598, https://doi.org/10.3402/tellusb.v64i0.15598, 2012.
Ebert, M., Worringen, A., Benker, N., Mertes, S., Weingartner, E., and Weinbruch, S.: Chemical composition and mixing-state of ice residuals sampled within mixed phase clouds, Atmos. Chem. Phys., 11, 2805–2816, https://doi.org/10.5194/acp-11-2805-2011, 2011.
Emberlin, J.: Grass, Tree, and Weed Pollen, in: Allergy and Allergic Diseases, Wiley-Blackwell, West Sussex, UK, 942–962, 2008.
Fernández-Rodríguez, S., Tormo-Molina, R., Lemonis, N., Clot, B., O'Connor, D. J., and Sodeau, J. R.: Comparison of fungal spores concentrations measured with wideband integrated bioaerosol sensor and Hirst methodology, Atmos. Environ., 175, 1–14, https://doi.org/10.1016/j.atmosenv.2017.11.038, 2018.
Gabey, A. M., Gallagher, M. W., Whitehead, J., Dorsey, J. R., Kaye, P. H., and Stanley, W. R.: Measurements and comparison of primary biological aerosol above and below a tropical forest canopy using a dual channel fluorescence spectrometer, Atmos. Chem. Phys., 10, 4453–4466, https://doi.org/10.5194/acp-10-4453-2010, 2010.
Gosselin, M. I., Rathnayake, C. M., Crawford, I., Pöhlker, C., Fröhlich-Nowoisky, J., Schmer, B., Després, V. R., Engling, G., Gallagher, M., Stone, E., Pöschl, U., and Huffman, J. A.: Fluorescent bioaerosol particle, molecular tracer, and fungal spore concentrations during dry and rainy periods in a semi-arid forest, Atmos. Chem. Phys., 16, 15165–15184, https://doi.org/10.5194/acp-16-15165-2016, 2016.
Hallar, A. G., Chirokova, G., McCubbin, I., Painter, T. H., Wiedinmyer, C., and Dodson, C.: Atmospheric bioaerosols transported via dust storms in the western United States, Geophys. Res. Lett., 38, L17801, https://doi.org/10.1029/2011gl048166, 2011.
Heald, C. L. and Spracklen, D. V.: Atmospheric budget of primary biological aerosol particles from fungal spores, Geophys. Res. Lett., 36, L09806, https://doi.org/10.1029/2009gl037493, 2009.
Hernandez, M., Perring, A. E., McCabe, K., Kok, G., Granger, G., and Baumgardner, D.: Chamber catalogues of optical and fluorescent signatures distinguish bioaerosol classes, Atmos. Meas. Tech., 9, 3283–3292, https://doi.org/10.5194/amt-9-3283-2016, 2016.
Hoose, C., Kristjánsson, J. E., and Burrows, S. M.: How important is biological ice nucleation in clouds on a global scale?, Environ. Res. Lett., 5, 024009, https://doi.org/10.1088/1748-9326/5/2/024009, 2010.
Jaenicke, R.: Abundance of cellular material and proteins in the atmosphere, Science, 308, 5718, https://doi.org/10.1126/science.1106335, 2005.
Kaye, P. H., Barton, J. E., Hirst, E., and Clark, J. M.: Simultaneous light scattering and intrinsic fluorescence measurement for the classification of airborne particles, Appl. Optics, 39, 3738–3745, https://doi.org/10.1364/ao.39.003738, 2000.
Kaye, P. H., Stanley, W. R., Hirst, E., Foot, E. V., Baxter, K. L., and Barrington, S. J.: Single particle multichannel bio-aerosol fluorescence sensor, Opt. Express, 13, 3583–3593, https://doi.org/10.1364/opex.13.003583, 2005.
Koppelaar, R. H. E. M. and Weikard, H. P.: Assessing phosphate rock depletion and phosphorus recycling options, Global Environ. Chang., 23, 1454–1466, https://doi.org/10.1016/j.gloenvcha.2013.09.002, 2013.
Matthias-Maser, S., Obolkin, V., Khodzer, T., and Jaenicke, R.: Seasonal variation of primary biological aerosol particles in the remote continental region of Lake Baikal/Siberia, Atmos. Environ., 34, 3805–3811, https://doi.org/10.1016/s1352-2310(00)00139-4, 2000.
Mazar, Y., Cytryn, E., Erel, Y., and Rudich, Y.: Effect of Dust Storms on the Atmospheric Microbiome in the Eastern Mediterranean, Environ. Sci. Technol., 50, 4194–4202, https://doi.org/10.1021/acs.est.5b06348, 2016.
Möhler, O., DeMott, P. J., Vali, G., and Levin, Z.: Microbiology and atmospheric processes: the role of biological particles in cloud physics, Biogeosciences, 4, 1059–1071, https://doi.org/10.5194/bg-4-1059-2007, 2007.
Möhler, O., Georgakopoulos, D. G., Morris, C. E., Benz, S., Ebert, V., Hunsmann, S., Saathoff, H., Schnaiter, M., and Wagner, R.: Heterogeneous ice nucleation activity of bacteria: new laboratory experiments at simulated cloud conditions, Biogeosciences, 5, 1425–1435, https://doi.org/10.5194/bg-5-1425-2008, 2008.
Murphy, D. M.: The design of single particle laser mass spectrometers, Mass Spectrom. Rev., 26, 150–165, https://doi.org/10.1002/mas.20113, 2007.
Peltier, R. E., Sullivan, A. P., Weber, R. J., Brock, C. A., Wollny, A. G., Holloway, J. S., de Gouw, J. A., and Warneke, C.: Fine aerosol bulk composition measured on WP-3D research aircraft in vicinity of the Northeastern United States – results from NEAQS, Atmos. Chem. Phys., 7, 3231–3247, https://doi.org/10.5194/acp-7-3231-2007, 2007.
Perring, A. E., Schwarz, J. P., Baumgardner, D., Hernandez, M. T., Spracklen, D. V., Heald, C. L., Gao, R. S., Kok, G., McMeeking, G. R., McQuaid, J. B., and Fahey, D. W.: Airborne observations of regional variation in fluorescent aerosol across the United States, J. Geophys. Res.-Atmos., 120, 1153–1170, https://doi.org/10.1002/2014jd022495, 2015.
Pöhlker, C., Huffman, J. A., and Pöschl, U.: Autofluorescence of atmospheric bioaerosols – fluorescent biomolecules and potential interferences, Atmos. Meas. Tech., 5, 37–71, https://doi.org/10.5194/amt-5-37-2012, 2012.
Portillo, M. C., Leff, J. W., Lauber, C. L., and Fierer, N.: Cell Size Distributions of Soil Bacterial and Archaeal Taxa, Appl. Environ. Microbiol., 79, 7610–7617, https://doi.org/10.1128/aem.02710-13, 2013.
Pósfai, M., Li, J., Anderson, J. R., and Buseck, P. R.: Aerosol bacteria over the Southern Ocean during ACE-1, Atmos. Res., 66, 231–240, https://doi.org/10.1016/s0169-8095(03)00039-5, 2003.
Salter, S. J., Cox, M. J., Turek, E. M., Calus, S. T., Cookson, W. O., Moffatt, M. F., Turner, P., Parkhill, J., Loman, N. J., and Walker, A. W.: Reagent and laboratory contamination can critically impact sequence-based microbiome analyses, BMC Biol., 12, 87, https://doi.org/10.1186/s12915-014-0087-z, 2014.
Savage, N. J. and Huffman, J. A.: Evaluation of a hierarchical agglomerative clustering method applied to WIBS laboratory data for improved discrimination of biological particles by comparing data preparation techniques, Atmos. Meas. Tech., 11, 4929–4942, https://doi.org/10.5194/amt-11-4929-2018, 2018.
Savage, N. J., Krentz, C. E., Könemann, T., Han, T. T., Mainelis, G., Pöhlker, C., and Huffman, J. A.: Systematic characterization and fluorescence threshold strategies for the wideband integrated bioaerosol sensor (WIBS) using size-resolved biological and interfering particles, Atmos. Meas. Tech., 10, 4279–4302, https://doi.org/10.5194/amt-10-4279-2017, 2017.
Seifried, J. S., Wichels, A., and Gerdts, G.: Spatial distribution of marine airborne bacterial communities, MicrobiologyOpen, 4, 475–490, https://doi.org/10.1002/mbo3.253, 2015.
Seinfeld, J. H. and Pandis, S. N.: Atmospheric Chemistry and Physics: From Air Pollution to Climate Change, John Wiley & Sons, Inc., Hoboken, NJ, USA, 2006.
Sesartic, A. and Dallafior, T. N.: Global fungal spore emissions, review and synthesis of literature data, Biogeosciences, 8, 1181–1192, https://doi.org/10.5194/bg-8-1181-2011, 2011.
Sesartic, A., Lohmann, U., and Storelvmo, T.: Bacteria in the ECHAM5-HAM global climate model, Atmos. Chem. Phys., 12, 8645–8661, https://doi.org/10.5194/acp-12-8645-2012, 2012.
Spracklen, D. V. and Heald, C. L.: The contribution of fungal spores and bacteria to regional and global aerosol number and ice nucleation immersion freezing rates, Atmos. Chem. Phys., 14, 9051–9059, https://doi.org/10.5194/acp-14-9051-2014, 2014.
Tang, K., Huang, Z., Huang, J., Maki, T., Zhang, S., Shimizu, A., Ma, X., Shi, J., Bi, J., Zhou, T., Wang, G., and Zhang, L.: Characterization of atmospheric bioaerosols along the transport pathway of Asian dust during the Dust-Bioaerosol 2016 Campaign, Atmos. Chem. Phys., 18, 7131–7148, https://doi.org/10.5194/acp-18-7131-2018, 2018.
Thomson, D. S., Schein, M. E., and Murphy, D. M.: Particle Analysis by Laser Mass Spectrometry WB-57F Instrument Overview, Aerosol Sci. Tech., 33, 153–169, https://doi.org/10.1080/027868200410903, 2000.
Toon, O. B., Maring, H., Dibb, J., Ferrare, R., Jacob, D. J., Jensen, E. J., Luo, Z. J., Mace, G. G., Pan, L. L., Pfister, L., Rosenlof, K. H., Redemann, J., Reid, J. S., Singh, H. B., Thompson, A. M., Yokelson, R., Minnis, P., Chen, G., Jucks, K. W., and Pszenny, A.: Planning, implementation, and scientific goals of the Studies of Emissions and Atmospheric Composition, Clouds and Climate Coupling by Regional Surveys (SEAC4RS) field mission, J. Geophys. Res.-Atmos., 121, 4967–5009, https://doi.org/10.1002/2015jd024297, 2016.
Twohy, C. H., McMeeking, G. R., DeMott, P. J., McCluskey, C. S., Hill, T. C. J., Burrows, S. M., Kulkarni, G. R., Tanarhte, M., Kafle, D. N., and Toohey, D. W.: Abundance of fluorescent biological aerosol particles at temperatures conducive to the formation of mixed-phase and cirrus clouds, Atmos. Chem. Phys., 16, 8205–8225, https://doi.org/10.5194/acp-16-8205-2016, 2016.
Xia, X., Wang, J., Ji, J., Zhang, J., Chen, L., and Zhang, R.: Bacterial Communities in Marine Aerosols Revealed by 454 Pyrosequencing of the 16S rRNA Gene, J. Atmos. Sci., 72, 2997–3008, https://doi.org/10.1175/jas-d-15-0008.1, 2015.
Yamamoto, N., Bibby, K., Qian, J., Hospodsky, D., Rismani-Yazdi, H., Nazaroff, W. W., and Peccia, J.: Particle-size distributions and seasonal diversity of allergenic and pathogenic fungi in outdoor air, ISME J., 6, 1801–1811, https://doi.org/10.1038/ismej.2012.30, 2012.
Zawadowicz, M. A.: Model-Measurement Consistency and Limits of Bioaerosol Abundance Over the Continental United States, Harvard Dataverse, V1, https://doi.org/10.7910/DVN/75VVNV, 2019.
Zawadowicz, M. A., Froyd, K. D., Murphy, D. M., and Cziczo, D. J.: Improved identification of primary biological aerosol particles using single-particle mass spectrometry, Atmos. Chem. Phys., 17, 7193–7212, https://doi.org/10.5194/acp-17-7193-2017, 2017.
Zhang, X., Smith, K. A., Worsnop, D. R., Jimenez, J., Jayne, J. T., and Kolb, C. E.: A Numerical Characterization of Particle Beam Collimation by an Aerodynamic Lens-Nozzle System: Part I. An Individual Lens or Nozzle, Aerosol Sci. Tech., 36, 617–631, https://doi.org/10.1080/02786820252883856, 2002.
Zhang, X., Smith, K. A., Worsnop, D. R., Jimenez, J. L., Jayne, J. T., Kolb, C. E., Morris, J., and Davidovits, P.: Numerical Characterization of Particle Beam Collimation: Part II Integrated Aerodynamic-Lens–Nozzle System, Aerosol Sci. Tech., 38, 619–638, https://doi.org/10.1080/02786820490479833, 2004.
Zhu, C., Kawamura, K., Fukuda, Y., Mochida, M., and Iwamoto, Y.: Fungal spores overwhelm biogenic organic aerosols in a midlatitudinal forest, Atmos. Chem. Phys., 16, 7497–7506, https://doi.org/10.5194/acp-16-7497-2016, 2016.
Ziemba, L. D., Beyersdorf, A. J., Chen, G., Corr, C. A., Crumeyrolle, S. N., Diskin, G., Hudgins, C., Martin, R., Mikoviny, T., Moore, R., Shook, M., Thornhill, K. L., Winstead, E. L., Wisthaler, A., and Anderson, B. E.: Airborne observations of bioaerosol over the Southeast United States using a Wideband Integrated Bioaerosol Sensor, J. Geophys. Res.-Atmos., 121, 8506–8524, https://doi.org/10.1002/2015jd024669, 2016.