the Creative Commons Attribution 4.0 License.
the Creative Commons Attribution 4.0 License.
 | 07 Nov 2019
Transport of the 2017 Canadian wildfire plume to the tropics via the Asian monsoon circulation
Corinna Kloss
Gwenaël Berthet
Pasquale Sellitto
Felix Ploeger
Silvia Bucci
Sergey Khaykin
Fabrice Jégou
Ghassan Taha
Larry W. Thomason
Brice Barret
Eric Le Flochmoen
Marc von Hobe
Adriana Bossolasco
Nelson Bègue
Bernard Legras
We show that a fire plume injected into the lower stratosphere at high northern latitudes during the Canadian wildfire event in August 2017 partly reached the tropics. The transport to the tropics was mediated by the anticyclonic flow of the Asian monsoon circulation. The fire plume reached the Asian monsoon area in late August/early September, when the Asian monsoon anticyclone (AMA) was still in place. While there is no evidence of mixing into the center of the AMA, we show that a substantial part of the fire plume is entrained into the anticyclonic flow at the AMA edge and is transported from the extratropics to the tropics, and possibly the Southern Hemisphere particularly following the north–south flow on the eastern side of the AMA. In the tropics the fire plume is lifted by ∼5 km in 7 months. Inside the AMA we find evidence of the Asian tropopause aerosol layer (ATAL) in August, doubling background aerosol conditions with a calculated top of the atmosphere shortwave radiative forcing of −0.05 W m−2. The regional climate impact of the fire signal in the wider Asian monsoon area in September exceeds the impact of the ATAL by a factor of 2–4 and compares to that of a plume coming from an advected moderate volcanic eruption. The stratospheric, trans-continental transport of this plume to the tropics and the related regional climate impact point to the importance of long-range dynamical interconnections of pollution sources.
- Article
(6543 KB) - Full-text XML
- BibTeX
- EndNote


During the 2017 summer season, historically severe wildfires appeared in western Canada and in the northwestern United States. Strong thunderstorms (pyro-cumulonimbus activity), which developed above the fires, injected smoke particles above western Canada into the lower extratropical stratosphere in mid-August (Khaykin et al., 2018). The fire plume was transported through the jet stream eastward and rose 2–3 km per day within the first days after its injection into the stratosphere (Khaykin et al., 2018) and to an altitude of 23 km within 2 months (Yu et al., 2019). Three days after the first appearance in the stratosphere above Canada, the plume first appeared over Europe on 19 August. Above southern France the plume was observed at altitudes up to about 20 km (Khaykin et al., 2018). Multiple studies have analyzed the fire plume above western/central Europe with lidar observations (Khaykin et al., 2018; Ansmann et al., 2018; Peterson et al., 2018). Yu et al. (2019) recently showed with model calculations that most of the fire plume in the stratosphere was quickly transported to the poles (depending on the computed BC content). The general impact on the radiative balance and climate of aerosol plumes from wildfires in the lowermost stratosphere has been discussed in Ditas et al. (2018); they found that the global average direct radiative forcing at the top of the atmosphere (TOA) of biomass burning aerosols from wildfires may reach −0.20 W m−2 (including biomass burning plumes and biomass burning-affected background atmosphere, and including absorbing and scattering aerosol components). A few rare extreme-fire events prior to this case have been investigated in terms of global distribution, showing enhanced trace gas and aerosol signatures at tropical latitudes (e.g., Siddaway and Petelina, 2011, Pumphrey et al., 2011, Jost et al., 2004, and Fromm et al., 2008). Those studies primarily focus on the evolution and distribution of the respective fire plumes rather than the underlying transport processes.
The Asian summer monsoon influences the composition of the upper troposphere–lower stratosphere (UTLS) (Garny and Randel, 2016; Pan et al., 2016; Ploeger et al., 2017), especially in the tropical tropopause layer (TTL, as defined by Fueglistaler et al., 2009; see their Fig. 5a). Either within the upwelling of the Asian monsoon or through the dynamical transport around the Asian monsoon anticyclone (AMA), air masses are drawn up each year between approximatively June and September into the TTL. It has been shown that most of the air entering the stratosphere in the tropics is transported around the AMA circulation without entering its core (Tissier and Legras, 2016). Within the AMA, air masses of continental origin are likely trapped, due to the dynamical barrier of the surrounding jets, and enhanced tropospheric and reduced stratospheric tracer concentrations are typically observed inside the transport barrier (Park et al., 2008; Randel et al., 2010; Bergman et al., 2013; Santee et al., 2016). Additionally, an accumulation of aerosols has been found inside the AMA, the Asian tropopause aerosol layer (ATAL) (Vernier et al., 2011; Yu et al., 2015). The ATAL's existence has been attributed to the recent increase in Asian emissions of anthropogenic pollutants like sulfur dioxide and volatile organic compounds (Neely et al., 2014; Yu et al., 2015) and is sustained by the convective activity of the Asian monsoon. The composition, variability, trend and budget of the ATAL are largely uncertain and are currently being studied. The impact of the ATAL on the extratropical aerosol budget in the Northern Hemisphere (NH) has been investigated by Khaykin et al. (2017). On average, the geographical extent of the AMA is largest in mid-July through the beginning of August and then decreases until it completely dissipates by the end of September (Santee et al., 2016). Lagrangian transport simulations suggest that 5 % of the air mass in the tropical pipe at 460 K and 15 % in the extratropical lowermost stratosphere at 380 K originate in the anticyclone over the course of a year (Ploeger et al., 2017). Conditions of enhanced aerosol concentration such as volcanic eruptions can act as tracers of AMA dynamics. For the Nabro volcano eruption, for example, the emitted aerosol and precursors have been partly injected directly into the lower stratosphere (Vernier et al., 2013; Fromm et al., 2013) at altitudes of about 15–18 km (Clarisse et al., 2014; Fromm et al., 2014). It has been shown that the Asian monsoon anticyclone was a dominant feature governing the dispersion of this volcanic plume (Fairlie et al., 2014). Satellite observations of volcanic effluents as SO2 (Clarisse et al., 2014) and sulfate aerosols (Sellitto et al., 2017) have shown the interaction of the Nabro plume's horizontal dispersion and the AMA dynamics. During the year of the Sarychev eruption, which occurred at the beginning of the Asian monsoon season, a negative anomaly inside the AMA has been shown, while for all other years, there is a positive aerosol anomaly (ATAL) (Vernier et al., 2011). Both observations (for the Sarychev and Nabro eruption) support a transport barrier that separates “inside” and “outside”. Volcanic aerosol plumes remaining outside of the AMA (as for the Sarychev eruption) can instead be transported along the eastern flank of the AMA circulation into the tropics (Wu et al., 2017). The importance of the Asian monsoon circulation for the horizontal transport of extratropical air masses into the tropics has already been shown by Konopka et al. (2010).
The Canadian fire event of August 2017 occurred during the same time frame of the Asian monsoon season in 2017. Here, we investigate the impact of the AMA circulation on the horizontal transport of the fire plume from the Canadian fires in 2017. In addition, we estimate the regional climate impact of the fire plume in the Asian monsoon area, and we compare this impact to the one of the ATAL during the monsoon season. Furthermore, the wider impact of the plume is compared with that of a moderate volcanic eruption.
The paper is structured as follows: data sets and methods are described in Sect. 2. The pathway of the fire plume to the Asian monsoon region is analyzed in Sect. 3. The corresponding regional climate impact is estimated in Sect. 4. Conclusions are drawn in Sect. 5.
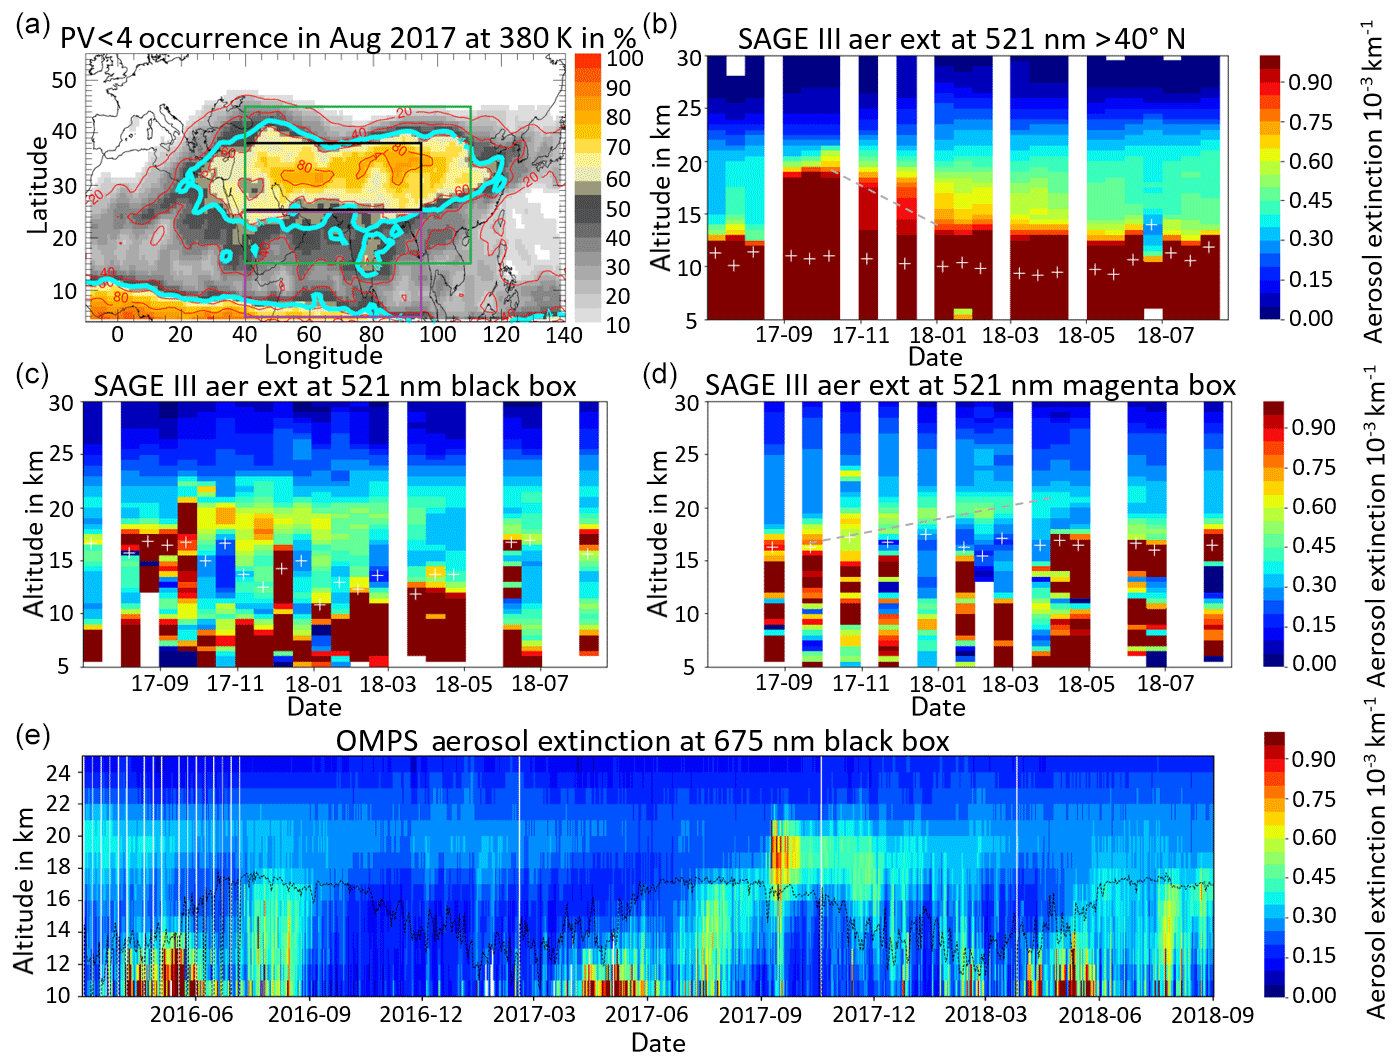
Figure 1(a) Selection criteria for the defined AMA box (black box, 25–38∘ N and 40–95∘ E) for this paper, a southern area (magenta box, 5–25∘ N and 40–95∘ E), and the wider Asian monsoon area box (green box: 15–45∘ N and 40–110∘ E): the occurrence frequency of the AMA at 380 K (color filling) in percentage of days for 1 August to 5 September in 2017 is used as a criterion for the selection of the boxes. It is based on the probability of a grid point having a PV value below 4 PVU, according to Ploeger et al. (2015). Red contours represent the percentage values; the cyan contour shows the average PV transport barrier. (b), (c) and (d): SAGE III aerosol extinction values at 521 nm on 15 d averages for (b) all longitudes and latitudes available above 40∘ N with an average of 88 profiles per bin (however, never higher than 70∘ N), (c) for the black box in (a) with an average of 5 profiles per bin, (d) for the magenta box in (a) with an average of 7 profiles per bin. White plus symbols represent the average tropopause altitude of the averaged profiles. Grey dashed lines in (b) and (d) represent the observed descent/ascent. (e) OMPS daily median aerosol extinction measurements in the black box at 675 nm. The black line represents the daily mean tropopause height in the black box.
2.1 SAGE III-ISS aerosol extinction profiles
The Stratospheric Aerosol and Gas Experiment (SAGE III-ISS) was launched in February 2017 and mounted aboard the International Space Station. Data from the instrument are available from June 2017 onwards (SAGE III, 2019). SAGE III uses solar and lunar occultation and limb scatter to infer profiles of trace gases like ozone and aerosol extinction coefficient at nine wavelengths between 384 and 1544 nm. Due to orbital considerations, SAGE III acquires 30 sets of profiles per day in two latitude bands which span from roughly 60∘ N to 60∘ S over the course of a month, with the best spatial coverage at the mid-latitudes (30–60∘). The vertical extent of the aerosol extinction coefficient profiles is from roughly 40 km down to encountering either the solid Earth or exceeding the dynamical range of the detector, usually in association with an optically opaque water cloud. These profiles have a vertical resolution of ∼1 km and are reported every 0.5 km from 0.5 to 40 km. The horizontal resolution is approximately 200 km along the line of sight between the instrument and the Sun and stretched along the direction of motion of the platform (ISS) by an additional 200 km. The meteorological data including the height of the tropopause are derived from the Modern-Era Retrospective analysis for Research and Applications, Version 2 (MERRA-2). Herein, we make use of the cloud-unfiltered version 5.1 solar occultation aerosol extinction coefficient profiles at three wavelengths (384, 521, 676 nm).

Figure 2(a) Mean SAGE III aerosol extinction profiles in the UTLS at 521 nm in defined areas: the green curve shows the average for the black box from Fig. 1a, from 10 to 15 August. The black curve is the equivalent mean extinction profile for the area 15–45∘ N and 60∘ W–10∘ E. The red curve shows the average for the green box in Fig. 1a from 1 to 5 September. Tropopause heights given by the SAGE III data set are indicated (dotted green line: ±2.7 km; dotted red line: ±2.3 km). The number of profiles averaged is indicated. (b) Spectral AOD from SAGE III observations for the mean fire and ATAL (dashed red and green lines, respectively). The intervals of CALIOP AODs at 550 nm for the July–August (JA) ATAL and Junge layer are also displayed (semi-transparent green and blue, respectively) – Vernier et al. (2015). Dots indicate the Ångström exponent for the fire (red) and ATAL (green).
2.2 OMPS aerosol extinction profiles
The Ozone Mapping Profiler Suite Limb Profiler (OMPS-LP) instrument onboard the Suomi National Polar-orbiting Partnership (Suomi NPP) images the Earth limb by pointing aft along the spacecraft flight path. The sensor employs three vertical slits separated horizontally to provide near-global coverage in 3–4 d. The instrument measures limb-scattering radiance and solar irradiance at the 290–1000 nm wavelength range and the 0–80 km altitude range with 1.6 vertical resolution. The current OMPS-LP algorithm uses the radiance measurements at a single wavelength (675 nm) to estimate the aerosol extinction coefficient profile (Loughman et al., 2018; Bhartia and Torres, 2019). In this study, we use the OMPS version 1.5 aerosol extinction data (Chen et al., 2018), left slit only, from May 2016 to 2018 in the area 25–38∘ N and 40–95∘ E. Data are provided between 10 and 40 km altitude. Clouds have been filtered by removing the data below the cloud top (Chen et al., 2016) for clouds below the tropopause. Hence, potential biomass, volcanic and fire plume aerosol signals are maintained in the stratosphere. However, some residual cloud contamination may remain. As for SAGE III, the tropopause altitude is provided by MERRA-2 forward processing.
2.3 IASI CO observations
To visualize the fire plume in an early stage, when OMPS gives no measurement due to oversaturation, the Infrared Atmospheric Sounding Interferometer (IASI) CO data are chosen as a representation of its position. IASI is a thermal infrared nadir sensor flying onboard the MetOp A, B and C satellites launched in 2006, 2012 and 2016, respectively. The IASI series enables monitoring of the tropospheric content of atmospheric trace gases such as O3 (Eremenko et al., 2008; Barret et al., 2011) and CO (George et al., 2009; De Wachter et al., 2012) with a global coverage twice daily, for each individual sensor. Here, we use CO data retrieved with the Software for a Fast Retrieval of IASI Data (SOFRID) (Barret et al., 2011; De Wachter et al., 2012). Validation against MOZAIC airborne in situ data have demonstrated that SOFRID-CO data are able to capture the seasonal variability of CO at mid-latitudes (Frankfurt) as well as at tropical latitudes (Windhoek) in the lower (and upper) troposphere with correlation coefficients of 0.85 (and 0.70, respectively) (De Wachter et al., 2012). Barret et al. (2016) have also shown that SOFRID-CO data were able to document the accumulation of CO in the UTLS AMA.
2.4 CLaMS CO simulations
The Chemical Lagrangian Model of the Stratosphere (CLaMS) is a Lagrangian chemistry transport model. The transport is modeled based on 3-D forward trajectories and an additional parameterization of small-scale mixing (McKenna et al., 2002; Konopka et al., 2007). For this study, the model transport is driven by ERA-Interim meteorological data (Dee et al., 2011). Here, the CO trace gas enhancements in the AMA simulated by CLaMS are used to confirm the location and isolation of the anticyclone indicated by the PV field. The lower boundary conditions are derived from Atmospheric Infrared Sounder (AIRS) version 6 satellite measurements following the approach presented by Pommrich et al. (2014). Chemical loss is included in the model based on reactions with OH (Pommrich et al., 2014). However, it has to be noted that upward transport in the troposphere is likely too weak in CLaMS due to the lack of a convective parameterization and, therefore, the simulated CO mixing ratios in the Asian monsoon area are likely too low. However, the simulated CO indicates the isolation and position of the AMA.
2.5 TRACZILLA back-trajectories
Back-trajectories are computed using archived horizontal winds and vertical velocities from the European Centre for Medium-Range Weather Forecasts (ECMWF) reanalyses (Pisso and Legras, 2008). For trajectories remaining in the Asian area, ERA-5 kinematics are used for the calculation for 1-hourly time steps with a horizontal resolution of and a vertical resolution of ∼300 to 500 m. For back-trajectories leaving Asia, the global Era-Interim input is used (Dee et al., 2011), with a vertical resolution of around 1 km at the considered altitudes and a horizontal resolution on a global scale and 3-hourly time steps. The time, pressure level and region of the air parcels' release are chosen according to the individual SAGE III profiles of interest. Here, 1000 trajectories are initiated on a regular grid covering the spatial uncertainty of the SAGE III measurements.
2.6 UVSPEC radiative forcing estimations
The shortwave surface and TOA direct radiative forcing for this event is estimated using the UVSPEC radiative transfer model and the LibRadtran package (Mayer and Kylling, 2005), available at the following website: http://www.libradtran.org/doku.php, last access: 11 November 2019. The radiative transfer equation is solved with the SDISORT method, the pseudo-spherical approximation of the discrete ordinate method (DISORT) (Dahlback and Stamnes, 1991). Surface and TOA direct and diffuse shortwave spectra are computed in the range 300 to 3000 nm (0.1 nm spectral resolution). We use the input solar flux spectra of Kurucz (2005). The atmospheric state in terms of the vertical profiles of temperature, pressure, humidity, and gas concentration is set as for the AFGL (Air Force Geophysics Laboratory) climatological standard tropical atmosphere (Anderson et al., 1986). Molecular absorption is parameterized with the LOWTRAN band model (Pierluissi and Peng, 1985), as adopted from the SBDART code (Ricchiazzi et al., 1998). We performed clear-sky simulations. We perform a baseline simulation with this setup and a background boundary layer aerosol layer. Then we add the measured fire plume and ATAL extinction coefficient profiles (SAGE III observations). For baseline and fire plume- or ATAL-perturbed configurations, we simulate the radiative transfer at different solar zenith angles (SZAs). The daily average shortwave TOA radiative forcing for a given aerosol layer (fire plume or ATAL) is calculated as the SZA-averaged upward diffuse irradiance for a baseline simulation without the investigated aerosols minus that with aerosols, integrated over the whole spectral range. The shortwave surface radiative forcing is calculated as the SZA-averaged downward global (direct plus diffuse) irradiance with aerosols minus the baseline, integrated over the whole spectral range.
To study the transport of the Canadian fire plume in the Asian monsoon area, we distinguish two sub-regions: (1) the main Asian monsoon region 15–45∘ N and 40–110∘ E (the green box in Fig. 1a), a compromise from the choices of Santee et al. (2016), Ploeger et al. (2015), Vernier et al. (2011), and (2) the AMA box in 2017, 25–38∘ N and 40–95∘ E, with a maximized probability of being inside the AMA at 380 K for August 2017 (the black box in Fig. 1a). This probability (occurrence frequency) has been calculated according to a maximum in the PV gradient on the 380 K isentrope following Ploeger et al. (2015). Even though this is considered a reliable method to identify the AMA center, it should be noted that the maximum in the PV gradient around the monsoon anticyclone is weak (see the discussion in Ploeger et al., 2015) and has even not been detected for several days during summer 2017. Based on the strength of the easterly jets in 2017, the circulation of the anticyclone was strongest during July and from thereon declined very slowly and was still in place, even if weaker, at the end of September (see Fig. A1).
Figure 1b shows the aerosol extinction values for all longitudes available in the SAGE III above 40∘ N. To exclude most cloud features and also background aerosol in Fig. 1b, we focus on the aerosol extinction region from 0.6 to km−1 for our analysis. A strongly enhanced aerosol extinction signature appears in the SAGE III data set, >40∘ N at the middle to end of August (Fig. 1b), after the beginning of the major fire event in Canada. This confirms the results of multiple previous studies, which have also seen highly increased aerosol signatures due to the fire at the middle to end of August at higher latitudes in the NH (Khaykin et al., 2018; Ansmann et al., 2018; Haarig et al., 2018). It has to be noted that the measurement point furthest north was taken below 70∘ N; however, especially in the winter, most observations are limited to below 50∘ N. Between November 2017 and March 2018, the aerosol signature descends with roughly 0.64 mm s−1 in altitude based on aerosol extinction values km−1 (5 km in 3 months, October to January). This is on the order of the rate expected for the downwelling of the Brewer–Dobson circulation (BDC) (see Abalos et al., 2015). However, other processes may contribute to the observed aerosol extinction decrease in Fig. 1b: the effect of sedimentation is expected to play an important role. The contribution of sedimentation as well as dilution/mixing is not quantified here, because additional microphysical and dynamical sensitivity studies would be necessary. The lower stratosphere is filled with enhanced aerosols until about mid-April 2018.
Figure 1c shows the SAGE III aerosol extinction values in the inner AMA region (black box in Fig. 1a). The unfiltered cloud structures in the SAGE III data set mask the first appearance of the plume in the black box in Fig. 1c. However, the first SAGE III profile in the Asian monsoon region that we can trace back to the fire plume signature and that has previously been transported within the circulation of the AMA appears on 30 August 2017 at ∼17 km altitude (Fig. B1, within the green box). As a result, there is no indication of a fire plume signature within the AMA core (i.e., passing the AMA transport barrier). The relatively high altitudes of this signature (17–20 km) in Fig. 1c indicate that the fire plume arrived in the TTL region in the Asian monsoon area, where the transport barrier might have forced the fire plume to rise by bypassing the AMA on its upper part, as was the case for the Sarychev aerosol plume in 2009 (Vernier et al., 2011). A clear signal is still apparent in April 2018, 8 months after its first appearance and long after the breakdown of the AMA confinement. However, it has to be noted that there are no previous years of SAGE III measurements available, so that no comparison with background conditions in April can be made.

Figure 3Selected maps at 380 K potential temperature on (a) 17 August, (b) 26 August, (c) 5 September and (d) 19 September at 380 K for the CLaMS simulation for the fire tracer initialized in the green box (area: 50< lat <65, 235< long <255; potential temperature: 345 K 465 K) between 345 and 465 K potential temperature. CF_00 represents the fraction of the air mass originating from the green box. The position and time (12 to 14 August 2017) of the initialization of the fire tracer have been chosen according to the first appearance of enhanced CO mixing ratios in the stratosphere above western Canada, observed by IASI (as shown in Fig. 4). White lines represent PV contours. This approach is similar to the one presented in Vogel et al. (2015).
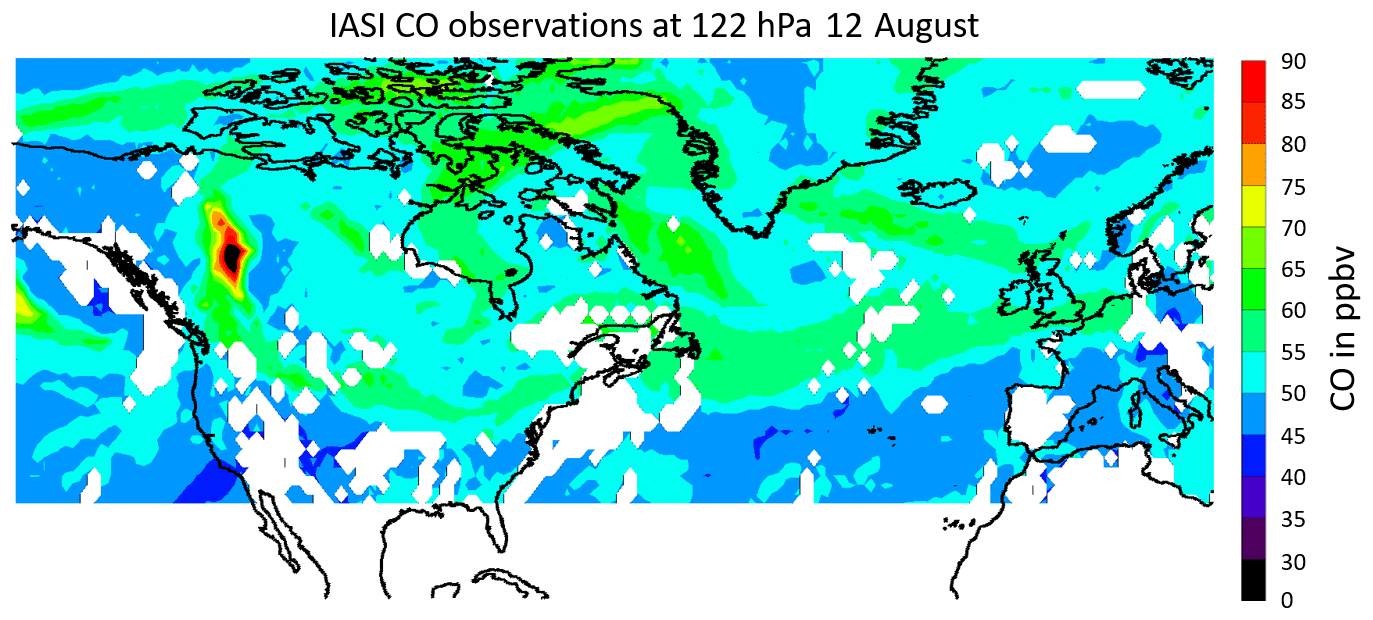
Figure 4IASI-SOFRID CO mixing ratios at 122 hPa for the morning (09:30 local solar time) of 12 August. The high CO plume detected over Canada is used to determine the initialization box chosen for the CLaMS simulation in Fig. 3.
To see whether the fire plume has been transported to the tropics (as has been shown for the Sarychev eruption by Wu et al., 2017), another box south of the core Asian monsoon box has been chosen (Fig. 1d, according to Fig. 1a, magenta box). We attribute the ascending signal starting at around 16 km in mid-September and reaching altitudes of around 21 km about 6 months later to the Canadian wildfire, as its origin coincides in time and altitude with the fire signal in the AMA region (black box, Fig. 1c). Hence, the AMA generates a strong dynamical connection between the mid-latitudes and the tropics during the summer season. In the tropics, the fire plume signature rises about 0.2–0.3 mm s−1 (about 5 km from September to April) in the magenta box according to aerosol extinction values of around km−1. This tropical upwelling velocity estimate is in good agreement with the tropical upwelling velocity in current reanalyses (e.g., Abalos et al., 2015, Fig. 6). Similar ascending features are visible around the globe at 0–25∘ N (Fig. C1). The reversed vertical transport of the aerosol particles in Fig. 1b compared to 1d (i.e., the observed descent at the northern latitudes and ascent in the tropics) reflects the contribution of the ascending and descending branches of the BDC. The average signal for the magenta box remains also until April 2018 at ∼19 km altitude. Based on the good agreement of the slope in the aerosol signal with downwelling and upwelling velocities by the BDC, we hypothesize that the BDC played a role in both extratropical downward and tropical upward transport of the aerosol.
To further verify the link between the enhanced aerosol extinction values in the Asian monsoon region (especially south of the center, as seen in Fig. 1) and the Canadian wild fire plume, individual SAGE III observations are further analyzed in Figs. 5, B2 and B3 to show that the enhanced aerosol extinction values (Fig. 1) can be assigned to the Canadian fire plume.
As a solar occultation instrument, SAGE III provides an enhanced sensitivity of the aerosol extinction signal. In order to provide better statistics for a daily mean and investigate a potential co-occurrence of the fire plume and the ATAL in this area, the denser data set in terms of space and time of the OMPS-LP is inspected in the black box. In Fig. 1e the ATAL is clearly visible for all 3 years displayed (2016–2018) in July and August up to 18 km altitude. The fire plume appears at altitudes between 16 and 21 km at the beginning of September 2017 and is not visible anymore at the end of March 2018. Both signals appear as two distinguishable events on different altitude ranges (fire plume: 16–22 km, ATAL: <18 km). In Fig. 1e, the ATAL is mostly apparent in the troposphere (at altitude levels exhibiting a generally higher AMA confinement, but as expected also with some distinguishable signal in the lowermost stratosphere), while the fire plume appears clearly in the stratosphere (at altitude levels with generally weaker confinement), which indicates a clear separation between the two aerosol layers. During early September (earliest fire signal in Fig. 1e), the ATAL is already in the process of slowly declining.
The green solid line in Fig. 2a shows the average SAGE III profile for the black box from Fig. 1a prior to any fire influence, i.e., 10–15 August. It shows a clear ATAL signal with a broad peak located at ∼15 km altitude. This peculiar peak becomes even more evident in comparison with the average aerosol extinction signal during the same period outside the Asian monsoon box (black dashed line). The ATAL signal doubles the background aerosol extinction at 15 km altitude. The doubling of background conditions and the altitude range agree well with the ATAL signal found by Vernier et al. (2015) in the SAGE II and CALIOP data set. There are no SAGE III measurements from July to 10 August in the wider Asian monsoon area (green box from Fig. 1a). Considering the data coverage of OMPS and SAGE III, the ATAL heights of the two data sets are in reasonable agreement (up to 18 km for OMPS and peaking at 16 km for SAGE III). Looking at the green box between 1 and 5 September (red line) shows that the aerosol extinction of the fire plume reaching the Asian monsoon area is a factor of ∼9 higher than the ATAL signal observed in August and a factor of ∼18 higher than background aerosol conditions. The average peak altitude of the visible fire plume is ∼18 km.
From the average fire plume and ATAL spectral aerosol extinction profiles identified in Fig. 2a, spectral aerosol optical depth (AOD) is derived and shown in Fig. 2b. In Vernier et al. (2015), the time evolution of the averaged ATAL AOD in July–August, between 1995 and 2013, is derived at 525 nm with a combination of SAGE II and CALIOP data, using different hypotheses of the lidar ratio value for the target aerosol layer. For this reason, the derived AODs are very uncertain. The average July–August ATAL AOD estimated by Vernier et al. (2015) lies between 0.0030 and 0.0070. In our case, the average ATAL AOD at 525 nm is ∼0.0025. This is consistent with Vernier et al. (2015), considering that our value is averaged on a late monsoon period (i.e., 10 to 15 August), when the dynamical barrier of the AMA starts to decline and, consequently, the ATAL concentration and AOD are possibly weaker than, e.g., in July. The ATAL AOD decreases steeply with wavelength to values smaller than 0.001 at 1020 nm. The fire plume has significantly higher AOD values, i.e., from values higher than 0.010 at 380–520 nm to ∼0.0045 at 1020 nm. As an indicator of the average particle size in the aerosol populations the average Ångström exponent is estimated for both ATAL and fire plume (Fig. 2b). It is calculated starting from the AOD values at 869 and 521 nm. A higher Ångström exponent can be associated with the prevalence of smaller particles, while a lower exponent points to larger particles on average. Ångström exponents between ∼0.8 and 1.5 may be linked to aged biomass burning plumes (e.g., Müller et al., 2007, and Pereira et al., 2014). By contrast, higher Ångström exponents (1.8 or greater) may point to freshly nucleated secondary aerosol and/or younger biomass burning plumes (e.g., Müller et al., 2007). The average Ångström exponent has values of ∼1.9 for the ATAL and 0.9 for the fire plume (Fig. 2b). This is consistent with our identification of an aged fire plume transported into a region previously dominated by a layer of freshly nucleated, smaller particles.
To investigate the dynamics of the fire plume transport to the AMA region, an air mass origin tracer has been initialized between 12 and 14 August 2017 in the box over western Canada (green box in Fig. 3) using the CLaMS model. The point in time and space of the initialization box was chosen according to the position and time of high observed IASI CO values due to the fire, which is shown in Fig. 4. The simulation with box initialization as presented here provides an illustration of the possible large-scale transport pathways but should not be taken for quantitative estimations for two reasons. (1) The significant self-rising feature of this plume (as observed in Khaykin et al., 2018, and Yu et al., 2019) is not considered in this or any previous Lagrangian transport model, and (2) as we chose a box-shaped area to represent the start of the trajectories (green box in Fig. 3a–d), it becomes evident that some air masses within the box do not belong to the fire plume. The model fire tracer was injected into the respective box throughout the 345–465 K layer. This approach was found to be very robust in terms of initialization levels, by initializing air masses on different potential temperature levels and on each day between 12 and 14 August. Therefore, uncertainties arising from the observed time and injection altitude do not interfere with our line of argument, and the fact that clear transport pathways emerge from the large initialization region further corroborates our results. After initialization, the tracer is advected passively during the following weeks. This approach is similar to the one presented in Vogel et al. (2015): the plume is first transported eastwards at latitudes >40∘ N and passes over Europe in early/mid-August (Fig. 3a). After reaching the Asian monsoon area at the end of August, a fraction of the fire tracer is partly transported along the eastern flank of the AMA circulation from the extratropics into the tropics (Fig. 3b). In the simulations, part of the plume even reaches the Southern Hemisphere (Fig. 3c). It is shown that the plume reaches the tropics (<10∘ N) first through the AMA circulation (Fig. 3c). This is consistent with the SAGE III observations shown before. With the slow breakdown of the AMA, plume air masses mix into the area that has before been confined by the AMA transport barrier from the northern side (Fig. 3d). By mid-September most of the NH is filled with the artificial fire tracer at 380 K potential temperature (Fig. 3d). Similar features are seen at 400 K potential temperature (Fig. D1). This pathway of the fire plume transport to the tropics within the eastern flank of the AMA circulation is further confirmed by OMPS aerosol extinction observations (see Appendix D, Fig. D2).
A measurement profile with readily identifiable and vertically separated AMA and fire plume signatures is shown in Fig. 5a. Around 370 K, the profile inside the AMA shows no clear evidence of enhanced aerosol from the fire plume (Fig. 5a at ∼16 km altitude). This is consistent with the existence of the generally strongest confinement (transport barrier) at around 380 K (Ploeger et al., 2015). The generally weaker confinement at around 400 K compared to 380 K is reflected by the CO gradient and Montgomery stream function shown in Fig. 5b. The enhanced CO mixing ratios displayed in Fig. 5b indicate the entrainment of tropospheric tracers insider the AMA (e.g., Santee et al., 2016; Park et al., 2008). The profile in Fig. 5 is selected here because of its location within the eastern flank of the AMA circulation (Fig. 5b), within the canonical north–south transport pathway from the extratropics to the tropics. Back-trajectories show that air masses from the altitude levels of the fire plume and ATAL peaks pass over partly different regions 9 d prior to the SAGE III measurement profile (Fig. 5c). For this study ultra-violet (UV) aerosol index measurements by OMPS and the position of detected enhanced aerosol extinction values by CALIPSO are displayed in Fig. 5c. While CO mixing ratios are a fire indicator for “fresh” plumes, enhanced aerosol can be traced over longer timescales. Because of the spatial distance between the fire plume origin and the Asian monsoon region, aerosol extinction values rather than CO measurements are taken as an indication for the fire plume. About 40 % of the red back-trajectories (initialized at the fire plume peak altitude) pass over areas with fire influence. Air masses measured at 17–18 km altitude in Fig. 5a can be understood as a mixture of air masses, partly influenced by the fire and partly coming from other regions; in any case, the fire plume particles' signature on the aerosol extinction is predominant. Air masses measured at 15–16 km reasonably follow the AMA circulation and pass through the polluted and convective South-East Asian and Indian regions. Therefore, the two peaks in Fig. 5a, one at 17–18 km altitude (∼395 K) and one at 15–16 km altitude (∼370 K), can be associated with the fire plume and the ATAL, respectively. With the limiting spatial resolution of remote sensing instruments, it cannot be concluded whether both air masses have mixed. More examples are discussed in the Appendix: one profile showing enhanced aerosols due to the fire, originating from the plume (Fig. B2), one profile showing both enhanced aerosols from the plume and ATAL (Fig. B1) and one profile with a visible ATAL signal and no fire signature, due to the dynamical position of the measurement (Fig. B3).
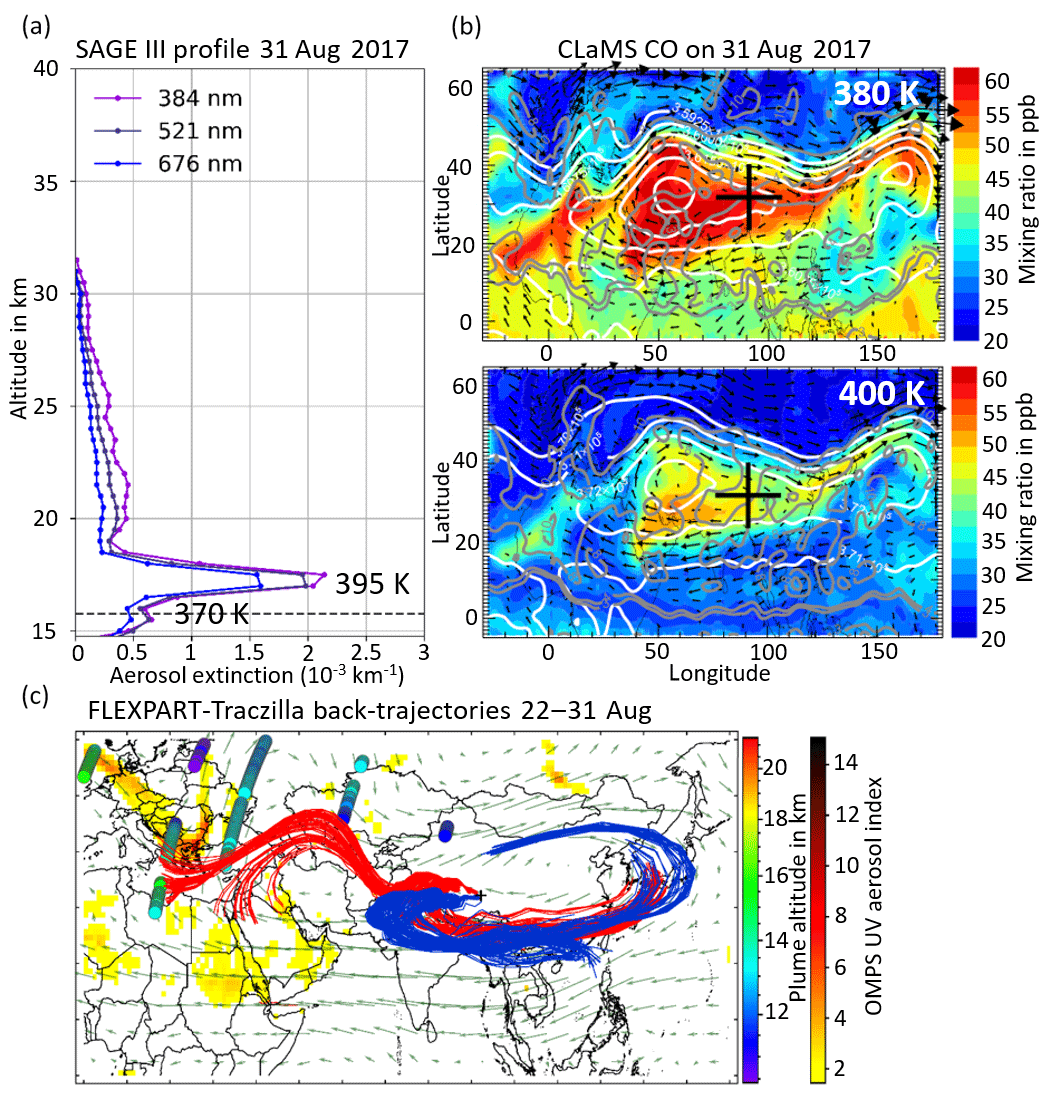
Figure 5(a) SAGE III aerosol extinction values for the profile taken on 31 August 2017 at 31.53∘ N and 91.56∘ E. The dotted black line represents the given tropopause height by the SAGE III data set. (b) CLaMS CO map at 380 and 400 K on 31 August 2017. Grey lines represent the PV contours at 3.6 PVU. The determination of the AMA PV transport barrier works only on a few days in 2017. White lines show the Montgomery stream function. The black cross represents the profile position. (c) OMPS UV aerosol index (yellow-reddish areas) and the plume altitude based on CALIOP observations (blue to green dots), which show enhanced aerosol values due to the fire plume on 22 August (9 d prior to the SAGE III measurement profile in a). Superimposed: every fifth of the 1000 9 d back-trajectories calculated using TRACZILLA starting from the respective altitude and position of the two peaks shown in (a). The blue and red trajectories correspond to the peaks at 15–16 km (370 K) and 17–18 km (395 K), respectively, in (a).
The radiative properties of the fire plume, once in the AMA region, are studied and compared with those of the observed late ATAL layer. Starting from the spectral aerosol extinction from the SAGE III observations for the mean fire plume and ATAL of Fig. 2a, the radiative impacts have been estimated by means of the shortwave (300.0 to 3000.0 nm) daily average clear-sky direct radiative forcing (RF) at the surface and at the TOA, as well as their f ratio (Fig. 6). The f ratio is defined as the ratio between surface and TOA RF (e.g., Di Biagio et al., 2010, and Sellitto et al., 2016). Even though the aerosol extinction data used in our simulation have been observed, hypotheses are necessary for the single scattering albedo (SSA) of the two aerosol layers. To cope with the limited knowledge of this parameter, we run the radiative transfer simulations multiple times using different realistic SSA values: from 0.90 to 0.93 for the advected fire plume and from 0.97 to 0.99 for the ATAL. Values higher than 0.90 for aged fire plumes are found by, e.g., Haywood et al. (2003). This points to the presence of less absorbing features with respect to fresh biomass burning soot because of the progressive coating of condensed sulfates and/or organics (Ditas et al., 2018, and references therein). In addition, SSA for boreal forests fires has, on average, a higher SSA than tropical forest fires (Wong and Li, 2002). The optical properties of this fire plume have been observed with a ground-based lidar, on 22 August in Europe, by Haarig et al. (2018). They report a SSA of 0.80 in the visible spectral range, which is typical of pure-soot particles. Nevertheless, our radiative simulations are representative of a plume at least 2 weeks older than the one sampled by Haarig et al. (2018) and with quite likely less absorbing (in terms of absorption-to-scattering ratio) sulfate-/organics-covered soot particles. Ditas et al. (2018) have shown that SSA, for a biomass burning aerosol plume, is strongly dependent on the coating thickness of core black carbon particles. For aged fire plumes, a particle-to-core ratio of 4 or bigger was observed with in situ aerosol observations on aircraft platforms (Fig. S12a of Ditas et al., 2018). In these cases, the particles' SSA has values of 0.90 or bigger (Fig. S12b of Ditas et al., 2018). Therefore, we select 0.90 to 0.93 as the interval of SSA for the particular aged fire plume investigated in our paper. The ATAL is considered to be principally composed of freshly nucleated secondary organic and sulfate aerosols, both characterized by very high (near-1) SSA. Nevertheless, the precise composition of the ATAL and its variability are still largely unknown. Then, starting from the idea of very reflective aerosols, we have extended the interval of SSA for the ATAL to smaller values (i.e., down to 0.97). To the best of our knowledge, ours is the first estimation of the surface direct RF and f ratio of the ATAL. Our estimation of the TOA RF for the ATAL (about −0.05 W m−2) is significantly smaller than the one from Vernier et al. (2015) (−0.12 W m−2, also shown in Fig. 6). This might be related to the fact that our estimation has been made using observed ATAL aerosol extinction profiles for a late monsoon period (August). The estimated shortwave surface RF is about −0.05 W m−2; consequently, the ATAL f ratio is ∼1. This value is typical of very reflective aerosol layers, as expected for a layer mostly composed of condensed sulfates or organic aerosols. By contrast, the estimated shortwave RF for the advected aged fire plume is about −0.18 W m−2 at TOA and about −0.46 W m−2 at the surface, leading to an average f ratio of ∼3.8, typical of significantly absorbing layers (e.g., Sellitto and Briole, 2015). From the TOA RF calculations for the fire plume and ATAL, it can be concluded that the regional climate impact of the fire plume is up to 4 times (late ATAL, our estimation) and 2 times (peak ATAL, estimation by Vernier et al., 2015) larger than the one of the ATAL. Our RF estimation for the fire plume is consistent with the estimated RF for biomass burning from wildfires of Ditas et al. (2018). The fire plume TOA RF estimated here in the tropical UTLS has the same order of magnitude as a moderate volcanic eruption. For example, Haywood et al. (2003) have estimated the mean RF of the 2010 Sarychev aerosols to about −0.25 W m−2 once dispersed in the NH stratosphere. While here we do not attempt to estimate the impact of the aged Canadian fire plume over the whole NH, we provide an estimation of an already widespread fire plume (see Fig. 3c and d). In addition, the calculated values of the f ratio and TOA RF suggest that while the fire plume has this significant cooling impact on the climate system, it can produce an additional local heating in the layer where it is located for f ratio values considerably larger than 1 (Sellitto and Briole, 2015).

Figure 6Daily average clear-sky top of the atmosphere (TOA) and surface direct radiative forcing (triangles), and f ratio (dots), for the mean fire plume and ATAL profiles of Fig. 2a. Green represents the calculations for the ATAL, red for the fire. The variability of the SSA in our calculations is reflected by the error bars. The clear-sky TOA radiative forcing estimation for the July–August ATAL of Vernier et al. (2015) is also shown (semi-transparent green square).
The circulation of the AMA has effectively transported Canadian fire plume air from northern latitudes (∼40∘ N) around its eastern flank into the tropics, where the air has further been lifted with the ascending branch of the BDC.
Although the highest extent of the fire plume in the stratosphere is seen at higher latitudes (>40∘ N), a plume signal appears at the end of August 2017 in the lower stratosphere (17 km) above the AMA/layer of confinement. The signal remains visible in the Asian area until April 2018. The diluted fire plume exceeds the concentrated ATAL signal, on average, in the Asian monsoon region by a factor of 9 in terms of measured aerosol extinction (1–5 September compared to 10–15 August 2017). Within the AMA region in 2017 (25–38∘ N and 40–95∘ E) and also south of the AMA (5–25∘ N and 40–95∘ E) an enhanced aerosol extinction signal is visible above the tropopause in the second half of August. This signal remains at ∼19 km until April 2018. We found no evidence that the fire plume passes the barrier, mixing with the air masses inside the AMA. We conclude that the fire plume has largely bypassed the AMA, as observed in the past for the Sarychev plume.
Even though recent moderate volcanic eruptions have had bigger impacts on the aerosol budget in the global stratosphere, we show that extreme fire events, like the Canadian fires in 2017, can also have an impact on the global atmosphere by transport of the plume into the tropics via the eastern flank of the AMA circulation. These fire events may even occur at high northern latitudes and are still subject to efficient transport to the tropics. For this event, we estimate a significant regional climate impact, exceeding the ATAL climate forcing by a factor of 2 to 4, and our calculations suggest a significant cooling of the NH climate system, comparable to a moderate volcanic eruption. The partially absorbing nature of aged fire aerosols may lead to a significant local heating of the layer where they reside. While in this study we present one case example of the plume that originated from the Canadian wildfires in 2017, it has to be noted that extreme fire events like this are expected to occur more frequently due to climate change (Field et al., 2014). Already in 2018 another series of record-breaking wildfires has been reported (Lindsay, 2018). For future extreme wildfire events the AMA circulation will provide a pathway for long-range transport of atmospheric pollutants and fire plumes each year from the NH to the tropics and possibly to the Southern Hemisphere and the stratosphere.
Most of the Canadian fire aerosols injected into the Northern Hemisphere stratosphere have been transported to the north, descending back to the troposphere via the lower branch of the BDC (Yu et al., 2019). In this study, we analyze one specific southward transport pathway: the transport in the lower stratosphere within the easterly jet together with the north–south anticyclonic flow at the eastern flank of the AMA. We show that this is an efficient transport pathway from northern latitudes to the tropics. However, other dynamical processes bringing air masses from the mid-latitudes to the tropics are possible and not investigated in this study: for instance, the easterly jet in the lower stratosphere does not appear only at one specific latitude, but can also allow for a southward (also northward) propagation of air masses. Furthermore, fire plume air masses injected in the mid-latitude upper troposphere to the tropics with subsequent uplift to the stratosphere could be considered. Beside the AMA, which is by far the largest periodically reoccurring anticyclonic flow system in the lower stratosphere on Earth, dynamical effects of other monsoon systems have the potential to transport air masses southwards (e.g., the North American monsoon and the West African monsoon) in the lower stratosphere.
The aerosol extinction data sets from SAGE III-ISS v5.1 are available at the NASA Langley Research Center Atmospheric Science Data Center at https://eosweb.larc.nasa.gov (SAGE III, 2019) and OMPS v1.5 at https://daac.gsfc.nasa.gov/ (Bhartia and Torres, 2019). The model and simulation data may be requested from the corresponding author: the CLaMS model data (f.ploeger@fz-juelich.de), the UVSPEC input and output files for the radiative forcing calculations (pasquale.sellitto@lisa.u-pec.fr) and the TRACZILLA back-trajectories (silvia.bucci@lmd.ens.fr).
The criterion for the breakdown of the AMA circulation in 2017 is chosen according to the strength of the easterly jet that forms the southern branch of the anticyclone and is displayed in Fig. A1. The jet has its maximum at 12 km altitude (196 hPa). Hence, the criterion is based on this altitude. For the years 2010–2017 the jet intensifies on average from April to July, with a highest intensity in July (green curve). While the jet intensifies, it moves northwards to ∼5∘ N. Especially in 2017 (red curve), the data show a much faster onset than decline, which is not the case for an average year between 2010 and 2017 (black curve). From those data it can be concluded that the anticyclone is still there until the end of September 2017.

Figure A1Maximum easterly wind (m s−1) and latitude of the maximum wind (in degree) produced from ERA 5 (Copernicus Climate Change Service (C3S), 2017). Climatology from twice-daily data 2010–2017 in black, with ±1 standard deviation in green. Respective data for the year 2017 in red.
Another SAGE III aerosol extinction profile with two peaks, one at 15 km (tropopause height, corresponding to a potential temperature of 365 K) and one at 17 km (corresponding to a potential temperature of 380 K), is shown in Fig. B1. The magnitude of the aerosol extinction peak at 15 km agrees well with the ATAL signal observed in Fig. 2. To put the observed measurement profile of Fig. B1a in the context of the dynamical/meteorological situation on the day of the SAGE III measurement profile, the strength and position of the AMA have been investigated (Fig. B1b) and back-trajectories calculated. While the 9 d back-trajectories from the peak at 17 km altitude (red trajectories) reach out to western Asia, the blue trajectories corresponding to the lower peak at 15 km do not reach as far to the west. At this time the very first fire plume signal is observed in western Asia and then transported within the next week over central and eastern Asia (Khaykin et al., 2018 in Fig. 3). Consequently, the higher peak at 17 km altitude (with air mass influence from far western Asia on 21 August) may be interpreted as a mixture of air masses partly originating from the Canadian fire plume. The lower peak at 15 km altitude (with 9 d back-trajectories reaching back to regions where the fire plume has not been transported to yet and staying closer to the center of the AMA) can be associated with the ATAL signal (Fig. B1).
Figure B2a shows a clear aerosol extinction enhancement at 18 km altitude, equivalent to 445 K potential temperature. At the altitude of the aerosol extinction peak, the calculated Ångström exponent is ∼1.2, suggesting that the peak indeed results from the aged fire plume. Figure B2b shows the position of the SAGE III profile within its dynamical surrounding. The CLaMS CO tracer in Fig. B2b gives an indication of the position of the AMA center with its enhanced tropospheric trace gases and does not show “real” CO abundances (e.g., the model CO mixing ratios depend strongly on the used boundary condition from AIRS observations and on the representation of tropospheric transport processes; see Pommrich et al., 2014). Even though the profile has been taken in early September, a time when the transport barrier is generally in the phase of slowly dissolving, enhanced artificial CO with isolated features is still visible at 400 K, which confirms the long lifetime of the AMA, particularly in 2017 shown in Fig. A1. A group of perturbed back-trajectories (1000), obtained using the TRACZILLA Lagrangian model, has been launched from the center of the peak seen in Fig. B2, determined from the SAGE III observation. All 1000 calculated back-trajectories pass over northern Canada ∼18 d prior to the SAGE III measurement profile at a pressure level of 85.87±4.37 hPa (Fig. B2c). IASI CO observations show highly increased CO values at a 85 hPa pressure level. It is easily identified as due to the injection of the Canadian fire plume into the stratosphere 18 d prior to the SAGE III measurement profile (with respect to the end points of the trajectories). Consistent with Fig. B2c, the upper aerosol extinction peak in Fig. B2a can convincingly be associated with the Canadian fire plume.
Pure ATAL signals without any fire signature often appear in the SAGE III data set at 15 km altitude or slightly above, with the Ångström exponent mainly between 2.0 and 2.5. At the peak altitude of 16–17 km we calculate an Ångström exponent of 2.2. Therefore, the enhanced aerosol extinction values in Fig. B3a can be associated with the ATAL signal, even though it is 1–2 km higher than other ATAL signals seen with the SAGE III data set (which could be a sign of an ATAL air mass leaving the dissipating AMA “bubble” – Yu et al., 2017). On the northern side of the AMA a high PV gradient indicates a strong transport barrier (B), related to the strong westerly winds of the subtropical jet. Therefore, the profile taken at the border of the AMA is dynamically clearly in the center of the AMA, and it is not surprising that no fire plume signal is visible in Fig. B3a. Figure B3c shows the 9 d back-trajectories from the ATAL signal in Fig. B3a. All 1000 trajectories only reach areas of the core anticyclone shielded by the transport barrier, following the wind fields shown in Fig. B3b.
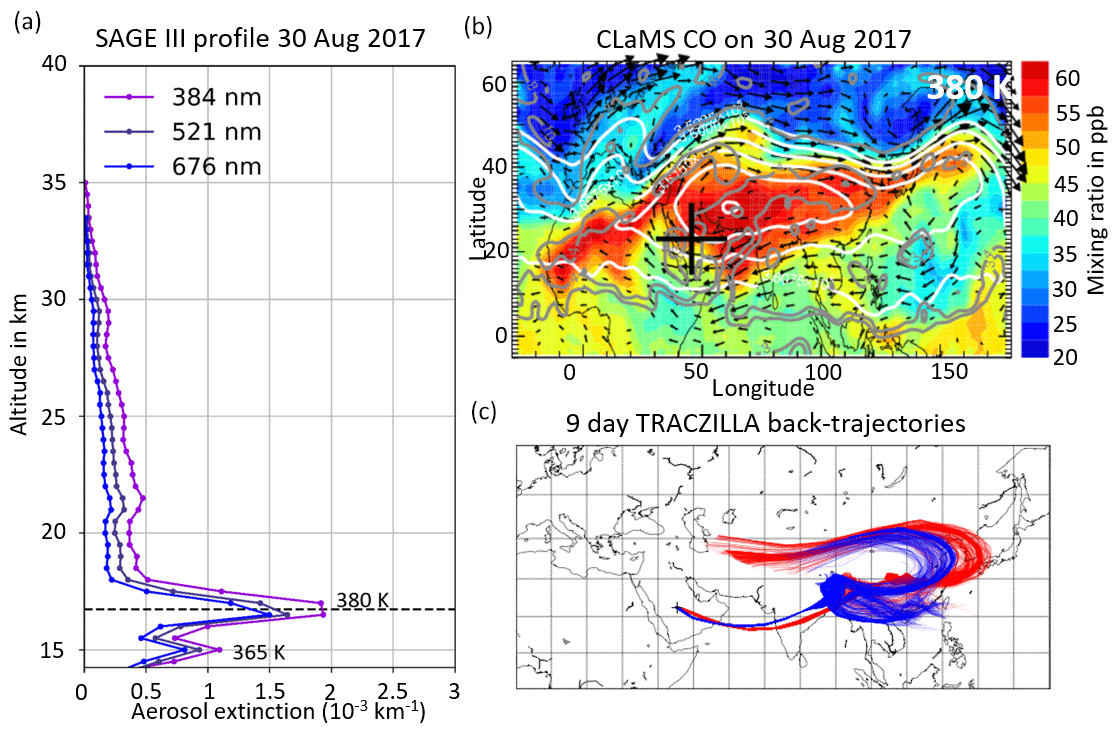
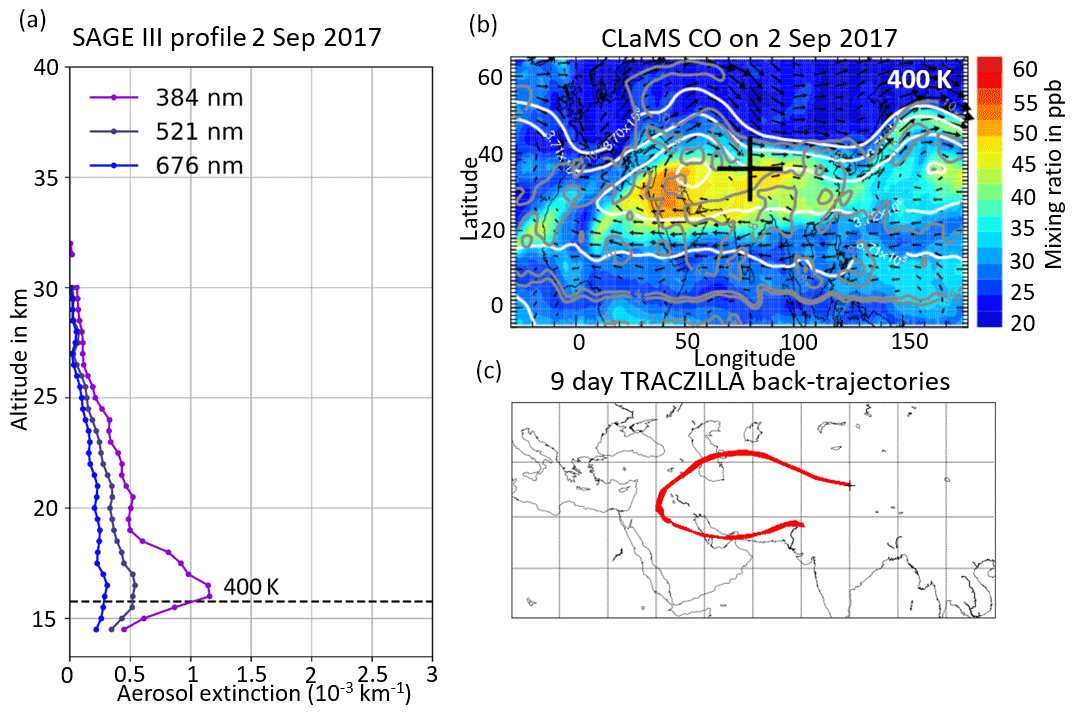
Figure B1(a) SAGE III aerosol extinction values for the profile taken on 30 August 2017 at 22.47∘ N and 45.18∘ E. The dotted black line represents the given tropopause height by the SAGE III data set. (b) ClaMS CO map at 380 K. Grey lines represent the PV contours at 3.6 PVU. The determination of the AMA PV transport barrier works only on a few days in 2017. White lines show the Montgomery stream function. The position of the measurement profile from (a) is indicated with the black cross. (c) The 1000 9 d back-trajectories with respect to the altitude and position of the two peaks shown in (a). The beginning of the blue trajectories corresponds to the peak at 15 km altitude (365 K), the red trajectories to the peak at 17 km altitude (380 K) in (a).
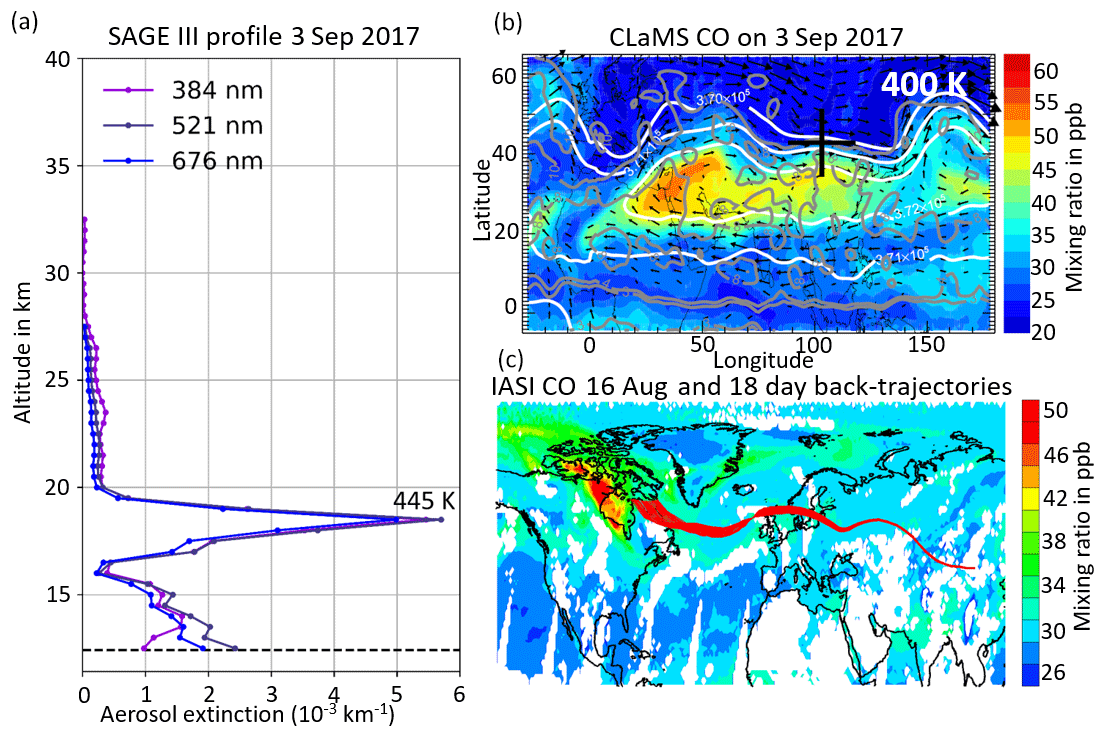
Figure B2Same as for Fig. 5 and B1 for 3 September 2017 at 42.94∘ N and 103.8∘ E. (a) The dotted black line represents the given tropopause height by the SAGE III data set. (b) CLaMS CO map at 400 K on 3 September 2017. (c) IASI CO map, integrated over 12 h at 85.18 hPa 18 d before the SAGE III profile measurement in (a). Superimposed: every fifth of the 1000 18 d TRACZILLA kinematic back-trajectories initialized at the geographical position and altitude of the fire plume peak in (a).
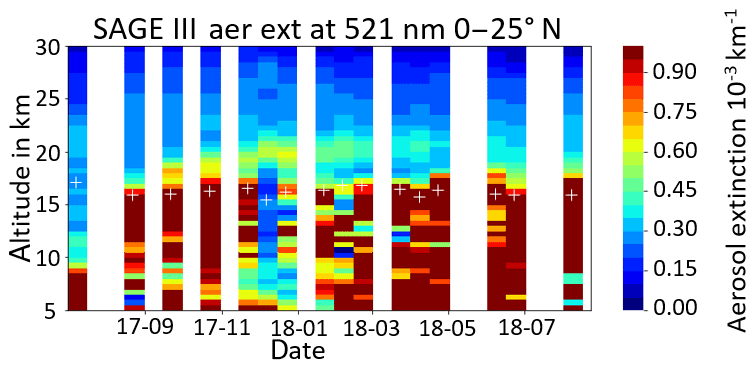
As the upwelling of the BDC in the tropics is a feature usually displayed on a bigger scale, a larger area covering all longitudes in the Northern Hemisphere tropics (0–25∘ N) was chosen (Fig. C1). The ascending features of enhanced aerosol extinction values (as seen in Fig. 1d) are clearly visible in Fig. C1 and can therefore be attributed to the rising branch in the tropics of the BDC.
Once injected into the stratosphere, the initialized fire tracer follows very similar patterns at different potential temperature levels, as seen when comparing Fig. 3 with Fig. D1.
Figure D2 shows OMPS aerosol extinction measurements, supporting the transport pathway simulated by CLaMS in Fig. 3. The fire plume signal approaches the Asian region from the west and is transported into the tropics via the eastern flank of the AMA. To exclude a biased signal due to clouds, the altitude 18.5 km has been chosen.


Figure D2OMPS aerosol extinction observation 675 nm at 18.5 km altitude on 22 August and 2 September at 675 nm. White lines are the MERRA winds.
CK, GB, and PS designed the research and analyzed and interpreted the data. FP, SB, and PS provided simulations and calculations. BL, LWT, GT, BB, EL, and SK provided data and data analysis. MH, AB, FJ, and NB were involved in discussion and data interpretation. All the co-authors contributed in writing the paper.
The authors declare that they have no conflict of interest.
The providers of the LibRadtran suite are gratefully acknowledged. Furthermore, the authors acknowledge the National Aeronautics and Space Administration (NASA) and the SAGE III-ISS and OMPS teams. The authors thank Jean-Paul Vernier for helpful discussions and David Huber for technical support.
This research has been supported by the Agence Nationale de La Recherche (grant no. ANR-17-CE01-0015, TTL-Xing) and the VOLTAIRE LabEx (VOLatils – Terre, Atmosphère et Interactions – Ressources et Environnement) as part of WP7 (convention no. ANR-10-LABX-100-01). Corinna Kloss was partly funded by the Deutsche Forschungsgemeinschaft (DFG, German Research Foundation) – 409585735. Felix Ploeger was funded by the Helmholtz Association under grant VH-NG-1128 (Helmholtz Young Investigators Group ASPECi). Silvia Bucci was supported by EU FP7 (grant nos. 603557, CEFIPRA5607-1). IASI-related activities were supported by CNES (TOSCA IASI project).
This paper was edited by Hang Su and reviewed by Michael Fromm and two anonymous referees.
Abalos, M., Legras, B., Ploeger, F., and Randel, W. J.: Evaluating the advective Brewer-Dobson circulation in three reanalyses for the period 1979–2012, J. Geophys. Res., 120, 7534–7554, https://doi.org/10.1002/2015JD023182, 2015. a, b
Anderson, G., Clough, S., Kneizys, F., and Shettle, E.: AFGL Atmospheric Constituent Profiles (0.120 km), AFGL Environmental Research Papers, 1–46, available at: https://apps.dtic.mil/dtic/tr/fulltext/u2/a175173.pdf (last access: 11 March 2019), 1986. a
Ansmann, A., Baars, H., Chudnovsky, A., Mattis, I., Veselovskii, I., Haarig, M., Seifert, P., Engelmann, R., and Wandinger, U.: Extreme levels of Canadian wildfire smoke in the stratosphere over central Europe on 21–22 August 2017, Atmos. Chem. Phys., 18, 11831–11845, https://doi.org/10.5194/acp-18-11831-2018, 2018. a, b
Bhartia, P. K. and Torres, O. O.: OMPS-NPP L2 LP Aerosol Extinction Vertical Profile swath daily 3slit V1.5, Greenbelt, MD, USA, Goddard Earth Sciences Data and Information Services Center (GES DISC), https://doi.org/10.5067/GZJJYA7L0YW2, last access: 22 Februar 2019. a, b
Barret, B., Le Flochmoen, E., Sauvage, B., Pavelin, E., Matricardi, M., and Cammas, J. P.: The detection of post-monsoon tropospheric ozone variability over south Asia using IASI data, Atmos. Chem. Phys., 11, 9533–9548, https://doi.org/10.5194/acp-11-9533-2011, 2011. a, b
Barret, B., Sauvage, B., Bennouna, Y., and Le Flochmoen, E.: Upper-tropospheric CO and O3 budget during the Asian summer monsoon, Atmos. Chem. Phys., 16, 9129–9147, https://doi.org/10.5194/acp-16-9129-2016, 2016. a
Bergman, J. W., Fierli, F., Jensen, E. J., Honomichl, S., and Pan, L. L.: Boundary layer sources for the Asian anticyclone: Regional contributions to a vertical conduit, J. Geophys. Res., 118, 2560–2575, https://doi.org/10.1002/jgrd.50142, 2013. a
Chen, Z., DeLand, M., and Bhartia, P. K.: A new algorithm for detecting cloud height using OMPS/LP measurements, Atmos. Meas. Tech., 9, 1239–1246, https://doi.org/10.5194/amt-9-1239-2016,2016. a
Chen, Z., Bhartia, P. K., Loughman, R., Colarco, P., and DeLand, M.: Improvement of stratospheric aerosol extinction retrieval from OMPS/LP using a new aerosol model, Atmos. Meas. Tech., 11, 6495–6509, https://doi.org/10.5194/amt-11-6495-2018, 2018. a
Clarisse, L., Coheur, P.-F., Theys, N., Hurtmans, D., and Clerbaux, C.: The 2011 Nabro eruption, a SO2 plume height analysis using IASI measurements, Atmos. Chem. Phys., 14, 3095–3111, https://doi.org/10.5194/acp-14-3095-2014, 2014. a, b
Dahlback, A. and Stamnes, K.: A new spherical model for computing the radiation field available for photolysis and heating at twilight, Planet. Space Sci., 39, 671–683, https://doi.org/10.1016/0032-0633(91)90061-E, 1991. a
Dee, D. P., Uppala, S. M., Simmons, A. J., Berrisford, P., Poli, P., Kobayashi, S., Andrae, U., Balmaseda, M. A., Balsamo, G., Bauer, P., Bechtold, P., Beljaars, A. C. M., van de Berg, L., Bidlot, J., Bormann, N., Delsol, C., Dragani, R., Fuentes, M., Geer, A. J., Haimberger, L., Healy, S. B., Hersbach, H., Hólm, E. V., Isaksen, L., Kållberg, P., Köhler, M., Matricardi, M., McNally, A. P., Monge-Sanz, B. M., Morcrette, J.-J., Park, B.-K., Peubey, C., de Rosnay, P., Tavolato, C., Thépaut, J.-N., and Vitart, F.: The ERA-Interim reanalysis: configuration and performance of the data assimilation system, Q. J. R. Meteorol. Soc., 137, 553–597, https://doi.org/10.1002/qj.828, 2011. a, b
De Wachter, E., Barret, B., Le Flochmoën, E., Pavelin, E., Matricardi, M., Clerbaux, C., Hadji-Lazaro, J., George, M., Hurtmans, D., Coheur, P.-F., Nedelec, P., and Cammas, J. P.: Retrieval of MetOp-A/IASI CO profiles and validation with MOZAIC data, Atmos. Meas. Tech., 5, 2843–2857, https://doi.org/10.5194/amt-5-2843-2012, 2012. a, b, c
Di Biagio, C., di Sarra, A., and Meloni, D.: Large atmospheric shortwave radiative forcing by Mediterranean aerosols derived from simultaneous ground-based and spaceborne observations and dependence on the aerosol type and single scattering albedo, J. Geophys. Res., 115, D10209, https://doi.org/10.1029/2009JD012697, 2010. a
Ditas, J., Ma, N., Zhang, Y., Assmann, D., Neumaier, M., Riede, H., Karu, E., Williams, J., Scharffe, D., Wang, Q., Saturno, J., Schwarz, J. P., Katich, J. M., McMeeking, G. R., Zahn, A., Hermann, M., Brenninkmeijer, C. A. M., Andreae, M. O., Pöschl, U., Su, H., and Cheng, Y.: Strong impact of wildfires on the abundance and aging of black carbon in the lowermost stratosphere, P. Natl. Acad. Sci. USA, 115, E11595–E11603, https://doi.org/10.1073/pnas.1806868115, 2018. a, b, c, d, e, f
Eremenko, M., Dufour, G., Foret, G., Keim, C., Orphal, J., Beekmann, M., Bergametti, G., and Flaud, J.-M.: Tropospheric ozone distributions over Europe during the heat wave in July 2007 observed from infrared nadir spectra recorded by IASI, J. Geophys. Res. Lett., 35, L18805, https://doi.org/10.1029/2008GL034803, 2008. a
Fairlie, T. D., Vernier, J.-P., Natarajan, M., and Bedka, K. M.: Dispersion of the Nabro volcanic plume and its relation to the Asian summer monsoon, Atmos. Chem. Phys., 14, 7045–7057, https://doi.org/10.5194/acp-14-7045-2014, 2014. a
Field, C., Barros, V., Dokken, D., Mach, K., Mastrandrea, M., Bilir, T., Chatterjee, M., Ebi, K., Estrada, Y., Genova, R., Girma, B., Kissel, E., Levy, A., MacCracken, S., Mastrandrea, P., and White, L.: Climate Change 2014 Impacts, Adaptation, and Vulnerability, Part A: Global and Sectoral Aspects, Contribution of Working Group II to the Fifth Assessment Report of the Intergovernmental Panel on Climate Change, IPCC, 32 pp., 2014. a
Fromm, M., Torres, O., Diner, D., Lindsey, D., Vant Hull, B., Servranckx, R., Shettle, E. P., and Li, Z.: Stratospheric impact of the Chisholm pyrocumulonimbus eruption: 1. Earth-viewing satellite perspective, J. Geophys. Res.-Atmos., 113, D08202, https://doi.org/10.1029/2007JD009153, 2008. a
Fromm, M., Nedoluha, G., and Charvát, Z.: Comment on “Large Volcanic Aerosol Load in the Stratosphere Linked to Asian Monsoon Transport”, Science, 339, 647–647, https://doi.org/10.1126/science.1228605, 2013. a
Fromm, M., Kablick III, G., Nedoluha, G., Carboni, E., Grainger, R., Campbell, J., and Lewis, J.: Correcting the record of volcanic stratospheric aerosol impact: Nabro and Sarychev Peak, J. Geophys. Res.-Atmos., 119, 10,343–10,364, https://doi.org/10.1002/2014JD021507, 2014. a
Fueglistaler, S., Dessler, A. E., Dunkerton, T. J., Folkins, I., Fu, Q., and Mote, P. W.: Tropical tropopause layer, Rev. Geophys., 47, RG1004, https://doi.org/10.1029/2008RG000267, 2009. a
Garny, H. and Randel, W. J.: Transport pathways from the Asian monsoon anticyclone to the stratosphere, Atmos. Chem. Phys., 16, 2703–2718, https://doi.org/10.5194/acp-16-2703-2016, 2016. a
George, M., Clerbaux, C., Hurtmans, D., Turquety, S., Coheur, P.-F., Pommier, M., Hadji-Lazaro, J., Edwards, D. P., Worden, H., Luo, M., Rinsland, C., and McMillan, W.: Carbon monoxide distributions from the IASI/METOP mission: evaluation with other space-borne remote sensors, Atmos. Chem. Phys., 9, 8317–8330, https://doi.org/10.5194/acp-9-8317-2009, 2009. a
Haarig, M., Ansmann, A., Baars, H., Jimenez, C., Veselovskii, I., Engelmann, R., and Althausen, D.: Depolarization and lidar ratios at 355, 532, and 1064 nm and microphysical properties of aged tropospheric and stratospheric Canadian wildfire smoke, Atmos. Chem. Phys., 18, 11847–11861, https://doi.org/10.5194/acp-18-11847-2018, 2018. a, b, c
Haywood, J. M., Osborne, S. R., Francis, P. N., Keil, A., Formenti, P., Andreae, M. O., and Kaye, P. H.: The mean physical and optical properties of regional haze dominated by biomass burning aerosol measured from the C-130 aircraft during SAFARI 2000, J. Geophys. Res.-Atmos., 108, 8473, https://doi.org/10.1029/2002JD002226, 2003. a, b
Jost, H.-J., Drdla, K., Stohl, A., Pfister, L., Loewenstein, M., Lopez, J. P., Hudson, P. K., Murphy, D. M., Cziczo, D. J., Fromm, M., Bui, T. P., Dean-Day, J., Gerbig, C., Mahoney, M. J., Richard, E. C., Spichtinger, N., Pittman, J. V., Weinstock, E. M., Wilson, J. C., and Xueref, I.: In-situ observations of mid-latitude forest fire plumes deep in the stratosphere, Geophys. Res. Lett., 31, L11101, https://doi.org/10.1029/2003GL019253, 2004. a
Khaykin, S. M., Godin-Beekmann, S., Keckhut, P., Hauchecorne, A., Jumelet, J., Vernier, J.-P., Bourassa, A., Degenstein, D. A., Rieger, L. A., Bingen, C., Vanhellemont, F., Robert, C., DeLand, M., and Bhartia, P. K.: Variability and evolution of the midlatitude stratospheric aerosol budget from 22 years of ground-based lidar and satellite observations, Atmos. Chem. Phys., 17, 1829–1845, https://doi.org/10.5194/acp-17-1829-2017, 2017. a
Khaykin, S. M., Godin-Beekmann, S., Hauchecorne, A., Pelon, J., Ravetta, F., and Keckhut, P.: Stratospheric Smoke With Unprecedentedly High Backscatter Observed by Lidars Above Southern France, Geophys. Res. Lett., 45, 1639–1646, https://doi.org/10.1002/2017GL076763, 2018. a, b, c, d, e, f, g
Konopka, P., Günther, G., Müller, R., dos Santos, F. H. S., Schiller, C., Ravegnani, F., Ulanovsky, A., Schlager, H., Volk, C. M., Viciani, S., Pan, L. L., McKenna, D.-S., and Riese, M.: Contribution of mixing to upward transport across the tropical tropopause layer (TTL), Atmos. Chem. Phys., 7, 3285–3308, https://doi.org/10.5194/acp-7-3285-2007, 2007. a
Konopka, P., Grooß, J.-U., Günther, G., Ploeger, F., Pommrich, R., Müller, R., and Livesey, N.: Annual cycle of ozone at and above the tropical tropopause: observations versus simulations with the Chemical Lagrangian Model of the Stratosphere (CLaMS), Atmos. Chem. Phys., 10, 121–132, https://doi.org/10.5194/acp-10-121-2010, 2010. a
Kurucz, R.: The solar spectrum:, Atmos. Chem. Phys., 5, 1855–1877, https://doi.org/10.5194/acp-5-1855-2005, 2005. a
Lindsay, B.: 2018 now worst fire season on record as B.C. extends state of emergency, available at: https://www.cbc.ca/news/canada/british-columbia/state-emergency-bc-wildfires-1.4803546 (last access: 11 March 2019), 2018. a
Loughman, R., Bhartia, P. K., Chen, Z., Xu, P., Nyaku, E., and Taha, G.: The Ozone Mapping and Profiler Suite (OMPS) Limb Profiler (LP) Version 1 aerosol extinction retrieval algorithm: theoretical basis, Atmos. Meas. Tech., 11, 2633–2651, https://doi.org/10.5194/amt-11-2633-2018, 2018. a
Mayer, B. and Kylling, A.: Technical note: The libRadtran software package for radiative transfer calculations – description and examples of use, Atmos. Chem. Phys., 5, 1855–1877, https://doi.org/10.5194/acp-5-1855-2005, 2005. a
McKenna, D. S., Konopka, P., Grooß, J.-U., Günther, G., Müller, R., Spang, R., Offermann, D., and Orsolini, Y.: A new Chemical Lagrangian Model of the Stratosphere (CLaMS) 1. Formulation of advection and mixing, J. Geophys. Res., 107, D16, https://doi.org/10.1029/2000JD000114, 2002. a
Müller, D., Ansmann, A., Mattis, I., Tesche, M., Wandinger, U., Althausen, D., and Pisani, G.: Aerosol-type-dependent lidar ratios observed with Raman lidar, J. Geophys. Res., 112, D16202, https://doi.org/10.1029/2006JD008292, 2007. a, b
Neely, R. R., Yu, P., Rosenlof, K. H., Toon, O. B., Daniel, J. S., Solomon, S., and Miller, H. L.: The contribution of anthropogenic SO2 emissions to the Asian tropopause aerosol layer, J. Geophys. Res., 119, 1571–1579, https://doi.org/10.1002/2013JD020578, 2014. a
Pan, L. L., Honomichl, S. B., Kinnison, D. E., Abalos, M., Randel, W. J., Bergman, J. W., and Bian, J.: Transport of chemical tracers from the boundary layer to stratosphere associated with the dynamics of the Asian summer monsoon, J. Geophys. Res., 121, 14,159–14,174, https://doi.org/10.1002/2016JD025616, 2016. a
Park, M., Randel, W. J., Emmons, L. K., Bernath, P. F., Walker, K. A., and Boone, C. D.: Chemical isolation in the Asian monsoon anticyclone observed in Atmospheric Chemistry Experiment (ACE-FTS) data, Atmos. Chem. Phys., 8, 757–764, https://doi.org/10.5194/acp-8-757-2008, 2008. a, b
Pereira, S., Preißler, J., Rascado, J. L., Silva, A., and Wagner, F.: Forest Fire Smoke Layers Observed in the Free Troposphere over Portugal with a Multiwavelength Raman Lidar: Optical and Microphysical Properties, The Sci. World J., 2014, 421838, https://doi.org/10.1155/2014/421838, 2014. a
Peterson, D. A., Campbell, J. R., Hyer, E. J., Fromm, M. D., Kablick, G. P., Cossuth, J. H., and DeLand, M. T.: Wildfire-driven thunderstorms cause a volcano-like stratospheric injection of smoke, NPJ Clim. Atmos. Sci., 1, 2397–3722, https://doi.org/10.1038/s41612-018-0039-3, 2018. a
Pierluissi, J. and Peng, G.: New molecular transmission band models for LOWTRAN, Opt. Eng., 24, 541–547, https://doi.org/10.1117/12.7973523, 1985. a
Pisso, I. and Legras, B.: Turbulent vertical diffusivity in the sub-tropical stratosphere, Atmos. Chem. Phys., 8, 697–707, https://doi.org/10.5194/acp-8-697-2008, 2008. a
Ploeger, F., Gottschling, C., Griessbach, S., Grooß, J.-U., Guenther, G., Konopka, P., Müller, R., Riese, M., Stroh, F., Tao, M., Ungermann, J., Vogel, B., and von Hobe, M.: A potential vorticity-based determination of the transport barrier in the Asian summer monsoon anticyclone, Atmos. Chem. Phys., 15, 13145–13159, https://doi.org/10.5194/acp-15-13145-2015, 2015. a, b, c, d, e
Ploeger, F., Konopka, P., Walker, K., and Riese, M.: Quantifying pollution transport from the Asian monsoon anticyclone into the lower stratosphere, Atmos. Chem. Phys., 17, 7055–7066, https://doi.org/10.5194/acp-17-7055-2017, 2017. a, b
Pommrich, R., Müller, R., Grooß, J.-U., Konopka, P., Ploeger, F., Vogel, B., Tao, M., Hoppe, C. M., Günther, G., Spelten, N., Hoffmann, L., Pumphrey, H.-C., Viciani, S., D'Amato, F., Volk, C. M., Hoor, P., Schlager, H., and Riese, M.: Tropical troposphere to stratosphere transport of carbon monoxide and long-lived trace species in the Chemical Lagrangian Model of the Stratosphere (CLaMS), Geosci. Model Dev., 7, 2895–2916, https://doi.org/10.5194/gmd-7-2895-2014, 2014. a, b, c
Pumphrey, H. C., Santee, M. L., Livesey, N. J., Schwartz, M. J., and Read, W. G.: Microwave Limb Sounder observations of biomass-burning products from the Australian bush fires of February 2009, Atmos. Chem. Phys., 11, 6285–6296, https://doi.org/10.5194/acp-11-6285-2011, 2011. a
Randel, W. J., Park, M., Emmons, L., Kinnison, D., Bernath, P., Walker, K. A., Boone, C., and Pumphrey, H.: Asian Monsoon Transport of Pollution to the Stratosphere, Science, 328, 611–613, https://doi.org/10.1126/science.1182274, 2010. a
Ricchiazzi, P., Yang, S., Gautier, C., and Sowle, D.: SBDART: A Research and Teaching Software Tool for Plane-Parallel Radiative Transfer in the Earth's Atmosphere, B. Am. Meteorol. Soc., 79, 2101–2114, https://doi.org/10.1175/1520-0477(1998)079<2101:SARATS>2.0.CO;2, 1998. a
SAGE III: SAGE Science Team: SAGE III/ISS Level 2 Solar Event Species Profiles Native Binary File – Version 5.1, https://doi.org/10.5067/ISS/SAGEIII/SOLAR_BINARY_L2-V5.1 (last access: 15 November 2018), 2019. a, b
Santee, M. L., Manney, G. L., Livesey, N. J., Schwartz, M. J., Neu, J. L., and Read, W. G.: A comprehensive overview of the climatological composition of the Asian summer monsoon anticyclone based on 10 years of Aura Microwave Limb Sounder measurements, J. Geophys. Res., 122, 5491–5514, https://doi.org/10.1002/2016JD026408, 2016. a, b, c, d
Sellitto, P. and Briole, P.: On the radiative forcing of volcanic plumes: modelling the impact of Mount Etna in the Mediterranean, Ann. Geophys., 58, https://doi.org/10.4401/ag-6879, 2015. a, b
Sellitto, P., di Sarra, A., Corradini, S., Boichu, M., Herbin, H., Dubuisson, P., Sèze, G., Meloni, D., Monteleone, F., Merucci, L., Rusalem, J., Salerno, G., Briole, P., and Legras, B.: Synergistic use of Lagrangian dispersion and radiative transfer modelling with satellite and surface remote sensing measurements for the investigation of volcanic plumes: the Mount Etna eruption of 25–27 October 2013, Atmos. Chem. Phys., 16, 6841–6861, https://doi.org/10.5194/acp-16-6841-2016, 2016. a
Sellitto, P., Sèze, G., and Legras, B.: Secondary sulphate aerosols and cirrus clouds detection with SEVIRI during Nabro volcano eruption, Int. J. Remote Sens., 38, 5657–5672, https://doi.org/10.1080/01431161.2017.1348635, 2017. a
Siddaway, J. M. and Petelina, S. V.: Transport and evolution of the 2009 Australian Black Saturday bushfire smoke in the lower stratosphere observed by OSIRIS on Odin, J. Geophys. Res.-Atmos., 116, D06203, https://doi.org/10.1029/2010JD015162, 2011. a
Tissier, A.-S. and Legras, B.: Convective sources of trajectories traversing the tropical tropopause layer, Atmos. Chem. Phys., 16, 3383–3398, https://doi.org/10.5194/acp-16-3383-2016, 2016. a
Vernier, J.-P., Thomason, L. W., and Kar, J.: CALIPSO detection of an Asian tropopause aerosol layer, Geophys Res Lett, 38, L07804, https://doi.org/10.1029/2010GL046614, 2011. a, b, c, d
Vernier, J.-P., Thomason, L. W., Fairlie, T. D., Minnis, P., Palikonda, R., and Bedka, K. M.: Comment on “Large Volcanic Aerosol Load in the Stratosphere Linked to Asian Monsoon Transport”, Science, 339, 647–647, https://doi.org/10.1126/science.1227817, 2013. a
Vernier, J.-P., Fairlie, T. D., Natarajan, M., Wienhold, F. G., Bian, J., Martinsson, B. G., Crumeyrolle, S., Thomason, L. W., and Bedka, K. M.: Increase in upper tropospheric and lower stratospheric aerosol levels and its potential connection with Asian pollution, J. Geophys. Res., 120, 1608–1619, https://doi.org/10.1002/2014JD022372, 2015. a, b, c, d, e, f, g, h
Vogel, B., Günther, G., Müller, R., Grooß, J.-U., and Riese, M.: Impact of different Asian source regions on the composition of the Asian monsoon anticyclone and of the extratropical lowermost stratosphere, Atmos. Chem. Phys., 15, 13 699–13 716, https://doi.org/10.5194/acp-15-13699-2015, 2015. a, b
Wong, J. and Li, Z.: Retrieval of Optical Depth for Heavy Smoke Aerosol Plumes: Uncertainties and Sensitivities to the Optical Properties, J. Atmos. Sci., 59, 250–261, https://doi.org/10.1175/1520-0469(2002)059<0250:ROODFH>2.0.CO;2, 2002. a
Wu, X., Griessbach, S., and Hoffmann, L.: Equatorward dispersion of a high-latitude volcanic plume and its relation to the Asian summer monsoon: a case study of the Sarychev eruption in 2009, Atmos. Chem. Phys., 17, 13439–13455, https://doi.org/10.5194/acp-17-13439-2017, 2017. a, b
Yu, P., Toon, O. B., Neely, R. R., Martinsson, B. G., and Brenninkmeijer, C. A. M.: Composition and physical properties of the Asian Tropopause Aerosol Layer and the North American Tropospheric Aerosol Layer, Geophys. Res. Lett., 42, 2540–2546, https://doi.org/10.1002/2015GL063181, 2015. a, b
Yu, P., Rosenlof, K. H., Liu, S., Telg, H., Thornberry, T. D., Rollins, A. W., Portmann, R. W., Bai, Z., Ray, E. A., Duan, Y., Pan, L. L., Toon, O. B., Bian, J., and Gao, R.-S.: Efficient transport of tropospheric aerosol into the stratosphere via the Asian summer monsoon anticyclone, P. Natl. Acad. Sci. USA, 114, 6972–6977, https://doi.org/10.1073/pnas.1701170114, 2017. a
Yu, P., Toon, O. B., Bardeen, C. G., Zhu, Y., Rosenlof, K. H., Portmann, R. W., Thornberry, T. D., Gao, R.-S., Davis, S. M., Wolf, E. T., de Gouw, J., Peterson, D. A., Fromm, M. D., and Robock, A.: Black carbon lofts wildfire smoke high into the stratosphere to form a persistent plume, Science, 365, 587–590, https://doi.org/10.1126/science.aax1748, 2019. a, b, c, d
- Abstract
- Introduction
- Methods
- Tracing of the fire plume in the Asian monsoon region
- Regional climate impact
- Conclusions
- Data availability
- Appendix A: Breakdown of the AMA circulation criterion
- Appendix B: Additional information for Figs. 1 and 5
- Appendix C: Additional information for Fig. 1D
- Appendix D: Additional information for Fig. 3
- Author contributions
- Competing interests
- Acknowledgements
- Financial support
- Review statement
- References