the Creative Commons Attribution 4.0 License.
the Creative Commons Attribution 4.0 License.
Contributions of Nordic anthropogenic emissions on air pollution and premature mortality over the Nordic region and the Arctic
Jesper H. Christensen
Ole-Kenneth Nielsen
Maria Sand
Risto Makkonen
Camilla Geels
Camilla Anderson
Jaakko Kukkonen
Susana Lopez-Aparicio
Jørgen Brandt
This modeling study presents the sectoral contributions of anthropogenic emissions in the four Nordic countries (Denmark, Finland, Norway and Sweden) on air pollution levels and the associated health impacts and costs over the Nordic and the Arctic regions for the year 2015. The Danish Eulerian Hemispheric Model (DEHM) has been used on a 50 km resolution over Europe in tagged mode in order to calculate the response of a 30 % reduction of each emission sector in each Nordic country individually. The emission sectors considered in the study were energy production, non-industrial/commercial heating, industry, traffic, off-road mobile sources and waste management/agriculture. In total, 28 simulations were carried out. Following the air pollution modeling, the Economic Valuation of Air Pollution (EVA) model has been used to calculate the associated premature mortality and their costs. Results showed that more than 80 % of the PM2.5 concentration was attributed to transport from outside these four countries, implying an effort outside the Nordic region in order to decrease the pollutant levels over the area. The leading emission sector in each country was found to be non-industrial combustion (contributing by more than 60 % to the total PM2.5 mass coming from the country itself), except for Sweden, where industry contributed to PM2.5 with a comparable amount to non-industrial combustion. In addition to non-industrial combustion, the next most important source categories were industry, agriculture and traffic. The main chemical constituent of PM2.5 concentrations that comes from the country itself is calculated to be organic carbon in all countries, which suggested that non-industrial wood burning was the dominant national source of pollution in the Nordic countries. We have estimated the total number of premature mortality cases due to air pollution to be around 4000 in Denmark and Sweden and around 2000 in Finland and Norway. These premature mortality cases led to a total cost of EUR 7 billion in the selected Nordic countries. The assessment of the related premature mortality and associated cost estimates suggested that non-industrial combustion, together with industry and traffic, will be the main sectors to be targeted in emission mitigation strategies in the future.
- Article
(3246 KB) - Full-text XML
-
Supplement
(401 KB) - BibTeX
- EndNote
Air pollution is the world's single largest environmental health risk (WHO, 2014), estimated to be responsible for 3.7 million premature deaths in 2012 from urban and rural sources worldwide. In Europe, recent results (Andersson et al., 2009; Brandt et al., 2013a, b; Geels et al., 2015; Im et al., 2018a; Liang et al., 2018; Solazzo et al., 2018) show that outdoor air pollution causes ∼500 000 premature deaths in Europe. Brandt et al. (2013a) calculated that due to exposure to ambient air pollution, there were around 3500 premature deaths in 2011 in Denmark alone. Lehtomäki et al. (2018) have recently evaluated that ambient air pollution caused approximately 2000 premature deaths in Finland in 2015. Other studies have made assessments for some of the Nordic countries (Denmark, Sweden and Finland), with estimates ranging from 6500 to 9500 for the year 2000 (Geels et al., 2014; Watkiss et al., 2005; Karvosenoja et al., 2011, respectively). Kukkonen et al. (2018) and Forsberg et al. (2005) have concluded that long-range-transported fine particulate matter dominates the health effects in the Nordic countries, with the largest contribution to long-term effects in Sweden originating from southwestern Europe, while the largest contribution to short-term exposure originates from southeastern Europe (Jönsson et al., 2013).
Air pollution is a transboundary problem covering global, regional, national and local sources, leading to large spatial variability and therefore to large differences in the geographical distribution of human exposure to air pollution (Im et al., 2018a, b). In the Nordic countries, there are large spatial differences in air pollution levels because of long-range-transported and polluted air masses, especially from the south and east, as well as due to the degree of urbanization. There are also local differences depending on wind direction and distance from local emission sources such as road transport, power plants and industry (Brandt et al., 2013a). Furthermore, the widespread use of domestic wood stoves in the Nordic countries represents a special challenge for exposure to air pollution (Kukkonen et al., 2019), where, e.g., more than a third of the health impacts from Danish emissions are due to smoke from wood stoves. International ship traffic is also a significant source of air pollution and health impacts in highly trafficked areas of the Baltic and North seas (Brandt et al., 2013b; Jalkanen et al., 2016; Johansson et al., 2017). Based on simulations for the period of 1997–2003, Andersson et al. (2009) calculated that Sweden contributed to 1.4 % of the European primary PM2.5 (PPM2.5) mass concentrations, while Denmark, Finland and Norway were responsible for 4 % of European PPM2.5. Contributions to secondary inorganic aerosol (SIA) levels were much smaller (0.5 % from Sweden and 1.4 % from Denmark, Finland and Norway). They also calculated a death rate increase of 2 % and 3 % due to exposure to PPM2.5 and SIA, respectively, in Europe due to emissions from Denmark, Finland, Norway and Sweden.
The external (or indirect) costs to society related to health impacts from air pollution are substantial. In all of Europe, the total external costs have been estimated to be approximately EUR 800 billion per year and in Denmark alone the external costs are nearly EUR 4 billion per year (Brandt et al., 2013a). In a more recent study, Im et al. (2018a), using a multi-model ensemble of 14 chemistry transport models (CTMs), estimated that ambient air pollution in Europe in 2010 was responsible for 414 000 ± 100 000 premature deaths, leading to a cost of EUR 300 billion. The study also showed that a 20 % decrease of anthropogenic emissions in Europe source could avoid 47 000 premature deaths in Europe, while a similar reduction in the US would avoid around 1000 premature deaths in Europe due to long-range transport.
The Nordic countries are generally characterized among the EU countries with low air pollution levels (EEA, 2018). PM2.5 levels are below the EU legislated limit value of 25 µg m−3 as well as the WHO limit value of 10 µg m−3 (EEA, 2018). However, there are still large impacts of air pollution on human health and climate in the region itself (Arctic Council, 2011; Brandt et al., 2013a; Forsberg et al., 2015), as well as over the Arctic (Sand et al., 2015). The Task Force on Short Lived Climate Forcers of the Arctic Council reported that measures aimed at decreasing Nordic emissions will have positive health effects for communities exposed to air pollution. In a recent study, Sand et al. (2015) showed that although the largest Arctic warming source is from Asian emissions, the Arctic is most sensitive, per unit mass emitted, to short-lived climate forcer (SLCF) emissions from a small number of activities within the Arctic nations themselves.
The aim of the study is to quantify the contributions of the main emission sectors in each of the Nordic countries to air pollutant levels and their impacts on premature mortality and associated costs in the Nordic region and the Arctic. This will help us identify the emission sectors in these Nordic countries that should be targeted for mitigation to decease the air pollution and exposure levels in the Nordic countries that originated within the region. In addition, we also aim to give a first estimate of the impact of transported air pollution on the Arctic population. In order to achieve this, we have coupled the Danish Eulerian Hemispheric Model (DEHM) to the Economic Valuation of Air Pollution (EVA) model and conducted a number of perturbation simulations targeting different emission sectors in the four Nordic countries (Denmark, Finland, Norway and Sweden) for the year 2015. The year 2015 is selected to be in agreement with the ongoing Coupled Model Intercomparison Project phase 6 (CMIP6; Eyring et al., 2016), where the current year is 2015. As the present study will also look at the impacts in the future using baseline scenarios from the CMIP6, we have selected the present year to be 2015 for consistency. The models and perturbation simulations are described in Sect. 2, the model evaluation against surface measurements in the Nordic countries is presented in Sect. 3.1, the contributions of sectoral emissions on the air pollution levels in the Nordic region and the Arctic are presented in Sect. 3.2., and the health impacts and associated costs are presented in Sect. 3.3. Conclusions are given in Sect. 4.
2.1 Danish Eulerian Hemispheric Model (DEHM)
The DEHM model was originally developed mainly to study the transport of SO2 and SO4 to the Arctic (Christensen, 1997) but has been extended to different applications during the last decades. It has been documented extensively in Brandt et al. (2012) and evaluated in several intercomparison studies (e.g., Solazzo et al., 2012a, b, 2017; Im et al., 2018a, b) and recently joined the suite of operational models in the Copernicus Atmospheric Monitoring System (CAMS) to provide regional forecasts of air pollution over Europe. The DEHM model uses a 150 km × 150 km spatial resolution over the Northern Hemisphere, then nests to 50 km × 50 km resolution over Europe, extending up to 100 hPa through 29 vertical levels, with the first layer height of approximately 20 m. The meteorological fields were simulated by the Weather Research and Forecasting (WRF; Skamarock et al., 2008) model setup with identical domains and resolution. The time resolution of the DEHM model is 1 h. The gas-phase chemistry module includes 58 chemical species, nine primary particles, including natural particles such as sea salt, and 122 chemical reactions (Brandt et al., 2012). The model also describes atmospheric transport and chemistry of lead, mercury and CO2, as well as persistent organic pollutants (POPs). Secondary organic aerosols (SOAs) are calculated using the volatility basis set (VBS; Bergstrom et al., 2012). In addition to the anthropogenic PM and SOA due to biogenic emissions, DEHM model also calculates sea-salt emissions and their transport and interactions with other pollutants. The current version of the DEHM model does not include wind-blown or resuspended dust emissions. DEHM model does not output a PM2.5 or PM10 diagnostic; however, these are calculated offline, using all anthropogenic and natural components of PM, in order to be used in the health impact assessment described in Sect. 2.2.
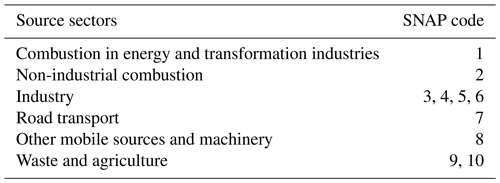
In the current study, the DEHM model used anthropogenic emissions from the Emissions Database for Global Atmospheric Research – Hemispheric Transport of Air Pollution (EDGAR-HTAP) database and biogenic emissions are calculated online based on the Model of Emissions of Gases and Aerosols from Nature (MEGAN). The total emissions per country for the different pollutants are presented in Table 1. The sectoral distributions of emissions in each country are presented in Fig. 1. As seen in the Table 2, most SNAP (Selected Nomenclature for Air Pollutants; CEIP, 2019) sectors are considered individually, while some are merged in order to reduce the computational costs. All sectors in relation to industrial activities (combustion, processes, solvent use and extraction and transport of fossil fuels) are merged into an “industry” source sector, while waste management and agriculture sectors were lumped into one source sector.
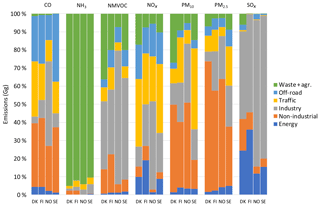
Figure 1Relative distributions (%) of sectoral emissions of major air pollutants in the Nordic countries.
Table 2Exposure-response functions (ERFs) used in EVA to calculate premature mortality.

a Pope et al. (2002). b Anderson et al. (1996). c Touloumi et al. (1996). d Pope et al. (1995). e Woodruff et al. (1997).
As seen in Fig. 1, non-industrial combustion (orange bars), where non-industrial combustion dominates, stands out as a major source contributing to CO and PM emissions, while industry (grey bars) (Table 2) is the largest source of non-methane volatile organic compounds (NMVOCs), NOx and SOx. Traffic (yellow bars) also contributes significantly to CO and NOx. The largest source of NH3 is from agriculture in particular, as well as waste management (green bars) (Table 2).
2.1.1 Tagging method
The tagging method keeps track of contributions to the concentration field from a particular emission source or sector, as explained in detail in Brandt et al. (2013a). Tagging involves modeling the background concentrations and the δ concentrations (the contributions from a specific emission source or sector to the overall air pollution levels) in parallel (as two different runs under the same run), where special treatment is required for the non-linear process of atmospheric chemistry, since the δ concentrations are strongly influenced by the background concentrations in such processes. Although this treatment involves taking the difference of two concentration fields, it does not magnify the spurious oscillations (the Gibbs phenomenon), which are primarily generated in the advection step. The non-linear effects can be accounted for in the δ concentrations without losing track of the contributions arising from the specific emission source or sector.
2.1.2 Model evaluation
Surface concentrations modeled by the DEHM model were evaluated against data at selected urban background and regional or global monitoring stations in each Nordic country. The statistical comparisons included using correlation coefficient (r), mean bias (MB) and normalized mean bias (NMB) and root mean square error (RMSE). The station information is provided in Table S1 in the Supplement, along with the descriptions of the monitoring network in each country.
2.2 Economic Valuation of Air Pollution (EVA) system
The EVA system (Brandt et al., 2013a, b; Geels et al., 2015; Im et al., 2018a) is based on the impact-pathway chain method (Friedrich and Bickel, 2001). The EVA system can estimate acute (short-term) and chronic (long-term) mortality, related to acute exposure to O3 and SO2, and chronic exposure to PM2.5, and the associated external costs. The EVA system requires gridded concentrations along with gridded population data, exposure-response functions (ERFs) for health impacts, which are recommended by the WHO (2013), and economic valuation functions of the impacts from air pollution. In addition, EVA uses population densities over fixed age intervals, corresponding to babies (under 1 year), children (under 15), adults (above 15 and above 30) and the elderly (above 65). The impacts of short-term exposure to O3 and SO2, and the long-term exposure to PM2.5 are well established. EVA uses the annual mean concentrations of SO2, and PM2.5, while for O3, it uses the SOMO35 metric that is defined as the annual sum of the daily maximum of 8 h running average over 35 ppb, following WHO (2013) and EEA (2017).
The health impacts are calculated using an ERF of the following form:
where R is the response of the mortality rate or the years of life lost (in cases or days), δc denotes the pollutant concentration, P denotes the affected share of the population, and α is an empirically determined constant for the particular health outcome. EVA uses ERFs that are modeled as a linear function, which is a reasonable approximation for the region of interest in the present study, as shown in several studies (e.g., Pope, 2000; the joint World Health Organization/UNECE Task Force on Health; EU, 2004; Watkiss et al., 2005). However, some studies showed non-linear relationships, being steeper at lower than at higher concentrations (e.g., Samoli et al., 2005). Therefore, linear relationships may lead to overestimated health impacts over highly polluted areas. ERFs for all-cause chronic mortality due to PM2.5 are based on Pope et al., 2002; Krewski et al., 2009), which are also recommended by the WHO (2013). These are the most extensive and up-to-date data, although there are ongoing studies in Europe, and in particular in the Nordic region to develop regional-specific ERFs (e.g., the NordicWelfAir project: https://projects.au.dk/nordicwelfair/, last access: 17 October 2019). The current version of the EVA system used in the present study does not include impacts due to exposure to NO2. However, a new version is currently under development under the NordicWelfAir project.
EVA calculates the number of lost life years for a Danish population cohort with normal age distribution, when applying the ERF of Pope et al. (2002) for all-cause mortality: relative risk (RR) of 1.062 (1.040–1.083) on a 95 % confidence interval. The latency period sums to 1138 years of life lost (YOLL) per 100 000 individuals for an annual PM2.5 increase of 10 µg m−3 (Andersen et al., 2008). The YOLL is then converted to the number of cases by dividing by 10.6, following Watkiss et al. (2005). The counterfactual PM2.5 concentration is assumed to be 0 µg m−3 following the EEA methodology, meaning that the impacts have been estimated for the simulated total (anthropogenic and natural) PM2.5 mass. Applying a low counterfactual concentration can underestimate health impacts at low concentrations if the relationship is linear or close to linear (Anenberg et al., 2015). However, it is important to note that uncertainty in the health impact results may increase at low concentrations due to sparse epidemiological data. Assuming linearity at very low concentrations may distort the true health impacts of air pollution in relatively clean atmospheres (Anenberg et al., 2016).
Regarding short-term exposure to O3, EVA uses the ERF recommended by the CAFE program (Hurley et al., 2005) and WHO (2013) which uses the daily maximum of 8 h mean O3 concentrations. There are also studies showing that SO2 is associated with acute mortality, and EVA adopts the ERF identified in the APHENA study – Air Pollution and Health: A European Approach (Katsouyanni et al., 1997). Some recent studies also report the chronic effects from O3 (e.g., Turner, 2016); however, the current version of the EVA model does not include these effects. The ERFs used in EVA to calculate mortality are presented in Table 2.
For the valuation of the health impacts, a value of EUR 1.5 million was applied for preventing an acute death, following expert panel advice (EC, 2001), while for the valuation of a life year, a value of EUR 57 500 per YOLL were applied (Alberini et al., 2006). More details can be found in Im et al. (2018a).
2.3 Scenarios (response and contribution)
We have applied a 30 % reduction on land-based anthropogenic emissions from each of the continental Nordic countries, which include Denmark, Finland, Norway and Sweden. Each simulation perturbed a SNAP sector from an individual Nordic country, which are listed in Table 3. Industry is perturbed as the combination of SNAP3, 4, 5 and 6, while agriculture (SNAP9) and waste management (SNAP10) are perturbed as one combined sector.
The DEHM model has been run on “tagged” mode, explained in Sect. 2.1, so each simulation included a “perturbed” and “non-perturbed” concentration, which we used to calculate the response to the 30 % reduction in the particular country and sector. These responses are then converted to population-weighted contributions using the gridded population densities and by assuming a linear extrapolation to 100 %.
3.1 Evaluation
Surface ozone and PM2.5 concentrations calculated by the DEHM model have been evaluated using surface observations from the urban background and regional background monitoring stations in the Nordic countries. The comparisons of the mean of all observed concentrations in each country and the corresponding modeled concentrations are presented in Table 4, while Figs. 2 and 3 present Taylor diagrams for each station in each Nordic country, giving insight to the spatial distribution of model performance. As seen in Table 3, temporal variations of O3 levels are well reproduced by the DEHM model over all countries (r>0.6); however, there is an overestimation of ∼10 % over Denmark, Finland and Sweden, and ∼30 % over Norway. The daily variations of PM2.5 levels, averaged over all stations in each Nordic country, are well reproduced for Denmark (), moderately over Norway and Sweden (r>0.4) and poorly (r∼0) over Finland (Table 3). PM2.5 concentrations are underestimated by up to 35 % over Denmark, Finland and Norway, and overestimated by 8 % over Sweden.
Table 4Model evaluation for the daily mean concentrations of O3 and PM2.5 for all the selected stations in the Nordic countries.

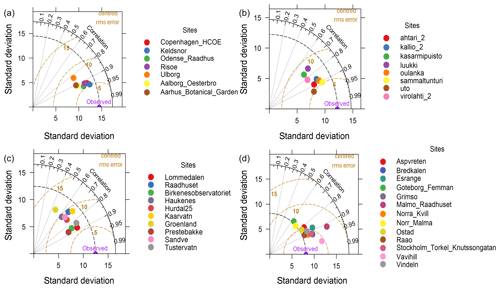
Figure 2Taylor diagrams for daily mean O3 for all stations in (a) Denmark, (b) Finland, (c) Norway and (d) Sweden.
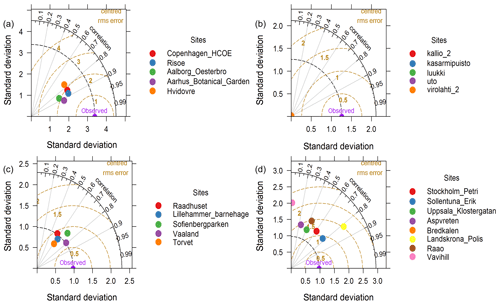
Figure 3Taylor diagrams for daily mean PM2.5 for all stations in (a) Denmark, (b) Finland, (c) Norway and (d) Sweden.
In all countries, lower NMB values are calculated for O3 over the regional background stations compared to urban background stations, where values are overestimated. Regarding PM2.5, no such conclusions can be drawn due to very limited number of regional background stations in Denmark and Norway. In Finland, lower NMB values for PM2.5 are calculated for the regional background stations, while in Sweden, much lower NMB values are calculated for the urban stations. These differences reflect the underestimations in emissions as well as the coarse model resolution, as well as missing sources, in particular for PM, such as wind-blown and resuspended dust in the DEHM model. It should also be mentioned that the modeled PM does not contain residual water. Table S2 shows the same comparisons for NO2 and SO2. The underestimations in the modeled PM2.5 levels imply an underestimated exposure to PM2.5 levels, given the dominance of PM2.5 in premature mortality. Similarly, the overestimations in O3 levels can be attributed to the underestimated NO titration (Table S2).
3.2 Sectoral contributions to surface concentrations
3.2.1 Nordic countries
In general, the long-term transport of air pollutants from one country to another is dependent on the global and regional atmospheric circulation and on the relative geographic positions of the countries. Nordic countries are influenced by substantial long-range-transported contributions of air pollution especially from the central, western and central-eastern parts of Europe. In the region containing the continental Nordic countries, the prevailing atmospheric flow directions near the ground surface are from the west, southwest and south. Based on the prevailing atmospheric circulation patterns, it is therefore to be expected that, e.g., the emissions in Denmark will have a relatively larger influence on the pollution levels in the other Nordic countries than those in Finland.
Our simulations show that PM2.5 mass concentrations over the Nordic countries are dominated by nitrate aerosols (30 %–45 %) and sea salt (30 %–50 %). SO4 aerosols contribute 10 % to 15 % of PM2.5 concentrations, while OC contributes 8 %–11 % and BC 2 %–4 % of the PM2.5 mass. As SO4 and NO3 aerosols include NH4 in DEHM, results suggest that NH4 aerosols contribute by more than half of the PM2.5 mass over the Nordic countries. The annual mean surface PM2.5 concentrations for Denmark, Finland, Norway and Sweden are calculated to be 9.1, 4.4, 4.8 and 5.8 µg m−3, respectively. These values are in agreement with those reported by the EEA (2017) with, however, an underestimation of 12 % (Denmark) up to 30 % (Norway).
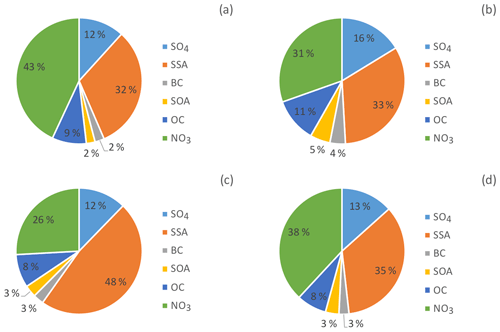
Figure 4Simulated surface PM2.5 chemical composition over (a) Denmark, (b) Finland, (c) Norway and (d) Sweden.
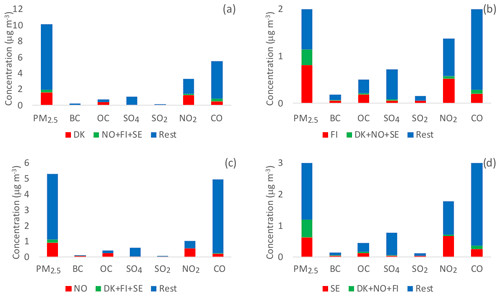
Figure 5Absolute contributions of national, Scandinavian and other sources on the surface levels of major air pollutants over (a) Denmark, (b) Finland, (c) Norway and (d) Sweden. Note that CO concentrations are divided by 20 to scale with other pollutants.
Figure 5 compares the contribution of the total contributions anthropogenic sectors of each Nordic country on the surface concentrations over the country itself, with contributions from the anthropogenic sources in the rest of the Nordic countries and the rest of the world. Therefore, PM2.5 in the figure does not contain the natural components that cannot be regulated, such as sea salt. Figure 5 clearly shows that over 80 % or more of PM2.5 surface levels are transported outside the Nordic region, pointing out that the Nordic countries are responsible for less than 20 % of the particulate pollution in the region. This suggests significant decreases in the PM2.5 levels in the region can only be possible through reductions in the emissions upwind. Similar high contributions for other species including CO also show that Nordic countries are exposed to air masses coming from the rest of the world, while local pollution is low. The figure also shows that PM2.5 levels are generally low in the Nordic countries, with annual means lower than 10 µg m−3 (highest in Denmark and lowest in Finland). Similar to PM2.5, annual mean surface O3 levels are also low (∼30 µg m−3). Similar analyses done for O3 (not shown) show that O3 levels are controlled largely in a regional manner, where the local sources in the Nordic countries lead to a small sink of O3 due to NO titration. This is also in agreement with Im et al. (2018b) reporting high response to extra-regional emission reduction (RERER) values (> 0.8), suggesting that O3 is a regional background pollutant in Europe.
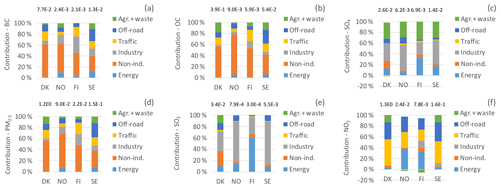
Figure 6Population-weighted sectoral contributions of Danish emissions on surface (a) BC, (b) OC, (c) SO4, (d) PM2.5, (e) SO2 and (f) NO2 over the Nordic countries. The labels above the bars show the absolute total contribution in µg m−3 from all the sectors in Denmark.
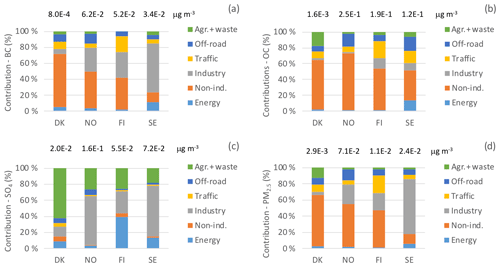
Danish emissions contribute to only 1.14 µg m−3 (13 %) of the surface PM2.5 concentrations over Denmark (9.1 µg m−3), while contributions to other Nordic countries are about 3 % (Fig. 6). Non-industrial combustion (SNAP2), which is dominated by non-industrial combustion, is responsible for 0.36 µg m−3 (60 %) of the Danish contribution to surface PM2.5 concentrations over Denmark. Non-industrial combustion contributes to 0.22 µg m−3 (56 %) of the Danish contribution to surface organic carbon (OC) concentrations over the country, suggesting the importance of non-industrial wood burning for heating. Industry contributes to 0.01 µg m−3 (35 %) of the Danish contribution to the surface SO2 concentrations over Denmark, while on-road and off-road transport contribute equally to the Danish share of the in-surface NO2 concentrations by 1.02 µg m−3 (∼79 % together). Agriculture and waste handling are important sources for surface SO4 levels over Denmark as well as over the other Nordic countries, via the formation of ammonium sulfate ((NH4)2SO4) due to the large ammonia (NH3) emissions from these sectors. A total of 0.26 µg m−3 of PM2.5 over Denmark comes the other Nordic countries, with 0.03 µg m−3 coming from non-industrial combustion only.
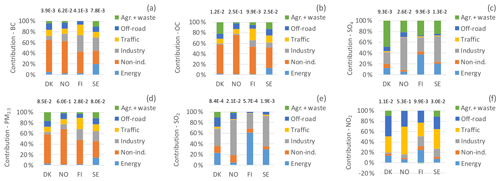
Figure 7Population-weighted sectoral contributions of Norwegian emissions on surface (a) BC, (b) OC, (c) SO4, (d) PM2.5, (e) SO2 and (f) NO2 over the Nordic countries. The labels above the bars show the absolute total contribution in µg m−3 from all the sectors in Norway.
Contributions of the Norwegian emissions over the Nordic countries are presented in Fig. 7. Similar to the Danish emissions, Norwegian emissions contribute to 0.6 µg m−3 (13 %) of the surface PM2.5 concentrations over Norway, while contributions to other Nordic countries are below 1 %, except for NO2, where on-road transport emissions from Norway contribute to almost 0.02 µg m−3 (42 %) of the surface NO2 levels over Finland. Non-industrial combustion is the main source of pollutant levels, in particular for OC, where Norwegian emissions are responsible for 0.18 µg m−3 (74 %) of local contribution to the surface OC levels over Norway. Industry is a major source of surface SO2 levels over Norway, contributing to 0.02 µg m−3 (66 %) of the local contribution. A total of 0.2 µg m−3 of PM2.5 levels over Norway comes from the other Nordic countries, 0.02 µg m−3 being from non-residential combustion.
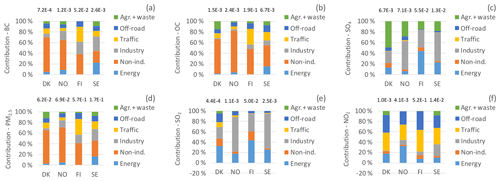
Figure 8Population-weighted sectoral contributions of Finnish emissions on surface (a) BC, (b) OC, (c) SO4, (d) PM2.5, (e) SO2 and (f) NO2 over the Nordic countries. The labels above the bars show the absolute total contribution in µg m−3 from all the sectors in Finland.
Figure 8 shows the contributions of Finnish emissions on the pollutant levels over the Nordic countries. Similar to Denmark and Norway, non-industrial combustion is the major source of pollution over Finland, although contributions are lower compared to Denmark and Norway (0.19 µg m−3 (41 %) of PM2.5 and 0.11 µg m−3 (48 %) of OC). Another noticeable difference is that energy production is also an important contributor to surface SO2 (0.01 µg m−3: 44 %) and SO4 (0.03 µg m−3: 44 %) levels over Finland. A total of 0.3 µg m−3 of PM2.5 levels over Finland come from the other Nordic countries, 0.2 µg m−3 being from non-residential combustion. Finnish emissions, in particular industrial combustion, contribute the most to the air pollution over Sweden.
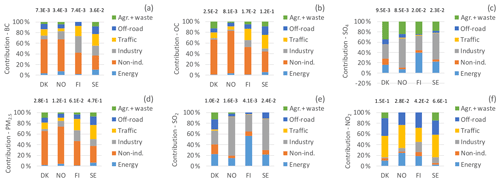
Figure 9Population-weighted sectoral contributions of Swedish emissions on surface (a) BC, (b) SO4, (c) OC, (d) PM2.5, (e) SO2 and (f) NO2 over the Nordic countries. The labels above the bars show the absolute total contribution in µg m−3 from all the sectors in Sweden.
Contributions from the Swedish emission sources to surface pollutant levels over the Nordic countries are presented in Fig. 9. Unlike other Nordic countries, Swedish emissions have larger contributions to pollution levels over the other Nordic countries, in particular over Norway. The figure also shows that Sweden does not experience as much dominant contribution from non-industrial combustion (32 %) like the other Nordic countries show. Swedish emissions from SNAP2 are much lower than for the rest of the Nordic countries (official emissions reported to the Convention on Long-Range Transboundary Air Pollution – CLRTAP), most probably due to lower emission factors. Non-industrial combustion and industry contribute similarly to the surface PM2.5 levels. Industry also has an important contribution to surface SO4 levels (0.01 µg m−3: 51 %), as well to SO2 (0.01 µg m−3: 58 %) and BC (0.006 µg m−3: 18 %). 0.5 µg m−3 of surface PM2.5 levels over Sweden comes from the other Nordic countries, of which 0.1 µg m−3 comes from non-residential combustion.
3.2.2 Arctic
The contributions of the emission sources in the different Nordic countries to the surface aerosol concentrations over the Arctic region (defined as the area north of 67∘ N latitude) are presented in Fig. 10. Results show that overall, Norway has the largest contribution to surface aerosol levels over the Arctic, while Denmark has the lowest contribution, although contributions are only a few percent. Norwegian emissions, in particular non-industrial combustion, contribute to about 2 % of the surface BC levels over the Arctic. Non-industrial combustion in the Nordic countries is also the largest contributor to Arctic BC levels, except for Sweden, where industry plays a more important role. Non-industrial combustion is also the dominant contributor to OC levels over the Arctic. Sulfate levels are largely influenced by the contributions from the agriculture and waste treatment facilities over the Nordic countries. Contributions to Arctic PM2.5 levels are similar to the contributions to the BC levels.
3.2.3 Spatial distributions of contributions
The geographical distributions of total anthropogenic emissions from each Nordic country to surface PM2.5 and O3 levels are calculated to investigate the extent of contributions from each Nordic country to its neighbors and to the Arctic. Figure 11 shows the annual-mean absolute contributions (%) of total land-based anthropogenic emissions to surface O3 levels in the Nordic region from each country. The annual-mean contributions are very low (up to 1.5 µg m−3: 5 %). The largest contributions in each country are calculated in the source region in the particular country, implying the impact of O3 titration by local fresh NO emissions. Danish anthropogenic emissions (Fig. 11a) led to a titration of up to 1.5 µg m−3 (around 4 %–5 %), particularly over the capital region. The largest impact of Finnish emissions is around the Helsinki area, responsible for up to 1 µg m−3 (5 %) of surface O3 destruction over the area (Fig. 11b). Finnish emissions also led to an increase of surface O3 levels by up to 0.5 µg m−3 (1 %) over the downwind regions to the southeast and northwest. The impacts of Norwegian emissions on surface O3 levels (Fig. 11c) are largest (up to 1 µg m−3: 2 %) over the Oslo area and the impact extends over the northern part of Oslo with a slightly larger spatial contribution to O3 levels compared to Denmark and Finland. The Swedish emissions have a larger geographical impact on the surface O3 levels (Fig. 11d) over the country itself compared to the other Nordic countries but the magnitude is similar to the impact from the Norwegian emissions.
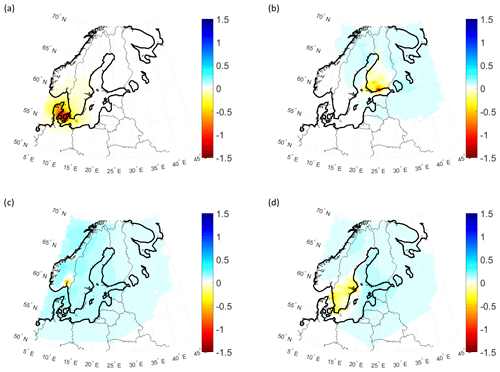
Figure 11Spatial distributions of annual population-weighted mean absolute contributions (µg m−3) of total emissions from (a) Denmark, (b) Finland, (c) Norway and (d) Sweden to surface O3 levels in the Nordic region.
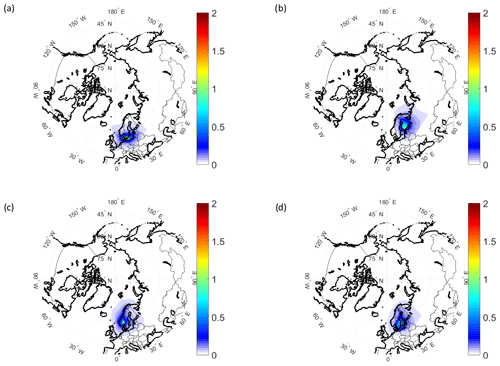
Figure 12Spatial distributions of annual population-weighted mean absolute contributions (µg m−3) of total emissions from (a) Denmark, (b) Finland, (c) Norway and (d) Sweden to surface PM2.5 levels over the Nordic and the Arctic regions (north of 67∘ N).
Figure 12 shows the annual-mean absolute contributions of each Nordic country to the surface PM2.5 levels in the entire model domain. Danish anthropogenic emissions are responsible for up to 20 % of surface PM2.5 levels over Denmark, with the largest contributions over the capital region (greater Copenhagen area) (Fig. 12a). Danish land emissions also impact the surface PM2.5 levels over the southern part of Sweden and Norway, by around 4 % and 2 %, respectively. The Finnish anthropogenic emissions have the largest impact on surface PM2.5 levels over the southern part of the country, around the capital region by up to 30 % (Fig. 12b). Finnish emissions also have a small impact, lower than 3 %, on the central part of Sweden and northern parts of Norway. Norwegian anthropogenic emissions have largest contributions to surface PM2.5 levels around the capital region by up to 30 %, while there is also a significant impact on surface PM2.5 levels over Sweden by around 7 % (Fig. 12c). Finally, Swedish anthropogenic emissions have a large contribution to surface PM2.5 levels over the Stockholm area by around 15 % and also contribute to PM2.5 levels over Finland, in particular over the southwestern parts of Finland, by up to 5 % (Fig. 12d).
Figure 12 also shows the impact of anthropogenic emissions from each Nordic country to the surface PM2.5 over the Arctic. Overall, the impacts are very small, around a few percent, as seen in the figure. The Danish emissions (Fig. 12a) have a more local contribution compared to other Nordic countries and the impact does not reach above roughly 70∘ N. The outflow from Finland, Norway and Sweden can reach to the central Arctic Ocean over to the northern parts of Greenland; however, contributions are around 1 %–2 % (Fig. 12b–d).
3.3 Contribution to premature mortality and costs
The rates of acute and chronic premature mortality in the four selected Nordic countries and the Arctic region (north of 67∘ N), along with the associated costs, are presented in Table 5. The 95 % confidence intervals provided in the brackets are calculated by scaling the calculated health outcomes by the confidence intervals of RR presented in Sect. 2.2 (RR of 1.062 [1.040–1.083]). As seen in the table, chronic mortality due to PM2.5 is the major source of premature mortality, as EVA calculates chronic mortality only due to exposure to PM2.5 (see Table 2). The highest number of cases is calculated for Sweden (∼4200 cases), followed by Denmark (∼3500 cases), Finland (∼1800) and Norway (∼1700). Results also show that SO2 is responsible for almost all acute mortalities in the region, which is consistent with earlier studies (e.g., Brandt et al., 2013a, b). This is due to the decrease of O3 in the region by fresh NO emissions, leading to low mortality due to O3 exposure. These numbers led to an associated cost of more than EUR 2 billion in Sweden and Denmark and ∼ EUR 1 billion in Finland and Norway. The number of premature death cases is comparable with existing literature (e.g., Brandt et al., 2013a for Denmark; Solazzo et al., 2018 for all four Nordic countries; EEA, 2017 for all four Nordic countries). In the Arctic region, the total number of premature mortality cases is calculated to be 94, 93 of which are due to exposure to PM2.5 (chronic), leading to a cost of EUR 58 million.
Table 5Acute and chronic premature death cases in the Nordic countries and the Arctic region (north of 67∘ N) in 2015 and the associated costs. The brackets show the 95 % confidence interval.
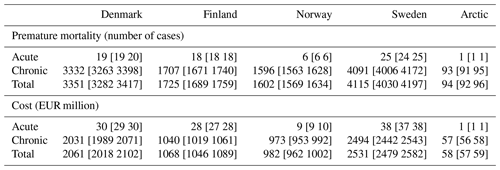
Table 6Source–receptor relationships of the contributions of anthropogenic emissions from the Nordic countries to the premature mortality in the Nordic area. The brackets show the 95 % confidence interval.

Table 7Contribution of costs (EUR million) of air pollution impacts on human health in the Nordic countries. The brackets show the 95 % confidence interval.

The EVA model has been used to calculate the contributions of Nordic emissions to the total premature mortality (acute plus chronic) in the Nordic countries for the year 2015. Table 6 presents a source–receptor matrix of the contributions to premature mortality on the Nordic countries. Danish emissions contribute to ∼400 premature deaths in Denmark, dominated by agriculture (33 %), non-industrial combustion (31 %) and traffic (18 %). In Norway, the dominating sector contributing is non-industrial combustion, responsible for 48 % of the ∼200 premature deaths in Norway. In Finland, the total number of premature deaths in 2015 is calculated to be ∼270, where non-industrial combustion and traffic are responsible for more than half. Finally, in Sweden, traffic and waste management/agriculture are responsible for 50 % of the total premature deaths in Sweden (∼330).
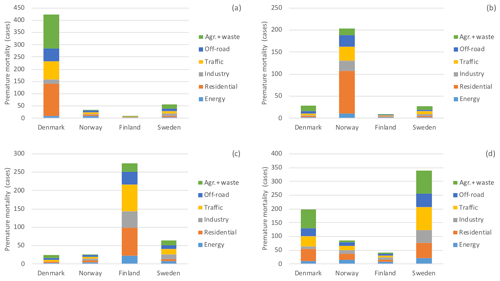
Figure 13Source contributions from the anthropogenic emissions of (a) Denmark, (b) Norway, (c) Finland and (d) Sweden to total premature mortality (acute plus chronic) in the Nordic countries.
Figure 13 shows the contributions of sectoral emissions from each Nordic country to the total premature death cases in 2015 in the different Nordic countries. Overall, Nordic countries contribute to low premature death cases in their Nordic neighbors (≤50). As seen in the figure, agriculture and waste management sectors together can have a significant share in the premature mortality (e.g., Denmark) due to the dominant contribution of NH4 aerosols in the region (Fig. 4). The largest transboundary contribution is calculated for the Danish emissions, dominated by agriculture, non-industrial combustion and traffic, contributing to ∼200 premature death cases in Sweden.
Table 7 shows the cost of air pollution on human health in each of the Nordic countries in the source country and the neighboring Nordic countries. Among the four Nordic countries, Denmark has the largest external costs due to air pollution, followed by Sweden, Finland and Norway, respectively. Following the mortality rates, Denmark, Finland and Norway have the largest cost contribution to Sweden, while Sweden contributes largest to Denmark.
Regarding the costs attributed to each of the source sectors, Fig. S1 summarizes the contributions per country. For Denmark, results suggest that non-industrial combustion and agriculture/waste management are the main sectors to be targeted to reduce the negative impacts of air pollution. In Norway, reduction of non-industrial combustion emissions alone can substantially reduce the costs of air pollution. In Finland, similar to Denmark and Norway, non-industrial combustion should be targeted for developing emission reduction strategies, along with the traffic emissions, which contribute as much as the non-industrial combustion. Finally, in Sweden, traffic and agriculture/waste management sectors should be targeted to reduce the adverse impacts of air pollution and their associated costs. However, as the local contributions to air pollutants are generally low in the region, it should be noted that significant reductions can only be achieved by reducing the emissions upwind, which would require a coordinated effort in Europe.
The sectoral contributions of land-based anthropogenic emission sources in the four Nordic countries (Denmark, Finland, Norway and Sweden) on air pollution levels and premature mortality in these countries and over the Arctic have been estimated using the DEHM/EVA impact assessment system for the year 2015. The chemistry and transport model, DEHM, was run with tagging mode in order to calculate inline the sectoral contributions based on 30 % reductions of each sector separately. Using the modeled surface concentrations of O3, SO2 and PM2.5, the EVA model calculated the acute (O3 and SO2) and chronic (PM2.5) premature mortality due to exposure to these pollutants.
Results show that the Nordic countries are responsible for 5 %–10 % of the regional background surface PM2.5 concentrations in the countries themselves. The non-industrial combustion (SNAP2), which is dominated by the non-industrial wood combustion, is responsible for 50 % to 80 % of the contribution to surface PM2.5 in the Nordic countries. In Denmark, Finland and Norway, non-industrial combustion contributes largely to surface OC (by 60 %–80 %). In Sweden, SNAP2 is responsible for 43 % of the contribution to surface OC, while 43 % comes from industrial activities. Similar to OC, BC is also dominated by non-industrial combustion (by 50 %–65 %), except for Sweden, where 25 % originates from non-industrial combustion and 31 % from industrial activities. The dominant source for surface SO4 and SO2 in all four Nordic countries is calculated to be industrial activities. In Norway and Sweden, around 70 % of SO2 comes from industrial activities, while in Denmark and Finland, industrial activities are responsible for around 30 % of SO2. Off-road traffic is responsible for 21 % of SO2, while energy production is responsible for 50 % of SO2 in Finland. Industrial activities are also responsible for 60 % of SO4 in Norway and Sweden and 30 % in Denmark and Finland. The dominant source for NO2 is attributed to mobile sources, and the share between on-road and off-road traffic varies depending on the country. Almost 35 % of NO2 comes from on-road traffic in all four Nordic countries, while off-road traffic contributes by 25 % to 35 %.
Norway has the largest contribution to aerosol levels over the Arctic, while Denmark has the lowest contribution, although contributions are only a few percent. Non-industrial combustion in the Nordic countries is also the largest contributor to Arctic OC and BC levels, except for Sweden, where industry plays a more important role in relation to the Arctic levels. Agriculture and waste treatment facilities over the Nordic countries are responsible for contributing to the sulfate levels over the Arctic.
Anthropogenic emissions led to a titration of around 4 %–5 %, particularly over the source countries and led to a very small surface O3 increase (> 1 %) in the downwind regions. The largest impacts are calculated to be around the capital regions. Danish emissions also impact the surface PM2.5 levels over the southern part of Sweden and Norway, by around 3 %. Finnish emissions also have a small impact, lower than 3 %, on the central part of Sweden and northern parts of Norway. Norwegian anthropogenic emissions impact PM2.5 levels over Sweden by around 7 %, while Swedish anthropogenic emissions contribute to PM2.5 levels over the southwestern parts of Finland by up to 5 %. It should be noted that these results are calculated for a specific year (2015); therefore, transport from one country to others can significantly vary in different years due to meteorology, in particular wind speed and direction.
The total number of premature mortality cases due to air pollution are calculated to be ∼4000 in Denmark and Sweden and ∼2000 in Finland and Norway, leading to a total cost of EUR 7 billion in the selected Nordic countries. The contributions of emission sectors to premature mortality in each of the Nordic countries vary. Danish agriculture and industrial emissions contribute similarly (by 33 %) to ∼400 premature mortality cases in Denmark, which are due to the Danish emissions. In Norway, non-industrial combustion, dominated by non-industrial wood combustion, is responsible for 48 % of the ∼200 premature deaths in Norway due to the exposure to pollution from the Nordic sources. In Finland, non-industrial combustion and traffic are responsible for more than half of the ∼270 premature deaths in 2015, caused by the sources within the region. Finally, in Sweden, traffic and waste management/agriculture are responsible for 50 % of the total premature death in Sweden (∼330), caused by the emissions in the Nordic region. In Denmark, Finland and Norway, non-industrial combustion is the main sector to be targeted to reduce the negative impacts of air pollution, while in Sweden, traffic and agriculture/waste management sectors should be targeted to reduce the adverse impacts of air pollution and their associated costs. Overall, Nordic countries contribute to low premature death cases in their Nordic neighbors (≤50). Among the four Nordic countries, Denmark has the largest external costs due to air pollution, followed by Sweden, Finland and Norway, respectively. Following the mortality rates, Denmark, Finland and Norway have the largest cost contribution to Sweden, while Sweden contributes largest to Denmark.
Overall, results from the estimates of pollution export, premature mortality and associated costs suggest that in the Nordic countries, non-industrial combustion, which is dominated by non-industrial wood combustion, together with industry and traffic, is the main sector to be targeted for emission mitigation strategies. The contributions of emissions from Nordic countries to each other are small (≤10 %), and to the Arctic (up to 2 %), meaning that large reductions can be achieved only by coordinated efforts to decrease emissions in the upwind countries.
The data are not publicly available. The FREYA project is still ongoing and we do not have an agreement in the contract to make the data publicly available.
The supplement related to this article is available online at: https://doi.org/10.5194/acp-19-12975-2019-supplement.
UI and JHC conducted the model simulations. JHC and OKN worked with the emissions input. MS and RM contributed to the experimental design of the model simulations. UI, JK, CA and SLA extracted measurement data from Denmark, Finland, Sweden and Norway, respectively. CG and JB contributed to premature mortality and cost calculations. All co-authors contributed to the manuscript.
The authors declare that they have no conflict of interest.
This study has been conducted under the FREYA project, funded by the Nordic Council of Ministers, Climate and Air Pollution Group (grant agreement no. MST-227-00036). Aarhus University gratefully acknowledges the NordicWelfAir project, funded by the NordForsk's Nordic Programme on Health and Welfare (grant agreement no. 75007). The work has also been funded by the Academy of Finland within the project GLOROIA and by the Research Council of Norway under the project BlackArc (contract no. 240921).
This study has been conducted under the 55 FREYA project, funded by the Nordic Council of Ministers, Climate and Air Pollution Group (grant no. MST-227-00036).
This paper was edited by Pedro Jimenez-Guerrero and reviewed by three anonymous referees.
Alberini, A., Hunt, A., and Markandya, A.: Willingness to pay to reduce mortality risks: Evidence from a three-country contingent valuation study, Environ. Resour. Econ., 33, 251–264, 2006.
Andersen, M. S., Frohn, L. M., Nielsen, J. S., Nielsen, M., Jensen, S. S., Christensen, J. H., and Brandt, J.: A Non-linear Eulerian Approach for Assessment of Health-cost Externalities of Air Pollution, Proceedings of the European Association of Environmental and Resource Economists 16th Annual Conference, Gothenburg, Sweden, 25–28 June, 23 pp., 2008.
Andersson, C., Bergström, R., and Johansson, C.: Population exposure and mortality due to regional background PM in Europe – long-term simulations of source-region and shipping contributions, Atmos. Environ., 43, 3614–3620, 2009.
Andersson, C., Bergström, R., and Johansson, C.: Population exposure and mortality due to regional background PM in Europe – long-term simulations of source-region and shipping contributions, Atmos. Environ., 43, 3614–3620, 2009.
Anderson, H. R., Ponce de Leon, A., Bland, J. M., Bower, J. S., and Strachan, D. P.: Air Pollution and daily mortality in London: 1987-92, Brit. Med. J., 312, 665–669, 1996.
Anenberg, S. C., Belova, A., Brandt, J., Fann, N., Greco, S., Gut- tikunda, S., Heroux, M.-E., Hurley, F., Krzyzanowski, M., Med- ina, S., Miller, B., Pandey, K., Roos, J., Van Dingenen, R.: Survey of ambient air pollution health risk assessment tools, Risk Anal., 36, 1718–1736, https://doi.org/10.1111/risa.12540, 2015.
Arctic Council: Arctic Council Task Force on Short-Lived Climate Forcers – An Assessment of Emissions and Mitigation Options for Black Carbon for the Arctic Council, available at: https://oaarchive.arctic-council.org/handle/11374/926 (last access: 26 February 2019), 2011.
Brandt, J., Silver, J. D., Frohn, L. M., Geels, C., Gross, A., Hansen, A. B., Hansen, K. M., Hedegaard, G. B., Skjøth, C. A., Villadsen, H., Zare, A., and Christensen, J. H.: An integrated model study for Europe and North America using the Danish Eulerian Hemispheric Model with focus on intercontinental transport, Atmos. Environ., 53, 156–176, 2012.
Brandt, J., Silver, J. D., Christensen, J. H., Andersen, M. S., Bønløkke, J. H., Sigsgaard, T., Geels, C., Gross, A., Hansen, A. B., Hansen, K. M., Hedegaard, G. B., Kaas, E., and Frohn, L. M.: Contribution from the ten major emission sectors in Europe and Denmark to the health-cost externalities of air pollution using the EVA model system – an integrated modelling approach, Atmos. Chem. Phys., 13, 7725–7746, https://doi.org/10.5194/acp-13-7725-2013, 2013a.
Brandt, J., Silver, J. D., Christensen, J. H., Andersen, M. S., Bønløkke, J. H., Sigsgaard, T., Geels, C., Gross, A., Hansen, A. B., Hansen, K. M., Hedegaard, G. B., Kaas, E., and Frohn, L. M.: Assessment of past, present and future health-cost externalities of air pollution in Europe and the contribution from international ship traffic using the EVA model system, Atmos. Chem. Phys., 13, 7747–7764, https://doi.org/10.5194/acp-13-7747-2013, 2013b.
Christensen, J. H.: The Danish eulerian hemispheric model – a three-dimensional air pollution model used for the arctic, Atmos. Environ., 31, 4169–4191, 1997.
CEIP: Centre for Emission Inventories and Projections: Reported Emissions by Parties under the Convention for Long-range Transboundary Air Pollution, available at: http://www.ceip.at/webdab-emission-atabase/officially-reported-emissiondata/ (last access: 26 February 2019), 2019.
EEA: Air quality in Europe, Technical report 13/2017, Copenhagen, European Environment Agency, ISSN 1977-8449, 2017.
European Commission (EC): Recommended interim values for the value of preventing a fatality in DG Environment Cost Benefit analysis, Bruxelles, available at: http://ec.europa.eu/environment/enveco/others/pdf/recommended_interim_values.pdf (last access: 14 March 2019), 2001.
EU: Modelling and assessment of the health impact of particulate matter and ozone, Economic commission for Europe, Executive body for the convention on long-range transboundary air pollution, Working group on effects, twenty-third session, Geneva, 1–3 September, 2004.
Eyring, V., Bony, S., Meehl, G. A., Senior, C. A., Stevens, B., Stouffer, R. J., and Taylor, K. E.: Overview of the Coupled Model Intercomparison Project Phase 6 (CMIP6) experimental design and organization, Geosci. Model Dev., 9, 1937–1958, https://doi.org/10.5194/gmd-9-1937-2016, 2016.
Forsberg, B., Hansson, H. C., Johansson, C., Aureskoug, H., Persson, K., and Järvholm, B.: Comparative health impact assessment of local and regional particulate air pollutants in Scandinavia, Ambio, 34, 11–19, 2005.
Friedrich, R. and Bickel, P.: Environmental External Costs of Transport, Springer, Munich, 2001.
Geels, C., Andersson, C., Hänninen, O., Lansø, A. S., Schwarze, P., and Brandt, J.: Future Premature Mortality due to Air Pollution in Europe – Sensitivity to Changes in Climate, Anthropogenic Emissions, Population and Building stock, Int. J. Env. Res. Pub. He., 12, 2837–2869, 2015.
Hurley, F., Hunt, A., Cowie, H., Holland, Miller, B., Pye, S., and Watkiss, P.: Development of Methodology for the CBA of the Clean Air For Europe (CAFE) Programme, Volume 2: Health Impact Assessment, Report for European Commission DG Environment, AEAT/ED51014/Methodology, 2, 2005.
Im, U., Brandt, J., Geels, C., Hansen, K. M., Christensen, J. H., Andersen, M. S., Solazzo, E., Kioutsioukis, I., Alyuz, U., Balzarini, A., Baro, R., Bellasio, R., Bianconi, R., Bieser, J., Colette, A., Curci, G., Farrow, A., Flemming, J., Fraser, A., Jimenez-Guerrero, P., Kitwiroon, N., Liang, C.-K., Nopmongcol, U., Pirovano, G., Pozzoli, L., Prank, M., Rose, R., Sokhi, R., Tuccella, P., Unal, A., Vivanco, M. G., West, J., Yarwood, G., Hogrefe, C., and Galmarini, S.: Assessment and economic valuation of air pollution impacts on human health over Europe and the United States as calculated by a multi-model ensemble in the framework of AQMEII3, Atmos. Chem. Phys., 18, 5967–5989, https://doi.org/10.5194/acp-18-5967-2018, 2018a.
Im, U., Christensen, J. H., Geels, C., Hansen, K. M., Brandt, J., Solazzo, E., Alyuz, U., Balzarini, A., Baro, R., Bellasio, R., Bianconi, R., Bieser, J., Colette, A., Curci, G., Farrow, A., Flemming, J., Fraser, A., Jimenez-Guerrero, P., Kitwiroon, N., Liu, P., Nopmongcol, U., Palacios-Peña, L., Pirovano, G., Pozzoli, L., Prank, M., Rose, R., Sokhi, R., Tuccella, P., Unal, A., Vivanco, M. G., Yarwood, G., Hogrefe, C., and Galmarini, S.: Influence of anthropogenic emissions and boundary conditions on multi-model simulations of major air pollutants over Europe and North America in the framework of AQMEII3, Atmos. Chem. Phys., 18, 8929-8952, https://doi.org/10.5194/acp-18-8929-2018, 2018b.
Jalkanen, J.-P., Johansson, L., and Kukkonen, J.: A comprehensive inventory of ship traffic exhaust emissions in the European sea areas in 2011, Atmos. Chem. Phys., 16, 71–84, https://doi.org/10.5194/acp-16-71-2016, 2016.
Johansson, L., Jalkanen, J.-K., and Kukkonen, J.: Global assessment of shipping emissions in 2015 on a high spatial and temporal resolution, Atmos. Environ., 167, 403–415, 2017.
Jönsson, O., Andersson, C., Forsberg, B., and Johansson, C.: Health impacts and air pollution episodes in Stockholm regional background air due to European source regions, Boreal Environ. Res., 18, 280–302, 2013.
Katsouyanni, K., Touloumi, G., Spix, C., Schwartz, J., Balducci, F., Medina, S., Rossi, G., Wojtyniak, B., Sunyer, J., Bacharova, L., Schouten, J. P., Ponka, A., and Anderson, H. R.: Short-term effects of ambient sulphur dioxide and particulate matter on mortality in 12 European cities: results from time series data from the APHEA project, Air Pollution and Health: a European Approach, British Med. J., 314, 1658–1663, 1997.
Karvosenoja, N., Kangas, L., Kupiainen, K., Kukkonen, J., Karppinen, A., Sofiev, M., Tainio, M., Paunu, V.-V., Ahtoniemi, P., Tuomisto, J. T., and Porvari, P.: Integrated modeling assessments of the population exposure in Finland to primary PM2.5 from traffic and domestic wood combustion on the resolutions of 1 and 10 km, Air Qual. Atmos. Health, 4, 179–188, 2011.
Krewski, D., Jerrett, M., Burnett, R. T., Ma, R., Hughes, E., Shi, Y., Turner, M. C., Arden Pope III, C., Thurston, G., Calle, E. E., and Thun, M. J.: Extended Follow-Up and Spatial Analysis of the American Cancer Society Study Linking Particulate Air Pollution and Mortality, Health Effects Insitute Research Report, 140, 1–154, 2009.
Kukkonen, J., Kangas, L., Kauhaniemi, M., Sofiev, M., Aarnio, M., Jaakkola, J. J. K., Kousa, A., and Karppinen, A.: Modelling of the urban concentrations of PM2.5 on a high resolution for a period of 35 years, for the assessment of lifetime exposure and health effects, Atmos. Chem. Phys., 18, 8041–8064, https://doi.org/10.5194/acp-18-8041-2018, 2018.
Kukkonen, J., López-Aparicio, S., Segersson, D., Geels, C., Kangas, L., Kauhaniemi, M., Maragkidou, A., Jensen, A., Assmuth, T., Karppinen, A., Sofiev, M., Hellen, H., Riikonen, K., Nikmo, J., Kousa, A., Niemi, J. V., Karvosenoja, N., Santos, G. S., Sundvor, I., Im, U., Christensen, J. H., Nielsen, O.-K., Plejdrup, M. S., Nøjgaard, J. K., Omstedt, G., Andersson, C., Forsberg, B., and Brandt, J.: The influence of residential wood combustion on the concentrations of PM2.5 in four Nordic cities, Atmos. Chem. Phys. Discuss., https://doi.org/10.5194/acp-2019-564, in review, 2019.
Lehtomäki, H., Korhonen, A., Asikainen, A., Karvosenoja, N., Kupiainen, K., Paunu, V. V., Savolahti, M., Sofiev, M., Palamarchuck, Y., Karppinen, A., Kukkonen, J., and Hänninen, O.: Health Impacts of Ambient Air Pollution in Finland, Int. J. Environ. Res. Publ. Health, 15, 736, https://doi.org/10.3390/ijerph15040736, 2018.
Liang, C.-K., West, J. J., Silva, R. A., Bian, H., Chin, M., Davila, Y., Dentener, F. J., Emmons, L., Flemming, J., Folberth, G., Henze, D., Im, U., Jonson, J. E., Keating, T. J., Kucsera, T., Lenzen, A., Lin, M., Lund, M. T., Pan, X., Park, R. J., Pierce, R. B., Sekiya, T., Sudo, K., and Takemura, T.: HTAP2 multi-model estimates of premature human mortality due to intercontinental transport of air pollution and emission sectors, Atmos. Chem. Phys., 18, 10497–10520, https://doi.org/10.5194/acp-18-10497-2018, 2018.
Pope, C. A.: Particulate matter-mortality exposure-response relations and threshold, Am. J. Epidemiol., 152, 407–412, 2000.
Pope, C. A., Thun, M. J., Namboodiri, M. M., Dockery, D. W., Evans, J. S., Speizer, F. E., and Heath Jr, C. W.: Particulate air pollution as a predictor of mortality in a prospective study of US adults, Am. J. Resp. Crit. Care Med., 151, 669–674, 1995.
Pope, C. A., Burnett, R. T., Thun, M. J., Calle, E. E., Krewski, D., Ito, K., and Thurston, G. D.: Lung cancer, cardiopulmonary mortality and long-term exposure to fine particulate air pollution, J. Am. Med. Assoc., 287, 1132–1141, 2002.
Samoli, E., Analitis, A., Touloumi, G., Schwartz, J., Anderson, H. R., Sunyer, J., Bisanti, L., Zmirou, D., Vonk, J. M., Pekkanen, J., Goodman, P., Paldy, A., Schindler, C., and Kaysouyanni, K.: Estimating the Exposure–Response Relationships between Particulate Matter and Mortality within the APHEA Multicity Project, Environ. Health Persp., 113, 88–95, 2005.
Sand, M., Berntsen, T. K., von Salzen, K., Flanner, M. G., and Viktor, D. G.: Response of Arctic temperature to changes in emissions of short-lived climate forcers, Nat. Clim. Change, 6, 286–289, 2015.
Skamarock, W. C., Klemp, J. B., Dudhia, J., Gill, D. O., Barker, D. M., Wang, W., and Powers, J. G.: A description of the Advanced Research WRF Version 3, Technical report, NCAR, nCAR Tech Notes-468+STR, 2008.
Solazzo, E., Bianconi, R., Vautard, R., Appel, K. W., Moran, M. D., Hogrefe, C., Bessagnet, B., Brandt, J., Christensen, J. H., Chemel, C., Coll, I., van der Gon, H. D., Ferreira, J., Forkel, R., Francis, X. V., Grell, G., Grossi, P., Hansen, A. B., Jerice- vic, A., Kraljevic, L., Miranda, A. I., Nopmongcol, U., Pirovano, G., Prank, M., Riccio, A., Sartelet, K. N., Schaap, M., Silver, J. D., Sokhi, R. S., Vira, J., Werhahn, J., Wolke, R., Yarwood, G., Zhang, J., Rao, S. T., and Galmarini, S.: Ensemble modelling of surface level ozone in Europe and North America in the context of AQMEI, Atmos. Environ., 53, 60–74, 2012a.
Solazzo, E., Bianconi, R., Pirovano, G., Matthias, V., Vautard, R., Moran, M. D., Appel, K. W., Bessagnet, B., Brandt, J., Chris- tensen, J. H., Chemel, C., Coll, I., Ferreira, J., Forkel, R., Francis, X. V., Grell, G., Grossi, P., Hansen, A. B., Hogrefe, C., Miranda, A. I., Nopmongco, U., Prank, M., Sartelet, K. N., Schaap, M., Sil- ver, J. D., Sokhi, R. S., Vira, J., Werhahn, J., Wolke, R., Yarwood, G., Zhang, J., Rao, S. T., and Galmarini, S.: Operational model evaluation for particulate matter in Europe and North America in the context of AQMEII, Atmos. Environ., 53, 75–92, 2012b.
Solazzo, E., Bianconi, R., Hogrefe, C., Curci, G., Tuccella, P., Alyuz, U., Balzarini, A., Baró, R., Bellasio, R., Bieser, J., Brandt, J., Christensen, J. H., Colette, A., Francis, X., Fraser, A., Vi- vanco, M. G., Jiménez-Guerrero, P., Im, U., Manders, A., Nop- mongcol, U., Kitwiroon, N., Pirovano, G., Pozzoli, L., Prank, M., Sokhi, R. S., Unal, A., Yarwood, G., and Galmarini, S.: Eval- uation and error apportionment of an ensemble of atmospheric chemistry transport modeling systems: multivariable temporal and spatial breakdown, Atmos. Chem. Phys., 17, 3001–3054, https://doi.org/10.5194/acp-17-3001-2017, 2017.
Solazzo, E., Riccio, A., Van Dingenen, R., and Galmarini, S.: Evaluation and uncertainty estimation of the impact of air quality modelling on crop yields and premature deaths using a multi-model ensemble, Sci. Total Environ., 663, 1437–1452, 2018.
Touloumi, G., Samoli, E., and Katsuyanni, K.: Daily mortality and “winter type” air pollution in Athens, Greece - a time series analysis within the APHEA project, J. Epidemiol. Commun. H., 50, 47–51, 1996.
Turner, M.: Long-Term Ozone Exposure and Mortality in a Large Prospective Study, Am. J. Respir. Crit. Care Med., 193, 1134–1142, https://doi.org/10.1164/rccm.201508-1633OC, 2016.
Watkiss, P., Pye, S., and Holland, M.: Cafe CBA: Baseline Analysis 2000 to 2020, Service Contract for Carrying out Cost-Benefit Analysis of Air Quality Related Issues, in Particular in the Clean Air for Europe (Cafe) Programme, available at: http://ec.europa.eu/environment/archives/cafe/activities/pdf/cba_baseline_results2000_2020.pdf (last access: 29 February 2019), 2005.
WHO: Health risks of air pollution in Europe – HRAPIE: Recommendations of concentration-response functions for cost-benefit analysis of particulate matter, ozone and nitrogen dioxide, World Health Organization, available at: http://www.euro.who.int/__data/assets/pdf_file/0006/238956/Health_risks_air_pollution_HRAPIE_project.pdf (last access: 17 October 2019), 2013.
WHO: 7 million premature deaths annually linked to air pollution, News release, World Health Organization, available at: http://www.who.int/mediacentre/news/releases/2014/air-pollution/en/ (last access: 26 February 2019), 2014.
Woodruff, T. J., Grillo, J., and Schoendorf, K. C.: The relationship between selected causes of postneonatal infant mortality and particulate air pollution in the United States, Environ. Hlth. Perspect., 105, 608–612, 1997.


