the Creative Commons Attribution 4.0 License.
the Creative Commons Attribution 4.0 License.
 | 11 Oct 2019
Optical properties of meteoric smoke analogues
Tasha Aylett
James S. A. Brooke
Alexander D. James
Mario Nachbar
Denis Duft
Thomas Leisner
Accurate determination of the optical properties of analogues for meteoric smoke particles (MSPs), which are thought to be composed of iron-rich oxides or silicates, is important for their observation and characterization in the atmosphere. In this study, a photochemical aerosol flow system (PAFS) has been used to measure the optical extinction of iron oxide MSP analogues in the wavelength range 325–675 nm. The particles were made photochemically and agglomerate into fractal-like particles with sizes on the order of 100 nm. Analysis using transmission electron microscopy (TEM), energy-dispersive X-ray spectroscopy (EDX) and electron energy loss spectroscopy (EELS) suggested the particles were most likely maghemite-like (γ-Fe2O3) in composition, though a magnetite-like composition could not be completely ruled out. Assuming a maghemite-like composition, the optical extinction coefficients measured using the PAFS were combined with maghemite absorption coefficients measured using a complementary experimental system (the MICE-TRAPS) to derive complex refractive indices that reproduce both the measured absorption and extinction.
- Article
(5196 KB) - Full-text XML
-
Supplement
(739 KB) - BibTeX
- EndNote


The ablation of cosmic material in the mesosphere leads to the formation of nanometre-sized meteoric smoke particles (MSPs) (Plane et al., 2015). Reaction, condensation and subsequent agglomeration of stable reservoir species such as FeOH, Mg(OH)2, NaHCO3 and SiO2 leads to the formation of MSPs over a timescale of several days. However, very little is known about the physical and chemical properties of these particles. It is important to establish the composition and other characteristics of MSPs because the particles are thought to be involved in a wide range of atmospheric processes as they are transported down through the atmosphere, including: mesospheric metal chemistry; mesospheric oxygen chemistry; nucleation of polar mesospheric clouds (PMCs); stratospheric aerosol chemistry (including the nucleation of polar stratospheric clouds, PSCs); and deposition of bioavailable metal sulfates into the oceans (Plane et al., 2015).
The detection and characterization of MSPs has proven extremely challenging as the mesosphere–lower thermosphere (MLT) is a notoriously difficult region in which to perform in situ studies. In terms of the composition, at present only two types of investigations exist: rocket-borne instruments (e.g. Faraday cup detectors and electric work-function studies) and remote sensing (e.g. optical spectroscopy). The only direct measurements have been obtained via sounding rocket flights, though only charged particles have been sampled with any success. One example is the ECOMA (Existence and Charge state Of Meteoric smoke particles in the middle Atmosphere) project (Rapp et al., 2010). This work constrained the MSP size and work function, with electronic structure calculations inferring a likely MSP composition of Fe and Mg hydroxide clusters with low silica content (Rapp et al., 2012).
Important progress has also been achieved using remote sensing techniques: the SOFIE (Solar Occultation for Ice Experiment) instrument on the AIM (Aeronomy of Ice in the Mesosphere) satellite has detected MSPs by optical extinction, conducting solar occultation measurements from April 2007 to the present. Extinction measurements at 330, 867 and 1037 nm were used to show that the best-fit particle compositions are iron-rich oxides (magnetite (Fe3O4), wüstite (FeO), magnesiowüstite (MgxFe1−xO, )) or iron-rich olivine (Mg2xFe2−2xSiO4, ) (Hervig et al., 2017). That is, the major meteoric elements Fe, Mg and Si are either mixed in olivinic particles with a single average composition, or MSPs are a mix of metal oxide and silica particles. However, this technique makes an important assumption: that the bulk (crystalline) refractive indices (RIs) used to infer smoke compositions are applicable to MSPs, despite evidence that the particles are structurally amorphous, fractal-like agglomerates (Saunders and Plane, 2006). This assumption is currently not confirmed, and as such it is important to measure RIs of realistic MSP analogues, especially those of iron-rich particles.
A number of crystalline MSP analogues (Fe2O3, silica (SiO2) and iron silicates (FexSi(1−x)O3 ())) with radii on the order of 2 nm have recently been generated in the laboratory using a low-pressure, non-thermal microwave resonator (Nachbar et al., 2018a, 2019). The particles are transferred to a low-pressure, supersaturated particle trap – the Molecular Flow Ice Cell-Trapped Reactive Atmospheric Particle Spectrometer (MICE-TRAPS) – in which particle properties can be determined. The latest work using this system derived absorption efficiencies for Fe2O3 particles at 450, 488 and 660 nm (Nachbar et al., 2019). David et al. (2012) have demonstrated the production of maghemite particles with a similar experimental arrangement. In fact, Navrotsky et al. (2008) have argued that maghemite is thermodynamically favoured with respect to haematite for particles smaller than 16 nm in diameter. The particles produced in the study of Nachbar et al. (2018b) are therefore very likely to have been maghemite.
Amorphous MSP analogues have previously been generated in the laboratory using a photochemical aerosol flow system (PAFS) (Saunders and Plane, 2011, 2010, 2006). Particles with compositions close to the minerals haematite (α-Fe2O3), goethite (FeOOH), fayalite (Fe2SiO4) and silica (SiO2) were produced when metal-containing precursors were photolysed in the presence of O3∕O2. Particle size distributions were measured using a Scanning Mobility Particle Sizer (SMPS), and optical extinction measurements were obtained for comparison with values calculated from Mie theory using literature RIs for the unidentified particles. Although the experimental size distributions of the MSP analogues produced could be replicated using an agglomeration model (Jacobson, 2005; Saunders and Plane, 2010, 2006), there was significant uncertainty in the measured size distribution. Consequently, Mie theory was able to reproduce the measured extinction using bulk RIs for α-Fe2O3 and Fe2SiO4 particles, though not when using the experimental size distribution.
In this article, the photochemical technique used by Saunders and Plane has been developed further to study the agglomeration and optical properties of iron oxide particles. The measured optical extinction has been modelled using Mie theory and the Rayleigh–Debye–Gans (RDG) approximation (discussed below). Analysis using transmission electron microscopy (TEM), electron energy loss spectroscopy (EELS) and EDX (energy-dispersive X-ray) spectroscopy indicates a maghemite-like (γ-Fe2O3) particle composition. The measured optical extinction data were combined with absorption efficiencies from Nachbar et al. (2019) to derive wavelength-dependent complex RIs that reproduce the measured extinction. Maghemite particles have not been previously considered in the compositional analysis of MSPs because no RIs are available in the literature. However, the formation of maghemite nanoparticles in laboratory studies via two different production methods (via photolysis/in a microwave plasma) that operate under distinctly different conditions demonstrates the potential relevance of this species in the atmosphere and the need for further studies on this compound as a potential candidate for MSPs.
2.1 PAFS
The photochemical apparatus used to generate analogue MSPs (Fig. 1) has been described previously (Saunders and Plane, 2006, 2010, 2011). The set-up consists of a cylindrical glass photolysis cell with quartz end windows (r=4 cm; φ=25 cm) into which a combined flow of the Fe precursor, iron pentacarbonyl vapour (Fe(CO)5), and O3∕O2 was introduced. The Fe(CO)5 was generated by passing a flow of N2 through a round-bottomed flask containing ∼3 cm3 of liquid Fe(CO)5 (Aldrich) cooled in a water–ice bath to 0 ∘C. The round-bottomed flask and ice bath were covered to prevent any premature photolysis (and subsequent build-up of material on the flow tube walls). O3 was produced by photolysing O2 at 184 nm, by passing a flow of O2 through a glass cell with a quartz window in front of a Hg pen lamp. Once in the photolysis cell, the gases were irradiated using a 1000 W ozone-free Xenon arc lamp. Variable N2 “curtain” flows were passed across each of the cell windows such that the total flow rate was 550 sccm (1 sccm =1 cm3 min−1 at standard temperature and pressure (273 K and 1 bar)). After leaving the photolysis cell the particle flow was directed through an absorption cell (r=10 cm; φ=48 cm) with White cell optics in which the optical extinction of the particles was measured (hereafter referred to as the White cell). On exit from the White cell, particle size distributions were recorded using an SMPS consisting of a differential mobility analyser (DMA) and a condensation particle counter (CPC). The DMA sheath and aerosol flow rates were 3 and 0.3 L min−1 respectively, with a scan taken every 3 min (a scan time of 120 s and retrace of 30 s was used).
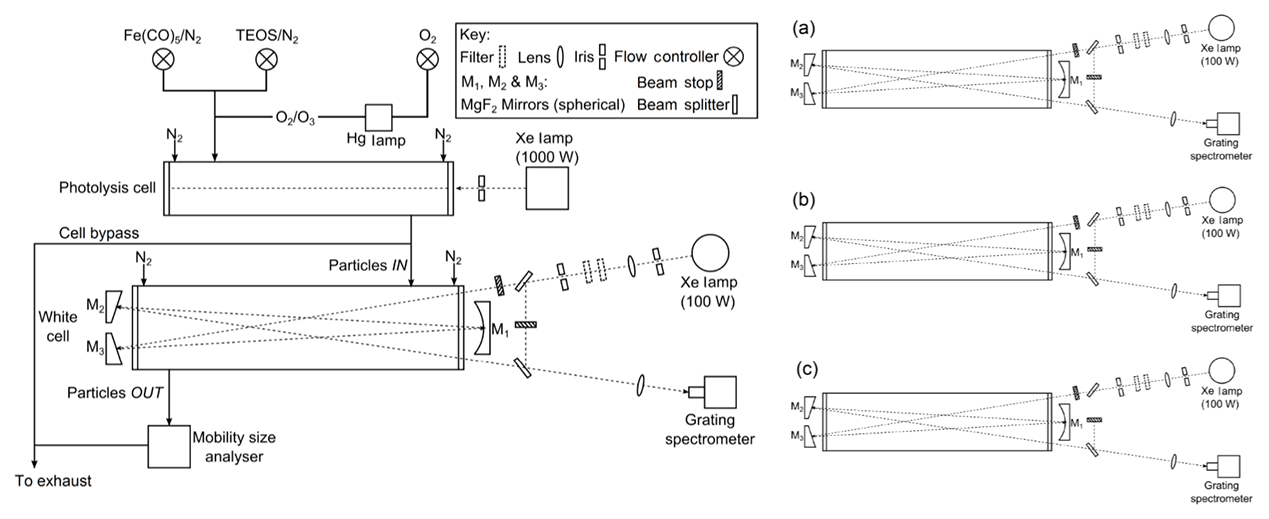
Figure 1Schematic diagram of the experimental system used for the generation and optical detection of MSP analogues, where (a), (b) and (c) show different beam configurations used to generate a normalized cell spectrum.
Light from a 100 W Xenon arc lamp was focused into the cell using a quartz lens (focal length =75 cm). The lamp intensity could be controlled by the insertion of a selection of neutral density filters, and stray lamp light was eliminated using an iris. Borosilicate White cell windows prevented further photolysis by the spectroscopy lamp and excluded second-order light at wavelengths below ∼330 nm from entering the spectrometer and potentially contaminating the spectra. N2 curtain flows (500 sccm) were passed across the windows to prevent aerosol deposition. Particle extinction was measured between 325 and 675 nm. A total optical path length (l) of 624 cm was achieved by folding the light path 12 times between three concave mirrors comprising the White cell. The exit beam was focused with a quartz lens onto a fibre optic coupled to an Acton Research SpectraPro 500i spectrometer, in which the light was dispersed using a grating (150 groove mm−1) onto a CCD camera. The exposure time was 0.1 s, with 57 accumulations per spectrum generating 9 spectra per minute.
To measure smaller levels of optical extinction than in our previous work (Saunders and Plane, 2006, 2010, 2011), an optical bypass was introduced to normalize for drifts in the Xe lamp spectral intensity with time. Beam stops were used to create three different beam configurations from which the separate signals could be extracted (Fig. 1). Spectra were recorded in 3 min cycles with 1 min of spectra taken using each configuration: (a) the beam directed through the cell and additionally through the bypass (Ia); (b) the beam directed only through the bypass (Ib); and (c) the beam directed only through the cell (Ic). This generated one normalized spectrum (In) every 3 min (see Eq. 1). The minimum detectable absorbance ranged from 0.07 to 0.004 over the wavelength range studied.
In a typical experiment, the sample flows were switched on, with the particle flow initially diverted to an exhaust rather than through the White cell. The background particle size distribution and optical intensity in the White cell (In,bg(λ, t)) were then measured for about 30 min. The particle flow was then directed through the White cell, and a further 21 min of sample measurements was recorded (In,sa(λ, t)). Thereafter, the particle flow was diverted back to the exhaust and background measurements resumed for around 45 min. A repeat sample measurement was recorded followed by approximately 30 min of reference measurements until the peak of the recorded size distribution had stabilized to within 1 %.
The gas-phase spectrum for the Fe(CO)5 precursor was measured with a PerkinElmer Lambda 90 UV–Vis spectrometer in a 1 cm × 1 cm gas cuvette. Due to the wide range covered by the absorption cross section in the measured wavelength range (4 orders of magnitude), the final spectrum was a composite of two spectra; the low-wavelength end of the spectrum (λ < 280 nm) was an average of three low-pressure measurements (P∼2 Torr) and the high-wavelength portion (λ > 280 nm) was an average of two higher-pressure measurements (P∼20–30 Torr). A reference spectrum for the empty cuvette was subtracted from each individual spectrum before averaging.
2.2 TEM
Particles formed in the photochemical aerosol flow system were collected by diverting the flow bypass through a round-bottomed flask containing a suspended transmission electron microscopy (TEM) grid (copper mesh with a holey carbon film coating). The grids were then stored under vacuum in the dark prior to imaging. Particles were analysed using TEM with EDX and electron energy loss spectroscopy (EELS) at the University of Leeds (FEI Titan3 Themis 300).
2.3 MICE-TRAPS
Absorption efficiencies determined in Nachbar et al. (2019) for maghemite particles with the MICE-TRAPS apparatus were used in combination with the optical extinction measured in this work for iron oxide particles produced with the PAFS apparatus, in order to derive complex RIs. The experimental and analytical methods used for the MICE-TRAPS experiment have been described in detail previously (Meinen et al., 2010a, b; Duft et al., 2015; Nachbar et al., 2016), with the recent methodology for particle production outlined in Nachbar et al. (2018a). The analysis procedure for the determination of absorption efficiencies is specified in Nachbar et al. (2019).
In brief, singly charged, spherical and compact nanoparticles are produced by mixing vapour from a volatile precursor (solid ferrocene, Fe(C5H5)2, ∼353 K) with a flow of oxygen and helium. This mixture then flows through a low-pressure, non-thermal microwave resonator to create a plasma in which electronically excited Fe atoms (in long-lived metastable states) are oxidized to produce Fe2O3 particles. A portion of the flow passes into a vacuum chamber through an aerodynamic lens, a flow-limiting orifice and an octupole ion guide (Fig. S1, Supplement). Particles of a chosen size are deflected with a quadrupole deflector and are subsequently trapped into a cloud of ∼1 mm radius within the ion trap MICE, where a He bath gas is added to thermalize the particles. Within the MICE, the particles are subject to a well-calibrated concentration of gas-phase H2O molecules (Nachbar et al., 2018b). Small numbers of particles are extracted from the trap at regular time intervals to a time-of-flight (ToF) mass spectrometer for particle mass determination.
In a typical experimental run, Fe2O3 particles were admitted into the MICE, where H2O molecules were adsorbed onto the particle surfaces with increasing trapping time until an equilibrium of adsorbing and desorbing molecules was reached. A number of repeat runs were performed where the cloud of particles was irradiated using optically pumped continuous wave semiconductor lasers (OBIS LX, Coherent, at 405, 488 and 660 nm), increasing the laser power in each subsequent run. Absorption of the laser light by the particles caused heating and desorption of H2O molecules from the particle surface (see Fig. S2). Parameters such as the initial mass and radius (r) of the particles, and the temperature change due to irradiation could then be calculated from the mass of the levitated nanoparticles as a function of the residence time in MICE. Assuming an equilibrium between radiative heating and collisional cooling enables the absorption cross section (Cabs) and absorption efficiency (Qabs, see Eq. 2) to be calculated. The latter is typically used when comparing the absorption of different-sized particles.
3.1 TEM
Examination of particles collected from the PAFS using TEM shows non-spherical, fractal-like particles. A range of particle sizes can be observed, ranging from tens of nanometres to microns in radius (Fig. 2). The fractal-like agglomerates are formed of primary spheres, whose size was estimated by taking a number of measurements from three high-resolution images of different agglomerates, one of which is shown in Fig. 2b. In each of these three images, 15 primary spheres were measured from around the visible “edge” of the particle, where a defined spherical shape could be seen. This analysis resulted in a primary particle radius of 1.65±0.15 nm.

Figure 2(a) Low-resolution TEM image showing the size range of iron oxide agglomerates (dark grey/black particles) collected on a holey-carbon grid (light grey holes and webbing). (b) High-resolution TEM image showing the primary particles forming an agglomerate. Black circles indicate measured primary spheres used for size characterization.
Comparison of the background-subtracted, low-loss deconvolved iron L-edge and oxygen K-edge EELS spectra with those from iron oxide standards can provide information on the particle composition (Fig. 3a and c) (Brown et al., 2017, 2001). The oxygen K-edge spectra for the iron oxide standards have been aligned using the energy loss for the peak designated as b in Fig. 3, due to the invariance of this peak in the spectra. Likewise, the iron L-edge spectra have been aligned to the sample peak a. On inspection of the oxygen K-edge, a wüstite-like sample composition can be excluded due to the differing edge-onset energy and shape of peak a. A haematite-like sample composition can also be rejected on the basis of the lack of the double-peak structure characteristic of haematite in the sample spectrum. This is corroborated on inspection of the iron L-edge, where a well-defined shoulder on the low-energy side and a broad shoulder on the high-energy side of peak a are observed for haematite and wüstite, respectively, neither of which are present in the sample spectrum.
In the case of both magnetite and maghemite there are no distinctive features in either the oxygen K-edges or iron L-edges to easily distinguish between the two species. Nonetheless, upon closer inspection (Fig. 3b and d) the sample spectra more closely resemble those for the maghemite standard as compared to those for magnetite. For the iron L-edge, although the shoulder on the low-energy side of peak a is larger in the sample spectrum than that observed for maghemite, it is more well defined than the shoulder seen in the magnetite spectrum. Furthermore, the profile of peak a more closely follows that for the maghemite standard on both the high- and low-energy sides. Though a defined double-peak structure is not observed in peak b, both the peak profile on the high-energy side and the height of the peak more closely resemble maghemite. For the oxygen K-edge, although there are some differences between the sample spectra and those for both standards (notably the lack of a defined peak c), there are minimal differences between the spectra for the maghemite and magnetite standards. For this reason, though the profile of peak a more closely follows that of maghemite, it is not possible to distinguish between the two species from the oxygen K-edge spectra alone.
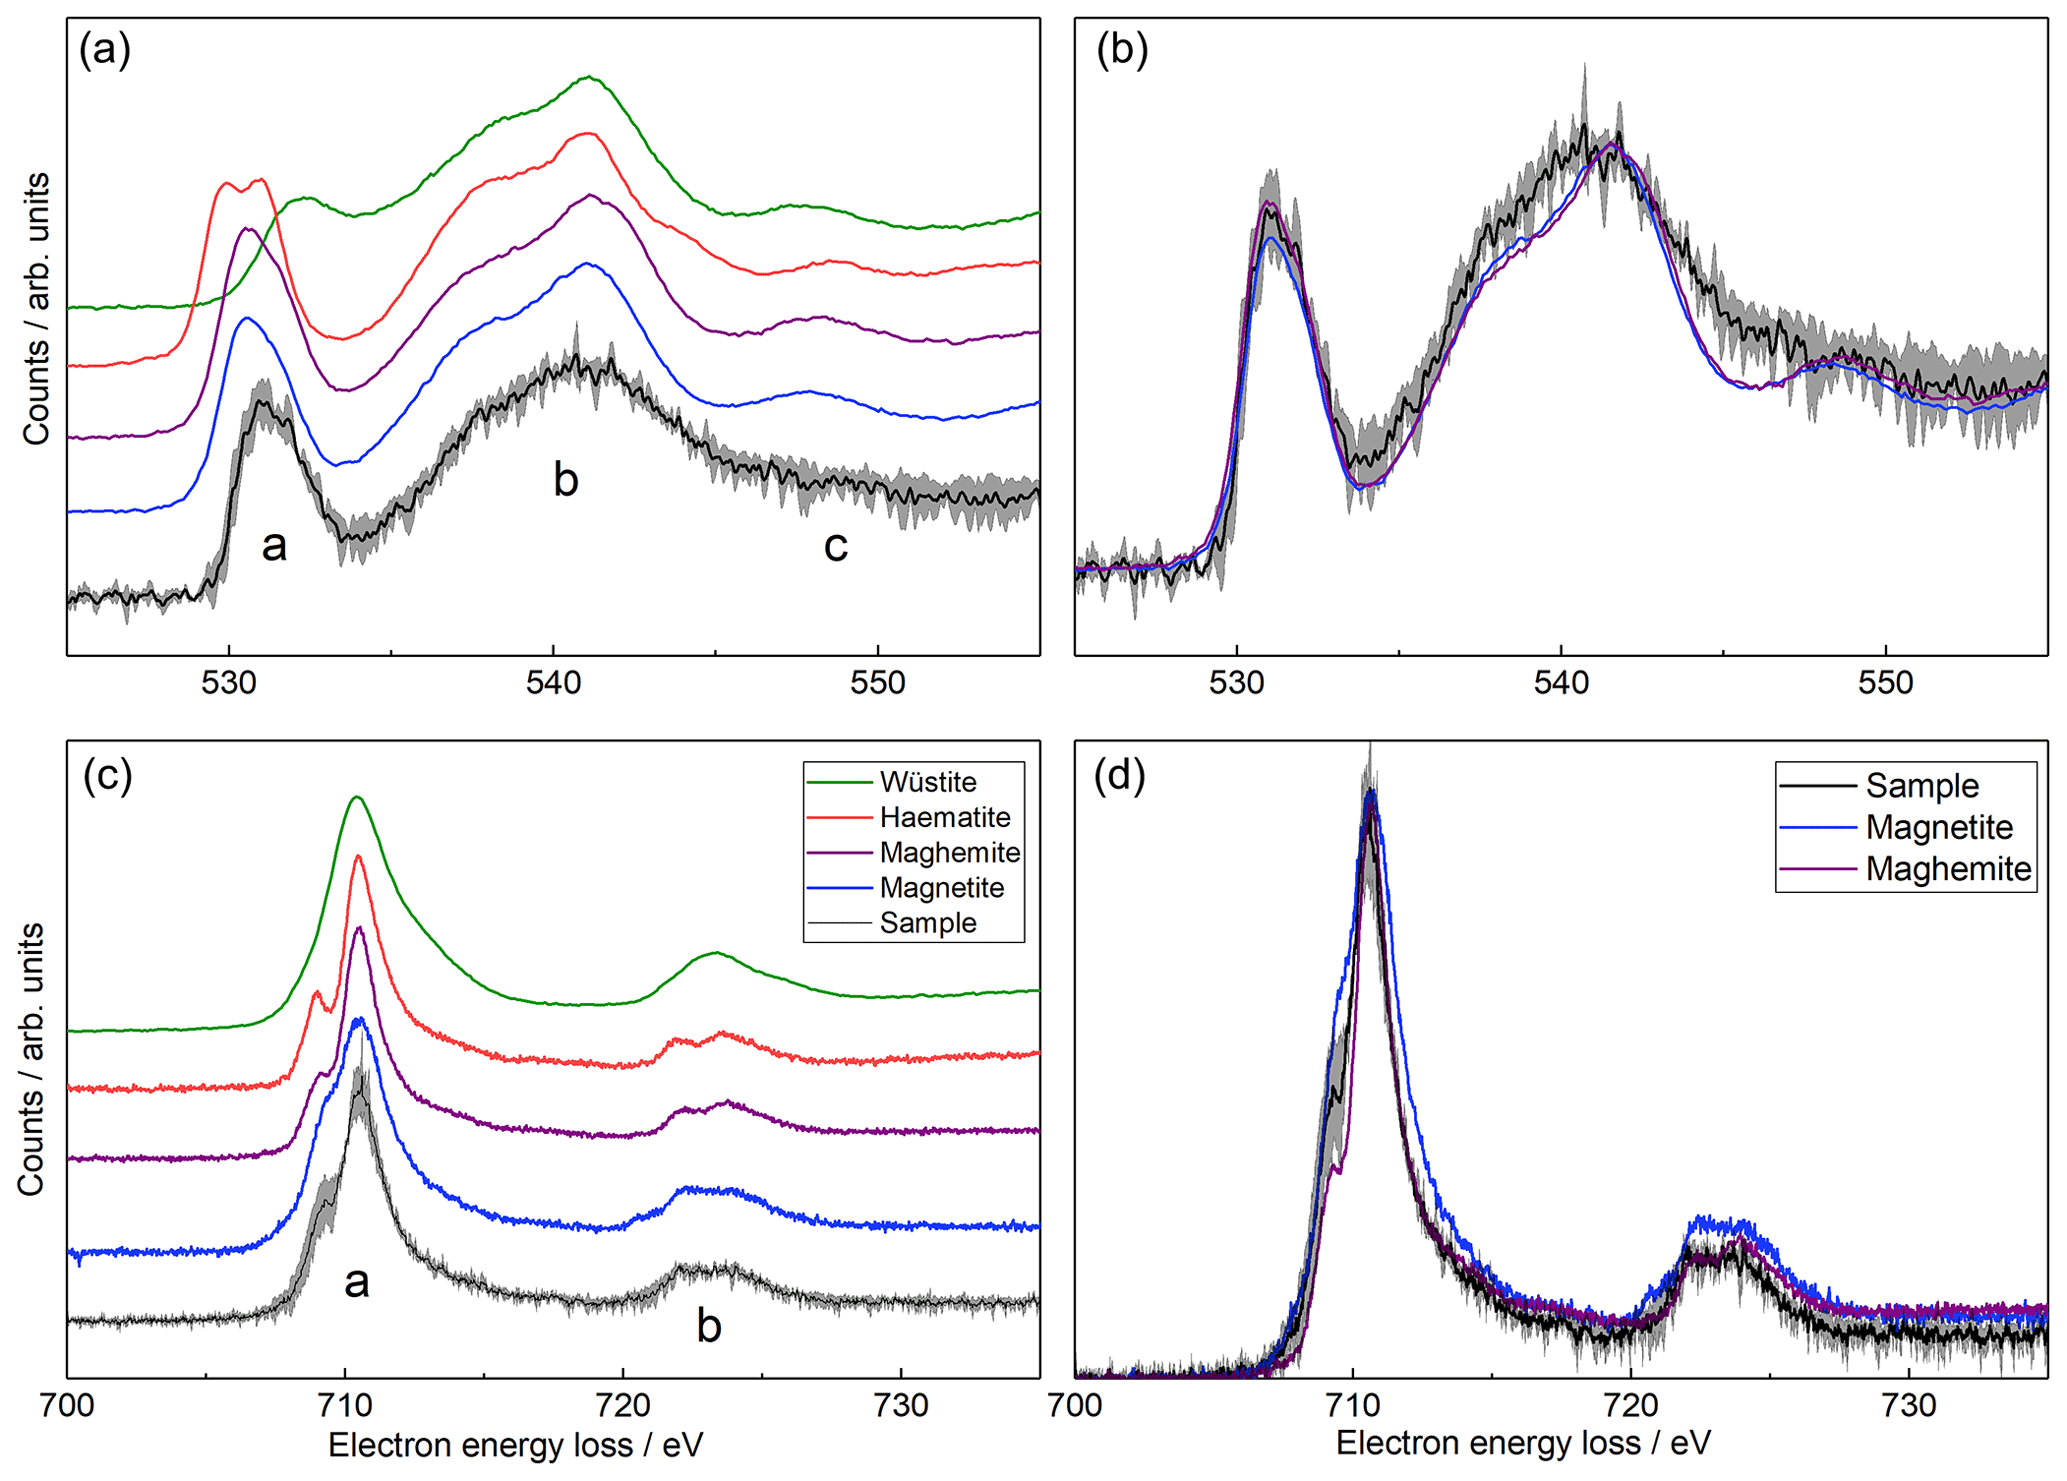
Figure 3Electron energy loss spectra measured with the TEM compared to spectra for iron oxide standards (Brown et al., 2017, 2001). (a, b) Oxygen K-edge. (c, d) Iron L-edge. Grey shaded regions indicate the experimental uncertainty. The (a) and (c) panels show the spectra offset for clarity, and (b) and (d) panels show the same spectra (for the sample, magnetite and maghemite) superimposed.
The defined peak c is not observed in the sample oxygen K-edge, which we speculate may be due to the poor crystallinity of the particles. This is confirmed by the electron diffraction pattern (Fig. S3) where two broad rings are observed coinciding with the intense reflections of magnetite/maghemite. The interplanar distances measured, accounting for a camera calibration error of ±6 %, were 2.60 and 1.47 Å near to the 311 and 440 diffraction planes, respectively (cf. measured distances of 2.57 and 1.52 Å in a maghemite standard). A faint ring was observed at an interplanar distance of 2.09 Å, close to the 400 diffraction plane at 2.11 Å. The diffraction pattern cannot distinguish between maghemite and magnetite, since both are based on a spinel crystal structure. However, this analysis does corroborate that the sample composition is very similar to either maghemite or magnetite. Elemental quantification using EELS resulted in an Fe∕O ratio of 0.48±0.12 – more oxygen-rich than any of the possible compositions haematite, maghemite, magnetite or wüstite (the oxides have Fe∕O ratios of 0.67, 0.75 and 1, respectively, i.e. Fe:O , 3:4 and 1:1). As such, the composition is most likely to be maghemite-like, although potentially with additional oxidation or oxygen contamination. This additional oxygen could be another reason for the differences observed in the oxygen K-edge.
The EDX spectrum (Fig. S4) confirms the presence of Fe and O, though some differences are observed in the intensities of the peaks in the spectra for the agglomerate and the maghemite standard. In the agglomerate spectrum, the intensity of the low-energy iron L-peak is higher than for the standard, which we speculate may be due to fluorescence from excited Cu X-rays from a grid bar, consistent with a relatively large amount of Cu in the agglomerate spectrum. The sample is also more oxygen-rich than the standard. This could result from contamination which was introduced after deposition, prior to TEM imaging. A significant carbon peak is observed in the agglomerate spectrum, suggesting a possible C- and O-rich hydrocarbon source for this contamination. Alternatively, oxygen could have been introduced within the flow apparatus, by coordination to, or reaction with, an oxygen-rich species O3, forming an oxide coating.
FeO3 is thought to form from the sequential oxidation of Fe by O3 (Fe → FeO → FeO2 → FeO3); the rate coefficients for these three reactions have been measured in the gas phase to be fast (Self and Plane, 2003). The formation of Fe2O3 smoke analogues in the PAFS apparatus has been previously proposed to occur by polymerization and subsequent re-ordering of FeO3 in the solid phase (Saunders and Plane, 2006); it may be that incomplete re-structuring of the FeO3 has occurred, thus causing the decreased Fe∕O ratio. Previous work using the PAFS under comparable experimental conditions obtained an Fe∕O ratio of 0.65±0.06 (Saunders and Plane, 2006). Although this was suggested to imply the formation of haematite, it would also be consistent with maghemite. Navrotsky et al. (2008) show that for nanoparticles less than ∼16 nm in size, maghemite is more stable than haematite since it has a lower surface enthalpy. We therefore conclude that a maghemite-like composition is most likely for the smoke analogues generated using the PAFS.
3.2 PAFS
The reduction in intensity of a beam of light from I0 to I as it traverses a distance l through an absorbing medium can be expressed as an optical density (OD) using the Beer–Lambert equation:
where the extinction coefficient αext arises from both absorption and scattering. The intensity (I) at time t is given by the sample spectrum recorded with the particle flow directed through the absorption cell (In,sa(λ, t)). A straight line reference fitted to the background spectrum (In,bg(λ, t)) yields I0 at time t, enabling the time- and wavelength-dependent OD to be extracted from the raw spectra. Once the particle size distribution exiting the absorption cell of the PAFS had stabilized, spectra were averaged to obtain one OD spectrum for the iron oxide nanoparticles (Fig. 4). As shown by the black shaded area in Fig. 4b, the uncertainty in the OD increased significantly at small wavelengths as a result of the decreasing intensity of the spectroscopic lamp and the fall-off in quantum efficiency of the CCD detector. Consequently, the optical data below 350 nm were discarded. At long wavelengths, data above 550 nm were also discarded because the OD decreased below the detection limit. The OD spectrum was also corrected for contributions from the residual precursors used to make the particles. The OD of residual O3 was negligible over the wavelength range of usable experimental data (λ > 350 nm). However, the residual Fe(CO)5 spectrum did need to be subtracted. Inspection of the literature did not yield appropriate data, so the Fe(CO)5 absorption cross section was measured (Fig. 4, top panel). The cross section data are listed in Table S3. The extent of Fe(CO)5 photolysis in the photolysis cell (Fig. 1) was calculated using the flow rates, the lamp irradiance and the wavelength-dependent absorption cross sections.

Figure 4(a) Measured Fe(CO)5 absorption cross section (cm2) with experimental uncertainty indicated by red shading. (b) Iron oxide particle extinction with the precursor spectrum removed (blue line) and experimental uncertainty indicated by light blue shading. Also shown is the spectrum for the Fe(CO)5 present in the absorption cell (red line), with the experimental uncertainty indicated by red shading. The detection limit for the experiment is shown with the black line and shaded region. Note the different wavelength ranges in each panel.
The size distribution of agglomerates measured with the SMPS follows an approximate lognormal distribution peaking around 100 nm radius (demonstrated by the lognormal fit in Fig. 5). A small additional mode is present in the distribution with a peak of approximately 30 nm. The measured size distribution provides a measure of the mobility radius, which is not necessarily equivalent to the fractal (outer) radius of amorphous particles – these are typically sized differently to spherical particles in an SMPS as they experience higher drag compared to a sphere with the same mass (DeCarlo et al., 2004). As such, it should be noted that it may not be appropriate to use the measured size distribution to calculate the optical extinction. Indeed, some very large (∼2 µm) particles are observed in the TEM images, though these may have resulted from further agglomeration during deposition on the collection grid. As shown in Fig. 6, using Mie theory with the experimental size distribution overpredicts the OD by at least an order of magnitude when using literature RIs for haematite, magnetite and wüstite (Hsu and Matijevic, 1985; Longtin et al., 1988; Querry, 1985; Fontijn et al., 1997; Huffman and Stapp, 1973; Henning and Mutschke, 1997). No equivalent calculation can be performed for maghemite as the bulk RIs are not available in the literature.
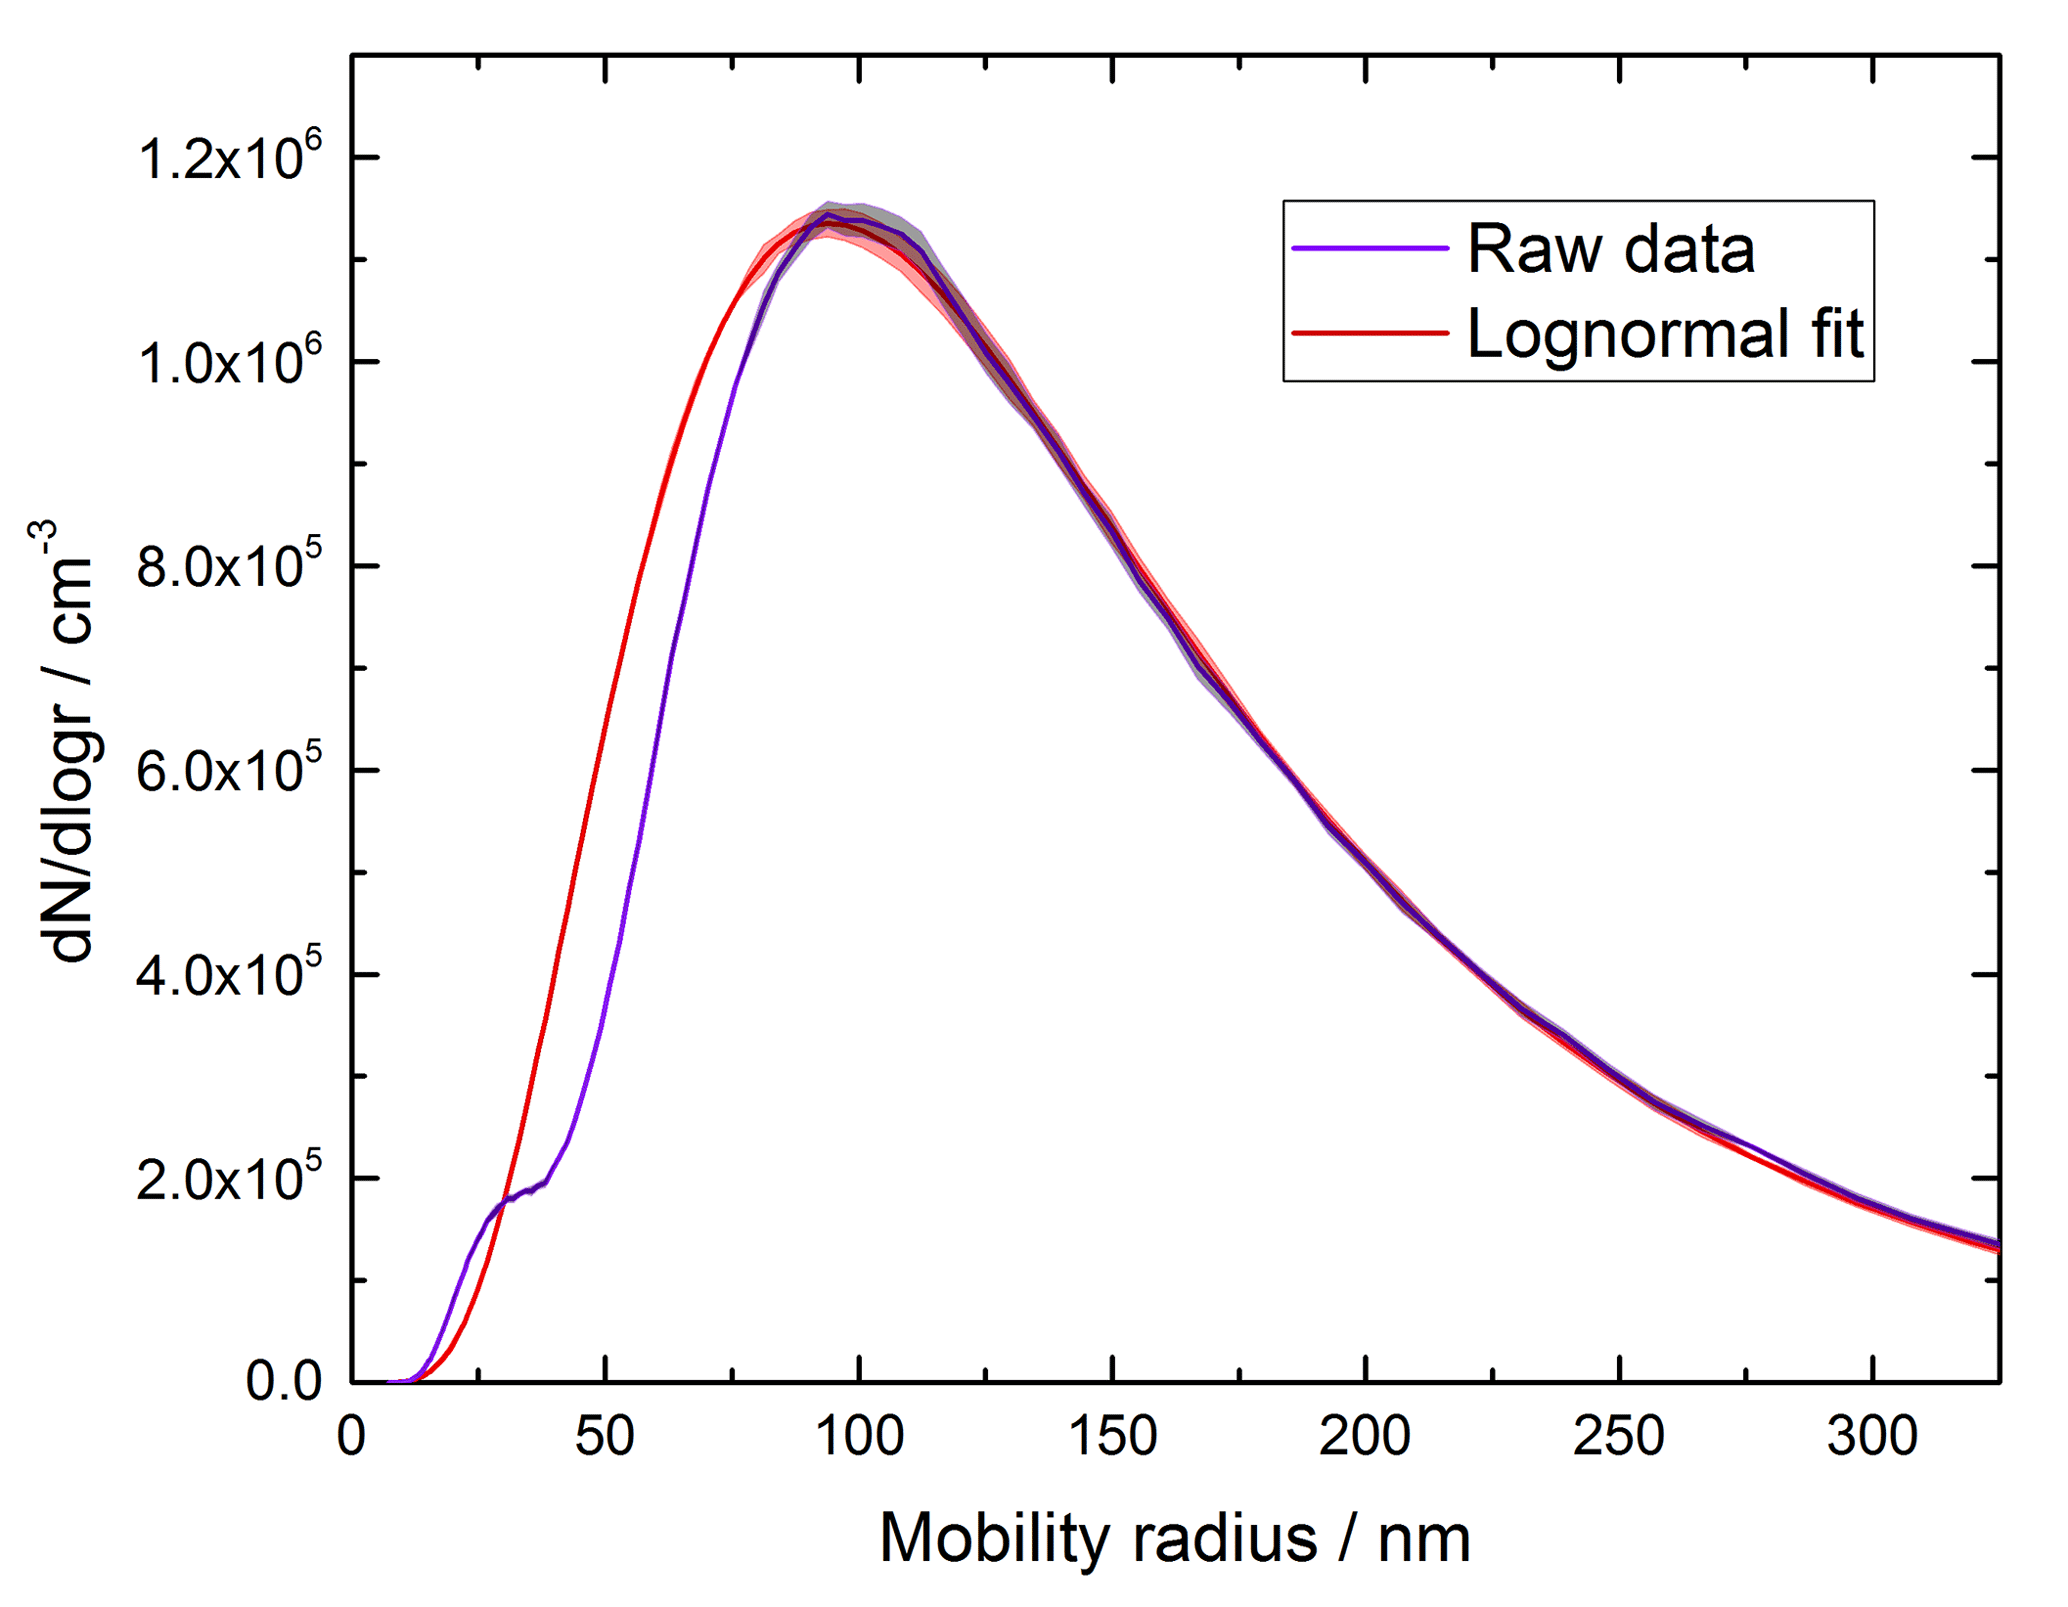
Figure 5Measured size distribution (purple) and a lognormal fit to the experimental data (red) with shaded areas indicating the experimental uncertainty.
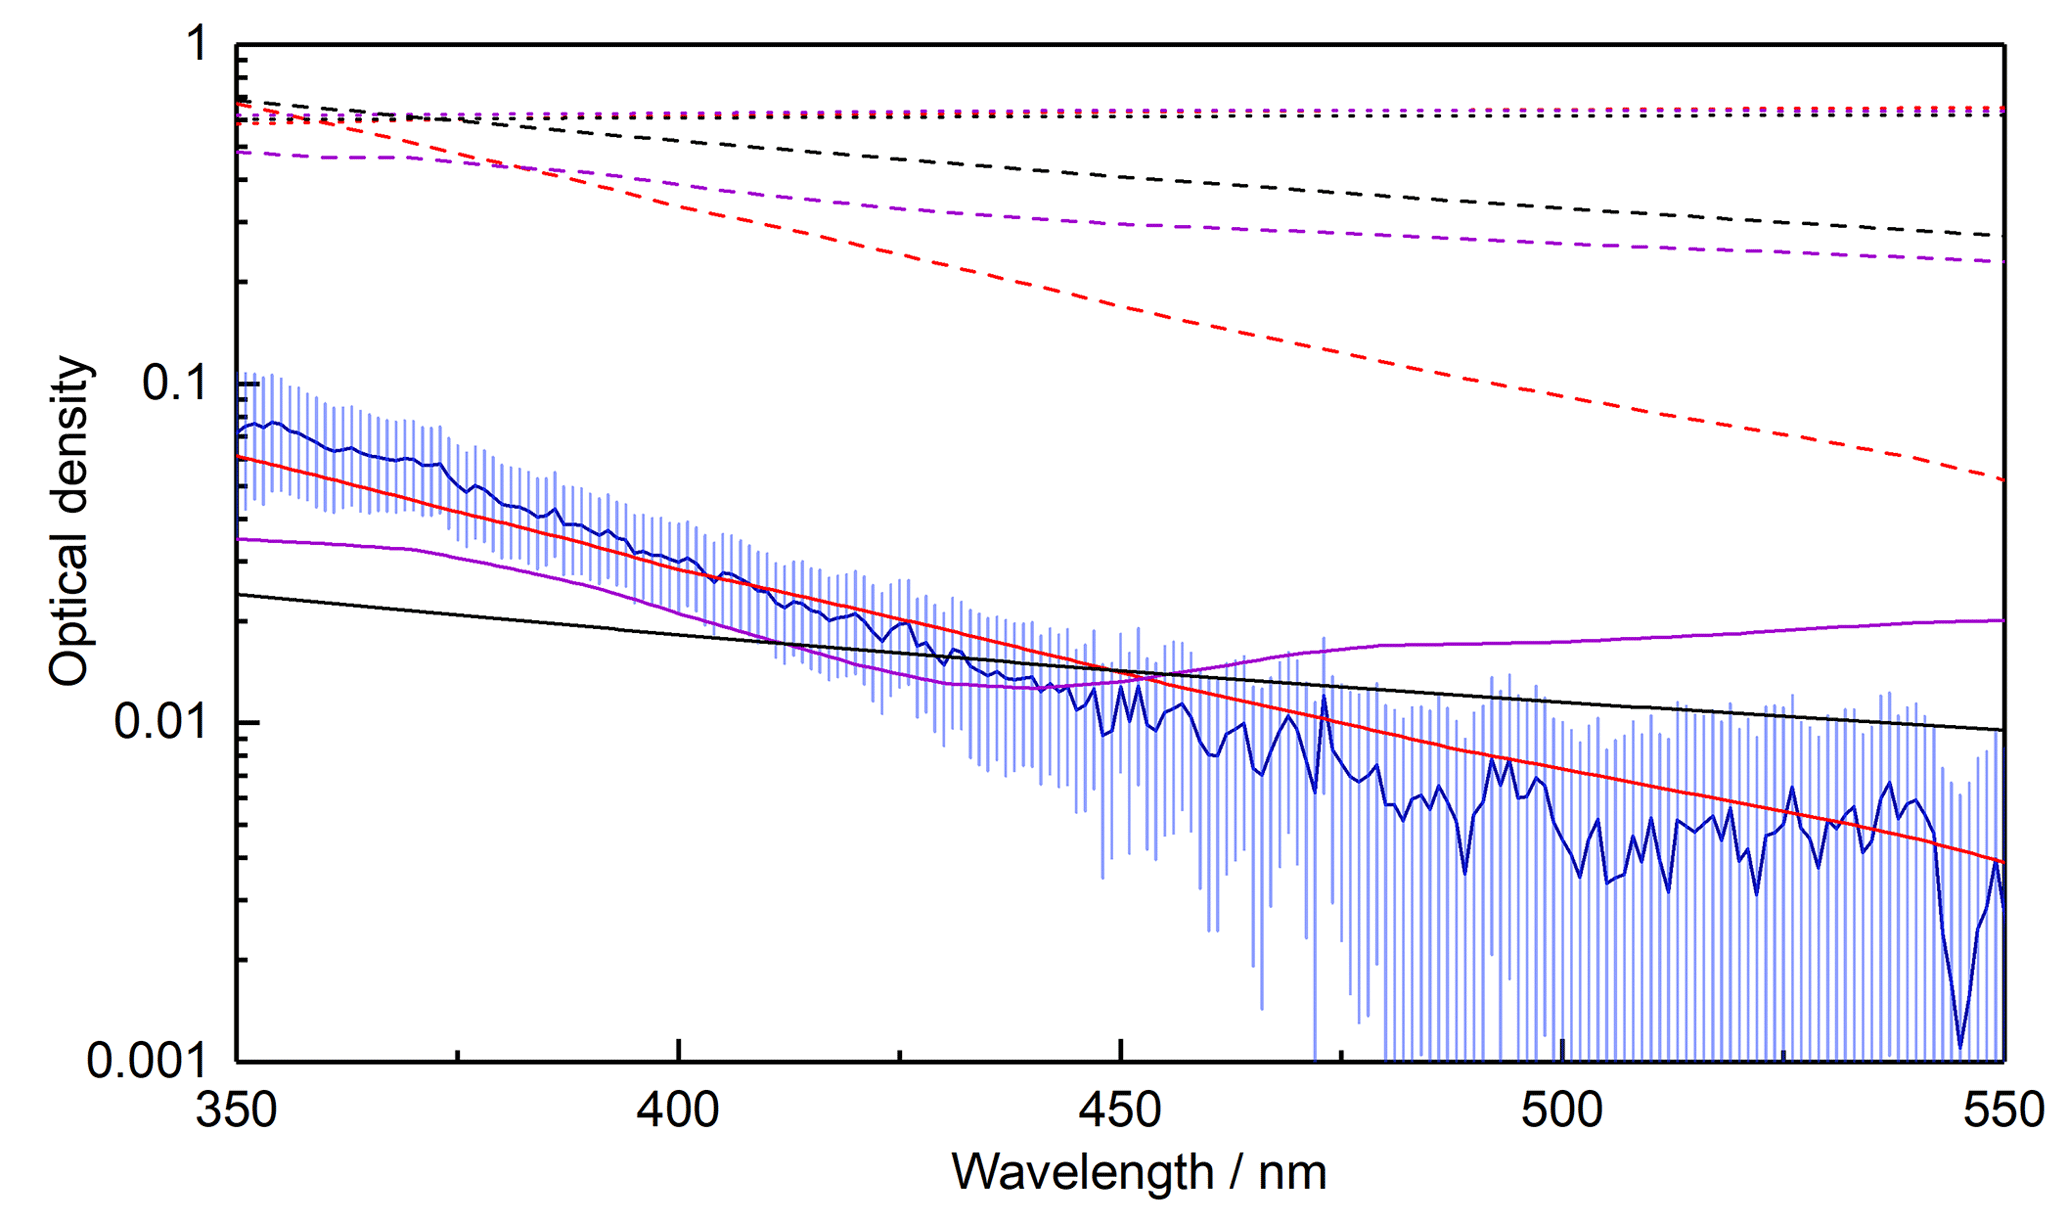
Figure 6Measured OD as a function of wavelength (blue line), compared with the average OD calculated from literature data for haematite (red, Hsu and Matijevic, 1985; Longtin et al., 1988; Querry, 1985), magnetite (purple, Fontijn et al., 1997; Huffman and Stapp, 1973; Querry, 1985) and wüstite (black, Henning and Mutschke, 1997) using the measured size distribution (dotted lines), the RDG approximation with a monomer concentration derived from the measured size distribution (dashed lines) and the RDG approximation with a monomer concentration fitted to the experimental data (solid lines).
An alternative method for calculating the OD of amorphous agglomerates is the Rayleigh–Debye–Gans (RDG) approximation (Sorensen, 2001), where an agglomerate is treated as a monodisperse distribution of primary spheres and the overall agglomerate extinction is calculated by summing those of the individual primary particles. Using a concentration of r=1.65 nm monomers calculated by integrating the measured size distribution (4.3×1011 cm−3), Fig. 6 shows that the OD is again overpredicted by around an order of magnitude, though a decrease in OD with increasing wavelength is obtained which more closely matches the experimental data. If the monomer concentration is reduced, as would be expected if the observed size distribution is made up of fractal-like particles rather than solid spheres, significantly better fits to the experimental data can be achieved for all species considered, with the best agreement achieved when using haematite RIs (Fig. 6). Assuming the RDG approximation holds, a comparison can be made with absorbance data for maghemite (Jain et al., 2009; Tang et al., 2003): for particles on the order of a few nanometres in size, absorption dominates over scattering (for the iron oxides, scattering < 0.01 % absorption). As such, the contribution from scattering to the OD can be neglected, and the absorbance data available in the literature can be arbitrarily scaled for comparison with the experimental data, since scaling the absorbance is equivalent to changing the concentration of monomers in the RDG approximation. This comparison is shown in Fig. 7, where the literature data agree reasonably well with the measured OD. As the literature optical data for haematite and maghemite best replicate the measured OD, this again suggests the most likely composition to be maghemite-like, given that the EELS analysis definitively excludes a haematite composition.
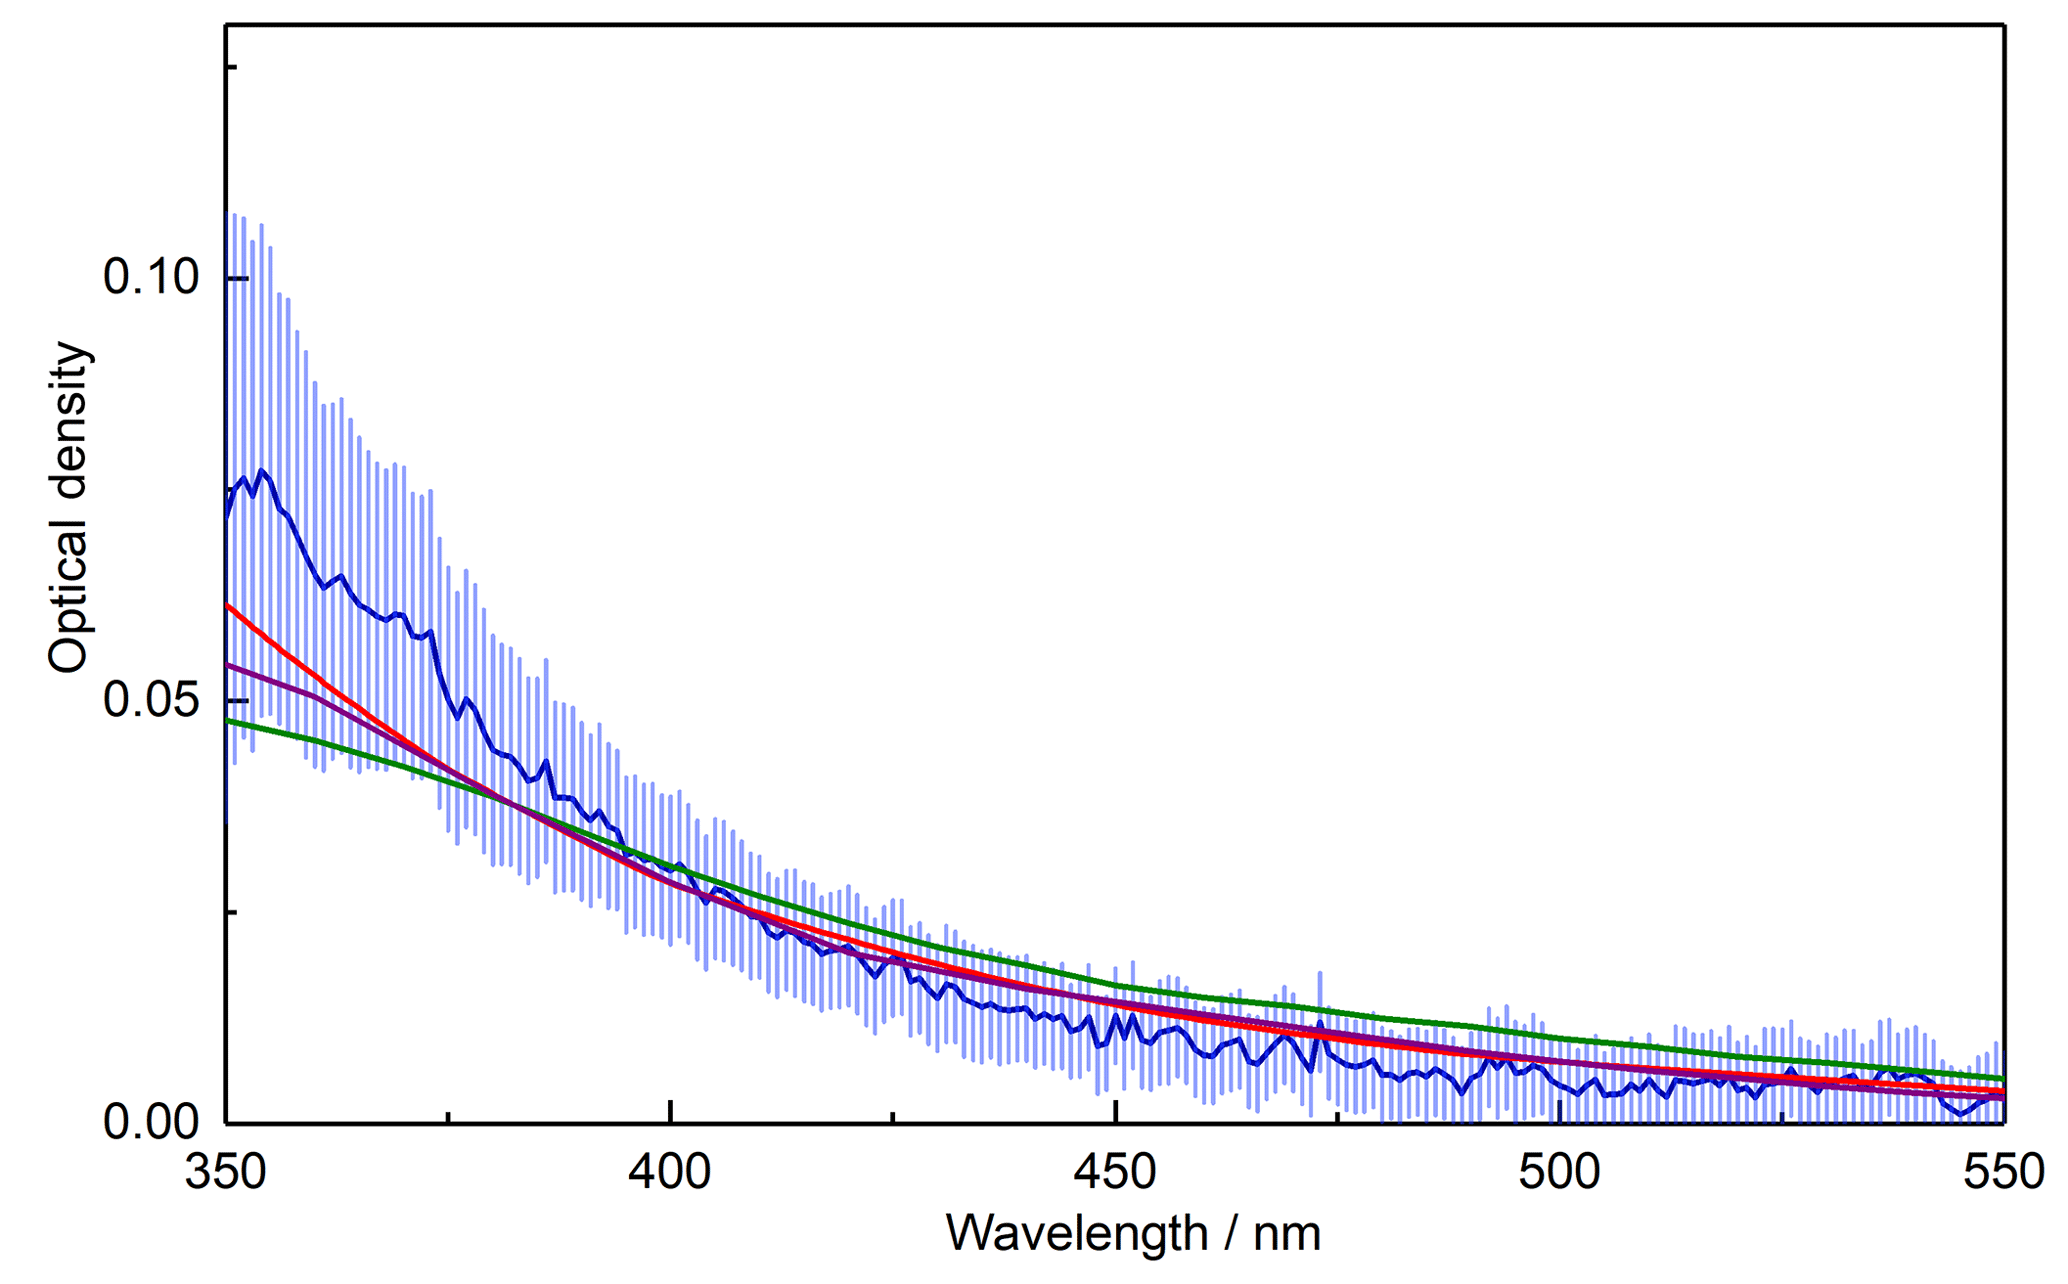
Figure 7Measured OD (blue line), scaled maghemite OD from Jain et al. (2009) (green line) and scaled maghemite OD from Tang et al. (2003) (purple line), as a function of wavelength. Also shown is the average OD calculated from literature data for haematite (red, Hsu and Matijevic, 1985; Longtin et al., 1988; Querry, 1985) using the RDG approximation with a monomer concentration fitted to the experimental data (as shown in Fig. 6).
3.3 Photochemical modelling
The previously measured size-dependent absorption efficiencies from the MICE-TRAPS experiment that were used to derive complex RIs are shown in Fig. 8. The solid lines represent an average of the absorption efficiencies calculated with Mie theory from haematite RIs available in the literature (Querry, 1985; Bedidi and Cervelle, 1993; Hsu and Matijevic, 1985; Longtin et al., 1988). The experimental data generally agree with those from the literature, given the experimental uncertainties and the variation in literature values. The best agreement is seen at 488 nm, where there is approximately a 20 % difference between the size-dependent literature average and the experimental values. The absorption efficiencies at 405 nm are around 45 % larger than the average literature values whilst still being within the spread of the experimental error. Those at 660 nm are around 45 % smaller than the average literature values, on the edge of the range spanned by the experimental errors.
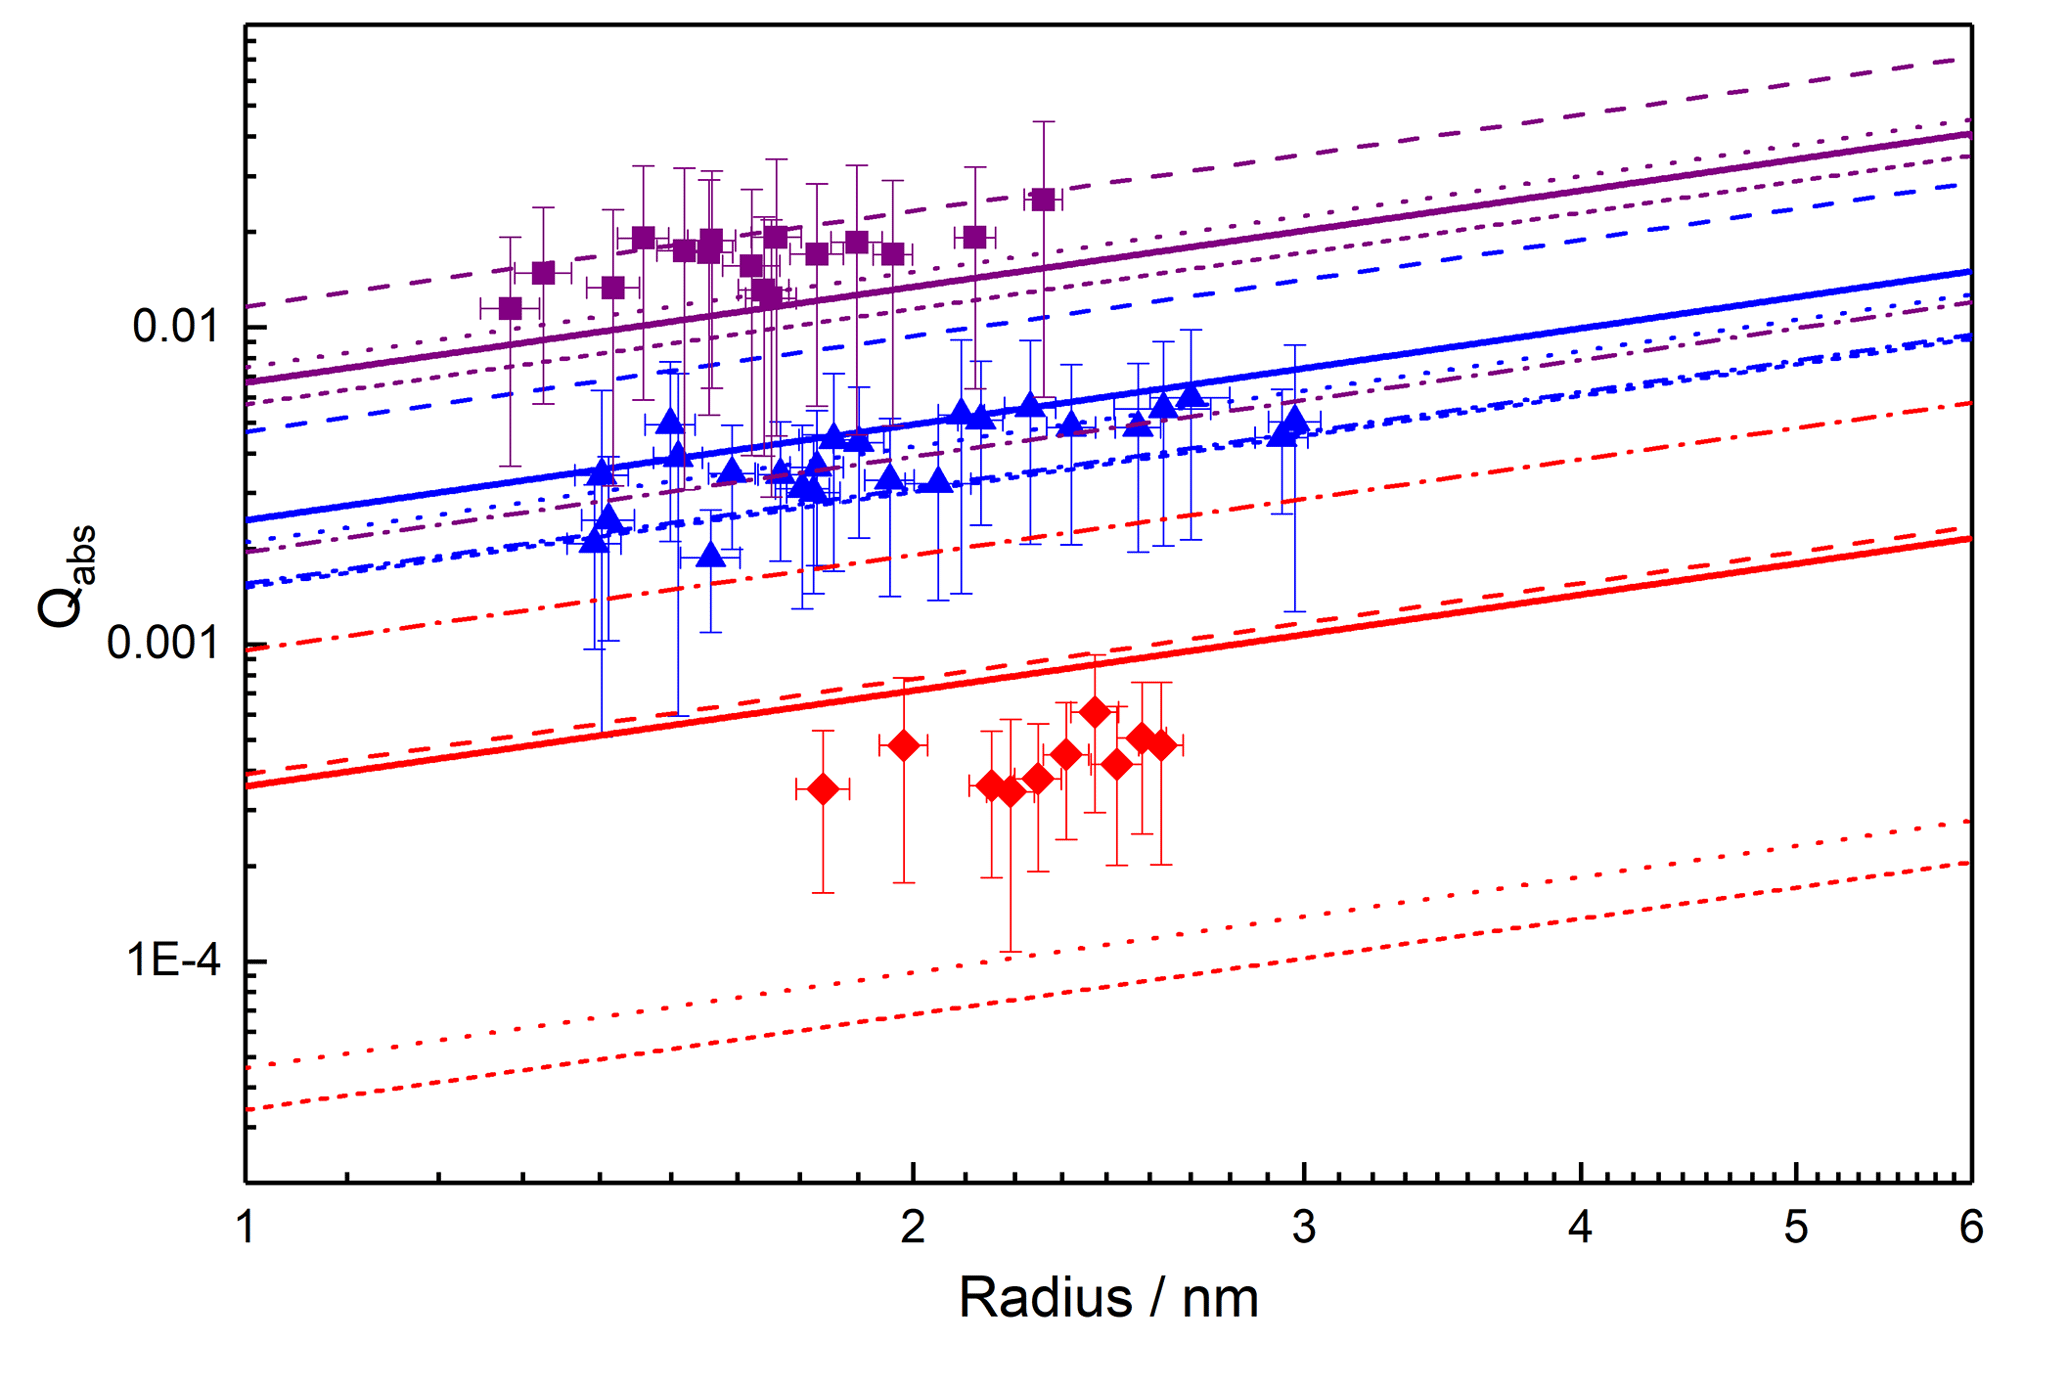
Figure 8Absorption efficiencies for a range of particle sizes at three different wavelengths: 405 nm (purple), 488 nm (blue) and 660 nm (red). Also shown are the literature data for haematite particles from Querry (1985) (long dash), Hsu and Matijevic (1985) (short dash), Bedidi and Cervelle (1993) (dot dash), Longtin et al. (1988) (dotted), and the average (bold lines).
In order to model the PAFS data, at each of the three wavelengths studied with the MICE-TRAPS (405, 488 and 660 nm), a range of best-fit complex RIs (Eq. 4, where n and k are the real and imaginary parts, respectively) was established by iterating over a range of possible RIs and calculating absorption cross sections for each real-imaginary pair using Mie theory. The indices resulting in the smallest normalized square difference (dabs,λ, Eq. 5) between the measured (Cabs,exp) and calculated (Cabs,calc) absorption cross section gave the best-fit RIs to the absorption data at that wavelength (Fig. 9).
By neglecting the scattering component in the absorption-dominated OD, the extinction cross sections measured in the PAFS could be approximated using the absorption cross sections measured in the MICE-TRAPS. This enabled a best-fit primary particle concentration to be determined for the PAFS particles, using data from the two wavelengths at which the measured extinction was above the detection limit (405 and 488 nm). Using the best-fit complex RIs from the MICE-TRAPS data, the PAFS extinction was calculated using the RDG approximation for a range of primary particle concentrations. At each wavelength (405 or 488 nm), the normalized square difference between the measured and calculated extinction cross sections was calculated for each concentration (δext,λ, Eq. 6, where Cext,exp and Cext,calc are the experimental and calculated extinction cross sections, respectively). The δext,λvalues for the two wavelengths were summed to derive (Eq. 7) and the concentration resulting in the smallest value gave the best-fit primary particle concentration, generating the best match to the measured extinction over the two wavelengths.
Using this best-fit primary particle concentration of 3.14×1010 cm−3, δext,λ was calculated for a range of complex RIs at 405 and 488 nm, with the indices giving the smallest δext,λ value defining the best fit to the extinction data at each wavelength (Fig. 9). The final best-fit RIs at each wavelength, fitting both the absorption and extinction data, were those that generated the minimum combined δ value (δλ, Eq. 8). At 660 nm, the final best-fit RIs used were those which best fit the absorption (gave the minimum δabs,λ).

Figure 9Best-fit RIs k and n for data at 405 nm (purple), 488 nm (blue) and 660 nm (red), for absorption (dotted lines), extinction (dashed lines) and the combination (solid lines). Shaded regions indicate where the resulting absorption and extinction cross sections are within experimental error for both experiments.
As it is possible to reproduce the measured absorption and extinction data at each wavelength using multiple different combinations of RIs, it is not possible to identify a unique solution for the wavelength dependence of these parameters. However, one way forward is first to select the wavelength dependence of the real RIs, which have a much smaller impact on the extinction cross section than the imaginary RIs in the absorption-dominated regime. The literature data for haematite from Hsu and Matijevic (1985), Longtin et al. (1988), and Querry (1985) very satisfactorily fit the experimental data across the whole wavelength range within experimental errors using the RDG approximation (Fig. 6, red line). Thus, for the unidentified particles an average of the real RIs from these data was used (Fig. 10a). Using these real RIs at 405, 488 and 660 nm, the imaginary RI at each wavelength was selected from the best-fit data (Table S1 in the Supplement). The wavelength dependence was then determined by fitting an exponential decay function through the three values (Fig. 10a, Table S1). The wavelength-dependent optical densities calculated using these RIs are shown in Fig. 10b. At 405, 488 and 660 nm the calculated absorption efficiencies for a 1.65 nm particle are , and respectively, compared to the experimentally determined values of , and .
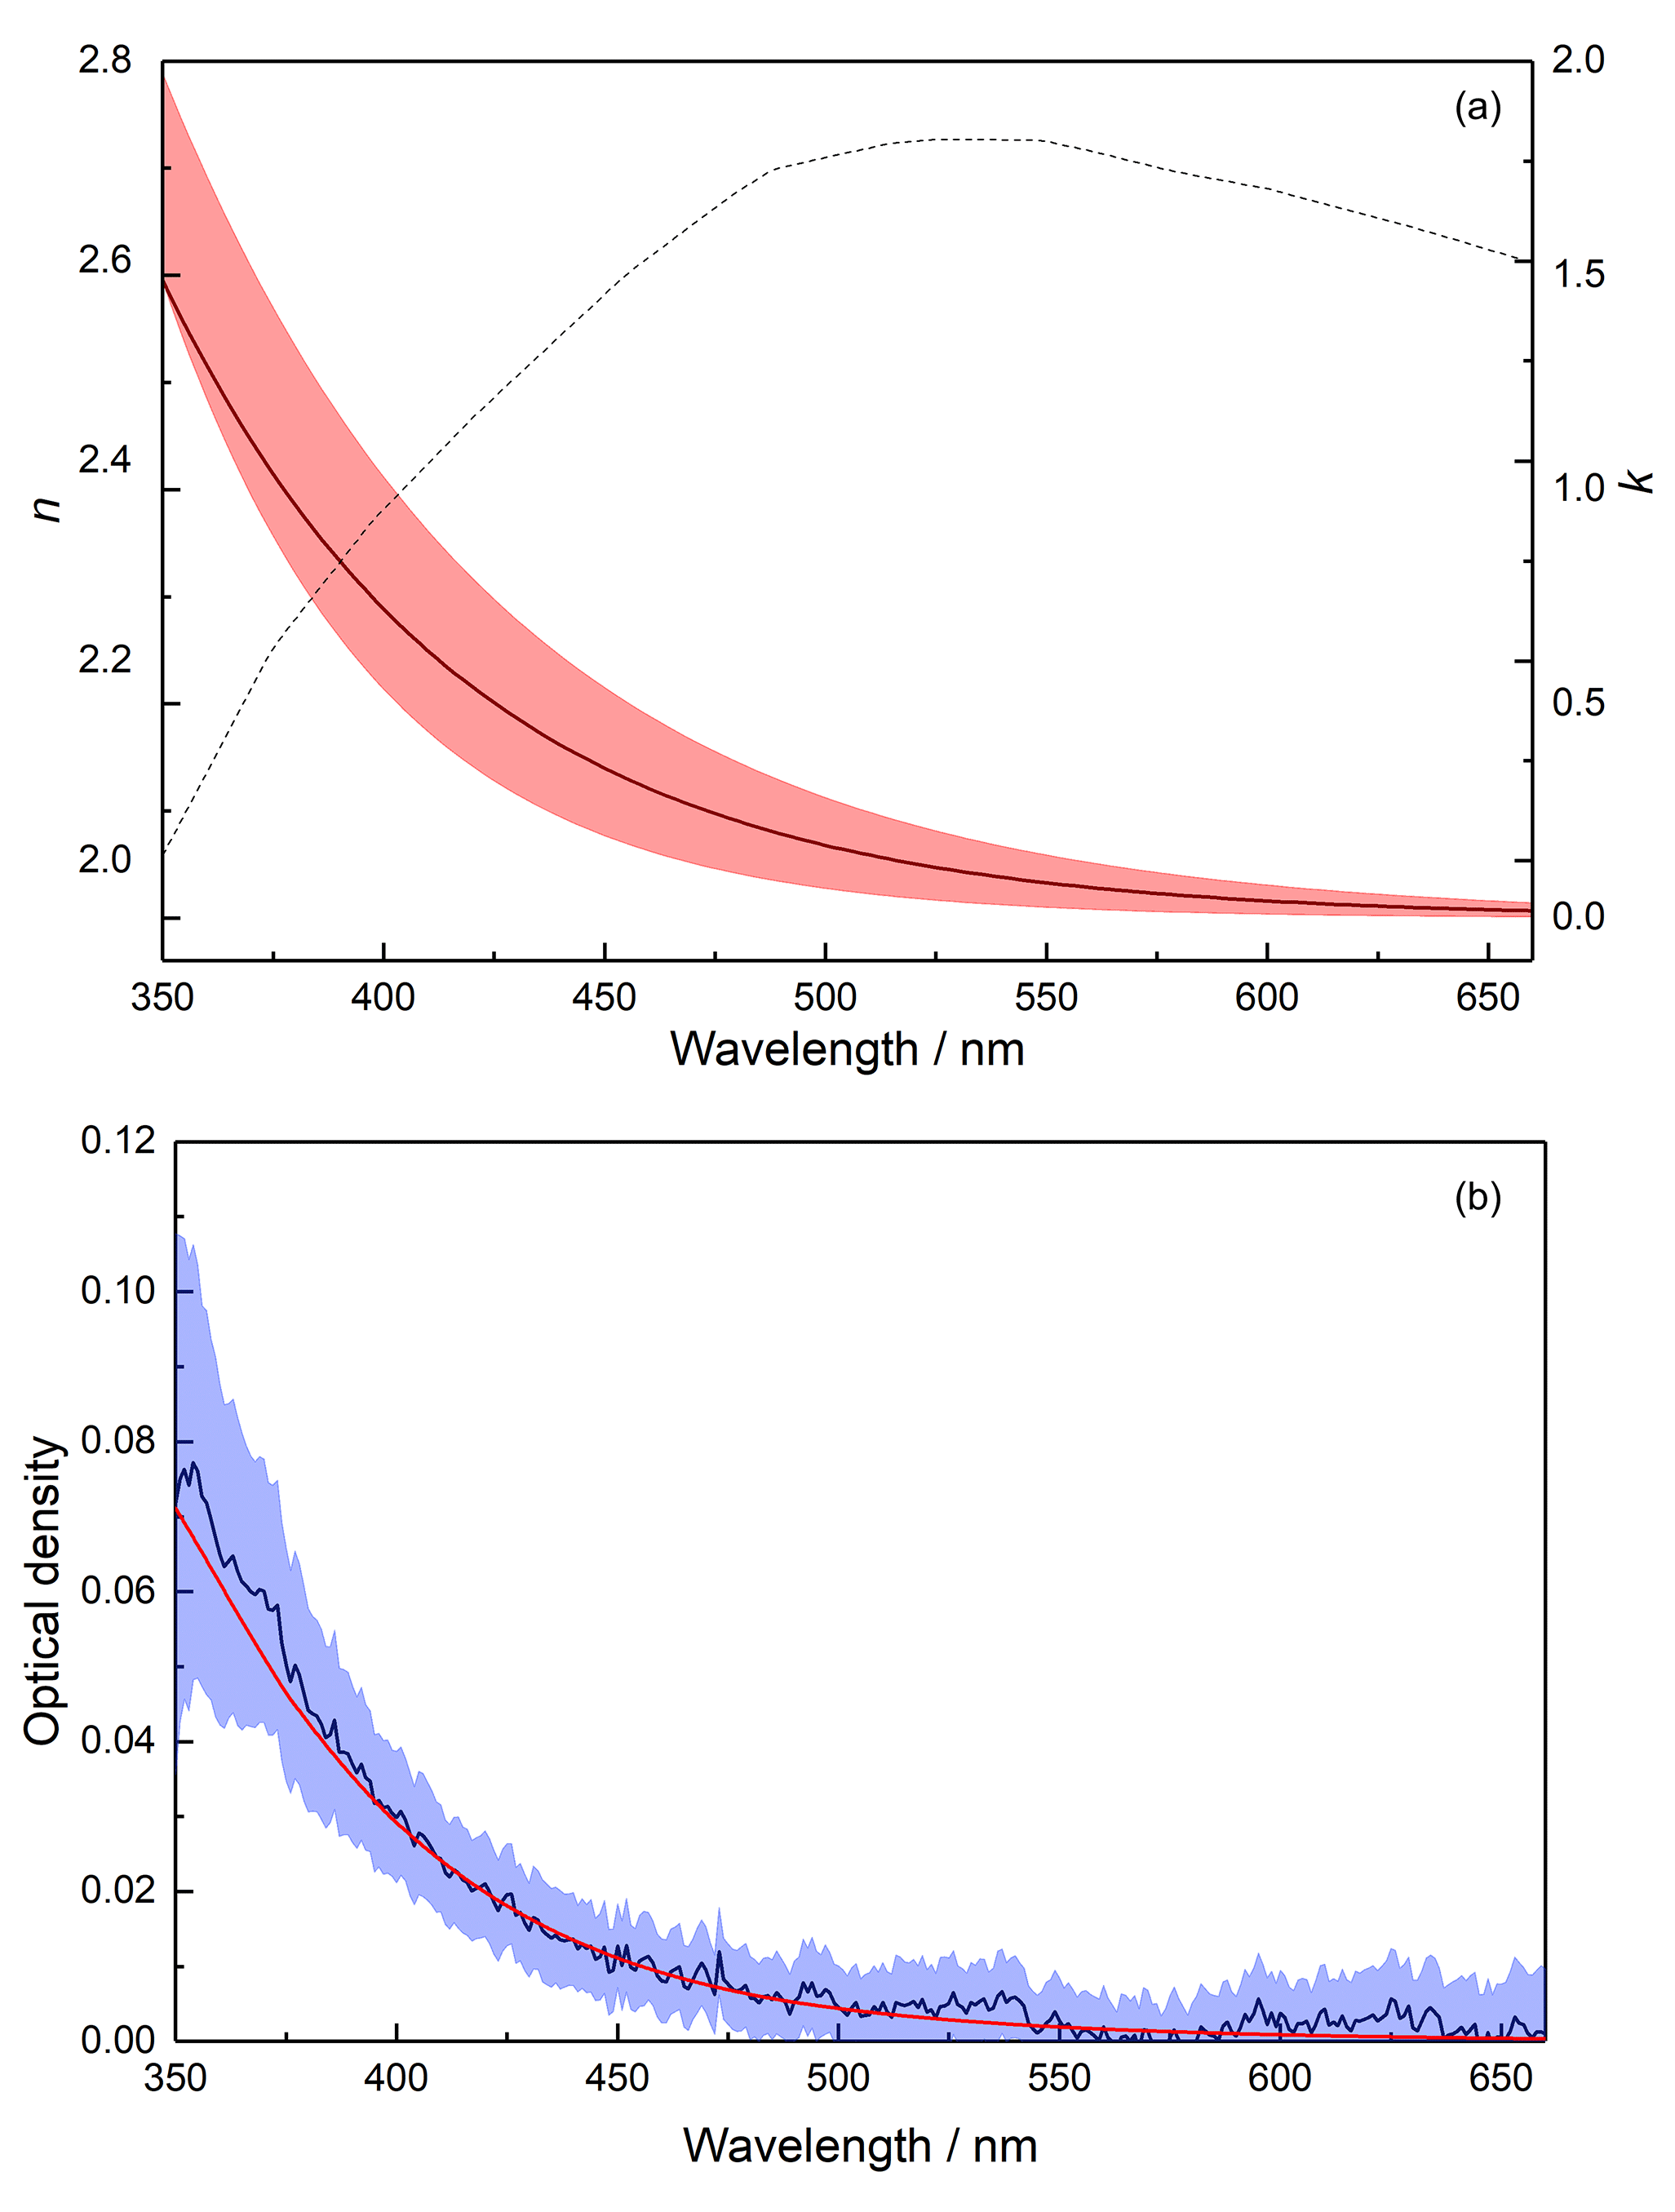
Figure 10(a) Real (n) and imaginary (k) RIs for maghemite particles (dashed and solid lines, respectively) with the uncertainty in k indicated with red shading. (b) Experimental OD (blue) and the calculated OD (red) using the wavelength-dependent RIs for maghemite particles.
Wavelength-dependent complex RIs have been derived for iron oxide meteoric smoke analogues generated under atmospherically relevant conditions using two different experimental systems. Analysis of particles collected from both experiments suggested a maghemite-like composition to be most likely, although, for the particles produced in the PAFS, a magnetite-like composition could not be definitively ruled out. Assuming the PAFS particles were indeed maghemite-like, data from the two experiments were combined using an iteration procedure to determine “best-fit” complex RIs that replicate both experimental datasets at 405 and 488 nm, and the absorption data at 660 nm. Values for the real RIs from the literature that generated the closest match to the measured extinction data (using the RDG approximation for 1.65 nm particles) were used with the best-fit data to determine the imaginary RIs at wavelengths between 350 and 660 nm.
Despite a number of iron oxides being considered as some of the most probable constituents of meteoric smoke, maghemite particles have not previously been investigated due to a lack of RIs available in the literature. Note that the production of maghemite-like particles in the laboratory using very different experimental conditions demonstrates the potential importance of this species in the atmosphere. Mesospheric metal chemistry leads to the formation of gas-phase precursors to MSPs such as iron oxides and hydroxides. The particle production method used in the PAFS mimics this: UV photolysis of Fe(CO)5 leads to the formation of gas-phase Fe, which reacts with O3 present in the system to form oxides such as FeO, FeO2 and FeO3. Particles were then allowed to freely agglomerate in the presence of O2 and O3 – as they would in the atmosphere. Since the two experiments use different iron precursors (Fe(CO)5 and Fe(C2H5)2), the choice of precursor does not appear to be a significant factor affecting the composition of particles formed. The PAFS operates at standard atmospheric pressure, and the MICE-TRAPS particles are produced at a much lower pressure of ∼60 mbar. Although still higher than in the upper mesosphere, the formation of similar particles in the two experiments suggests that pressure does not significantly change the particle properties. Lastly, in the PAFS experiments the O3:O2 ratio used is higher than in the atmosphere. However, the particles in the MICE-TRAPS apparatus are produced in the presence of O2 only and still form maghemite-like particles. As mentioned in the Introduction, the most likely candidates for smoke particles are iron oxides and silicates, but it is not known whether these occur in a single phase or separate distinct phases. For this reason, there is a need for further studies on the optical properties of maghemite.
The present study also demonstrates that the RDG approximation is more appropriate than Mie theory to model the optical properties of fractal-like MSPs, since Mie theory overpredicts the optical extinction by at least an order of magnitude across the wavelength range studied. This supports the earlier work of Saunders et al. (2007) and is important since current studies with the SOFIE satellite calculate MSP extinction using Mie theory for a distribution of spherical particles (Hervig et al., 2017). Nevertheless, the fact that the derived complex RIs generated good fits to both the absorption and extinction produced by crystalline and amorphous particles in the MICE-TRAPS and PAFS experiments, respectively, lends confidence to the idea that it is appropriate to use the RIs for bulk (crystalline) species to represent amorphous MSPs for the purposes of their characterization.
Though the complex RIs derived for the particles do not represent a unique solution to the wavelength dependence across the wavelength range studied, they provide good fits to both the experimental extinction and absorption in the two experiments. As such, since the important parameter for MSP characterization in the atmosphere is the particle extinction, these RIs should be applicable across this wavelength range (using different combinations of best-fit RIs incurs an error of < 0.4 % in the particle extinction at 405, 488 and 660 nm). However, in order for these RIs to be used with data from the SOFIE satellite, the wavelength range would need to be extended further into both ultraviolet and infrared wavelengths. With the current data, although extrapolation to a wavelength of 330 nm may be feasible, it is not possible to extrapolate to the other wavelengths currently used for SOFIE analysis (867 and 1037 nm); the difference in wavelength is too great, given the unpredictable variation in RIs usually observed across wide wavelength ranges. Nevertheless, the RIs could be used in global climate models to probe the optical properties of meteoric smoke and make comparisons to observations.
The refractive index data and Fe(CO)5 absorption spectrum are archived at the Leeds University PETAL (Petabyte Environmental Tape Archive and Library; http://www.see.leeds.ac.uk/business-and-consultation/facilities/petabyte-environmental-tape-archiveand-library-petal/, Plane, 2019). The data are also available upon request to John M. C. Plane.
The supplement related to this article is available online at: https://doi.org/10.5194/acp-19-12767-2019-supplement.
The PAFS experiments were designed by TA, AJ and JP and carried out by TA, who also performed the data analysis. The photochemical model was designed and written by TA, based on code written by JB. The MICE-TRAPS experiments were designed by MN, DD and TL. Experiments were carried out by MN and TA. MN performed the data analysis. TA prepared the manuscript with contributions from all co-authors. DD, JP and TL supervised the project.
The authors declare that they have no conflict of interest.
Tasha Aylett has a research studentship funded by the NERC SPHERES doctoral training programme, which included funding for a research placement at the Karlsruhe Institute of Technology (KIT), Institute of Meteorology and Climate Research. We would also like to thank Andy Brown at the Leeds Electron Microscopy and Spectroscopy Centre (LEMAS) for his invaluable help with the TEM, EDX and EELS analysis and for providing data for the iron oxide standards. We thank Dwayne Heard for the loan of the SMPS instrument.
This research has been supported by the Natural Environment Research Council (grant no. NERC SPHERES DTP).
This paper was edited by Franz-Josef Lübken and reviewed by two anonymous referees.
Bedidi, A. and Cervelle, B.: Light scattering by spherical particles with hematite and goethitelike optical properties: Effect of water impregnation, J. Geophys. Res.-Sol. Ea., 98, 11941–11952, https://doi.org/10.1029/93JB00188, 1993.
Brown, A. P., Moore, R. G. C., Evans, S., and Brydson, R.: Characterisation of iron oxide nanoparticles using EELS, Conference: Conference of the Electron-Microscopy-and Analysis-Group, 255–258, 2001.
Brown, A. P., Hillier, S., and Brydson, R. M. D.: Quantification of Fe-oxidation state in mixed valence minerals: a geochemical application of EELS revisited, J. Phys. Conf. Ser., 902, 012016, https://doi.org/10.1088/1742-6596/902/1/012016, 2017.
David, B., Pizurova, N., Schneeweiss, O., Santavá, E., Kudrle, V., and Jašek, O.: Gamma-Fe2O3 Nanopowders Synthesized in Microwave Plasma and Extraordinarily Strong Temperature Influence on Their Mossbauer Spectra, J. Nanosci. Nanotech., 12, 9277–9285, https://doi.org/10.1166/jnn.2012.6767, 2012.
DeCarlo, P. F., Slowik, J. G., Worsnop, D. R., Davidovits, P., and Jimenez, J. L.: Particle morphology and density characterization by combined mobility and aerodynamic diameter measurements. Part 1: Theory, Aerosol Sci. Tech., 38, 1185–1205, https://doi.org/10.1080/027868290903907, 2004.
Duft, D., Nachbar, M., Eritt, M., and Leisner, T.: A Linear Trap for Studying the Interaction of Nanoparticles with Supersaturated Vapors, Aerosol Sci. Tech., 49, 682–690, https://doi.org/10.1080/02786826.2015.1063583, 2015.
Fontijn, W. F. J., vanderZaag, P. J., Devillers, M. A. C., Brabers, V. A. M., and Metselaar, R.: Optical and magneto-optical polar Kerr spectra of Fe3O4 and Mg2+- or Al3+-substituted Fe3O4, Phys. Rev. B, 56, 5432–5442, https://doi.org/10.1103/PhysRevB.56.5432, 1997.
Henning, T. and Mutschke, H.: Low-temperature infrared properties of cosmic dust analogues, Astron. Astrophys., 327, 743–754, 1997.
Hervig, M. E., Brooke, J. S. A., Feng, W., Bardeen, C. G., and Plane, J. M. C.: Constraints on Meteoric Smoke Composition and Meteoric Influx Using SOFIE Observations With Models, J. Geophys. Res.-Atmos., 122, 13495–13505, https://doi.org/10.1002/2017JD027657, 2017.
Hsu, W. P. and Matijevic, E.: Optical properties of monodispersed hematite hydrosols, Appl. Optics, 24, 1623–1630, https://doi.org/10.1364/AO.24.001623, 1985.
Huffman, D. R. and Stapp, J. L.: Optical Measurements on Solids of Possible Interstellar Importance, in: Interstellar Dust and Related Topics, edited by: Greenberg, J. M. and Van De Hulst, H. C., Springer Netherlands, Dordrecht, 297–301, 1973.
Jacobson, M. Z.: Fundamentals of Atmospheric Modeling, 2nd edn., Cambridge Univ. Press, New York, 2005.
Jain, P. K., Xiao, Y. H., Walsworth, R., and Cohen, A. E.: Surface Plasmon Resonance Enhanced Magneto-Optics (SuPREMO): Faraday Rotation Enhancement in Gold-Coated Iron Oxide Nanocrystals, Nano Lett., 9, 1644–1650, https://doi.org/10.1021/nl900007k, 2009.
Longtin, D. R., Shettle, E. P., Hummel, J. R., and Pryce, J. D.: A Wind Dependent Desert Aerosol Model: Refractive Properties, Air Force Syst. Command, Air Force Geophys. Lab., Hanscom Air Force Base, USA, 115 pp., 1988.
Meinen, J., Khasminskaya, S., Eritt, M., Leisner, T., Antonsson, E., Langer, B., and Ruhl, E.: Core level photoionization on free sub-10-nm nanoparticles using synchrotron radiation, Rev. Sci. Instrum., 81, 085107, https://doi.org/10.1063/1.3475154, 2010a.
Meinen, J., Khasminskaya, S., Ruhl, E., Baumann, W., and Leisner, T.: The TRAPS Apparatus: Enhancing Target Density of Nanoparticle Beams in Vacuum for X-ray and Optical Spectroscopy, Aerosol Sci. Tech., 44, 316–328, https://doi.org/10.1080/02786821003639692, 2010b.
Nachbar, M., Duft, D., Mangan, T. P., Martin, J. C. G., Plane, J. M. C., and Leisner, T.: Laboratory measurements of heterogeneous CO2 ice nucleation on nanoparticles under conditions relevant to the Martian mesosphere, J. Geophys. Res.-Planet., 121, 753–769, https://doi.org/10.1002/2015JE004978, 2016.
Nachbar, M., Duft, D., Kiselev, A., and Leisner, T.: Composition, Mixing State and Water Affinity of Meteoric Smoke Analogue Nanoparticles Produced in a Non-Thermal Microwave Plasma Source, Z. Phys. Chem., 232, 635–648, 2018a.
Nachbar, M., Duft, D., and Leisner, T.: The vapor pressure over nano-crystalline ice, Atmos. Chem. Phys., 18, 3419–3431, https://doi.org/10.5194/acp-18-3419-2018, 2018b.
Nachbar, M., Wilms, H., Duft, D., Aylett, T., Kitajima, K., Majima, T., Plane, J. M. C., Rapp, M., and Leisner, T.: The impact of solar radiation on polar mesospheric ice particle formation, Atmos. Chem. Phys., 19, 4311–4322, https://doi.org/10.5194/acp-19-4311-2019, 2019.
Navrotsky, A., Mazeina, L., and Majzlan, J.: Size-driven structural and thermodynamic complexity in iron oxides, Science, 319, 1635–1638, https://doi.org/10.1126/science.1148614, 2008.
Plane, J. M. C.: Tasha_Photochem_data_ACP_1OCT2019, available at: http://www.see.leeds.ac.uk/business-and-consultation/facilities/petabyte-environmental-tape-archiveand-library-petal/, last access: 1 October 2019.
Plane, J. M. C., Feng, W., and Dawkins, E. C. M.: The Mesosphere and Metals: Chemistry and Changes, Chem. Rev., 115, 4497–4541, https://doi.org/10.1021/cr500501m, 2015.
Querry, M. R.: Optical Constants, Contractor report, , US Army Chemical Research, Development and Engineering Center (CRDC), Aberdeen Proving Ground, MD, USA, 415 pp., 1985.
Rapp, M., Strelnikova, I., Strelnikov, B., Hoffmann, P., Friedrich, M., Gumbel, J., Megner, L., Hoppe, U. P., Robertson, S., Knappmiller, S., Wolff, M., and Marsh, D. R.: Rocket-borne in situ measurements of meteor smoke: Charging properties and implications for seasonal variation, J. Geophys. Res.-Atmos., 115, D00I16, https://doi.org/10.1029/2009JD012725, 2010.
Rapp, M., Plane, J. M. C., Strelnikov, B., Stober, G., Ernst, S., Hedin, J., Friedrich, M., and Hoppe, U.-P.: In situ observations of meteor smoke particles (MSP) during the Geminids 2010: constraints on MSP size, work function and composition, Ann. Geophys., 30, 1661–1673, https://doi.org/10.5194/angeo-30-1661-2012, 2012.
Saunders, R. W. and Plane, J. M. C.: A laboratory study of meteor smoke analogues: Composition, optical properties and growth kinetics, J. Atmos. Sol.-Terr. Phy., 68, 2182–2202, https://doi.org/10.1016/j.jastp.2006.09.006, 2006.
Saunders, R. W. and Plane, J. M. C.: The formation and growth of Fe2O3 nanoparticles from the photo-oxidation of iron pentacarbonyl, J. Aerosol Sci., 41, 475–489, https://doi.org/10.1016/j.jaerosci.2010.02.009, 2010.
Saunders, R. W. and Plane, J. M. C.: A photo-chemical method for the production of olivine nanoparticles as cosmic dust analogues, Icarus, 212, 373–382, https://doi.org/10.1016/j.icarus.2010.12.019, 2011.
Saunders, R. W., Forster, P. M., and Plane, J. M. C.: Potential climatic effects of meteoric smoke in the Earth's paleo-atmosphere, L16801, 34, https://doi.org/10.1029/2007gl029648, 2007.
Self, D. E. and Plane, J. M. C.: A kinetic study of the reactions of iron oxides and hydroxides relevant to the chemistry of iron in the upper mesosphere, Phys. Chem. Chem. Phys., 5, 1407–1418, https://doi.org/10.1039/b211900e, 2003.
Sorensen, C. M.: Light Scattering by Fractal Aggregates: A Review, Aerosol Sci. Tech., 35, 648–687, https://doi.org/10.1080/02786820117868, 2001.
Tang, J., Myers, M., Bosnick, K. A., and Brus, L. E.: Magnetite Fe3O4 nanocrystals: Spectroscopic observation of aqueous oxidation kinetics, J. Phys. Chem. B, 107, 7501–7506, https://doi.org/10.1021/jp027048e, 2003.