the Creative Commons Attribution 4.0 License.
the Creative Commons Attribution 4.0 License.
 | 30 Sep 2019
Nonlinear behavior of organic aerosol in biomass burning plumes: a microphysical model analysis
Matthias Beekmann
Nikolai A. Golovushkin
Meinrat O. Andreae
Organic aerosol (OA) is a major component of smoke plumes from open biomass burning (BB). Therefore, adequate representation of the atmospheric transformations of BB OA in chemistry-transport and climate models is an important prerequisite for accurate estimates of the impact of BB emissions on air quality and climate. However, field and laboratory studies of atmospheric transformations (aging) of BB OA have yielded a wide diversity of observed effects. This diversity is still not sufficiently understood and thus not addressed in models. As OA evolution is governed by complex nonlinear processes, it is likely that at least a part of the observed variability in the BB OA aging effects is due to the factors associated with the intrinsic nonlinearity of the OA system. In this study, we performed a numerical analysis in order to gain a deeper understanding of these factors. We employ a microphysical dynamic model that represents gas–particle partitioning and OA oxidation chemistry within the volatility basis set (VBS) framework and includes a schematic parameterization of BB OA dilution due to dispersion of an isolated smoke plume. Several VBS schemes of different complexity, which have been suggested in the literature to represent BB OA aging in regional and global chemistry-transport models, are applied to simulate BB OA evolution over a 5 d period representative of the BB aerosol lifetime in the dry atmosphere. We consider the BB OA mass enhancement ratio (EnR), which is defined as the ratio of the mass concentration of BB OA to that of an inert tracer and allows us to eliminate the linear part of the dilution effects. We also analyze the behavior of the hygroscopicity parameter, κ, that was simulated in a part of our numerical experiments. As a result, five qualitatively different regimes of OA evolution are identified, which comprise (1) a monotonic saturating increase in EnR, (2) an increase in EnR followed by a decrease, (3) an initial rapid decrease in EnR followed by a gradual increase, (4) an EnR increase between two intermittent stages of its decrease, or (5) a gradual decrease in EnR. We find that the EnR for BB aerosol aged from a few hours to a few tens of hours typically increases for larger initial sizes of the smoke plume (and therefore smaller dilution rates) or for lower initial OA concentrations (and thus more organic gases available to form secondary OA – SOA). However, these dependencies can be weakened or even reversed, depending on the BB OA age and on the ratio between the fragmentation and functionalization oxidation pathways. Nonlinear behavior of BB OA is also exhibited in the dependencies of κ on the parameters of the plume. Application of the different VBS schemes results in large quantitative and qualitative differences between the simulations, although our analysis suggests also that the main qualitative features of OA evolution simulated with a complex two-dimensional VBS scheme can also be reproduced with a much simpler scheme. Overall, this study indicates that the BB aerosol evolution may strongly depend on parameters of the individual BB smoke plumes (such as the initial organic aerosol concentration and plume size) that are typically not resolved in chemistry-transport models.
Please read the corrigendum first before continuing.
-
Notice on corrigendum
The requested paper has a corresponding corrigendum published. Please read the corrigendum first before downloading the article.
-
Article
(2682 KB)
-
The requested paper has a corresponding corrigendum published. Please read the corrigendum first before downloading the article.
- Article
(2682 KB) - Full-text XML
- Corrigendum
- BibTeX
- EndNote


Atmospheric aerosol is known to play an important role as a climate driver on global and regional scales and to adversely affect human health. A large fraction of the aerosol mass is typically represented by organic components forming liquid, amorphous, or glassy particulate matter, which here is referred to as organic aerosol (OA). As a climate forcer, OA scatters solar radiation and provides cloud condensation nuclei, thus directly and indirectly contributing to cooling of the atmosphere on the global scale (IPCC, 2013; Lelieveld et al., 2019), although part of it, so-called brown carbon, can absorb sunlight, thus contributing to warming (see, for example, Andreae and Gelencsér, 2006; Feng et al., 2013; Jo et al., 2016). On a regional scale, of particular significance is the cooling effect of OA on climate in the Arctic (Sand et al., 2015), opposing the rapid increase in surface temperature that has been observed in recent decades (Bekryaev et al., 2010). As an agent of air pollution, OA constitutes a considerable fraction of fine particulates (PM2.5; Jimenez et al., 2009) that cause human health disorders and premature deaths (Pope et al., 2009; Burnett et al., 2018; Lelieveld et al., 2019). However, as evidenced by the large differences between the OA atmospheric budgets evaluated with different models and also by considerable discrepancies between simulations and observations of OA (see, for example, Tsigaridis et al., 2014; Bessagnet et al., 2016; Tsigaridis and Kanakidou, 2018), the current knowledge of the sources and atmospheric transformations of OA is still deficient, and corresponding modeling representations are very imperfect.
Open biomass burning (BB), i.e., vegetation fires and agricultural waste burning, provides a major source of OA on the global scale. Specifically, it has been estimated that BB emissions of primary OA (POA), which typically constitutes the predominant fraction of BB aerosol, contribute about 70 % of total POA emissions (Bond et al., 2013). In recent years, numerous studies have been aimed at investigating and modeling sources (e.g., May et al., 2013; Jathar et al., 2014; Konovalov et al., 2015; van der Werf et al., 2017), radiative effects (e.g., Saleh et al., 2013, 2015; Archer-Nicholls et al., 2016; Pokhrel et al., 2017; Yao et al., 2017), and atmospheric transformations (e.g., Cubison et al., 2011; Jolleys et al., 2012; Forrister et al., 2015; Shrivastava et al., 2015; Konovalov et al., 2015, 2017; Tsimpidi et al., 2018; Theodoritsi and Pandis, 2019) of BB OA and its components.
Both laboratory experiments and ambient observations suggest that the mass concentration of BB OA may undergo major, yet highly diverse, changes as a result of its aging under typical atmospheric conditions. These changes are commonly evaluated by means of the BB OA mass enhancement ratio (EnR), which is usually defined as the normalized ratio of the BB OA mass concentration to the concentration of an inert BB tracer. This normalization makes the EnR for freshly emitted aerosol equal to unity. In particular, considerable increases (in many cases exceeding a factor of 2) in EnR were found in smog chamber experiments after a few hours of photochemical aging of smoke from wood or grass burning (e.g., Grieshop et al., 2009; Hennigan et al., 2011; Tiitta et al., 2016; Ciarelli et al., 2017a; Fang et al., 2017; Ahern et al., 2019), although there has been a large diversity between results of individual chamber experiments. As a result of aircraft experiments conducted in North America around Mexico City and on the Yucatan Peninsula, significant increases in EnR have been reported by DeCarlo et al. (2008) and Yokelson et al. (2009) for aging BB plumes (from about 30 % up to a factor of 2). Konovalov et al. (2015) identified a substantial increase (by a factor of 2) in the enhancement ratio for mass concentration of particulate matter in smoke plumes after 1–2 d of transport over regions of eastern Europe. A similar major increase in the enhancement ratio for BB aerosol mass concentration, but over about 15 h of photochemical oxidation of BB plumes, was deduced from an analysis of satellite measurements of aerosol optical depth (AOD) over Siberia (Konovalov et al., 2017). Based on several years of continuous measurements of BB OA in an African savannah, Vakkari et al. (2018) found that EnR more than doubles on average after 3 h of daytime aging. However, there is also evidence that EnR may decrease or remain nearly constant in aging smoke plumes. For example, based on aircraft measurements, Akagi et al. (2012) identified a sharp decrease in EnR during the first hour after emissions. Using data from several field campaigns conducted in Australia, North America, and western Africa, Jolleys et al. (2012, 2015) found that the BB OA enhancement ratios in highly aged BB plumes (typically transported between 3 and 6 d before the measurements were taken) were consistently smaller than those in the fresh plumes. The aforementioned analysis of satellite data (Konovalov et al., 2017) suggested evidence for a gradual decrease in EnR after its initial strong increase. At the same time, several observational studies (e.g., Capes et al., 2008; Brito et al., 2014; Sakamoto et al., 2015; May et al., 2015; Zhou et al., 2017) did not reveal any significant net changes of EnR in aged BB plumes.
Numerous studies reported major changes in the chemical composition of BB OA due to its aging (e.g., DeCarlo et al., 2008; Cubison et al., 2011; Pratt et al., 2011; Jolleys et al., 2012, 2015; Brito et al., 2014; May et al., 2015; Bertrand et al., 2018; Lim et al., 2019) regardless of whether significant net changes were detected in the BB OA mass concentration or not. On the one hand, BB OA aging has been found to be typically associated with a rapid decay (over a period of a few hours under typical atmospheric conditions) of some key chemical compounds contributing to POA (such as, for example, levoglucosan): using aerosol mass spectrometry, such a decay, can be inferred from a decrease in the mass fragment signatures at m∕z 60 (e.g., May et al., 2015) as well as from a more comprehensive analysis at the molecular level (Bertrand et al., 2018). On the other hand, atmospheric processing of BB OA has been reported to result in strong enhancements of the oxidation state of the organic matter. The increases in the O:C ratio (due to addition of, for example, alcohol and carbonyl groups) are usually inferred from increases in the mass spectrometric signal at m∕z 44 (e.g., Brito et al., 2014; May et al., 2015; Fang et al., 2017) and can be indicative of secondary organic aerosol (SOA) formation. Note that changes in the chemical composition and oxidation state of OA particles can affect their hygroscopic and optical properties (e.g., Lambe et al., 2011; Adler et al., 2011; Akagi et al., 2012; Fan et al., 2019), which need to be adequately specified in chemistry-transport and climate models.
Useful insights into the possible reasons behind the large variability in the EnR trends reported earlier for aging BB aerosol have been provided by recent smog chamber experiments (Ahern et al., 2019; Lim et al., 2019) that revealed a strong dependence of SOA formation on variable initial concentrations of organic gases. These experiments, however, do not rule out the possibility that there are some other factors contributing significantly to the observed diversity of changes in EnR during the atmospheric lifetime of BB aerosol. In view of significant nonlinear interactions of the processes affecting properties, formation, and evolution of SOA (Shrivastava et al., 2017), it seems reasonable to expect that the diversity of observational findings concerning BB aerosol atmospheric aging can in part be due to nonlinear behavior of OA transformations. By nonlinear behavior, we mean here any manifestations of a dependence of the relative rate of change of OA mass concentration at a given moment of time on the mass concentration of OA itself at the current moment or previous moments.
In this study, we investigate qualitative nonlinear features of the behavior of OA within an isolated BB plume and attempt to reconcile some of the diverse observational findings concerning BB aerosol aging effects from a theoretical viewpoint. To this end, using some routines and interfaces of the CHIMERE chemistry-transport model (Menut et al., 2013), we developed and employed a microphysical dynamic (box) model of organic aerosol (MDMOA). While three-dimensional chemistry-transport models are intended to provide the best possible quantitative representation of the evolution of OA and its gaseous precursors from various anthropogenic and natural sources, the principal purpose of MDMOA is to isolate and simulate, under fixed ambient conditions, the effects of key processes responsible for chemical and physical transformations of OA from other complex processes affecting evolution of OA in the real atmosphere (such as mixing with aerosols and their gaseous precursors from multiple sources, vertical advection, dry and wet deposition, in-cloud processing, etc.). In this sense, our study is similar to several previous studies employing box models to study OA processes (e.g., Camredon et al., 2007; Lee-Taylor et al., 2011, 2015; Lannuque et al., 2018). Note that while the spatial scales representative of isolated BB plumes are typically not resolved by chemistry-transport models, simulations of a single BB plume with a box model can provide useful insights into possible uncertainties introduced by neglecting the spatial inhomogeneity of BB OA emissions in chemistry-transport models at the sub-grid scales. Furthermore, compared to smog chamber and dedicated field studies, a box-model analysis enables a much more comprehensive examination of the parameter space of the BB OA system.
It has been proposed that complex atmospheric transformations of OA (regardless of its origin), including SOA formation, can be adequately represented in chemistry-transport models within the volatility basis set (VBS) modeling framework (Donahue et al., 2006, 2011, 2012a; Robinson et al., 2007). This framework has been implemented in MDMOA. The VBS method involves splitting semi-volatile organic compounds (SVOCs), and the more volatile intermediate-volatility organic compounds (IVOCS), into several classes with respect to volatility and applying the absorptive partitioning theory (Pankow, 1994) to distribute the organic compounds between gas phase and particles. The SVOCs and IVOCs can also be distributed between several model types, depending, for example, on their oxidation state (O:C ratio), origin (e.g., primary or secondary, anthropogenic or biogenic, etc.), and photochemical age (Donahue et al., 2012a, b; Shrivastava et al., 2013; Tsimpidi et al., 2018). Representing the processes involving SVOCs and IVOCs within the VBS framework has been shown to allow improving the performance of simulations of OA from vegetation fires with respect to simulations using the “conventional” OA modeling framework, in which these processes are basically disregarded and only specific volatile organic compounds (VOCs) are considered to be precursors of SOA (Hodzic et al., 2010; Shrivastava et al., 2015; Konovalov et al., 2015, 2017). Based on simulations using the VBS method, it has also been argued (Konovalov et al., 2015, 2017) that disregard for the BB OA aging processes might be one of the main reasons for a strong underestimation of aerosol optical depth in BB plumes by chemistry-transport models using the conventional representation of OA evolution (e.g., Tosca et al., 2013; Konovalov et al., 2014, 2018; Reddington et al., 2016; Petrenko et al., 2017). It should be noted, however, that the representation of the BB OA evolution within the VBS framework in chemistry-transport models is still associated with major uncertainties: while a variety of VBS schemes of different complexities have been suggested for BB OA modeling (e.g., Grieshop et al., 2009; Koo et al., 2014; Shrivastava et al., 2015; Ciarelli et al., 2017a; Tsimpidi et al., 2018), any of these schemes has only partially been constrained by laboratory or ambient measurements. In view of these uncertainties, we performed our analysis using several different available VBS schemes.
Based on simulations of the first few hours of BB OA evolution with a similar microphysical box model, Bian et al. (2017) and Hodshire et al. (2019) showed that apart from oxidation, evaporation and condensation of SVOCs, BB OA dynamics is strongly affected by the dilution process. Hodshire et al. (2019) also pointed out a significant impact of the background aerosol on near-field BB OA aging processes. Accordingly, both dilution and entrainment of background aerosol are also taken into account in our model (although investigating the role of the latter process is not the focus of this study). Following Bian et al. (2017) and Hodshire et al. (2019), we approximate the dilution rate as a function of the initial plume size by using the formulations of the stationary Gaussian dispersion model and analyze the dependence of the BB OA mass enhancement ratio on the initial plume size, which controls the dilution rate. However, we considerably extend the period of analysis (up to 5 d), and instead of a simple single-step oxidation scheme that was used by Bian et al. (2017) to analyze atmospheric implications of short-run smoke chamber experiments and by Hodshire et al. (2019) to investigate the near-source relationships between parameters of diluting BB plumes and BB OA physical properties, we use several multi-step oxidation schemes that have been suggested for modeling of BB OA specifically within chemistry-transport models. Along with the dynamics of EnR, we consider the evolution of the hygroscopicity parameter, κ, which is commonly used to characterize the uptake of water by aerosol particles and their cloud condensation nucleus (CCN) activity (e.g., Petters and Kreidenweis, 2007; Chang et al., 2010; Mikhailov et al., 2015). The evolution of the hygroscopicity parameter, however, is not the main focus of this study.
By using MDMOA, we address the following questions. What are the manifestations of the OA system's nonlinearity in the dependencies of EnR and κ on the initial size and initial density of a smoke plume? Can variability in the parameters of the plume lead to qualitatively different types of BB OA evolution? Can differences between available VBS schemes be associated with qualitatively different responses of EnR to variations in the plume's parameters? It should be emphasized that our simple model and its application in this study are not intended to reproduce any realistic scenarios of atmospheric evolution of BB OA in a quantitatively accurate way. Instead, we focus our analysis on identification of possible qualitative features of the BB OA behavior, which may have a sufficiently general character. We believe that the results of this kind of analysis can be useful as theoretical guidance for future experimental studies and for improving parameterizations of BB OA processes in chemistry-transport models.
2.1 Microphysical dynamic model of organic aerosol (MDMOA): dynamic equations
The CHIMERE-based box model, MDMOA, is intended to represent the following processes: (1) growth and evaporation of multi-disperse particles of OA due to partitioning of SVOCs between gas phase and particles; (2) gas-phase oxidation of VOCs, IVOCs, and SVOCs; and (3) atmospheric dilution of OA. The model also includes a representation of coagulation, but this process has not been taken into account in the present study. MDMOA has been developed by adopting and modifying several modules of the CHIMERE chemistry-transport model (Menut et al., 2013), including the routines implementing the Gauss–Seidel iteration scheme (Verwer et al., 1994) to solve a set of dynamic equations, a sectional representation of the OA mass absorption and evaporation processes (Gelbard and Seinfeld, 1980), and some model interfaces facilitating modifications of the simulation configuration as well as providing simulation outputs in a convenient NetCDF format. Dynamic mass transfer equations for a semi-volatile species, s, in a particle size section, l, are formulated as follows:
where is the condensed-phase mass concentration, is the particle diameter, c and λ are the mean velocity and free path of the organic molecule in the air, F is the Fuchs–Sutugin correction factor, is the number of particles in the size bin l, is the instantaneous gas-phase concentration, K is the Kelvin effect factor, is the equilibrium gas-phase concentration, and and are the intersectional fluxes between the bins l−1 and l and between the bins l and l+1.
The molecular mean free path, the Fuchs–Sutugin correction factor, and the Kelvin effect factor are evaluated using the conventional formulations (Seinfeld and Pandis, 2016):
where D is the molecular diffusion coefficient, Kn is the Knudsen number (), α is the mass accommodation coefficient (which is assumed to be unity in all our simulations), σp and ρp are the surface tension and density of the particle material, MWs is the molecular weight, R is the ideal gas constant, and T is temperature. Following the basic formulations for the VBS framework, the gas-phase equilibrium concentration is expressed through the total mass concentration of SVOCs, Ctot, the mass fraction of a given species, fs, the total mass concentration of OA particles, COA, and the saturation concentration :
Note that the formulation of the mass flux term for transfer of SVOCs from and into the gas phase in Eq. (1) is essentially the same as that in the kinetic model used by May et al. (2013) to derive the volatility distributions for BB POA. Following May et al. (2013), we also assumed, for definiteness, that the diffusion coefficient, surface tension, and the particle bulk density are equal to m2 s−1, 0.05 N m−1 and 1.2×10³ kg m−3, respectively.
The intersectional fluxes are calculated according to Gelbard and Seinfeld (1980) as a combination of the weighed mass fluxes between the gas and particle phases for the bins l−1, l, and l+1. A concrete representation of the intersectional fluxes is not of significance in this study, since they cannot, by definition, contribute to the mass balance (their sum over the all particle size bins equals zero), and we do not consider here the evolution of the particle size distribution. Furthermore, as argued below, the equilibration timescales determined by Eq. (1) are typically much smaller than the timescales associated with oxidation of SVOCs, and so our simulations are not sensitive to the particle size distribution.
The dynamics of the total concentration (both in the gas phase and in particles), , of a given SVOCs species is driven by the following mass balance equations:
where is the oxidation reaction rate, [OH] is concentration of hydroxyl radical, VP is the volume of a BB plume, and Ps is the chemical production rate of s. The reaction rates and chemical processes specified in the model are described in the next section (Sect. 2.2). Note that Eq. (6) for several different species composes an essentially nonlinear system. In particular, not only does in thermodynamic equilibrium depend nonlinearly on the total aerosol concentration, COA, in accordance with Eq. (5), but COA itself also depends in a complex nonlinear manner on the total concentrations, , of all SVOCs. Furthermore, Ps is determined by the gas-phase concentrations of SVOCs, too, and therefore depends nonlinearly on both and COA.
Representation of the dilution process (described in Eq. 6 by the term proportional to ) in our simulations largely follows Bian et al. (2017). Specifically, we assume that all the species considered are uniformly distributed within a box with a half width of 2σy across the wind direction and a half thickness of 2σz in the vertical. The thickness of the box in the wind direction does not need to be explicitly specified in our simulations (but just for definiteness, it can be assumed to be equal to 1 m). The evolution of σy and σz is represented by the power law expressions according to Klug et al. (1969; see also Seinfeld and Pandis, 2016) for the neutral (D) Pasquill atmospheric stability class. The plume is assumed to be transported along the wind direction with a constant speed of 5 m s−1. The initial width of the plume (4σy) is considered to be a control parameter, Sp, in our simulations. The initial plume width, Sp, can also be interpreted as the across-wind width of the area affected by the fire. The initial value of σz is expressed as a function of σy. It is assumed that the plume's thickness in the vertical direction (4σz) cannot exceed the mixed layer height, which is fixed at 2500 m: that is, once σz calculated according to Klug et al. (1969) reaches 625 m, the plume is allowed to disperse only in the horizontal direction. Such a simple representation of the plume's evolution is by no means intended to be quantitatively accurate under any real conditions but is used mainly to roughly characterize a dependence of the temporal scale of the dilution process on the horizontal spatial scale of a BB plume, especially during the first few hours of evolution.
2.2 Representations of BB OA oxidation processes and gas–particle partitioning in MDMOA
To take into account the existing ambiguity associated with the representation of the oxidation of organic matter within the VBS framework, we performed our simulations using several VBS schemes of varying complexity. A summary of the main features of the schemes and their reference codes is provided in Table 1. We also used a conventional OA scheme that assumes that POA is composed of nonvolatile species. Below we describe the schemes in more detail.
Table 1Reference codes and main features of the BB OA modeling schemes used in the simulations. SVOC: semi-volatile organic compound. VOC: volatile organic compound. POG: primary organic gas. SOG: secondary organic gas. POA: primary organic aerosol. SOA: secondary organic aerosol. C*: saturation mass concentration. βfrag: fragmentation branching ratio.
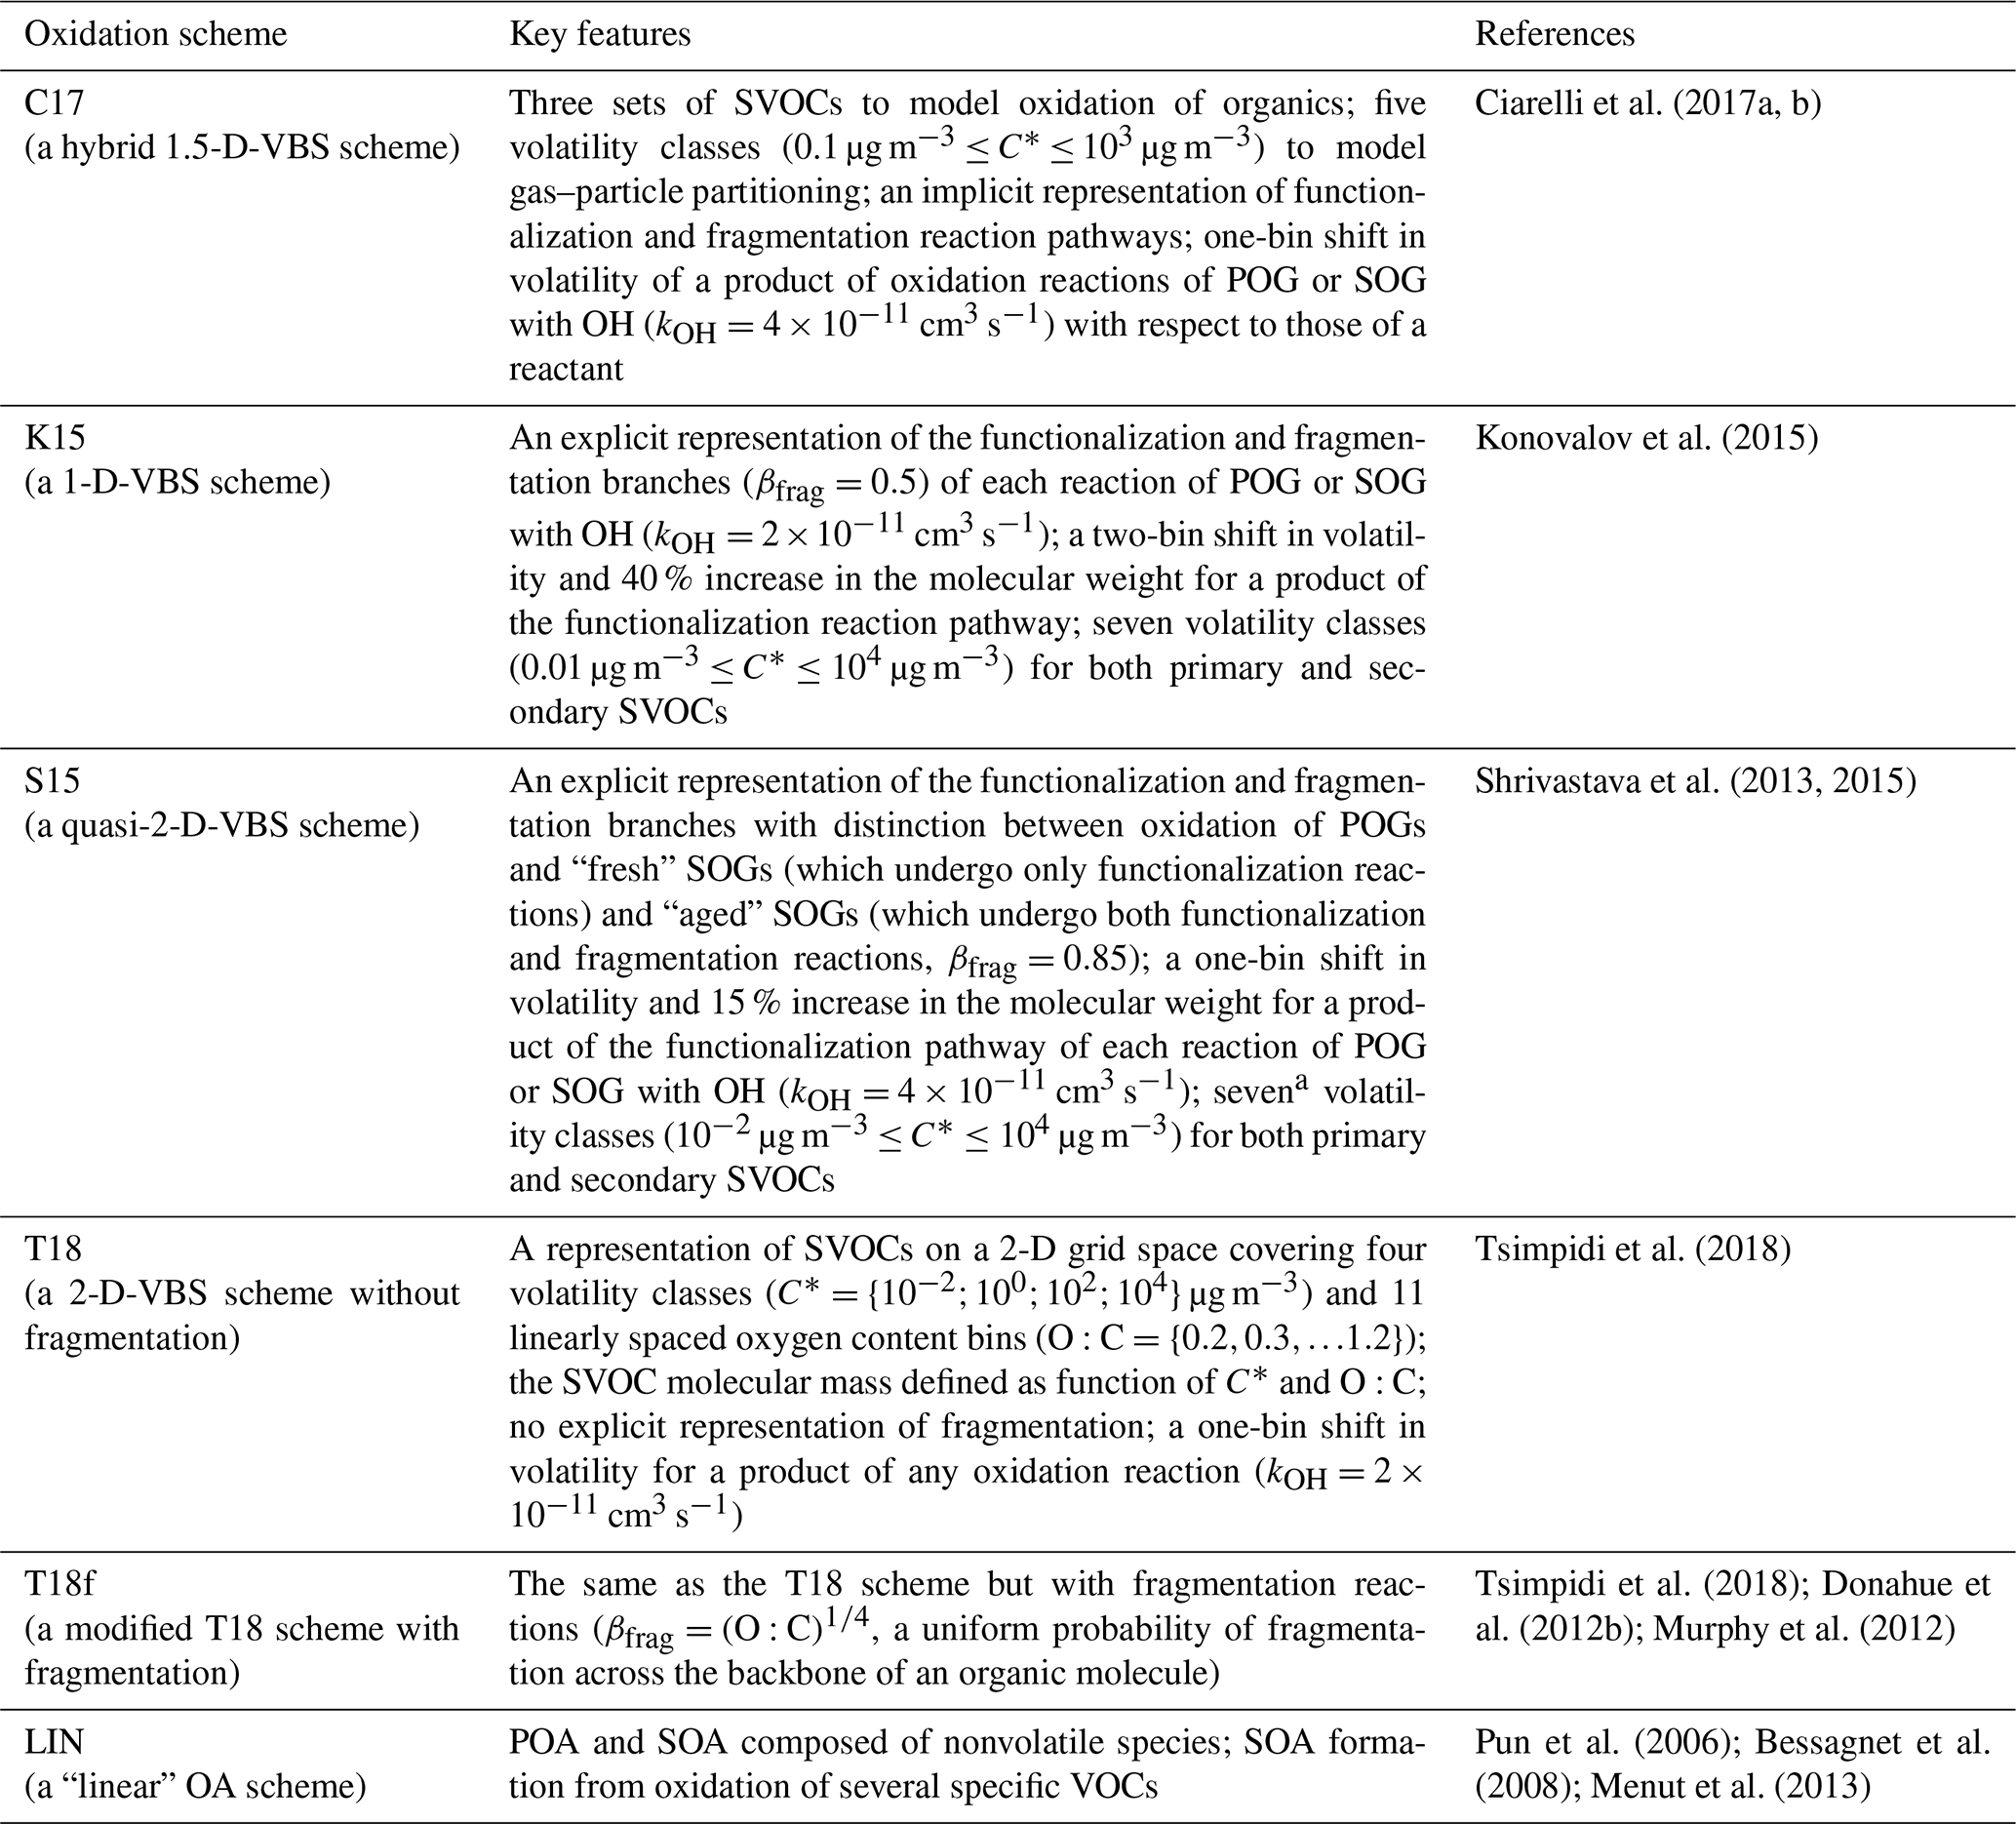
a Note that the original VBS scheme (Shrivastava et al., 2015) involves only five volatility classes.
The scheme “C17” has been described and evaluated by Ciarelli et al. (2017a, b). It is a relatively simple scheme which has been referred to as a hybrid 1.5-dimensional VBS (1.5-D-VBS) and is based on a similar scheme proposed by Koo et al. (2014). The idea behind this scheme is to characterize sources, volatilities, chemical transformation, and oxidation state of a complex mixture of SVOCs by considering several surrogate species which are given average molecular compositions and molecular weights. The scheme distinguishes between three sets of the surrogate species, i.e., the POA set (set 1), the set containing oxidation products from reactions of hydroxyl radical with semi-volatile gases from POA (set 2), and the SOA set (set 3) representing products of reactions of OH with any VOCs (and, implicitly, also IVOCs). Semi-volatile gases from sets 2 and 3 are also allowed to react with OH, with the volatility of the product being an order of magnitude lower than that of the reactant. The different reaction products have different molecular weights and are assumed to represent the net effects of the actual functionalization and fragmentation reactions (neither of which are specified explicitly). All SVOCs are represented using five volatility classes covering the volatility range from 10−1 to 103 µg m−3. The reaction rate (kOH) is fixed at cm3 molec−1 s−1 for all the oxidation reactions. Some parameters of the scheme have been optimized by fitting box-model simulations to the data from several aging experiments with BB aerosol from stove wood combustion (Ciarelli et al., 2017a). Based on the optimization results, the average ratio of the initial total mass concentrations of VOCs and SVOCs was set at 4.75. The scheme was then implemented into a chemistry-transport model and successfully evaluated against ambient measurements performed with an aerosol mass spectrometer (AMS) across Europe, specifically in situations where a considerable part of OA originated from residential wood burning (Ciarelli et al., 2017b). Note, however, that the composition and conditions of atmospheric aging of OA from residential wood burning are not necessary representative of those of OA from vegetation fires.
The scheme “K15” is a one-dimensional (1-D) scheme that was introduced by Konovalov et al. (2015) in an air pollution case study to represent atmospheric aging of BB OA from the 2010 Russian fires. It combines one of the simplest 1-D schemes (Grieshop et al., 2009), in which only functionalization reactions have been taken into account, and a more complex scheme in which both functionalization and fragmentation processes are taken into account (albeit in a very simplified manner) and which is referred below as the scheme “S15” (Shrivastava et al., 2013, 2015). The oxidation processes are described using a volatility grid that includes seven bins ( µg m−3). The scheme distinguishes between oxidation of primary organic gases (POGs), which is assumed to result only in functionalization, and oxidation of secondary organic gases (SOGs), which is assumed to include both functionalization and fragmentation branches. The products of the functionalization branch get their mass increased by 40 % and the volatility reduced by 2 orders magnitude with respect to those of the reactants. Specifically, oxidation of POG and SOG from volatility bin i is represented as follows:
where LCN denotes the highly volatile low carbon-number species that are the products of the fragmentation branch, and all the species are assumed to have the same molecular weight (250 g mol−1). Along with LCN, the fragmentation branch yields SOG in the highest volatility bin. While LCN species are not allowed to participate in any reactions, SOG species can be reprocessed according to Eq. (8). Note that oxidation of SOGs results in a net increase in the organic mass, although Eq. (8) formally corresponds to a fragmentation branching ratio (Jimenez et al., 2009) of 0.5. Note also that the simulations reported by Konovalov et al. (2015) included the transformation of condensed-phase SOA into nonvolatile SOA (NVSOA) and indicated that this process had only a small impact on the simulated evolution of BB aerosol in the case considered. In view of the lack of robust knowledge about the condensed-phase processes (see also Sect. 4) and for consistency with the other numerical experiments performed in the present study, the transformation of SOA into NVSOA has been disregarded in our simulations.
The scheme “S15” is a slightly modified version of the VBS scheme that was proposed by Shrivastava et al. (2013) and adopted, as part of a global chemistry-transport model, for BB aerosol modeling in a subsequent study (Shrivastava et al., 2015). Unlike the original VBS scheme by Shrivastava et al. (2013, 2015), where only five volatility classes are used for computational reasons, the volatility basis set in the S15 scheme is specified using the same seven volatility bins as in the K15 scheme for the sake of easier interpretation of differences between the respective simulation results. The S15 scheme can be regarded as a quasi-two-dimensional scheme, as it realizes a computationally efficient way to account for the increasing probability of fragmentation reactions with BB OA aging (and, implicitly, with increasing oxidation state) of BB OA by distinguishing between different generations, n, of SOA precursors. Specifically, while POGs and the first two generations of SOGs are assumed to undergo only functionalization reactions,
the third and further generations undergo both functionalization and fragmentation reactions:
where βfr is the fragmentation branching ratio, which in this case is assumed to be equal to 0.85.
According to Eqs. (9)–(11), the functionalization reactions of both POGs and SOGs yield SOG species in the next lower-volatility bin and result in an increase in the molecular weight by 15 %. Similar to the K15 scheme, all the VBS species are assumed to have the same molar mass of 250 g mol−1. On the basis of the OA oxidation scheme described above, Shrivastava et al. (2015) defined the two modeling configurations, FragSVSOA and FragNVSOA, with SOA treated as semi-volatile or nonvolatile, respectively. The simulations performed in this study with the S15 scheme involved only the FragSVSOA configuration. This configuration enables better consistency of the S15 scheme with the other VBS schemes considered here, and thus any differences between the simulations performed with the S15 scheme and the other schemes are easier to interpret. When choosing the FragSVSOA configuration, we also took into account that global-model simulations involving this configuration were found by Shrivastava et al. (2015) to agree better with both surface observations of OA at a South Africa measurement site positioned to investigate BB aerosol and with satellite observations of aerosol optical depth on the global scale than the simulations with the FragNVSOA configuration. Possible formation of NVSOA due to particle-phase reactions (e.g., Barsanti and Pankow, 2004; Jang et al., 2002; Shiraiwa et al., 2013b) is one of the factors (see Sect. 4) that can affect the real BB OA evolution, but these were not analyzed in this study, which focused on identification of major qualitative nonlinear effects in the BB OA behavior due to gas-phase oxidation reactions in BB plumes.
Scheme “T18” is a two-dimensional (2-D) VBS scheme that is adopted (with minor modifications) from Tsimpidi et al. (2018), where it has been introduced as part of the ORACLE v2.0 aerosol module of the ECHAM/MESSy Atmospheric Chemistry (EMAC) global model. The scheme represents the oxidation of BB OA on the 2-D-VBS grid constructed in the space of the volatility and the oxygen content (O:C ratio). The volatility dimension is discretized into four bins, µg m−3, and the oxygen content dimension is divided into 11 O:C bins covering the O:C values from 0.2 to 1.2, with a constant step of 0.1. The smallest value of the O:C ratio is assumed to be representative of fresh BB emissions and is attributed to POA. Each species is identified with a representative number of carbon atoms per molecule, nc, and with a molecular weight, MW, evaluated using structure–activity relationships (Pankow and Asher, 2008; Donahue et al., 2011) and an approximation of the hydrogen-to-carbon atomic ratio (Heald et al., 2010) as follows:
Oxidation of POG (or SOG) species is assumed to result in addition of two or three oxygen atoms to their molecules with an equal probability. The O:C ratio of the products is therefore evaluated as follows:
where ΔO (equal to 2 or 3) is an assumed increment of the oxygen atomic content. The product is assumed to belong to the next lower-volatility class with respect to the volatility class of the reactant. Similar oxidation reactions also apply to POG and SOG species from the lowest-volatility class except that the products of these reactions keep the volatility of the reactants. Fragmentation reactions are not explicitly taken into account. As noted by Tsimpidi et al. (2018), neglecting fragmentation may result in overestimation of OA concentration at long aging timescales. However, it should also be noted that since nc can decrease as a result of an oxidation step in accordance with Eq. (12), the fragmentation pathway is, to some extent, taken into account in the T18 scheme implicitly.
Along with similar 2-D-VBS schemes for anthropogenic and biogenic OA, the T18 scheme described above has been used for multi-year simulations of OA with the EMAC model, and the simulation results were compared against AMS measurements at urban downwind and rural environments in the Northern Hemisphere (Tsimpidi et al., 2018). However, the comparison results did not provide enough information about the performance of the T18 scheme in simulations of OA specifically from BB sources.
The last VBS scheme that we used, “T18f”, is our modification of the original T18 scheme. It has been obtained for this study by adding explicit fragmentation pathways to the original T18 scheme so that any POG or SOG species considered in the T18 scheme is assumed to participate in both functionalization and fragmentation reactions. The reactions originally included in the T18 scheme are assumed (for simplicity) to represent only the functionalization pathways. The probability of a given pathway is controlled by the fragmentation branching ratio, βfrag, which is parameterized as follows (Jimenez et al., 2009; Donahue et al., 2012b):
Following Murphy et al. (2012), we assume that splitting of an organic molecule as a result of fragmentation reactions occurs with a uniform probability at any site throughout its carbon backbone. Accordingly, a fragmentation reaction of any species containing (according to Eq. 12) nc carbon atoms can potentially yield (if nc is an odd number) or nc∕2 (if nc is an even number) different (with respect to the atomic carbon content) products. Furthermore, consistently with the assumptions underlying the original T18 scheme, we assume that as a result of any oxidation reaction, one of the two fragments receives two or three additional oxygen atoms, and so its O:C ratio increases in accordance with Eq. (14) except that the atomic carbon number of the reactant in the right-hand part of the equation should be substituted for that of the product. The O:C ratio of the other fragment is kept the same as that of the reactant. If the calculated O:C ratio of a product exceeds 1.2 (that is, the maximum value covered by the O:C grid considered), this product is assumed to be irreversibly lost in the gas phase. All possible pairs of fragmentation products described above are introduced in the corresponding mass balance equations (see Eq. 6). The stoichiometric coefficients for the products in the functionalization, , and fragmentation, , pathways are evaluated as follows:
where and are the total numbers of possible products in the functionalization and fragmentation pathways, respectively.
Finally, we also consider a linear analogue to the above nonlinear representations of BB OA evolution. The scheme “LIN” is based on a simple oxidation scheme (Pun et al., 2006; Bessagnet et al., 2008) designed in the framework of the conventional approach to representation of OA evolution and SOA formation and implemented in the CHIMERE model. The key assumptions underlying this scheme are that POA is composed of nonvolatile species and that SOA is formed from oxidation of several specific (“traditional”) volatile precursors that were identified earlier in smog chamber experiments (Odum et al., 1997). In this study, the original scheme described in detail by Menut et al. (2013) was simplified (linearized) by assuming that all oxidation products are nonvolatile. The emission factors from Andreae (2019) for the boreal forest were used to specify initial concentrations of POA precursors as a function of the initial concentration of BB OA. Note that the original SOA formation scheme from the CHIMERE model was earlier used in the simulations of evolution of BB aerosol from Russian fires (Konovalov et al., 2015, 2017, 2018) and was found to produce rather negligible amounts of SOA in BB plumes.
It should be stressed that the different VBS schemes outlined above certainly do not comprise all known mechanisms and pathways of oxidation of organic compounds composing BB OA. Nonetheless, consideration of even a limited spectrum of available representations of the BB OA aging processes allows us to gain a useful insight into the uncertainty associated with simulations of BB OA aerosol evolution using the VBS framework. Some processes which could further enhance the diversity of our simulations of BB OA evolution are briefly discussed in Sect. 4.
2.3 Configuration of the numerical experiments and processing of output data
MDMOA was run using each VBS scheme described above for a period of 120 h. This period has been chosen to be within the range of typical atmospheric lifetimes of submicron aerosol particles emitted from open vegetation fires in the major BB regions worldwide, as indicated, for example, by a measurement-based estimate (5.1 d) of the lifetime of black carbon (BC) in Siberia (Paris et al., 2009) and global-model estimates of the BC lifetimes for open fires in northern Africa (5.6 d) and northern South America (3.1 d; Wang et al., 2016). A part of the simulation period (7 h d−1) was assumed to correspond to nighttime conditions when any oxidation processes were disabled (OH concentration in Eq. 6 was set to be zero); such a nighttime duration is typical, for instance, for central Siberia in summer.
The initial conditions for SVOCs in particles and in the gas phase correspond to the gas–particle equilibrium determined in accordance with the partitioning theory. Specifically, the gas-phase initial concentration for a species s was calculated using Eq. (5), where the OA mass concentration was assumed to include, along with the BB fraction, a background OA concentration, Cbg, of 5 µg m−3. The same background OA concentration had been specified in the box-model simulations performed by Bian et al. (2017). For comparison, particulate matter (PM10) in a boreal environment of central Siberia under background conditions (that is, without the detectable influence of local or regional pollution sources, including fires) was found by Mikhailov et al. (2017) to have concentration ranging from about 2 to 10 µg m−3 in summer, being composed mostly of organic material. Therefore, the background OA concentration in our simulations can be assumed to be representative of typical background conditions in Siberian boreal forest in summer. Note that specifying a much larger or much smaller value of Cbg would likely result in noticeable quantitative changes of the simulated BB OA behavior, since entrainment of background aerosol affects evaporation rates and gas–particle partitioning in a BB plume (Hodshire et al., 2019). The total mass concentration of SVOCs, Ctot, that is involved in Eq. (5) was evaluated as follows:
where fi defines the mass fraction of all species in bin i of the volatility distribution, and C0 is the initial BB OA concentration. C0 is considered – along with the initial plume size, Sp – to be a control parameter in our simulations. Test experiments (see Sect. 3.1) have shown that the characteristic timescales for the adjustment to the “local” thermodynamic equilibrium are short (seconds or minutes) compared to the timescales associated with the oxidation processes (hours). The background aerosol concentration was not affected by any process except for the intersectional fluxes and so was basically kept constant in all the simulations.
The volatility distribution for all our experiments with the K15 and S15 schemes (in which the volatility grid includes seven bins) was adopted from the study by Konovalov et al. (2015): at a temperature of 298 K. This distribution is consistent (within the range of uncertainties) with the data from thermodenuder measurements of BB emissions (May et al., 2013). The volatility distributions for the C17, T18, and T18f schemes were obtained from the same distribution by disregarding or aggregating the corresponding volatility bins.
In the experiments with the C17, K15, S15, and LIN schemes, the aerosol size distribution was modeled using nine size bins covering the range from 20 nm to 10 µm and following a geometric progression with the common ratio of 5001∕9 (≈2.0). To limit the computational time, the experiments with the T18 and T18f schemes were conducted using only three size bins that were defined to cover the same range (from 20 nm to 10 µm) using a geometric progression with the common ratio of 5001∕3 (≈7.9). In all cases, we used a log-normal distribution with a mass mean diameter of 0.3 µm and a geometric standard deviation of 1.6 (Reid et al., 2005). While the size distribution can affect the timescales for evaporation and growth of particles, these timescales, as noted above, are much smaller than those associated with chemical aging. Accordingly, in all our simulations, the results of the simulations have been practically independent of the assumed particle size distribution (except for a very minor influence of the Kelvin effect). Note that the representation of nonequilibrium processes in accordance with Eq. (1) has been included in MDMOA mainly to enable simulations of the evolution of BB aerosol optical properties in prospective studies.
In accordance with Bian et al. (2017) and Hodshire et al. (2019), we assume that the OH concentration does not depend on the initial parameters of the plume and does not change as the plume evolves. Based on the in-plume measurements by Akagi et al. (2012), its value was set to 5×106 cm−3 in all our simulations, which is larger than the value (1.08×106 cm−3) specified in the simulations by Bian et al. (2017) and Hodshire et al. (2019). Assuming a lower or higher constant value of the OH concentration would slow down or speed up chemical evolution of BB OA in our simulations but is not expected to alter major qualitative nonlinear features of the BB OA behavior, which are the focus of this study. Like Bian et al. (2017) and Hodshire et al. (2019), we assumed a constant temperature of 298 K within the plume, thus making any assumptions regarding enthalpies of vaporization of SVOCs unnecessary. The concentration of OH within real BB plumes can be affected by many factors (such as, for example, the UV flux, the concentrations of nitrogen oxides, and VOCs within the plume) which cannot be unambiguously simulated within our box model. Variability in these factors can cause variability in the OH concentration levels across different plumes as well as temporal and spatial fluctuations of the OH concentration within a given plume. In particular, attenuation of the downwelling UV flux within dense plumes (Hobbs et al., 2003) can suppress both the OH levels and SOA formation rates (Konovalov et al., 2016). Temperature is also likely to vary, both spatially and temporally, within real-world BB plumes. In particular, it is likely to be lower in the upper part of a plume than near the surface (Hodshire et al., 2019). All possible variability and inhomogeneities of the OH concentration and temperature are disregarded in our simulations. Our study is therefore limited in this respect, but this limitation allowed us to isolate and investigate the internal dynamics of the BB OA system under fixed predefined conditions.
Along with aerosol species, MDMOA has been configured to simulate the evolution of a special tracer which is intended to represent the evolution of the BB OA mass concentration in a hypothetical situation where BB aerosol is composed of chemically inert and nonvolatile components. Accordingly, the tracer has been introduced into our model as a chemically inert species that can be affected only by dilution (since dry and wet deposition processes were not considered in our simulations), and the behavior of the tracer's mass concentration was controlled only by the parameter Sp (initial plume size). The tracer's initial mass concentration in all our simulations was the same as that of BB OA (that is, C0). The molecular weight of the tracer has been set to be the same as that of carbon monoxide (CO). Note that the concept of analyzing the evolution of BB aerosol versus the evolution of an inert tracer (usually represented by CO) has been fruitfully exploited in many previous experimental and modeling studies of BB aerosol (e.g., Akagi et al., 2012; Konovalov et al., 2015; Bian et al., 2017; Vakkari et al., 2018). Figure 1 shows the dynamics of the mass concentration of the inert tracer for several different values of Sp according to our simulations. Consistent with the tracer dynamics demonstrated by Bian et al. (2017), our simulations indicate that the initial plume size may have a major impact on the subsequent plume evolution (and thus on the BB OA mass concentration). In particular, whereas the tracer concentration drops by 4 orders of magnitudes during the evolution of a plume with the smallest value of Sp (100 m), it keeps a practically constant value (decreasing by less than 3 %) within the largest plume considered (with Sp of 100 km). Note that for the plumes with Sp smaller than 3 km, the largest changes of tracer concentration occur during the first 5 h of evolution; afterwards, the changes are relatively small and are not of significance for the results of this study. It should be emphasized that our simulations of the BB plume dispersion were not intended to be fully realistic and quantitatively accurate. Rather, we used a simple plume dispersion model (which is formally not applicable at timescales exceeding a few hours and has many other limitations) just to specify several definite scenarios for the dilution process, with strongly different dilution rates during the initial stage of the BB plume evolution.
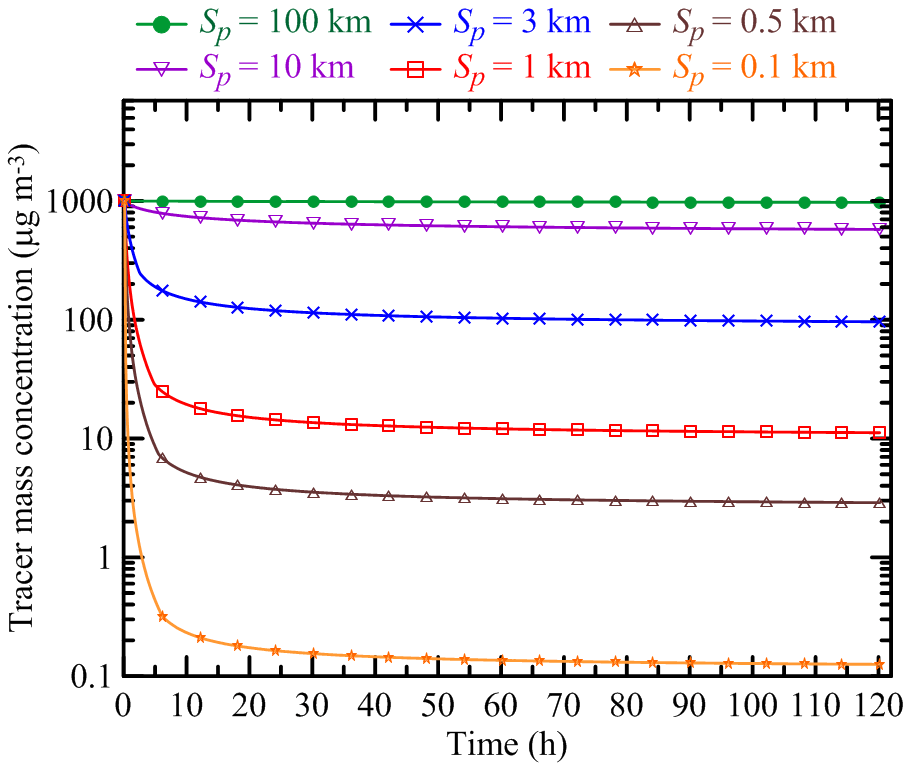
Figure 1Simulated evolution of the mass concentration of an inert tracer for different values of the initial plume size, Sp. The simulations were done with an initial tracer concentration of 1000 µg m3.
Using the simulated tracer mass concentration (Tr), we evaluated the BB OA mass enhancement ratio (abbreviated as EnR throughout this paper and also denoted as γa below) at a given time t as follows:
where COA(t) is the total OA mass concentration. Note that γa is analogous to the “inert OA mass enhancement ratio” introduced by Bian et al. (2017). Since the initial concentration of the tracer was set to be the same as the initial concentration of BB OA, the initial value of γa in our simulations was always equal to 1 without using any additional normalization (which is usually involved in similar definitions of EnR used in chamber and field studies). The simulations were performed with a sufficiently small nominal time step of 1 s. Based on some test simulations performed with smaller time steps, we estimate that the numerical error in γa does not exceed 10 % in any case considered (but is typically much smaller).
Analysis of γa allows us to identify changes of BB OA concentration due to the combined effects of oxidation and gas–particle partitioning processes. Furthermore, any kind of dependence of γa on the initial BB plume size (Sp) or the initial concentration of BB OA (C0) can be considered to be a manifestation of a nonlinear behavior of the BB OA mass concentration. Indeed, it is easy to show using Eq. (6) that if the gas-phase concentration of each SVOC, , were a linear function of the total concentration, , of the same species, then the dynamics of γa would not depend on C0 and could not be affected by dilution (and accordingly would not depend on Sp either).
Interaction of SVOCs with water is not taken into account in the OA schemes described above; thus any known effects of humidity on evolution of BB OA, such as, for example, formation of SOA from oxidation of water-soluble organic compounds in the liquid phase (Brege et al., 2018), have been disregarded. However, as suggested by Tsimpidi et al. (2018), we used the calculations of the O:C ratio to evaluate the hygroscopicity parameter κ (Petters and Kreidenweis, 2007), which characterizes hygroscopicity and CCN activity of BB OA. Specifically, we expressed the hygroscopicity parameter for any organic species s, κs, as a linear function of the O:C ratio by using a parameterization proposed by Lambe et al. (2011):
The overall value of κ for BB OA, κorg, was obtained using a mixing rule (Petters and Kreidenweis, 2007):
where εs is a volume fraction of a given species. The volume fractions were estimated by assuming a constant volumetric mass density of 1.2×10³ kg m−3 for any OA species considered. Note that the hygroscopicity parameter was calculated only with the C17, T18, and T18f schemes, as the other oxidation schemes (K15, S15, and LIN) considered in this study are not designed to evaluate the O:C ratio.
3.1 Dynamical regimes of the BB OA evolution
The evolution of EnR (γa) according to our simulations performed with the different OA schemes is presented in Figs. 2 and 3. The simulations were done with several different values of the initial plume size, Sp (Fig. 2), and initial BB OA concentration, C0 (Fig. 3). The parameter range considered in our simulations is intended to represent the highly variable characteristics of typical smoke plumes from any kind of vegetation fires. The fixed values of C0 (103 µg m3) and Sp (5 km) in the simulations shown in, respectively, Figs. 2 and 3 are chosen to approximately represent midrange values of the corresponding parameters (on a logarithmic scale). The simulation results allow us to identify five distinctive dynamical regimes of the BB OA evolution. The simulations corresponding to the specific regimes are marked in the figures by the numbers from 1 to 5. The first regime (1) corresponds to a monotonic saturating increase in γa. This regime is found in the simulations with the C17, K15, and LIN schemes. An increase in γa is followed by its decrease in the second regime (2), which is typical for the S15, T18, and T18f schemes. The third regime (3) features a sharp initial decrease in γa followed by a slow monotonic increase. This regime is found with the C17, K15, and T18 schemes but only when Sp is relatively small (in particular, when Sp equals to 100 m; see Fig. 2c and d). The most complex behavior of γa corresponds to the fourth regime (4) and is found with the S15, T18, and T18f schemes (Figs. 2c, 2d, and 3d) for specific C0 and Sp values. In this regime, γa first decreases, then increases, and finally decreases again. Finally, the fifth regime (5) corresponds to the monotonic decrease in γa. It is found only in a simulation with the T18f scheme (Fig. 3d).
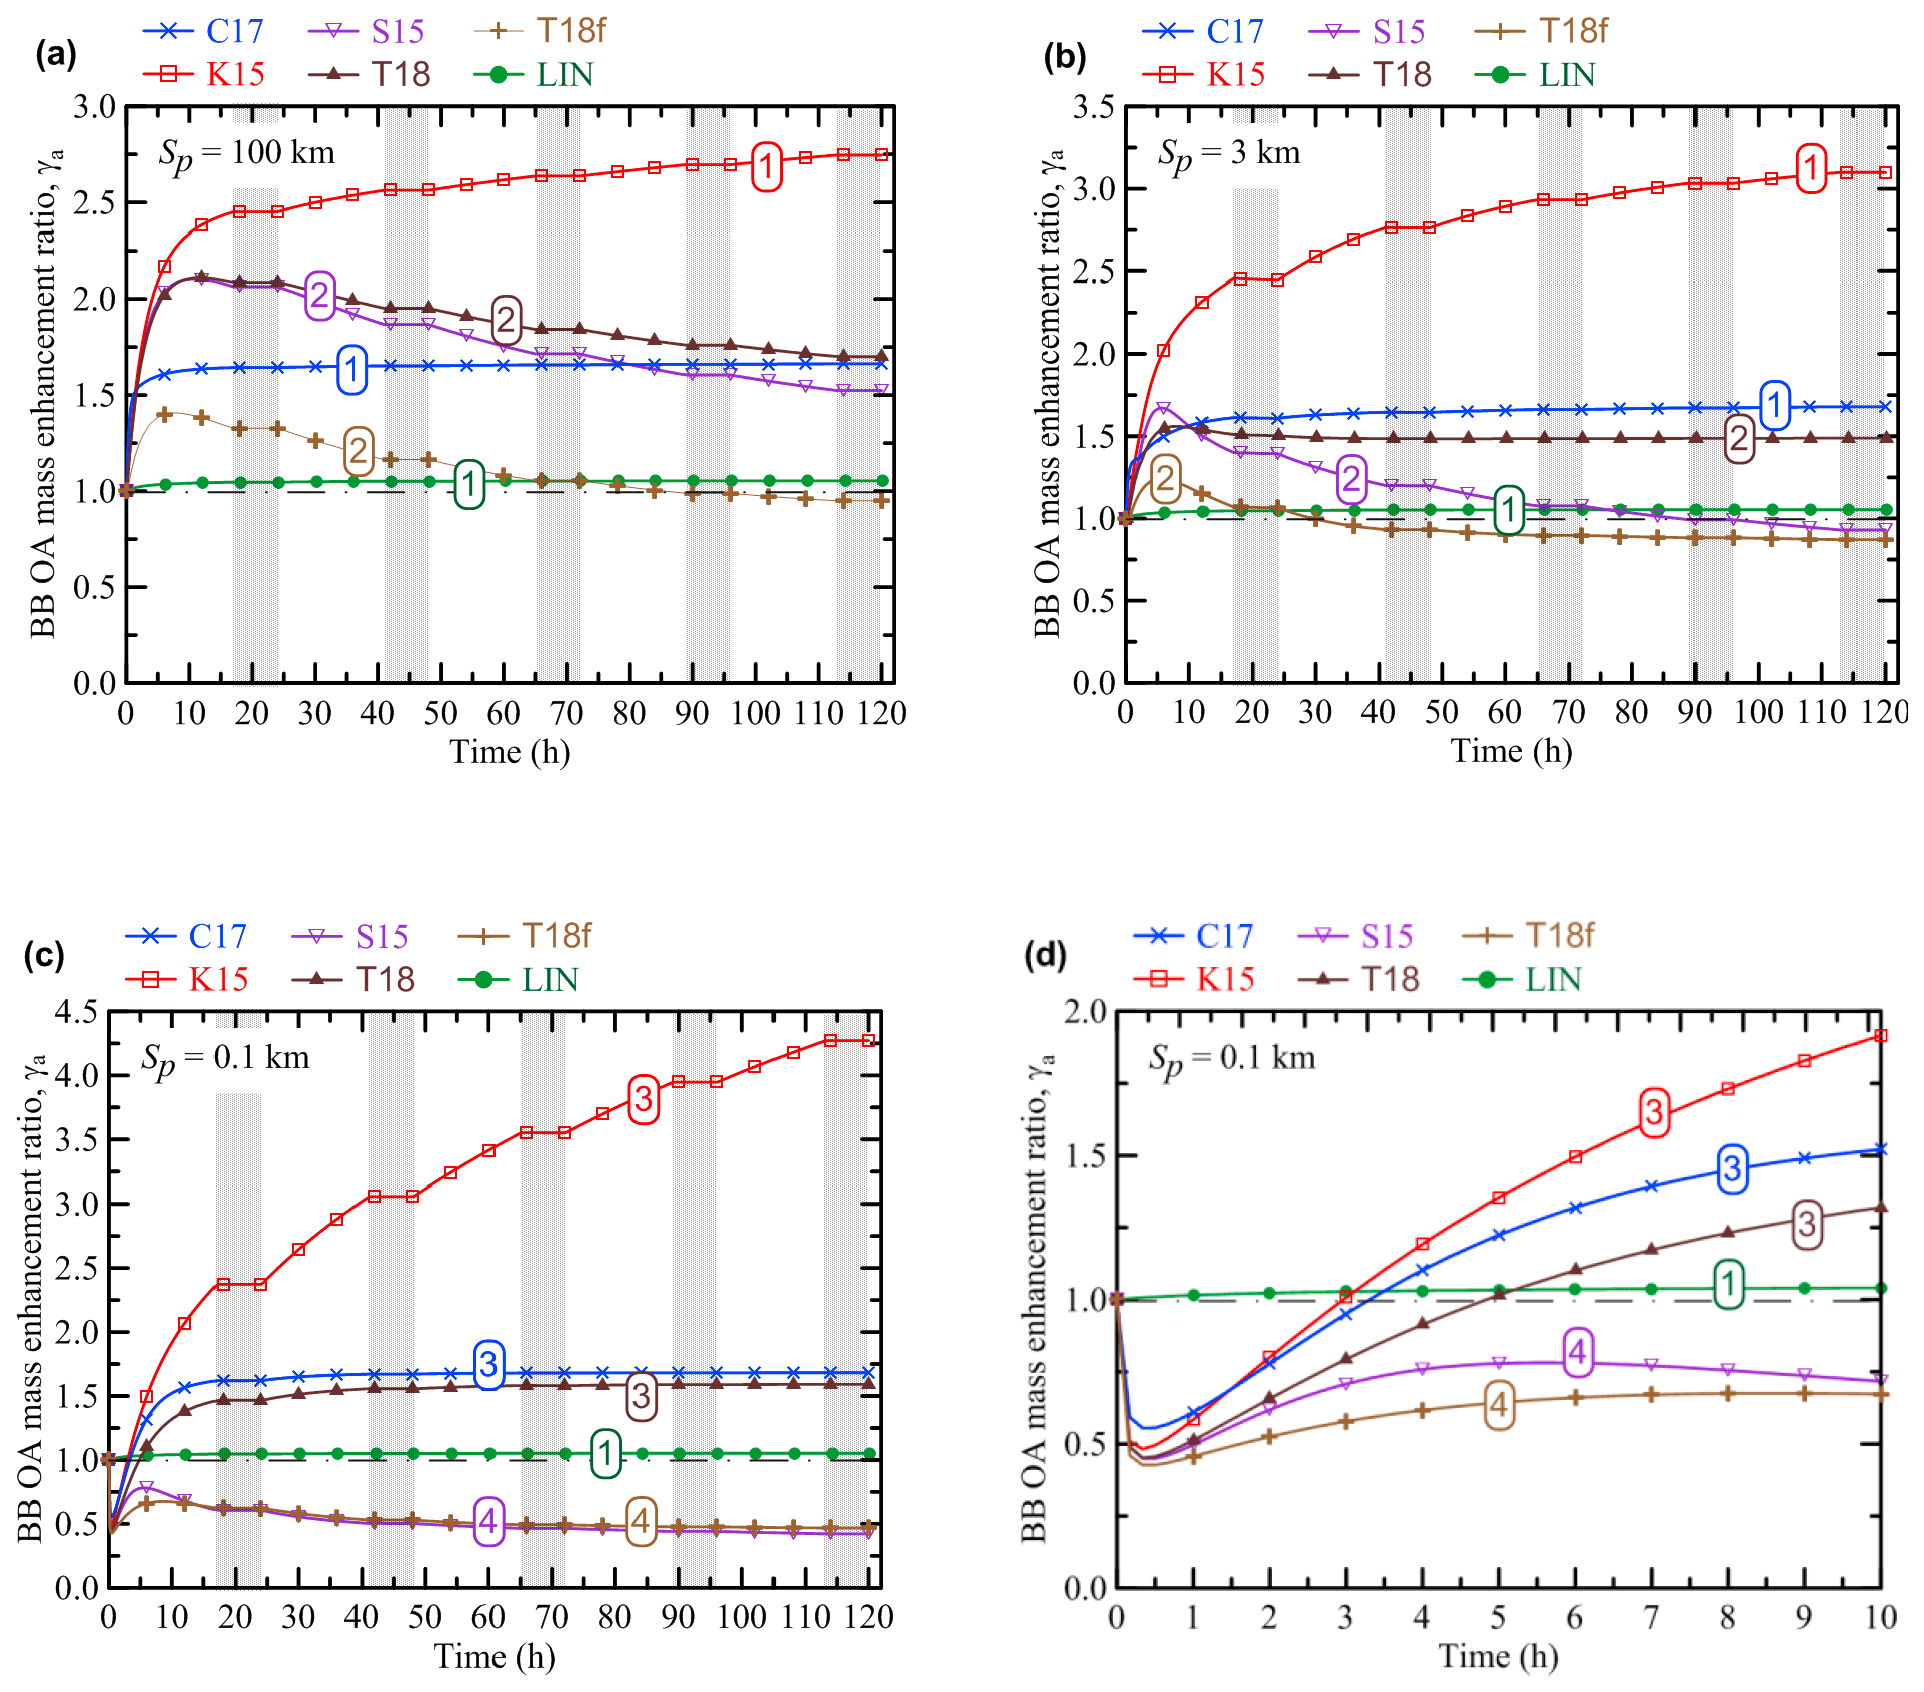
Figure 2Evolution of the BB OA mass enhancement ratio (γa) according to the simulations performed with the different OA schemes and with different values of the initial plume size: (a) Sp=100 km, (b) Sp=3 km, and (c, d) Sp=0.1 km. The initial BB OA concentration, C0, was fixed at 103 µg m3 in all the simulations. Panel (d) shows a zoomed fragment of the simulations presented in panel (c). Shaded bands depict nighttime periods when no oxidation reactions were allowed to occur. The numbers on the curves denote the different dynamical regimes of BB OA evolution according to the definitions in Sect. 3.1. A horizontal dashed–dotted line in each panel indicates the situation where no BB OA mass enhancement occurs (γa=1).
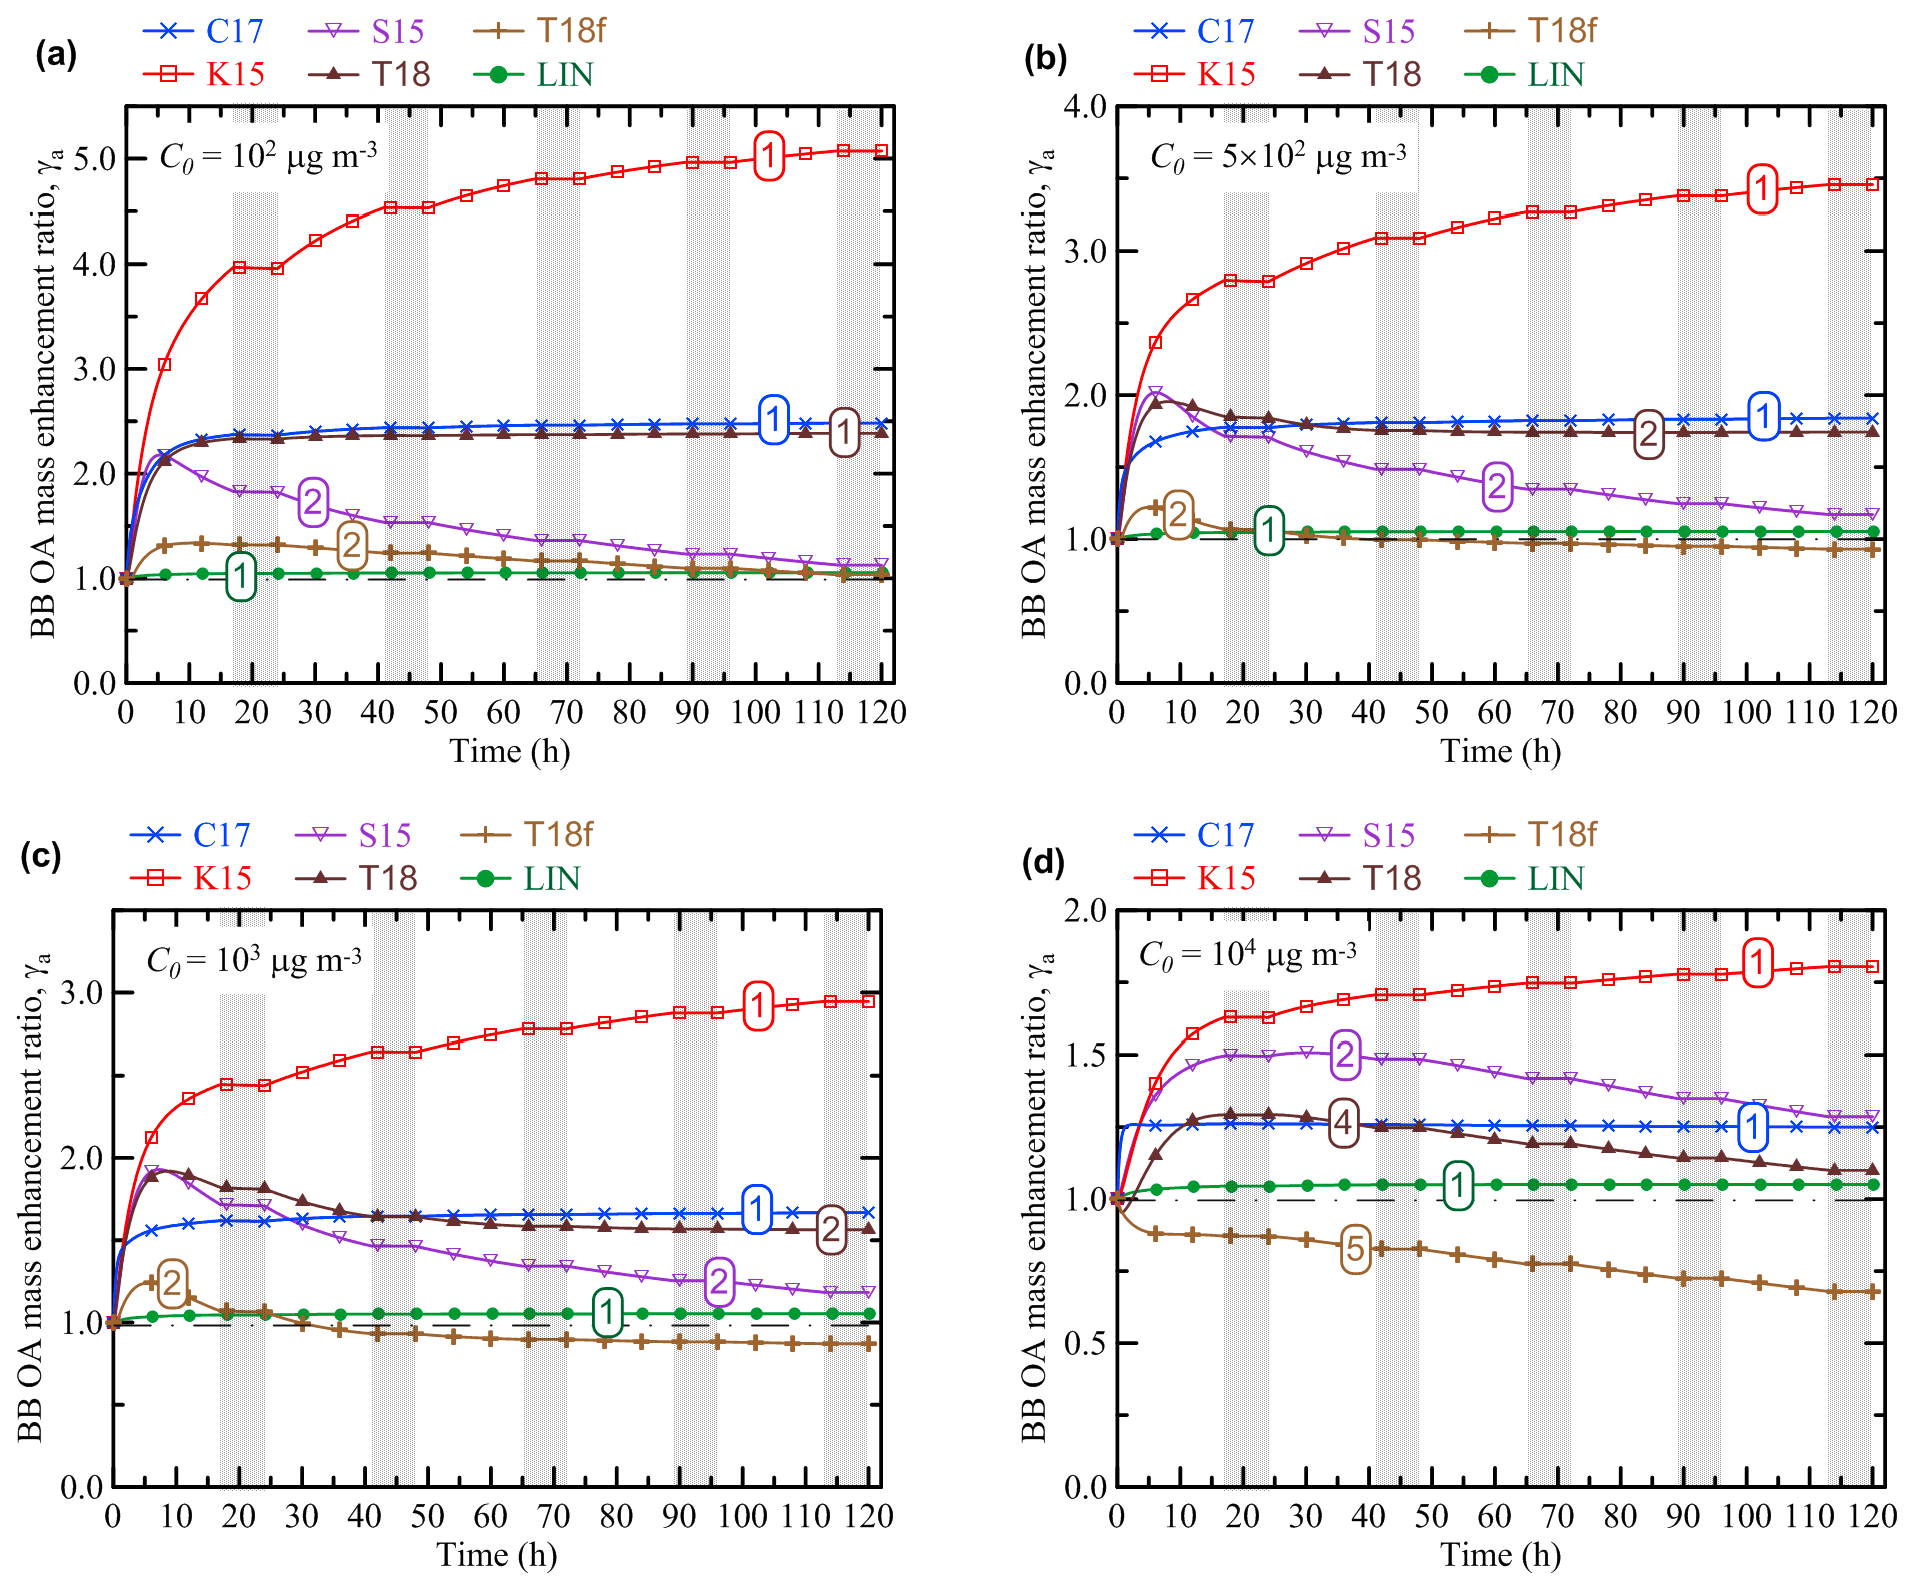
Figure 3Evolution of the BB OA mass enhancement ratio (γa) according to the simulations performed with the different OA schemes and with different values of the initial mass concentration of BB OA: (a) C0=102 µg m3, (b) µg m3, (c) C0=103 µg m3, and (d) C0=104 µg m3. The initial BB plume size, Sp, was fixed at 5 km in all the simulations shown. Shaded bands depict nighttime periods when no oxidation reactions were allowed to occur. The numbers on the curves denote the different dynamical regimes of BB OA evolution according to the definitions in Sect. 3.1. A horizontal dashed–dotted line in each panel indicates the situation where no BB OA mass enhancement occurs (γa=1).
The results shown in Figs. 2 and 3 demonstrate, on the one hand, that the differences in the considered representations of the OA evolution are associated with both major quantitative and qualitative differences in the BB OA behavior even when the control parameters are the same. For example, if Sp=5 km and C0=103 µg m3 (Fig. 3c), the simulation with the K15 scheme predicts a strong monotonic increase in γa up to a factor of 3 after a 120 h evolution. At the same time, the T18f scheme predicts a slight net decrease in γa even though it also predicts an increase in γa at the initial stage of the evolution. Even larger differences (exceeding a factor of 8) between the simulations are evident if Sp equals 0.1 km.
On the other hand, changing parameter values in the simulations with the same VBS scheme can result in “switching” between different types of the BB OA evolution. In particular, depending on Sp, the simulations with the C17 and K15 schemes can demonstrate both the regimes 1 (Figs. 2a, 2b, and 3) and 3 (Fig. 2c and d). Both the regimes 2 (e.g., Fig. 2a and b) and 4 (e.g., Fig. 2c) are found in the simulations performed with the S15 and T18f schemes. The simulations with the T18 scheme are found to manifest four regimes, from 1 to 4 (Figs. 3a, 3c, 3d, and 2c). In contrast to the simulations using the VBS framework, the simulations with the LIN scheme manifest a single dynamic regime (regime 1). Note that the simulation results shown in Figs. 2 and 3 are not meant to provide an exhaustive analysis of the parameter space with regard to possible dynamical regimes, but are rather intended to illustrate the diversity of the BB OA behavior simulated with different OA schemes and different parameter values.
Figures 2 and 3 also show that using the same OA scheme with different values of Sp and C0 can be associated with not only qualitative differences in the EnR behavior (as indicated above) but also with considerable quantitative differences between the simulated EnR values. For example, γa for the BB OA at an age of 120 h with the K15 scheme and C0=1000 µg m3 increases from about 2.7 to 4.2 as Sp decreases from 100 to 0.1 km (cf. Fig. 2a and c). In contrast, the same change of Sp in the simulation with the S15 scheme results in a dramatic drop in γa, from about 1.5 to 0.5. The simulations with the C17 and T18 are relatively insensitive to changes of Sp. An increase in C0 is typically associated with a decrease in γa. The sensitivity of γa to C0 is very significant in the simulations with the K15 scheme but is weak in the simulations with the S15 and T18f schemes.
As noted in Sect. 2.3, any effects of changes in the parameters Sp and C0 on γa can be considered to be a manifestation of a nonlinear behavior of BB OA. In contrast to the nonlinear behavior demonstrated by BB OA in the simulations with the VBS schemes, the simulations with the LIN scheme manifest a simple “linear” behavior, being quite insensitive to changes of Sp and C0: γa monotonically increases by ∼5 % after 120 h irrespective of the parameter values. This insensitivity is a result of the assumptions that POA is not affected by any processes except for dilution and that the initial concentration of SOA precursors is proportional to C0. The dependencies of γa on the control parameters of our simulations are analyzed in more detail in the next section (Sect. 3.2).
The existence of the different dynamical regimes of BB OA evolution can be interpreted by considering the interplay between several competing processes, such as functionalization, fragmentation, and evaporation with dilution. In particular, regime 1, featuring a saturating enhancement of γa, can be explained by SOA formation dominated by functionalization reactions associated with a decrease in volatility and an increase in the molecular weight of SVOCs. A steady state is reached in this regime when all SVOCs belong to the two lowest-volatility bins. Rapid fragmentation reactions in the case of S15 and T18f schemes or the decrease in the molecular weight of the products of the oxidation reactions (effectively combining the effects of the functionalization and fragmentation oxidation pathways) in the case of the T18 scheme can cause a depletion of the SOA amounts that have initially been formed from oxidation of POGs, leading to regime 2. A rapid POA evaporation caused by dilution at the initial stage of the BB plume evolution can result in a depletion of the bulk OA amounts and give rise to the regimes 3, 4, or 5, depending on the interplay between fragmentation and functionalization after the fast dilution.
Unlike the BB OA enhancement ratio, the hygroscopicity parameter κorg exhibits a rather simple behavior (Fig. 4), similar to that of γa in the regime 1. The monotonic growth of κorg over time is hardly surprising, since each reaction is assumed to result in an increase in the O:C ratio (according to, for example, Eq. 14) for at least one of the products with respect to that of the reactant (and the O:C ratio of the other products is assumed to remain the same as that of the reactant). The initial rapid increase in κorg eventually slows down because the semi-volatile POGs and SOGs participating in the oxidation processes are eventually transformed either into low-volatile products (as in the simulations with the C17 and T18 schemes) or, on the contrary, into volatile gases (as in the simulations with the T18f scheme). Note again that the hygroscopicity parameter was calculated using only the C17, T18, and T18f schemes, since the other oxidation schemes (K15, S15, and LIN) considered in this study are not designed to track changes of the O:C ratio.
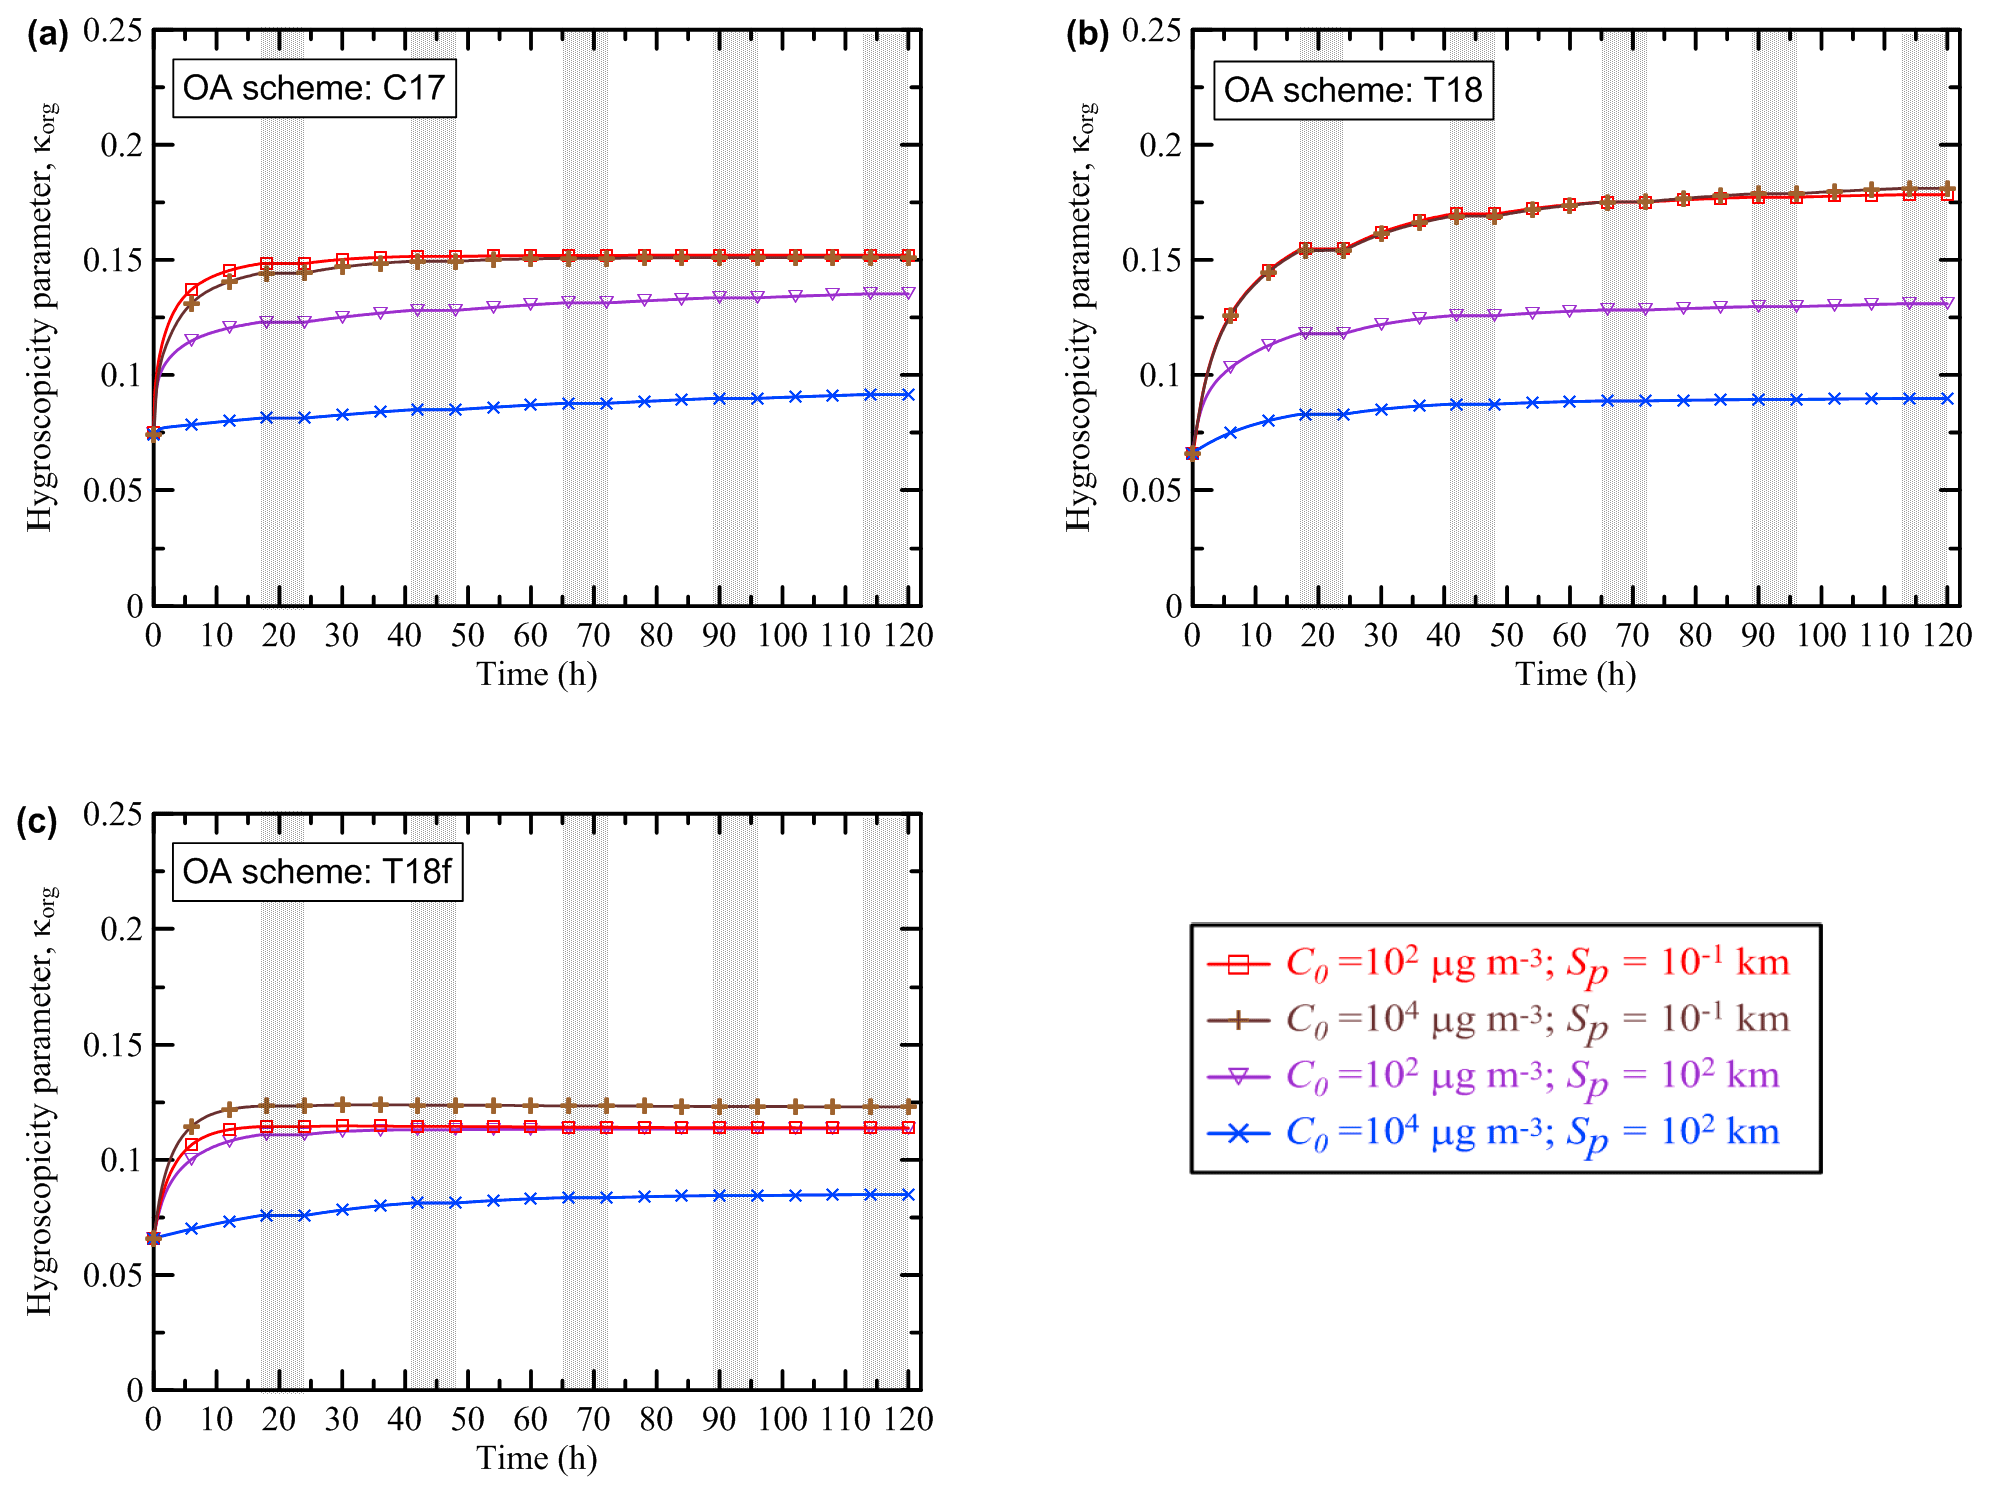
Figure 4Evolution of the hygroscopicity parameter κorg simulated as a function of time with different values of the initial BB OA mass concentration, C0, and the initial BB plume size, Sp, using the (a) C17, (b) T18, and (c) T18f schemes. Shaded bands depict nighttime periods when no oxidation reactions were allowed to occur.
Nonetheless, in spite of a relatively simple behavior, the simulations of κorg are still rather sensitive to the parameters of the BB plume. In particular, the value of κorg after the 120 h evolution is found, according to the simulation with the T18 scheme, to be about a factor of 2 bigger in the cases with a small plume (Sp=0.1 km), irrespective of the initial aerosol concentration, than in the cases with a large and dense plume (Sp=100 km; C0=104 µg m3). Values of κorg are higher for smaller plumes because a larger fraction of POA species evaporates due to more rapid dilution of smaller plumes, followed by gas-phase formation of highly oxidized SOA species. The sensitivity of the simulations of κorg with the T18f scheme to the control parameter values is smaller but is still considerable. The fact that κorg is sensitive to the parameters of a BB plume can be regarded as another manifestation of the nonlinear behavior of BB OA. Note that only simulations for the “extreme” values of C0 and Sp (among those considered in this study) are shown in Fig. 4 for all of the three oxidation schemes allowing an evaluation of the hygroscopicity parameter. Simulations performed using a given scheme with other (intermediate) parameter values would fall between the brown and blue curves in a corresponding plot. The dependencies of κorg on C0 and Sp are analyzed in some more detail in the next section. Note also that quantitatively, the hygroscopicity parameter values ranging from 0.08 to 0.18 for aged aerosol in our simulations look rather reasonable. For example, Mikhailov et al. (2015) reported a volume-based hygroscopicity parameter value of about 0.1 (on average) for the accumulation mode of aerosol in Siberia during the period of intense fires.
As noted above (Sect. 2.3), the initial conditions for our BB OA simulations correspond to instantaneous thermodynamic equilibrium. Additional test simulations performed using the S15 scheme with perturbed initial conditions and two different numbers of size bins (nine, as in the simulations with the C17, K15, and S15 schemes, or three, as in the simulations with the T18 and T18f schemes) confirm (Fig. 5) that thermodynamic equilibrium between POGs and particles is typically reached before any noticeable changes occur due to chemical processes. The equilibration timescales are found to range from just a few seconds (when the balance between gas and particle phases is shifted toward the particle phase) to about 10 min (when all the BB emissions are assumed to be in the gas phase and the bin number equals 3). In accordance with these results, the BB OA mass concentration after the 5 d evolution was not found to be sensitive in our additional test simulations (which are not presented here) to either the initial perturbations of the gas–particle equilibrium or to the change in the number of bins in the particle size distribution in the range of the considered values of the plume parameters even though when OA is aged or strongly diluted, it can feature much longer equilibration timescales (Riipinen et al., 2010).
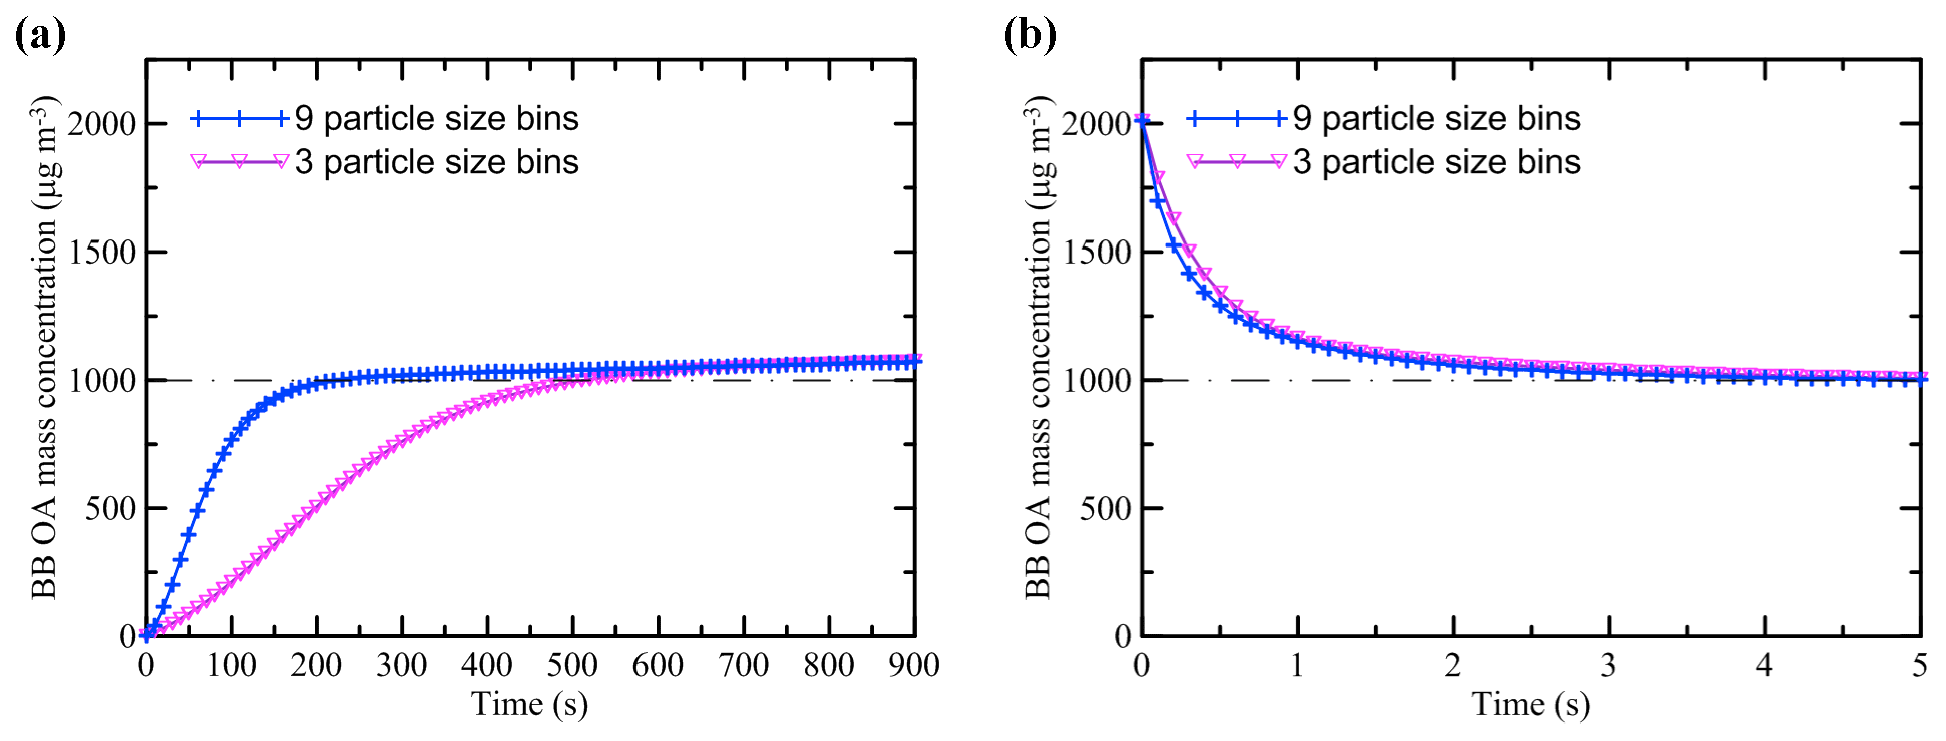
Figure 5Adjustment of mass concentration of fresh BB OA to thermodynamic equilibrium according to test simulations performed with the S15 scheme without dilution. The simulations were initiated from different initial conditions: (a) C0=0 µg m3 and (b) µg m3. A horizontal dashed–dotted line in each panel indicates the BB OA concentration (103 µg m3) at thermodynamic equilibrium. The time step in the test simulations was set at 0.1 s.
3.2 Dependencies of the BB OA enhancement ratio and hygroscopicity parameter on the parameters of the smoke plume
Figures 6 and 7 present the simulated dependencies of EnR on the initial BB OA concentration, C0, after 5 and 120 h of evolution, γa(5 h) and γa(120 h), respectively. These dependencies have been calculated using the different OA schemes with varying values of the initial plume size, Sp. Figure 6 also shows (by dashed lines) the initial ratio of the total SVOCs mass concentration (Ctot) to the total BB OA mass concentration (C0) at thermodynamic equilibrium according to Eq. (18). The Ctot∕C0 ratio depends on the parameters of the assumed volatility distribution and, for this reason, is different for different schemes. Our simulations show that γa(5 h) follows, in most cases, a slow and monotonic inverse dependence on C0. This dependence is qualitatively (and in some cases, but not always, even quantitatively) rather similar to that of Ctot∕C0: evidently, the decreasing character of the dependence of γa on C0 can be due to the fact that larger values of C0 correspond to a smaller SVOC gas-phase fraction available for SOA formation. Larger values of Sp typically correspond to larger values of γa(5 h); such a dependence is evidently due to evaporation of POA with dilution. However, the dependences of γa(5 h) on C0 and Sp are not always monotonic. In particular, the dependence of γa on C0 has a “weak” minimum in the simulations with the T18 scheme and Sp of 1 km when C0 is around 5×10³ µg m3. A similar minimum (but around 2×10³ µg m3) can be seen in the simulations with the T18f scheme. When C0 equals 5×10³ or 104 µg m3 in the simulations with the T18 scheme, γa calculated with Sp=5 km is larger than that calculated with Sp=100 km, although an inverse relation exists between the corresponding values of γa simulated with Sp=0.1 km and Sp=0.5 km. These irregularities cannot be easily explained but are certainly not due to numerical errors (as has been confirmed in additional test simulations with a reduced time step), emphasizing the essentially nonlinear character of the BB OA behavior, especially when it is modeled using such complex VBS schemes as T18 or T18f.
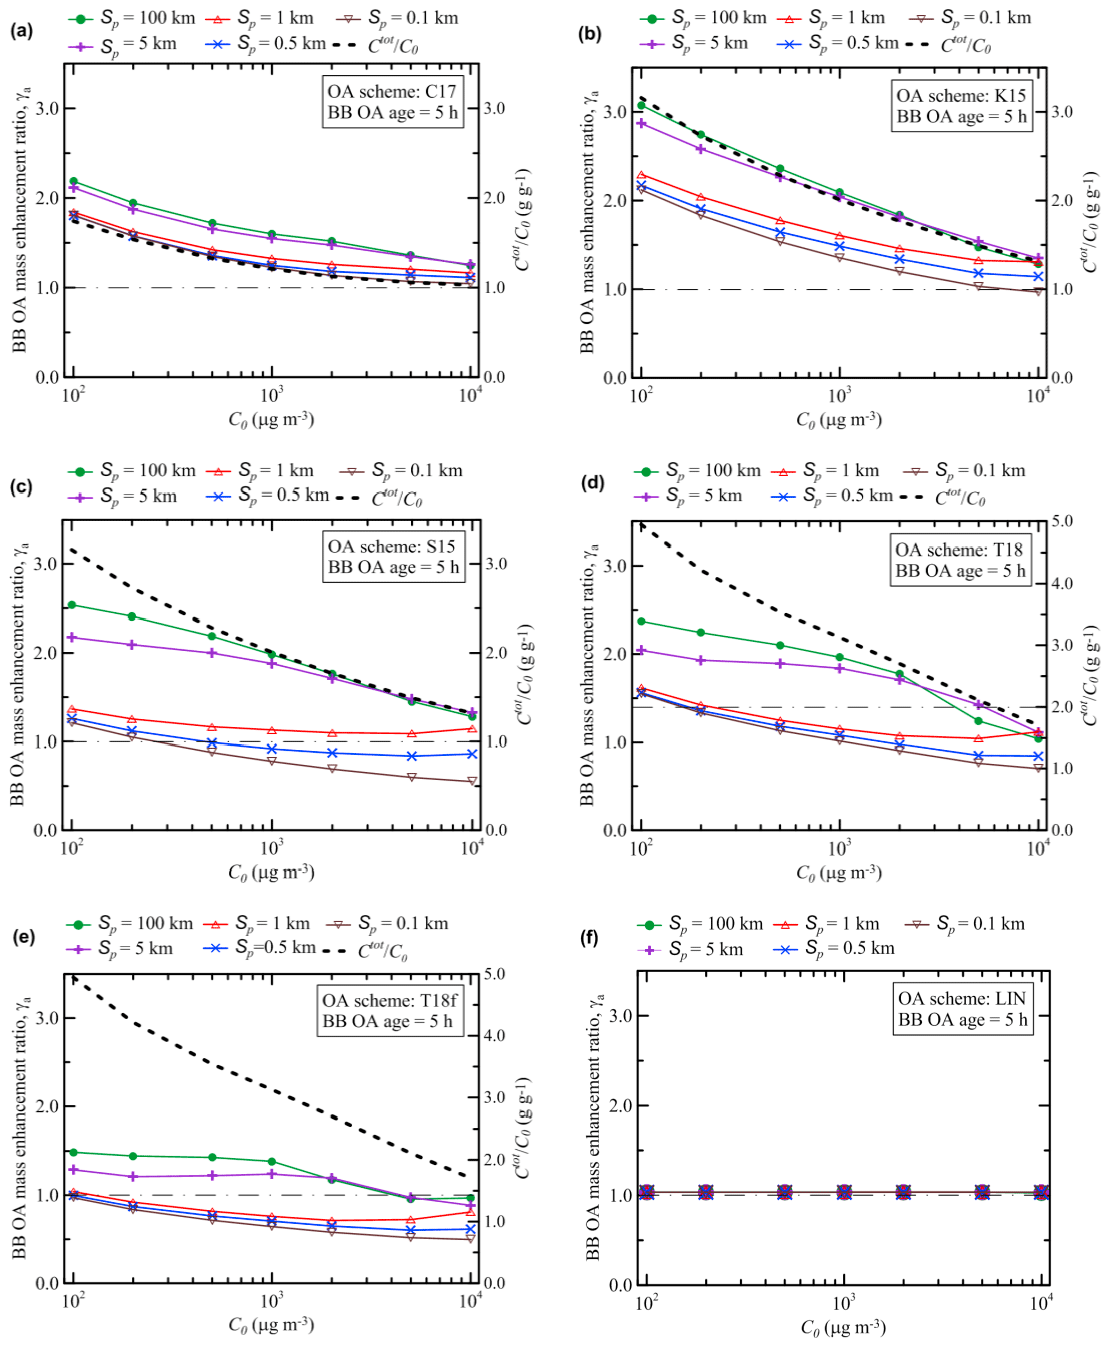
Figure 6Simulated dependencies of the BB OA enhancement ratio after 5 h of evolution on the initial BB OA mass concentration, C0. The dependencies are obtained with different OA schemes (Table 1) and with different values of the initial plume size, Sp. Dashed lines show the ratio of the total initial mass concentration of SVOCs (Ctot) to the initial BB OA concentration (C0) at thermodynamic equilibrium according to Eq. (18). A horizontal dashed–dotted line in each panel indicates the situation where no BB OA mass enhancement occurs (γa=1).
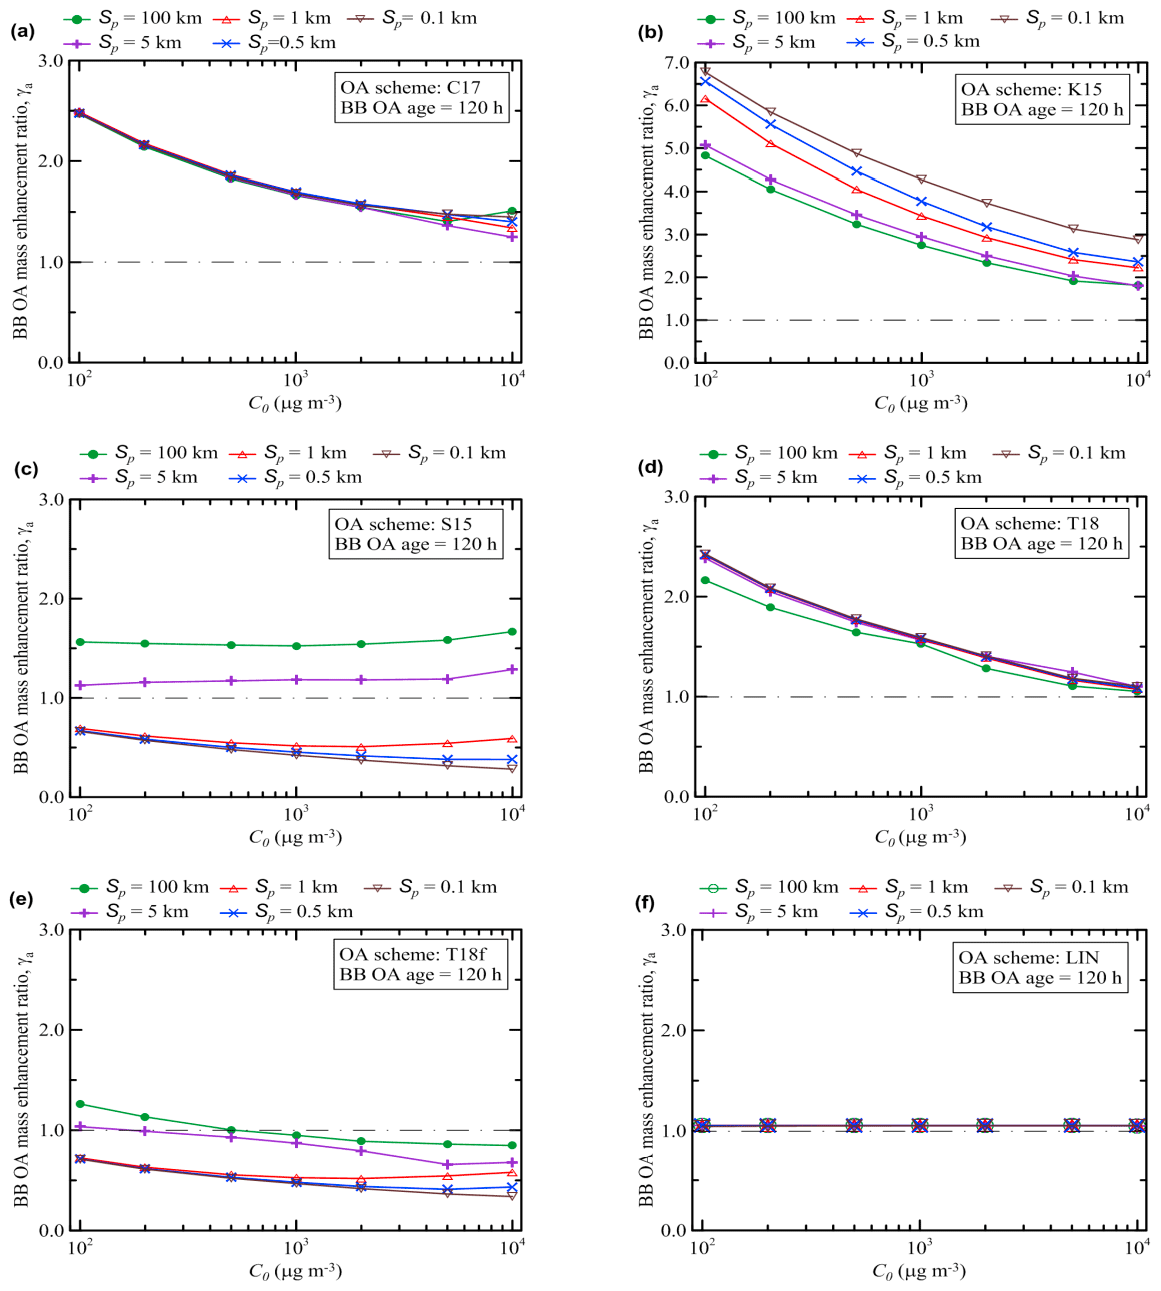
Figure 7The same as in Fig. 6 but for the BB OA enhancement ratio after 120 h of evolution and except that the ratio of Ctot to C0 (which is not supposed to characterize the state of BB OA after 5 d aging) is not shown. Note that the y axis scale in the panel (b) is not the same as in other panels. A horizontal dashed–dotted line in each panel indicates the situation where no BB OA mass enhancement occurs (γa=1).
The value of γa(120 h) also tends to decrease as C0 increases in most cases, but with differences among the schemes: C17, K15, and T18 schemes with a weaker degree of fragmentation show a pronounced decrease, while schemes with a stronger degree of fragmentation are less sensitive to C0 (Fig. 7). This is presumably due to the fact that if functionalization is more important than fragmentation, then the availability of more SOGs at lower C0 leads to enhancements in SOA formation.
However, different schemes feature more complex and diverse dependencies on Sp (Fig. 7). For example, while the simulations with the C17 and T18 schemes, where the fragmentation and functionalization processes are treated implicitly, do not reveal any strong sensitivity of γa(120 h) on Sp, the scheme K15 where functionalization strongly dominates over fragmentation yields a rather strong but inverse dependence of the same parameter (that is, unlike γa(5 h) calculated with the same scheme, γa(120 h) decreases with increasing Sp). Presumably, evaporation of POA due to dilution provides more “fuel” for functionalization reactions, leading to a larger increase in γa when Sp is smaller (as found in the simulations with K15 scheme). In contrast, the schemes with strong fragmentation reactions, S15 and T18f, reveal a strong increasing dependence of γa(120 h) on Sp, while they are less sensitive on C0 relative to the other schemes. This dependence can mainly be due to the fact that the evaporated organic compounds are exposed to fragmentation reactions: accordingly, a decrease in Sp results in larger losses of SVOCs and smaller SOA concentrations.
A comparison of the results shown in Figs. 6 and 7 reveals that the differences between the different VBS schemes are associated with mostly only quantitative differences in the dependencies of γa(5 h) on C0 and Sp, but with both quantitative and some qualitative differences in the corresponding dependencies of γa(120 h). This observation indicates that the mass concentration of aged BB OA is likely to be much more strongly affected in the simulations by uncertainties in available representations of the BB OA evolution than the mass concentration of relatively fresh BB OA. One of the reasons is that as the amount of SOGs susceptible to fragmentation reactions increases with time, the competition between functionalization and fragmentation reactions plays an increasingly important role, creating a more complex dependence on the plume parameters. As a result of this competition, the outcome of the BB OA evolution becomes strongly dependent on the fragmentation branching ratio associated with a given OA scheme. One of the most significant findings of our analysis in this respect is that the sensitivity of γa to the initial plume size (or, similarly, to the dilution rate) may be positive or negative, depending on the VBS scheme and the BB OA age. Factors controlling the dependence of γa on Sp are examined more in detail in the next section (Sect. 3.3).
The simulated dependencies of the values of the hygroscopicity parameter after 5 and 120 h of evolution, κorg(5 h) and κorg(120 h), respectively, on the initial BB OA concentration, C0, and the plume size, Sp, are presented in Fig. 8. Evidently, similar to γa(5 h) and γa(120 h), κorg(5 h) and κorg(120 h) are affected by changes of the control parameters in a nonlinear way, although the nonlinearities are not as pronounced as in the case of the corresponding dependencies for EnR. In particular, while the values of κorg(5 h) and κorg(120 h) decrease with increasing C0 for the largest plumes (Sp=100 km), they are nearly constant and even slightly increase with increasing C0 for the smallest plumes (Sp=0.1 km). According to the simulations with all three of the schemes enabling simulations of the hygroscopicity parameter, both κorg(5 h) and κorg(120 h) are more sensitive to the changes of Sp than to the changes of C0. Furthermore, the sensitivity of κorg(5 h) and κorg(120 h) to Sp increases with increasing C0. Note that as C0 increases, a larger fraction of the total particulate organic matter concentration, Ctot, belongs, under thermodynamic equilibrium, to the condensed phase. This fraction is oxidized (as a result of mass transfer between the particles and gas phase) slowly compared to the gas-phase fraction, which is why both κorg(5 h) and κorg(120 h) mostly tend to decrease with C0. However, the particulate fraction of Ctot can readily evaporate and become accessible for fast gas-phase oxidation as a result of evaporation in the rapidly diluted small plumes: this may explain why κorg(5 h) and κorg(120 h) are nearly insensitive to C0 in the simulations with Sp=0.1 km.
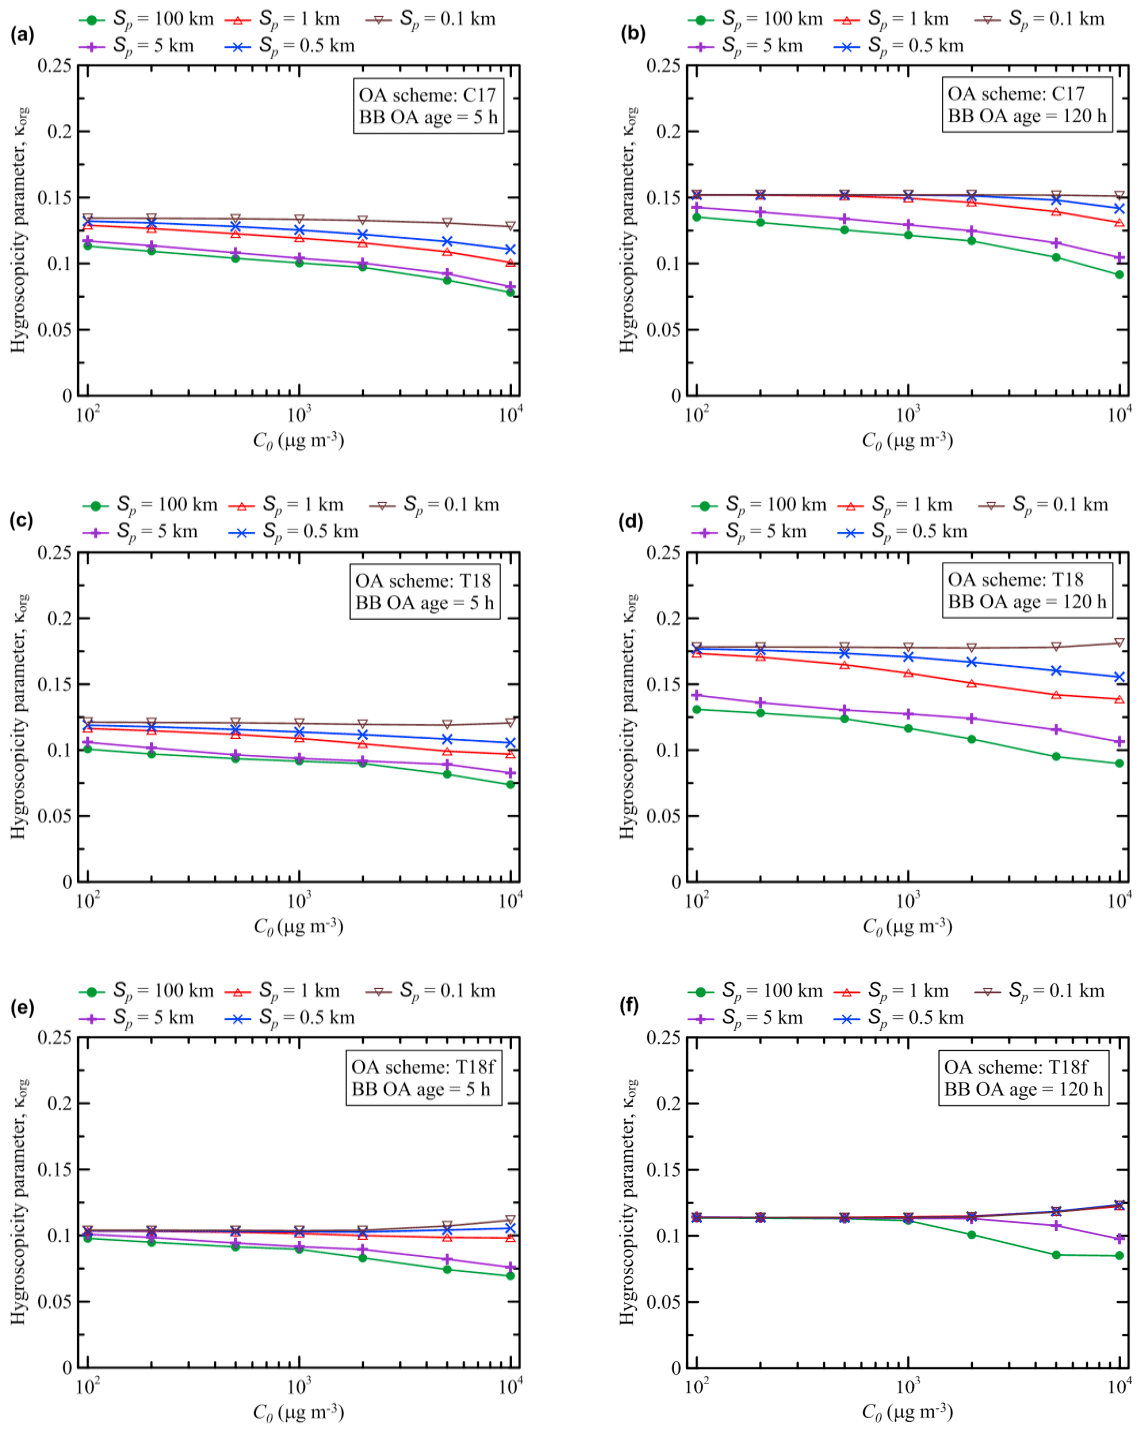
Figure 8Dependencies of the hygroscopicity parameter, κorg, after (a, c, e) 5 h and (b, d, f) 120 h of BB OA evolution, simulated using the (a, b) C17, (c, d) T18, and (e, f) T18f schemes.
The simulations of κorg performed with the different schemes are noticeably different both quantitatively and qualitatively. Quantitatively, the C17 and T18 schemes typically yield larger values of κorg than the T18f scheme, and, for the smaller plumes (with Sp≤1 km), the T18 scheme predicts bigger values of κorg(120 h) than the C17 scheme. Qualitatively, while aerosol aging is associated with increasing sensitivity of κorg to Sp in the simulations with the T18 scheme (cf. Fig. 8c and d), the sensitivity of κorg either does not change significantly or diminishes (depending on C0) as the aerosol ages in the simulations with the C17 (cf. Fig. 8a and b) and T18f schemes (cf. Fig. 8e and f). The likely reasons for the differences between the simulations of κorg with, on the one hand, the C17 and T18 schemes, and, on the other hand, the T18f scheme, have already been mentioned above (see Sect. 3.1). That is, on the one hand, oxidation reactions in the C17 and T18 schemes yield less volatile products, which eventually accumulate in particles and increase the overall O:C ratio for BB OA. On the other hand, fragmentation reactions in the T18f scheme result in irreversible loss of the condensable organic matter into the gas phase, thus limiting an increase in the O:C ratio for the condensed phase. The significant differences between the κorg(120 h) values simulated with the C17 and T18 schemes for the smaller plumes (with Sp≤1 km) are likely due to the fact that semi-volatile products from oxidation of OA can achieve a higher degree of oxidation in the T18 scheme than in the C17 scheme.
3.3 The effects of fragmentation reactions
As noted in the previous section, our simulations performed with the S15 (or T18f) and K15 schemes reveal qualitatively different dependencies of the BB OA enhancement ratio after 120 h of evolution, γa(120 h), on the initial concentration, C0, but even more on the initial plume size, Sp. Specifically, while the S15 and T18f schemes predict that γa(120 h) increases with an increase in Sp, the K15 scheme yields an inverse dependence. Meanwhile, the main difference between the S15 and K15 schemes is that the fragmentation pathway of the oxidation reactions has a larger weight relative to the functionalization pathway in the S15 scheme than in the K15 scheme. The effect of fragmentation reactions is also quite visible in simulations with the T18f scheme compared to the simulations with the T18 scheme. Taking these considerations into account, we performed additional simulations in which we varied the fragmentation branching ratio in the same scheme. For definiteness, we used the S15 scheme which is rather “transparent” and flexible but not oversimplified.
Figure 9 shows the dependencies of γa(120 h) on both C0 and Sp according to our simulations performed with four different values of the fragmentation branching ratio, βfrag, for the SOA oxidation reactions (see Eq. 11): 0, 0.25, 0.5, and 1.0. Figure 7c shows similar calculations for the case with βfrag=0.85. The simulations with the extreme values of βfrag (0 and 1) do not correspond to any realistic situation and are provided only for reference purposes, but taking into account that the fragmentation branching ratio is a highly uncertain parameter of VBS schemes (Donahue et al., 2012b; Shrivastava et al., 2015), neither of the simulations with the other values of βfrag is intended to be more or less realistic. It is noticeable that the dependencies obtained using the S15 scheme with βfrag=0 (see Fig. 9a) are very similar to those obtained with the K15 scheme (Fig. 7b). Specifically, according to the simulation with both schemes, γa(120 h) is inversely dependent on Sp. An increase in βfrag (Fig. 9b) to 0.25 results in a stronger sensitivity of γa(120 h) to Sp and in an increase in maximum values of γa(120 h) (reached with Sp=0.1 km): apparently, this is due to the fact that the effect of fragmentation of SOGs is counteracted by oxidation of their products which are reprocessed according to Eq. (11). However, as βfrag increases further, the reprocessing of SOGs cannot compensate for a loss of SVOCs in the fragmentation branch: the values of γa(120 h) calculated with βfrag=0.5 (Fig. 9c) are typically lower (and sometimes very considerably) than those calculated with βfrag=0.25. Furthermore, when βfrag equals 0.5, the dependence of γa(120 h) on Sp “collapses”. That is, an approximate balance between the fragmentation and functionalization branches makes the BB OA enhancement ratio after 5 d of evolution nearly insensitive to dilution. Note that there is an obvious similarity between the dependences obtained using, on the one hand, the S15 scheme with the branching ratio of 0.5 (Fig. 9c), and, on the other hand, the C17 and T18 schemes. This similarity implies that the fragmentation and functionalization processes are, effectively, nearly balanced in the C17 and T18 schemes. The dominance of fragmentation over functionalization is again associated with a rather strong sensitivity of γa(120 h) to Sp (Figs. 7c and 9d). However, unlike the cases with βfrag<0.5, γa(120 h) increases with increasing Sp. Another noteworthy feature of the simulations with βfrag=0.85 or βfrag=1.0 is a rather weak sensitivity of γa(120 h) to C0. This is likely because the oxidation of POGs, which are available in larger amounts when C0 is smaller, yields much less SOA in the cases with dominating fragmentation compared to the cases with dominating functionalization.
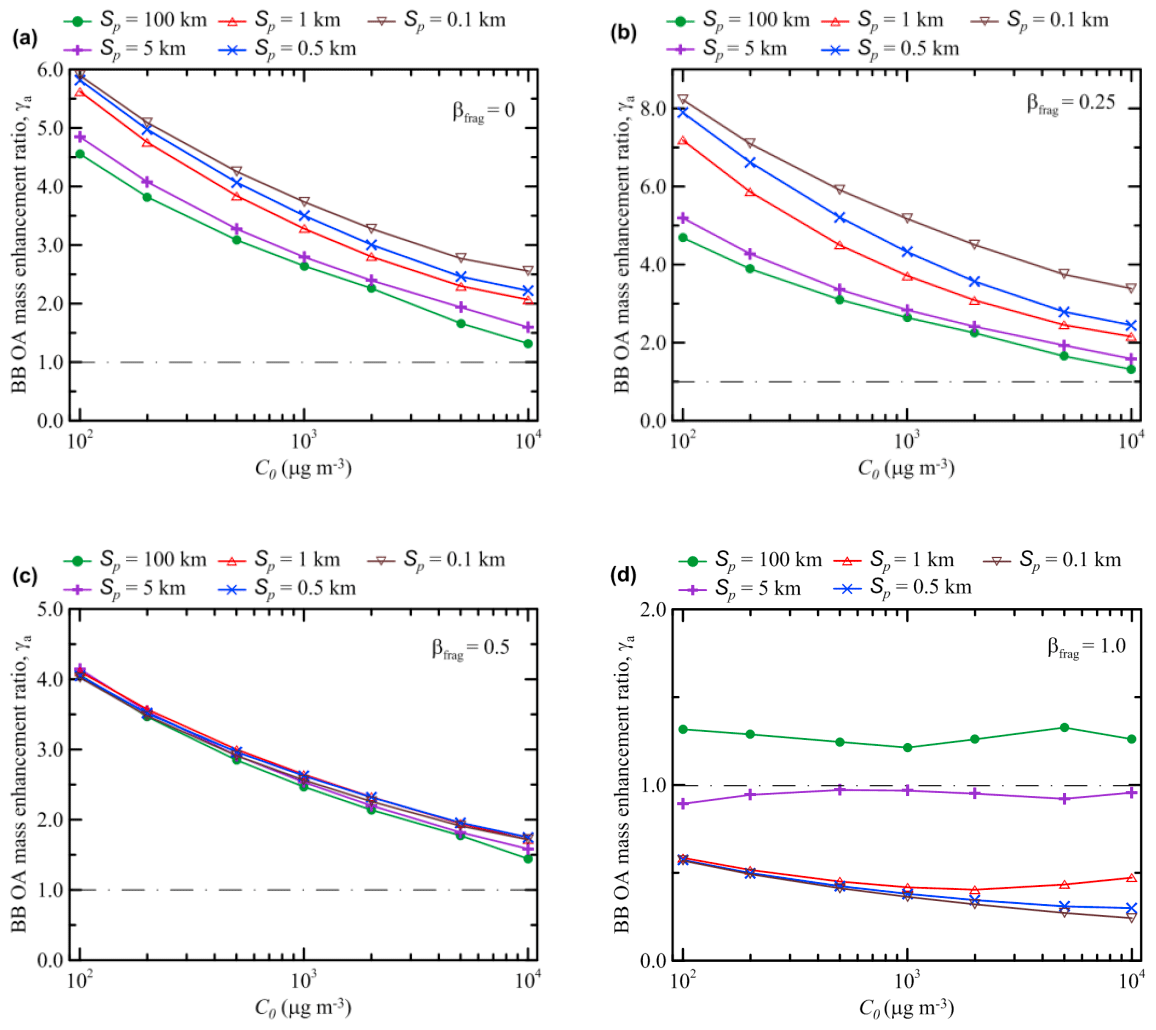
Figure 9Dependencies of the BB OA enhancement ratio after 120 h of evolution on the initial BB OA mass concentration, C0, according to the simulations using the S15 scheme with different values of Sp and varying values of the fragmentation branching ratio: (a) βfrag=0, (b) βfrag=0.25, (c) βfrag=0.5, and (d) βfrag=1.0. A horizontal dashed–dotted line in each panel indicates the situation where no BB OA mass enhancement occurs (γa=1).
The effects of fragmentation and functionalization reactions on the composition of BB OA in the simulation performed with the S15 scheme on the composition of BB OA are further visualized in Fig. 10, which illustrates the BB OA evolution by distinguishing primary and secondary fractions in particles (POA and SOA) and in the gas phase (POG and SOG) as well as between “fresh” (n≤2, see Sect. 2.2) and “aged” (n>2) fractions of SOA (SOA-f and SOA-a, respectively). The simulations shown in Fig. 10 were performed for the four cases with different values of C0 (102 and 103 µg m−3) and βfrag (0 and 1). The initial plume size was taken to be 100 km in all these simulations; that is, the BB OA evolution was practically not affected by dilution.
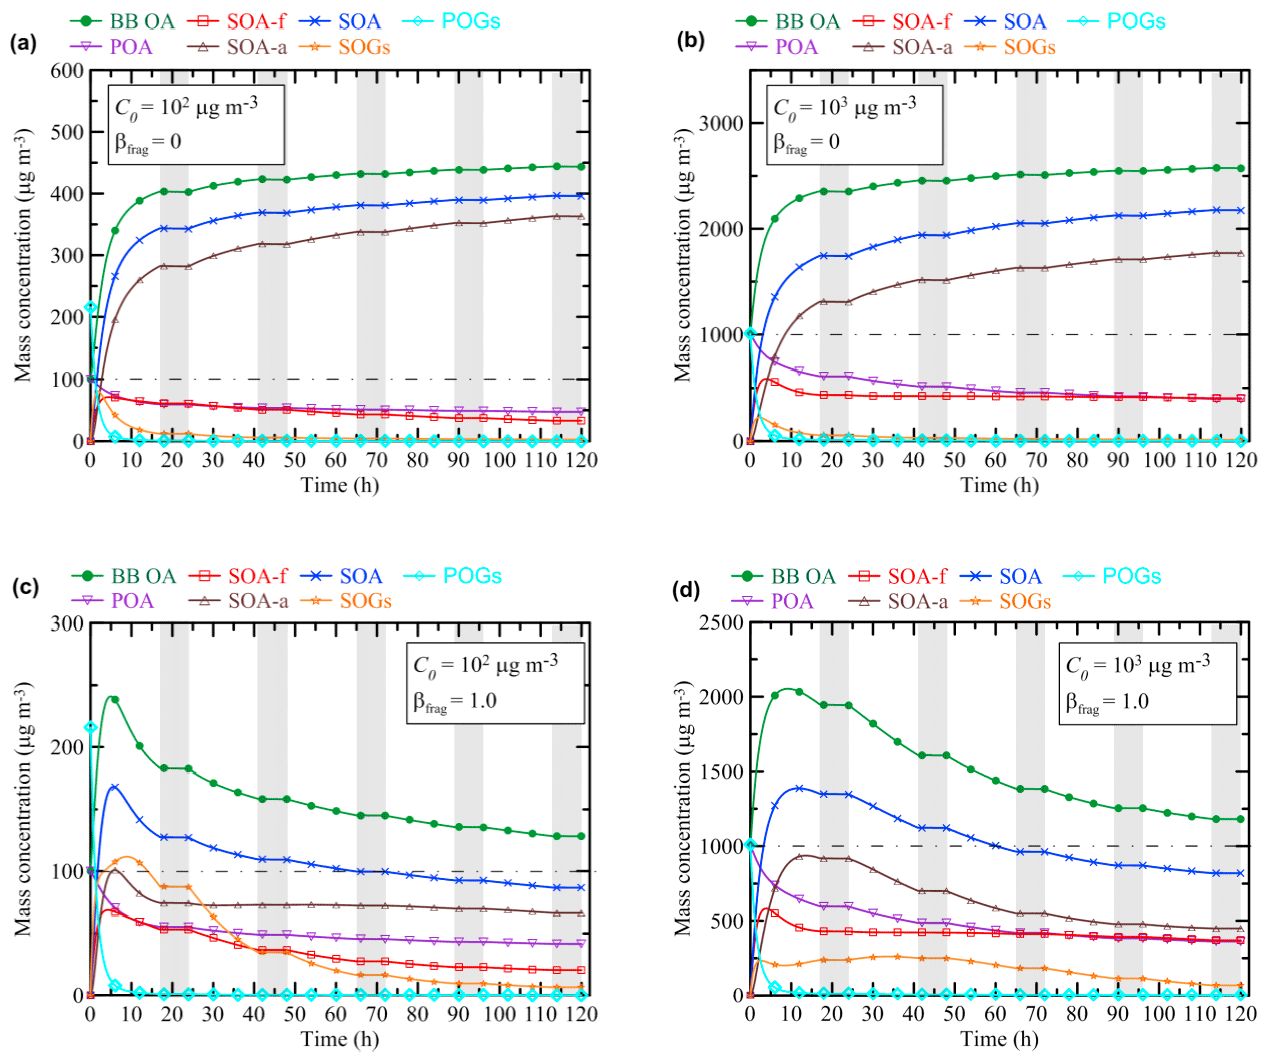
Figure 10Evolution of the mass concentration of BB OA and its components, including POA, “fresh” SOA (SOA-f), and “aged” SOA (SOA-a), according to the simulations performed with the S15 scheme. Also shown are the total mass concentration of SOA and the mass concentrations of POGs and SOGs. The simulations were done with two different values of βfrag, (a, b) βfrag=0 and (c, d) βfrag=1, and two different values of C0, (a, c) C0=102 µg m3 and (b, d) C0=103 µg m3. The initial plume size was set at 100 km in all the simulations. A horizontal dashed–dotted line in each panel indicates the initial concentration of BB OA aerosol. Shaded bands depict nighttime periods when no oxidation reactions were allowed to occur.
It is evident that after about 5–10 h of evolution, SOA already provides a major contribution to the OA mass concentration in all of the cases considered. Not surprisingly, the SOA fraction is larger in the simulations with βfrag=0 (in the “functionalization” case) than in the simulations with the βfrag=1 (in the “fragmentation” case). In addition, the aged SOA fraction is larger for the non-fragmentation case. Consistent with the dependence of γa on C0 in Fig. 9a, the SOA fraction calculated with βfrag=0 is also larger in the simulations with a smaller value of C0 (cf. Fig. 10a and b). A smaller C0 value is also associated with a larger contribution of SOA-a (and, correspondingly, with a smaller contribution of SOA-f) to the total concentration of SOA. It is worth noting that compared with the simulations performed with C0=103 µg m−3, the simulations with C0=102 µg m−3 feature a faster decrease in SOA-f. This is probably due to an initially larger fraction of SOGs in the simulations with C0=102 µg m−3: rapid oxidation of fresh SOGs causes evaporation of corresponding species from particles, thus depleting SOA-f. A major qualitative difference between the simulations performed for the functionalization and fragmentation cases is that the OA, SOA, and SOA-a concentrations monotonically increase with time in the former case (regime 1) but show a “humped” dependence on time in the latter case (regime 2). That is, the simulations shown in Fig. 10 confirm our initial suggestion (see Sect. 3.1) that realization of regimes 1 and 2 depends on the ratio between the fragmentation and functionalization branches of the oxidation reactions.
In this section, we briefly discuss possible implications and limitations of our findings presented in Sect. 3. First of all, our results indicate that uncertainties associated with the representation of BB OA evolution in chemistry-transport models (CTMs) may have a major impact on the simulated behavior of BB aerosol. Indeed, our simulations show that differences between available OA schemes may entail differences in the calculated EnR (γa) as large as a factor of 5 (Fig. 3a) or even greater (Fig. 2c) after 5 d of evolution. Furthermore, there may be not only quantitative but also qualitative differences in the BB OA simulations, such as a difference between a gradually increasing EnR (in the regime 1) and a humped temporal dependence of EnR (in the regime 2; see, for example, Fig. 2a). Typically, OA VBS schemes are constrained (at least to some extent) with data from aerosol chamber experiments (e.g., Hennigan et al., 2011) which are, however, rarely representative of more than a few hours of BB aerosol aging under atmospheric conditions. Taking into account that major quantitative and qualitative differences between our simulations with different OA schemes are manifested at longer timescales, our results therefore indicate the particular importance of observational constraints at the timescales ranging from tens of hours to several days. Potentially, such constraints can be provided by in situ aerosol measurements (e.g., Jolleys et al., 2012; Shrivastava et al., 2015) or remote (e.g., satellite) observations (Konovalov et al., 2017).
Even if one of the VBS schemes considered in this study were perfectly adequate, its application in the framework of a typical CTM would still likely entail considerable model biases due to several factors. First, the bias may be due to a dependence of BB OA evolution on its initial concentration. Indeed, smearing of BB emissions from an intense but small (relative to the grid cell size) fire within a model grid cell would result in smaller initial concentration (C0) of BB OA in the model than in the real atmosphere. For example, if the model had a horizontal resolution of 50 km×50 km but the fire size was 5 km×5 km, the initial concentration of BB OA in the model would be 2 orders of magnitude lower than within the actual plume (e.g., 102 instead of 104 µg m−3). As indicated by our analysis for several cases (Figs. 6a, 6b, and 6d and 7a, 7b, and 7d), the EnR simulated for such a situation can be strongly overestimated due to its inverse dependence on C0. Second, a model bias in EnR can be caused by a dependence of EnR on the initial plume size, Sp. For example, due to the effect of rapid dilution of BB OA plumes originating from relatively small (with a typical size of about 1 km or less) but multiple fires, a model that does not resolve the plume scales will likely overestimate EnR and corresponding changes of the BB OA mass concentration after its aging during several days if the evolution of BB OA is strongly affected by fragmentation (Fig. 7c and e). However, it is also possible that a CTM will underestimate EnR if functionalization dominates over fragmentation (Fig. 7b). If the BB OA evolution is reproduced adequately with the C17 and T18 schemes, then the same situation (where BB OA plumes originate from relatively small fires) may be associated with a negative bias in the hygroscopicity parameter κorg (Fig. 8b and d) rather than with any significant bias in EnR (Fig. 7a and d). Over shorter timescales (a few hours), a CTM is likely to overestimate EnR and underestimate κorg in the case of small fires, irrespective of the relative importance of functionalization and fragmentation reactions (Figs. 6a–e and 8a, c, and e). Note that our findings concerning the impact of the plume size on EnR after a few initial hours of aging are qualitatively consistent with the results of numerical experiments conducted by Bian et al. (2017) and Hodshire et al. (2019). The net effects of the limited horizontal resolution of a CTM on the simulated BB OA evolution are likely very variable and are hardly possible to predict accurately with a box model, as they should be dependent on the spatial structure and intensity of fire emissions as well as on meteorological conditions. Third, the simulated values of EnR (and to a lesser extent, those of the hygroscopicity parameter) may be biased as a result of model errors in the vertical injection profile of fire emissions. Indeed, available parameterizations can strongly underestimate or overestimate the smoke injection height, sometimes by an order of magnitude (Sofiev et al., 2012); these errors can cause biases in EnR as a result of the sensitivity of the simulations of BB OA to uncertainties in both the plume's density and dilution rate and also to its temperature, affecting thermodynamic equilibria. Similar effects of chemical nonlinearities on simulations of the consequences of atmospheric processing of BB emissions were first pointed out by Chatfield and Delany (1990).
The results of our analysis may be helpful for understanding the reasons for the observational diversity of BB OA aging effects. Indeed, our findings suggest that the occurrence of differences in the observed effects of BB OA aging, such as an increase (see, for example, Yokelson et al., 2009; Konovalov et al., 2015; Vakkari et al., 2018) or a decrease (e.g., Jolleys et al., 2012; 2015) in EnR can be driven by differences in the initial parameters of the BB plumes as well as by the BB aerosol's photochemical age and the ratio between the fragmentation and functionalization reaction pathways. In particular, our simulations predict that aging of BB aerosol in a large plume is more likely to result initially in an increase in EnR, whereas the initial evolution of a small plume is likely to be associated with an initial decrease in EnR (Fig. 2a and c). Consistent with these predictions, there is observational evidence for a growth of EnR in the situations with large-scale fires (e.g., Konovalov et al., 2015, 2017; Vakkari et al., 2018) as well as evidence for an initial drop in γa in a relatively small isolated plume (Akagi et al., 2012). It is noteworthy that in agreement with our simulations corresponding to the regimes 3 and 4, the observations by Akagi et al. (2012) show an increase in EnR after the initial decrease. Our analysis also indicates that if fragmentation dominates over functionalization, an initial growth of EnR in situations with large fires is likely to be followed by a decreasing stage (see the simulations for regime 2 in Figs. 2a, 2b, and 3). A similar humped dependence of EnR on the BB aerosol photochemical age was identified earlier in the analysis of satellite observations of BB aerosol in Siberia (Konovalov et al., 2017). The fact that, according to aircraft observations, EnR can be around or smaller than unity even in relatively large plumes transported during a few days (Jolleys et al., 2012, 2015) is consistent with our simulations corresponding to regimes 2, 4, or 5 in Fig. 3.
Our analysis indicates that BB OA evolution is strongly dependent on the fragmentation branching ratio (Fig. 9), which is known to be a growing function of the oxidation state of OA (Jimenez et al., 2009). It seems reasonable to suggest that the oxidation state of BB OA (and thus the effective fragmentation branching ratio) within a BB plume at any given moment is dependent on the initial chemical composition (and therefore oxidation state) of fresh BB OA. There is evidence (e.g., Grieshop et al., 2009; May et al., 2015; Tiita et al., 2016; Ahern et al., 2019; Lim et al., 2019) that the oxidation state of fresh BB OA is strongly variable, depending on conditions of burning and fuel type. Variable effects of fragmentation reactions have been suggested to be a possible reason for the diversity of values of the BB OA EnR (ranging from about 0.8 to almost 3) in BB aerosol aging experiments (Hennigan et al., 2011). Therefore, the differences between our simulations performed with different oxidation schemes may reflect, to some extent, the diversity of the observed aging effects of BB OA due to variability in its initial chemical composition.
It should be especially noted that the VBS schemes employed in our simulations do not comprise the whole range of uncertainties associated with the representation of the BB OA aging in models. In particular, all of the considered schemes share the common assumption that OA particles are composed of well-mixed liquids, which is also used in the majority of other modeling studies using the VBS framework. However, based on findings from some laboratory experiments, Shrivastava et al. (2013, 2015) argued that SOA should rather be represented as nonvolatile glassy semisolid mass. Available estimates of the annual-mean SOA glass transition temperature (Shiraiwa et al., 2017) indicate that in major biomass burning regions (such as the Amazon basin and Siberia), SOA is typically in the liquid state near the ground but transits to the semi-glassy state towards the top of the boundary layer. Taking these estimates into account, it seems reasonable to expect that the SOA phase state in ambient BB aerosol in these regions is quite variable, depending on relative humidity and ambient temperature. When the equilibrium state of SOA is semisolid, the effects of gas-phase fragmentation reactions are expected to diminish (since SOA, once formed, cannot evaporate), depending on the highly uncertain timescale of transformation of semi-volatile SOA into a nonvolatile state (Shrivastava et al., 2015). Another uncertain factor that affects the evolution of the ambient BB aerosol but is not taken into account in our simulations is heterogeneous oxidation of OA particles. Similar to gas-phase fragmentation reactions, heterogeneous oxidation increases the oxidation state of particulate carbon, resulting in formation of volatile products escaping irreversibly to the gas phase. Kroll et al. (2015) estimated carbon loss from the particles after 1 week of OA aging under typical atmospheric conditions to be in the range from 3 % to 13 %. Heterogeneous reactions would be slowed down further if the particles are in a semisolid state (Shiraiwa et al., 2013a). These estimates mean that heterogeneous oxidation is unlikely to affect BB OA behavior significantly at the timescales addressed in this study except that including even a slow heterogeneous oxidation into our model would inevitably transform regime 1 (a monotonic saturating increase in EnR, leading to a steady state) into regime 2 (an increase in EnR, followed by its decrease), as heterogeneous oxidation would eventually convert all particulate carbon into CO2 (Donahue et al., 2013). Finally, it should again be noted that none of the VBS schemes considered take into account interaction of SVOCs with water. That is, we essentially assume that both POA and SOA are formed of hydrophobic species. This assumption is not expected to have a strong effect on BB aerosol evolution in a relatively dry atmosphere (with the relative humidity below about 60 %) where the water uptake by BB aerosol is small (Hand et al., 2010). Significant uptake of water can result in important contributions of aqueous-phase oxidation reactions to transformations of BB OA chemical composition and to formation of SOA (Brege et al., 2018).
As argued above, the nonlinear behavior of BB OA in our model experiments stems merely from the well-established semi-volatile nature of organic compounds composing it. This fact indicates that the nonlinear features of BB OA evolution, which have been revealed in our simulations, are not a consequence of any simplifications involved in our model but rather an inherent property of real BB aerosol. However, the great diversity of the simulations using different VBS schemes indicates that an accurate quantitative representation of these features in the presently available atmospheric models is yet hardly feasible. Taking into account that regional and global CTMs are not designed to address the scales associated with individual plumes, the results of our study indicate the need for robust sub-grid parameterizations of BB OA evolution. Instead of explicitly assuming variable properties of individual smoke plumes and the BB aerosol they contain, such parameterizations might rely on some external observable characteristics of fire emissions, such as the density and size distribution of fire spots and the fire radiative power, as well as on common meteorological parameters (e.g., temperature and relative humidity). Useful observational constraints for robust representations of atmospheric aging of BB aerosol in CTMs can hopefully be inferred from satellite measurements of BB aerosol (Konovalov et al., 2017).
In this paper, we analyzed the role of the intrinsic nonlinearity of the processes driving gas–particle partitioning and oxidation of SVOCs during the atmospheric evolution of BB organic aerosol. We performed simulations of BB OA evolution during a 5 d period using a microphysical box model in which BB OA chemical transformations and SOA formation were represented within the VBS framework. A simple parameterization based on a Gaussian dispersion model was used to specify several scenarios for dilution of a BB plume. The model was run with several VBS schemes of varying complexity, including 1-D-VBS, 1.5-D-VBS, quasi-2-D-VBS, and 2-D-VBS schemes that had been proposed in the literature to represent BB OA evolution specifically in the framework of regional and global chemistry-transport models (CTMs). We analyzed the BB OA evolution by considering the BB OA mass enhancement ratio (EnR) to be a function of two control parameters, i.e., the initial horizontal plume size, Sp, across the wind direction and the initial BB OA concentration, C0, corresponding to thermodynamic equilibrium. For a part of our simulations, we also considered the dependence of the hygroscopicity parameter, κorg, on the same parameters. The initial plume size controls the dilution rate (the larger Sp, the smaller the dilution rate), and the initial BB OA concentration determines the partitioning of SVOCs between the gas phase and the particles (the larger C0, the smaller the gas-phase fraction of SVOCs).
The simulation results allowed us to identify several qualitatively different regimes of BB OA evolution, which feature a monotonic saturating increase in EnR (regime 1), an increasing and then decreasing EnR (regime 2), an increase in EnR after its initial rapid decrease (regime 3), a stage with an increasing EnR between two intermittent stages of its decrease (regime 4), or a monotonically decreasing EnR (regime 5). The manifestations of nonlinear behavior of BB OA are found to include pronounced dependencies of EnR on both Sp and C0. For relatively fresh BB aerosol (with the age ranging from a few hours to several tens of hours), EnR increases as Sp increases or C0 decreases. However, these kinds of dependencies can be strongly suppressed or even reversed, depending on the VBS scheme used and the aerosol age. Another interesting manifestation of nonlinear behavior of BB OA is possible shifts between the regimes as a result of a change in Sp: for example, the regimes 1 and 2 for slowly diluting large smoke plumes can transform into the regimes 3 and 4, respectively, for small plumes with fast initial dilution. Evolution of κorg is also found to be affected by changes of the control parameters in a nonlinear way, although the manifestations of the nonlinearities are not as spectacular as in the case of the corresponding dependencies for EnR.
Differences between the VBS schemes can result in large quantitative differences between the simulations; they increase with the aerosol age and can almost be as large as a factor of 10 in the EnR values after a 5 d evolution under typical conditions in summer midlatitudes. Such large quantitative differences are usually associated with qualitative differences between the simulations: specifically, the simulations resulting in the largest values of EnR correspond to regime 1 of BB OA evolution, while those yielding relatively small EnR values typically correspond to regimes 2, 4, or 5. Our analysis indicates that one of the major factors behind the quantitative and qualitative differences between the simulations with the different VBS schemes is the ratio between fragmentation and functionalization. Specifically, prevalence of fragmentation over functionalization (when the effective fragmentation branching ratio exceeds 0.5) gives rise to regimes 2 and 4 and is associated with an eventual decrease in EnR, while the dominance of functionalization over fragmentation is associated with regimes 1 and 3, which correspond to a saturating increase in EnR. A change of the fragmentation branching ratio also can eventually cause a reversal of the dependence of EnR calculated after a 5 d evolution on Sp: that is, EnR increases with increasing Sp if fragmentation is prevailing over functionalization and decreases otherwise. Future studies involving a microphysical model with different OA oxidation schemes are needed to examine how the BB OA behavior depends on varying environmental conditions and on several factors (e.g., a possibility of SOA being in semi-glassy state and heterogeneous and aqueous-phase oxidation reactions) that have not been taken into account in our simulations.
We argue that in spite of the inevitable limitations of our study, its results have important implications for modeling of BB OA in the framework of CTMs. First, our analysis allows us to point out nonlinear behavior of the OA system as a possible reason for the observed diversity of effects of aging of ambient BB aerosol (see, for example, Cubison et al., 2011). A better understanding of the factors behind the diversity of BB OA aging effects is essential for ensuring the efficiency of in situ ambient observations of BB OA as observational constraints to representations of BB OA processes in CTMs. Second, our findings suggest that uncertainties associated with the representation of BB OA in CTMs may have a major impact on the simulated behavior of BB aerosol at the scales of its typical lifetime in the boundary layer with respect to dry deposition. Note that these uncertainties can be especially important in the context of modeling rapid climate change in the Arctic, where BB OA provides a considerable contribution to the radiative balance (Sand et al., 2015). Third, a rather strong sensitivity of EnR evolution to the parameters of a BB plume (such as C0 and Sp) indicates that application of even a perfect VBS scheme in the framework of available regional or global models would likely entail considerable model biases in simulations of atmospheric transformations of BB aerosol due to the fact that the evolution of individual BB plumes with varying parameters cannot be accurately represented on a typical model grid with a horizontal resolution ranging from tens to a few hundreds of kilometers. Overall, our findings call for the development of sub-grid parameterizations of the BB OA evolution, which could be constrained with available in situ and satellite measurements but, at the same time, would be sufficiently robust with respect to nonlinear effects that cannot be properly addressed in typical CTMs.
The data presented in this paper were obtained by integrating the dynamic equations specified in Sect. 2.1 and are available upon request from the corresponding author. Numerical codes representing the equations and the involved chemical and microphysical processes in the framework of the box model used in this study are based on the routines and interfaces of the CHIMERE chemistry-transport model. The CHIMERE codes are available at http://www.lmd.polytechnique.fr/chimere/ (last access: 23 April 2019).
IBK and MB designed the study. IBK also performed the simulations and data analysis and wrote the paper. NAG contributed to development of the box model. MOA contributed to the discussion of the results and to writing the paper.
The authors declare that they have no conflict of interest.
The authors thank the anonymous reviewers for their helpful comments.
The simulations and analysis of evolution of the BB OA mass enhancement ratio were supported by the Russian Foundation for Basic Research (grant no. 18-05-00911). The simulations of the hygroscopicity parameter were performed with support from the Russian Science Foundation (grant agreement no. 18-17-00076). Igor B. Konovalov was supported by travel expenses in the framework of the French PARCS (Pollution in the ARCtic System – PARCS) project.
This paper was edited by Kostas Tsigaridis and reviewed by two anonymous referees.
Adler, G., Flores, J. M., Abo Riziq, A., Borrmann, S., and Rudich, Y.: Chemical, physical, and optical evolution of biomass burning aerosols: a case study, Atmos. Chem. Phys., 11, 1491–1503, https://doi.org/10.5194/acp-11-1491-2011, 2011.
Ahern, A. T., Robinson, E. S., Tkacik, D. S., Saleh, R., Hatch, L. E., Barsanti, K. C., Stockwell, C. E., Yokelson, R. J., Presto, A. A., Robinson, A. L., Sullivan, R. C., and Donahue, N. M.: Production of secondary organic aerosol during aging of biomass burning smoke from fresh fuels and its relationship to VOC precursors, J. Geophys. Res., 124, 3583–3606, https://doi.org/10.1029/2018JD029068, 2019.
Akagi, S. K., Craven, J. S., Taylor, J. W., McMeeking, G. R., Yokelson, R. J., Burling, I. R., Urbanski, S. P., Wold, C. E., Seinfeld, J. H., Coe, H., Alvarado, M. J., and Weise, D. R.: Evolution of trace gases and particles emitted by a chaparral fire in California, Atmos. Chem. Phys., 12, 1397–1421, https://doi.org/10.5194/acp-12-1397-2012, 2012.
Andreae, M. O.: Emission of trace gases and aerosols from biomass burning – an updated assessment, Atmos. Chem. Phys., 19, 8523–8546, https://doi.org/10.5194/acp-19-8523-2019, 2019.
Andreae, M. O. and Gelencsér, A.: Black carbon or brown carbon? The nature of light-absorbing carbonaceous aerosols, Atmos. Chem. Phys., 6, 3131–3148, https://doi.org/10.5194/acp-6-3131-2006, 2006.
Archer-Nicholls, S., Lowe, D., Schultz, D. M., and McFiggans, G.: Aerosol–radiation–cloud interactions in a regional coupled model: the effects of convective parameterisation and resolution, Atmos. Chem. Phys., 16, 5573–5594, https://doi.org/10.5194/acp-16-5573-2016, 2016.
Barsanti, K. C. and Pankow, J. F.: Thermodynamics of the formation of atmospheric organic particulate matter by accretion reactions – Part 1: aldehydes and ketones, Atmos. Environ., 38, 4371–4382, https://doi.org/10.1016/j.atmosenv.2004.03.035, 2004.
Bekryaev, R. V., Polyakov, I. V., and Alexeev, V. A.: Role of polar amplification in long-term surface air temperature variations and modern Arctic warming, J. Climate, 23, 3888–3906, https://doi.org/10.1175/2010jcli3297.1, 2010.
Bertrand, A., Stefenelli, G., Jen, C. N., Pieber, S. M., Bruns, E. A., Ni, H., Temime-Roussel, B., Slowik, J. G., Goldstein, A. H., El Haddad, I., Baltensperger, U., Prévôt, A. S. H., Wortham, H., and Marchand, N.: Evolution of the chemical fingerprint of biomass burning organic aerosol during aging, Atmos. Chem. Phys., 18, 7607–7624, https://doi.org/10.5194/acp-18-7607-2018, 2018.
Bessagnet, B., Menut, L., Curci, G., Hodzic, A., Guillaume, B., Liousse, C., Moukhtar, S., Pun, B., Seigneur, C., and Schulz, M.: Regional modeling of carbonaceous aerosols over Europe – Focus on Secondary Organic Aerosols, J. Atmos. Chem., 61, 175–202, https://doi.org/10.1007/s10874-009-9129-2, 2008.
Bessagnet, B., Pirovano, G., Mircea, M., Cuvelier, C., Aulinger, A., Calori, G., Ciarelli, G., Manders, A., Stern, R., Tsyro, S., García Vivanco, M., Thunis, P., Pay, M.-T., Colette, A., Couvidat, F., Meleux, F., Rouïl, L., Ung, A., Aksoyoglu, S., Baldasano, J. M., Bieser, J., Briganti, G., Cappelletti, A., D'Isidoro, M., Finardi, S., Kranenburg, R., Silibello, C., Carnevale, C., Aas, W., Dupont, J.-C., Fagerli, H., Gonzalez, L., Menut, L., Prévôt, A. S. H., Roberts, P., and White, L.: Presentation of the EURODELTA III intercomparison exercise – evaluation of the chemistry transport models' performance on criteria pollutants and joint analysis with meteorology, Atmos. Chem. Phys., 16, 12667–12701, https://doi.org/10.5194/acp-16-12667-2016, 2016.
Bian, Q., Jathar, S. H., Kodros, J. K., Barsanti, K. C., Hatch, L. E., May, A. A., Kreidenweis, S. M., and Pierce, J. R.: Secondary organic aerosol formation in biomass-burning plumes: theoretical analysis of lab studies and ambient plumes, Atmos. Chem. Phys., 17, 5459–5475, https://doi.org/10.5194/acp-17-5459-2017, 2017.
Bond, T. C., Doherty, S. J., Fahey, D. W., Forster, P. M., Berntsen, T., DeAngelo, B. J., Flanner, M. G., Ghan, S., Kärcher, B., Koch, D., Kinne, S., Kondo, Y., Quinn, P. K., Sarofim, M. C., Schultz, M. G., Schulz, M., Venkataraman, C., Zhang, H., Zhang, S., Bellouin, N., Guttikunda, S. K., Hopke, P. K., Jacobson, M. Z., Kaiser, J. W., Klimont, Z., Lohmann, U., Schwarz, J. P., Shindell, D., Storelvmo, T., Warren, S. G., and Zender, C. S.: Bounding the role of black carbon in the climate system: A scientific assessment, J. Geophys. Res.-Atmos., 118, 5380–5552, https://doi.org/10.1002/jgrd.50171, 2013.
Brege, M., Paglione, M., Gilardoni, S., Decesari, S., Facchini, M. C., and Mazzoleni, L. R.: Molecular insights on aging and aqueous-phase processing from ambient biomass burning emissions-influenced Po Valley fog and aerosol, Atmos. Chem. Phys., 18, 13197–13214, https://doi.org/10.5194/acp-18-13197-2018, 2018.
Brito, J., Rizzo, L. V., Morgan, W. T., Coe, H., Johnson, B., Haywood, J., Longo, K., Freitas, S., Andreae, M. O., and Artaxo, P.: Ground-based aerosol characterization during the South American Biomass Burning Analysis (SAMBBA) field experiment, Atmos. Chem. Phys., 14, 12069–12083, https://doi.org/10.5194/acp-14-12069-2014, 2014.
Burnett, R., Chen, H., Szyszkowicz, M., Fann, N., Hubbell, B., Pope, C. A., Apte, J. S., Brauer, M., Cohen, A., Weichenthal, S., Coggins, J., Di, Q., Brunekreef, B., Frostad, J., Lim, S. S., Kan, H., Walker, K. D., Thurston, G. D., Hayes, R. B., Lim, C. C., Turner, M. C., Jerrett, M., Krewski, D., Gapstur, S. M., Diver, W. R., Ostro, B., Goldberg, D., Crouse, D. L., Martin, R. V., Peters, P., Pinault, L., Tjepkema, M., van Donkelaar, A., Villeneuve, P. J., Miller, A. B., Yin, P., Zhou, M., Wang, L., Janssen, N. A. H., Marra, M., Atkinson, R. W., Tsang, H., Quoc Thach, T., Cannon, J. B., Allen, R. T., Hart, J. E., Laden, F., Cesaroni, G., Forastiere, F., Weinmayr, G., Jaensch, A., Nagel, G., Concin, H., and Spadaro, J. V.: Global estimates of mortality associated with long-term exposure to outdoor fine particulate matter, P. Natl. Acad. Sci., 115, 9592–9597, https://doi.org/10.1073/pnas.1803222115, 2018.
Camredon, M., Aumont, B., Lee-Taylor, J., and Madronich, S.: The SOA/VOC/NOx system: an explicit model of secondary organic aerosol formation, Atmos. Chem. Phys., 7, 5599–5610, https://doi.org/10.5194/acp-7-5599-2007, 2007.
Capes, G., Johnson, B., McFiggans, G., Williams, P. I., Haywood, J., and Coe, H.: Aging of biomass burning aerosols over West Africa: Aircraft measurements of chemical composition, microphysical properties, and emission ratios, J. Geophys. Res., 113, D00C15, https://doi.org/10.1029/2008jd009845, 2008.
Chang, R. Y.-W., Slowik, J. G., Shantz, N. C., Vlasenko, A., Liggio, J., Sjostedt, S. J., Leaitch, W. R., and Abbatt, J. P. D.: The hygroscopicity parameter (κ) of ambient organic aerosol at a field site subject to biogenic and anthropogenic influences: relationship to degree of aerosol oxidation, Atmos. Chem. Phys., 10, 5047–5064, https://doi.org/10.5194/acp-10-5047-2010, 2010.
Chatfield, R. B. and Delany, A. C.: Convection links biomass burning to increased tropical ozone; However, models will tend to over-predict O3, J. Geophys. Res., 95, 18473–18488, 1990.
Ciarelli, G., El Haddad, I., Bruns, E., Aksoyoglu, S., Möhler, O., Baltensperger, U., and Prévôt, A. S. H.: Constraining a hybrid volatility basis-set model for aging of wood-burning emissions using smog chamber experiments: a box-model study based on the VBS scheme of the CAMx model (v5.40), Geosci. Model Dev., 10, 2303–2320, https://doi.org/10.5194/gmd-10-2303-2017, 2017a.
Ciarelli, G., Aksoyoglu, S., El Haddad, I., Bruns, E. A., Crippa, M., Poulain, L., Äijälä, M., Carbone, S., Freney, E., O'Dowd, C., Baltensperger, U., and Prévôt, A. S. H.: Modelling winter organic aerosol at the European scale with CAMx: evaluation and source apportionment with a VBS parameterization based on novel wood burning smog chamber experiments, Atmos. Chem. Phys., 17, 7653–7669, https://doi.org/10.5194/acp-17-7653-2017, 2017b.
Cubison, M. J., Ortega, A. M., Hayes, P. L., Farmer, D. K., Day, D., Lechner, M. J., Brune, W. H., Apel, E., Diskin, G. S., Fisher, J. A., Fuelberg, H. E., Hecobian, A., Knapp, D. J., Mikoviny, T., Riemer, D., Sachse, G. W., Sessions, W., Weber, R. J., Weinheimer, A. J., Wisthaler, A., and Jimenez, J. L.: Effects of aging on organic aerosol from open biomass burning smoke in aircraft and laboratory studies, Atmos. Chem. Phys., 11, 12049–12064, https://doi.org/10.5194/acp-11-12049-2011, 2011.
DeCarlo, P. F., Dunlea, E. J., Kimmel, J. R., Aiken, A. C., Sueper, D., Crounse, J., Wennberg, P. O., Emmons, L., Shinozuka, Y., Clarke, A., Zhou, J., Tomlinson, J., Collins, D. R., Knapp, D., Weinheimer, A. J., Montzka, D. D., Campos, T., and Jimenez, J. L.: Fast airborne aerosol size and chemistry measurements above Mexico City and Central Mexico during the MILAGRO campaign, Atmos. Chem. Phys., 8, 4027–4048, https://doi.org/10.5194/acp-8-4027-2008, 2008.
Donahue, N. M., Robinson, A. L., Stanier, C. O., and Pandis, S. N.: Coupled partitioning, dilution, and chemical aging of semivolatile organics, Environ. Sci. Technol., 40, 2635–2643, https://doi.org/10.1021/es052297c, 2006.
Donahue, N. M., Epstein, S. A., Pandis, S. N., and Robinson, A. L.: A two-dimensional volatility basis set: 1. organic-aerosol mixing thermodynamics, Atmos. Chem. Phys., 11, 3303–3318, https://doi.org/10.5194/acp-11-3303-2011, 2011.
Donahue, N. M., Kroll, J. H., Pandis, S. N., and Robinson, A. L.: A two-dimensional volatility basis set – Part 2: Diagnostics of organic-aerosol evolution, Atmos. Chem. Phys., 12, 615–634, https://doi.org/10.5194/acp-12-615-2012, 2012a.
Donahue, N. M., Henry, K. M., Mentel, T. F., Kiendler-Scharr, A., Spindler, C., Bohn, B., Brauers, T., Dorn, H. P., Fuchs, H., Tillmann, R., Wahner, A., Saathoff, H., Naumann, K.-H., Möhler, O., Leisner, T., Müller, L., Reinnig, M.-C., Hoffmann, T., Salo, K., Hallquist, M., Frosch, M., Bilde, M., Tritscher, T., Barmet, P., Praplan, A. P., DeCarlo, P. F., Dommen, J., Prévôt, A. S. H., and Baltensperger, U.: Aging of biogenic secondary organic aerosol via gas-phase OH radical reactions, P. Natl. Acad. Sci., 109, 13503–13508, https://doi.org/10.1073/pnas.1115186109, 2012b.
Donahue, N. M., Chuang, W., Epstein, S. A., Kroll, J. H., Worsnop, D. R., Robinson, A. L., Adams, P. J., and Pandis, S. N.: Why do organic aerosols exist? Understanding aerosol lifetimes using the two-dimensional volatility basis set, Environ. Chem., 10, 151–157, https://doi.org/10.1071/EN13022, 2013.
Fan, X., Yu, X., Wang, Y., Xiao, X., Li, F., Xie, Y., Wei, S., Song, J., and Peng, P.: The aging behaviors of chromophoric biomass burning brown carbon during dark aqueous hydroxyl radical oxidation processes in laboratory studies, Atmos. Environ., 205, 9–18, https://doi.org/10.1016/j.atmosenv.2019.02.039, 2019.
Fang, Z., Deng, W., Zhang, Y., Ding, X., Tang, M., Liu, T., Hu, Q., Zhu, M., Wang, Z., Yang, W., Huang, Z., Song, W., Bi, X., Chen, J., Sun, Y., George, C., and Wang, X.: Open burning of rice, corn and wheat straws: primary emissions, photochemical aging, and secondary organic aerosol formation, Atmos. Chem. Phys., 17, 14821–14839, https://doi.org/10.5194/acp-17-14821-2017, 2017.
Feng, Y., Ramanathan, V., and Kotamarthi, V. R.: Brown carbon: a significant atmospheric absorber of solar radiation?, Atmos. Chem. Phys., 13, 8607–8621, https://doi.org/10.5194/acp-13-8607-2013, 2013.
Forrister, H., Liu, J., Scheuer, E., Dibb, J., Ziemba, L., Thornhill, K. L., Anderson, B., Diskin, G., Perring, A. E., Schwarz, J. P., Campuzano-Jost, P., Day, D. A., Palm, B. B., Jimenez, J. L., Nenes, A., and Weber, R. J.: Evolution of brown carbon in wildfire plumes, Geophys. Res. Lett., 42, 2015GL063897, https://doi.org/10.1002/2015GL063897, 2015.
Gelbard, F. and Seinfeld, J. H.: Simulation of multicomponent aerosol dynamics, J. Colloid Interf. Sci., 78, 485–501, 1980.
Grieshop, A. P., Logue, J. M., Donahue, N. M., and Robinson, A. L.: Laboratory investigation of photochemical oxidation of organic aerosol from wood fires 1: measurement and simulation of organic aerosol evolution, Atmos. Chem. Phys., 9, 1263–1277, https://doi.org/10.5194/acp-9-1263-2009, 2009.
Hand, J. L., Day, D. E., McMeeking, G. M., Levin, E. J. T., Carrico, C. M., Kreidenweis, S. M., Malm, W. C., Laskin, A., and Desyaterik, Y.: Measured and modeled humidification factors of fresh smoke particles from biomass burning: role of inorganic constituents, Atmos. Chem. Phys., 10, 6179–6194, https://doi.org/10.5194/acp-10-6179-2010, 2010.
Heald, C. L., Kroll, J. H., Jimenez, J. L., Docherty, K. S., DeCarlo, P. F., Aiken, A. C., Chen, Q., Martin, S. T., Farmer, D. K., and Artaxo, P.: A simplified description of the evolution of organic aerosol composition in the atmosphere, Geophys. Res. Lett., 37, L08803, https://doi.org/10.1029/2010GL042737, 2010.
Hennigan, C. J., Miracolo, M. A., Engelhart, G. J., May, A. A., Presto, A. A., Lee, T., Sullivan, A. P., McMeeking, G. R., Coe, H., Wold, C. E., Hao, W.-M., Gilman, J. B., Kuster, W. C., de Gouw, J., Schichtel, B. A., Collett Jr., J. L., Kreidenweis, S. M., and Robinson, A. L.: Chemical and physical transformations of organic aerosol from the photo-oxidation of open biomass burning emissions in an environmental chamber, Atmos. Chem. Phys., 11, 7669–7686, https://doi.org/10.5194/acp-11-7669-2011, 2011.
Hobbs, P. V., Sinha, P., Yokelson, R. J., Christian, T. J., Blake, D. R., Gao, S., Kirchstetter, T. W., Novakov, T., and Pilewkie, P.: Evolution of gases and particles from a savanna fire in South Africa, J. Geophys. Res., 108, 8485, https://doi.org/10.1029/2002JD002392, 2003.
Hodzic, A., Jimenez, J. L., Madronich, S., Canagaratna, M. R., DeCarlo, P. F., Kleinman, L., and Fast, J.: Modeling organic aerosols in a megacity: potential contribution of semi-volatile and intermediate volatility primary organic compounds to secondary organic aerosol formation, Atmos. Chem. Phys., 10, 5491–5514, https://doi.org/10.5194/acp-10-5491-2010, 2010.
Hodshire, A. L., Bian, Q., Ramnarine, E., Lonsdale, C. R., Alvarado, M. J., Kreidenweis, S. M., Jathar, S. H., and Pierce, J. R.: More than emissions and chemistry: Fire size, dilution, and background aerosol also greatly influence near-field biomass burning aerosol aging, J. Geophys. Res.-Atmos., 124, 5589–5611, https://doi.org/10.1029/2018JD029674, 2019.
IPCC: Summary for Policymakers, in: Climate Change 2013: The Physical Science Basis. Contribution of Working Group I to the Fifth Assessment Report of the Intergovernmental Panel on Climate Change, edited by: Stocker, T. F., Qin, D., Plattner, G.-K., Tignor, M., Allen S. K., Boschung, J., Nauels, A., Xia, Y., Bex, V., and Midgley, P. M., Cambridge University Press, Cambridge, UK and New York, NY, USA, 2013.
Jang, M. S., Czoschke, N. M., Lee S., and Kamens, R. M.: Heterogeneous atmospheric aerosol production by acid-catalyzed particle-phase reactions, Science, 298, 5594, 814–817, https://doi.org/10.1126/science.1075798, 2002.
Jathar, S. H., Gordon, T. D., Hennigan, C. J., Pye, H. O. T., Pouliot, G., Adams, P. J., Donahue, N. M., and Robinson, A. L.: Unspeciated organic emissions from combustion sources and their influence on the secondary organic aerosol budget in the United States, P. Natl. Acad. Sci. USA, 111, 10473–10478, https://doi.org/10.1073/pnas.1323740111, 2014.
Jimenez, J., Canagaratna, M., Donahue, N., Prevot, A., Zhang, Q., Kroll, J. H., DeCarlo, P. F., Allan, J. D., Coe, H., Ng, N. L., Aiken, A. C., Docherty, K. S., Ulbrich, I. M., Grieshop, A. P., Robinson, A. L., Duplissy, J., Smith, J. D., Wilson, K. R., Lanz, V. A., Hueglin, C., Sun, Y. L., Tian, J., Laaksonen, A., Raatikaine, T., Rautiainen, J., Vaattovaara, P., Ehn, M., Kulmala, M., Tomlinson, J. M., Collins, D. R., Cubison, M. J., Dunlea, E. J., Huffman, J. A., Onasch, T. B., Alfarra, M. R., Williams, P. I., Bower, K., Kondo, Y., Schneider, J., Drewnick, F., Borrmann, S., Weimer, S., Demerjian, K., Salcedo, D., Cottrell, L., Griffin, R., Takami, A., Miyoshi, T., Hatakeyama, S., Shimono, A., Sun, J. Y., Zhang, Y. M., Dzepina, K., Kimmel, J. R., Sueper, D., Jayne, J. T., Herndon, S. C., Trimborn, A. M., Williams, L. R., Wood, E. C., Middlebrook, A. M., Kolb, C. E., Baltensperger, U., and Worsnop, D. R.: Evolution of organic aerosols in the atmosphere, Science, 326, 1525–1529, https://doi.org/10.1126/science.1180353, 2009.
Jo, D. S., Park, R. J., Lee, S., Kim, S.-W., and Zhang, X.: A global simulation of brown carbon: implications for photochemistry and direct radiative effect, Atmos. Chem. Phys., 16, 3413–3432, https://doi.org/10.5194/acp-16-3413-2016, 2016.
Jolleys, M. D., Coe, H., McFiggans, G., Capes, G., Allan, J. D., Crosier, J., Williams, P. I., Allen, G., Bower, K. N., Jimenez, J. L., Russell, L. M., Grutter, M., and Baumgardner, D.: Characterizing the aging of biomass burning organic aerosol by use of mixing ratios: a meta-analysis of four regions, Environ. Sci. Technol., 46, 13093–13102, https://doi.org/10.1021/es302386v, 2012.
Jolleys, M. D., Coe, H., McFiggans, G., Taylor, J. W., O'Shea, S. J., Le Breton, M., Bauguitte, S. J.-B., Moller, S., Di Carlo, P., Aruffo, E., Palmer, P. I., Lee, J. D., Percival, C. J., and Gallagher, M. W.: Properties and evolution of biomass burning organic aerosol from Canadian boreal forest fires, Atmos. Chem. Phys., 15, 3077–3095, https://doi.org/10.5194/acp-15-3077-2015, 2015.
Klug, W.: A method for determining diffusion conditions from synoptic observations, Staub-Reinhalt. Luft, 29, 14–20, 1969.
Konovalov, I. B., Berezin, E. V., Ciais, P., Broquet, G., Beekmann, M., Hadji-Lazaro, J., Clerbaux, C., Andreae, M. O., Kaiser, J. W., and Schulze, E.-D.: Constraining CO2 emissions from open biomass burning by satellite observations of co-emitted species: a method and its application to wildfires in Siberia, Atmos. Chem. Phys., 14, 10383–10410, https://doi.org/10.5194/acp-14-10383-2014, 2014.
Konovalov, I. B., Beekmann, M., Berezin, E. V., Petetin, H., Mielonen, T., Kuznetsova, I. N., and Andreae, M. O.: The role of semi-volatile organic compounds in the mesoscale evolution of biomass burning aerosol: a modeling case study of the 2010 mega-fire event in Russia, Atmos. Chem. Phys., 15, 13269–13297, https://doi.org/10.5194/acp-15-13269-2015, 2015.
Konovalov, I. B., Berezin, E. V., and Beekmann, M.: Effect of photochemical self-action of carbon-containing aerosol: wildfires, Izv. Atmos. Ocean. Phy., 52, 263–270, https://doi.org/10.1134/S0001433816030063, 2016.
Konovalov, I. B., Beekmann, M., Berezin, E. V., Formenti, P., and Andreae, M. O.: Probing into the aging dynamics of biomass burning aerosol by using satellite measurements of aerosol optical depth and carbon monoxide, Atmos. Chem. Phys., 17, 4513–4537, https://doi.org/10.5194/acp-17-4513-2017, 2017.
Konovalov, I. B., Lvova, D. A., Beekmann, M., Jethva, H., Mikhailov, E. F., Paris, J.-D., Belan, B. D., Kozlov, V. S., Ciais, P., and Andreae, M. O.: Estimation of black carbon emissions from Siberian fires using satellite observations of absorption and extinction optical depths, Atmos. Chem. Phys., 18, 14889–14924, https://doi.org/10.5194/acp-18-14889-2018, 2018.
Koo, B., Knipping, E., and Yarwood, G.: 1.5-Dimensional volatility basis set approach for modeling organic aerosol in CAMx and CMAQ, Atmos. Environ., 95, 158–164, https://doi.org/10.1016/j.atmosenv.2014.06.031, 2014.
Kroll, J. H., Lim, C. Y., Kessler, S. H., and Wilson, K. R.: Heterogeneous oxidation of atmospheric organic aerosol: Kinetics of changes to the amount and oxidation state of particlephase organic carbon, J. Phys. Chem. A, 119, 10767–10783, https://doi.org/10.1021/acs.jpca.5b06946, 2015.
Lambe, A. T., Onasch, T. B., Massoli, P., Croasdale, D. R., Wright, J. P., Ahern, A. T., Williams, L. R., Worsnop, D. R., Brune, W. H., and Davidovits, P.: Laboratory studies of the chemical composition and cloud condensation nuclei (CCN) activity of secondary organic aerosol (SOA) and oxidized primary organic aerosol (OPOA), Atmos. Chem. Phys., 11, 8913–8928, https://doi.org/10.5194/acp-11-8913-2011, 2011.
Lannuque, V., Camredon, M., Couvidat, F., Hodzic, A., Valorso, R., Madronich, S., Bessagnet, B., and Aumont, B.: Exploration of the influence of environmental conditions on secondary organic aerosol formation and organic species properties using explicit simulations: development of the VBS-GECKO parameterization, Atmos. Chem. Phys., 18, 13411–13428, https://doi.org/10.5194/acp-18-13411-2018, 2018.
Lee-Taylor, J., Madronich, S., Aumont, B., Baker, A., Camredon, M., Hodzic, A., Tyndall, G. S., Apel, E., and Zaveri, R. A.: Explicit modeling of organic chemistry and secondary organic aerosol partitioning for Mexico City and its outflow plume, Atmos. Chem. Phys., 11, 13219–13241, https://doi.org/10.5194/acp-11-13219-2011, 2011.
Lee-Taylor, J., Hodzic, A., Madronich, S., Aumont, B., Camredon, M., and Valorso, R.: Multiday production of condensing organic aerosol mass in urban and forest outflow, Atmos. Chem. Phys., 15, 595–615, https://doi.org/10.5194/acp-15-595-2015, 2015.
Lelieveld, J., Klingmüller, K., Pozzer, A., Burnett, R. T., Haines, A., and Ramanathan, V.: Effects of fossil fuel and total anthropogenic emission removal on public health and climate, P. Natl. Acad. Sci., 116, 7192–7197, https://doi.org/10.1073/pnas.1819989116, 2019.
Lim, C. Y., Hagan, D. H., Coggon, M. M., Koss, A. R., Sekimoto, K., de Gouw, J., Warneke, C., Cappa, C. D., and Kroll, J. H.: Secondary organic aerosol formation from biomass burning emissions, Atmos. Chem. Phys. Discuss., https://doi.org/10.5194/acp-2019-326, in review, 2019.
May, A. A., Levin, E. J. T., Hennigan, C. J., Riipinen, I., Lee, T., Collett Jr., J. L., Jimenez, J. L., Kreidenweis, S. M., and Robinson, A. L.: Gas-particle partitioning of primary organic aerosol emissions: 3. Biomass burning, J. Geophys. Res.-Atmos., 118, 11327–11338, https://doi.org/10.1002/jgrd.50828, 2013.
May, A. A., Lee, T., McMeeking, G. R., Akagi, S., Sullivan, A. P., Urbanski, S., Yokelson, R. J., and Kreidenweis, S. M.: Observations and analysis of organic aerosol evolution in some prescribed fire smoke plumes, Atmos. Chem. Phys., 15, 6323–6335, https://doi.org/10.5194/acp-15-6323-2015, 2015.
Menut, L., Bessagnet, B., Khvorostyanov, D., Beekmann, M., Blond, N., Colette, A., Coll, I., Curci, G., Foret, G., Hodzic, A., Mailler, S., Meleux, F., Monge, J.-L., Pison, I., Siour, G., Turquety, S., Valari, M., Vautard, R., and Vivanco, M. G.: CHIMERE 2013: a model for regional atmospheric composition modelling, Geosci. Model Dev., 6, 981–1028, https://doi.org/10.5194/gmd-6-981-2013, 2013.
Mikhailov, E. F., Mironov, G. N., Pöhlker, C., Chi, X., Krüger, M. L., Shiraiwa, M., Förster, J.-D., Pöschl, U., Vlasenko, S. S., Ryshkevich, T. I., Weigand, M., Kilcoyne, A. L. D., and Andreae, M. O.: Chemical composition, microstructure, and hygroscopic properties of aerosol particles at the Zotino Tall Tower Observatory (ZOTTO), Siberia, during a summer campaign, Atmos. Chem. Phys., 15, 8847–8869, https://doi.org/10.5194/acp-15-8847-2015, 2015.
Mikhailov, E. F., Mironova, S., Mironov, G., Vlasenko, S., Panov, A., Chi, X., Walter, D., Carbone, S., Artaxo, P., Heimann, M., Lavric, J., Pöschl, U., and Andreae, M. O.: Long-term measurements (2010–2014) of carbonaceous aerosol and carbon monoxide at the Zotino Tall Tower Observatory (ZOTTO) in central Siberia, Atmos. Chem. Phys., 17, 14365–14392, https://doi.org/10.5194/acp-17-14365-2017, 2017.
Murphy, B. N., Donahue, N. M., Fountoukis, C., Dall'Osto, M., O'Dowd, C., Kiendler-Scharr, A., and Pandis, S. N.: Functionalization and fragmentation during ambient organic aerosol aging: application of the 2-D volatility basis set to field studies, Atmos. Chem. Phys., 12, 10797–10816, https://doi.org/10.5194/acp-12-10797-2012, 2012.
Odum, J. R., Jungkamp, T. P.W., Griffin, R. J., Forster, H. J. L., Flagan, R. C., and Seinfeld, J. H.: Aromatics, reformulated gasoline and atmospheric organic aerosol formation, Environ. Sci. Technol., 31, 1890–1897, 1997.
Pankow, J. F.: An absorption model of gas/particle partitioning of organic compounds in the atmosphere, Atmos. Environ., 28, 185–188, https://doi.org/10.1016/1352-2310(94)90093-0, 1994.
Pankow, J. F. and Asher, W. E.: SIMPOL.1: a simple group contribution method for predicting vapor pressures and enthalpies of vaporization of multifunctional organic compounds, Atmos. Chem. Phys., 8, 2773–2796, https://doi.org/10.5194/acp-8-2773-2008, 2008.
Paris, J.-D., Stohl, A., Nédélec, P., Arshinov, M. Yu., Panchenko, M. V., Shmargunov, V. P., Law, K. S., Belan, B. D., and Ciais, P.: Wildfire smoke in the Siberian Arctic in summer: source characterization and plume evolution from airborne measurements, Atmos. Chem. Phys., 9, 9315–9327, https://doi.org/10.5194/acp-9-9315-2009, 2009.
Petrenko, M., Kahn, R., Chin, M., and Limbacher, J.: Refined use of satellite aerosol optical depth snapshots to constrain biomass burning emissions in the GOCART model, J. Geophys. Res.-Atmos., 122, 10983–11004, https://doi.org/10.1002/2017JD026693, 2017.
Petters, M. D. and Kreidenweis, S. M.: A single parameter representation of hygroscopic growth and cloud condensation nucleus activity, Atmos. Chem. Phys., 7, 1961–1971, https://doi.org/10.5194/acp-7-1961-2007, 2007.
Pokhrel, R. P., Beamesderfer, E. R., Wagner, N. L., Langridge, J. M., Lack, D. A., Jayarathne, T., Stone, E. A., Stockwell, C. E., Yokelson, R. J., and Murphy, S. M.: Relative importance of black carbon, brown carbon, and absorption enhancement from clear coatings in biomass burning emissions, Atmos. Chem. Phys., 17, 5063–5078, https://doi.org/10.5194/acp-17-5063-2017, 2017.
Pope, C. A., Ezzati, M., and Dockery, D. W.: Fine-Particulate Air Pollution and Life Expectancy in the United States, N. Engl. J. Med., 360, 376–386, https://doi.org/10.1056/NEJMsa0805646, 2009.
Pratt, K. A., Murphy, S. M., Subramanian, R., DeMott, P. J., Kok, G. L., Campos, T., Rogers, D. C., Prenni, A. J., Heymsfield, A. J., Seinfeld, J. H., and Prather, K. A.: Flight-based chemical characterization of biomass burning aerosols within two prescribed burn smoke plumes, Atmos. Chem. Phys., 11, 12549–12565, https://doi.org/10.5194/acp-11-12549-2011, 2011.
Pun, B. K., Seigneur, C., and Lohman, K.: Modeling secondary organic aerosol formation via multiphase partitioning with molecular data, Environ. Sci. Technol., 40, 4722–4731, 2006.
Reddington, C. L., Spracklen, D. V., Artaxo, P., Ridley, D. A., Rizzo, L. V., and Arana, A.: Analysis of particulate emissions from tropical biomass burning using a global aerosol model and long-term surface observations, Atmos. Chem. Phys., 16, 11083–11106, https://doi.org/10.5194/acp-16-11083-2016, 2016.
Reid, J. S., Koppmann, R., Eck, T. F., and Eleuterio, D. P.: A review of biomass burning emissions part II: intensive physical properties of biomass burning particles, Atmos. Chem. Phys., 5, 799–825, https://doi.org/10.5194/acp-5-799-2005, 2005.
Riipinen, I., Pierce, J. R., Donahue, N. M., and Pandis, S. N.: Equilibration time scales of organic aerosol inside thermodenuders: Evaporation kinetics versus thermodynamics, Atmos. Environ., 44, 597–607, 2010.
Robinson, A. L., Donahue, N. M., Shrivastava, M. K., Weitkamp, E. A., Sage, A. M., Grieshop, A. P., Lane, T. E., Pierce, J. R., and Pandis, S. N.: Rethinking organic aerosols: Semivolatile emissions and photochemical aging, Science, 315, 1259–1262, https://doi.org/10.1126/science.1133061, 2007.
Sakamoto, K. M., Allan, J. D., Coe, H., Taylor, J. W., Duck, T. J., and Pierce, J. R.: Aged boreal biomass-burning aerosol size distributions from BORTAS 2011, Atmos. Chem. Phys., 15, 1633–1646, https://doi.org/10.5194/acp-15-1633-2015, 2015.
Saleh, R., Hennigan, C. J., McMeeking, G. R., Chuang, W. K., Robinson, E. S., Coe, H., Donahue, N. M., and Robinson, A. L.: Absorptivity of brown carbon in fresh and photo-chemically aged biomass-burning emissions, Atmos. Chem. Phys., 13, 7683–7693, https://doi.org/10.5194/acp-13-7683-2013, 2013.
Saleh, R., Marks, M., Heo, J., Adams, P. J., Donahue, N. M., and Robinson, A. L.: Contribution of brown carbon and lensing to the direct radiative effect of carbonaceous aerosols from biomass and biofuel burning emissions, J. Geophys. Res.-Atmos., 120, 10285–10296, https://doi.org/10.1002/2015JD023697, 2015.
Sand, M., Berntsen, T., von Salzen, K., Flanner, M., Langner, J., and Victor, D.: Response of arctic temperature to changes in emissions of short-lived climate forcers, Nat. Clim. Change, 6, 286–289, https://doi.org/10.1038/nclimate2880, 2015.
Seinfeld, J. H. and Pandis, S. N.: Atmospheric chemistry and physics: From air pollution to climate change, 3rd Edn., J. Wiley & Sons, Inc., New Jersey, 2016.
Shiraiwa, M., Zuend, A., Bertram, A. K., and Seinfeld, J. H.: Gas-particle partitioning of atmospheric aerosols: interplay of physical state, non-ideal mixing and morphology, Phys. Chem. Chem. Phys., 15, 11441–11453, https://doi.org/10.1039/c3cp51595h, 2013a.
Shiraiwa, M., Yee, L. D., Schilling, K. A., Loza, C. L., Craven, J. S., Zuend, A., Ziemann, P. J., and Seinfeld, J. H.: Size distribution dynamics reveal particle-phase chemistry in organic aerosol formation, P. Natl. Acad. Sci. USA, 110, 11746–11750, https://doi.org/10.1073/pnas.1307501110, 2013b.
Shiraiwa, M., Li, Y., Tsimpidi, A. P., Karydis, V. A., Berkemeier, T., Pandis, S. N., Lelieveld, J., Koop, T., and Pöoschl, U.: Global distribution of particle phase state in atmospheric secondary organic aerosols, Nat. Commun., 8, 15002, https://doi.org/10.1038/ncomms15002, 2017.
Shrivastava, M., Zelenyuk, A., Imre, D., Easter, R. C., Beranek, J., Zaveri, R. A., and Fast, J. D.: Implications of low volatility and gas-phase fragmentation reactions on SOA loadings and their spatial and temporal evolution in the atmosphere. J. Geophys. Res.-Atmos., 118, 3328–3342, https://doi.org/10.1002/jgrd.50160, 2013.
Shrivastava, M., Easter, R., Liu, X., Zelenyuk, A., Singh, B., Zhang, K., Ma, P-L, Chand, D., Ghan, S., Jimenez, J. L., Zhang, Q., Fast, J., Rasch, P., and Tiitta, P.: Global transformation and fate of SOA: Implications of low volatility SOA and gas phase fragmentation reactions, J. Geophys. Res.-Atmos., 120, 4169–4195, https://doi.org/10.1002/2014JD022563, 2015.
Shrivastava, M., Cappa, C., Fan, J., Goldstein, A., Guenther, A., Jimenez, J., Kuang, C., Laskin, A., Martin, S., Ng, N., Petaja, T., Pierce, J., Rasch, P., Roldin, P., Seinfeld, J., Shilling, J., Smith, J., Thornton, J., Volkamer, R., Wang, J., Worsnop, D., Zaveri, R., Zelenyuk, A., and Zhang, Q.: Recent advances in understanding secondary organic aerosol: Implications for global climate forcing, Rev. Geophys., 55, 509–559, https://doi.org/10.1002/2016RG000540, 2017.
Sofiev, M., Ermakova, T., and Vankevich, R.: Evaluation of the smoke-injection height from wild-land fires using remote-sensing data, Atmos. Chem. Phys., 12, 1995–2006, https://doi.org/10.5194/acp-12-1995-2012, 2012.
Theodoritsi, G. N. and Pandis, S. N.: Simulation of the chemical evolution of biomass burning organic aerosol, Atmos. Chem. Phys., 19, 5403–5415, https://doi.org/10.5194/acp-19-5403-2019, 2019.
Tiitta, P., Leskinen, A., Hao, L., Yli-Pirilä, P., Kortelainen, M., Grigonyte, J., Tissari, J., Lamberg, H., Hartikainen, A., Kuuspalo, K., Kortelainen, A.-M., Virtanen, A., Lehtinen, K. E. J., Komppula, M., Pieber, S., Prévôt, A. S. H., Onasch, T. B., Worsnop, D. R., Czech, H., Zimmermann, R., Jokiniemi, J., and Sippula, O.: Transformation of logwood combustion emissions in a smog chamber: formation of secondary organic aerosol and changes in the primary organic aerosol upon daytime and nighttime aging, Atmos. Chem. Phys., 16, 13251–13269, https://doi.org/10.5194/acp-16-13251-2016, 2016.
Tosca, M. G., Randerson, J. T., and Zender, C. S.: Global impact of smoke aerosols from landscape fires on climate and the Hadley circulation, Atmos. Chem. Phys., 13, 5227–5241, https://doi.org/10.5194/acp-13-5227-2013, 2013.
Tsigaridis, K. and Kanakidou, M.: The Present and Future of Secondary Organic Aerosol Direct Forcing on Climate, Current Climate Change Reports, 4, 1–15, https://doi.org/10.1007/s40641-018-0092-3, 2018.
Tsigaridis, K., Daskalakis, N., Kanakidou, M., Adams, P. J., Artaxo, P., Bahadur, R., Balkanski, Y., Bauer, S. E., Bellouin, N., Benedetti, A., Bergman, T., Berntsen, T. K., Beukes, J. P., Bian, H., Carslaw, K. S., Chin, M., Curci, G., Diehl, T., Easter, R. C., Ghan, S. J., Gong, S. L., Hodzic, A., Hoyle, C. R., Iversen, T., Jathar, S., Jimenez, J. L., Kaiser, J. W., Kirkevåg, A., Koch, D., Kokkola, H., Lee, Y. H., Lin, G., Liu, X., Luo, G., Ma, X., Mann, G. W., Mihalopoulos, N., Morcrette, J.-J., Müller, J.-F., Myhre, G., Myriokefalitakis, S., Ng, N. L., O'Donnell, D., Penner, J. E., Pozzoli, L., Pringle, K. J., Russell, L. M., Schulz, M., Sciare, J., Seland, Ø., Shindell, D. T., Sillman, S., Skeie, R. B., Spracklen, D., Stavrakou, T., Steenrod, S. D., Takemura, T., Tiitta, P., Tilmes, S., Tost, H., van Noije, T., van Zyl, P. G., von Salzen, K., Yu, F., Wang, Z., Wang, Z., Zaveri, R. A., Zhang, H., Zhang, K., Zhang, Q., and Zhang, X.: The AeroCom evaluation and intercomparison of organic aerosol in global models, Atmos. Chem. Phys., 14, 10845–10895, https://doi.org/10.5194/acp-14-10845-2014, 2014.
Tsimpidi, A. P., Karydis, V. A., Pozzer, A., Pandis, S. N., and Lelieveld, J.: ORACLE 2-D (v2.0): an efficient module to compute the volatility and oxygen content of organic aerosol with a global chemistry–climate model, Geosci. Model Dev., 11, 3369–3389, https://doi.org/10.5194/gmd-11-3369-2018, 2018.
Vakkari, V., Beukes, J. P., Dal Maso, M., Aurela, M., Josipovic, M., and van Zyl, P. G.: Major secondary aerosol formation in southern African open biomass burning plumes, Nat. Geosci., 11, 580–583, https://doi.org/10.1038/s41561-018-0170-0, 2018.
van der Werf, G. R., Randerson, J. T., Giglio, L., van Leeuwen, T. T., Chen, Y., Rogers, B. M., Mu, M., van Marle, M. J. E., Morton, D. C., Collatz, G. J., Yokelson, R. J., and Kasibhatla, P. S.: Global fire emissions estimates during 1997–2016, Earth Syst. Sci. Data, 9, 697–720, https://doi.org/10.5194/essd-9-697-2017, 2017.
Verwer, J.: Gauss-Seidel iteration for stiff ODEs from chemical kinetics, J. Sci. Comput., 15, 1243–1250, 1994.
Wang, Q., Saturno, J., Chi, X., Walter, D., Lavric, J. V., Moran-Zuloaga, D., Ditas, F., Pöhlker, C., Brito, J., Carbone, S., Artaxo, P., and Andreae, M. O.: Modeling investigation of light-absorbing aerosols in the Amazon Basin during the wet season, Atmos. Chem. Phys., 16, 14775–14794, https://doi.org/10.5194/acp-16-14775-2016, 2016.
Yao, H., Song, Y., Liu, M., Archer-Nicholls, S., Lowe, D., McFiggans, G., Xu, T., Du, P., Li, J., Wu, Y., Hu, M., Zhao, C., and Zhu, T.: Direct radiative effect of carbonaceous aerosols from crop residue burning during the summer harvest season in East China, Atmos. Chem. Phys., 17, 5205–5219, https://doi.org/10.5194/acp-17-5205-2017, 2017.
Yokelson, R. J., Crounse, J. D., DeCarlo, P. F., Karl, T., Urbanski, S., Atlas, E., Campos, T., Shinozuka, Y., Kapustin, V., Clarke, A. D., Weinheimer, A., Knapp, D. J., Montzka, D. D., Holloway, J., Weibring, P., Flocke, F., Zheng, W., Toohey, D., Wennberg, P. O., Wiedinmyer, C., Mauldin, L., Fried, A., Richter, D., Walega, J., Jimenez, J. L., Adachi, K., Buseck, P. R., Hall, S. R., and Shetter, R.: Emissions from biomass burning in the Yucatan, Atmos. Chem. Phys., 9, 5785–5812, https://doi.org/10.5194/acp-9-5785-2009, 2009.
Zhou, S., Collier, S., Jaffe, D. A., Briggs, N. L., Hee, J., Sedlacek III, A. J., Kleinman, L., Onasch, T. B., and Zhang, Q.: Regional influence of wildfires on aerosol chemistry in the western US and insights into atmospheric aging of biomass burning organic aerosol, Atmos. Chem. Phys., 17, 2477–2493, https://doi.org/10.5194/acp-17-2477-2017, 2017.
The requested paper has a corresponding corrigendum published. Please read the corrigendum first before downloading the article.
- Article
(2682 KB) - Full-text XML