the Creative Commons Attribution 4.0 License.
the Creative Commons Attribution 4.0 License.
 | 26 Sep 2019
Estimating global surface ammonia concentrations inferred from satellite retrievals
Lei Liu
Xiuying Zhang
Anthony Y. H. Wong
Xuejun Liu
Huan Mi
Xuehe Lu
Limin Zhao
Zhen Wang
Xiaodi Wu
Ammonia (NH3), as an alkaline gas in the atmosphere, can cause direct or indirect effects on the air quality, soil acidification, climate change and human health. Estimating surface NH3 concentrations is critically important for modeling the dry deposition of NH3 and for modeling the formation of ammonium nitrate, which have important impacts on the natural environment. However, sparse monitoring sites make it challenging and difficult to understand the global distribution of surface NH3 concentrations in both time and space. We estimated the global surface NH3 concentrations for the years of 2008–2016 using satellite NH3 retrievals combining vertical profiles from GEOS-Chem. The accuracy assessment indicates that the satellite-based approach has achieved a high predictive power for annual surface NH3 concentrations compared with the measurements of all sites in China, the US and Europe (R2=0.76 and RMSE = 1.50 µg N m−3). The satellite-derived surface NH3 concentrations had higher consistency with the ground-based measurements in China (R2=0.71 and RMSE = 2.6 µg N m−3) than the US (R2=0.45 and RMSE = 0.76 µg N m−3) and Europe (R2=0.45 and RMSE = 0.86 µg N m−3) at a yearly scale. Annual surface NH3 concentrations higher than 6 µg N m−3 are mainly concentrated in the North China Plain of China and northern India, followed by 2–6 µg N m−3 mainly in southern and northeastern China, India, western Europe, and the eastern United States (US). High surface NH3 concentrations were found in the croplands in China, the US and Europe, and surface NH3 concentrations in the croplands in China were approximately double those in the croplands in the US and Europe. The linear trend analysis shows that an increase rate of surface NH3 concentrations (> 0.2 µg N m−3 yr−1) appeared in eastern China during 2008–2016, and a middle increase rate (0.1–0.2 µg N m−3 yr−1) occurred in northern Xinjiang over China. NH3 increase was also found in agricultural regions in the central and eastern US with an annual increase rate of lower than 0.10 µg N m−3 yr−1. The satellite-derived surface NH3 concentrations help us to determine the NH3 pollution status in the areas without monitoring sites and to estimate the dry deposition of NH3 in the future.
- Article
(14987 KB) - Full-text XML
-
Supplement
(1320 KB) - BibTeX
- EndNote


Ammonia (NH3), emitted primarily by agricultural activities and biomass burning, is an important alkaline gas in the atmosphere (Van Damme et al., 2018; Warner et al., 2017). Excessive surface NH3 concentrations can cause chronic or acute damage to the plant (such as reduced growth and bleached gray foliage) when its capacity of detoxification is exceeded (Eerden, 1982; Sheppard et al., 2008). Estimation of surface NH3 concentrations is critically important in modeling the dry deposition of NH3, which may comprise a large part of atmospheric nitrogen (N) deposition, and could cause acidification in the soil, eutrophication in the aquatic ecosystems, and contamination in drinking water (Basto et al., 2015; Kim et al., 2014; Lamarque et al., 2005; Larssen et al., 2011; Reay et al., 2008). In addition, NH3 can also react with nitric acid and sulfuric acid to form ammonium salts (Li et al., 2014; Y. Li et al., 2017), which are important components of particulate matter (PM) and have negative impacts on air quality and human health (Xu et al., 2017; Schaap et al., 2004; Wei et al., 2019).
Several national monitoring programs can measure surface NH3 concentrations, including the Chinese Nationwide Nitrogen Deposition Monitoring Network (NNDMN) established in 2004, the Ammonia Monitoring Network in China (AMoN-China) established in 2015, the Ammonia Monitoring Network in the US (AMoN-US), and the European Monitoring and Evaluation Programme (EMEP). However, there are still relatively large uncertainties of estimating global surface NH3 concentrations, resulting from the sparse monitoring sites as well as the limited spatial representativeness (Liu et al., 2017a, b). Satellite NH3 retrievals are an important complement to gain the global distribution of NH3 concentrations with a high spatial resolution (Van Damme et al., 2014b). NH3 can be measured by several satellite instruments including the Infrared Atmospheric Sounding Interferometer (IASI), Atmospheric Infrared Sounder (AIRS), Cross-track Infrared Sounder (CrIS) and tropospheric emission spectrometer (TES). TES using the thermal infrared spectral range has sparser spatial coverage compared to IASI, CrIS and AIRS (Shephard et al., 2011; L. Zhang et al., 2018). A recent study (Kharol et al., 2018) reported the dry NH3 depositions in North America, and found −15 % underestimation in CrIS surface NH3 concentrations (using three fixed NH3 profiles considering unpolluted, moderate and polluted conditions) compared with the measurements from AMoN-US during the warm months (from April to September). Warner et al. (2017) reported the global AIRS NH3 concentrations at 918 hPa (approximately 700–800 m) at 1∘ latitude × 1∘ longitude grids, and found NH3 concentrations increased in the major agricultural regions during 2003–2015 (Warner et al., 2017). The IASI NH3 measurements have been validated with NH3 columns measured by Fourier transform infrared (FTIR) spectroscopy, ground-based NH3 measurements, NH3 emissions and atmospheric chemistry transport models (CTMs) (Dammers et al., 2016; Van Damme et al., 2014b, 2015a; Whitburn et al., 2016).
Apart from satellite retrievals, CTMs are also powerful tools to investigate spatiotemporal variability of surface NH3 concentrations in the atmosphere. Schiferl et al. (2016) evaluated the modeled NH3 concentrations during 2008–2012 from GEOS-Chem, and found an approximately 26 % underestimation compared with the ground-based measurements, which can be related to the relatively large uncertainties in NH3 emissions used for driving GEOS-Chem (Schiferl et al., 2016). Zhu et al. (2013) used the GEOS-Chem constrained by TES measurements to estimate surface NH3 concentration during 2006–2009, and found an improvement in comparison with the ground-based measurements in the United States. Schiferl et al. (2014) used the airborne observations to validate the simulated NH3 concentrations in 2010 from GEOS-Chem, and revealed reasonably simulated NH3 vertical profiles compared with the aircraft measurements but with an underestimation in surface NH3 concentrations in California (Schiferl et al., 2014). A number of previous studies have used satellite NO2 columns to estimate the surface NO2 concentrations combining NO2 vertical profiles from CTMs (Geddes et al., 2016; Lamsal et al., 2013; Nowlan et al., 2014; Liu et al., 2017c). The methods of using the vertical profiles to convert satellite-retrieved columns to surface concentrations have been proven successful for SO2 and NO2 (Geddes et al., 2016; Geng et al., 2015; Lamsal et al., 2008; Nowlan et al., 2014). CTMs can provide valuable information of NH3 vertical profiles (Whitburn et al., 2016; Liu et al., 2017b), and IASI-derived surface NH3 concentrations combining NH3 vertical profiles from CTMs in China and Europe were evaluated previously (Liu et al., 2017b; van der Graaf et al., 2018). This study followed these studies to estimate the satellite-derived global surface NH3 concentrations using IASI NH3 retrievals and the vertical profiles from GEOS-Chem, and the present study aims to estimate the global surface NH3 concentration from a satellite perspective.
2.1 IASI NH3 measurements
The Infrared Atmospheric Sounding Interferometer (IASI) is a passive instrument measuring infrared radiation within the spectral range of 645–2769 cm−1. The IASI-A instrument is on board the MetOp-A satellite launched in 2006 covering the globe twice a day with an elliptical spatial resolution of approximately 12 km by 12 km, and crosses the Equator at 09:30 and 21:30 local time (Van Damme et al., 2014a). We used the daytime IASI NH3 measurements due to the larger positive thermal contrast detected by satellite instruments leading to smaller errors compared to the nighttime data (Van Damme et al., 2014a). In this work, we used the IASI NH3 column products (ANNI-NH3-v2.2R-I) during 2008–2016 (Van Damme et al., 2017) to estimate the global surface NH3 concentrations. The ANNI-NH3-v2.2R-I datasets were developed by converting spectral HRI (hyperspectral range index) to NH3 columns through an Artificial Neural Network for IASI (ANNI) algorithm (Whitburn et al., 2016). This algorithm considered the influence of the NH3 vertical profiles, pressure, humidity and temperature. The NH3 vertical profile information used to generate the ANNI NH3 columns was retrieved from GEOS-Chem, which integrates aerosol thermodynamics mechanisms (Whitburn et al., 2016; Van Damme et al., 2017). The ANNI-NH3-v2.2R-I datasets used the ANNI algorithm and took account of the influence of NH3 vertical profiles, pressure, humidity and temperature, which were to make the columns accurate. There is no information on NH3 vertical profiles in the ANNI-NH3-v2.2R-I datasets. The NH3 vertical profiles used in this paper was to convert the columns to surface concentrations and to make the surface NH3 estimates accurate. The IASI NH3 columns used in this study were processed into monthly data on 0.25∘ latitude × 0.25∘ longitude grids by the arithmetic averaging method (Van Damme et al., 2017; Whitburn et al., 2016; Liu et al., 2017a).
2.2 Surface NH3 measurements
To evaluate our satellite-derived global surface NH3 concentrations, we collected available surface NH3 measurements on a regional scale in 2014. In China, we used the national measurements from the Chinese Nationwide Nitrogen Deposition Monitoring Network (NNDMN) including 10 urban sites, 22 rural sites and 11 background sites. Surface NH3 concentrations in the NNDMN were measured by both ALPHA (Adapted Low-cost Passive High Absorption) and DELTA (DEnuder for Long-Term Atmospheric sampling) systems. The bias for monthly measurements at a site using the DELTA system is as below approximately 10 % (Sutton et al., 2001), and the correlation between the ALPHA and DELTA measurements was highly significant (R2=0.919, p<0.001) (Xu et al., 2015). The detailed descriptions on the NNDMN have been described in a previous study (Xu et al., 2015). In the US, we used the measurements of 67 sites from AMoN-US, downloaded from the website http://nadp.sws.uiuc.edu/AMoN/, last access: 21 September 2018. Surface NH3 concentrations in the AMoN-US were measured by a radiello™ diffusive sampler (http://www.radiello.com, last access: 21 September 2018) as a simple diffusion-type sampler collected every 2 weeks, and these sites were generally distributed at rural sites (Li et al., 2016). We calculated annual surface NH3 concentrations by averaging all the measurements since we compared the measured surface NH3 concentrations with satellite-derived surface NH3 concentrations at a yearly scale. In Europe, we used the measurements of 43 sites from the EMEP network (https://www.nilu.no/projects/ccc/emepdata.html, last access: 21 September 2018). EMEP is composed of multiple national networks in Europe; thus the measurement systems differ among different national networks. The overall bias of the different instruments in EMEP varied from −30 % to 10 % for all sites (von Bobrutzki et al., 2010). Most sites in China, the US and Europe were set to a height of 1–50 m above the ground (Xu et al., 2015; Li et al., 2016; Puchalski et al., 2011).
2.3 GEOS-Chem model
We used GEOS-Chem version 11-01 as the chemical transport model to calculate global NH3 vertical profiles (using the year 2014 as a case study in the results and discussion). We performed spin up for 5 months, which well exceeds the typical lifetime of atmospheric NH3 (typically within 24 h) and aerosol ammonium ions (typically within a week) (Pye et al., 2009). It has a spatial resolution of 2∘ latitude × 2.5∘ longitude × 47 vertical layers spanning over Earth's surface and about 80 km above it. It is driven by the meteorological field data of the GEOS-FP (forward-processing) products, which were produced by NASA GMAO (Global Modeling and Assimilation Office) (https://gmao.gsfc.nasa.gov/, last access: 21 September 2018). Here we modeled the NH3 vertical profiles using GEOS-Chem, and used the monthly averages for analysis. The global NH3 emissions in GEOS-Chem are based on EDGAR (Emissions Database for Global Atmospheric Research) v4.2 (http://edgar.jrc.ec.europa.eu/overview.php?v=42, last access: 21 September 2018), while the regional emissions are replaced with the MIX inventory for East Asia (M. Li et al., 2017) (http://www.meicmodel.org/dataset-mix.html, last access: 21 September 2018), EMEP inventory for Europe (http://www.emep.int/, last access: 21 September 2018), NEI (National Emissions Inventory) for the US (https://www.epa.gov/air-emissions-inventories, last access: 21 September 2018) and CAC (Criteria Air Contaminant) inventory for Canada (https://www.canada.ca/en/services/environment/pollution-waste-management/national-pollutant-release-inventory.html, last access: 21 September 2018). The main difference between the regional inventories and EDGAR is that seasonality of emissions is included in regional inventories. The seasonality of regional emissions inventories is embedded as an integral part of the inventory except EMEP (Janssens-Maenhout et al., 2015; Crippa et al., 2018; Lenhart and Friedrich, 1995). The biomass burning emissions are from the Global Fire Emissions Database (GFED4) including agricultural fires, wildfire and pre-scribed burning (Giglio et al., 2013). The GEOS-Chem simulates a comprehensive atmospheric NOx−O3–volatile organic compound–aerosol system (Mao et al., 2013). The thermodynamic equilibrium of the system is simulated by the ISORROPIA II model (Fountoukis and Nenes, 2007; Pye et al., 2009). The modeling of wet deposition is described by a previous study (Liu et al., 2001) with updates from other studies (Amos et al., 2012; Wang et al., 2011). Dry deposition of particles follows the size-segregated treatment (Zhang et al., 2001) and gaseous dry deposition follows the framework (Wesely, 1989) with updates from a previous study (Wang et al., 1998). We archive the output daily averages of NH3 concentrations as well as the averages between 09:00 and 10:00, which corresponds to the local crossing time of IASI (09:30). The local time is the time in a particular region or area expressed with reference to the meridian passing through it. The relationship between NH3 concentration at 09:00–10:00 and the daily averages derived from the GEOS-Chem was used to convert the satellite-observed NH3 column to daily averages (Nowlan et al., 2014).
2.4 Estimation of surface NH3 concentrations
We estimated global surface NH3 concentrations using the IASI NH3 columns as well as GEOS-Chem. We took into account the advantages of IASI NH3 columns with high spatial resolutions and GEOS-Chem with vertical profiles. The IASI NH3 data we gained are column data, and there is no information on the vertical information. To convert the columns to surface concentrations, we used the widely used modeled vertical profiles from GEOS-Chem. The GEOS-Chem outputs include 47 layers, which are not continuous in the vertical direction. To gain the continuous vertical NH3 profile, we used the Gaussian function to fit the 47 layers' NH3 concentrations. The main advantage to simulating the vertical profiles is that the NH3 concentration at any height indicated by satellite can be obtained. On the other hand, the simulated profile function has a general rule, which can convert the columns indicated by satellite to surface concentration simply and quickly for many years. The height of each grid box used here was calculated at the middle height of each layer rather than the top height of each layer. A three-parameter Gaussian function was used to fit NH3 vertical profiles at each grid box from GEOS-Chem in the previous studies (Whitburn et al., 2016; Liu et al., 2017b):
where ρ is NH3 concentrations at the layer height Z; ρmax is the maximum NH3 concentrations at the height z0; σ is an indicator for the spread or thickness of the NH3 concentrations.
This study expanded Eq. (1) to fit NH3 vertical profiles at each grid box by the following equation (Liu et al., 2017b):
where n ranges from 1 to 6. If n=1, Eq. (2) is the same as Eq. (1); if n>1, Eq. (2) is multiple three-parameter Gaussian items. We determined the value of n that can simulate the NH3 vertical profiles with the best performance at each grid box using the determining coefficients of R square (R2). Once the NH3 vertical profiles were determined at each grid box, we could extrapolate NH3 concentrations at any height from GEOS-Chem (GGEOS-Chem).
We then aggregated the IASI NH3 columns ΩIASI (0.25∘ latitude × 0.25∘ longitude) to the GEOS-Chem grid size (2∘ latitude × 2.5∘ longitude) by the averaging method. We obtain the following equation (Lamsal et al., 2008):
where is the satellite-derived surface NH3 concentrations at a GEOS-Chem grid size at 09:00–10:00; is the ratio of surface NH3 concentrations to NH3 columns calculated from GEOS-Chem; is the average IASI NH3 columns at a GEOS-Chem grid at 09:00–10:00.
We found a high correlation (R = 0.96 and p = 0.000) between the surface NH3 concentrations and NH3 columns based on the GEOS-Chem outputs (Fig. S1 in the Supplement). Then we used the satellite-derived scaling factor to downscale the satellite-derived surface NH3 concentrations at a GEOS-Chem grid by using the following ratio:
where RIASI is the scaling factor. is the satellite-derived surface NH3 concentrations at a satellite IASI grid size (0.25∘ latitude × 0.25∘ longitude) at 09:00–10:00.
To convert the instantaneous satellite-derived surface NH3 concentrations GIASI to daily average surface NH3 concentrations, we used the following equations (Nowlan et al., 2014):
where is the daily average surface NH3 concentrations, and is the ratio of the GEOS-Chem surface NH3 concentrations at the daily average to the average of 09:00–10:00.
3.1 NH3 vertical profiles from GEOS-Chem
NH3 emitted from the surface can be transported horizontally or vertically, and its concentrations may show a certain gradient in the vertical and horizontal directions (Preston et al., 1997; Rozanov et al., 2005). There are generally two types of shapes of NH3 vertical profiles (Fig. S2) from aircraft measurements (Y. Li et al., 2017; Tevlin et al., 2017) and CTMs (Whitburn et al., 2016; Liu et al., 2017b). One is representative for the vertical profile with maximum NH3 concentrations at a certain height (z0>0) and the other is representative for the vertical profile with maximum NH3 concentrations near the Earth surface (z0=0). In this study, the vertical profiles of NH3 were fitted based on the 47 layers' outputs by GEOS-Chem in 2014 at a monthly scale. Figure S3 shows the spatial distribution of NH3 concentrations in the first and fifth layers simulated by GEOS-Chem in January 2014. NH3 concentrations in the fifth layer are significantly lower than those in the first layer, suggesting that NH3 concentrations decrease with increasing layers (or altitude), especially in NH3 hot spot regions (such as eastern China, India, western Europe and the eastern US). The average difference of NH3 concentrations between the first and fifth layers on the land is 0.34 µg N m−3. The average NH3 concentrations in the first and fifth layers in eastern China, India, western Europe and the eastern US were 2.76, 7.28, 0.55 and 0.31 µg N m−3, respectively.
To more vividly depict the vertical profiles of NH3, we show NH3 vertical concentrations with a cross section drawn at 37∘ N in January 2014 (Fig. S4). High NH3 concentrations are mainly concentrated in layers 1–10, and show a significant decreasing trend with increasing altitude, which is consistent with the aircraft measurements (Preston et al., 1997; Lin et al., 2014; Levine et al., 1980; Shephard and Cady-Pereira, 2015; Y. Li et al., 2017; Tevlin et al., 2017). NH3 vertical profiles were fitted by a Gaussian function (two to six terms) based on the 47 layers' NH3 concentrations from GEOS-Chem, and the fitting accuracy was determined by R2. We found that the NH3 vertical profiles on land between 60∘ N and 55∘ S can be well modeled using a Gaussian function (R2 higher than 0.90) (Fig. 1). Previous studies also found high accuracy using the Gaussian function to simulate the NH3 vertical profiles in China and globally (Whitburn et al., 2016; Liu et al., 2017b).
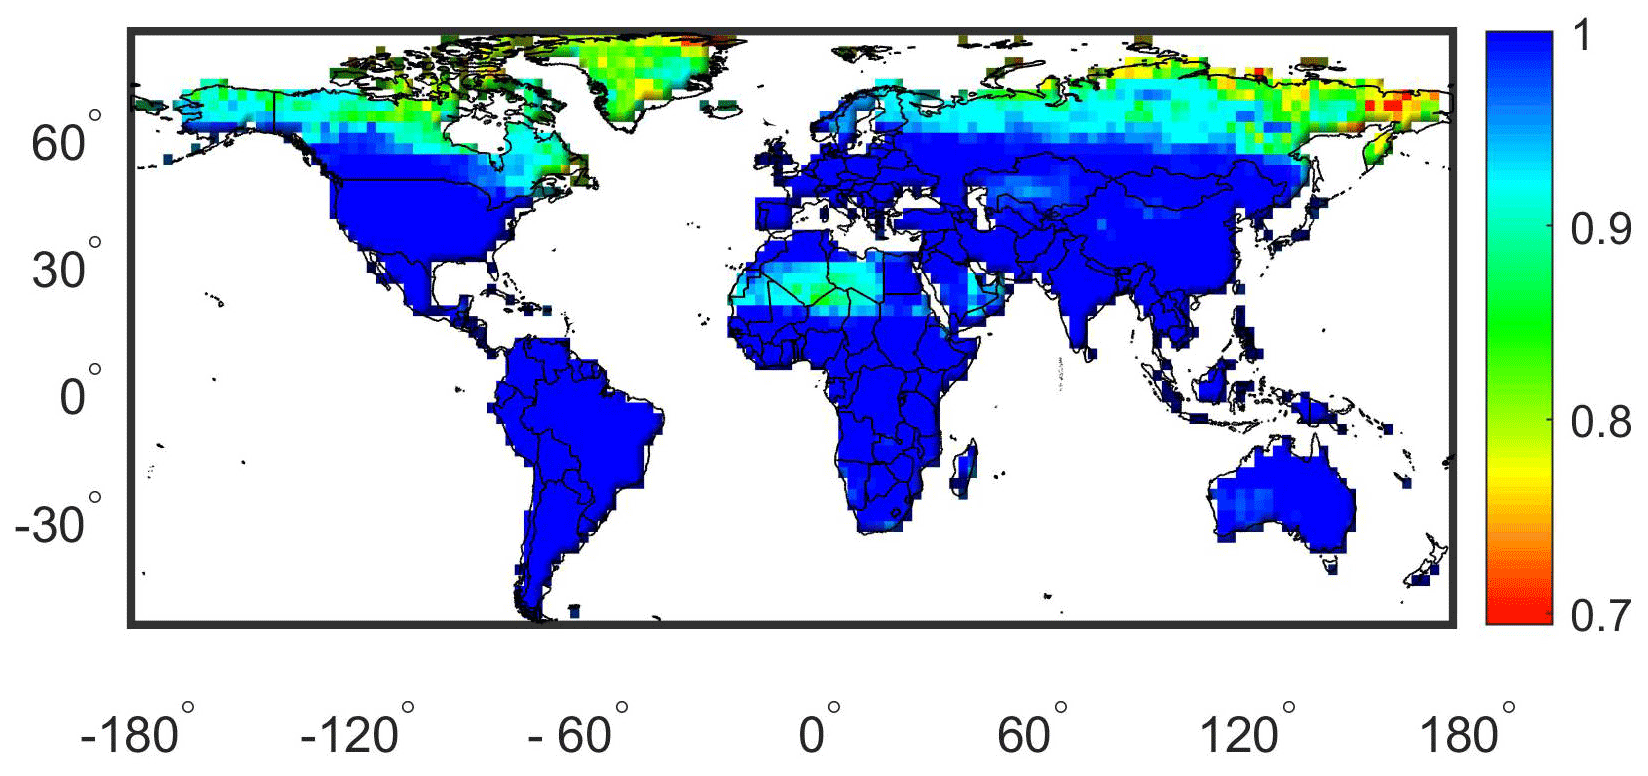
Figure 1R2 of Gaussian fit for NH3 vertical profiles.
3.2 Validation of satellite-derived surface NH3 concentrations
NH3 vertical profiles were used to convert IASI NH3 columns to surface NH3 concentrations. Figure 2 shows the IASI-derived global surface NH3 concentrations on land for the 0.25∘ latitude × 0.25∘ longitude grids in 2014. IASI-derived surface NH3 concentrations capture the general spatial pattern of surface NH3 concentrations fairly well in 2014 in regions with relatively intensive monitoring sites (R2=0.76 and RMSE = 1.50 µg N m−3 in Figs. 2 and 3). Overall, 72.85 % of observations (including China, the US and Europe) were within a factor of 2 of the satellite-derived surface NH3 concentrations. In China, approximately 71.43 % and 77.27 % of observations were within a factor of 2 of the satellite-derived surface NH3 concentrations in urban and rural areas, respectively. There is no big difference in the accuracy of satellite-derived surface NH3 concentrations between urban and rural areas. In the US, the monitoring sites were generally distributed at rural sites (http://www.radiello.com, last access: 21 September 2018) (Li et al., 2016), and, in Europe, there is no information to indicate the land use of each site (https://projects.nilu.no//ccc/, last access: 21 September 2018) (Tørseth et al., 2012a). The overall mean of satellite-derived surface NH3 concentrations in 2014 at the measured sites was 2.52 µg N m−3 and was close to the average of measured surface NH3 concentrations (2.51 µg N m−3) in 2014. IASI-derived surface NH3 concentrations gained higher consistency with the ground-based measurements in China (R2=0.71 and RMSE = 2.6 µg N m−3 for 43 sites) than the US (R2=0.45 and RMSE = 0.76 µg N m−3 for 67 sites) and Europe (R2=0.45 and RMSE = 0.86 µg N m−3 for 43 sites) at a yearly scale. This might be due to the fact that high concentrations in a region (associated with high thermal contrast) can be more reliably detected by IASI (Van Damme et al., 2015a). The accuracy of IASI-retrieved surface NH3 concentrations in different regions is highly linked with the thermal contrast (TC) and atmosphere NH3 abundance (Whitburn et al., 2016). The lowest uncertainties occur when high columns and high TC coincide. In case either of them decreases, the uncertainty will gradually increase. In case both the TC and column are low, all sensitivity to NH3 is lost. When high TC and high NH3 columns (high HRI) occur, the major contribution to the uncertainty results from the thickness of the NH3 layer, the surface temperature and the temperature profile (Whitburn et al., 2016). The simulation of NH3 mixing from GEOS-Chem may also have different accuracy in different regions, and thus can cause uncertainty to the different accuracy of IASI-retrieved surface NH3 concentrations in different regions. Notably, we compared the surface NH3 concentrations at the monitoring stations with the grid values of satellite-derived estimates directly. This point-to-grid verification strategy may cause uncertainty since the monitoring site location may not be representative of a given grid cell for an average retrieved value. The satellite-derived NH3 has a detection limit of 0.0025 µg N m−3 (2.5 ppb) (van der Graaf et al., 2018; Van Damme et al., 2015a). Similarly, we also compared the surface NH3 concentrations (at the first layer) simulated by GEOS-Chem with the monitoring results (R2=0.54 and RMSE = 2.14 µg N m−3 in Fig. 3). In general, IASI-derived surface NH3 concentrations had better consistency with the ground-based measurements than those from GEOS-Chem over China, the US and Europe. The relatively low accuracy from GEOS-Chem was likely due to the coarse model resolutions as well as the poor spatiotemporal representations of NH3 emissions, as suggested by a previous study (Y. Zhang et al., 2018).
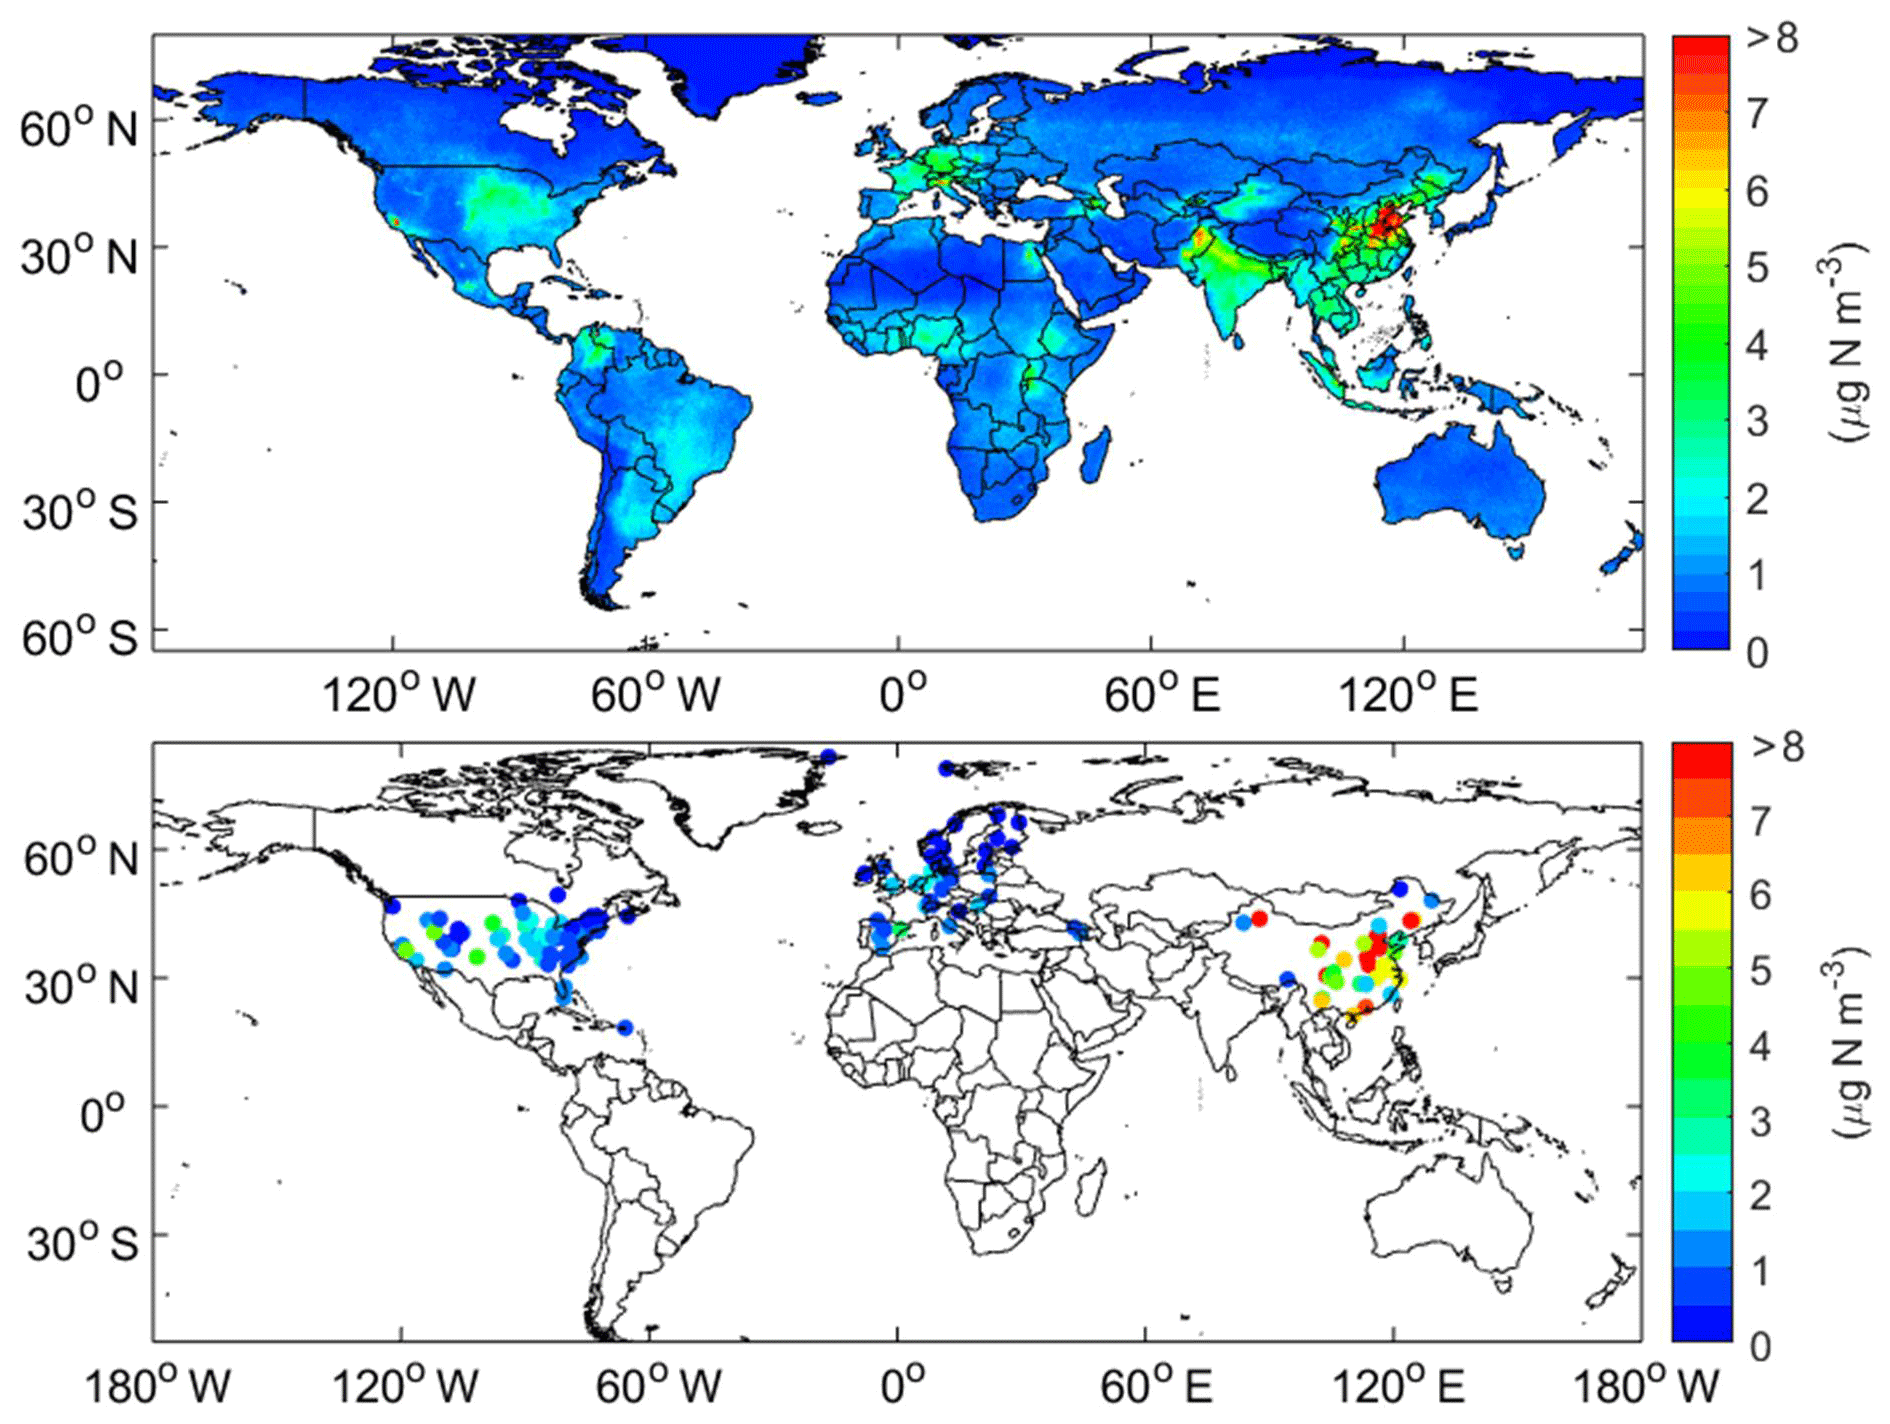
Figure 2Spatial distribution of satellite-derived and measured surface NH3 concentrations in 2014.

Figure 3Comparison of satellite-derived and GEOS-Chem modeled surface NH3 concentrations with measured concentrations in China, the US and Europe.
A known limitation of IASI NH3 retrievals is lack of vertical profile information. A previous study (Van Damme et al., 2015a) used fixed profiles on land to convert the IASI NH3 columns to surface NH3 concentrations. Using the fixed profiles can cause large uncertainties for estimating surface NH3 concentrations. In this work, we utilized the advantages of CTMs and considered the spatial variability of the vertical profiles, and we prove that IASI NH3 columns are powerful to predict the surface NH3 concentrations by combining the vertical profiles simulated by Gaussian function.
Through the Gaussian simulation of NH3 vertical profiles, we are able to evaluate the sensitive regions of surface NH3 concentrations with respect to different heights. Figure S5 shows the spatial distribution of the difference of NH3 concentrations between 40 and 60 m (about the middle height of the first layer in GEOS-Chem). In general, in strong NH3 emission regions, there is a relatively large difference in surface NH3 concentrations such as, for instance, in eastern China and northwestern India (can be up to 3 µg N m−3); subsequently, a middle difference (2–3 µg N m−3) occurs in eastern and middle China, northern India, and northern Italy. Except for the abovementioned regions, the difference of NH3 concentrations between 40 and 60 m is generally lower than 0.5 µg N m−3.
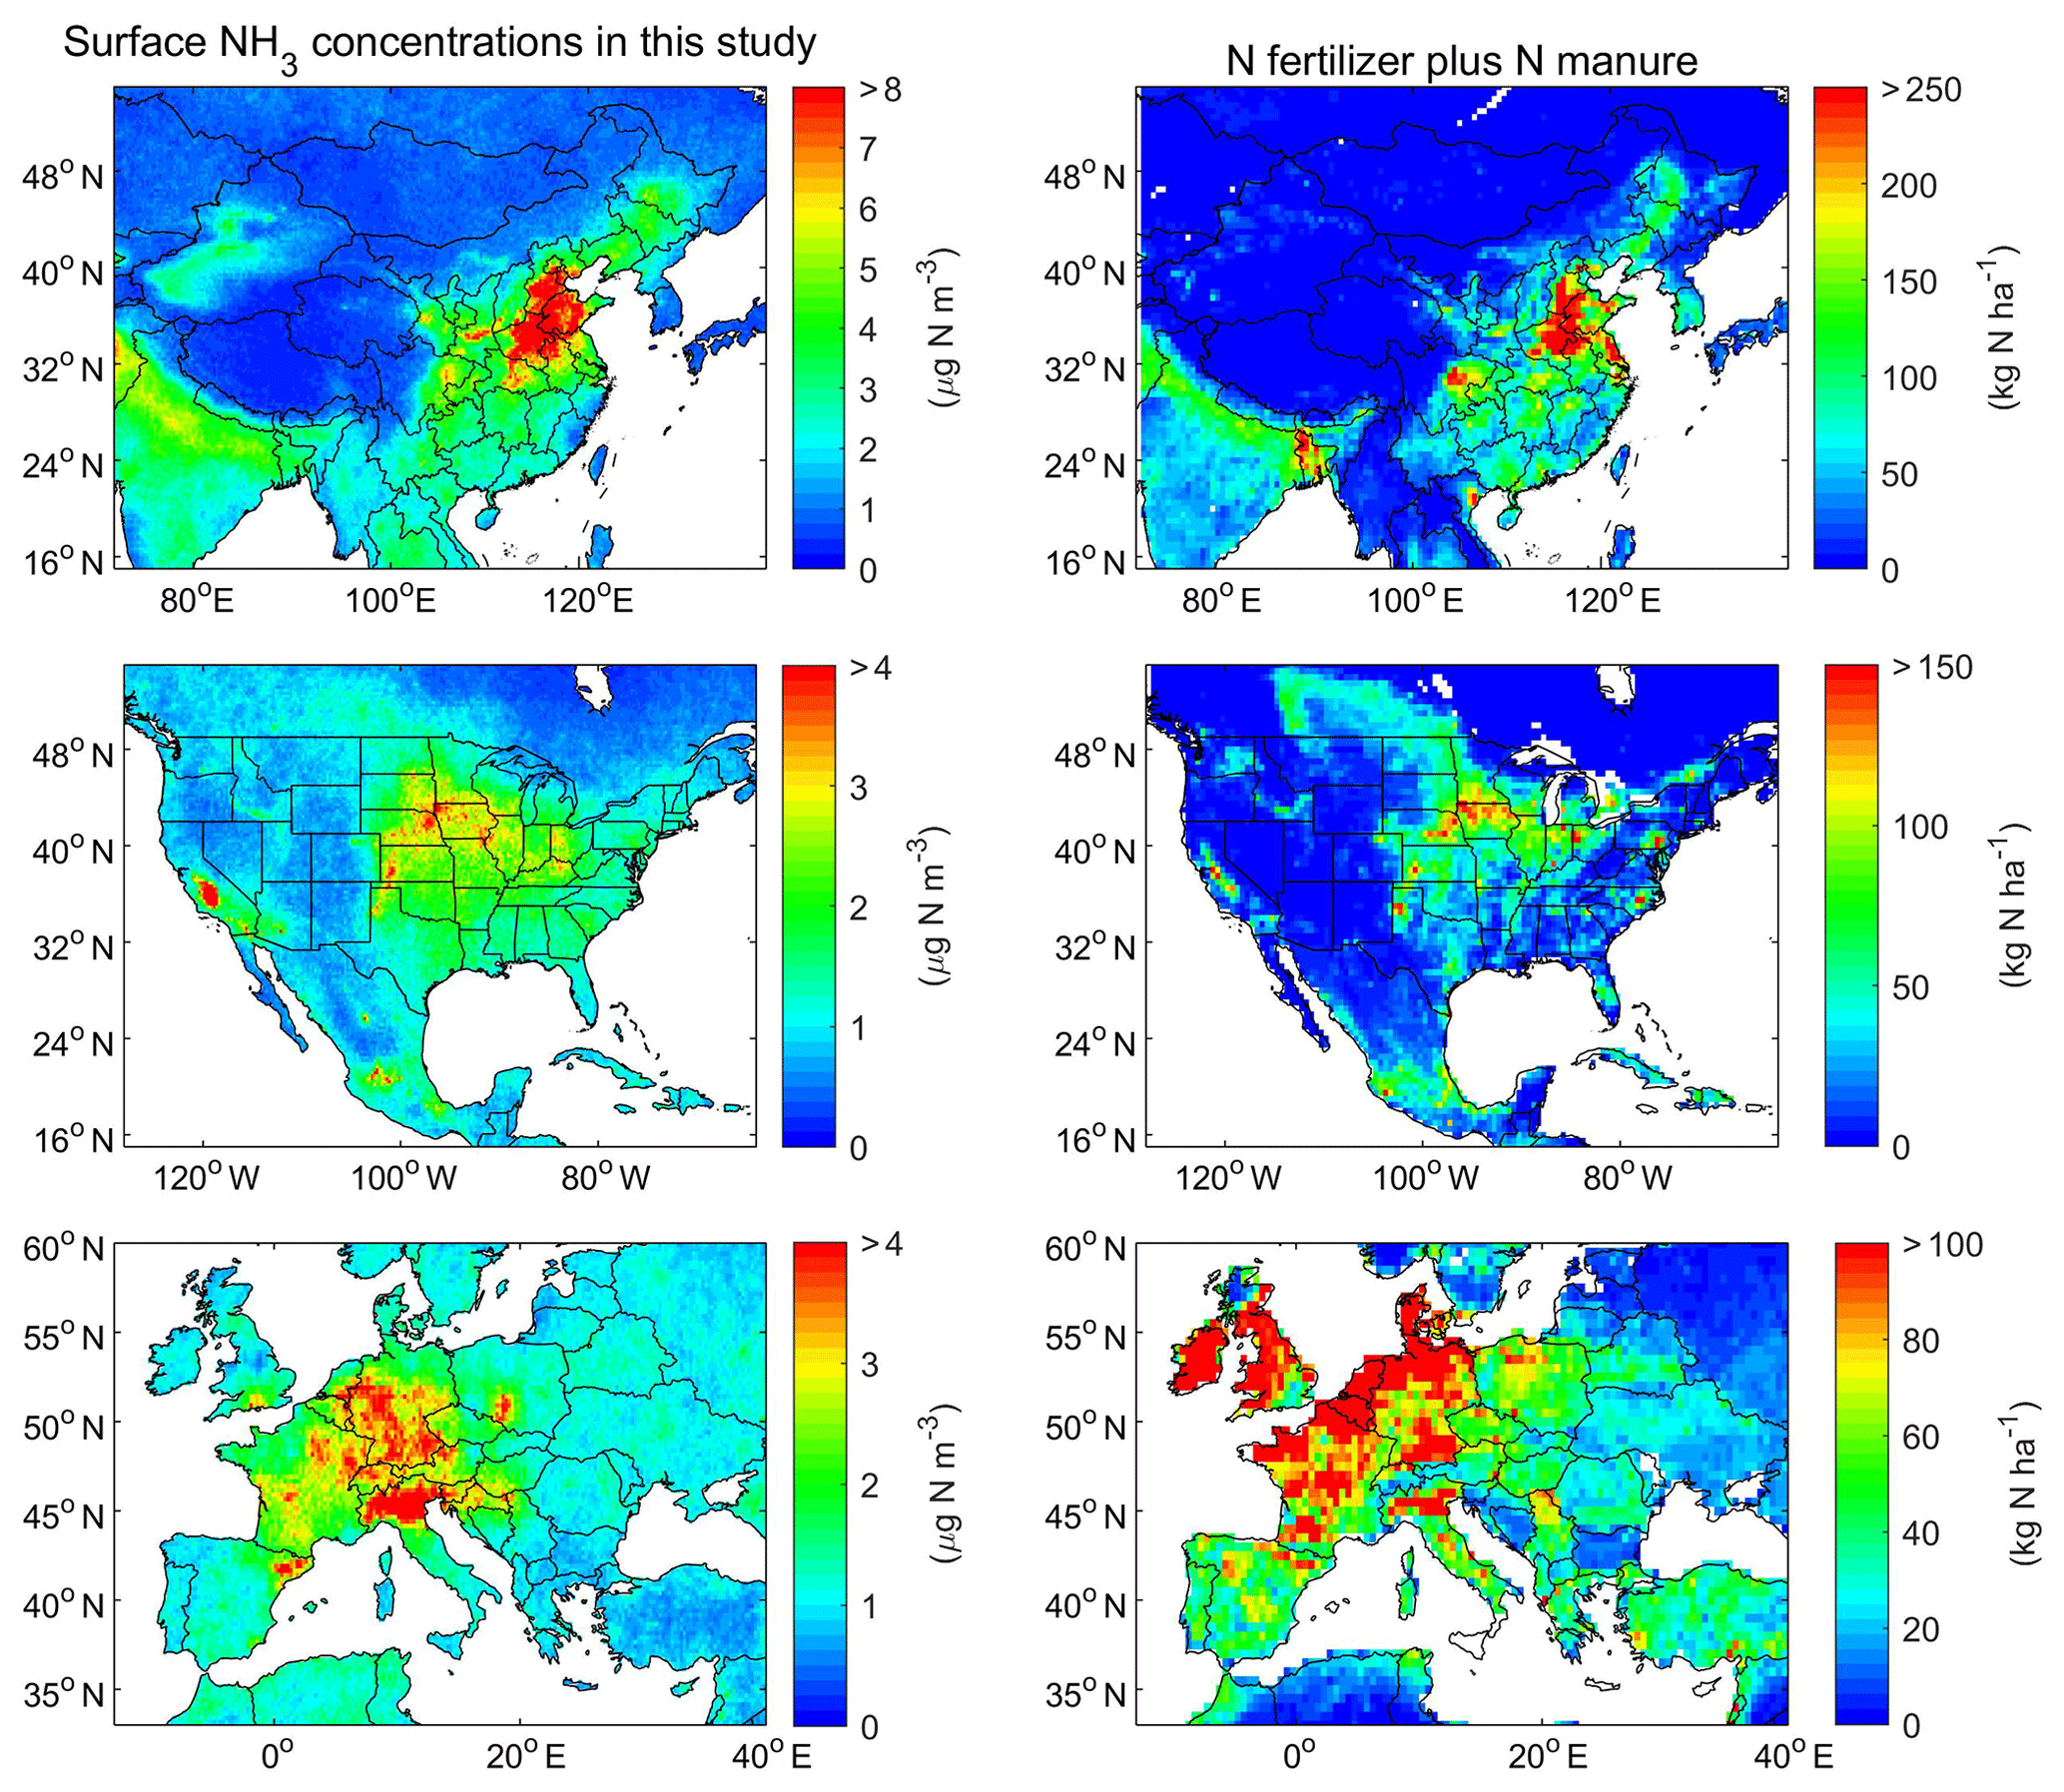
Figure 4Spatial distribution of IASI-derived surface NH3 concentrations and N fertilizer plus N manure (from N application) in China, Europe and the US.
3.3 Spatial distributions of satellite-derived surface NH3 concentrations
Figure 4 shows the spatial distributions of surface NH3 concentrations in China, the US and Europe in 2014. The overall mean surface NH3 concentrations over China were 2.38 µg N m−3, with the range of 0.22–13.11 µg N m−3. We found large areas in eastern China (109–122∘ E, 28-41∘ N), Sichuan Basin, Hubei (including Wuhan, Xiangyang and Yichang), Shaanxi (including Xi'an, Baoji, Hanzhong, Weinan), Gansu (Lanzhou and its surrounding areas), Shanxi (including Yuncheng and Changzhi) and northwestern Xinjiang with surface NH3 concentrations greater than 8 µg N m−3 yr−1, which were in agreement with the spatial distributions of the croplands in China (Fig. S6). It is not surprising that high surface NH3 concentrations occurred in eastern China and the Sichuan Basin because the major Chinese croplands are distributed there, as the major source of NH3 emissions with frequent N fertilizer applications. In addition, N manure is another major source of NH3 emissions in China, and the percentage of N manure to NH3 emissions exceeds 50 % (Kang et al., 2016). Overall, there was a significant linear correlation between surface NH3 concentration and N fertilization plus N manure in China (R2=0.69, p = 0.000 in Fig. 5). The hot spots also occurred in northwestern Xinjiang surrounding the cropland areas, which may be related to the dry climate that can maintain NH3 in the gaseous state for a longer time, providing climate conditions for the long-distance transmission of NH3. Recent national measurement work (Pan et al., 2018) also revealed high surface NH3 concentrations in northwestern Xinjiang, confirming the rationality of the IASI-derived estimates.
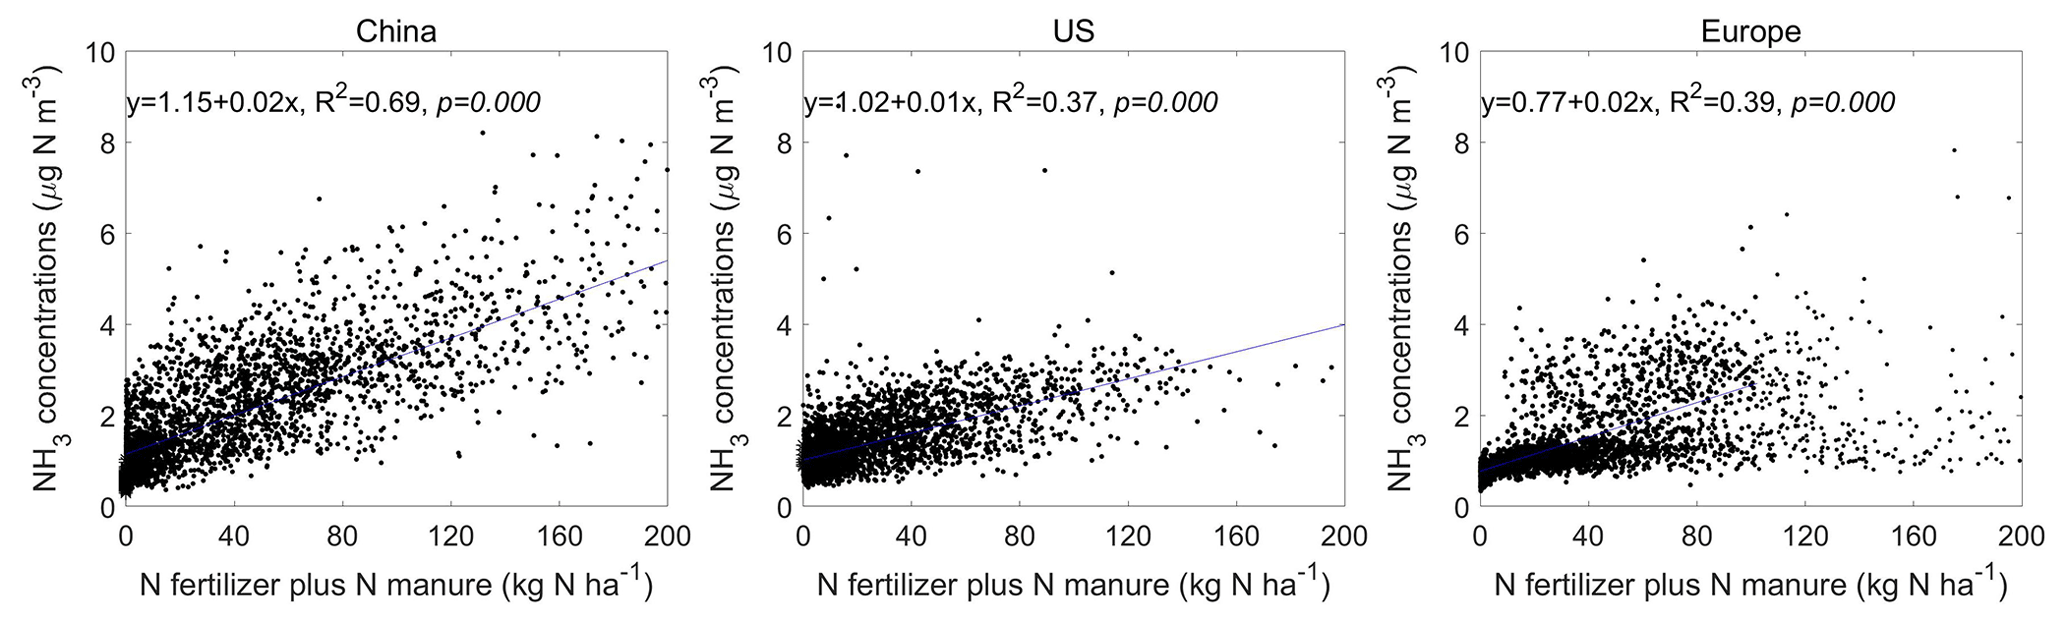
Figure 5Comparison of satellite-derived surface NH3 concentrations and N fertilizer plus N manure (from N application) in China, the US and Europe. The spatial resolution of satellite-derived surface NH3 concentrations and N fertilizer plus N manure is 0.25∘ and 0.5∘, respectively. We first resampled the satellite-derived surface NH3 concentrations to 0.5∘ grids and then compared them with N fertilizer plus N manure by each grid cell. We obtained the N fertilizer and N manure data produced from McGill University (Potter et al., 2010).
In the US, the overall mean surface NH3 concentrations were 1.52 µg N m−3 yr−1, with the range of 0.14–10.60 µg N m−3. The surface NH3 hot spots were generally distributed in croplands in the central US (such as Ohio, Illinois, South Dakota, Nebraska, Kansas, Minnesota and North Dakota), as well as in some small areas in western coastal regions (such as California and Washington). In particular, the San Joaquin Valley (SJV) in California (agricultural land) had the highest surface NH3 concentrations greater than 4 µg N m−3. The NH3 source in the SJV was livestock and mineral N fertilizer, which accounted for 74 % and 16 % of total NH3 emissions, respectively (Simon et al., 2008). Except for the SJV in California, the annual surface NH3 concentrations in croplands were mostly within the range of 1–3 µg N m−3, which were much lower than those in eastern China (mostly within the range of 4–10 µg N m−3). Compared with the spatial distribution of N fertilization plus N manure, the hot spots of surface NH3 concentration can basically reflect the distribution of high N fertilization (R2=0.37, p = 0.000 in Figs. 4 and 5).
In Europe, the overall mean surface NH3 concentrations were 1.8 µg N m−3, with the range of 0.04–9.49 µg N m−3. High surface NH3 concentrations were distributed in croplands, especially in the western regions with values greater than 4 µg N m−3, such as northern Italy (Milan and its surrounding areas), Switzerland, central and southern Germany, eastern France (Paris and its surrounding areas), and Poland. According to the Emissions Database for Global Atmospheric Research (EDGAR), N manure and N fertilization account for 53 % and 43 % of the NH3 emissions in western Europe. Overall, there was also a significant linear correlation between surface NH3 concentration and N fertilization plus N manure (R2=0.39, p = 0.000) in Europe, reflecting the importance of N fertilization on surface NH3 concentration.
NH3 is the most abundant alkaline gas in the atmosphere, and has implications to neutralize acidic species (such as H2SO4 and HNO3) to form ammonium salts (such as (NH4)2SO4 and NH4NO3). Ammonium salts are the important inorganic N components in PM2.5, which can reduce regional visibility and contribute to human disease burden (Van et al., 2015; Yu et al., 2007). Comparing surface NH3 concentrations with PM2.5 can benefit the understanding of the sources and the mixture of air pollution. The spatial distribution of satellite-derived PM2.5 (dust and sea salt removed) in 2014 (Fig. S7) gained from a previous study (Van et al., 2016) was compared with the satellite-derived surface NH3 concentrations in 2014. On the other hand, NO2 is also an important precursor of nitrate salts in PM2.5. We also included the satellite-derived surface NO2 concentrations (Fig. S7) from a previous study (Geddes et al., 2016) to compare with surface NH3 and PM2.5 concentrations.
The hot spots of surface NH3 concentrations were highly linked with the hot spots of PM2.5. The most severe pollution occurred in eastern China with annual average PM2.5 exceeding 50 µg m−3 (much higher than 35 µg m−3 as the level 2 annual PM2.5 standard set by World Health Organization Air Quality Interim Target-1) and annual average surface NH3 and NO2 concentrations greater than 8 µg N m−3 and 4 µg N m−3, respectively. A previous study (Xu et al., 2017) reported that the secondary inorganic aerosols of and can account for 65 % of PM2.5 based on the measurements at three sites in Beijing. NH3 and NO2 are the most important precursors of nitrate salts and ammonium salts, and certainly contribute to the severe pollution in eastern China. The second severe pollution episode occurred in northern India with annual average PM2.5 and surface NH3 concentrations exceeding 40 µg m−3 and 4 µg N m−3, respectively (surface NO2 concentrations less than 1 µg N m−3). The major source of NH3 in northern India was agricultural activities and livestock waste management (Warner et al., 2016). The hot spots of surface NH3 concentrations in the central and eastern US were highly related to the hot spots of PM2.5. The annual average PM2.5 is less than 10 µg m−3 (the first level set by the World Health Organization) in most areas of the US, and only small areas had PM2.5 greater than 10 µg m−3. Similarly, in western Europe, the hot spots of high surface NH3 and NO2 concentrations (greater than 3 µg N m−3) were consistent with the hot spots of PM2.5 (greater than 20 µg m−3).
3.4 Seasonal variations in satellite-derived surface NH3 concentrations
To investigate the seasonal variations in surface NH3 concentrations, we took the monthly surface NH3 concentrations in 2014 as a case study (Fig. 6) and analyzed the seasonal surface NH3 concentrations in hot spot regions including eastern China (ECH), Sichuan and Chongqing (SCH), Guangdong (GD), northeastern India (NEI), the eastern US (EUS), and western Europe (WEU) (Fig. 7).
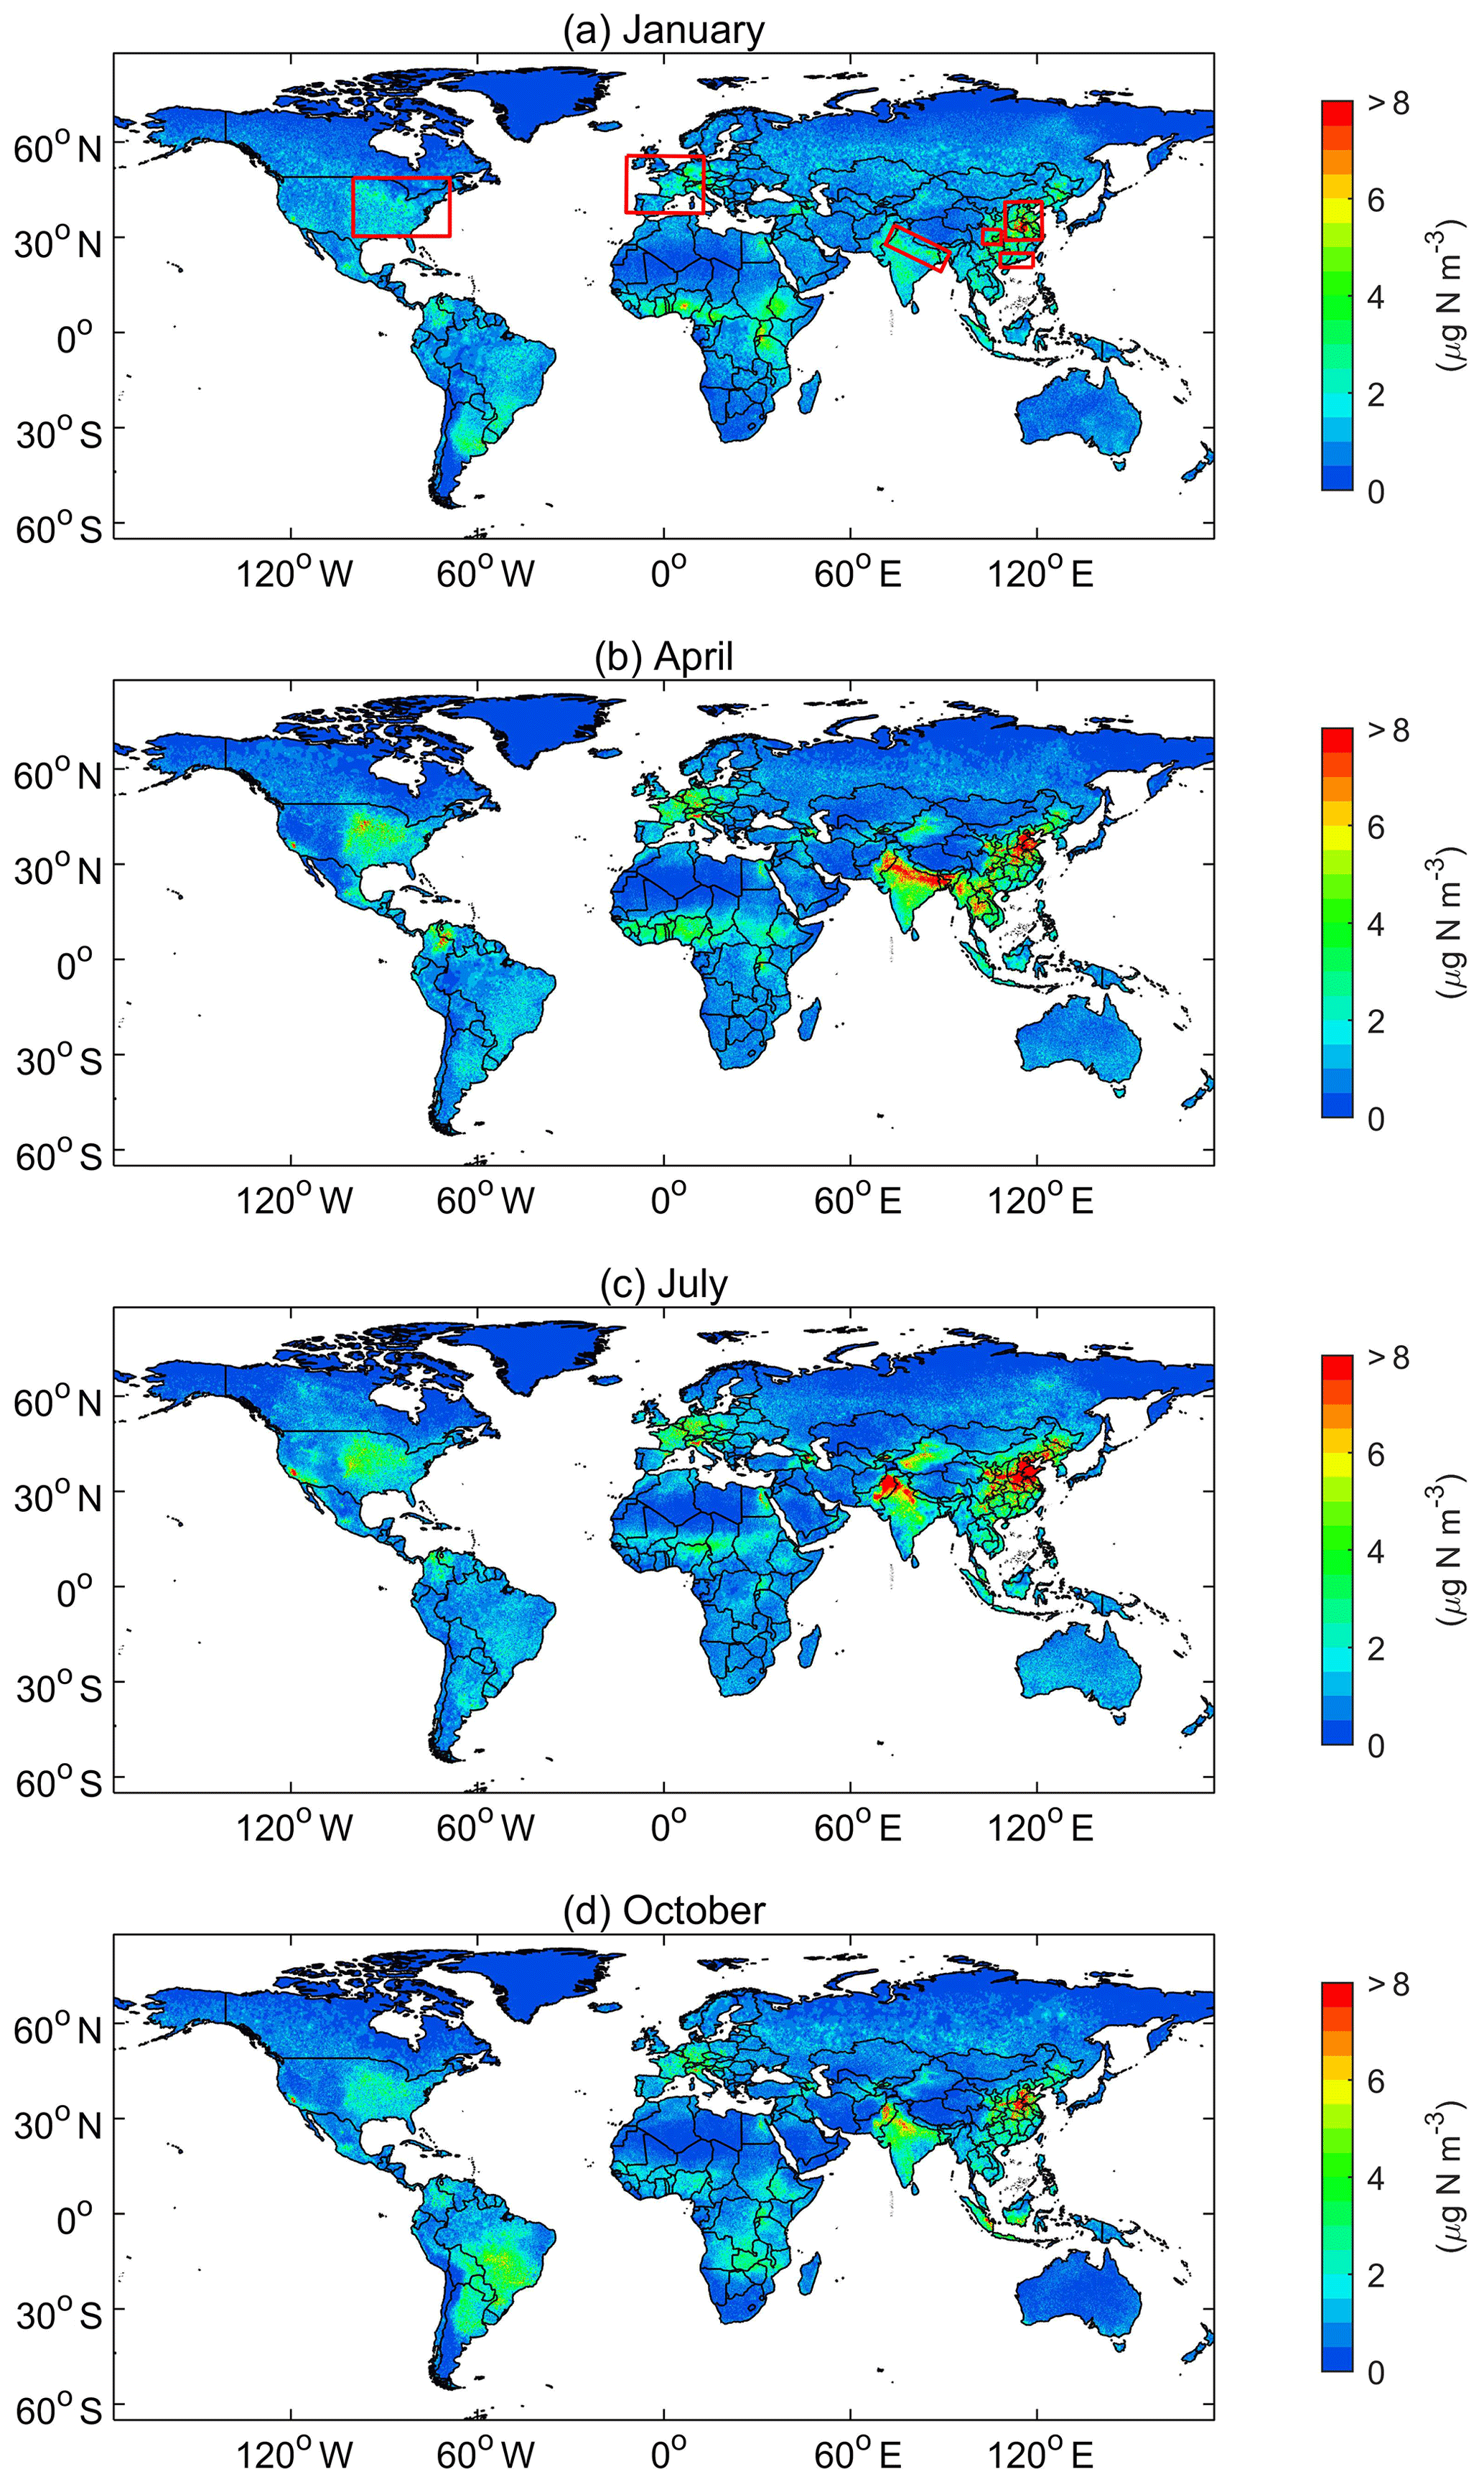
Figure 6Global surface NH3 concentrations in January, April, July and October in 2014. The red rectangular regions include eastern China (ECH), Sichuan and Chongqing (SCH), Guangdong (GD), northeastern India (NEI), the eastern US (EUS), and western Europe (WEU).
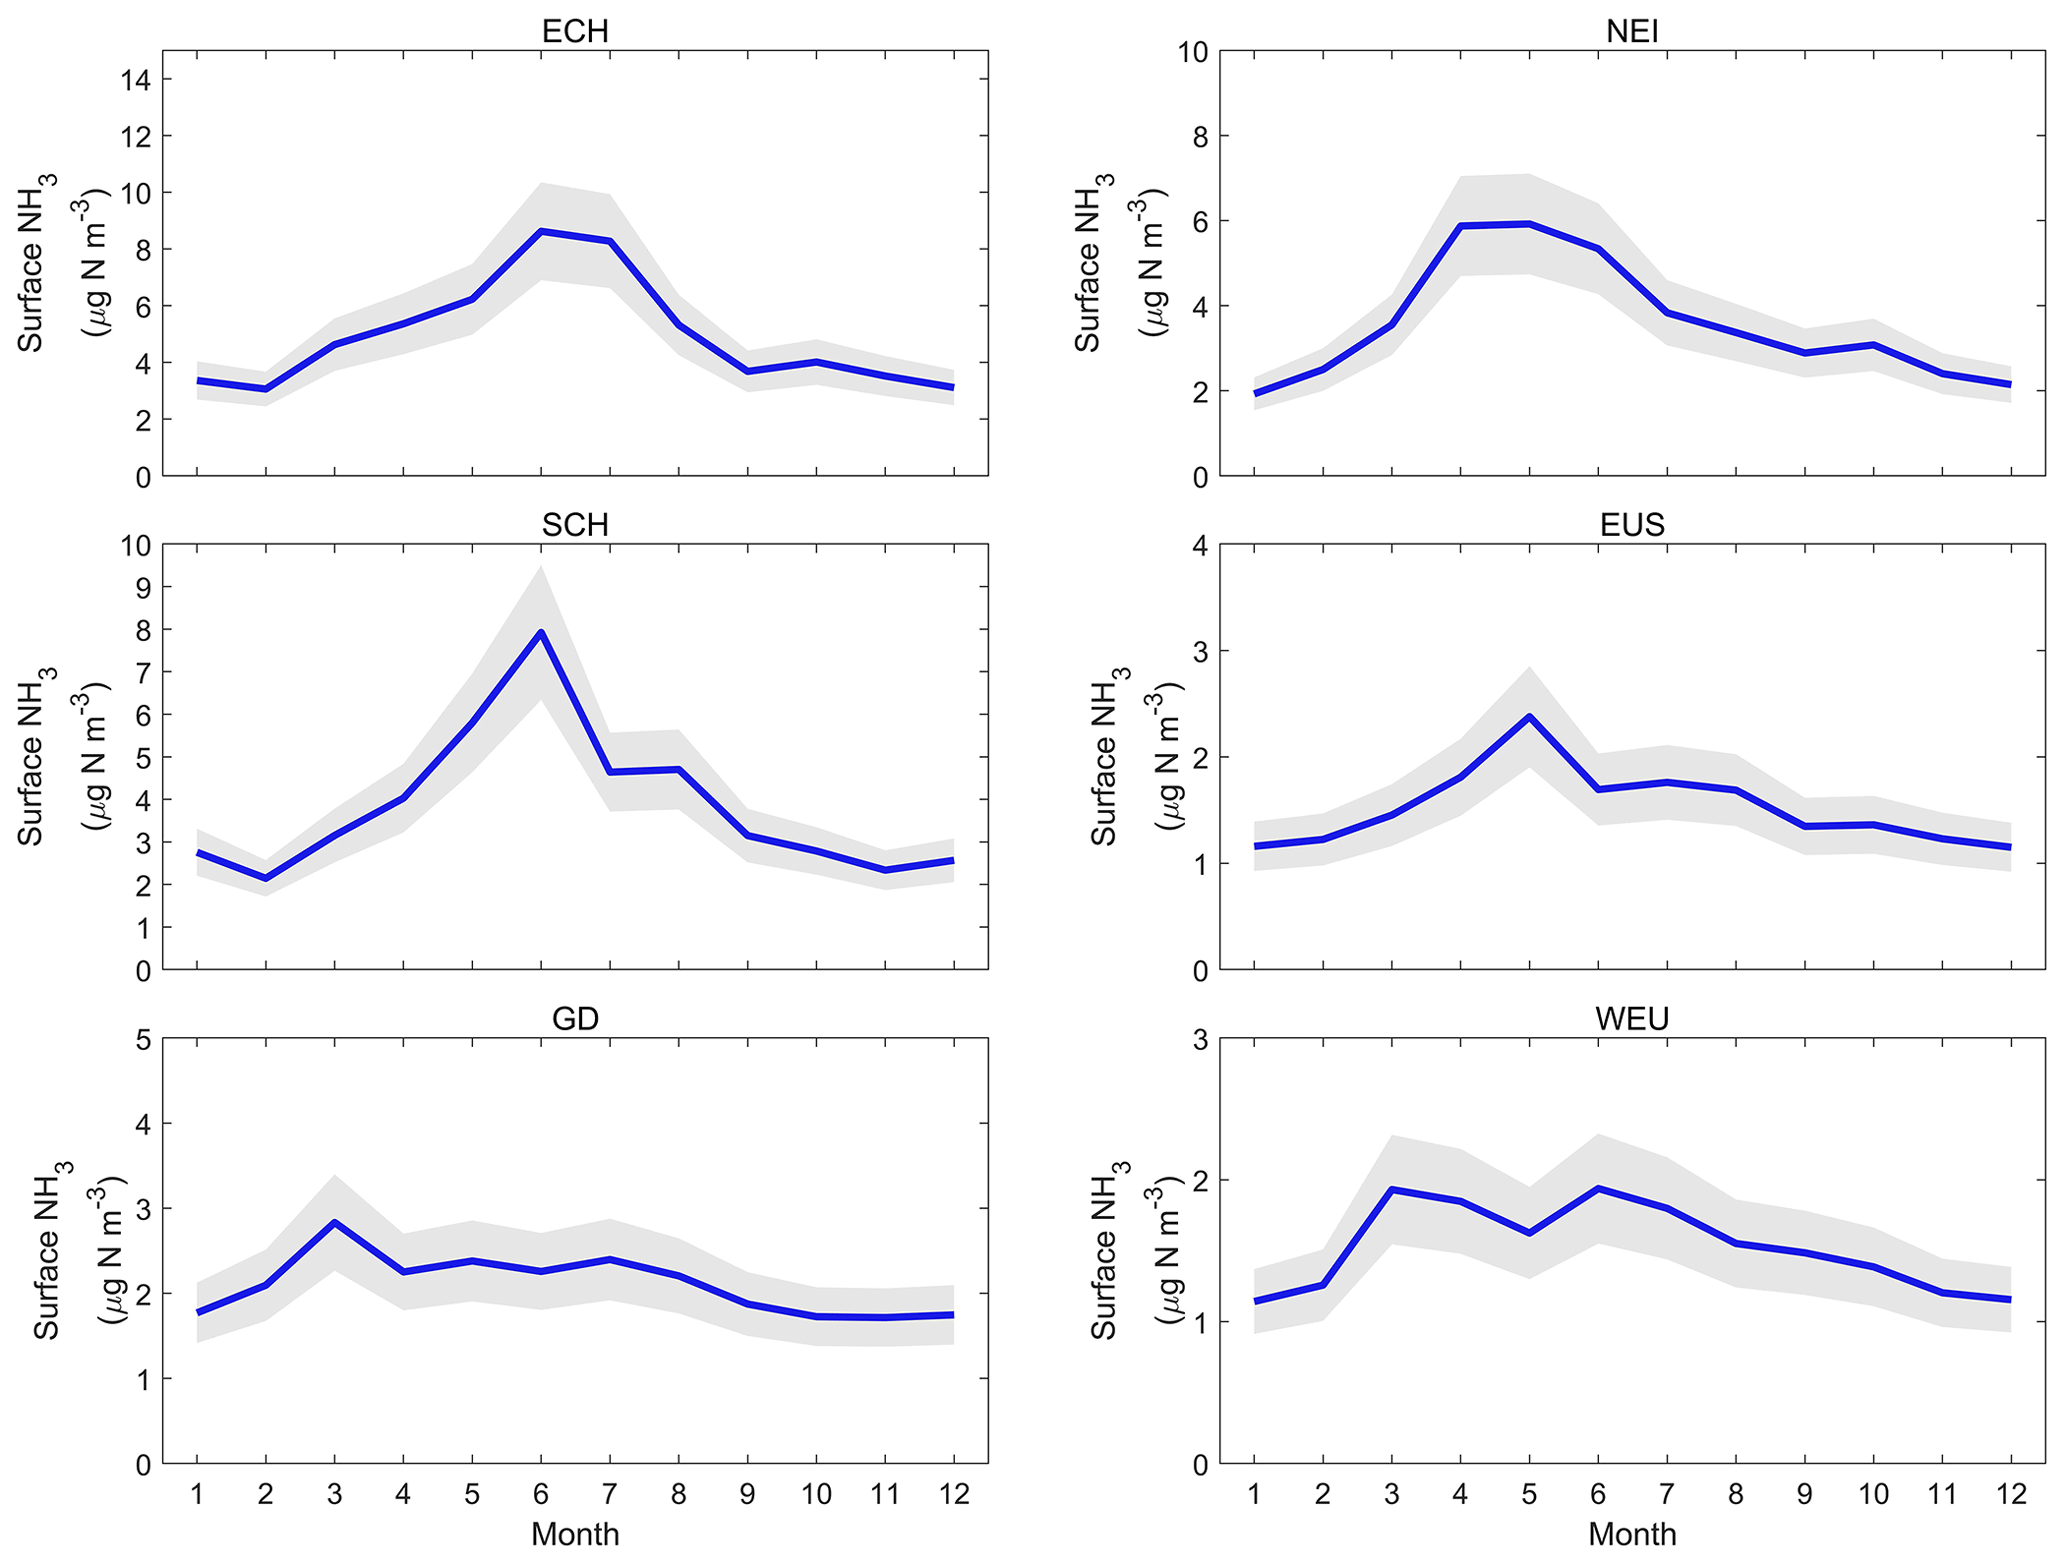
Figure 7Monthly variations in surface NH3 concentrations in hot spot regions including eastern China (ECH), Sichuan and Chongqing (SCH), Guangdong (GD), northeastern India (NEI), the eastern US (EUS), and western Europe (WEU).
Seasonal mean IASI-derived surface NH3 concentrations vary by more than 2 orders of magnitude in hot spot regions, such as eastern China and the eastern US. In China, high surface NH3 concentrations occurred in spring (March, April and May) and summer (June, July and August) in eastern China (ECH), Sichuan and Chongqing (SCH), and Guangdong (GD). This may be due to two major reasons. First, mineral N fertilizer or manure application occurred in summer or spring in the croplands (Paulot et al., 2014). A previous study (Huang et al., 2012) also suggested a summer peak in NH3 emissions in China, which was consistent with the summer peak in surface NH3 concentrations. Second, the temperature in warm months is highest in one year, which favors the volatilization of ammonium (). Notably, there is a difference in the seasonal variations in surface NH3 concentrations between ECH (peaking in June and July) and GD (peaking in March), which was likely related to different crop planting, N fertilization time and meteorological factors (Van Damme et al., 2015a, b; Shen et al., 2009). In the eastern US (EUS), high surface NH3 concentrations appeared in warm months (from March to August, Fig. 7) with the maximum in May due to higher temperature and emissions in vast croplands, where the agricultural mineral N fertilizers dominate the NH3 emissions. A previous study also implied a spring peak in NH3 emissions in the eastern US (Gilliland et al., 2006). Since the spatial patterns of high surface NH3 concentrations are highly linked with the spatial distributions of croplands, seasonal surface NH3 concentrations mainly reflect the timing of N fertilizers in the croplands. In western Europe, surface NH3 concentrations are low in January and February, rise in March and reach their maximum, remain high from March to June, and then decline from June to December (Fig. 7). High NH3 concentrations appeared from March to June, mainly affected by higher temperature and frequent N fertilization (Van Damme et al., 2014a, 2015b; Paulot et al., 2014; Whitburn et al., 2015).
To identify the major regions of biomass burning that may affect the spatial distribution of surface NH3 concentrations, we used the fire products from the Moderate Resolution Imaging Spectroradiometer (MODIS) on board NASA Aqua and Terra. The MODIS climate modeling grid (CMG) global monthly fire location product (level 2, collection 6) developed by the University of Maryland included the geographic location of fire, raw count of fire pixels and mean fire radiative power (Giglio et al., 2015). We used the Aqua and Terra CMG fire products on a monthly scale at a spatial resolution of 0.5∘ latitude × 0.5∘ longitude in 2014, and the fire pixel counts were used to identify the hot spot regions of biomass burning. In the major hot spots with frequent fires (mostly in the Southern Hemisphere), the biomass burning controlled the seasonal surface NH3 concentrations (Figs. S8 and S9), such as, for instance, Africa north of the Equator, Africa south of the Equator and central South America. Apart from the large areas with frequent fires in the Southern Hemisphere, we also demonstrated the relationship of biomass burning and surface NH3 concentrations in China, the US, and Europe and selected six typical regions in China (CH1 and CH2), the US (US1 and US2) and Europe (EU1 and EU2) (Fig. 8) to analyze the monthly variations in fire counts and surface NH3 concentrations.
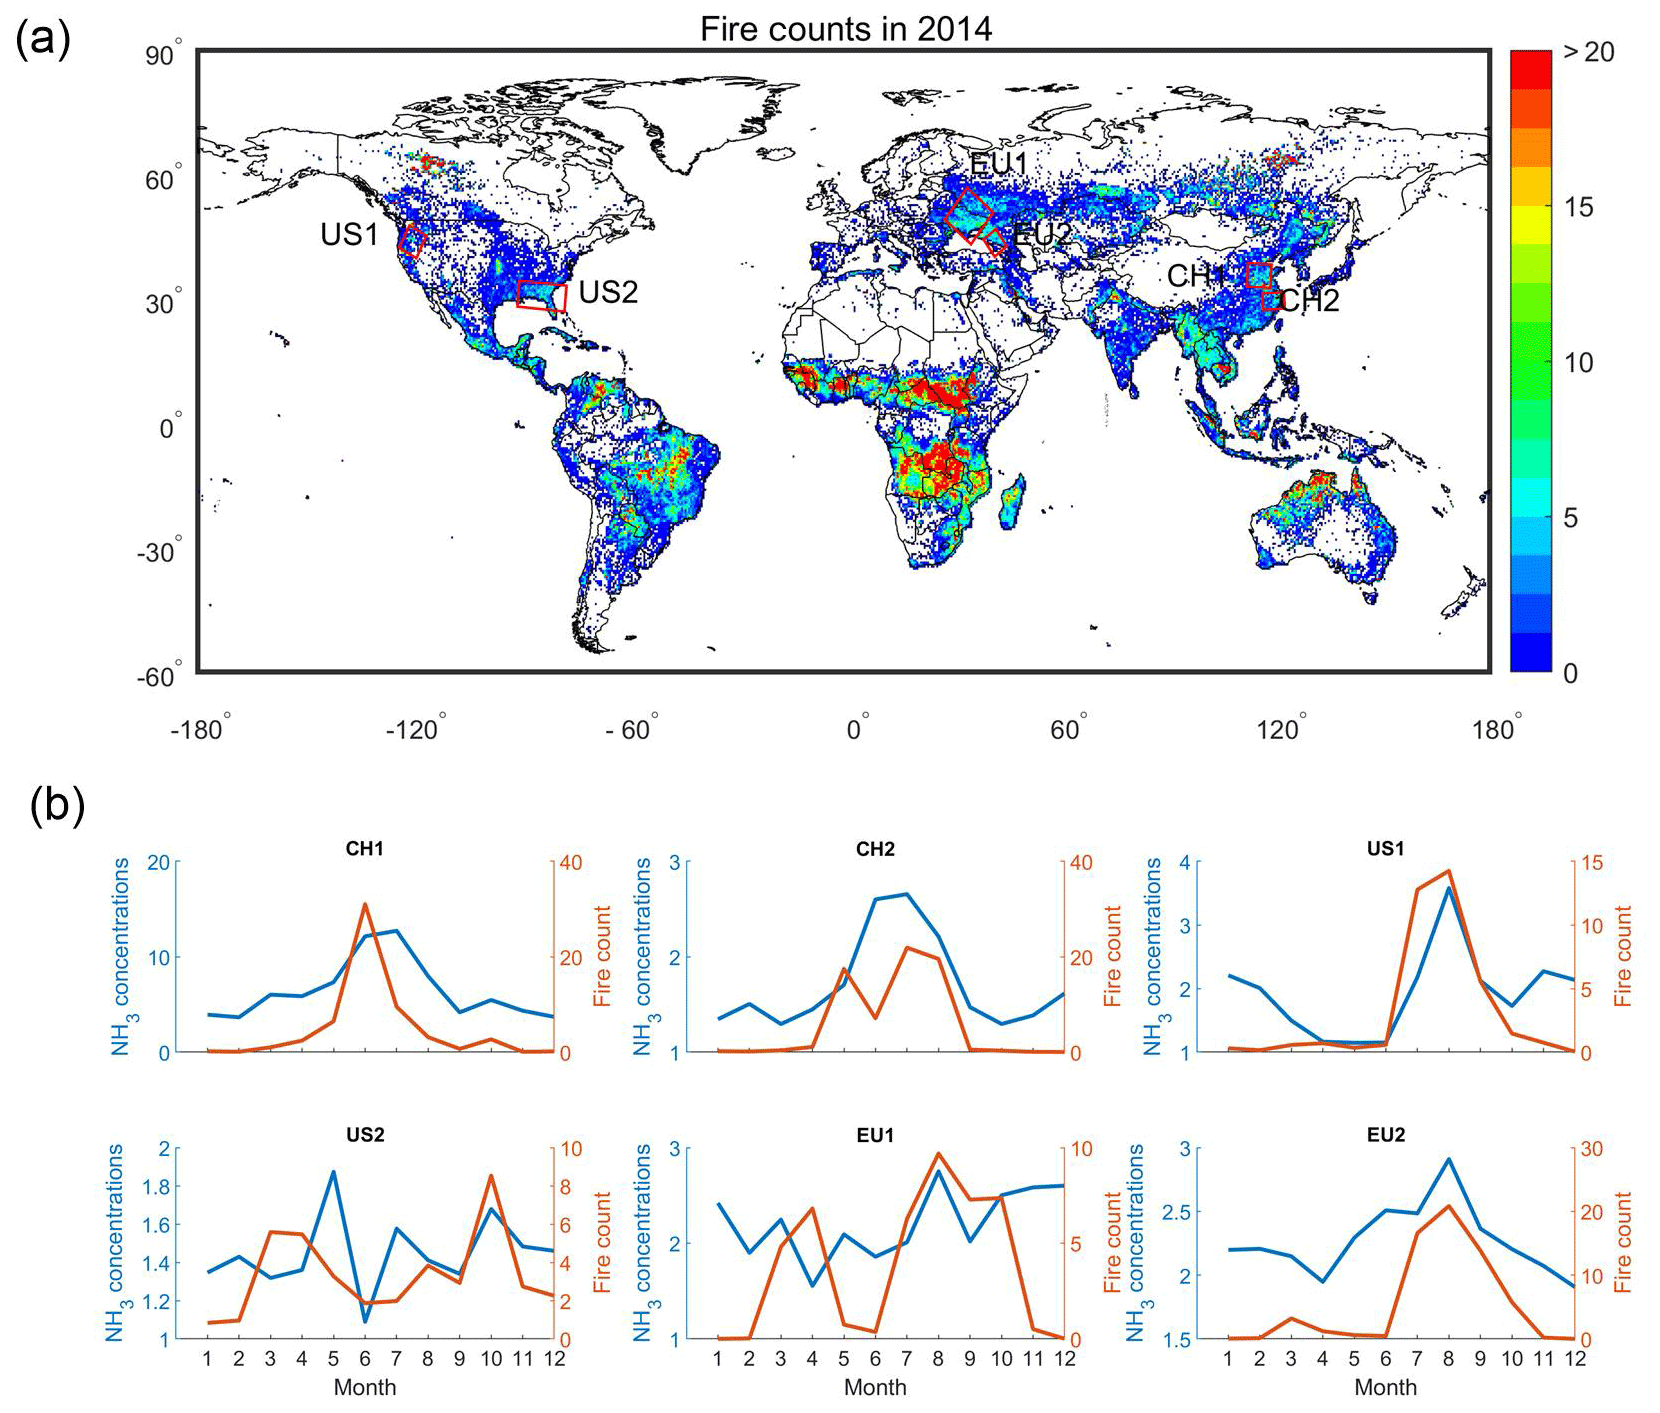
Figure 8MODIS fire counts in 2014. (a) Spatial distributions of MODIS fire counts. (b) Monthly variations in fire counts and surface NH3 concentrations in biomass burning regions in China, the US and Europe.
In China, the first region (CH1) covers the major cropland areas in northern China including Shandong, Henan and northern Jiangsu provinces. The fire counts were mainly from the crop straw burning, which contributes a large amount to surface NH3 concentrations. Both surface NH3 concentrations and fire counts were found in June likely related to the crop straw burning in these agricultural regions. Notably, despite a decline in fire counts in July, the surface NH3 concentrations in July did not decrease, probably due to mineral N fertilization for new planted crops (CH1 is typical for spring and summer corn rotations) as well as the high temperature favoring NH3 volatilization in July. The second region (CH2) is typical for the rice cultivation area in southern China, where the rice was normally planted in June or July with frequent mineral N fertilization. Thus, the highest surface NH3 concentrations occurred in June and July. This region is also typical for the winter wheat and summer rice rotations, and the wheat is normally harvested from May to July, which can lead to frequent fire counts there. Despite the more frequent fires in the second region than the first region, the surface NH3 concentrations in CH2 were much lower than those in CH1. This may be due to the wetter climate and more frequent precipitation events in CH2 than in CH1, resulting in higher scavenging of surface NH3 concentrations into water.
US1 is a region typical for forest land in the US, and the fire counts are certainly from the forest fires or anthropogenic biomass burning. The monthly variations in surface NH3 concentrations were consistent with the monthly variations in MODIS fire counts, which peaked in August with high temperature. Instead, US2 is a region typical for mixed agricultural and forest lands, which can be influenced by both potential mineral N fertilization and anthropogenic biomass burning or forest fires. It is clear to see that there is a peak in surface NH3 concentrations in October resulting from biomass burning because of the same peak in fire counts in October. However, there is also an apparent peak in surface NH3 concentrations in May, which may result from the mineral N fertilization in this region. In Europe, the selected two regions of EU1 and EU2 are mainly covered by crops, vegetables and forests. For EU2, the monthly variations in surface NH3 concentrations were consistent with the monthly variations in MODIS fire counts, which peaked in August with high temperature, implying that the biomass burning may control the seasonal surface NH3 concentrations. For EU1, there were two peaks of surface NH3 concentrations including April and August. The August peak can be related to the biomass burning because of the high fire counts, while the April peak may be related to the agricultural fertilizations for the spring crops.
3.5 Trends in surface NH3 concentrations in China, the US and Europe
Time series of 9 years (2008–2016) of IASI-derived surface NH3 concentrations have been fitted using the linear regression method (Geddes et al., 2016; Richter et al., 2005) for all grids on land. The annual trend (the slope of the linear regression model) is shown in Fig. 9. A significant increase rate of surface NH3 concentrations (> 0.2 µg N m−3 yr−1) appeared in eastern China, and a middle positive trend (0.1–0.2 µg N m−3 yr−1) occurred in northern Xinjiang, corresponding to its frequent agricultural activities for fertilized crops and dry climate (Warner et al., 2017; Liu et al., 2017b; Xu et al., 2015; Huang et al., 2012). The large increase in eastern China was consistent with the results revealed by AIRS NH3 data (Warner et al., 2017). The increase in surface NH3 concentrations in eastern China was consistent with the trend of NH3 emission estimates by a recent study (Zhang et al., 2017). China's NH3 emissions increased significantly from 2008 to 2015, with an increase rate of 1.9 % yr−1, which was mainly driven by eastern China (Zhang et al., 2017). Approximately 85 % of the inter-annual variations were due to the changes of human activities, and the remaining 15 % resulted from air temperature changes. Agricultural activities are the main driver of NH3 emission increase, of which 43.1 % and 36.4 % were contributed by livestock manure and fertilizer application (Zhang et al., 2017). In addition, the increase in surface NH3 concentrations in eastern China may also be linked with the decreased NH3 removal due to the decline in acidic gases (NO2 and SO2) (Liu et al., 2017a; Xia et al., 2016). NH3 can react with nitric acid and sulfuric acid to form ammonia sulfate and ammonia nitrate aerosols. The reduction of acidic gases leads to the reduction of NH3 conversion to ammonia salts in the atmosphere, which may lead to the increase in NH3 in the atmosphere (Liu et al., 2017a; Y. Li et al., 2017). China's SO2 emissions decreased by about 60 % in 2008–2016, which led to a 50 % decrease in surface SO2 concentrations simulated by the WRF model and then resulted in a 30 % increase in surface NH3 concentrations (Liu et al., 2018).
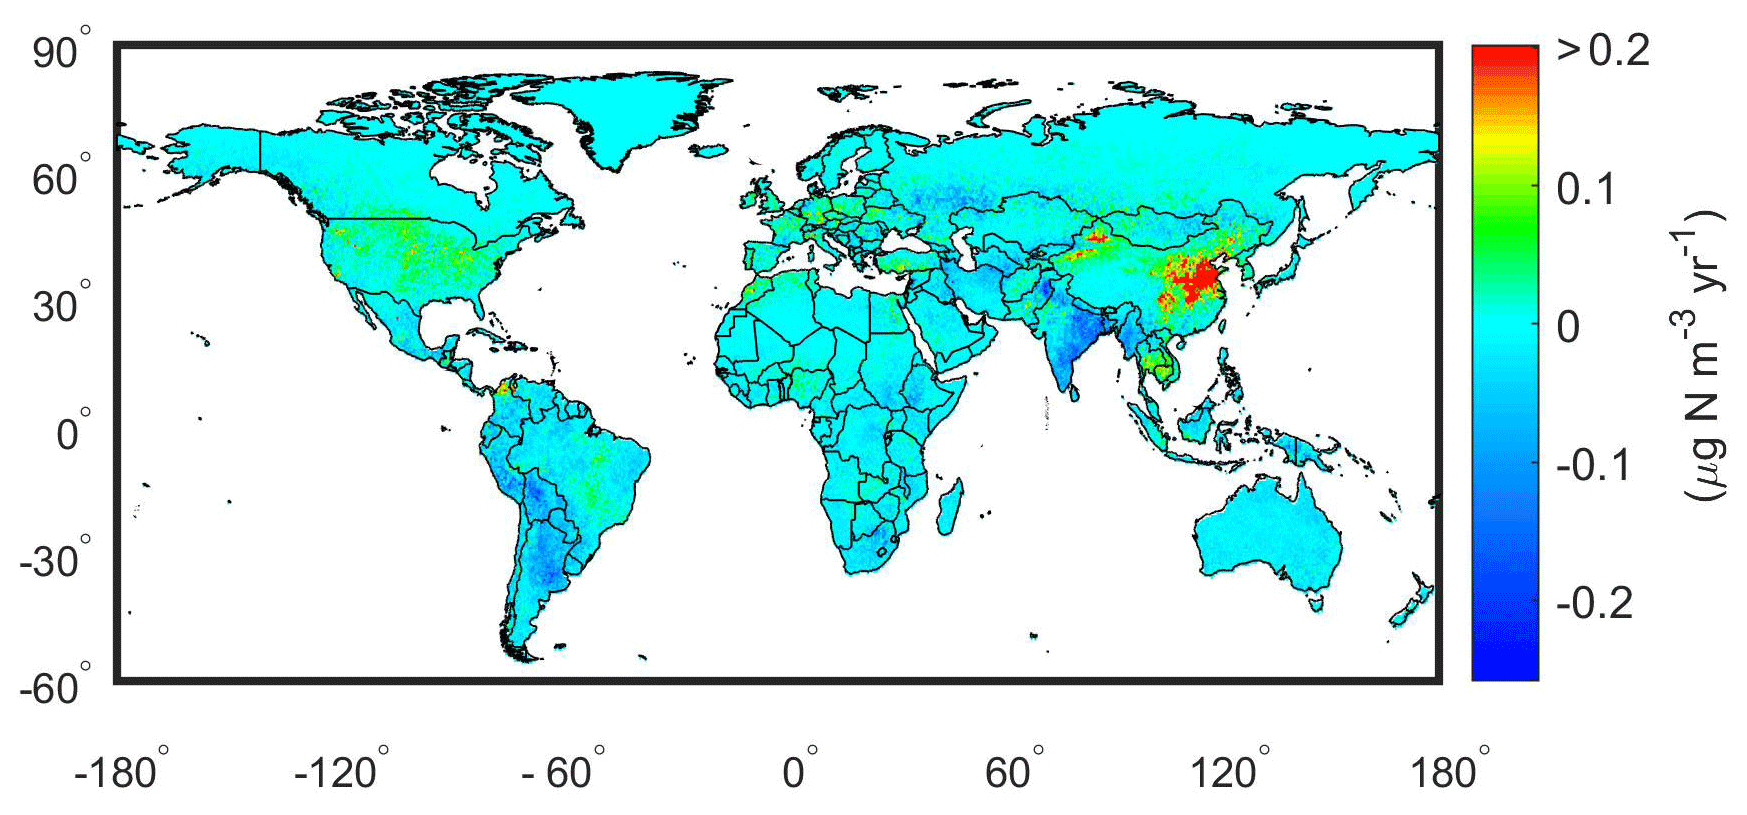
Figure 9Trends of IASI-derived surface NH3 concentrations between 2008 and 2016. A linear regression was performed to calculate the trends. The significance value (p) and R2 for the trends can be found in Fig. S10.
In the US, the NH3 increase was found in agricultural regions in middle and eastern regions with an annual increase rate of lower than 0.10 µg N m−3 yr−1, which was consistent with the results of AIRS NH3 data for a longer time period (2003–2016) (Warner et al., 2017), while we examined the time span of 2008–2016 from IASI retrievals. Based on the simulation data of the CMAQ model, it is also found that NH3 increased significantly in the eastern US from 1990 to 2010, which is inconsistent with the significant downward trend of NOx emissions (Y. Zhang et al., 2018). This inconsistency between NH3 and NOx trends in the US was mainly due to different emission control policies. Over the past 2 decades, due to the implementation of effective regulations and emission reduction measures for NOx, NOx emissions in the US decreased by nearly 41 % between 1990 and 2010 (Hand et al., 2014). However, this NH3 increase in the eastern US is likely due to the lack of NH3 emission control policies as well as the decreased NH3 removal due to the decline in acidic gases (NO2 and SO2) (Warner et al., 2017; Li et al., 2016). As NH3 is an uncontrolled gas in the US, NH3 emissions have continuously increased since 1990, and by 2003 NH3 emissions had begun to dominate the inorganic N emissions (NOx plus NH3) (Y. Zhang et al., 2018). For western Europe, the trend was close to 0 in most regions, although we can observe the NH3 increase at many points with small positive trends lower than 0.1 µg N m−3 yr−1. Compared with the trend of surface NH3 concentrations in China and the US, the change of surface NH3 concentrations in western Europe is more stable, which may be related to the mature NH3 reduction policies and measures in Europe. Since 1990, Europe has implemented a series of agricultural NH3 emission reduction measures, and NH3 emissions decreased by about 29 % between 1990 and 2009 (Tørseth et al., 2012b). For example, due to serious N eutrophication, the Netherlands has taken measures to reduce NH3 emissions by nearly a factor of 2 in the past 20 years, while maintaining a high level of food production (Dentener et al., 2006). The N fertilizer use in Europe has decreased according to the data from the World Bank (http://data.worldbank.org/indicator/AG.CON.FERT.ZS, last access: 18 September 2018) with an annual decrease of −8.84 to kg ha−1 yr−1 in fertilizer use in Europe (Warner et al., 2017).
The IASI-derived global surface NH3 concentrations during 2008–2016 were inferred based on IASI NH3 column measurements as well as NH3 vertical profiles from GEOS-Chem in this study. Global NH3 vertical profiles on land from GEOS-Chem can be modeled well by the Gaussian function between 60∘ N and 55∘ S with R2 higher than 0.90. The IASI-derived surface NH3 concentrations were compared to the in situ measurements over China, the US and Europe. One of the major findings is that a relatively high predictive power for annual surface NH3 concentrations was achieved through converting IASI NH3 columns using modeled NH3 vertical profiles, and the validation with the ground-based measurements shows that IASI-derived surface NH3 concentrations had higher accuracy in China than the US and Europe. High surface NH3 concentrations were found in croplands in China, the US, and Europe, and surface NH3 concentrations in croplands in China were approximately double those in the US and Europe. Seasonal mean IASI-derived surface NH3 concentrations vary by more than 2 orders of magnitude in hot spot regions, such as eastern China and the eastern US. The linear trend analysis shows that a significant positive increase rate of above 0.2 µg N m−3 yr−1 appeared in eastern China during 2008–2016, and a middle increase trend (0.1–0.2 µg N m−3 yr−1) occurred in northern Xinjiang Province. In the US, the NH3 increase was found in agricultural regions in middle and eastern regions with an annual increase rate of lower than 0.10 µg N m−3 yr−1.
The IASI NH3 satellite datasets are available at http://iasi.aeris-data.fr/NH3 (Van Damme et al., 2017, 2018). The ground-based NH3 measurements in the Chinese Nationwide Nitrogen Deposition Monitoring Network (NNDMN) can be requested from Xuejun Liu at the China Agricultural University. The ground-based NH3 measurements from AMoN-US can be downloaded from the website http://nadp.sws.uiuc.edu/AMoN/ (Li et al., 2016). The ground-based NH3 measurements from the EMEP network can be gained from https://www.nilu.no/projects/ccc/emepdata.html (von Bobrutzki et al., 2010). The IASI-derived surface NH3 used in this study is available from the corresponding author upon request.
The supplement related to this article is available online at: https://doi.org/10.5194/acp-19-12051-2019-supplement.
LL and XZ designed the research; WX and XL's group conducted the fieldwork in China; LL prepared IASI NH3 products; LL and AYHW conducted model simulations; LL, WX, LZ, XW and ZW performed the data analysis and prepared the figures; LL, AYHW and XZ wrote the paper, and all coauthors contributed to the revision.
The authors declare that they have no conflict of interest.
We acknowledge the free use of IASI NH3 data from the Atmospheric Spectroscopy Group at Université libre de Bruxelles (ULB). We thank Jeffrey A. Geddes for the help of using GEOS-Chem in this work. This study is supported by the National Natural Science Foundation of China (nos. 41471343, 41425007, 41101315 and 41705130) and Doctoral Research Innovation Fund (2016CL07) as well as the Chinese National Programs on Heavy Air Pollution Mechanisms and Enhanced Prevention Measures (project no. 8 in the second special program).
This research has been supported by the National Natural Science Foundation of China (grant nos. 41471343, 41425007, 41101315 and 41705130).
This paper was edited by Frank Dentener and reviewed by two anonymous referees.
Amos, H. M., Jacob, D. J., Holmes, C. D., Fisher, J. A., Wang, Q., Yantosca, R. M., Corbitt, E. S., Galarneau, E., Rutter, A. P., Gustin, M. S., Steffen, A., Schauer, J. J., Graydon, J. A., Louis, V. L. St., Talbot, R. W., Edgerton, E. S., Zhang, Y., and Sunderland, E. M.: Gas-particle partitioning of atmospheric Hg(II) and its effect on global mercury deposition, Atmos. Chem. Phys., 12, 591–603, https://doi.org/10.5194/acp-12-591-2012, 2012.
Basto, S., Thompson, K., Phoenix, G., Sloan, V., Leake, J., and Rees, M.: Long-term nitrogen deposition depletes grassland seed banks, Nat. Commun., 6, 1–6, https://doi.org/10.1038/ncomms7185, 2015.
Crippa, M., Guizzardi, D., Muntean, M., Schaaf, E., Dentener, F., van Aardenne, J. A., Monni, S., Doering, U., Olivier, J. G. J., Pagliari, V., and Janssens-Maenhout, G.: Gridded emissions of air pollutants for the period 1970–2012 within EDGAR v4.3.2, Earth Syst. Sci. Data, 10, 1987–2013, https://doi.org/10.5194/essd-10-1987-2018, 2018.
Dammers, E., Palm, M., Van Damme, M., Vigouroux, C., Smale, D., Conway, S., Toon, G. C., Jones, N., Nussbaumer, E., Warneke, T., Petri, C., Clarisse, L., Clerbaux, C., Hermans, C., Lutsch, E., Strong, K., Hannigan, J. W., Nakajima, H., Morino, I., Herrera, B., Stremme, W., Grutter, M., Schaap, M., Wichink Kruit, R. J., Notholt, J., Coheur, P. F., and Erisman, J. W.: An evaluation of IASI-NH3 with ground-based Fourier transform infrared spectroscopy measurements, Atmos. Chem. Phys., 16, 10351–10368, https://doi.org/10.5194/acp-16-10351-2016, 2016.
Dentener, F., Drevet, J., Lamarque, J., Bey, I., Eickhout, B., Fiore, A., Hauglustaine, D., Horowitz, L., Krol, M., and Kulshrestha, U.: Nitrogen and sulfur deposition on regional and global scales: a multimodel evaluation, Global Biogeochem. Cy., 20, 1–21, 2006.
Eerden, L. J. M. V. D.: Toxicity of ammonia to plants, Agr. Environ., 7, 223–235, 1982.
Fountoukis, C. and Nenes, A.: ISORROPIA II: a computationally efficient thermodynamic equilibrium model for K+––––Na+–––Cl−–H2O aerosols, Atmos. Chem. Phys., 7, 4639–4659, https://doi.org/10.5194/acp-7-4639-2007, 2007.
Geddes, J. A., Martin, R. V., Boys, B. L., and van Donkelaar, A.: Long-term trends worldwide in ambient NO2 concentrations inferred from satellite observations, Environ. Health Persp., 124, 281–289, 2016.
Geng, G., Zhang, Q., Martin, R. V., Donkelaar, A. V., Huo, H., Che, H., Lin, J., and He, K.: Estimating long-term PM2.5 concentrations in China using satellite-based aerosol optical depth and a chemical transport model, Remote Sens. Environ., 166, 262–270, 2015.
Giglio, L., Randerson, J. T., and van der Werf, G. R.: Analysis of daily, monthly, and annual burned area using the fourth-generation global fire emissions database (GFED4), J. Geophys. Res.-Biogeo., 118, 317–328, https://doi.org/10.1002/jgrg.20042, 2013.
Giglio, L., Csiszar, I., and Justice, C. O.: Global distribution and seasonality of active fires as observed with the Terra and Aqua Moderate Resolution Imaging Spectroradiometer (MODIS) sensors, J. Geophys. Res.-Biogeo., 111, 17–23, 2015.
Gilliland, A. B., Wyat Appel, K., Pinder, R. W., and Dennis, R. L.: Seasonal NH3 emissions for the continental united states: Inverse model estimation and evaluation, Atmos. Environ., 40, 4986–4998, https://doi.org/10.1016/j.atmosenv.2005.12.066, 2006.
Hand, J. L., Schichtel, B. A., Malm, W. C., Copeland, S., Molenar, J. V., Frank, N., and Pitchford, M.: Widespread reductions in haze across the United States from the early 1990s through 2011, Atmos. Environ., 94, 671–679, 2014.
Huang, X., Song, Y., Li, M., Li, J., Huo, Q., Cai, X., Zhu, T., Hu, M., and Zhang, H.: A high resolution ammonia emission inventory in China, Global Biogeochem. Cy., 26, 1–14, 2012.
Janssens-Maenhout, G., Crippa, M., Guizzardi, D., Dentener, F., Muntean, M., Pouliot, G., Keating, T., Zhang, Q., Kurokawa, J., Wankmüller, R., Denier van der Gon, H., Kuenen, J. J. P., Klimont, Z., Frost, G., Darras, S., Koffi, B., and Li, M.: HTAP_v2.2: a mosaic of regional and global emission grid maps for 2008 and 2010 to study hemispheric transport of air pollution, Atmos. Chem. Phys., 15, 11411–11432, https://doi.org/10.5194/acp-15-11411-2015, 2015.
Kang, Y., Liu, M., Song, Y., Huang, X., Yao, H., Cai, X., Zhang, H., Kang, L., Liu, X., Yan, X., He, H., Zhang, Q., Shao, M., and Zhu, T.: High-resolution ammonia emissions inventories in China from 1980 to 2012, Atmos. Chem. Phys., 16, 2043–2058, https://doi.org/10.5194/acp-16-2043-2016, 2016.
Kharol, S. K., Shephard, M. W., McLinden, C. A., Zhang, L., Sioris, C. E., O'Brien, J. M., Vet, R., Cady-Pereira, K. E., Hare, E., Siemons, J., and Krotkov, N. A.: Dry Deposition of Reactive Nitrogen From Satellite Observations of Ammonia and Nitrogen Dioxide Over North America, Geophys. Res. Lett., 45, 1157–1166, https://doi.org/10.1002/2017GL075832, 2018.
Kim, T. W., Lee, K., Duce, R., and Liss, P.: Impact of atmospheric nitrogen deposition on phytoplankton productivity in the South China Sea, Geophys. Res. Lett., 41, 3156–3162, 2014.
Lamarque, J. F., Kiehl, J., Brasseur, G., Butler, T., Cameron-Smith, P., Collins, W., Collins, W., Granier, C., Hauglustaine, D., and Hess, P.: Assessing future nitrogen deposition and carbon cycle feedback using a multimodel approach: Analysis of nitrogen deposition, J. Geophys. Res.-Atmos. (1984–2012), 110, 1–21, 2005.
Lamsal, L. N., Martin, R. V., van Donkelaar, A., Steinbacher, M., Celarier, E. A., Bucsela, E., Dunlea, E. J., and Pinto, J. P.: Ground-level nitrogen dioxide concentrations inferred from the satellite-borne Ozone Monitoring Instrument, J. Geophys. Res.-Atmos., 113, 1–15, https://doi.org/10.1029/2007JD009235, 2008.
Lamsal, L. N., Martin, R. V., Parrish, D. D., and Krotkov, N. A.: Scaling relationship for NO2 pollution and urban population size: a satellite perspective, Environ. Sci. Technol., 47, 7855–7861, 2013.
Larssen, T., Duan, L., and Mulder, J.: Deposition and leaching of sulfur, nitrogen and calcium in four forested catchments in China: implications for acidification, Environ. Sci. Technol., 45, 1192–1198, 2011.
Lenhart, L. and Friedrich, R.: European emission data with high temporal and spatial resolution, Water Air Soil Pollut., 85, 1897–1902, 1995.
Levine, J. S., Augustsson, T. R., and Hoell, J. M.: The vertical distribution of tropospheric ammonia, Geophys. Res. Lett., 7, 317–320, https://doi.org/10.1029/GL007i005p00317, 1980.
Li, M., Zhang, Q., Kurokawa, J.-I., Woo, J.-H., He, K., Lu, Z., Ohara, T., Song, Y., Streets, D. G., Carmichael, G. R., Cheng, Y., Hong, C., Huo, H., Jiang, X., Kang, S., Liu, F., Su, H., and Zheng, B.: MIX: a mosaic Asian anthropogenic emission inventory under the international collaboration framework of the MICS-Asia and HTAP, Atmos. Chem. Phys., 17, 935–963, https://doi.org/10.5194/acp-17-935-2017, 2017.
Li, Y., Schwandner, F. M., Sewell, H. J., Zivkovich, A., Tigges, M., Raja, S., Holcomb, S., Molenar, J. V., Sherman, L., and Archuleta, C.: Observations of ammonia, nitric acid, and fine particles in a rural gas production region, Atmos. Environ., 83, 80–89, 2014.
Li, Y., Schichtel, B. A., Walker, J. T., Schwede, D. B., Chen, X., Lehmann, C. M., Puchalski, M. A., Gay, D. A., and Collett, J. L.: Increasing importance of deposition of reduced nitrogen in the United States, P. Natl. Acad. Sci. USA, 113, 5874–5879, 2016.
Li, Y., Thompson, T. M., Van Damme, M., Chen, X., Benedict, K. B., Shao, Y., Day, D., Boris, A., Sullivan, A. P., Ham, J., Whitburn, S., Clarisse, L., Coheur, P.-F., and Collett Jr., J. L.: Temporal and spatial variability of ammonia in urban and agricultural regions of northern Colorado, United States, Atmos. Chem. Phys., 17, 6197–6213, https://doi.org/10.5194/acp-17-6197-2017, 2017.
Lin, J. T., Martin, R. V., Boersma, K. F., Sneep, M., Stammes, P., Spurr, R., Wang, P., Van Roozendael, M., Clémer, K., and Irie, H.: Retrieving tropospheric nitrogen dioxide from the Ozone Monitoring Instrument: effects of aerosols, surface reflectance anisotropy, and vertical profile of nitrogen dioxide, Atmos. Chem. Phys., 14, 1441–1461, 10.5194/acp-14-1441-2014, 2014.
Liu, H., Jacob, D. J., Bey, I., and Yantosca, R. M.: Constraints from 210Pb and 7Be on wet deposition and transport in a global three-dimensional chemical tracer model driven by assimilated meteorological fields, J. Geophys. Res.-Atmos., 106, 12109–12128, https://doi.org/10.1029/2000JD900839, 2001.
Liu, L., Zhang, X., Xu, W., Liu, X., Li, Y., Lu, X., Zhang, Y., and Zhang, W.: Temporal characteristics of atmospheric ammonia and nitrogen dioxide over China based on emission data, satellite observations and atmospheric transport modeling since 1980, Atmos. Chem. Phys., 17, 9365–9378, https://doi.org/10.5194/acp-17-9365-2017, 2017a.
Liu, L., Zhang, X., Xu, W., Liu, X., Lu, X., Wang, S., Zhang, W., and Zhao, L.: Ground Ammonia Concentrations over China Derived from Satellite and Atmospheric Transport Modeling, Remote Sens., 9, 1–19, 2017b.
Liu, L., Zhang, X., Zhang, Y., Xu, W., Liu, X., Zhang, X., Feng, J., Chen, X., Zhang, Y., Lu, X., Wang, S., Zhang, W., and Zhao, L.: Dry Particulate Nitrate Deposition in China, Environ. Sci. Technol., 51, 5572–5581, https://doi.org/10.1021/acs.est.7b00898, 2017c.
Liu, M., Huang, X., Song, Y., Xu, T., Wang, S., Wu, Z., Hu, M., Zhang, L., Zhang, Q., Pan, Y., Liu, X., and Zhu, T.: Rapid SO2 emission reductions significantly increase tropospheric ammonia concentrations over the North China Plain, Atmos. Chem. Phys., 18, 17933–17943, https://doi.org/10.5194/acp-18-17933-2018, 2018.
Mao, J., Paulot, F., Jacob, D. J., Cohen, R. C., Crounse, J. D., Wennberg, P. O., Keller, C. A., Hudman, R. C., Barkley, M. P., and Horowitz, L. W.: Ozone and organic nitrates over the eastern United States: Sensitivity to isoprene chemistry, J. Geophys. Res.-Atmos., 118, 11256–11268, 2013.
Nowlan, C., Martin, R., Philip, S., Lamsal, L., Krotkov, N., Marais, E., Wang, S., and Zhang, Q.: Global dry deposition of nitrogen dioxide and sulfur dioxide inferred from space-based measurements, Global Biogeochem. Cy., 28, 1025–1043, 2014.
Pan, Y., Tian, S., Zhao, Y., Zhang, L., Zhu, X., Gao, J., Huang, W., Zhou, Y., Song, Y., and Zhang, Q.: Identifying ammonia hotspots in China using a national observation network, Environ. Sci. Technol., 52, 3926–3934, 2018.
Paulot, F., Jacob, D. J., Pinder, R. W., Bash, J. O., Travis, K., and Henze, D. K.: Ammonia emissions in the United States, European Union, and China derived by high-resolution inversion of ammonium wet deposition data: Interpretation with a new agricultural emissions inventory (MASAGE_NH3), J. Geophys. Res.-Atmos., 119, 4343–4364, https://doi.org/10.1002/2013JD021130, 2014.
Potter, P., Ramankutty, N., Bennett, E. M., and Donner, S. D.: Characterizing the Spatial Patterns of Global Fertilizer Application and Manure Production, Earth Interact., 14, 1–22, https://doi.org/10.1175/2009EI288.1, 2010.
Preston, K. E., Jones, R. L., and Roscoe, H. K.: Retrieval of NO2 vertical profiles from ground-based UV-visible measurements: Method and validation, J. Geophys. Res.-Atmos., 102, 19089–19097, https://doi.org/10.1029/97JD00603, 1997.
Puchalski, M. A., Sather, M. E., Walker, J. T., Lehmann, C. M. B., Gay, D. A., Johnson, M., and Robarge, W. P.: Passive ammonia monitoring in the United States: comparing three different sampling devices, J. Environ. Monitor., 13, 3156–3167, 2011.
Pye, H. O. T., Liao, H., Wu, S., Mickley, L. J., Jacob, D. J., Henze, D. K., and Seinfeld, J. H.: Effect of changes in climate and emissions on future sulfate-nitrate-ammonium aerosol levels in the United States, J. Geophys. Res.-Atmos., 114, 1–18, https://doi.org/10.1029/2008jd010701, 2009.
Reay, D. S., Dentener, F., Smith, P., Grace, J., and Feely, R. A.: Global nitrogen deposition and carbon sinks, Nat. Geosci., 1, 430–437, 2008.
Richter, A., Burrows, J. P., Nüß, H., Granier, C., and Niemeier, U.: Increase in tropospheric nitrogen dioxide over China observed from space, Nature, 437, 129–132, 2005.
Rozanov, A., Bovensmann, H., Bracher, A., Hrechanyy, S., Rozanov, V., Sinnhuber, M., Stroh, F., and Burrows, J. P.: NO2 and BrO vertical profile retrieval from SCIAMACHY limb measurements: Sensitivity studies, Adv. Space Res., 36, 846–854, https://doi.org/10.1016/j.asr.2005.03.013, 2005.
Schaap, M., van Loon, M., ten Brink, H. M., Dentener, F. J., and Builtjes, P. J. H.: Secondary inorganic aerosol simulations for Europe with special attention to nitrate, Atmos. Chem. Phys., 4, 857–874, 10.5194/acp-4-857-2004, 2004.
Schiferl, L. D., Heald, C. L., Nowak, J. B., Holloway, J. S., Neuman, J. A., Bahreini, R., Pollack, I. B., Ryerson, T. B., Wiedinmyer, C., and Murphy, J. G.: An investigation of ammonia and inorganic particulate matter in California during the CalNex campaign, J. Geophys. Res.-Atmos., 119, 1883–1902, 2014.
Schiferl, L. D., Heald, C. L., Van Damme, M., Clarisse, L., Clerbaux, C., Coheur, P.-F., Nowak, J. B., Neuman, J. A., Herndon, S. C., Roscioli, J. R., and Eilerman, S. J.: Interannual variability of ammonia concentrations over the United States: sources and implications, Atmos. Chem. Phys., 16, 12305–12328, https://doi.org/10.5194/acp-16-12305-2016, 2016.
Shen, J. L., Tang, A. H., Liu, X. J., Fangmeier, A., Goulding, K. T. W., and Zhang, F. S.: High concentrations and dry deposition of reactive nitrogen species at two sites in the North China Plain, Environmental Pollut., 157, 3106–3113, https://doi.org/10.1016/j.envpol.2009.05.016, 2009.
Shephard, M. W. and Cady-Pereira, K. E.: Cross-track Infrared Sounder (CrIS) satellite observations of tropospheric ammonia, Atmos. Meas. Tech., 8, 1323–1336, https://doi.org/10.5194/amt-8-1323-2015, 2015.
Shephard, M. W., Cady-Pereira, K. E., Luo, M., Henze, D. K., Pinder, R. W., Walker, J. T., Rinsland, C. P., Bash, J. O., Zhu, L., Payne, V. H., and Clarisse, L.: TES ammonia retrieval strategy and global observations of the spatial and seasonal variability of ammonia, Atmos. Chem. Phys., 11, 10743–10763, https://doi.org/10.5194/acp-11-10743-2011, 2011.
Sheppard, L. J., Leith, I. D., Crossley, A., Dijk, N. V., Fowler, D., Sutton, M. A., and Woods, C.: Stress responses of Calluna vulgaris to reduced and oxidised N applied under “real world conditions”, Environ. Pollut., 154, 404–413, 2008.
Simon, H., Allen, D. T., and Wittig, A. E.: Fine particulate matter emissions inventories: comparisons of emissions estimates with observations from recent field programs, J. Air Waste Manage., 58, 320–343, 2008.
Sutton, M. A., Tang, Y. S., Miners, B., and Fowler, D.: A New Diffusion Denuder System for Long-Term, Regional Monitoring of Atmospheric Ammonia and Ammonium, Water Air Soil Pollut., 1, 145–156, 2001.
Tørseth, K., Aas, W., Breivik, K., Fjæraa, A. M., Fiebig, M., Hjellbrekke, A. G., Lund Myhre, C., Solberg, S., and Yttri, K. E.: Introduction to the European Monitoring and Evaluation Programme (EMEP) and observed atmospheric composition change during 1972–2009, Atmos. Chem. Phys., 12, 5447–5481, https://doi.org/10.5194/acp-12-5447-2012, 2012a.
Tørseth, K., Aas, W., Breivik, K., Fjæraa, A. M., Fiebig, M., Hjellbrekke, A. G., Lund Myhre, C., Solberg, S., and Yttri, K. E.: Introduction to the European Monitoring and Evaluation Programme (EMEP) and observed atmospheric composition change during 1972–2009, Atmos. Chem. Phys., 12, 5447–5481, https://doi.org/10.5194/acp-12-5447-2012, 2012b.
Tevlin, A. G., Li, Y., Collett, J. L., Mcduffie, E. E., Fischer, E. V., and Murphy, J. G.: Tall Tower Vertical Profiles and Diurnal Trends of Ammonia in the Colorado Front Range, J. Geophys. Res.-Atmos., 122, 12468–12487, 2017.
Van, D. A., Martin, R. V., Spurr, R. J., and Burnett, R. T.: High-Resolution Satellite-Derived PM2.5 from Optimal Estimation and Geographically Weighted Regression over North America, Environ. Sci. Technol., 49, 10482–10491, 2015.
Van, D. A., Martin, R. V., Brauer, M., Hsu, N. C., Kahn, R. A., Levy, R. C., Lyapustin, A., Sayer, A. M., and Winker, D. M.: Global Estimates of Fine Particulate Matter using a Combined Geophysical-Statistical Method with Information from Satellites, Models, and Monitors, Environ. Sci. Technol., 50, 3762–3772, 2016.
Van Damme, M., Clarisse, L., Heald, C. L., Hurtmans, D., Ngadi, Y., Clerbaux, C., Dolman, A. J., Erisman, J. W., and Coheur, P. F.: Global distributions, time series and error characterization of atmospheric ammonia (NH3) from IASI satellite observations, Atmos. Chem. Phys., 14, 2905–2922, https://doi.org/10.5194/acp-14-2905-2014, 2014a.
Van Damme, M., Wichink Kruit, R., Schaap, M., Clarisse, L., Clerbaux, C., Coheur, P. F., Dammers, E., Dolman, A., and Erisman, J.: Evaluating 4 years of atmospheric ammonia (NH3) over Europe using IASI satellite observations and LOTOS-EUROS model results, J. Geophys. Res.-Atmos., 119, 9549–9566, 2014b.
Van Damme, M., Clarisse, L., Dammers, E., Liu, X., Nowak, J. B., Clerbaux, C., Flechard, C. R., Galy-Lacaux, C., Xu, W., Neuman, J. A., Tang, Y. S., Sutton, M. A., Erisman, J. W., and Coheur, P. F.: Towards validation of ammonia (NH3) measurements from the IASI satellite, Atmos. Meas. Tech., 8, 1575–1591, https://doi.org/10.5194/amt-8-1575-2015, 2015a.
Van Damme, M., Erisman, J. W., Clarisse, L., Dammers, E., Whitburn, S., Clerbaux, C., Dolman, A. J., and Coheur, P. F.: Worldwide spatiotemporal atmospheric ammonia (NH3) columns variability revealed by satellite, Geophys. Res. Lett., 42, 8660–8668, 2015b.
Van Damme, M., Whitburn, S., Clarisse, L., Clerbaux, C., Hurtmans, D., and Coheur, P.-F.: Version 2 of the IASI NH3 neural network retrieval algorithm: near-real-time and reanalysed datasets, Atmos. Meas. Tech., 10, 4905–4914, https://doi.org/10.5194/amt-10-4905-2017, 2017.
Van Damme, M., Clarisse, L., Whitburn, S., Hadji-Lazaro, J., Hurtmans, D., Clerbaux, C., and Coheur, P.-F.: Industrial and agricultural ammonia point sources exposed, Nature, 564, 99–103, https://doi.org/10.1038/s41586-018-0747-1, 2018.
van der Graaf, S. C., Dammers, E., Schaap, M., and Erisman, J. W.: Technical note: How are NH3 dry deposition estimates affected by combining the LOTOS-EUROS model with IASI-NH3 satellite observations?, Atmos. Chem. Phys., 18, 13173–13196, https://doi.org/10.5194/acp-18-13173-2018, 2018.
von Bobrutzki, K., Braban, C. F., Famulari, D., Jones, S. K., Blackall, T., Smith, T. E. L., Blom, M., Coe, H., Gallagher, M., Ghalaieny, M., McGillen, M. R., Percival, C. J., Whitehead, J. D., Ellis, R., Murphy, J., Mohacsi, A., Pogany, A., Junninen, H., Rantanen, S., Sutton, M. A., and Nemitz, E.: Field inter-comparison of eleven atmospheric ammonia measurement techniques, Atmos. Meas. Tech., 3, 91–112, https://doi.org/10.5194/amt-3-91-2010, 2010.
Wang, Q., Jacob, D. J., Fisher, J. A., Mao, J., Leibensperger, E. M., Carouge, C. C., Le Sager, P., Kondo, Y., Jimenez, J. L., Cubison, M. J., and Doherty, S. J.: Sources of carbonaceous aerosols and deposited black carbon in the Arctic in winter-spring: implications for radiative forcing, Atmos. Chem. Phys., 11, 12453–12473, https://doi.org/10.5194/acp-11-12453-2011, 2011.
Wang, Y., Logan, J. A., and Jacob, D. J.: Global simulation of tropospheric O3−NOx-hydrocarbon chemistry: 2. Model evaluation and global ozone budget, J. Geophys. Res.-Atmos., 103, 10727–10755, 1998.
Warner, J. X., Wei, Z., Strow, L. L., Dickerson, R. R., and Nowak, J. B.: The global tropospheric ammonia distribution as seen in the 13-year AIRS measurement record, Atmos. Chem. Phys., 16, 5467–5479, https://doi.org/10.5194/acp-16-5467-2016, 2016.
Warner, J. X., Dickerson, R. R., Wei, Z., Strow, L. L., Wang, Y., and Liang, Q.: Increased atmospheric ammonia over the world's major agricultural areas detected from space, Geophys. Res. Lett., 44, 2875–2884, https://doi.org/10.1002/2016GL072305, 2017.
Wei, J., Li, Z., Peng, Y., and Sun, L.: MODIS Collection 6.1 aerosol optical depth products over land and ocean: validation and comparison, Atmos. Environ., 201, 428–440, 2019.
Wesely, M.: Parameterization of surface resistances to gaseous dry deposition in regional-scale numerical models, Atmos. Environ., 23, 1293–1304, 1989.
Whitburn, S., Van Damme, M., Kaiser, J. W., van der Werf, G. R., Turquety, S., Hurtmans, D., Clarisse, L., Clerbaux, C., and Coheur, P. F.: Ammonia emissions in tropical biomass burning regions: Comparison between satellite-derived emissions and bottom-up fire inventories, Atmos. Environ., 121, 42–54, https://doi.org/10.1016/j.atmosenv.2015.03.015, 2015.
Whitburn, S., Van Damme, M., Clarisse, L., Bauduin, S., Heald, C. L., Hadji-Lazaro, J., Hurtmans, D., Zondlo, M. A., Clerbaux, C., and Coheur, P. F.: A flexible and robust neural network IASI-NH3 retrieval algorithm, J. Geophys. Res.-Atmos., 121, 6581–6599, https://doi.org/10.1002/2016JD024828, 2016.
Xia, Y., Zhao, Y., and Nielsen, C. P.: Benefits of China's efforts in gaseous pollutant control indicated by the bottom-up emissions and satellite observations 2000–2014, Atmos. Environ., 136, 43–53, https://doi.org/10.1016/j.atmosenv.2016.04.013, 2016.
Xu, W., Luo, X. S., Pan, Y. P., Zhang, L., Tang, A. H., Shen, J. L., Zhang, Y., Li, K. H., Wu, Q. H., Yang, D. W., Zhang, Y. Y., Xue, J., Li, W. Q., Li, Q. Q., Tang, L., Lu, S. H., Liang, T., Tong, Y. A., Liu, P., Zhang, Q., Xiong, Z. Q., Shi, X. J., Wu, L. H., Shi, W. Q., Tian, K., Zhong, X. H., Shi, K., Tang, Q. Y., Zhang, L. J., Huang, J. L., He, C. E., Kuang, F. H., Zhu, B., Liu, H., Jin, X., Xin, Y. J., Shi, X. K., Du, E. Z., Dore, A. J., Tang, S., Collett Jr., J. L., Goulding, K., Sun, Y. X., Ren, J., Zhang, F. S., and Liu, X. J.: Quantifying atmospheric nitrogen deposition through a nationwide monitoring network across China, Atmos. Chem. Phys., 15, 12345–12360, https://doi.org/10.5194/acp-15-12345-2015, 2015.
Xu, W., Song, W., Zhang, Y., Liu, X., Zhang, L., Zhao, Y., Liu, D., Tang, A., Yang, D., Wang, D., Wen, Z., Pan, Y., Fowler, D., Collett Jr., J. L., Erisman, J. W., Goulding, K., Li, Y., and Zhang, F.: Air quality improvement in a megacity: implications from 2015 Beijing Parade Blue pollution control actions, Atmos. Chem. Phys., 17, 31–46, https://doi.org/10.5194/acp-17-31-2017, 2017.
Yu, Y., Xu, M., Yao, H., Yu, D., Qiao, Y., Sui, J., Liu, X., and Cao, Q.: Char characteristics and particulate matter formation during Chinese bituminous coal combustion, P. Combust. Inst., 31, 1947–1954, https://doi.org/10.1016/j.proci.2006.07.116, 2007.
Zhang, L., Gong, S., Padro, J., and Barrie, L.: A size-segregated particle dry deposition scheme for an atmospheric aerosol module, Atmos. Environ., 35, 549–560, https://doi.org/10.1016/S1352-2310(00)00326-5, 2001.
Zhang, L., Chen, Y., Zhao, Y., Henze, D. K., Zhu, L., Song, Y., Paulot, F., Liu, X., Pan, Y., Lin, Y., and Huang, B.: Agricultural ammonia emissions in China: reconciling bottom-up and top-down estimates, Atmos. Chem. Phys., 18, 339–355, https://doi.org/10.5194/acp-18-339-2018, 2018.
Zhang, X., Wu, Y., Liu, X., Reis, S., Jin, J., Dragosits, U., Van Damme, M., Clarisse, L., Whitburn, S., Coheur, P.-F., and Gu, B.: Ammonia Emissions May Be Substantially Underestimated in China, Environ. Sci. Technol., 51, 12089–12096, https://doi.org/10.1021/acs.est.7b02171, 2017.
Zhang, Y., Mathur, R., Bash, J. O., Hogrefe, C., Xing, J., and Roselle, S. J.: Long-term trends in total inorganic nitrogen and sulfur deposition in the US from 1990 to 2010, Atmos. Chem. Phys., 18, 9091–9106, https://doi.org/10.5194/acp-18-9091-2018, 2018.
Zhu, L., Henze, D. K., Cady-Pereira, K. E., Shephard, M. W., Luo, M., Pinder, R. W., Bash, J. O., and Jeong, G. R.: Constraining U.S. ammonia emissions using TES remote sensing observations and the GEOS-Chem adjoint model, J. Geophys. Res.-Atmos., 118, 3355–3368, 2013.