the Creative Commons Attribution 4.0 License.
the Creative Commons Attribution 4.0 License.
 | 26 Sep 2019
Quantifying snow darkening and atmospheric radiative effects of black carbon and dust on the South Asian monsoon and hydrological cycle: experiments using variable-resolution CESM
Stefan Rahimi
Xiaohong Liu
Chenglai Wu
William K. Lau
Hunter Brown
Mingxuan Wu
Yun Qian
Black carbon (BC) and dust impart significant effects on the South Asian monsoon (SAM), which is responsible for ∼80 % of the region's annual precipitation. This study implements a variable-resolution (VR) version of the Community Earth System Model (CESM) to quantify two radiative effects of absorbing BC and dust on the SAM. Specifically, this study focuses on the snow darkening effect (SDE), as well as how these aerosols interact with incoming and outgoing radiation to facilitate an atmospheric response (i.e., aerosol–radiation interactions, ARIs). By running sensitivity experiments, the individual effects of SDE and ARI are quantified, and a theoretical framework is applied to assess these aerosols' impacts on the SAM. It is found that ARIs of absorbing aerosols warm the atmospheric column in a belt coincident with the May–June averaged location of the subtropical jet, bringing forth anomalous upper-tropospheric (lower-tropospheric) anticyclogenesis (cyclogenesis) and divergence (convergence). This anomalous arrangement in the mass fields brings forth enhanced rising vertical motion across South Asia and a stronger westerly low-level jet, the latter of which furnishes the Indian subcontinent with enhanced Arabian Gulf moisture. Precipitation increases of 2 mm d−1 or more (a 60 % increase in June) result across much of northern India from May through August, with larger anomalies (+5 to +10 mm d−1) in the western Indian mountains and southern Tibetan Plateau (TP) mountain ranges due to orographic and anabatic enhancement. Across the Tibetan Plateau foothills, SDE by BC aerosols drives large precipitation anomalies of > 6 mm d−1 (a 21 %–26 % increase in May and June), comparable to ARI of absorbing aerosols from April through August. Runoff changes accompany BC SDE-induced snow changes across Tibet, while runoff changes across India result predominantly from dust ARI. Finally, there are large differences in the simulated SDE between the VR and traditional 1∘ simulations, the latter of which simulates a much stronger SDE and more effectively modifies the regional circulation.
- Article
(16282 KB) - Full-text XML
-
Supplement
(11460 KB) - BibTeX
- EndNote


The South Asian monsoon (SAM) and Tibetan Plateau (TP) snow cover are critical to the security of water resources across India, Pakistan, and the Bay of Bengal region. Developing from June through early September, the thermally driven SAM provides the region with ∼80 % of its annual precipitation (Bookhagen and Burbank, 2010; Hasson et al., 2013). This precipitation, together with seasonal snowmelt from Tibet, serves to replenish major waterways across the region. Southern Asia has a very high population density and is in a state of rapid industrialization. As a result, large numbers of black carbon (BC) particles are emitted to the atmosphere. BC can modify the premonsoonal and monsoonal system by perturbing the regional radiative balance (Flanner et al., 2007; Qian et al., 2009, 2011; Lau et al., 2010). Additionally, southern Asia's proximity to major dust emission sources makes this region's climate system susceptible to dust effects (Vinoj et al., 2014; Jin et al., 2015).
Various studies have shown that absorbing BC and dust (referred to collectively as BCD) can impart significant perturbations on the Earth's radiative balance and climate globally (Koch, 2001; Flanner et al., 2007; Xu et al., 2016) and regionally (Quinn et al., 2008; Qian et al., 2009; Painter et al., 2010, 2012; Zhao et al., 2014; Jin et al., 2015; Wu et al., 2018), resulting in changes in temperature, cloud fraction, precipitation, snow cover, and runoff. BCD have been shown to have a particularly strong impact on the South Asian monsoon (Lau et al., 2010, 2017; Qian et al., 2011; Das et al., 2015) through a variety of pathways. For instance, atmospheric BCD can increase the amount of absorbed solar energy across snow-covered regions when deposited on ice, leading to increased melting rates in a process known as the snow darkening effect (SDE; Qian et al., 2015). Furthermore, atmospheric BCD aerosols absorb and scatter incoming sunlight, altering the thermodynamic structure of the atmosphere. Dust interacts with longwave radiation to alter atmospheric thermodynamics further (Seinfeld et al., 2004; Zhao et al., 2011). These aerosol–radiation interactions (ARIs) describe the explicit heating–cooling of the atmosphere by attenuating aerosols (direct effects), as well as how the atmosphere circulations may be changed to influence cloud formation (semi-direct effects).
Southern Asia is especially susceptible to SDE and ARI during the spring and summer for several reasons. First, BCD burdens increase during this time period, contributing to stronger perturbations in the region's radiative balance. Second, the solar zenith angle is reduced, and higher-intensity sunlight warms the region; the more direct sunlight amplifies the radiative perturbations brought forth by BCD. Third, the highly elevated TP remains snow-covered for large fractions of the year and lies directly north and east of BCD sources, making this region vulnerable to BCD SDE (Qian et al., 2011; Lau et al., 2017).
The warm season evolution of SAM is quite complex (Boos and Kuang, 2010; Wu et al., 2015). During the spring and summer, unabated heating of the Indian peninsula brings forth the establishment of the monsoon trough beneath attendant upper-tropospheric anticyclogenesis (the Tibet high). Additionally, a westerly low-level jet (WLLJ) forms, which is responsible for transporting copious amounts of moisture into South Asia from the Arabian Sea. The heating is due to the presence of the zonally oriented mountain ranges of the southern TP, which effectively block cold air intrusions into the Indian subcontinent associated with midlatitude cyclones (Boos and Kuang, 2010). The rising branch of the monsoonal circulation that develops is moisture laden, contributing to deep convection from June through September. This rainfall, combined with seasonal snowmelt across the TP, replenishes main waterways across southern, central, and eastern Asia, providing water resources for billions.
BCD have been shown to warm the TP via SDE and ARI, with maximum warming and snowmelt during the late spring (Lau et al., 2006, 2010, 2017; Qian et al., 2011; Vinoj et al., 2014). Eastward dust transport from the Middle East in addition to BC transport from India warm the atmospheric column across south central Asia leading to low-level relative vorticity spin-up. The alignment of this low-level feature beneath the Tibet high brings forth an intensification of the WLLJ, and more moisture is transported from the Arabian Sea into southern Asia. The increased moisture amounts collocate with the rising branch of the SAM, and precipitation amounts are increased while surface temperatures cool (Vinoj et al., 2014; Jin et al., 2015). Furthermore, the warming associated with enhanced snow melting across Tibet enhances this circulation change by increasing the rate of column warming.
While many studies have attempted to model the BCD-induced perturbations on premonsoonal (May and June) and monsoonal (June through August) climate and hydrology, several opportunities for scientific understanding and advancement still exist as far as quantifying their regional climate impacts. Firstly, many SAM aerosol studies have utilized horizontal grid spacings (Δx) in excess of 100 km (e.g., Lau et al., 2010; Qian et al., 2011; Xu et at., 2016). While these grid spacings are generally adequate for resolving large-scale meteorological signatures, simulations with such coarse grid spacing may entirely fail to capture mesoscale precipitation systems whose latent energy helps to regulate the SAM. For studies that have utilized smaller grid spacings (e.g., Das et al., 2015; Jin et al., 2015; Lau et al., 2017), limited area models were used for computational practicality. However, these models require prescribed boundary conditions for the meteorological, chemical, and aerosol fields. Uncertainties associated with these fields, in addition to inconsistencies between reanalysis and simulation physics, can lead to uncertainties in quantifying SDE and ARI effects on the SAM. In addition, limited area models by their very nature prevent two-way interactions between the small-scale features of the inner domain and the large-scale features of the reanalysis grid.
In this study, we employ a variable-resolution (VR) version of the Community Earth System Model (CESM) to quantify the effects of BC- and dust-induced SDE and ARI on SAM dynamics. This relatively new modeling approach allows for a model grid spacing of 0.125∘ (∼14 km) across the TP, which transitions to a 1∘ mesh outside of South Asia. A suite of sensitivity experiments is conducted to quantify BCD-induced SDE and ARI changes in premonsoonal and monsoonal climate and hydrology. By implementing this VR version of CESM in this way, we are able to (i) bypass the need for boundary conditions, homogenizing the physics and chemistry parameterizations across the entire model domain; (ii) decrease the model grid spacing over the most complicated terrain of southern and central Asia, which has been identified as being critical to SAM dynamics and evolution; and (iii) estimate the relative importance of the SDE compared to ARI in affecting the premonsoonal and monsoonal environment for BC and dust separately.
We venture through this exploration in the following manner. Section 2 provides a methodology for our experimental design. This is followed by an aerosol validation in Sect. 3, in which we compare simulated to observed aerosol optical depth (AOD), as well as simulated in-snow and in-atmosphere BC concentrations to observations. Simulated meteorological and hydrological perturbations due to various effects by BC and dust are presented in Sect. 4. A theoretical framework is presented in Sect. 5 to unify the simulated changes in meteorology, thermodynamics, and hydrology. Concluding remarks and future work are discussed in Sect. 6.
2.1 Model configuration
The VR grid, which refines to 0.125∘ horizontal grid spacing (∼14 km) across south-central Asia, transitions to 0.25∘, followed by 0.5∘ and eventually 1∘ (Fig. 1a). The region of the analysis grid that is characterized by horizontal grid spacings less than 1∘ is located approximately between 60 and 120∘ E and 5 and 55∘ N. This encompasses all of India, the Bay of Bengal, and the Arabian Sea. Most of India and the Bay of Bengal are characterized by grid resolutions greater than 0.125∘. As in Zarzycki et al. (2013), the spectral element dynamic core is used in the Community Atmosphere Model, the atmospheric component of CESM, to solve the primitive hydrostatic equations on a fully unstructured quadrilateral mesh (Dennis et al., 2011). In addition to atmospheric fields, land surface fields are also treated on the same VR grid.

Figure 1The variable-resolution (VR) grid points are shown in (a), and locations for point-source surface-based aerosol measurements are shown in (b). The analysis subregions are shown in panel (c).
VR and uniform (UN) 1∘ resolution experiments are run to explore the sensitivity of BCD effects to model grid spacing. The number of horizontal computational grid cells increases from 48 602 in the UN experiment to 114 860 in the VR experiment. CESM experiments are conducted on 30 vertical levels; however the physics time step in VR simulations is 2 times smaller than that used in UN experiments (15 min compared to 30 min) to avoid numerical instability. Additionally, the dynamics time step is 9 s in VR experiments and 90 s in UN experiments. The grid setup between the VR and UN experiments is identical to that used in Rahimi et al. (2019).
2.2 Model physics
Both VR and UN simulations are conducted using identical physics. CESM version 1.2 is used with CAM version 5.3 (Neale et al., 2010) and is coupled with the Community Land Model, version 4.0 (CLM4). CLM4 default dust erodibility data, defined on a mesh, is used. Coupled into CLM4 is the SNow ICe and Aerosol Radiative (SNICAR) model, which prognostically treats albedo reductions associated with snow aging and snow grain size changes, as well as BC and dust deposition on snowpack absorption (Flanner et al., 2007). Parameterized cloud microphysics from Morrison and Gettelman (2008), shallow convection from Park and Bretherton (2009), and deep convection from Zhang and McFarlane (1995) and Richter and Rasch (2008) are used. Radiation is treated using the rapid radiative transfer model from Iacono et al. (2008), and aerosol impacts are simulated using the three-mode version of the Modal Aerosol Module (MAM3), described in Liu et al. (2012). A wavelength-independent refractive index of 1.95–0.79i is used for BC in shortwave bands. The dust refractive index used in this study varies in 16 simulated longwave bands (not listed here), but its shortwave refractive index varies between {(1.51 to 1.8) and (0.01 to 0.1)i}. The real component of dust refractive index varies only slightly in near-IR wavelengths (∼1.53), while its imaginary component varies between −0.004i and −0.03i.
2.3 Model experiments
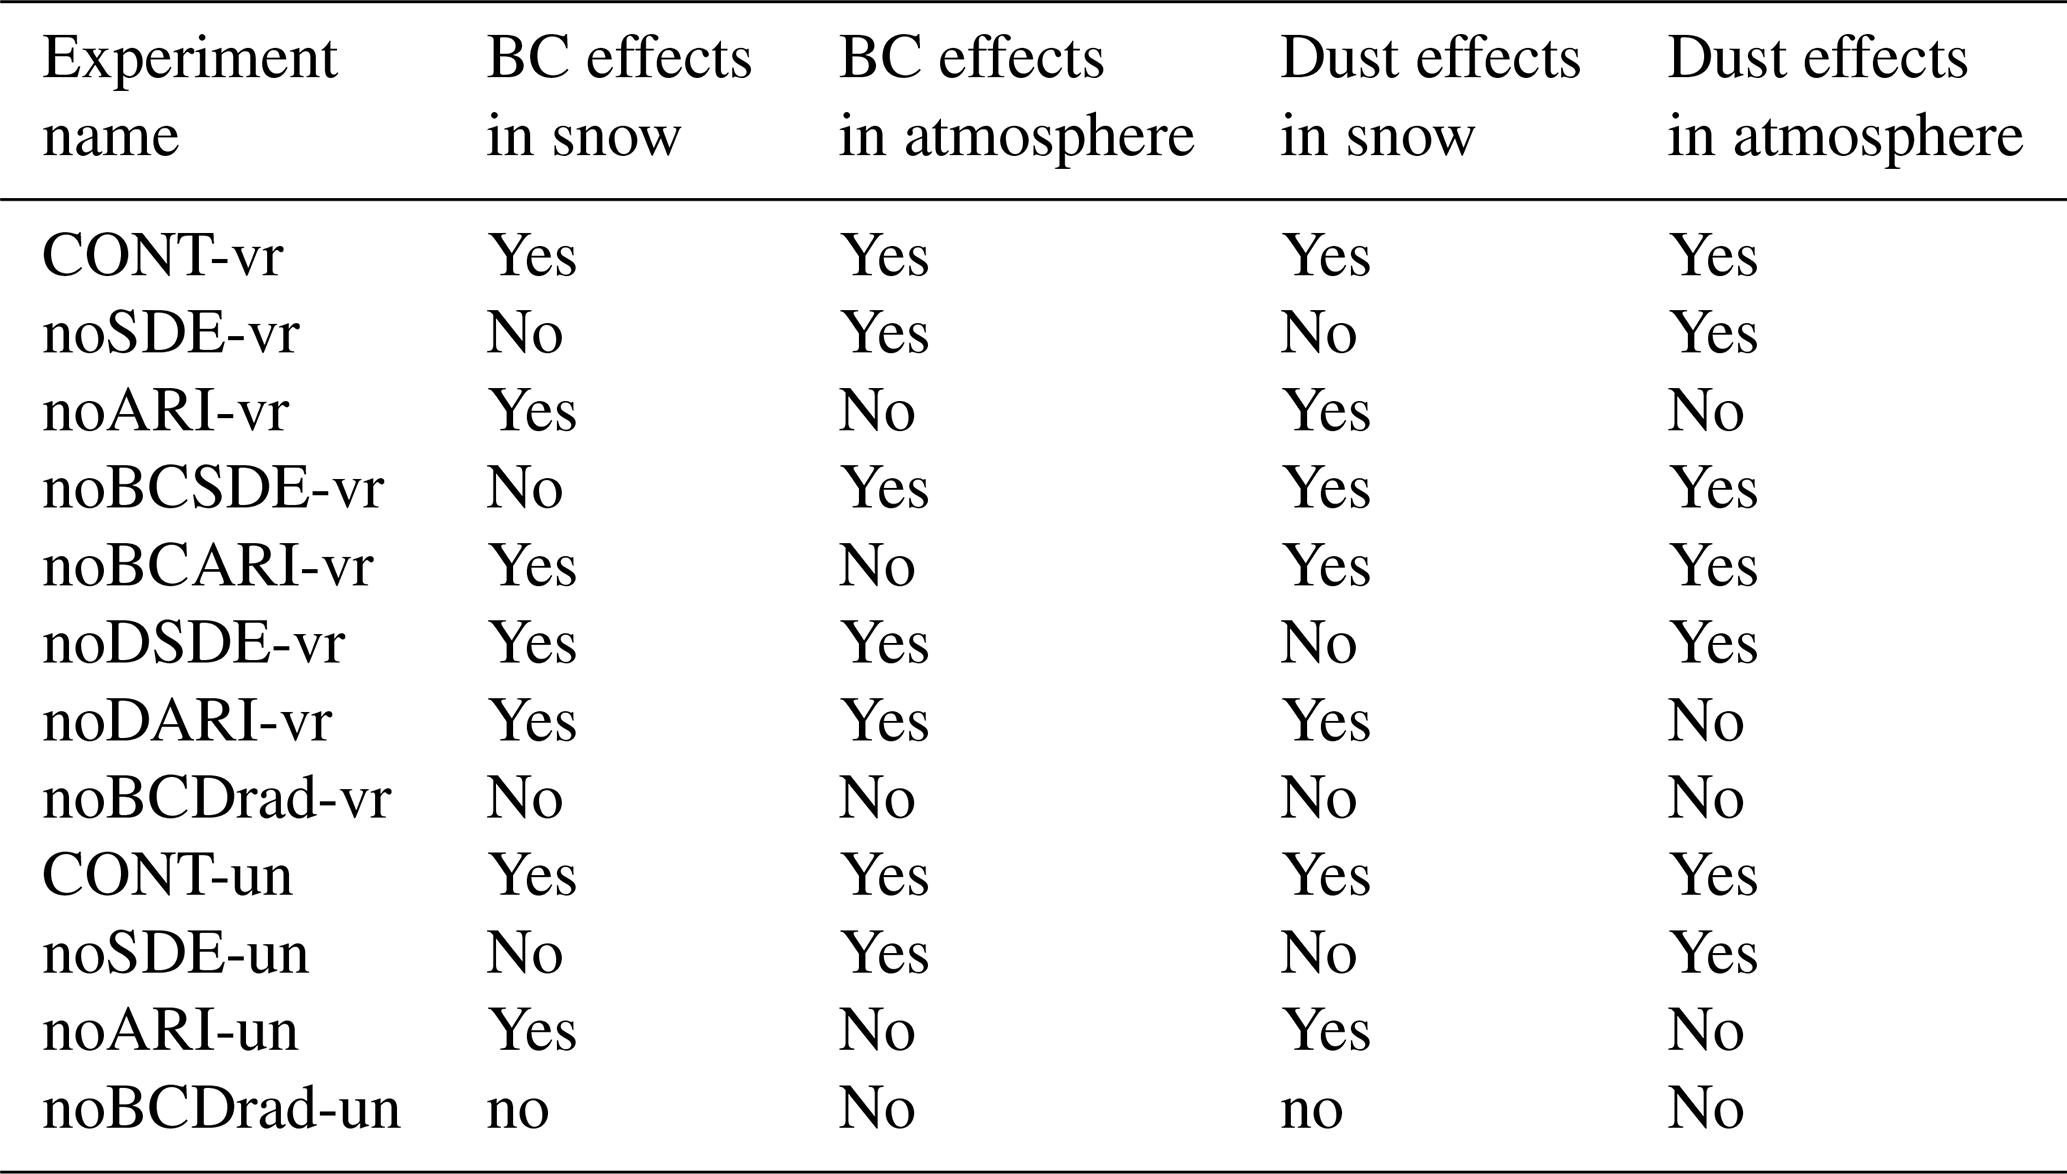
Eight VR and four UN experiments are run to estimate the impacts of BCD-induced SDE and ARI on premonsoonal and monsoon climate fields (Table 1). Aside from the control experiments, defined to be CONT-vr and CONT-un for the VR and UN control experiments, respectively, seven VR and three UN perturbation experiments are run to quantify various BCD effects.
Table 1List of VR simulations and the BCD effects they include.
Each individual experiment is run for 11 years, and the first year in each simulation is neglected in the analysis to allow for spin-up. The simulations are run with prescribed climatological sea surface temperature and sea ice cover averaged from 1982 to 2001 (Hurrell et al., 2008). The greenhouse gas concentrations and anthropogenic aerosol and precursor gas emissions are prescribed at the level for the year 2000 from the Intergovernmental Panel on Climate Change's Fifth Assessment Report. After comparing the simulations to both gridded and point source reference data (locations shown in Fig. 1b), the means of various climate variables from the last 10 years of simulations are computed to evaluate the impacts of BCD-induced SDE and ARI across southern Asia. Furthermore, all simulated data (both VR and UN) across the region are interpolated to an identical 0.125∘ rectilinear grid for direct comparison.
For the VR perturbation experiments, one is run with BCD SDE turned off (noSDE-vr). This is achieved by setting the on-snow BCD deposition fluxes to zero in CLM4. Second, an experiment is run in which BCD ARI is turned off (noARI-vr). This is achieved by excluding the BCD volume from the calculation of bulk aerosol extinction, asymmetry parameter, and single-scatter albedo in CAM. Third, an experiment is run in which both BCD SDE and ARI are removed (noBCDrad-vr). The fourth and fifth perturbation experiments are run, identical to noSDE-vr and noARI-vr, but only the BC-induced SDE and ARI are removed, respectively (noBCSDE-vr and noBCARI-vr, respectively). The sixth and seventh VR perturbation experiments are identical to noBCSDE-vr and noBCARI-vr, except dust SDE and ARI are removed, respectively (noDSDE-vr and noDARI-vr, respectively). Three UN perturbation experiments are also run to assess BCD effects on a 1∘ mesh: noSDE-un, noARI-un, and noBCDrad-un.
The BCD effects on meteorological and hydrological fields can be found by subtracting the perturbation experiments from the control simulation (CONT-vr). For some variable x, the effect induced by a specific species (BC or dust) at a grid cell can be computed.
Change in x induced by SDE is
Change in x induced by ARI is
Change in x induced by SDE + ARI is
Change in x induced by BC SDE is
Change in x induced by BC ARI is
Change in x induced by dust SDE is
Change in x induced by dust ARI is
The anomalies computed in Eqs. (4) through (7) for variable x are linear, but may add together such that their combined effect is nonlinear. In other words, there are nonlinear interactions between BC and dust SDE and ARI that may be important when considering the perturbations to SAM climate. We emphasize the VR results, but we do briefly discuss their differences with UN results in Sect. 5.
For our analysis, we break up southern Asia into five distinctive subregions (Fig. 1c). We consider most of India separately from the Indo-Gangetic Plain (IGP) to gain a sense of the impacts exerted on the SAM by the TP regional aerosol effects. Across India and the IGP, we only consider land grid cells with elevations lower than 1200 and 600 m, respectively. We also divide the TP into the western TP (WTP) and eastern TP (ETP) since other studies (Lau et al., 2010; Qian et al., 2011) have found there to be noticeable differences in simulated aerosol effects between these two regions. For the TP analyses areas, we only consider grid cells with elevations greater than 3700 m. A fifth region, the TP foothills (TPF), is also considered to explore how BCD effects may impact orographic precipitation. For the TPF subregion, we only consider grid cells with elevations between 400 and 3700 m.
A validation of the simulated meteorology was performed in Rahimi et al. (2019), in which CONT-vr and CONT-un were compared to surface- and satellite-based datasets. They found that there were marked improvements in the simulated temperature, precipitation, and snow coverage across the TP and its southern mountain ranges when using a VR grid. This is important when simulating the SDE, which is fundamentally dependent on the spatial distribution of snow coverage. In this study, we further evaluate CESM's performance in simulating aerosols, as the SDE and ARI are fundamentally dependent on the spatial variability and magnitude of aerosol loading.
3.1 Observational data
To accurately capture the impacts of SDE and ARI on South Asian climate, it is important for the simulations to adequately represent atmospheric aerosol characteristics, e.g., aerosol optical depth (AOD). We make use of satellite and ground-based AOD measurements, as well as point source BC measurements to evaluate the model performance. While in-atmosphere and in-snow BC measurements are available for model performance evaluation, in-snow and in-atmosphere dust measurements are lacking due to uncertainties in how dust is classified and the lack of data across southern Asia. These data and their respective uncertainties will now be presented.
Control simulations are compared to 1∘ and 0.5∘ Level-3 550 and 555 nm AOD data from the Moderate Resolution Imaging Spectroradiometer (MODIS; Platnick et al., 2015) and the Multi-angle Imaging SpectroRadiometer (MISR, MISR Science Team, 2015), respectively. MODIS data are averaged monthly from 2001 to 2014, while MISR data are similarly averaged from 2002 to 2014. Weaknesses in MODIS and MISR retrievals are associated with algorithm inadequacies, as well as retrieval difficulties over bright or cloud-filled pixels. More information on MODIS and MISR can be found in Sect. S1.1 and S1.2 of the Supplement, respectively.
AOD spectral radiometer measurements from 57 AErosol RObotic NETwork (AERONET) sites across central and southern Asia are used to evaluate simulated total, coarse-mode, and fine-mode AOD at 500 nm (Holben et al., 1998). Model results are linearly interpolated to AERONET site locations and averaged spatially (see Fig. 1b) between 60 and 110∘ E and between 5 and 40∘ N. AERONET data for South Asian sites were only available from 1998 onwards, and only data before 2016 are used. The simulated fine-mode AOD is the summation of the accumulation- and Aitken-mode AOD variables in CESM. AERONET site locations are denoted by the blue stars in Fig. 1b.
AOD information is available via the Max Planck Institute's Aerosol Climatology, version 2 (MACv2), providing present-day (year 2005) climatological estimates of monthly mean AOD at 550 nm on a 1∘ rectilinear grid (Stevens et al., 2017). Surface observations from AERONET are used in conjunction with anthropogenic and fire emission plume strengths from CMIP5 simulations to estimate preindustrial AOD based on present-day AOD. More information on the MACv2 product can be found in Sect. S1.3.
We compare our results against AOD data from the Modern-Era Retrospective analysis for Research and Applications version 2 (MERRA-2; see https://esgf.nccs.nasa.gov/projects/create-ip/, last access: 1 June 2018). Monthly 550 nm MERRA-2 data are available on a 0.5∘ by 0.625∘ grid and analysis is performed using data from 1980 to 2017. More information on the MERRA-2 product can be found in Sect. S1.4.
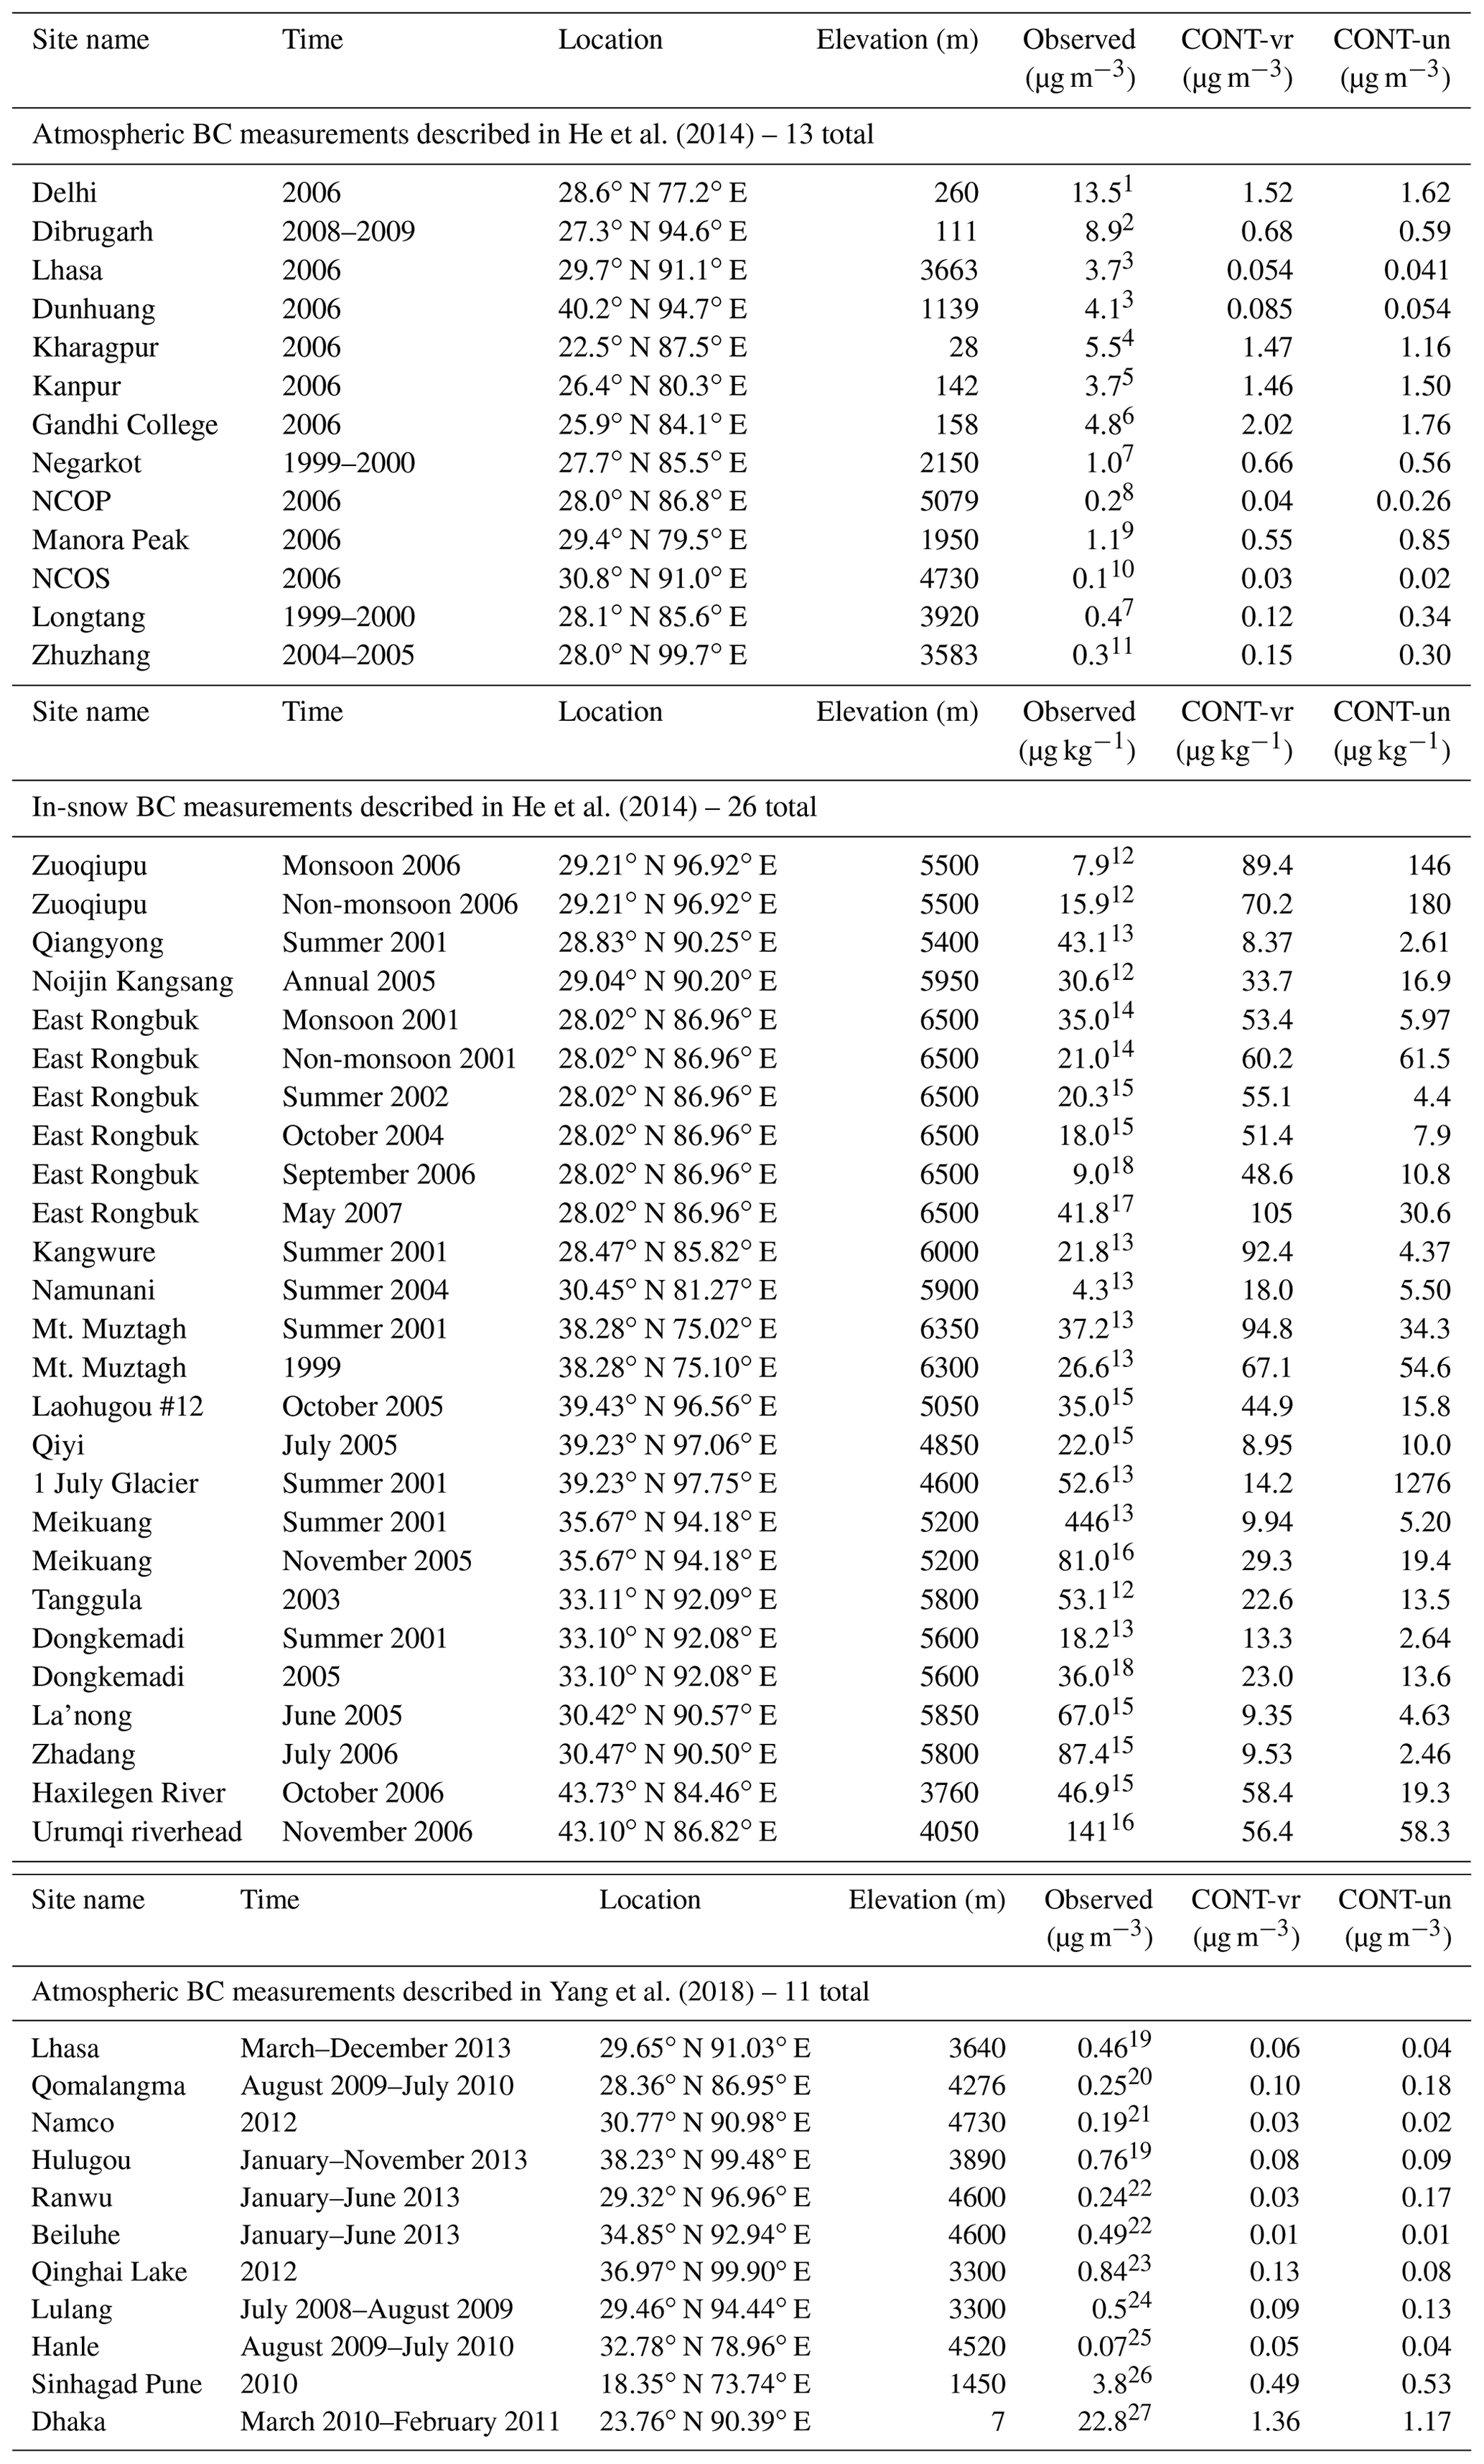
Finally, simulations are compared to point atmospheric BC measurements from 13 sites discussed in He et al. (2014) and 11 sites discussed in Yang et al. (2018). The site locations are shown in Fig. 1b (hollow black circles). Additionally, 26 measurements of in-snow BC, as discussed in He et al. (2014) are used to evaluate our simulations. Locations of in-snow BC measurements are also given in Fig. 1b (red triangles). Site metadata for in-snow and in-atmosphere BC measurements, as well as simulated and observed BC concentrations are given in Table 2.
Table 2Listing of metadata for the point source BC measurements used in this study. CONT-vr and CONT-un results are also shown. The superscript attached to the observed value denotes the following citations. 1 Beegum et al. (2009). 2 Pathak et al. (2010). 3 Zhang et al. (2008). 4 Nair et al. (2012). 5 Ram et al. (2010b). 6 Ganguly et al. (2009b). 7 Carrico et al. (2003). 8 Bonasoni et al. (2010). 9 Ram et al. (2010a). 10 Ming et al. (2010). 11 Qu et al. (2008). 12 Xu et al. (2009). 13 Xu et al. (2006). 14 Ming et al. (2008). 15 Ming et al. (2009a). 16 Ming et al. (2009b). 17 Ming et al. (2012). 18 Ming et al. (2013). 19 Li et al. (2016). 20 Cong et al. (2015). 21 Wan et al. (2015). 22 Wang et al. (2016). 23 Zhao et al. (2015). 24 Zhao et al. (2017). 25 Babu et al. (2011). 26 Safai et al. (2013). 27 Begum et al. (2012).
3.2 AOD comparisons
Focusing on annual AOD averaged between 0 and 60∘ N and 60 and 140∘ E, in which several major BCD emissions sources lie, CONT-vr and CONT-un simulate AOD values of 0.147 and 0.143, respectively. On the other hand, MODIS, MISR, MACv2, and MERRA-2 depict regionally higher annual AOD values of 0.285, 0.202, 0.235, and 0.216, respectively. While both CESM simulations reasonably capture the global annually averaged AOD compared to satellite observations (see Sect. S1.5), they do not capture the generally larger annual AOD values across south-central Asia. Because the buildup of aerosols across southern Asia has been identified to affect the premonsoonal and monsoonal properties (Lau et al., 2011, 2017), the CESM simulations' underprediction of annual AOD by almost a factor of 2 across South Asia must be kept in mind.
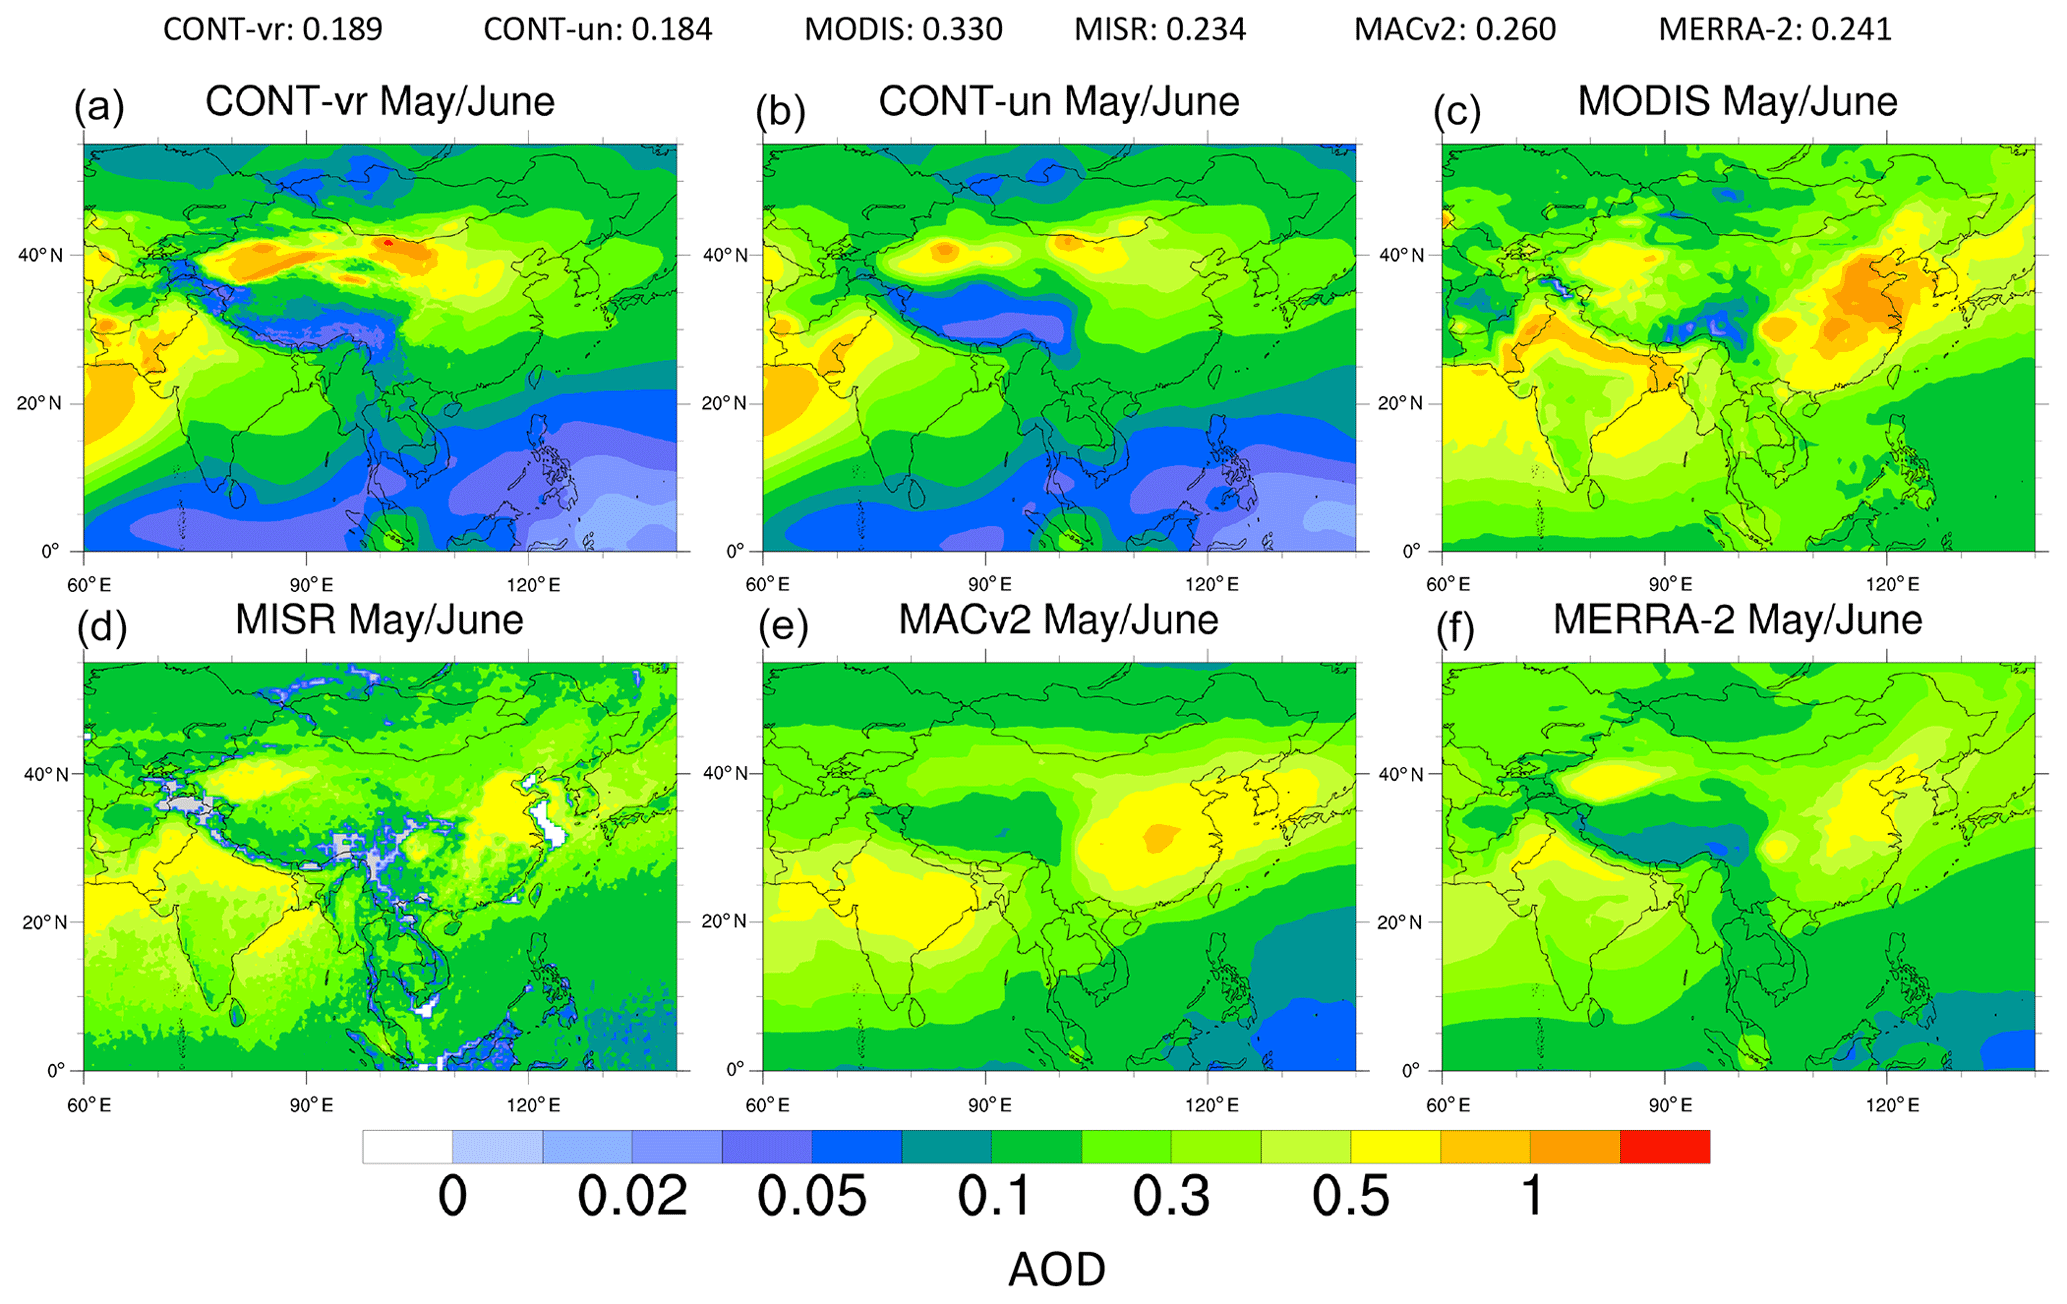
Figure 2Panels (a), (b), (c), (d), (e), and (f) depict May–June-averaged AOD values across South Asia for CONT-vr, CONT-un, MODIS, MISR, MACv2, and MERRA-2, respectively. AOD averages from these respective data between 0 and 60∘ N and 60 and 140∘ E are given at the top.
Figures 2 and S1 show the spatial distribution of Asian May and June (MJ) averaged and annually averaged AOD, respectively, from simulations, satellite measurements, and aerosol reanalysis. Data reveal higher MJ AOD values across southern Asia, the Tarim Basin eastward into northern China, and eastern China. The lowest AOD values are located across the TP, Russia, and northwestern Micronesia. CONT-vr and CONT-un overpredict AOD values over Asian dust sources (the Taklamakan and Gobi deserts) and the northern Arabian Sea, and simulations underpredict AOD values across India, eastern China, and oceanic regions compared to MISR, MODIS, MACv2, and MERRA-2 data.
Across deserts, the overestimation of AOD may be due to the fact that CLM4 uses a default erodibility dataset originally designed for use at a grid. The fact that many areas of our domain are refined to 0.125∘ grid spacing may lead to an overestimation of dust emissions across the region, correctable by tuning the dust emission factor. Over heavily polluted regions (e.g., east China), CONT-un and CONT-vr underprediction of AOD compared to observations may be due to the underestimation of anthropogenic aerosol emissions and the missing treatment of secondary aerosol production in the models (Fan et al., 2018). Across oceanic regions, the undersimulated AOD by models is most likely the result of inadequate sea salt emissions, which are not a focus of this study.
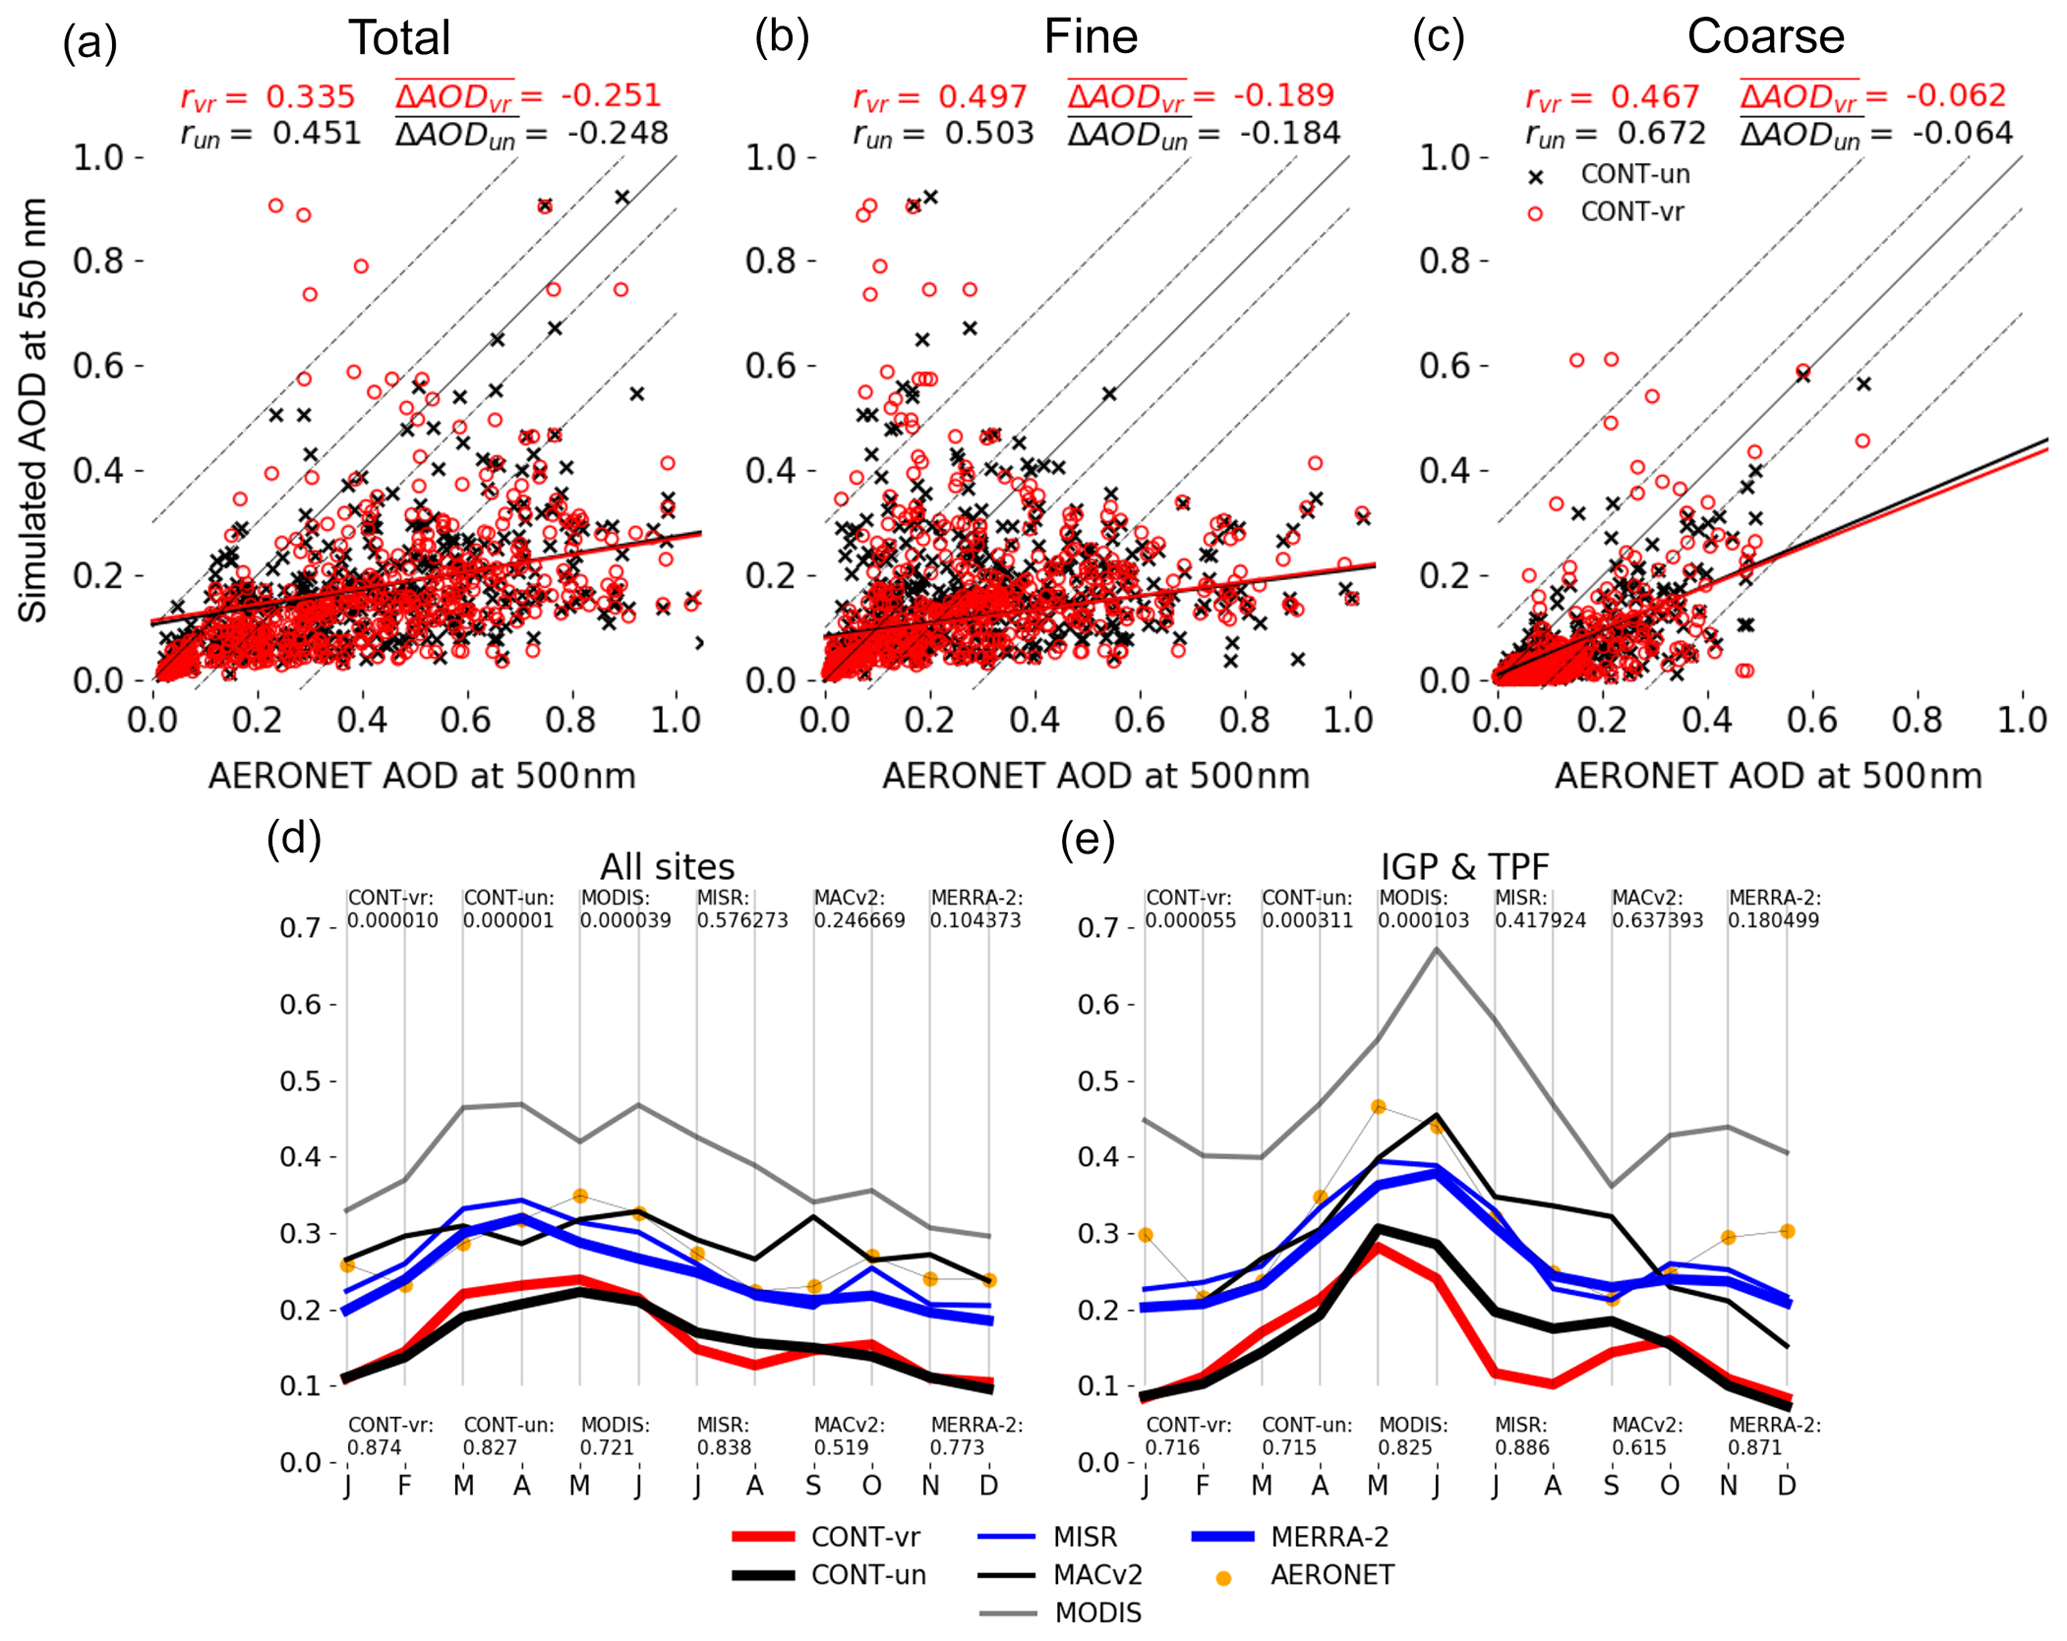
Figure 3Measurements from AERONET compared to CESM simulations for (a) total, (b) fine-mode, and (c) coarse-mode annually averaged AOD. Pearson correlation (r) values between simulations and observations are given, as are mean AOD differences (). The p values are not given for panels (a) through (c), as they are very close to zero. A best-fit line for the scatter data between CONT-vr (CONT-un) is plotted in red (black). The thin black line is the 1-to-1 curve. Panels (d) and (e) show the mean monthly variability of AOD averaged at all 57 AERONET sites and only for sites between 25 and 30∘ N and 70 and 90∘ E, respectively. r values (p values) between various simulations/observations and AERONET are also given in panels (d) and (e) at the bottom (top) of each panel.
Figure 3a–c show simulated versus observed annually averaged AOD from 57 AERONET sites (shown in Fig. 1b). CESM experiments underpredict AOD compared to AERONET measurements. Fine-mode aerosols contribute to most of the AOD underprediction. CONT-vr simulates a fine-mode and coarse-mode mean AOD bias ( of −0.189 and −0.062, respectively, while CONT-un simulates similar biases. Furthermore, CONT-vr slope values for the total, fine-mode, and coarse-mode best-fit lines of 0.157, 0.135, and 0.402, respectively, are simulated.
AOD underprediction by CONT-vr and CONT-un is also evident in a time series depicting the monthly variability of AOD averaged over the AERONET sites (Fig. 3d). Simulations and observations generally show a similar pattern, with larger values in the spring. CESM simulations underpredict AERONET AOD by a factor of ∼1.5. MISR, MACv2, and MERRA-2 appear to best agree with AERONET observations, while MODIS generally shows monthly AOD values that are 10 %–30 % higher than AERONET observations. Additionally, CONT-vr, CONT-un, MERRA-2, and MISR correlate better with AERONET than MODIS and MACv2, with CONT-vr having the highest r value of 0.874.
Figure 3e shows a time series of annually averaged monthly AOD interpolated to 18 AERONET sites across the IGP and TPF between 25 and 30∘ N and 70 and 90∘ E. Similar to the 57-site average, both CESM simulations underpredict monthly AOD by a factor of 1.5 to 2 across the IGP and TPF. However, in contrast to the 57-site average, the 18-site r values of the CESM simulations with AERONET are notably lower (see Sect. S1.5).
The CESM-simulated wet bias described in Rahimi et al. (2019) could have the effect of overpredicting wet scavenging of aerosols. This idea is reinforced when looking at point BC measurements across India, where simulated BC wet deposition dominates over dry deposition (Fig. S2), and simulated atmospheric BC concentrations are much lower than observations (Fig. 4a); simulations may be washing out too many aerosols. In addition, incorrect emissions may further contribute to the simulated bias in aerosol amounts (Zhao et al., 2011; Fan et al., 2018). Non-simultaneity between simulations and observation data may also play a role in skewing the interpretation of simulated aerosol features. Both anthropogenic emissions in Asia and dust emission in the Middle East have experienced significant decadal increasing trends during the first decade of the 21st century (e.g., Hsu et al., 2012; Jin et al., 2018). These trends may partially explain why the CESM experiments conducted with the year 2000 emissions underpredict AOD compared to observations. It is important to keep in mind these considerations when interpreting the relatively poor model performance in simulating AOD.
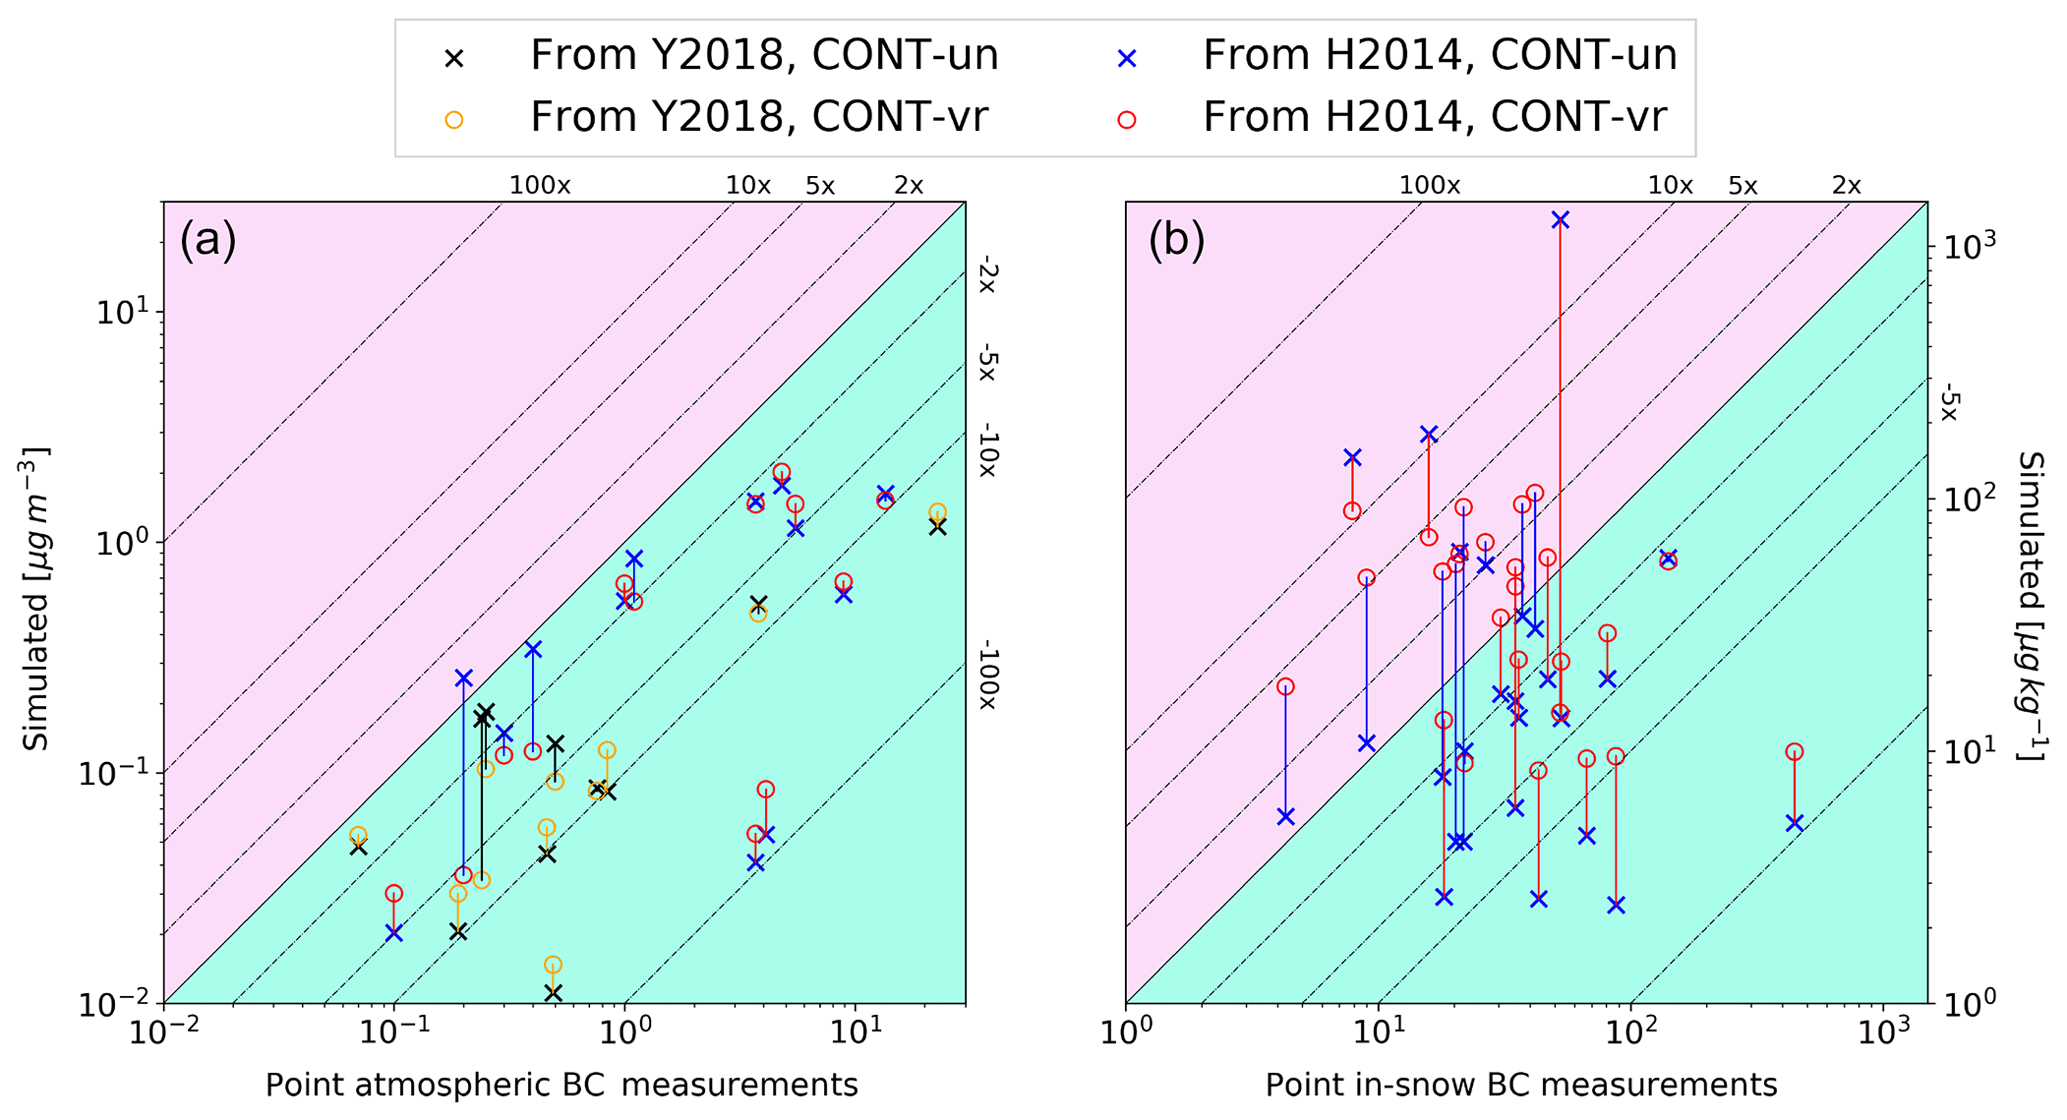
Figure 4Observed versus simulated (a) atmospheric and (b) in-snow BC. Observations are summarized in He et al. (2014; H2014) and Yang et al. (2018; Y2018). Pink (sea foam) denote areas where simulations overpredict (underpredict) BC. The vertical lines connect identical observation points from CONT-vr and CONT-un, while the color of each line indicates which experiment is closer to observed BC measurements. The thin solid black diagonal represents the 1-to-1 curve, while the thin dashed diagonals represent factors of underprediction or overprediction by CESM experiments.
3.3 Surface BC comparisons
Figure 4a depicts an almost unanimous underprediction of atmospheric BC concentrations across the 24 measurement sites by the CESM experiments, with average aerosol biases of −2.77 and −2.76 µg m−3 for CONT-vr and CONT-un, respectively. The largest underpredictions occur over urban sites such as Delhi (observed 13.5 µg m−3), Dibrugarh (observed 8.9 µg m−3), and Lhasa (observed 3.7 µg m−3; see Table 2). Averages of observations depict a mean concentration across all sites of 3.24 µg m−3, while CONT-vr and CONT-un underpredict this value by a factor of 6.9 and 6.8, respectively. Additionally, several sites see a simulated underprediction of BC concentrations by more than a factor of 10.
The widespread underprediction of atmospheric BC does not necessarily translate to an underprediction of in-snow BC mixing ratio as seen in Fig. 4b. CONT-vr and CONT-un simulate a bias of −10.4 and +22.7 µg kg−1, respectively, when comparing to the station-averaged BC mixing ratio of 54.6 µg kg−1. This indicates that CONT-vr is more comparable to observations magnitude-wise. It is also noteworthy that several sites showcase a CONT-vr-simulated in-snow BC mixing ratio that is an order of magnitude different from that simulated in CONT-un. These large differences in simulated in-snow BC between the VR and UN experiments can be attributed to large meteorological and terrain differences between the two experiments, especially for He et al. (2014) sites across the Himalayas. For instance, Fig. S2 shows that at East Rongbuk (28.02∘ N, 86.96∘ E), CONT-vr simulates the terrain height to be more than 2.5 km higher than CONT-un, culminating in lower monthly temperatures and snow water equivalent (SWE) increases of more than 300 mm compared to CONT-un. Despite the increased SWE at Rongbuk, CONT-vr simulates tens of millimeters less precipitation than CONT-un owing to the smaller south-to-north upslope zone simulated in the VR experiment (Rahimi et al., 2019). The smaller VR-simulated precipitation correlates with 100–300 µg m−2 d−1 less wet-scavenged BC compared to the CONT-un experiment. The decreased wet deposition coupled with the larger SWE amounts in CONT-vr thus favor lower in-snow BC mixing ratios than CONT-un.
Similar to what was noted in Sect. 3.2, the temporal inconsistency between point source BC measurements and the CESM experiments must be kept in mind. BC measurements were conducted between 1999 and 2013, while simulations are run with year 2000 anthropogenic emissions. Our results could therefore be biased depending on the trends in BC emissions after the year 2000.
Evaluation of the aerosol SDE and ARI is performed by examining the differences of the VR perturbations from the VR control experiment as discussed in Sect. 2.3. The radiative effect, as well as changes in 2 m temperature, snow water equivalent (SWE), cloud coverage, specific humidity, precipitation, and runoff are discussed in this section to motivate the application of a simple theoretical dynamical framework that describes the impacts of BCD on premonsoonal and monsoonal climate. Only results of the VR simulations are discussed in this section, and a brief comparison of VR and UN results is given in Sect. 5.
4.1 Radiative effect
All-sky direct radiative effect (DRE) and in-snow radiative effect (ISRE) diagnostics are computed online in CONT-vr. The all-sky DRE is computed by subtracting a diagnostically computed top-of-atmosphere (TOA) energy balance without aerosols from that computed with aerosols present following Ghan et al. (2012). ISRE is computed in the SNICAR code via a similar method.
While both aerosols contribute to positive ISRE for all months across the TP region, their DREs are more complicated. BCD combines to incite a generally positive DRE across South Asia during MJ and JA, and the pattern of the DRE is similar during these time periods, respectively. The spatial distribution of BCD DRE during MJ is shown in Fig. 5, while that for JA is shown in Fig. S3. Positive dust-induced DRE values of +4 to +9 W m−2 are simulated across the Tarim Basin and the Gobi desert.
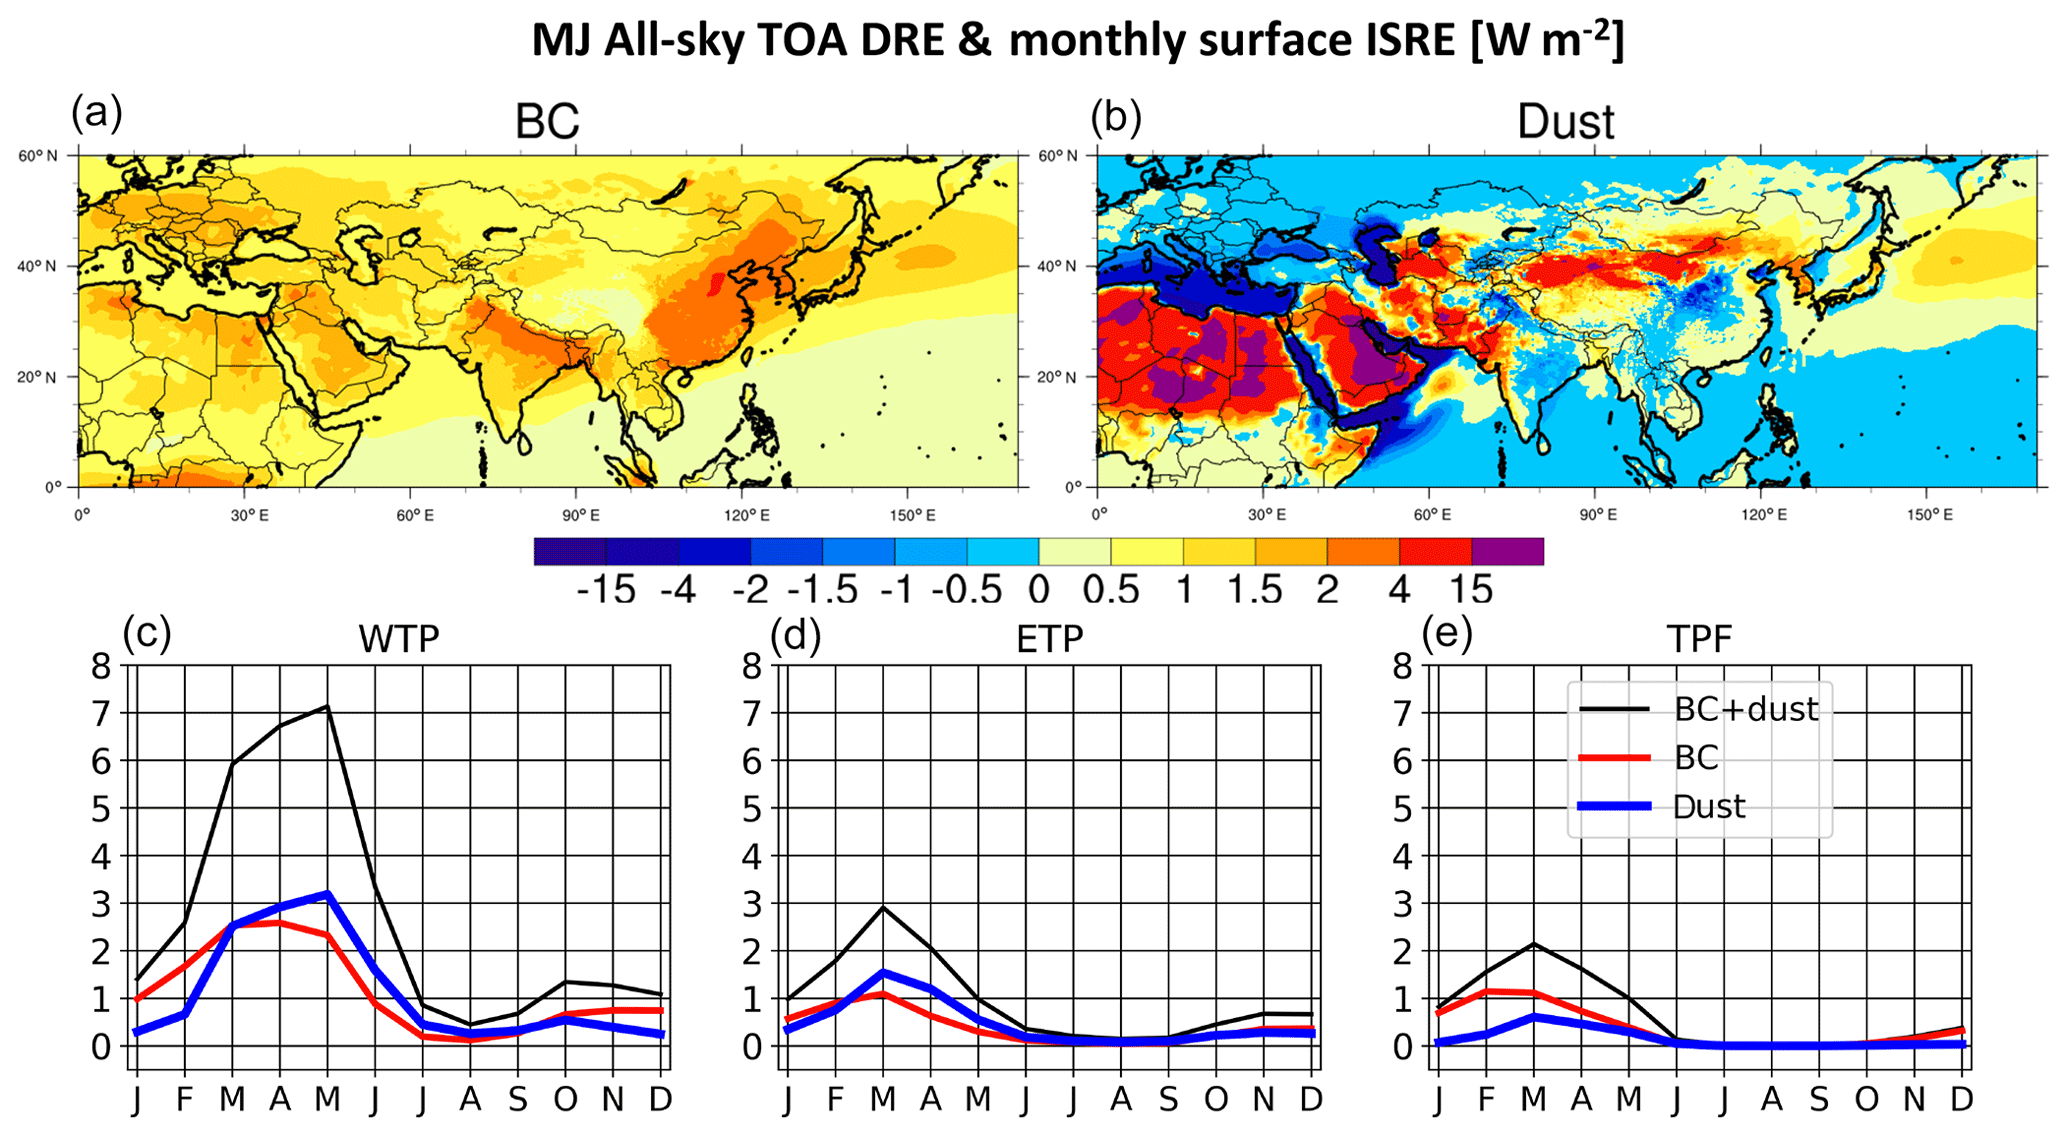
Figure 5Diagnostically computed direct radiative effect (DRE) (W m−2) at the top of the atmosphere (TOA) for (a) BC and (b) dust during MJ. Panels (c), (d), and (e) show the in-snow radiative effect (ISRE) at the surface for BCD across the WTP, ETP, and TPF, respectively (W m−2).
BC is simulated to exert unanimously positive DREs across southern and central Asia during MJ and JA. BC induces a DRE of between +1 and +4 W m−2 across India during MJ (Fig. 5a), with the magnitude weakening by JA (Fig. S3a). The highest BC DRE values of nearly +2 W m−2 are found across the IGP in northern India, while DRE values of +0.5 W m−2 or less are found across the TP during MJ into JA.
Dust is simulated to exert both positive and negative DREs across southern and central Asia during MJ and JA (Fig. 5b). Dust effectuates a DRE of nearly +10 W m−2 (+2 W m−2) during MJ south of the Gobi desert across the Ghar desert (north of the TP across the Tarim Basin). Dust-induced DRE values of between +1.5 and +4 W m−2 are also simulated across the central and northern Ghat Mountains of India during MJ. Meanwhile, dust induces a DRE of around +1 and −1 W m−2 across the TP and east-central India, respectively, during MJ. Areas with negative dust DRE values are typically characterized by low surface albedo; dust brightens the planetary albedo and thus cools the TOA. During JA, dust incites a DRE that is small (less than +1 W m−2) across east-central India (Fig. S3b). Also during JA, dust-induced DRE values in excess of +4 W m−2 are simulated across the northern Arabian Sea as dust is transported eastwards from Saudi Arabia by lower-tropospheric westerlies.
Despite the most prominent SWE reductions occurring due to BC SDE (discussed later), diagnostically computed ISRE values across the WTP indicate that BC and dust contribute to similar regionally averaged seasonal values of between +1 and +3 W m−2 from March through June (Fig. 5c–e), Together, BC and dust contribute to an annual maximum ISRE of +7 W m−2 across the WTP in May (Fig. 5c), while this maximum occurs in March across the ETP (Fig. 5d; +2.8 W m−2) and TPF (Fig. 5e; +2.2 W m−2). The ISRE maxima occur in boreal spring for all three TP regions as the solar elevation angle and South Asia BC and dust burdens increase during this time.
The largest ISRE values occur in MJ compared to JA, with the mountains on the southern and western TP periphery being characterized by ISRE values greater than +10 W m−2, locally (see Fig. S4). This heterogeneity in the ISRE spatial pattern mimics the heterogeneity in the SWE and 2 m temperature anomaly patterns across the TP (shown later), especially for the BCD SDE anomaly patterns. These features, obviously attributable to the VR mesh, are not captured in the UN experiments.

Figure 6May–June mean 2 m temperature (T2) anomalies (∘C) due to (a) BCD-induced SDE + ARI, (b) BCD-induced SDE, (c) BCD-induced ARI (d) BC-induced SDE, (e) BC-induced ARI, (f) dust-induced SDE, and (g) dust-induced ARI. Hatching marks denote areas with t values of 0.9 and greater, which have been interpolated to a 1∘ mesh for presentation. It is noted that, inside the 1∘ zone, there might be as many as 64 grid points that are characterized by statistically significant values.
4.2 The 2 m temperature
Together, BCD contribute to statistically significant (SS; t values in excess of 0.9) ARI- and SDE-induced 2 m temperature (T2) changes during MJ and July and August (JA) across Tibet and South Asia. Warming in excess of 3 ∘C across the WTP and 1.3 ∘C across the ETP is shown in Fig. 6a. Meanwhile, the collective impacts (ARI + SDE) of BCD contribute to cooling across most of India due to cloud coverage increases (to be discussed in Sect. 4.4), with SS values of −0.7 to −1.2 ∘C across western India and the IGP region. By JA, BCD effectuates T2 patterns similar to those in MJ across southern Asia, as shown in Fig. S5a. However, the areas of cooling characterizing much of India are shifted north and west to include most of Pakistan, and the areas of warming characterizing a majority of the TP are much reduced compared to MJ, especially across the southern TP. We note that T2 changes of 0.1–0.2 ∘C are simulated across portions of the Arabian Sea. These values should not be interpreted as significant due to the fact that sea surface temperatures (SSTs) are prescribed.
The sign and magnitude of T2 changes vary as a function of effect type (SDE or ARI) and by species (BC or dust). BCD SDE-induced T2 warming can exceed ARI T2 warming over complex terrain, as indicated by our results. Values of +2 ∘C are simulated across the WTP mountain chains (Fig. 6b), such as the western Himalayas, Kunlun, Karakoram, and Hindu Kush during MJ. Within the WTP, SDE-induced warming reaches 0.5 to 1.3 ∘C. Additionally, BC generally contributes to more simulated SDE warming than dust across the WTP during MJ and JA (Figures 6d and S5d, respectively), while dust contributes to a majority of the SDE-induced warming across the ETP during MJ.
BCD ARI drive a majority of the simulated T2 changes across southern Asia during MJ (Fig. 6c) and JA, with the largest T2 changes occurring during MJ. While MJ changes in T2 associated with ARI are brought forth by both BCD collectively, the TP area has more expansive T2 changes as a result of dust-induced ARI (Fig. 6g); a much larger swath of 1.3 to 2 ∘C warming occurs across the WTP compared to the simulated BC-induced ARI (Fig. 6e). Across the IGP, dust ARI brings forth cooling of more than 0.7 ∘C during MJ, while BCD ARI cool portions of central and southern India by 0.5 to 0.7 ∘C during MJ. By JA, dust ARI (BC ARI) contributes to most of the cooling (warming) across the IGP and Pakistan (northern TP), with simulated T2 changes from −0.2 to −0.7 ∘C (+0.2 to +1.3 ∘C). With these effects in mind, it should be noted that BC is underestimated compared to surface observations,
While understanding the BCD-induced changes in T2 is important from an anthropogenic perspective, these changes are inadequate when examining the influence of BCD on SAM dynamics. This is because BCD-induced SAM changes depend on the thermal characteristics of the tropospheric column. For this reason, Sect. 5 will make use of the 300–700 hPa mean column temperature differences instead of T2 differences when examining the circulation changes brought about by BCD effects on the SAM.
4.3 SWE
BCD effects contribute to large reductions in SWE across the TP and TPF from April through June. Peak BCD-induced SDE plus ARI reductions in SWE of 75 mm (49 %) are simulated in May across the WTP (Fig. 7a), while peak reductions of 25 mm occur in April across the ETP and TPF (61 % and 49 %, respectively; Fig. 7b, c). Even though the largest regionally averaged T2 warming results from BCD-induced ARI, the largest reductions in SWE are due to simulated BCD-induced SDE. By June, BCD SDE contributes to SWE reductions across the WTP of greater than 50 mm (62 %), while BCD ARI contributes to reductions in SWE of 10 mm (< 20 %) or less for all months. It is noted that the largest percent changes in SWE associated with BCD effects occur in the summer months, when SWE is minimized across the TP.

Figure 7Monthly time series of snow water equivalent (SWE) changes (millimeters) due to BCD effects across (a) the WTP, (b) ETP, and (c) TPF.
BC SDE drives a majority of SWE changes across the TP with reductions of greater than 30 mm (17 % to 44 %) or more across the WTP from March through June, but other effects are important too. BC ARI, dust ARI, and dust SDE all contribute to reduced SWE in excess of 10 mm from March through June across the WTP. Compared to the WTP, BCD effects across the ETP and TPF bring forth smaller reductions in SWE, but BC SDE still contributes to the largest effects on SWE. Additionally, the largest reductions in SWE are typically found along the western and southern TP periphery (Fig. 8).
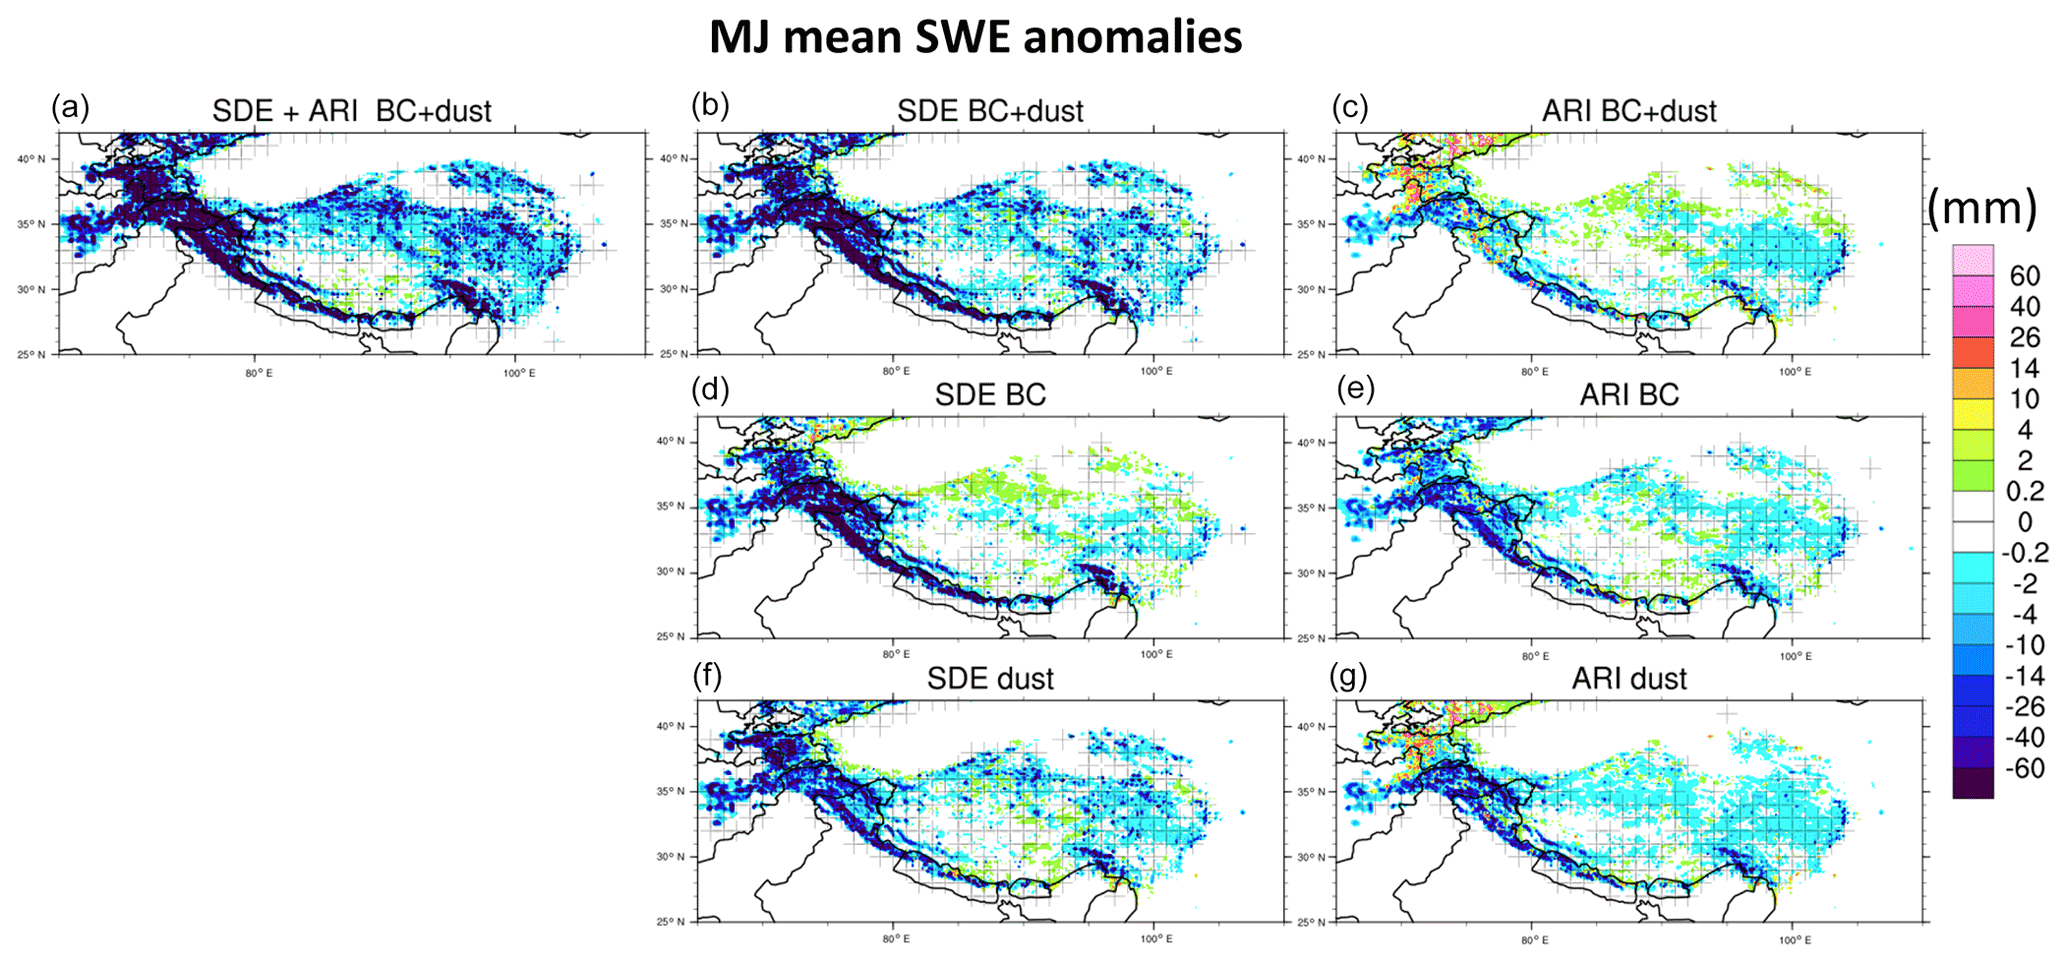
Figure 8Same as in Fig. 6, but for snow water equivalent (SWE) (mm).
BCD effects that lead to changes in TP area SWE can directly impact runoff, which replenishes main waterways across the region. It is found that BCD SDE drive runoff increases (decreases) from February through June (June through September) across the WTP and ETP, with peak runoff increases (decreases) of 1.2 mm d−1 (1 mm d−1) across the WTP occurring in May (July) (see Fig. S6), constituting a 77 % (36 %) increase (decrease) in runoff. The peak runoff increases across the WTP (ETP) correlate with maximum BCD SDE reductions in SWE of 75 mm (25 mm), which occur in May (April).
4.4 Cloud coverage and moisture
BCD effects bring forth responses in the mass fields, which impact simulated SAM cloud fraction (CF) and specific humidity (q). Driven primarily by BC and dust ARI, q increases in excess of 1 g kg−1 are simulated from mid-March through June across India, the IGP, and TPF; moisture changes peak during June across the IGP (+3.5 g kg−1) and TPF (+2.5 g kg−1) (Fig. 9). BCD-induced SDE contributes to smaller q changes from April through July across the IGP and TPF of +0.7 and +0.8 g kg−1, respectively. Interestingly, the q changes from dust-induced SDE and BC-induced SDE across the TPF and IGP do not add linearly during June (see Fig. 9c, e). Focusing specifically on the IGP, as the q changes are similar between the IGP and TPF, dust (BC) SDE contributes to a q change of +0.3 g kg−1 (+1.2 g kg−1), but we see a total (i.e., BC SDE + dust SDE) q change of +0.7 g kg−1. This result could be due to an increase in precipitation due to the combined effects of BCD SDE, which would act to deplete the available water vapor, locally. The positive q changes just discussed are dramatically reduced from July through September. Across the WTP and ETP, q changes of +1 g kg−1 are simulated in June, while smaller q changes are simulated for the spring and summer months across both regions.
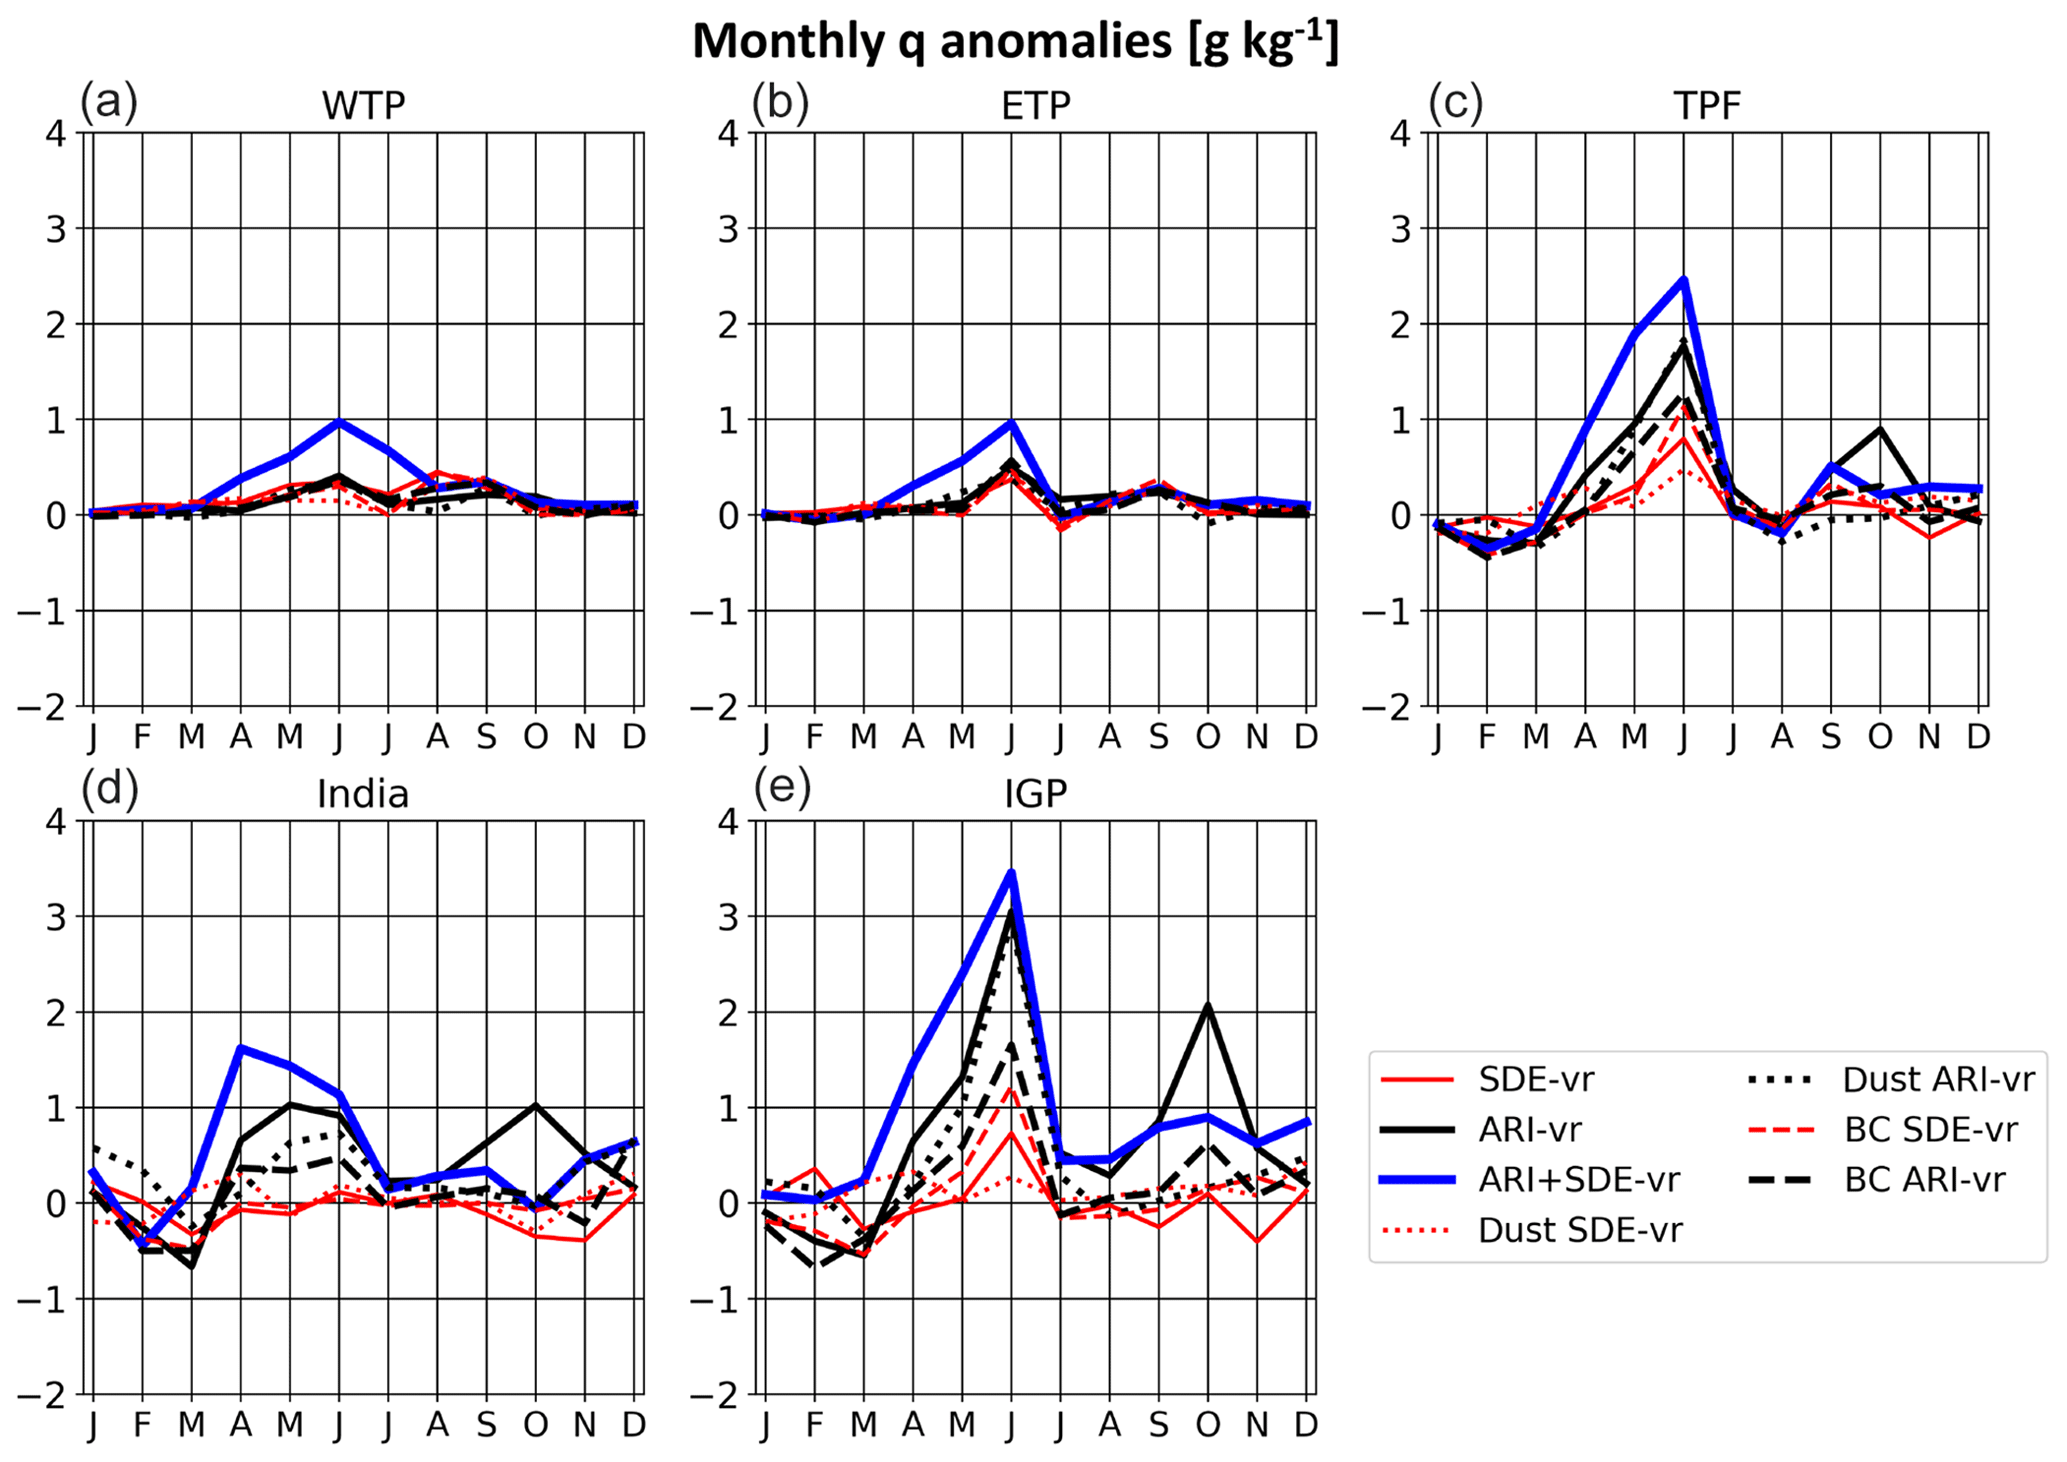
Figure 9Monthly time series of specific humidity (q) changes in grams per kilogram due to BCD effects across (a) WTP, (b) ETP, (c) TPF, (d) India, and (e) IGP.
Specific humidity increases due to BCD effects correlate reasonably well with increases in CF, especially across South Asia from April through September (see Fig. S7). An increase in CF, primarily driven by BCD ARI, is simulated across India, the IGP, and TPF from April through June. Net peak CF increases occur in May across India (12 %) and June across the IGP (15 %) and TPF (16 %) as seen in Fig. S7. CF increases of 10 % or more due to aerosol effects across southern Asia during MJ have been noted previously (Lau et al., 2010). By September, the CF increases vanish across India, the IGP, and TPF. Across the ETP, simulations indicate that CF increases of 3 % are due to BCD SDE in June, with slightly larger increases (as much as 7 %) in June and July across the WTP (see Fig. S7) also due to BCD SDE.
Compared to SDE, BCD ARI generally brings forth the largest changes in CF across South Asia from May through August. The spatial distributions of MJ (JA) CF changes are shown in Fig. 10 (Fig. S8). CF increases of 7 % or more across India and CF decreases of 5 %–10 % or more across the central and northern TP are simulated (Fig. 10a). The Arabian Sea, western Ghat Mountains, and TPF are characterized by the largest positive CF changes, which can exceed 15 %. Furthermore, while BC ARI patterns are similar to those of dust ARI during MJ, the magnitudes of dust-induced ARI changes are generally larger, especially across the Arabian Sea and the ETP (Fig. 10e, g).

Figure 10Same as in Fig. 6, but for cloud fraction (CF) (%).
While SDE magnitudes are generally smaller compared to those induced by BCD ARI, BC SDE drives MJ CF changes of +5 % to +15 % across the IGP and southwestern TP (Fig. 10d). Meanwhile, CF reductions of 2 % to 5 % are simulated due to BC SDE across northern TP during MJ, making the spatial pattern of CF changes induced by BC SDE (Fig. 10d) similar to those induced by BCD ARI (Fig. 10c). In addition, dust SDE contributes to increases in CF of 4 % to 7 % across the southern TP during MJ (see Fig. 10f).
4.5 Precipitation
BCD effects contribute to almost unanimously increased precipitation across southern Asia during premonsoonal months, as seen in Fig. 11a, with BCD collectively contributing to values in excess of +6 mm d−1 across the eastern Arabian Sea, the eastern Bay of Bengal, and the TPF. Here, we define “precipitation” to be sum of liquid precipitation plus ice precipitation, and we find that changes in total precipitation are driven by changes in liquid precipitation; simulated changes in snow precipitation are minimal (not shown). Elsewhere, BCD contributes to SS changes of between +1 and +4 mm d−1 across India and changes in MJ precipitation of around +1 mm d−1 over the southern and eastern TP. It seems as though the large-scale pattern in MJ precipitation changes is regulated by dust ARI (Fig. 11g). However, precipitation changes of between +1.5 and +5 mm d−1 are simulated across the Bay of Bengal and Arabian Sea associated with BC SDE (Fig. 11d).
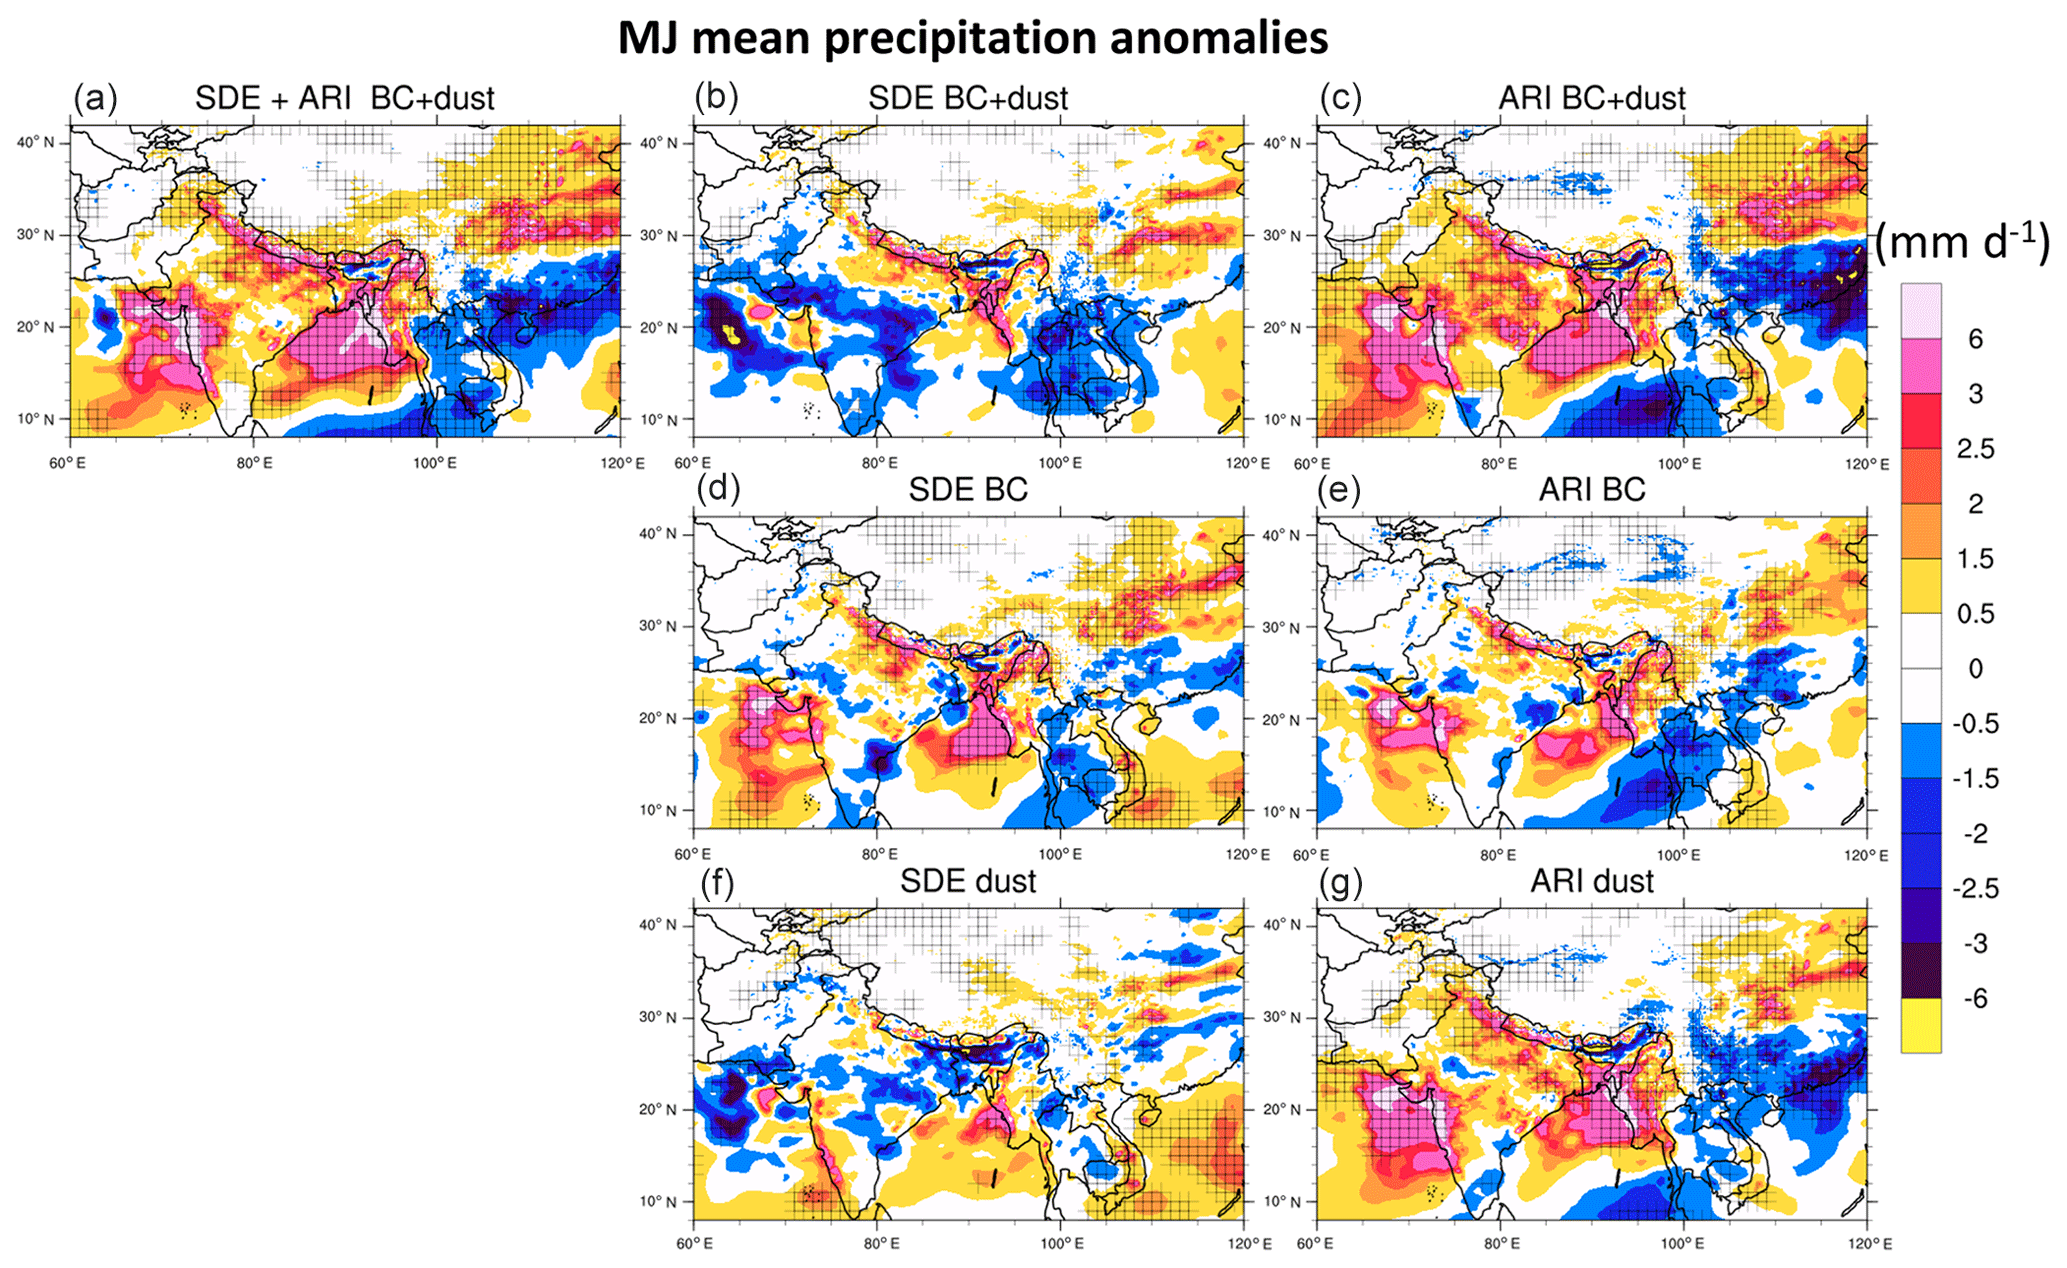
Figure 11Same as in Fig. 6, but for precipitation rate (mm d−1).
From July through August, precipitation increases of 1 mm d−1 are simulated across India, driven primarily by dust ARI. Meanwhile, dust ARI-driven precipitation increases of 2 mm d−1 (16 %–35 %) are simulated through September across the IGP (see Fig. 12). Additionally, BCD SDE contributes to slight increases of 0.5 mm d−1 (2 %–17 %) or less across the IGP from May through August. Across India, however, with the exception of July, BCD-induced SDE contributes to decreased precipitation from March through October, with a peak reduction in June at 1.2 mm d−1 (10 %). These increases, primarily induced by dust ARI, are similar to those reported in Jin et al. (2015) and slightly larger than those found in Vinoj et al. (2014).
The TPF region is characterized by the largest precipitation increases relative to the other subregions due to an enhancement of BCD effects by the complex terrain, with BCD effects bringing forth increases in precipitation from April through August (see Fig. 12c). BCD contribute to unanimous SDE- and ARI-induced precipitation increases in June across the TPF, with dust and BC ARI (both approximately +4.5 mm d−1; +25 % and +23 %, respectively) and BC SDE (+4.3 mm d−1; +21 %) dominating the enhanced precipitation; the collective impacts of BCD enhance precipitation by more than 7 mm d−1 (47 %) in June. Dust SDE contributes to smaller MJ anomalies of less than +1 mm d−1 (3%–6 %) across the TPF.
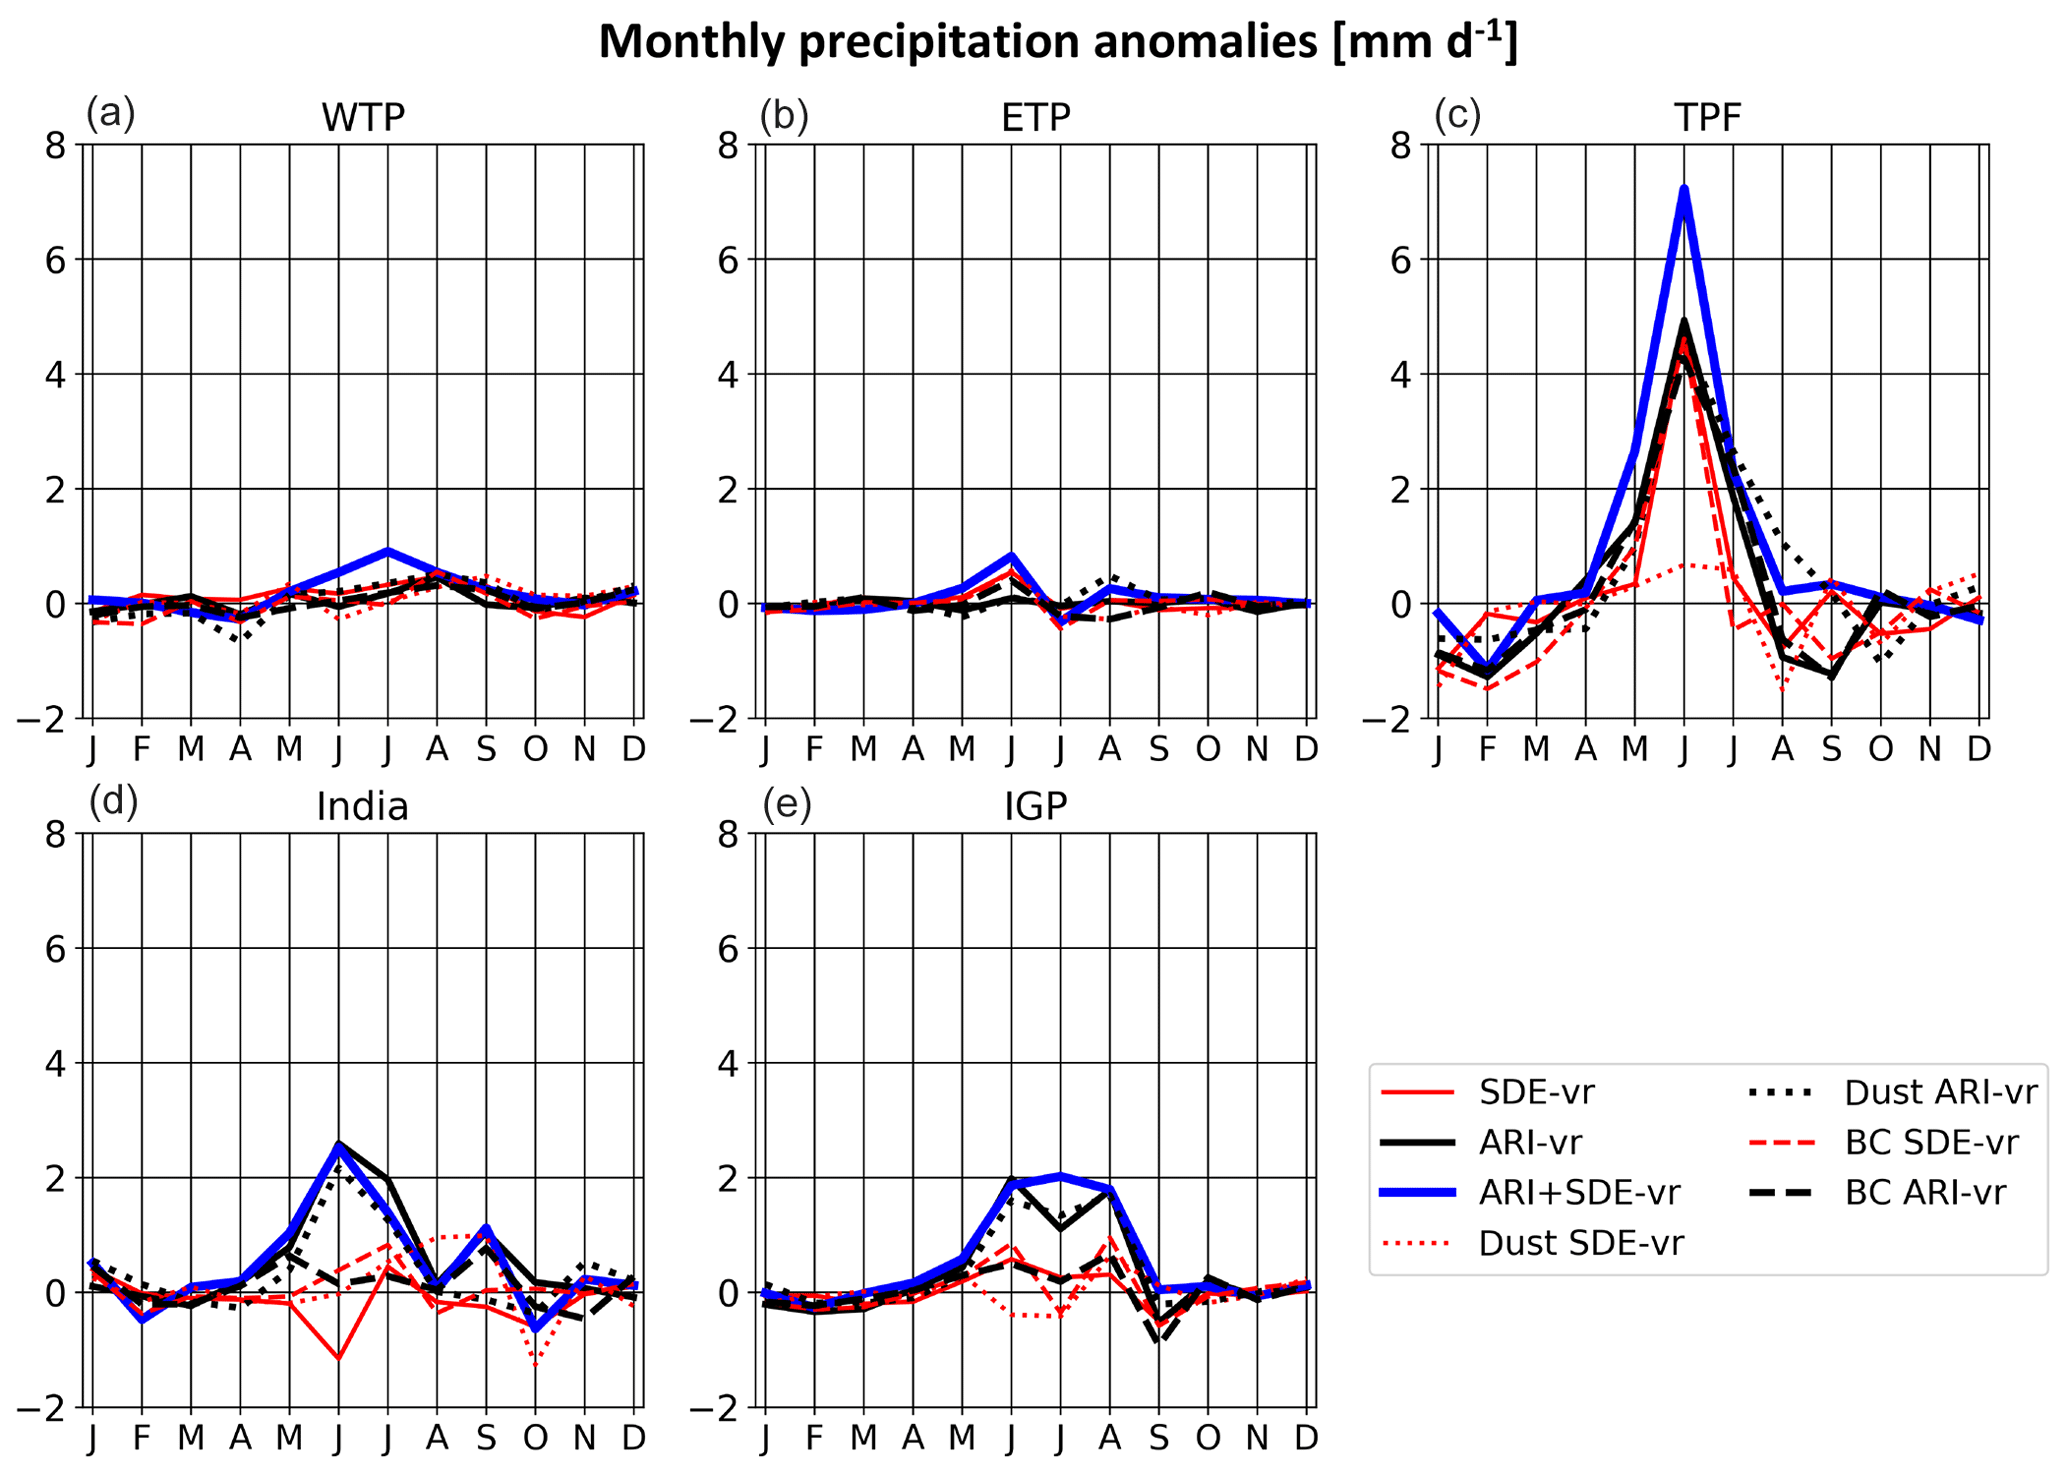
Figure 12Same as in Fig. 9, but for precipitation rate (mm d−1). Note that the y axis in (e) is different from panels (a–d).
BCD ARI-induced precipitation differences drive changes in runoff across India and the IGP, with runoff increases induced from April through October. Maximum precipitation increases of 2.5 mm d−1 (31 %) and 2 mm d−1 (27 %) occur a month ahead of runoff increases of 2 mm d−1 (41 %) and 1.6 mm d−1 (85 %) across India and the IGP, respectively (Fig. S6). The maximum precipitation (runoff) increase occurs in June (July) across India, while the maximum precipitation (runoff) increase occurs in July (August) across the IGP. In contrast to India and the IGP, the maximum precipitation increases in TPF driven by BCD ARI occur in the same month (June) as runoff, with precipitation (runoff) increases of 7 mm d−1 (6 mm d−1) representing increases of 47 % (58 %). The reasons for the differences in runoff–precipitation phase between India–IGP and the TPF may be the result of larger runoff effects associated with BCD SDE across the TPF compared to the IGP and India, which contributes to runoff increases of more than 3.5 mm d−1 (26 %) in June (Fig. S6c, e).
The simulated changes in South Asian climate introduced by BCD are the result of direct aerosol interactions with sunlight and outgoing terrestrial radiation, which leads to circulation changes brought about by stability and thermodynamic modifications of the atmospheric column. Furthermore, because this study did not attempt to isolate the near-field and far-field aerosol effects on the SAM, we restrict our attention to the combined near- and far-field BCD effects represented in overall circulation and meteorology perturbations across southern Asia.
5.1 Dynamical impacts of BCD on the SAM
The changes induced by the combination of BCD effects on the premonsoonal and monsoonal meteorology can be examined by considering thermal vorticity, ζT (Bluestein, 1992). Analogous to thermal wind, ζT is defined to be the difference between the upper-level geostrophic vorticity (ζg,above) and the lower-level geostrophic vorticity (ζg,below) within a column:
where , so
where f0 is the constant Coriolis parameter, ug and vg are the x and y components of the geostrophic velocity components, respectively, and Φ≡gz is the local geopotential height. Taking the derivative of Eq. (9) with respect to independent variable t, we find the local tendency in ζg to be
Substituting Eq. (10) into Eq. (8), we get
where is the average column thickness. Here, variable t can be time, but because we are applying Eq. (11) to independently run experiments, t is more accurately an independent variable denoting case. For simplicity, we define all variables that are subject to the operator to be a tendency. Equation (11) states that the thermal vorticity tendency is proportional to the Laplacian of the layer thickness tendency, which is proportional to the mean layer temperature. This section will thus utilize the 300–700 hPa column-averaged temperature to evaluate circulation changes.
For synoptic-scale flows, it can be shown via scale analysis that the local vorticity tendency is dominated by the stretching of Earth's vorticity, or
where . Equation (11) can be written as
In the above series of equations, u and v are the zonal (x) and meridional (y) components of the 3-D wind field. The upper- and lower-tropospheric divergence of the horizontal wind field is given by δabove and δbelow, respectively, and .
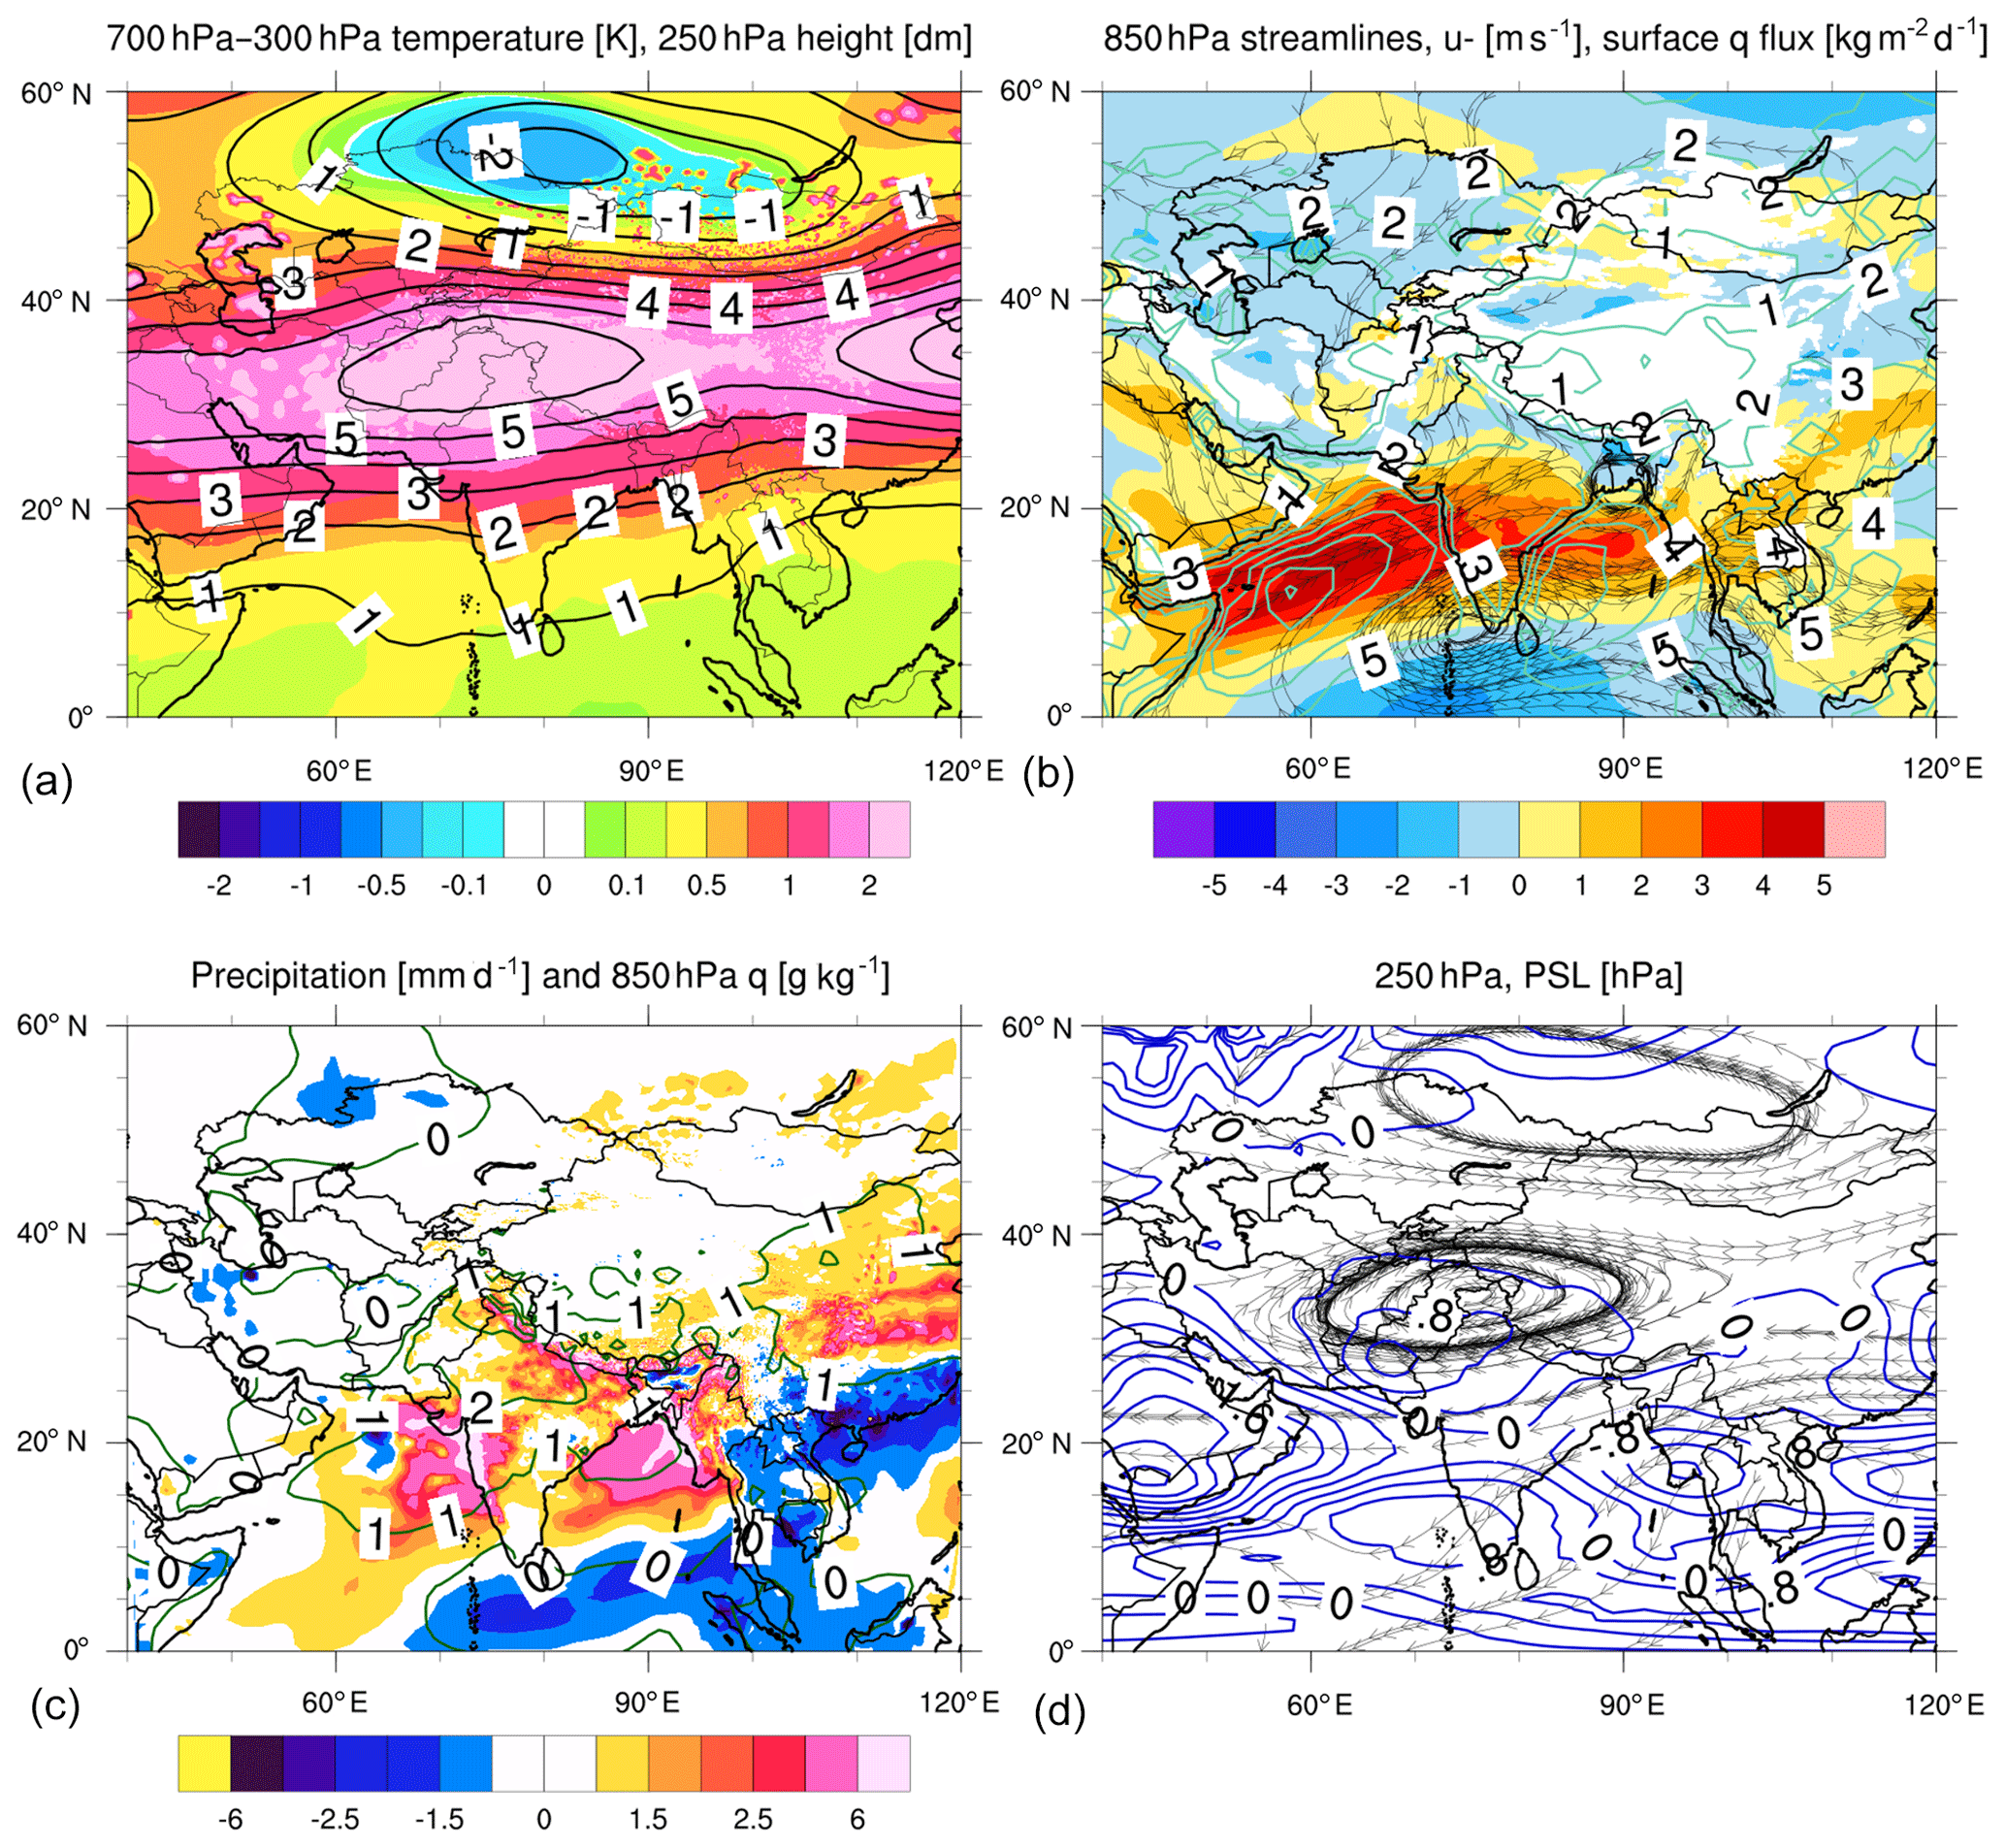
Figure 13MJ averaged BCD-induced anomalies in (a) 700–300 hPa column temperatures and 250 hPa heights; (b) 850 hPa u anomalies (color fill), streamlines, and surface moisture flux (aquamarine contours); (c) precipitation rate (color fill) and 850 hPa specific humidity (dark green contours); and (d) 250 hPa streamlines and surface pressure.
Using Eq. (13), we can link BCD-induced temperature changes to circulation changes during premonsoonal months. Figure 13a shows simulated MJ anomalies in 300–700 hPa column-averaged temperature. BCD-induced columnar warming of between 1 and 3 ∘C occurs in a belt between 20 and 40∘ N, within a zone of climatologically maximized west-southwesterly upper-tropospheric flow (see Fig. S9c). These strong upper-tropospheric winds are responsible for transporting dust downstream of major emission sources such as northern Africa and the Middle East. The warming in this belt is also due to changes in clouds through evaporation and regional circulation changes (Fig. 10a). Under this warming scenario, (i.e., the layer expands). If it is assumed that the geopotential field is the linear combination of sinusoidal functions, the Laplacian of a positive quantity will contribute to a negative thermal vorticity tendency by Eq. (11). Hence, a warming–expanding column will bring about Δδ>0 via Eq. (13), and upper-tropospheric anticyclonic ζg by Eq. (12) (and Φ rises; Fig. 13a, d) will tend to be generated atop lower-tropospheric cyclonic ζg by Eq. (12) (and Φ falls). Via continuity, these changes in the vorticity field lead to changes in vertical motion under the assumption of incompressibility, a commonly used assumption on regional and global scales. As aerosols heat the atmosphere, , , and Δδ>0. In an atmosphere where divergence increases with increasing height , the continuity equation subject to incompressibility is
where is the one-dimensional Laplacian and w is the vertical component to the 3-D velocity vector. Under such conditions, w must be positive if it is assumed that is a linear combination of sinusoidal functions. BCD warming brings forth an enhancement of the rising branch of the thermally direct monsoon circulation.
The application of Eqs. (13) and (14) to our results couples the total (BCD ARI and SDE) thermodynamic changes to the circulation changes during MJ. Maximal column-averaged temperature anomalies (Fig. 13a) are collocated with an upper-tropospheric anticyclonic anomaly in the mass field (Fig. 13d) across southwest into southern Asia during MJ, with 250 hPa pressure surface height rises of between 6 and 9 dm across south-central Asia (Fig. 13a).
The response in the mass field due to BCD ARI and SDE is not confined only to the upper troposphere, where the geostrophic approximation is most applicable. In fact, BCD-induced cyclonic changes in the 850 hPa flow are simulated (color fill, Fig. 13b), with an intensification in the WLLJ of as much as 5 m s−1, extending from eastern Africa, bifurcating the Arabian Sea, and protruding into southeast Asia during MJ (Fig. S13a). The magnitude of WLLJ intensification is smaller across India (2 to 4 m s−1), but its magnitude across the Bay of Bengal is more comparable to the intensified westerlies in the Arabian Sea. To this feature's north, there are simulated BCD-induced easterlies of −1 m s−1 across eastern Iran into Russia, but the most pronounced low-level flow changes lie across the open sea. This is to be expected, as the lower-tropospheric geostrophic assumption is more erroneous over land compared to oceans due to the far greater surface friction over land. More generally, friction may explain why the anomalous 850 hPa vorticity feature is more diffuse than the 250 hPa vorticity feature during MJ across south-central Asia.
The BCD-induced anomalies in the mass fields, discussed by invoking thermal vorticity arguments, lead to changes in the vertical motion pattern, water vapor budget, and precipitation patterns across South Asia during MJ. The 850 hPa q increases across South Asia of 1 to 2 g kg−1 are simulated (Fig. 13c) due to a stronger WLLJ (Fig. 13b). Meanwhile, BCD warming brings enhanced rising vertical motion by Eq. (14) across South Asia. These increases in w and q correlate with precipitation increases of +2 mm d−1 across India during MJ, while precipitation increases of greater than 6 mm d−1 are simulated across the western Ghats and TPF (see Fig. 13c). The latter increases may be due to increased orographic effects (not explicitly examined in this study), as low-level upslope flow over the Ghats is enhanced by a strengthened WLLJ, and upslope flow over the TPF is enhanced by stronger cyclonic flow across India (Fig. 13b). Positive precipitation anomalies increase in magnitude towards the east across the Arabian Sea and Bay of Bengal as eastward-moving precipitation systems gain sensible and latent heat from the open waters.
Into JA, the belt of maximum 300–700 hPa column heating shifts north (Fig. S11a) along with the subtropical jet. Meanwhile, the area of WLLJ intensification shifts north and shrinks significantly compared to MJ (Fig. S11b). A precipitation dipole is simulated across the western mountains of India during JA, with increases (decreases) in excess of 4 mm d−1 located further north (south) in the mountain chain. Precipitation increases greater than 4 mm d−1 are also simulated across the western IGP and the southern half of Pakistan (Fig. S11c), with the maximum BCD precipitation increases tending to occur on the eastern nose of the WLLJ anomaly (as in MJ).
It is noted in Sect. 4.5, when compared to other subregions, TPF precipitation is more sensitive to BC SDE, in addition to BC ARI and dust ARI (see Fig. 12). This could indicate the presence of the elevated heat pump effect (Lau et al., 2010), which develops in proximity to the TP as anomalous BCD-induced heating of the TP leads to enhanced anabatic upslope flow. This effect, coupled with enhanced southerly cyclonic flow incident on the TPF during MJ, may explain the enlarged precipitation enhancements across the TPF relative to other subregions considered in this study. Orographic enhancement of BCD effects over complex terrain was not explicitly examined in this study and remains the subject of future work.
5.2 Dominant species and effects contributing to SAM alterations
Different species (BC or dust) and different radiative effects (SDE or ARI) regulate the BCD impact on the SAM and premonsoonal meteorology. Figure 14 depicts the vertical structure of BCD effect-wise changes in temperature, w, CF, and q across northern India during MJ, averaged horizontally between 25 and 30∘ N and 75 and 80∘ E (north-central India).
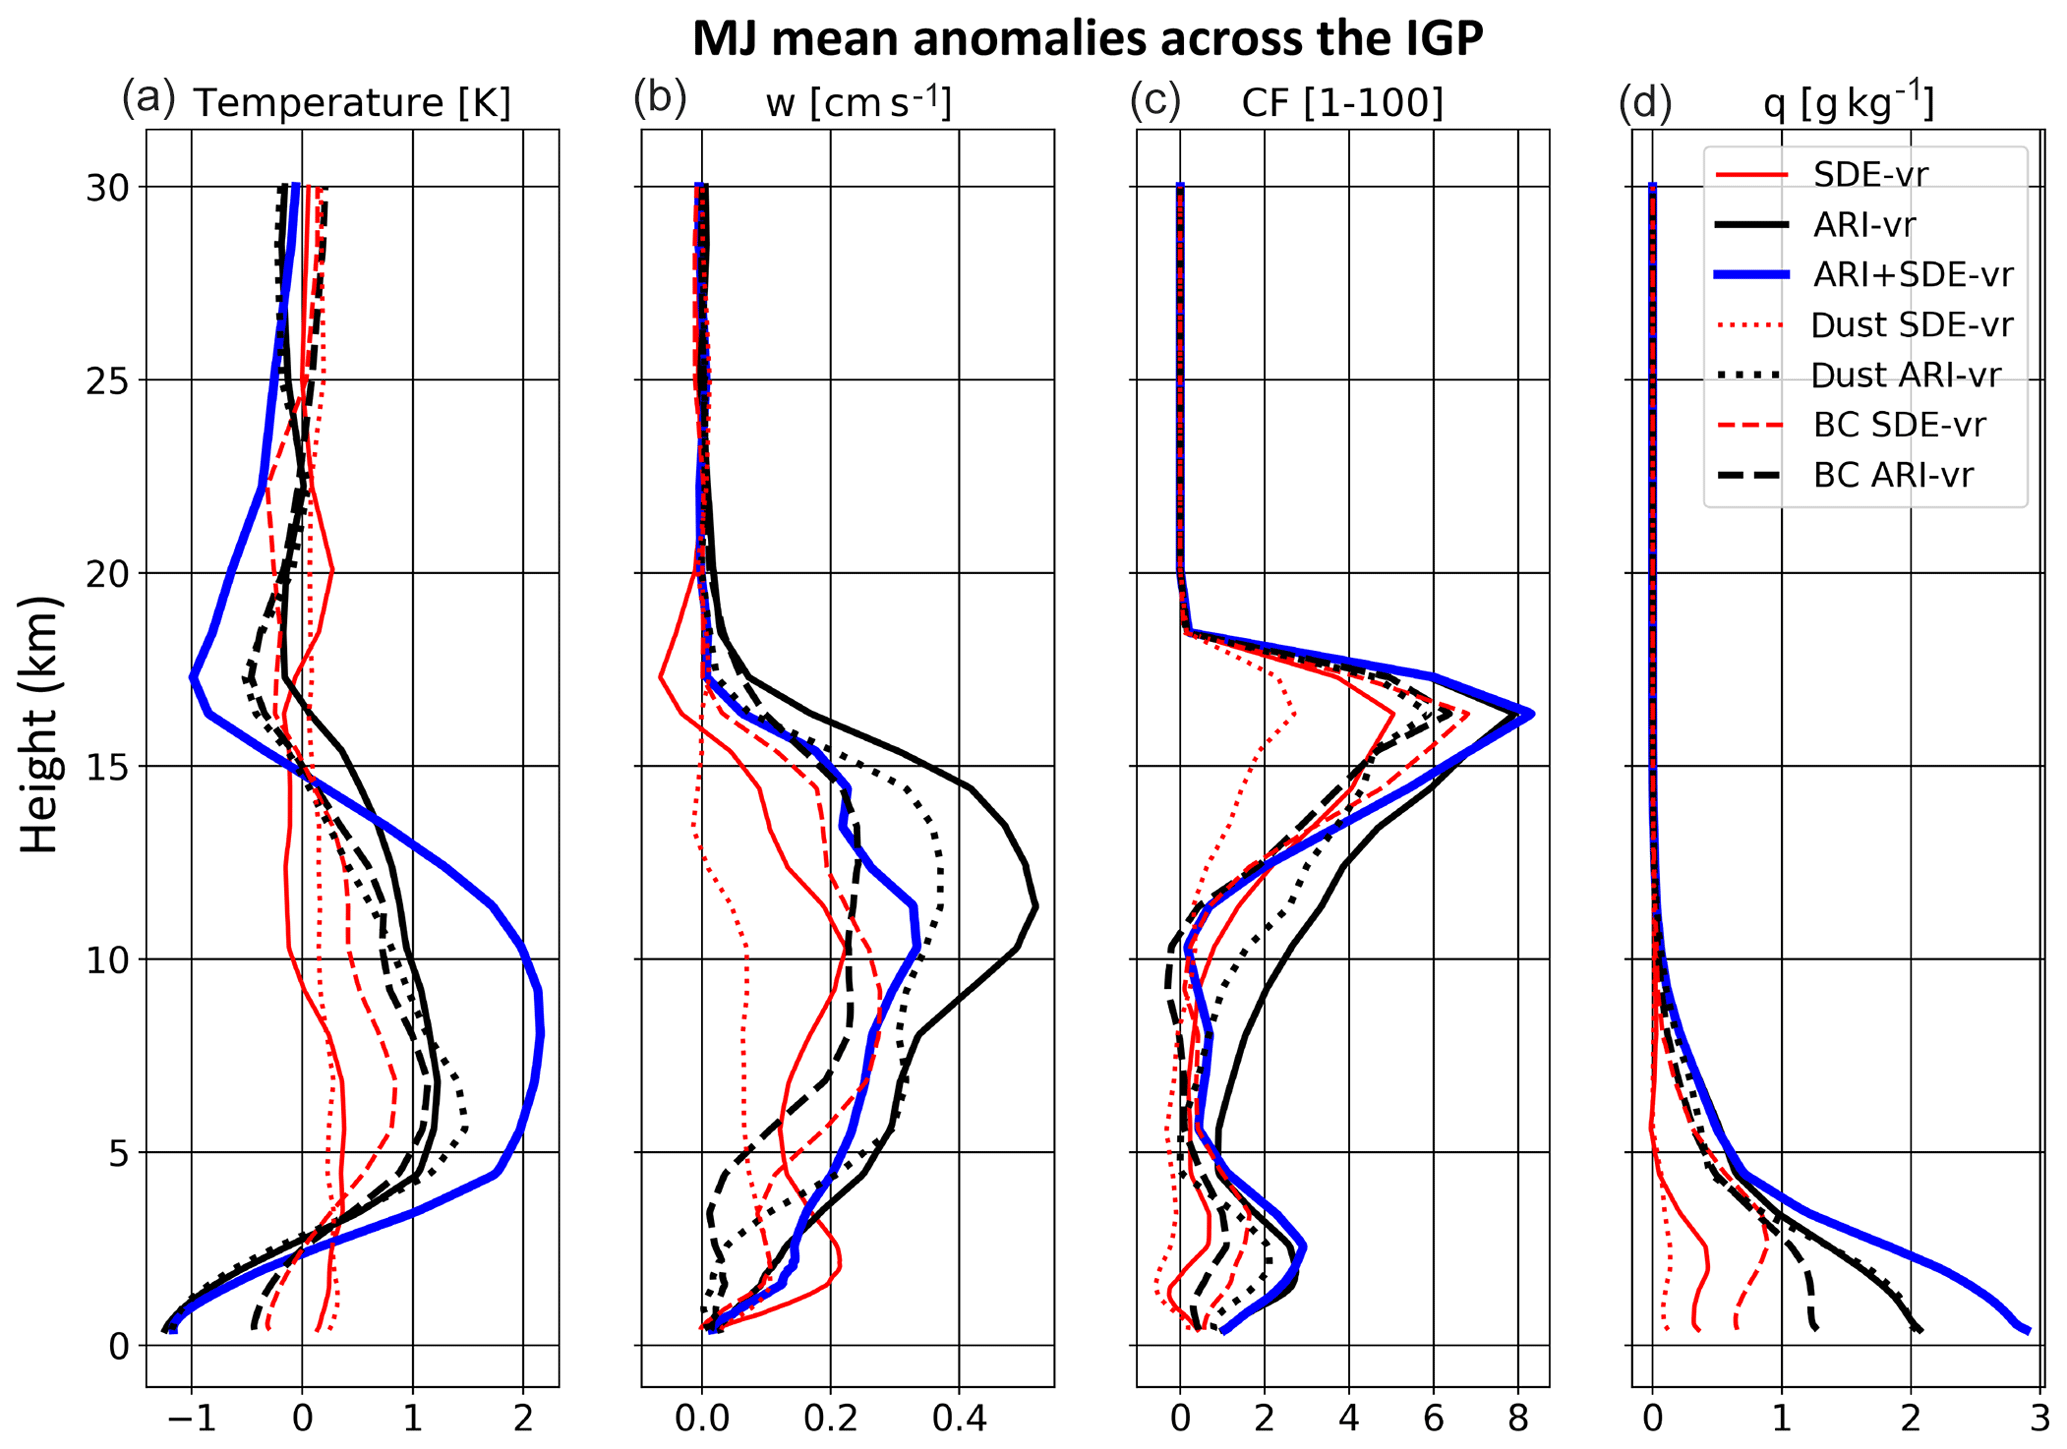
Figure 14Vertical profiles of BCD effect-wise anomalies in (a) temperature, (b) vertical velocity, (c) CF, and (d) q across the IGP during MJ, averaged horizontally between 25 and 30∘ N and 75 and 80∘ E. Red (black) curves depict ARI (SDE) effects, while the solid blue curve depicts the combined effects of BCD. Dashed lines represent BC-induced anomalies, while dotted lines represent dust-induced anomalies.
The combined effects of BCD SDE and ARI contribute to low-level cooling (1.2 ∘C) beneath middle- and upper-tropospheric warming (as large as 2.1 ∘C), which increases thermodynamic stability. Above 3 km, dust ARI drives atmospheric warming as large as 1.5 ∘C. BC ARI contributes to atmospheric warming as large as 1.1 ∘C in a pattern similar to that of dust ARI. The BC SDE contributes to middle-tropospheric temperature changes that are similar in sign to dust ARI but half the magnitude, while dust SDE contributes the least to atmospheric heating compared to other effects (Fig. 14a) during MJ. Finally, the lower-tropospheric cooling is the result of cloud increases through w, q, and CF increases.
Accompanying the BCD-induced warming of the 3–15 km layer is an increase in tropospheric w up to 17 km during MJ. As with temperature, BCD ARI drives w increases that peak around 12 km at 0.5 cm s−1. Dust ARI accounts for a large portion of the total w increase, with BC ARI-induced w increases that are ∼30 % less. Meanwhile, BC SDE contributes to slightly stronger upward vertical velocities than BC ARI below 11 km, while the reverse is true above this altitude. This result may indicate the presence of the elevated heat pump effect (Lau et al., 2010) associated with strong warming on the southern TP periphery. BC SDE-induced warming of the TP periphery may induce locally strong solenoidal circulations due to horizontal density variations between the warming TP and the adjacent free atmosphere. These circulations could manifest as lower-tropospheric anabatic branches of rising vertical motion across northern India, which may be stronger than the larger-scale thermally direct rising motions induced by BC ARI. These anabatic circulations were not explicitly studied in this work and are the subject of future work. In any case, BCD ARI would induce positive w anomalies throughout the tropospheric column across northern India, while BC SDE may generate rising vertical motion only in a layer of the atmosphere in which BC SDE-induced quasihorizontal temperature gradients could develop in proximity to the TP. As for temperature, dust SDE contributes to relatively small upward vertical velocity enhancements across northern India.
Interestingly, BCD ARI by itself corresponds with larger upward vertical velocity changes than those associated with the combined effects (SDE and ARI) of BCD, even though the combined effects lead to the strongest middle-tropospheric warming during MJ. This is because the combined effects of BCD greatly increase the thermodynamic stability of the atmosphere across northern India (Fig. 14a) such that w increases are depressed. Hydrostatically, warming of the mean atmospheric column tends to initiate a thermally direct rising bubble. However, if the heating is vertically nonuniform within the column, as is the case depicted in Fig. 14a, changes in atmospheric thermodynamic stability may actually reduce the buoyancy of the rising bubble. This increased atmospheric stability can be tied to negative CF anomalies as well because as the atmosphere becomes more stratified, increases in turbulent mixing and entrainment may incite the evaporation of clouds. Across northern Tibet, dust ARI and BC ARI actually stratify the atmosphere so much that CF anomalies approaching −10 % are simulated during MJ (see Fig. 10c). This leads to enhanced surface warming that persists into the monsoonal period (Figs. 6 and S5).
The BCD-induced effects on MJ upward vertical velocities, driven primarily by dust ARI and to a lesser extent BC ARI and BC SDE, correlate positively with CF anomalies. This is especially true for upper-tropospheric clouds (Fig. 14c). CF increases of 2 % are effectuated mainly by dust ARI below 4 km, while BC SDE primarily drives CF increases in excess of +6 % around 17 km. The increase in upper-tropospheric clouds is the result of increased convective precipitation, while the low-level CF increases result from increases in boundary layer moisture of nearly 3 g kg−1 (Fig. 14d) coupled with vertical velocity increases of 0.1 cm s−1 below 5 km and increased low-level thermodynamic stability.
Enhancements in w by BCD effects may not only be directly related to the synoptic response described in Sect. 5.1, but rather indirectly related via mesoscale features that form as a result of downscale energy cascade. While not explicitly examined in this study, low-level jet cores are characterized by mesoscale vertical circulations that may promote or inhibit upward vertical motion. Additionally, anabatic circulations associated with horizontal density and temperature gradients may do the same. These mesoscale features may enhance or depress the synoptic response induced by BCD effects and require more intense study.
5.3 CONT-vr versus CONT-un effects
VR experiments are comparable with UN experiments in simulating BCD effects (Fig. 15). These experiments simulate warming (cooling) across the TP (India) during MJ. However, VR experiments reveal a larger area of warming > 1.3 ∘C across the central and eastern TP (Fig. 15a) due to BCD effects compared to UN experiments (Fig. 15d). Additionally, UN simulated BCD effects bring about stronger cooling across India and Pakistan (Fig. 15d).
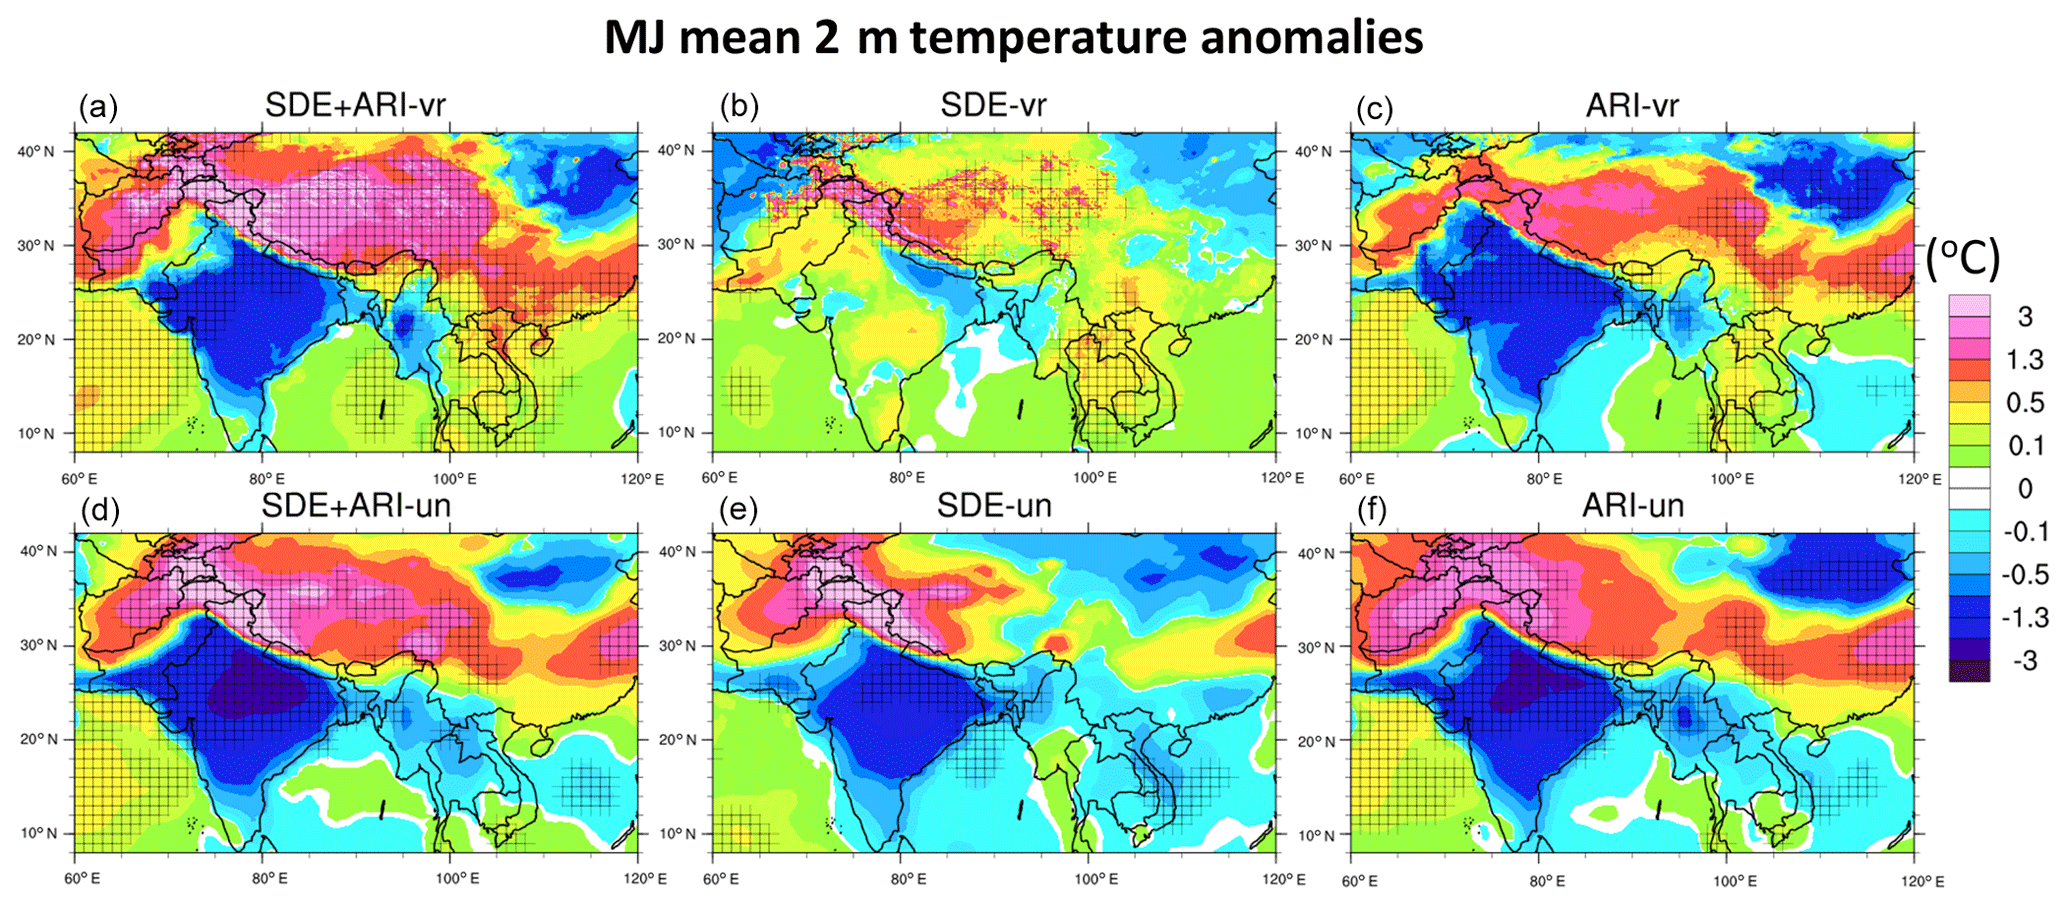
Figure 15Anomalous 2 m temperatures during May–June due to BCD (a) SDE + ARI, (b) SDE, and (c) ARI in the VR experiment. Panels (d–f) are the same as in (a)–(c) but are for the UN experiments.
These differences between VR and UN experiments result from a stronger BCD SDE in the UN experiments. Aerosol-induced snow melting is much stronger in the UN experiments (not shown), leading to a much stronger warming of the WTP (Fig. 15e) than in the VR experiments. This brings about a stronger columnar warming in the UN experiments (not shown) that leads to stronger Arabian Gulf moisture flow into India (Fig. S12) through a stronger WLLJ (Fig. S13) and higher CF increases (Fig. S14) in the UN versus the VR experiments during MJ. Because Rahimi et al. (2019) showed that CONV-vr significantly outperformed CONT-un in simulating TP regional snow cover, it is reasonable to assume that CONT-vr more accurately simulates BCD SDE compared to CONT-un. Simulated BCD SDE should thus be quite different in terms of meteorological perturbations during MJ.
Implementing a variable-resolution (VR) version of CESM allowed for a relatively high-resolution evaluation of the impacts of BC and dust on the South Asian monsoon. With a horizontal grid spacing of 0.125∘ across the TP and the rest of central Asia, VR simulations were able to capture the horizontally heterogeneous warming induced by BCD on TP snowpack. Results indicated that BCD effects, driven mainly by BCD ARI, lead to an enhancement of the SAM through a radiative–dynamics feedback that enhances precipitation in MJ. Precipitation increases of greater than 2 mm d−1 across central and northern India, with larger precipitation increases of more than 6 mm d−1, are simulated over the Ghat Mountains and TPF due to orographic enhancement in MJ. Into JA, precipitation increases shift west and north, with precipitation increases of more than 4.5 mm d−1 being simulated across the western IGP and southern Pakistan. Runoff increases follow precipitation increases across India and the IGP. Across the WTP and ETP, however, runoff changes are modulated primarily by BC SDE-induced snowmelt, with runoff increases (decreases) prior to (after) June; a majority of the simulated SWE reductions are due to BC SDE. Across the TPF, precipitation enhancements due to BC SDE are comparable in magnitude to those of BCD ARI, as TPF surface heating adjacent to a cooler free atmosphere south of the TP initiates an anomalous anabatic circulation through anomalous density gradients whose rising branch is located over the TP.
The precipitation increases across South Asia during MJ, and across western India and southern Pakistan during JA, occur as BCD warm the atmospheric column by 1 to 3 ∘C over a large belt coincident with the subtropical jet extending from northeast Africa through to the TP region. This results in a large upper-level (lower-level) divergence and anticyclonic (convergence and cyclonic) feature in the wind fields. On the southern side of the low-level cyclonic feature, an intensified WLLJ extends from the Horn of Africa through the eastern Bay of Bengal, bringing moisture to South Asia during the premonsoonal months. Despite TOA warming from BCD, increased cloud coverage from the intensified WLLJ actually leads to surface cooling. During JA, the WLLJ extends into the northern Arabian Sea. BCD-induced changes in the vertical gradient of the horizontal divergence, coupled with increased moisture across the region, bring forth stronger onset to monsoonal precipitation and increases overall monsoonal precipitation yields through increases in w. BCD effects are amplified across the western Ghat Mountains and the TPF, due to orographic and anabatic effects.
This study shows that the SDE and ARI influences on the premonsoon vary greatly as a function of model grid spacing. Specifically, SDE- and ARI-induced perturbations to premonsoonal climate were more comparable in the coarse-resolution experiments. In the VR experiments with a better simulation of TP snow cover (Rahimi et al., 2019), the SDE-induced effects were much smaller than those induced by ARI.
The results of this study agree well with Lau et al. (2017), suggesting that ARI contributes to the largest circulation changes during the premonsoonal and monsoonal periods. Furthermore, Vinoj et al. (2014) and Jin et al. (2015) concluded that monsoonal precipitation is positively correlated with dust transport from the Arabian Peninsula; absorbing dust initiates convergence across the Middle East, which drives moisture transport into South Asia on timescales of a week. Our results reinforce this conclusion. Dust ARI, as well as BC ARI, contributes to large increases in moisture, CF, precipitation, and upward vertical motion during the premonsoonal and monsoonal periods. Additionally, cloud reductions and precipitation increases due to semi-direct effects are simulated in our study with magnitudes comparable to Lau et al. (2010), although we simulate higher precipitation anomalies across the TPF and western India. Finally, in agreement with Das et al. (2015), we found that absorbing dust warms the atmospheric column downstream of major emission sources, contributing to anomalous upper-level (lower-level) ridging (troughing) and an intensification of the WLLJ.
There are significant questions that remain regarding the impact of BCD on SAM and premonsoonal meteorology. First, both UN and VR experiments performed rather poorly in simulating the magnitudes of BC in both snow and the atmosphere. Specifically, atmospheric BC was underestimated compared to surface observations by simulations, while dust upstream of India was oversimulated compared to satellite measurements by simulations. That being said, there are improvements in VR experiments: CONT-vr reduced the average bias of the in-snow BC concentration by more than a factor of 2 compared to the CONT-un and better represented AOD seasonality in AERONET measurements compared to CONT-un. Second, there is a pronounced lack of in situ dust measurements, in both snow and the atmosphere. This makes a model validation of dust aerosol quite difficult. Although our results indicate that BCD ARIs are main drivers of precipitation changes across South Asia during the warm season, the scope of these results could change as more data become available for model evaluation. Third, simulations were conducted with prescribed sea surface temperatures, so longer-term ocean–atmosphere feedbacks were not considered in the context of the aerosol effects. That being said, the heterogeneity of the SDE-induced meteorological anomalies across the TP brought forth by the use of a VR model improves significantly over its coarser-resolution counterparts, making the approach of using a VR global model beneficial when examining the climate system across regions in which the topography is highly variable. Thus, this approach has significant utility in other areas in which complex terrain may be a critical regulator of regional climate.
An opportunity exists for these simulations to be conducted without prescribed SSTs, as ocean–atmosphere feedbacks may affect the interseasonal and interannual variability of the monsoon. These feedbacks may depress or enhance the various BCD effects discussed here (Xu and Xie, 2015; Wang et al., 2017). To capture the multi-decadal variability of the monsoon, these experiments may also be conducted over longer time periods than considered in this study, as in Xu et al. (2016). Another opportunity exists for the quantification of aerosol–cloud interactions, which were not explicitly quantified in this study. Additionally, it has been shown that monsoon intensity correlates with precipitation and wave train patterns far downstream of the Asian continent (Lau and Weng, 2002). Examining how this teleconnection's sensitivity varies with the loading of light-absorbing aerosols may shed light on the importance of pollution in affecting far-field climate.
All results can be found in the NCAR Data Sharing Service repository upon request.
The supplement related to this article is available online at: https://doi.org/10.5194/acp-19-12025-2019-supplement.
SR and CW set up and ran the simulations. XL advised on all analyses and provided financial support. WKML and YQ collaborated in conceptualization. MW helped in the analyses of dust variables. HB assisted in clarifying the overarching messages in this paper.
The authors declare that they have no conflict of interest.
This article is part of the special issue “Interactions between aerosols and the South West Asian monsoon”. It is not associated with a conference.
We thank Chun Zhao for his personal communication. We also warmly acknowledge the scientists responsible for the development and processing of aerosol reference data. MODIS data can be found at https://ladsweb.modaps.eosdis.nasa.gov/search/ (last access: 1 June 2018), MISR data can be found at https://misr.jpl.nasa.gov/getData/accessData/ (last access: 1 June 2018), and MERRA-2 data can be accessed at https://gmao.gsfc.nasa.gov/reanalysis/MERRA-2/ (last access: 1 June 2018). We also acknowledge the scientists responsible for the maintenance of the AERONET and MACv2 datasets. We also acknowledge Colin Zarzycki and Paul Ulrich for their help in setting up the VR grid. We also acknowledge the TORNERDO consortium.
This paper was edited by Armin Sorooshian and reviewed by two anonymous referees.
Chenglai Wu acknowledges funding support from the National Natural Science Foundation of China (grant no. 41830966).
Babu, S. S., Chaubey, J. P., Krishna Moorthy, K., Gogoi, M. M., Kompalli, S. K., Sreekanth, V., Bagare, S. P., Bhatt, B. C., Gaur, V. K., Prabhu, T. P., and Singh, N. S.: High altitude (∼4520 m amsl) measurements of black carbon aerosols over western trans-Himalayas: Seasonal heterogeneity and source apportionment, J. Geophys. Res.-Atmos., 116, D24201, https://doi.org/10.1029/2011JD016722, 2011.
Beegum, S. N., Moorthy, K. K., Babu, S. S., Satheesh, S. K., Vinoj, V., Badarinath, K. V. S., Safai, P. D., Devara, P. C. S., Singh, S., Vinod, Durnka, U. C., and Pant, P.: Spatial distribution of aerosol black carbon over India during pre-monsoon season, Atmos. Environ., 43, 1071–1078, https://doi.org/10.1016/j.atmosenv.2008.11.042, 2009.
Begum, B. A., Hossain, A., Nahar, N., Markwitz, A. and Hopke, P. K.: Organic and Black Carbon in PM2.5 at an Urban Site at Dhaka, Bangladesh, Aerosol Air Qual. Res., 12, 1062–1072, https://doi.org/10.4209/aaqr.2012.05.0138, 2012.
Bluestein, H.: Synoptic-Dynamic Meteorology in Midlatitudes, Oxford University Press, Oxford, New York, 1992.
Bonasoni, P., Laj, P., Marinoni, A., Sprenger, M., Angelini, F., Arduini, J., Bonafè, U., Calzolari, F., Colombo, T., Decesari, S., Di Biagio, C., di Sarra, A. G., Evangelisti, F., Duchi, R., Facchini, MC., Fuzzi, S., Gobbi, G. P., Maione, M., Panday, A., Roccato, F., Sellegri, K., Venzac, H., Verza, GP., Villani, P., Vuillermoz, E., and Cristofanelli, P.: Atmospheric Brown Clouds in the Himalayas: first two years of continuous observations at the Nepal Climate Observatory-Pyramid (5079 m), Atmos. Chem. Phys., 10, 7515–7531, https://doi.org/10.5194/acp-10-7515-2010, 2010.
Bookhagen, B. and Burbank, D. W.: Toward a complete Himalayan hydrological budget: Spatiotemporal distribution of snowmelt and rainfall and their impact on river discharge, J. Geophys. Res., 115, F03019, https://doi.org/10.1029/2009JF001426, 2010.
Boos, W. R. and Kuang, Z.: Dominant control of the South Asian monsoon by orographic insulation versus plateau heating, Nature, 463, 218–222, https://doi.org/10.1038/nature08707, 2010.
Carrico, C. M., Bergin, M. H., Shrestha, A. B., Dibb, J. E., Gomes, L., and Harris, J. M.: The importance of carbon and mineral dust to seasonal aerosol properties in the Nepal Himalaya, Atmos. Environ., 37, 2811–2824, https://doi.org/10.1016/S1352-2310(03)00197-3, 2003.
Cong, Z., Kang, S., Zhang, Y., Gao, S., Wang, Z., Liu, B., and Wan, X.: New insights into trace element wet deposition in the Himalayas: amounts, seasonal patterns, and implications, Environ. Sci. Pollut. Res., 22, 2735–2744, https://doi.org/10.1007/s11356-014-3496-1, 2015.
Das, S., Dey, S., Dash S. K., Giuliani G., and Solmon F.: Dust aerosol feedback on the Indian summer monsoon: Sensitivity to absorption property, J. Geophys. Res.-Atmos., 120, 9642–9652, https://doi.org/10.1002/2015JD023589, 2015.
Dennis, J. M., Edwards, J., Evans, K. J., Guba, O., Lauritzen, P. H., Mirin, A. A., St-Cyr, A., Taylor, M. A. and Worley, P. H.: CAM-SE: A scalable spectral element dynamical core for the Community Atmosphere Model, Int. J. High P. C., 115, 74–89, https://doi.org/10.1177/1094342011428142, 2011.
Fan, T., Liu, X., Ma, P.-L., Zhang, Q., Li, Z., Jiang, Y., Zhang, F., Zhao, C., Yang, X., Wu, F., and Wang, Y.: Emission or atmospheric processes? An attempt to attribute the source of large bias of aerosols in eastern China simulated by global climate models, Atmos. Chem. Phys., 18, 1395–1417, https://doi.org/10.5194/acp-18-1395-2018, 2018.
Flanner, M. G., Zender, C. S., Randerson, J. T., and Rasch, P. J.: Present-day climate forcing and response from black carbon in snow, J. Geophys. Res., 112, D11202, https://doi.org/10.1029/2006JD008003, 2007.
Ganguly, D., Ginoux, P., Ramaswamy, V., Winker, D. M., Holben, B. N., and Tripathi, S. N.: Retrieving the composition and concentration of aerosols over the Indo-Gangetic basin using CALIOP and AERONET data, Geophys. Res. Lett., 36, L13806, https://doi.org/10.1029/2009gl038315, 2009b.
Ghan, S. J., Liu, X., Easter, R. C., Zaveri, R., Rasch, P. J., Yoon, J.-H., and Eaton, B.: Toward a Minimal Representation of Aerosols in Climate Models: Comparative Decomposition of Aerosol Direct, Semidirect, and Indirect Radiative Forcing, J. Climate, 25, 6461–6476, https://doi.org/10.1175/JCLI-D-11-00650.1, 2012.
Hasson, S., Lucarini, V., and Pascale, S.: Hydrological cycle over South and Southeast Asian river basins as simulated by PCMDI/CMIP3 experiments, Earth Syst. Dynam., 4, 199–217, https://doi.org/10.5194/esd-4-199-2013, 2013.
He, C., Li, Q. B., Liou, K. N., Zhang, J., Qi, L., Mao, Y., Gao, M., Lu, Z., Streets, D. G., Zhang, Q., Sarin, M. M., and Ram, K.: A global 3-D CTM evaluation of black carbon in the Tibetan Plateau, Atmos. Chem. Phys., 14, 7091–7112, https://doi.org/10.5194/acp-14-7091-2014, 2014.
Holben, B., Eck, T., Slutsker, I., Tanre, D., Buis, J., Setzer, A., Vermote, E., Reagan, J., Kaufman, Y., Nakajima, T., Lavenu, F., Jankowiak, I., and Smirnov, A.: AERONET–a federated instrument network and data archive for aerosol characterization, Remote Sens. Environ., 66, 1–16, 1998.
Hsu, N. C., Gautam, R., Sayer, A. M., Bettenhausen, C., Li, C., Jeong, M. J., Tsay, S.-C., and Holben, B. N.: Global and regional trends of aerosol optical depth over land and ocean using SeaWiFS measurements from 1997 to 2010, Atmos. Chem. Phys., 12, 8037–8053, https://doi.org/10.5194/acp-12-8037-2012, 2012.
Hurrell, J. W., Hack, J. J., Shea, D., Caron, J. M., and Rosinski, J.: A new sea surface temperature and sea ice boundary dataset for the Community Atmosphere Model, J. Climate, 21, 5145–5153, https://doi.org/10.1175/2008JCLI2292.1, 2008.
Iacono, M. J., Delamere, J. S., Mlawer, E. J., Shephard, M. W., Clough, S. A., and Collins, W. D.: Radiative forcing by long-lived greenhouse gases: Calculations with the AER radiative transfer models, J. Geophys. Res.-Atmos., 113, 2–9, https://doi.org/10.1029/2008JD009944, 2008.
Jin, Q., Wei, J., Yang, Z.-L., Pu, B., and Huang, J.: Consistent response of Indian summer monsoon to Middle East dust in observations and simulations, Atmos. Chem. Phys., 15, 9897–9915, https://doi.org/10.5194/acp-15-9897-2015, 2015.
Jin, Q., Wei, J., Pu, B., Yang, Z. L., and Parajuli, S. P.: High summertime aerosol loadings over the Arabian Sea and their transport pathways, J. Geophys. Res.-Atmos., 123, 10568–10590, https://doi.org/10.1029/2018jd028588, 2018.
Koch, D.: Transport and direct radiative forcing of carbonaceous and sulfate aerosols in the GISS GCM, J. Geophys. Res.-Atmos., 106, 20311–20332, https://doi.org/10.1029/2001JD900038, 2001.
Lau, K. M. and Kim, K. M.: Comment on “`Elevated heat pump' hypothesis for the aerosol – monsoon hydroclimate link?: `Grounded' in observations??” by S. Nigam and M. Bollasina, J. Geophys. Res.-Atmos., 116, 4–7, https://doi.org/10.1029/2010JD014800, 2011.
Lau, K.-M. and Weng, H.: Recurrent Teleconnection Patterns Linking Summertime Precipitation Variability over East Asia and North America, J. Meteorol. Soc. Jpn., 80, 1309–1324, https://doi.org/10.2151/jmsj.80.1309, 2002.
Lau, W. Kim, M. K., and Kim, K. M.: Asian summer monsoon anomalies induced by aerosol direct forcing: The role of the Tibetan Plateau, Clim. Dymam., 26, 855–864, 2006.
Lau, W. K. M., Kim, M.-K., Kim, K.-M., and Lee, W.-S.: Enhanced surface warming and accelerated snow melt in the Himalayas and Tibetan Plateau induced by absorbing aerosols, Environ. Res. Lett., 5, 25204–25204, https://doi.org/10.1088/1748-9326/5/2/025204, 2010.
Lau, W. K. M., Kim, K.-M., Shi, J.-J., Matsui, T., Chin, M., Tan, Q., Peters-Lidard, C., and Tao, W. K.: Impacts of aerosol–monsoon interaction on rainfall and circulation over Northern India and the Himalaya Foothills, Clim. Dynam., 49, 1945–1960, https://doi.org/10.1007/s00382-016-3430-y, 2017.
Li, C., Chen, P., Kang, S., Yan, F., Hu, Z., Qu, B., and Sillanpää, M.: Concentrations and light absorption characteristics of carbonaceous aerosol in PM2.5 and PM10 of Lhasa city, the Tibetan Plateau, Atmos. Environ., 127, 340–346, https://doi.org/10.1016/j.atmosenv.2015.12.059, 2016.
Liu, X., Easter, R. C., Ghan, S. J., Zaveri, R., Rasch, P., Shi, X., Lamarque, J.-F., Gettelman, A., Morrison, H., Vitt, F., Conley, A., Park, S., Neale, R., Hannay, C., Ekman, A. M. L., Hess, P., Mahowald, N., Collins, W., Iacono, M. J., Bretherton, C. S., Flanner, M. G., and Mitchell, D.: Toward a minimal representation of aerosols in climate models: description and evaluation in the Community Atmosphere Model CAM5, Geosci. Model Dev., 5, 709–739, https://doi.org/10.5194/gmd-5-709-2012, 2012.
Ming, J., Cachier, H., Xiao, C., Qin, D., Kang, S., Hou, S., and Xu, J.: Black carbon record based on a shallow Himalayan ice core and its climatic implications, Atmos. Chem. Phys., 8, 1343–1352, https://doi.org/10.5194/acp-8-1343-2008, 2008.
Ming, J., Xiao, C. D., Cachier, H., Qin, D. H., Qin, X., Li, Z. Q., and Pu, J. C.: Black Carbon (BC) in the snow of glaciers in west China and its potential effects on albedos, Atmos. Res., 92, 114–123, https://doi.org/10.1016/j.atmosres.2008.09.007, 2009a.
Ming, J., Xiao, C., Du, Z., and Flanner, M. G.,: Black carbon in snow/ice of west China and its radiave forcing, Adv. Climate Change Res., 5, 328–35, 2009b (in Chinese with English abstract).
Ming, J., Xiao, C. D., Sun, J. Y., Kang, S. C., and Bonasoni, P.: Carbonaceous particles in the atmosphere and precipitation of the Nam Co region, central Tibet, J. Environ. Sci.-China, 22, 1748–1756, https://doi.org/10.1016/S1001-0742(09)60315-6, 2010.
Ming, J., Du, Z. C., Xiao, C. D., Xu, X. B., and Zhang, D. Q.: Darkening of the mid-Himalaya glaciers since 2000 and the potential causes, Environ. Res. Lett., 7, 014021, https://doi.org/10.1088/1748-9326/7/1/014021, 2012.
Ming, J., Xiao, C. D., Du, Z. C., and Yang, X. G.: An overview of black carbon deposition in High Asia glaciers and its impacts on radiation balance, Adv. Water Res., 55, 80–87, https://doi.org/10.1016/j.advwatres.2012.05.015, 2013.
MISR Science Team: Terra/MISR Level 3, Component Global Aerosol Monthly NetCDF, version 4, Hampton, VA, USA: NASA Atmospheric Science Data Center (ASDC), Accessed 555 AOD from 2002 to 2014, https://doi.org/10.5067/Terra/MISR/MIL3MAEN_L3.004, 2015.
Morrison, H. and Gettelman, A.: A New Two-Moment Bulk Stratiform Cloud Microphysics Scheme in the Community Atmosphere Model, Version 3 (CAM3). Part I: Description and Numerical Tests, J. Climate, 21, 3642–3659, https://doi.org/10.1175/2008JCLI2105.1, 2008.
Nair, V. S., Solmon, F., Giorgi, F., Mariotti, L., Babu, S. S., and Moorthy, K. K.: Simulation of South Asian aerosols for regional climate studies, J. Geophys. Res.-Atmos., 117, D04209, https://doi.org/10.1029/2011JD016711, 2012.
Neale, R. B., Richter, J. H., Conley, A. J., Park, S., Lauritzen, P. H., Gettelman, A., Williamson, D. L., Rasch, P. J., Vavrus, S. J., Taylor, M. A., Collins, W. D., Zhang, M., and Lin, S.-J.: Description of the NCAR Community Atmosphere Model (CAM5) (NCAR Tech. Note. NCAR/TN-485+STR). Boulder, CO: National Center for Atmospheric Research, 2010.
Painter, T. H., Deems, J. S., Belnap, J., Hamlet, A. F., Landry, C. C., and Udall, B.: Response of Colorado River runoff to dust radiative forcing in snow, P. Natl. Acad. Sci. USA, 107, 17125–17130, https://doi.org/10.1073/pnas.0913139107, 2010.
Painter, T. H., Skiles, S. M., Deems, J. S., Bryant, A. C., and Landry, C. C.: Dust radiative forcing in snow of the Upper Colorado River Basin: 1. A 6 year record of energy balance, radiation, and dust concentrations, Water Resour. Res., 48, 1–14, https://doi.org/10.1029/2012WR011985, 2012.
Park, S. and Bretherton, C. S.: The University of Washington Shallow Convection and Moist Turbulence Schemes and Their Impact on Climate Simulations with the Community Atmosphere Model, J. Climate, 22, 3449–3469, https://doi.org/10.1175/2008JCLI2557.1, 2009.
Pathak, B., Kalita, G., Bhuyan, K., Bhuyan, P. K., and Moorthy, K. K.: Aerosol temporal characteristics and its impact on shortwave radiative forcing at a location in the northeast of India, J. Geophys. Res.-Atmos., 115, D19204, https://doi.org/10.1029/2009jd013462, 2010.
Platnick, S., Hubanks, S. P., Meyer, K., and King, M. D.: MODIS Atmosphere L3 Monthly Product, NASA MODIS Adaptive Processing System, Goddard Space Flight Center, USA, https://doi.org/10.5067/MODIS/MOD08_M3.006, 2015.
Qian, Y., Gustafson, W. I., Leung, L. R., and Ghan, S. J.: Effects of soot-induced snow albedo change on snowpack and hydrological cycle in western United States based on weather research and forecasting chemistry and regional climate simulations, J. Geophys. Res.-Atmos., 114, 1–19, https://doi.org/10.1029/2008JD011039, 2009.
Qian, Y., Flanner, M. G., Leung, L. R., and Wang, W.: Sensitivity studies on the impacts of Tibetan Plateau snowpack pollution on the Asian hydrological cycle and monsoon climate, Atmos. Chem. Phys., 11, 1929–1948, https://doi.org/10.5194/acp-11-1929-2011, 2011.
Qian Y., Yasunari, T. J., Doherty, S. J., Flanner, M. G., Lau, W. K., Ming, J., and Wang, H., and Wang, M.: Light-absorbing Particles in Snow and Ice: Measurement and Modeling of Climatic and Hydrological Impact, Adv. Atmos. Sci., 32, 64–91, https://doi.org/10.1007/s00376-014-0010-0, 2015.
Qu, W. J., Zhang, X. Y., Arimoto, R., Wang, D., Wang, Y. Q., Yan, L. W., and Li, Y.: Chemical composition of the background aerosol at two sites in southwestern and northwestern China: potential influences of regional transport, Tellus B, 60, 657–673, https://doi.org/10.1111/j.1600-0889.2008.00342.x, 2008
Quinn, P. K., Bates, T. S., Baum, E., Doubleday, N., Fiore, A. M., Flanner, M., Fridlind, A., Garrett, T. J., Koch, D., Menon, S., Shindell, D., Stohl, A., and Warren, S. G.: Short-lived pollutants in the Arctic: their climate impact and possible mitigation strategies, Atmos. Chem. Phys., 8, 1723–1735, https://doi.org/10.5194/acp-8-1723-2008, 2008.
Rahimi, S. R., Wu, C., Liu, X., and Brown, H.: Exploring a Variable-Resolution Approach for Simulating Regional Climate Over the Tibetan Plateau Using VR-CESM, J. Geophys. Res.-Atmos., 124, 4490–4513, https://doi.org/10.1029/2018JD028925, 2019.
Ram, K., Sarin, M. M., and Hegde, P.: Long-term record of aerosol optical properties and chemical composition from a high-altitude site (Manora Peak) in Central Himalaya, Atmos. Chem. Phys., 10, 11791–11803, https://doi.org/10.5194/acp-10-11791-2010, 2010a.
Ram, K., Sarin, M. M., and Tripathi, S. N.: A 1 year record of carbonaceous aerosols from an urban site in the Indo-Gangetic Plain: Characterization, sources, and temporal variability, J. Geophys. Res.-Atmos., 115, D24313, https://doi.org/10.1029/2010jd014188, 2010b.
Richter, J. H. and Rasch, P. J.: Effects of Convective Momentum Transport on the Atmospheric Circulation in the Community Atmosphere Model, Version 3, J. Climate, 21, 1487–1499, https://doi.org/10.1175/2007JCLI1789.1, 2008.
Safai, P. D., Raju, M. P., Budhavant, K. B., Rao, P. S. P., and Devara, P. C. S.: Long term studies on characteristics of black carbon aerosols over a tropical urban station Pune, India, Atmos. Res., 132–133, 173–184, https://doi.org/10.1016/j.atmosres.2013.05.002, 2013.
Seinfeld, J. H., Carmichael, G. R., Arimoto, R., Conant, W. C., Brechtel, F. J., Bates, T. S., Cahill, T. A., Clarke, A. D., Doherty, S. J., Flatau, P. J., Huebert, B. J., Kim, J., Markowicz, K. M., Quinn, P. K., Russell, L. M., Russell, P. B., Shimizu, A., Shinozuka, Y., Song, C. H., Tang, Y., Uno, I., Vogelmann, A. M., Weber, R. J., Woo, J.-H., and Zhang, X. Y.: ACE-ASIA: Regional Climatic and Atmospheric Chemical Effects of Asian Dust and Pollution, B. Am. Meteorol. Soc., 85, 367–380, https://doi.org/10.1175/BAMS-85-3-367, 2004.
Stevens, B., Fiedler, S., Kinne, S., Peters, K., Rast, S., Müsse, J., Smith, S. J., and Mauritsen, T.: MACv2-SP: a parameterization of anthropogenic aerosol optical properties and an associated Twomey effect for use in CMIP6, Geosci. Model Dev., 10, 433–452, https://doi.org/10.5194/gmd-10-433-2017, 2017
Vinoj, V., Rasch, P., Wang, H., Yoon, J-H., Ma, P.-L., Landu, K., and Singh, B.: Short term modulation of Indian summer monsoon rainfall by West Asian dust, Nat. Geosci., 7, 308–313, 2014.
Wan, X., Kang, S., Wang, Y., Xin, J., Liu, B., Guo, Y., Wen, T., Zhang, G., and Cong, Z.: Size distribution of carbonaceous aerosols at a high-altitude site on the central Tibetan Plateau (Nam Co Station, 4730 m a.s.l.), Atmos. Res., 153, 155–164, https://doi.org/10.1016/j.atmosres.2014.08.008, 2015.
Wang, M., Xu, B., Wang, N., Cao, J., Tie, X., Wang, H., Zhu, C., and Yang, W.: Two distinct patterns of seasonal variation of airborne black carbon over Tibetan Plateau, Sci. Total Environ., 573, 1041–1052, https://doi.org/10.1016/j.scitotenv.2016.08.184, 2016.
Wang, Z., Lin, L., Yang, M., Xu, Y., and Li, J.: Disentangling fast and slow responses of the East Asian summer monsoon to reflecting and absorbing aerosol forcings, Atmos. Chem. Phys., 17, 11075–11088, https://doi.org/10.5194/acp-17-11075-2017, 2017.
Wu, C., Liu, X., Lin, Z., Rahimi-Esfarjani, S. R., and Lu, Z.: Impacts of absorbing aerosol deposition on snowpack and hydrologic cycle in the Rocky Mountain region based on variable-resolution CESM (VR-CESM) simulations, Atmos. Chem. Phys., 18, 511–533, https://doi.org/10.5194/acp-18-511-2018, 2018.
Wu, G., Duan, A., Liu, Y., Mao, J., Ren, R., Bao, Q., He, B., Liu, B., and Hu, W.: Tibetan Plateau climate dynamics: recent research progress and outlook, Natl. Sci. Rev., 2, 100–116, https://doi.org/10.1093/nsr/nwu045, 2015.
Xu, B., Yao, T., Liu, X., and Wang, N.: Elemental and organic car- bon measurements with a two-step heating-gas chromatography system in snow samples from the Tibetan plateau, Ann. Glaciol., 43, 257–262, https://doi.org/10.3189/172756406781812122, 2006.
Xu, B. Q., Cao, J. J., Hansen, J., Yao, T. D., Joswia, D. R., Wang, N. L., Wu, G. J., Wang, M., Zhao, H. B., Yang, W., Liu, X. Q., and He, J. Q.: Black soot and the survival of Tibetan glaciers, P. Natl. Acad. Sci. USA, 106, 22114–22118, https://doi.org/10.1073/pnas.0910444106, 2009.
Xu, Y. and Xie, S.-P.: Ocean mediation of tropospheric response to reflecting and absorbing aerosols, Atmos. Chem. Phys., 15, 5827–5833, https://doi.org/10.5194/acp-15-5827-2015, 2015.
Xu, Y., Ramanathan, V., and Washington, W. M.: Observed high-altitude warming and snow cover retreat over Tibet and the Himalayas enhanced by black carbon aerosols, Atmos. Chem. Phys., 16, 1303–1315, https://doi.org/10.5194/acp-16-1303-2016, 2016.
Yang, J., Kang, S., Ji, Z., and Chen, D.: Modeling the Origin of Anthropogenic Black Carbon and Its Climatic Effect Over the Tibetan Plateau and Surrounding Regions, J. Geophys. Res.-Atmos., 123, 671–692, https://doi.org/10.1002/2017JD027282, 2018.
Zarzycki, C. M., Jablonowski, C. and Taylor, M. A.: Using Variable-Resolution Meshes to Model Tropical Cyclones in the Community Atmosphere Model, Mon. Weather Rev., 142, 1221–1239, https://doi.org/10.1175/MWR-D-13-00179.1, 2013.
Zhang, G. J. and McFarlane, N. A.: Sensitivity of climate simulations to the parameterization of cumulus convection in the Canadian climate centre general circulation model, Atmos. Ocean, 33, 407–446, https://doi.org/10.1080/07055900.1995.9649539, 1995.
Zhang, X. Y., Wang, Y. Q., Zhang, X. C., Guo, W., and Gong, S. L.: Carbonaceous aerosol composition over various regions of China during 2006, J. Geophys. Res.-Atmos., 113, D14111, https://doi.org/10.1029/2007jd009525, 2008.
Zhao, C., Liu, X., Ruby Leung, L., and Hagos, S.: Radiative impact of mineral dust on monsoon precipitation variability over West Africa, Atmos. Chem. Phys., 11, 1879–1893, https://doi.org/10.5194/acp-11-1879-2011, 2011.
Zhao, C., Hu, Z., Qian, Y., Ruby Leung, L., Huang, J., Huang, M., Jin, J., Flanner, M. G., Zhang, R., Wang, H., Yan, H., Lu, Z., and Streets, D. G.: Simulating black carbon and dust and their radiative forcing in seasonal snow: a case study over North China with field campaign measurements, Atmos. Chem. Phys., 14, 11475–11491, https://doi.org/10.5194/acp-14-11475-2014, 2014.
Zhao, Y., Nielsen, C. P., Lei, Y., McElroy, M. B., and Hao, J.: Quantifying the uncertainties of a bottom-up emission inventory of anthropogenic atmospheric pollutants in China, Atmos. Chem. Phys., 11, 2295–2308, https://doi.org/10.5194/acp-11-2295-2011, 2011.
Zhao, Z., Cao, J., Shen, Z., Huang, R.-J., Hu, T., Wang, P., Zhang, T., and Liu, S.: Chemical composition of PM2.5 at a high–altitude regional background site over Northeast of Tibet Plateau, Atmos. Pollut. Res., 6, 815–823, https://doi.org/10.5094/APR.2015.090, 2015.
Zhao, Z., Wang, Q., Xu, B., Shen, Z., Huang, R., Zhu, C., Su, X., Zhao, S., Long, X., Liu, S., and Cao, J.: Black carbon aerosol and its radiative impact at a high-altitude remote site on the southeastern Tibet Plateau: Black Carbon and Its Radiative Impact, J. Geophys. Res.-Atmos., 122, 5515–5530, https://doi.org/10.1002/2016JD026032, 2017.
- Abstract
- Introduction
- Model
- Evaluation of simulated aerosols
- Climatic effects of BC and dust
- Nature of the simulated changes
- Summary and conclusions
- Data availability
- Author contributions
- Competing interests
- Special issue statement
- Acknowledgements
- Review statement
- Financial support
- References
- Supplement