the Creative Commons Attribution 4.0 License.
the Creative Commons Attribution 4.0 License.
 | 25 Sep 2019
Plant assemblages in atmospheric deposition
Ke Dong
Cheolwoon Woo
Plants disperse spores, pollen, and fragments into the atmosphere. The emitted plant particles return to the pedosphere by sedimentation (dry deposition) and/or by precipitation (wet deposition) and constitute part of the global cycle of substances. However, little is known regarding the taxonomic diversities and flux densities of plant particles deposited from the atmosphere. Here, plant assemblages were examined in atmospheric deposits collected in Seoul in South Korea. A custom-made automatic sampler was used to collect dry and wet deposition samples for which plant assemblages and quantities were determined using high-throughput sequencing and quantitative polymerase chain reaction (PCR) with universal plant-specific primers targeting the internal transcribed spacer 2 (ITS2) region. Dry deposition was dominant for atmospheric deposition of plant particles (87 %). The remaining 13 % was deposited by precipitation, i.e., wet deposition, via rainout (in-cloud scavenging) and/or washout (below-cloud scavenging). Plant assemblage structures did not differ significantly between dry and wet deposition, indicating a possibility that washout, which is possibly taxon-independent, predominated rainout, which is possibly taxon-dependent, for wet deposition of atmospheric plant particles. A small number of plant genera were detected only in wet deposition, indicating that they might be specifically involved in precipitation through acting as nucleation sites in the atmosphere. Future interannual monitoring will control for the seasonality of atmospheric plant assemblages observed at our sampling site. Future global monitoring is also proposed to investigate geographical differences and investigate whether endemic species are involved in plant-mediated bioprecipitation in regional ecological systems.
- Article
(2829 KB) - Full-text XML
-
Supplement
(474 KB) - BibTeX
- EndNote


Approximately 374 000 plant species have been identified worldwide (Christenhusz and Byng, 2016), many of which release spores, pollen, and plant fragments into the global atmosphere. An estimated 47–84 Tg of plant particles are released into the environment each year (Després et al., 2012; Hoose et al., 2010; Jacobson and Streets, 2009), where they have impacts at local and global levels. For example, inhalation of allergenic pollen can induce IgE-mediated hypersensitive reactions in sensitized individuals (D'Amato et al., 2007). Globally, atmospheric pollen influences climate by reflecting and absorbing solar and terrestrial radiation (Spänkuch et al., 2000; Guyon et al., 2004), and/or by serving as ice nuclei (IN) and cloud condensation nuclei (CCN) (Pöschl et al., 2010; Pope, 2010). Finally, atmospheric pollen is involved in global cycling of substances (Després et al., 2012) by long-range transport and subsequent settlement to the planetary surface (pedosphere) by dry or wet deposition, i.e., sedimentation or precipitation, respectively.
Particle size influences the atmospheric processes experienced by airborne particles. Pollen grains are large in size (10–100 µm) compared with other biological particles such as viruses (0.02–0.3 µm), bacteria (0.3–10 µm), or fungal spores (0.5–30 µm) (Hinds, 1999; Jacobson and Morris, 1976). Pollen grains are thus more influenced by gravity than smaller particles and tend to settle rapidly (Aylor, 2002; Di-Giovanni et al., 1995). Large particles such as pollen grains serve as giant CCN (GCCN) that can efficiently collide and scavenge smaller droplets when settling from the atmosphere (Johnson, 1982; Möhler et al., 2007; Pope, 2010). Atmospheric pollen grains contribute to the formation and growth of cloud droplets and precipitation, and thereby influence the global hydrological cycle (Després et al., 2012; Pope, 2010).
Dry and wet deposition processes are analyzed using different methods. Gravitational methods are used to quantify dry deposition of airborne pollen because of their rapid deposition velocities (Durham, 1946b; Yamamoto et al., 2015; Gong et al., 2017; Watanabe and Ohizumi, 2018), and volumetric methods are used to quantify amounts of pollen per unit volume of air (Hirst, 1952; Núñez et al., 2017; Leontidou et al., 2018; Monroy-Colín et al., 2018). Precipitation (rain and snow) is analyzed for wet deposition of plant-associated materials such as phosphorus (Doskey and Ugoagwu, 1989) and organic carbon compounds from the atmosphere (Noll and Khalili, 1990; Mullaugh et al., 2014). However, pollen identification in the majority of aero-palynological studies is based on micromorphological characteristics (Levetin, 2004), which are subjective and limited in their resolving power. Recent studies have used DNA-based methods for accurate characterization of pollen diversity and assemblages in the atmosphere (Leontidou et al., 2018; Núñez et al., 2017).
Several studies have examined the emission of biological particles, including pollen, into the global atmosphere (Hoose et al., 2010; Jacobson and Streets, 2009; Elbert et al., 2007; Heald and Spracklen, 2009). Particle emission and deposition are balanced at the global level, and deposition can be used as a surrogate measure of particle emission, yet relatively few studies examining particle deposition have been conducted. Despite their quantitative advantages, DNA-based techniques are not widely used for characterizing atmospheric pollen deposition, particularly where simultaneous sampling of wet and dry deposition is used.
Our previous research showed that fungal assemblages differed significantly between wet and dry deposits, indicating taxon-specific involvement of fungi in precipitation (Woo et al., 2018), and we wished to determine whether plant assemblages displayed similar specificities. In this study, molecular techniques were used to compare the taxonomic compositions and flux densities of plant particles in wet and dry atmospheric deposits. Additionally, we analyzed how allergy-related genera were deposited and removed from the atmosphere. This study gives insights into how plant communities are involved in the cycling of substances through release of airborne particles such as pollen, spores, and fragments into the atmosphere.
2.1 Air and deposition sampling
Previously collected samples (Woo et al., 2018) were used for this study. Briefly, air and deposition samples were collected on the roof (approximately 20 m a.g.l.) of a building at an altitude of 105 m a.s.l. in a semi-urban mountainous forested area in the outskirts of the megacity of Seoul in South Korea (37∘27′55.0′′ N, 126∘57′17.7′′E). The highest peak (632 m) at which sparse trees exist was situated in the south-southeast of the sampling site at a horizontal distance of ca. 2.3 km (Fig. S1 in the Supplement). In addition to biological particles released from the local forested area, the site experiences the influence of abiotic pollutants released from large populated areas in Seoul (Lee, 2014). The sampling point was situated in a humid, continental, subtropical climate zone, according to Köppen climate classification. Approximately 4000 species of spermatophytes (seed plants) inhabit South Korea (Korea National Arboretum, 2017), among which 1048 and 1500 species have been listed by the Korea National Arboretum (2017) and the Korea Research Institute of Bioscience and Biotechnology (2016), respectively. Samples were collected over 1 month periods during May to November 2015, with the exception of air sampling in August, which failed due to a severe rain event. A custom-made automatic dry and wet deposition sampler was used to collect atmospheric deposition, while an eight-stage Andersen sampler (AN-200; Sibata Scientific Technology Ltd, Tokyo, Japan) was co-located to volumetrically collect plant particles in the atmosphere. The deposition and Andersen samplers were placed distant enough to avoid the interference, with the approximate horizontal distance of 2.5 m and vertical distance of 2.3 m (Fig. S2). The configuration of the dry deposition sampler is identical to that reported by Yi et al. (1997), while the configuration of the wet deposition sampler is similar to that reported by Landis and Keeler (1997). The substrate placed onto each stage of the Andersen sampler was rotated once every week to prevent particle overloading at the same spot under each impactor nozzle. Substrates from the Andersen sampler were analyzed using three impactor stages corresponding to particles with aerodynamic diameters (da) of 4.7–7.0, 7.0–11, and >11 µm. The majority of plant DNA was detected from da>11 µm since pollen grains are large in size (10–100 µm). However, the stages for da=4.7–7.0 and 7.0–11 µm were also analyzed to detect remnant DNA that was not collected at the stage of da>11 µm due to inadequate sharpness of the particle collection efficiency curve of the impactor. Substrates loaded on the remaining stages were not analyzed due to difficulty in PCR amplification. Deposition sampling was conducted in duplicate, but PCR amplification was not possible in three of the seven dry deposition samples. In total, 18 air samples (6 months, three sizes), 11 dry deposition samples (7 months in duplicate, but 3 unsuccessful), and 14 wet deposition samples (7 months in duplicate) were amplified and subjected to DNA sequence analysis (Table S1 in the Supplement).
2.1.1 DNA sequencing
DNA extraction was performed as described previously (Woo et al., 2018). The internal transcribed spacer 2 (ITS2) region was amplified using universal plant-specific primers ITS-p3 and ITS-u4 (Cheng et al., 2016) with adapter sequences for Illumina MiSeq. PCR reaction mixtures (50 µL) contained 1 µL of extracted DNA, 0.4 µM of each primer, 0.2 µM of each dNTP, 1× reaction buffer, and 1.25 U of Solg™ Taq DNA Polymerase (SolGent Co., Ltd., Seoul, Korea). Amplifications were performed using a T100™ thermal cycler (Bio-Rad Laboratories, Inc., Hercules, CA, USA) with the following thermal cycle: 10 min at 94 ∘C (initial denaturation); 34 cycles of 30 s at 94 ∘C, 40 s at 55 ∘C, and 60 s at 72 ∘C; and 10 min at 72 ∘C (final extension). The resultant amplicons were indexed using a Nextera XT Index kit (Illumina, Inc., San Diego, CA, USA) with the following thermal cycle: 3 min at 95 ∘C (initial denaturation); eight cycles of 30 s at 95 ∘C, 30 s at 55 ∘C, and 30 s at 72 ∘C; and 5 min at 72 ∘C (final extension). The indexed amplicons were purified using AMPure XP beads (Beckman Coulter, Inc., Brea, CA, USA), normalized to 4 nM with 10 mM tris-HCl (pH 8.5), and pooled with 30 % internal control PhiX. Heat-denatured pooled amplicons were loaded onto a V3 600 Cycle-Kit reagent cartridge for 2×300 bp sequencing by Illumina MiSeq.
2.2 DNA sequence processing and analyses
Raw sequence reads were demultiplexed and trimmed for reads with a quality score <20 using MiSeq Reporter v2.5 (Illumina). Assembly, quality check, and taxonomic assignment of sequence reads were performed using USEARCH v.11.0.667 (Edgar, 2010). Low-quality reads with >1.0 expected errors were removed, and joined reads of <200 bp were further excluded. Unique sequences were identified using default USEARCH settings. The UPARSE algorithm was used to remove chimeric reads, and the remaining reads were clustered into operational taxonomic units (OTUs) at 97 % sequence similarity (Núñez et al., 2017; Cornman et al., 2015). Our usage of 97 % as a threshold was operational since there is no consensus threshold available for plant internal transcribed spacer (ITS) although Cornman et al. (2015) reported that most plant species were represented by multiple OTUs of ITS at 97 % similarity, suggesting that most plant species are identifiable based on OTU clustering at 97 % similarity. Nonetheless, we restricted our analyses only down to the genus level to prevent from possible species-level misidentifications. In total, 1 261 572 reads from 43 libraries were mapped onto 97 % OTUs (Table S1). Taxonomic assignment was performed using the SINTAX algorithm with a cutoff value of 0.5 (Edgar, 2018) against the ITS2 database (Sickel et al., 2015; Ankenbrand et al., 2015). P tests were performed using mothur v.1.39.5 (Schloss et al., 2009) to compare taxonomic structures. Reproducibility of assemblage structures was assessed based on biologically duplicated deposition measurements, with a statistical significance observed across the samples, but not within each sample (P test, ParScore = 12, p<0.01) (Fig. S3a). For α-diversity analyses, 6142 reads were randomly subsampled from each library. The rarefaction curves appeared to reach asymptotes or near asymptotes (Fig. S4), indicating that the sequencing depth was adequate for taxonomic richness estimation of the analyzed samples.
2.3 Quantitative PCR
Quantitative PCR (qPCR) was performed using universal plant primers ITS-p3 and ITS-u4 (Cheng et al., 2016) to quantify total copy numbers (CNs) of the ITS2 region. Reaction mixtures (20 µL) contained 1× Fast SYBR Green Master Mix reagent (Thermo Fisher Scientific, Waltham, MA, USA), 10 µm of each primer, and 1 µL of extracted DNA. The qPCR reactions were conducted in triplicate using a QuantStudio™ 6 Flex Real-time PCR system (Applied Biosystems, Waltham, MA, USA) with the following thermal cycle: initial denaturation for 10 min at 95 ∘C followed by 40 cycles of 15 s at 95 ∘C and 60 s at 60 ∘C. Calibration curves were generated using serial dilutions of a known concentration of PCR amplicons from a synthesized template containing an Arabidopsis thaliana ITS2 sequence (Unfried and Gruendler, 1990). The synthesized template was amplified with the primers ITS-p3 and ITS-u4 and quantitated using a DS-11 FX spectrophotometer–fluorometer (DeNovix, Wilmington, DE, USA). Inhibition was considered as described previously (Hospodsky et al., 2010), and no inhibition was observed. As previously described (Hospodsky et al., 2010), DNA extraction efficiency was estimated at 10 % when reporting pollen quantities. The qPCR measurements were confirmed to be biologically reproducible with a cumulative coefficient of variation of 62 % on an arithmetic scale (Fig. S3b).
2.4 Calculations
Taxon-specific plant quantity was estimated by multiplying the DNA sequencing-derived relative abundance of each taxon by the total plant quantity by the universal plant-specific qPCR, as previously described (Yamamoto et al., 2014; Dannemiller et al., 2014; An et al., 2018). The calculated genus-level deposition flux densities were confirmed to be biologically reproducible with a cumulative coefficient of variation of 91 % on an arithmetic scale (Fig. S3c). The annual dry deposition velocity (Vd) was estimated for each plant taxon according to the following equation (Mariraj Mohan, 2016):
where Nj,i is the airborne plant concentration (CN m−3) in the ith particle size interval of the jth sampling month measured by the Andersen sampler, and Fj is the flux density of dry deposition (CN cm−2 month−1) measured for the jth month by the dry deposition sampler. In this calculation, the units were converted from month to second, and from meters to centimeters, if necessary, in order to provide Vd in centimeters per second. August 2015 data were excluded as air sampling failed.
3.1 Particle concentrations in air
Air and surface deposit samples were collected in Seoul in South Korea. From 18 air sample libraries, 552 074 high-quality ITS2 sequence reads were obtained and mapped onto 97 % OTUs (Table S1). The α-diversity measures of plant assemblages in air samples are listed in Table S2. Approximately 96 % of sequences belonged to Streptophyta, a plant superdivision that includes terrestrial plants. The remaining 4 % of the sequences belonged to Chlorophyta, which comprises aquatic organisms such as green microalgae (e.g., Trebouxiophyceae).
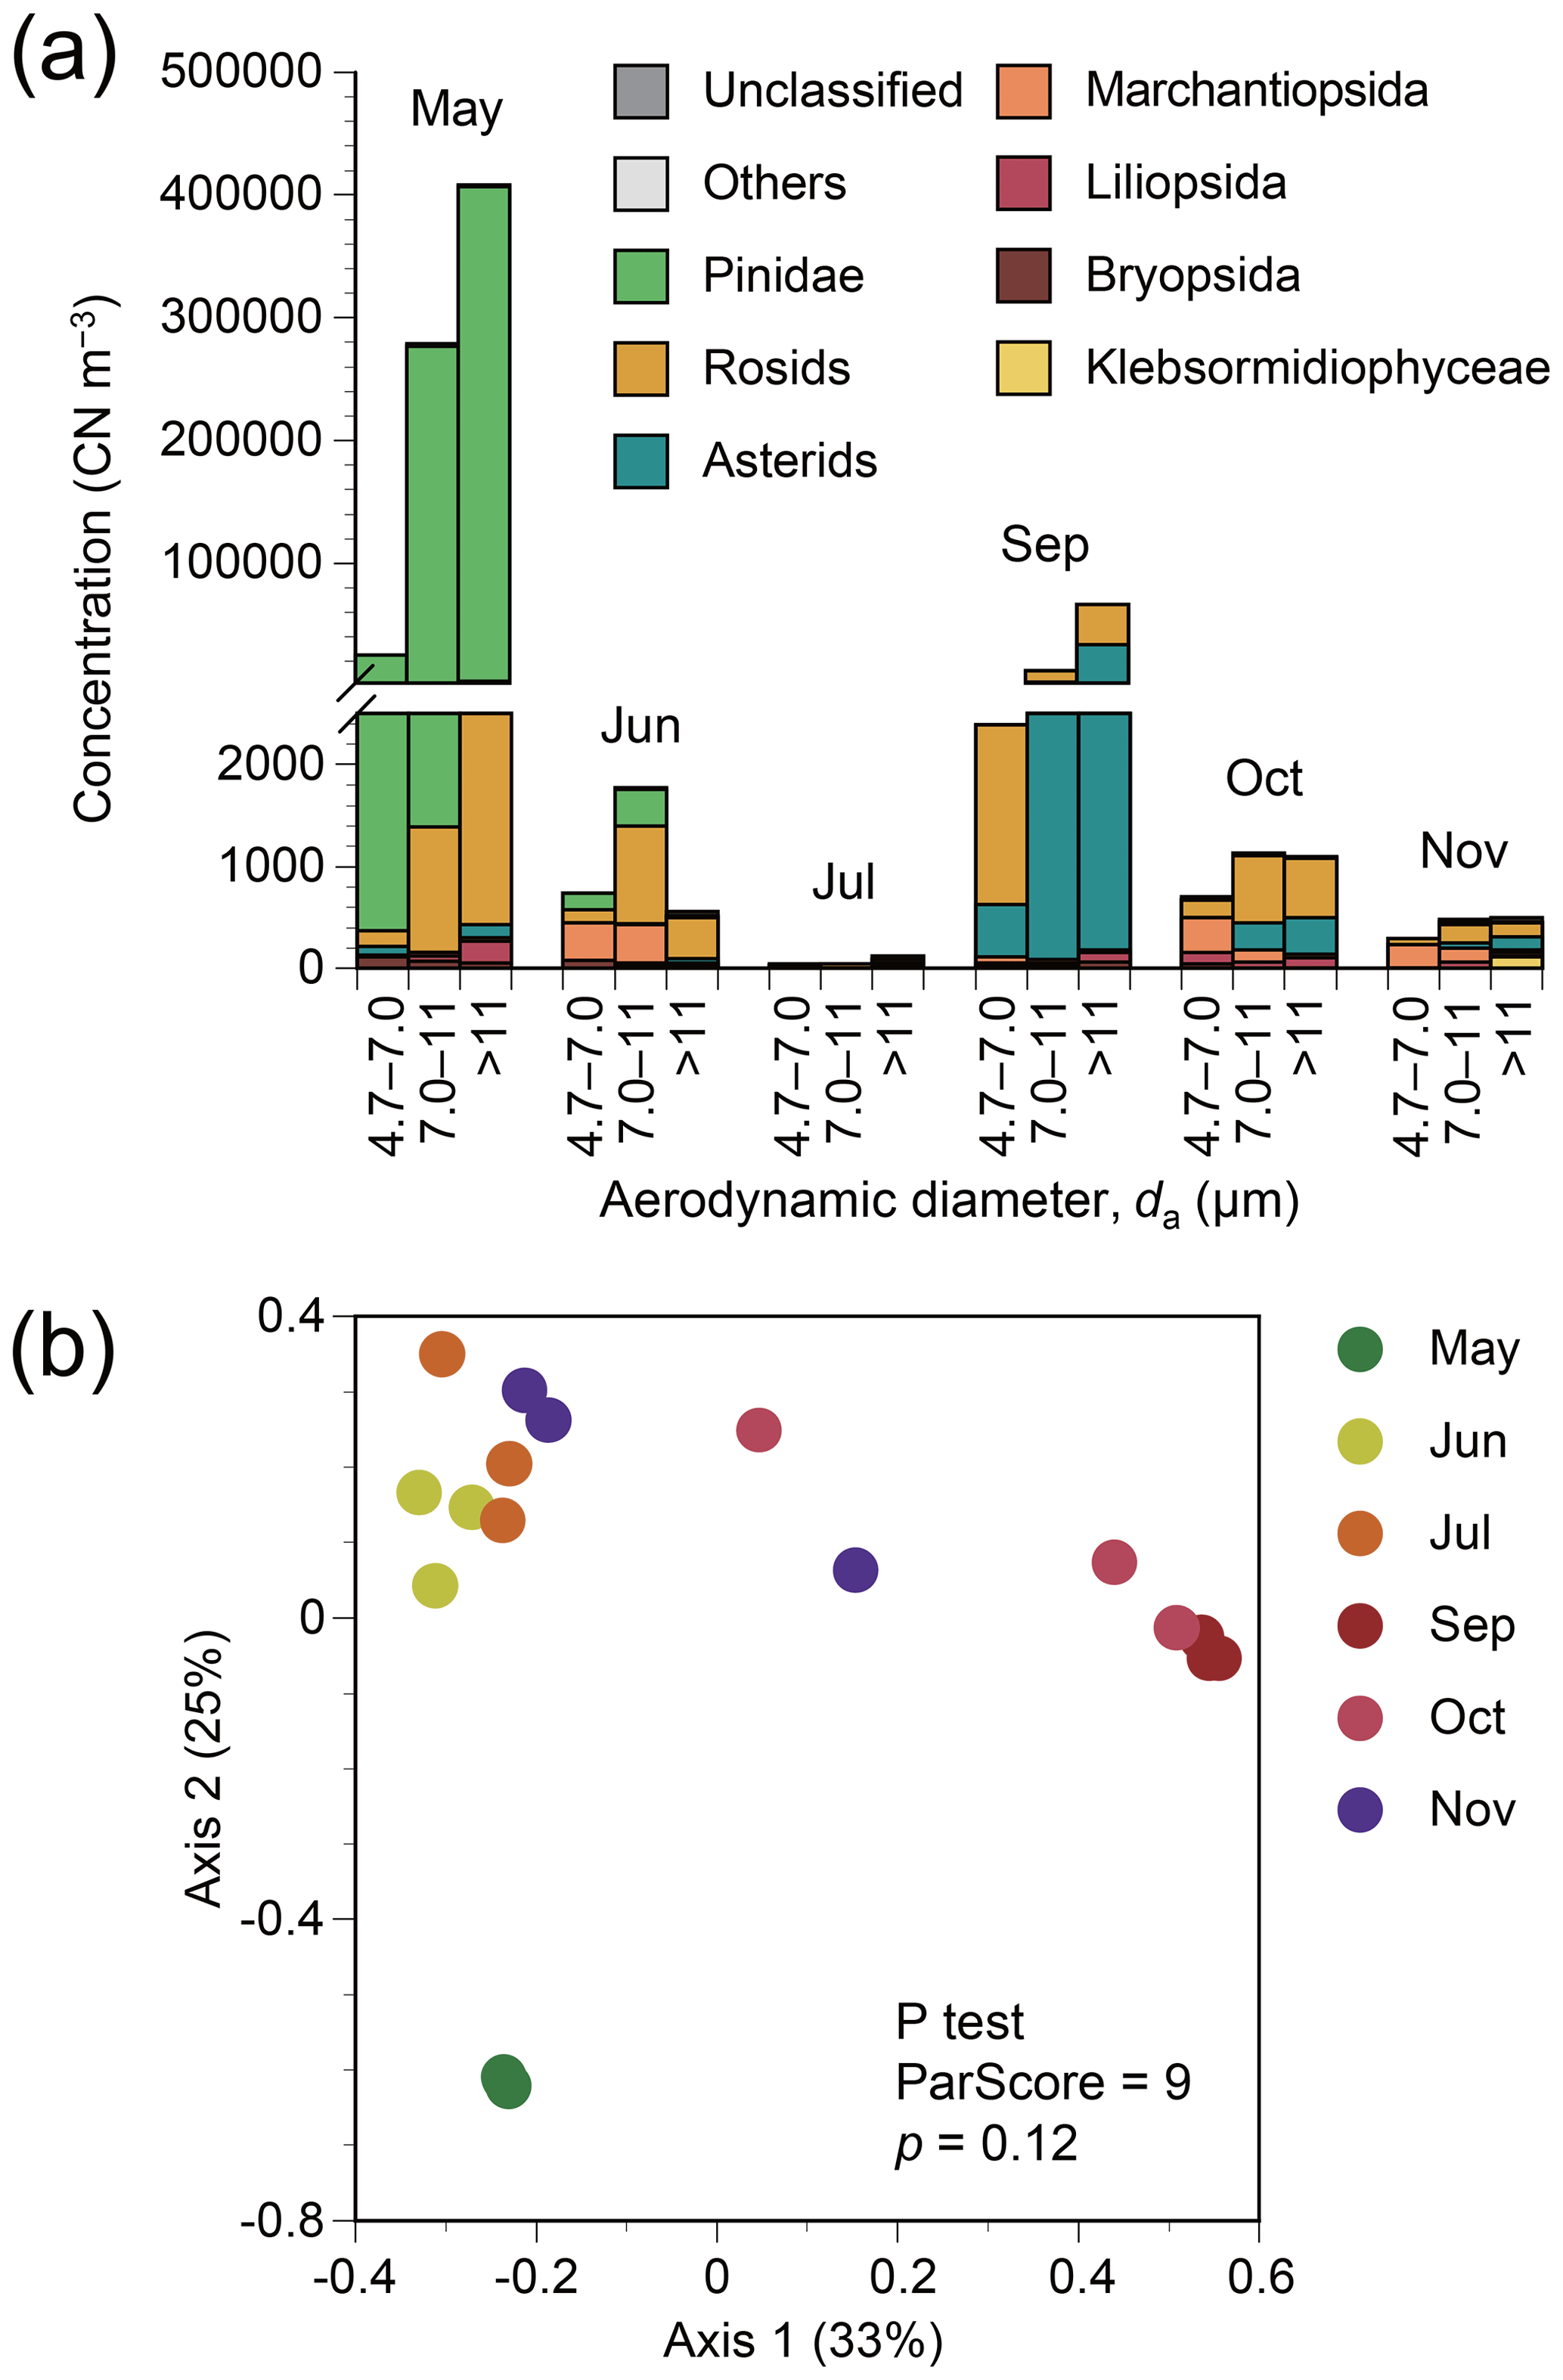
Figure 1(a) Particle size-resolved concentrations based on plant classes or clades in terms of copy number (CN) of ITS2 from atmospheric samples from Seoul in South Korea. Monthly results from May to November 2015 are shown, except for August when air sampling failed. The data shown are obtained by multiplication of DNA sequencing-derived relative abundance of each family by a total plant concentration measured by the universal plant-specific qPCR assay. (b) Principal coordinate analysis plot for plant assemblage structures based on Bray–Curtis distance. The data shown are based on DNA sequencing.
The annual mean particle size-integrated concentration of all plant taxa was 133 500 CN m−3. The three most dominant classes or clades found in air samples were Pinidae, rosids, and asterids (Fig. 1a), with respective annual mean concentrations of 117 400, 8600, and 6400 CN m−3 based on the number of ITS2 copies. Taxonomic structures varied with season, albeit not significantly (P test, ParScore = 9, p=0.12) (Fig. 1b). The highest particle concentrations for Pinidae were observed in May, whilst for asterids, the highest concentration was observed in September (Fig. 1a).
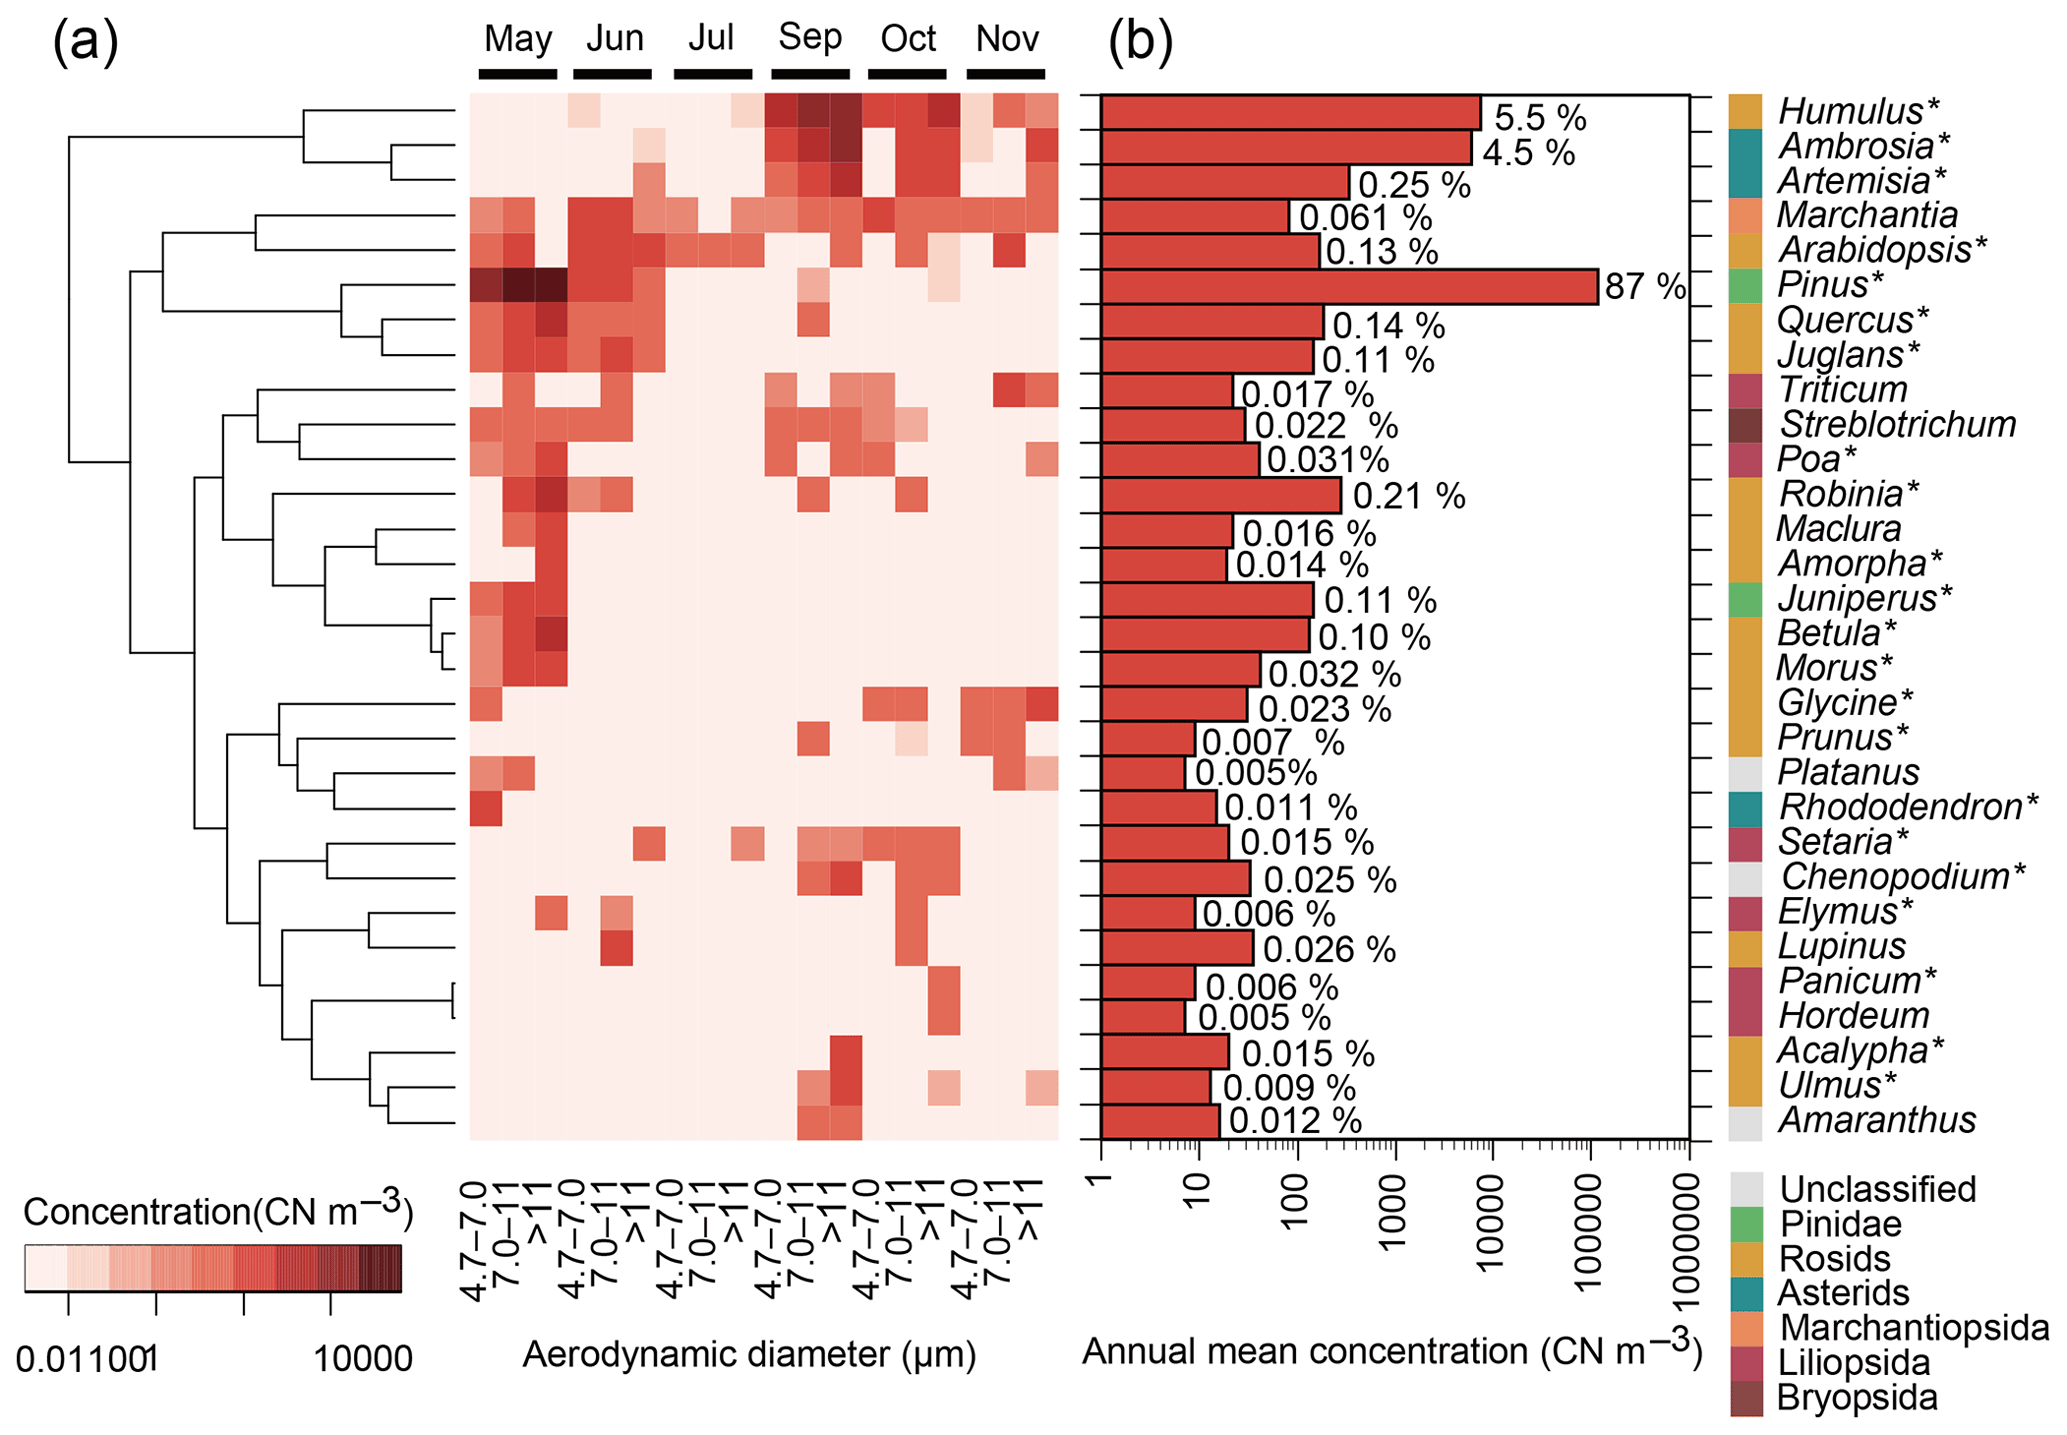
Figure 2The 30 most abundant plant genera in terms of ITS2 copy number (CN) in atmospheric samples from Seoul in South Korea. Asterisks (∗) indicate spermatophyte genera that are known to inhabit South Korea and that are listed in the databases of the Korea National Arboretum (2017) and/or the Korea Research Institute of Bioscience and Biotechnology (2016). (a) Monthly particle size-resolved concentrations from May to November 2015 are shown, except for August when air sampling failed. The tree represents the similarities, based on Euclidean distance, of the log-transformed concentrations. (b) Annual mean particle size-integrated concentrations. Percentage values indicate relative contributions.
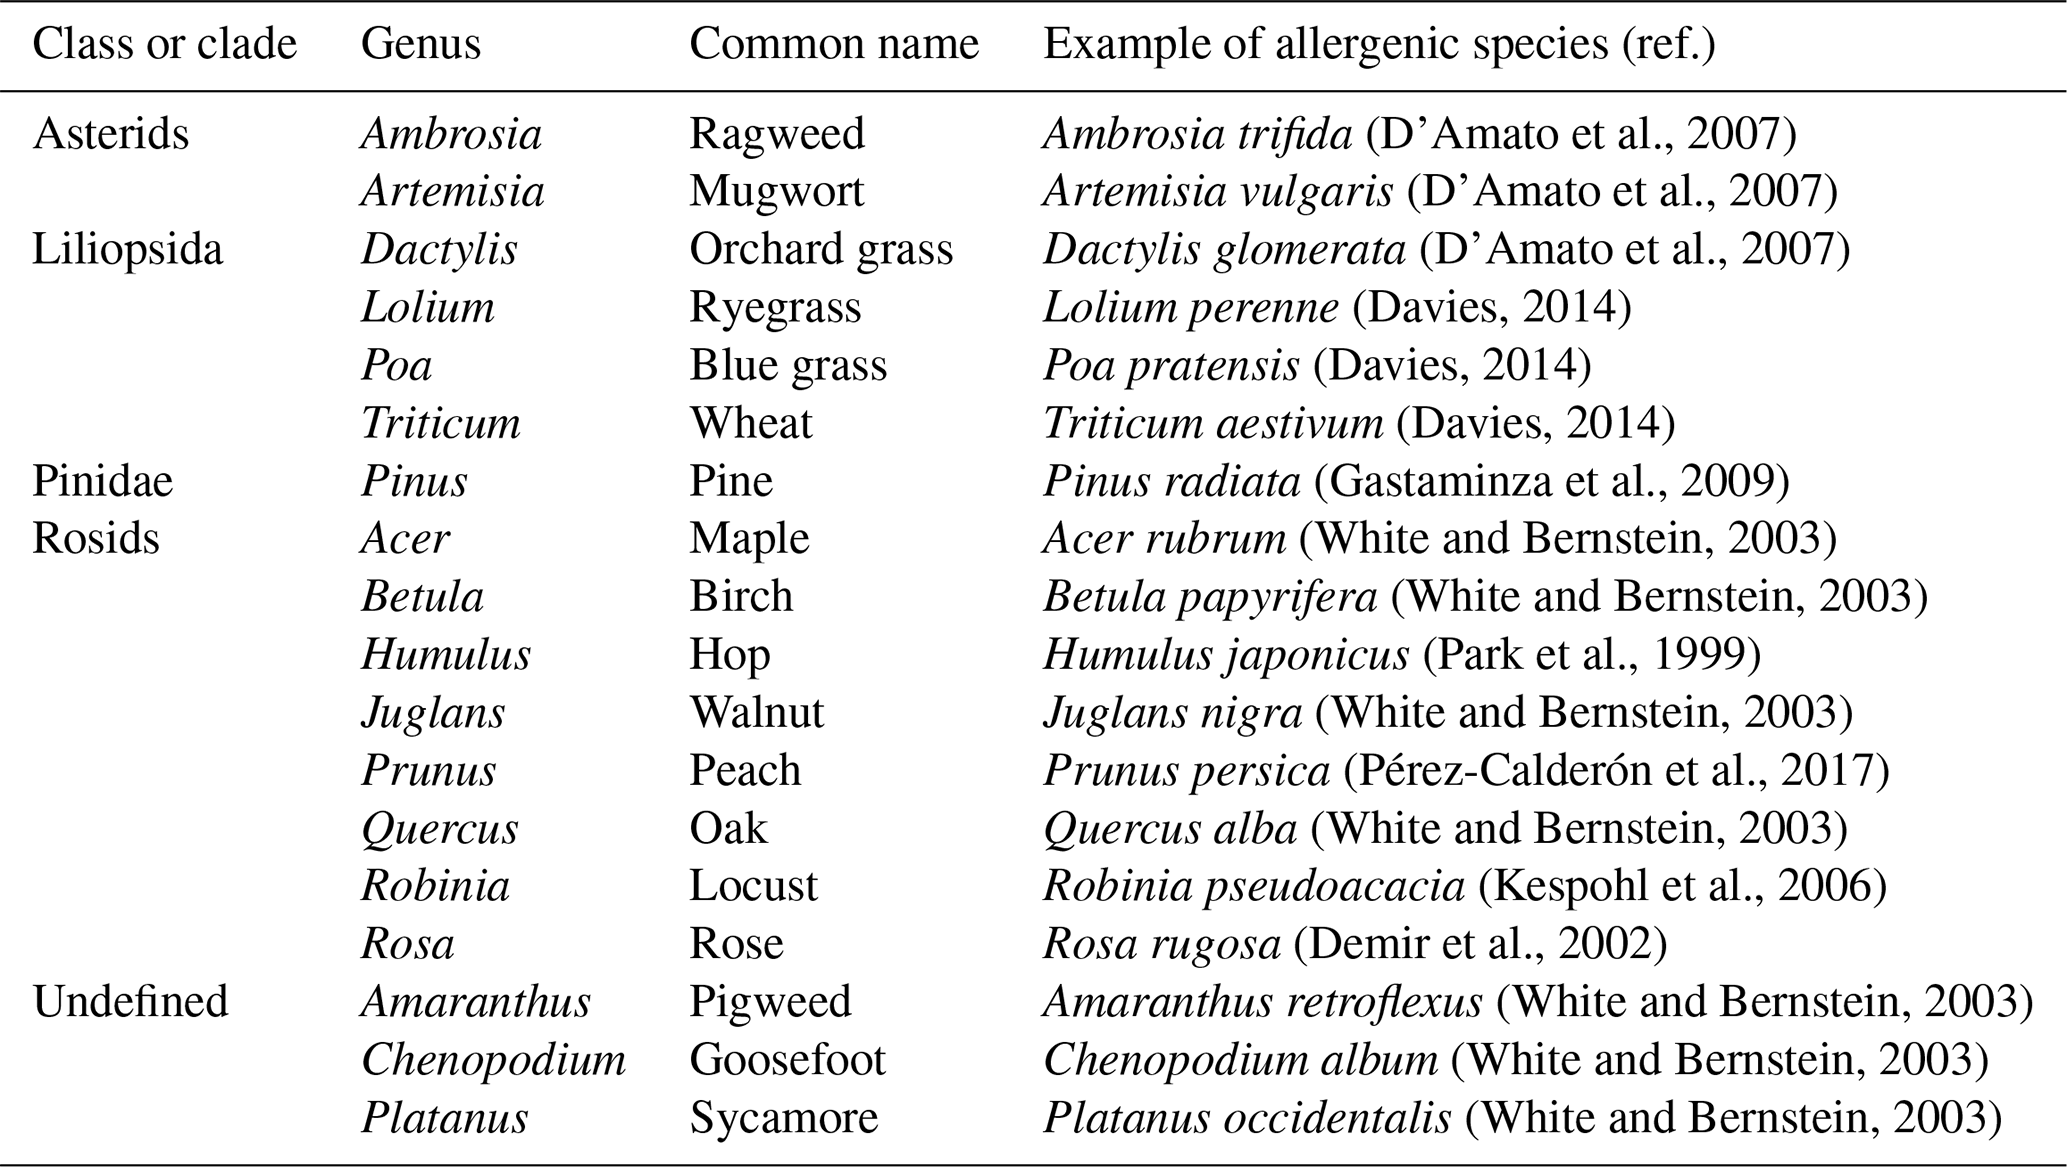
Table 1Examples of plant genera with known allergenic species.
Genus ranking showed that Pinus, Humulus, and Ambrosia were the three dominant genera found in the air samples (Fig. 2), with respective annual mean concentrations of 116 000, 7400, and 5900 CN m−3. Species of these genera were confirmed to inhabit the region near the Seoul sampling site. The highest concentrations were observed in May for Pinus and in September for Humulus and Ambrosia (Fig. 2a). These genera contain known human allergenic species (Table 1).
3.2 Particle concentrations in air
From 25 deposition sample libraries, 284 703 and 424 795 high-quality ITS2 sequence reads were obtained and mapped onto 97 % OTUs for 11 dry deposition and 14 wet deposition libraries, respectively (Table S1). The α-diversity measures of plant assemblages in deposition samples are listed in Table S2. In dry deposition samples, 89 % and 11 % of the sequences belonged to the Streptophyta and Chlorophyta, respectively. In wet deposition samples, 86 % and 13 % of the sequences belonged to the Streptophyta and Chlorophyta, respectively.
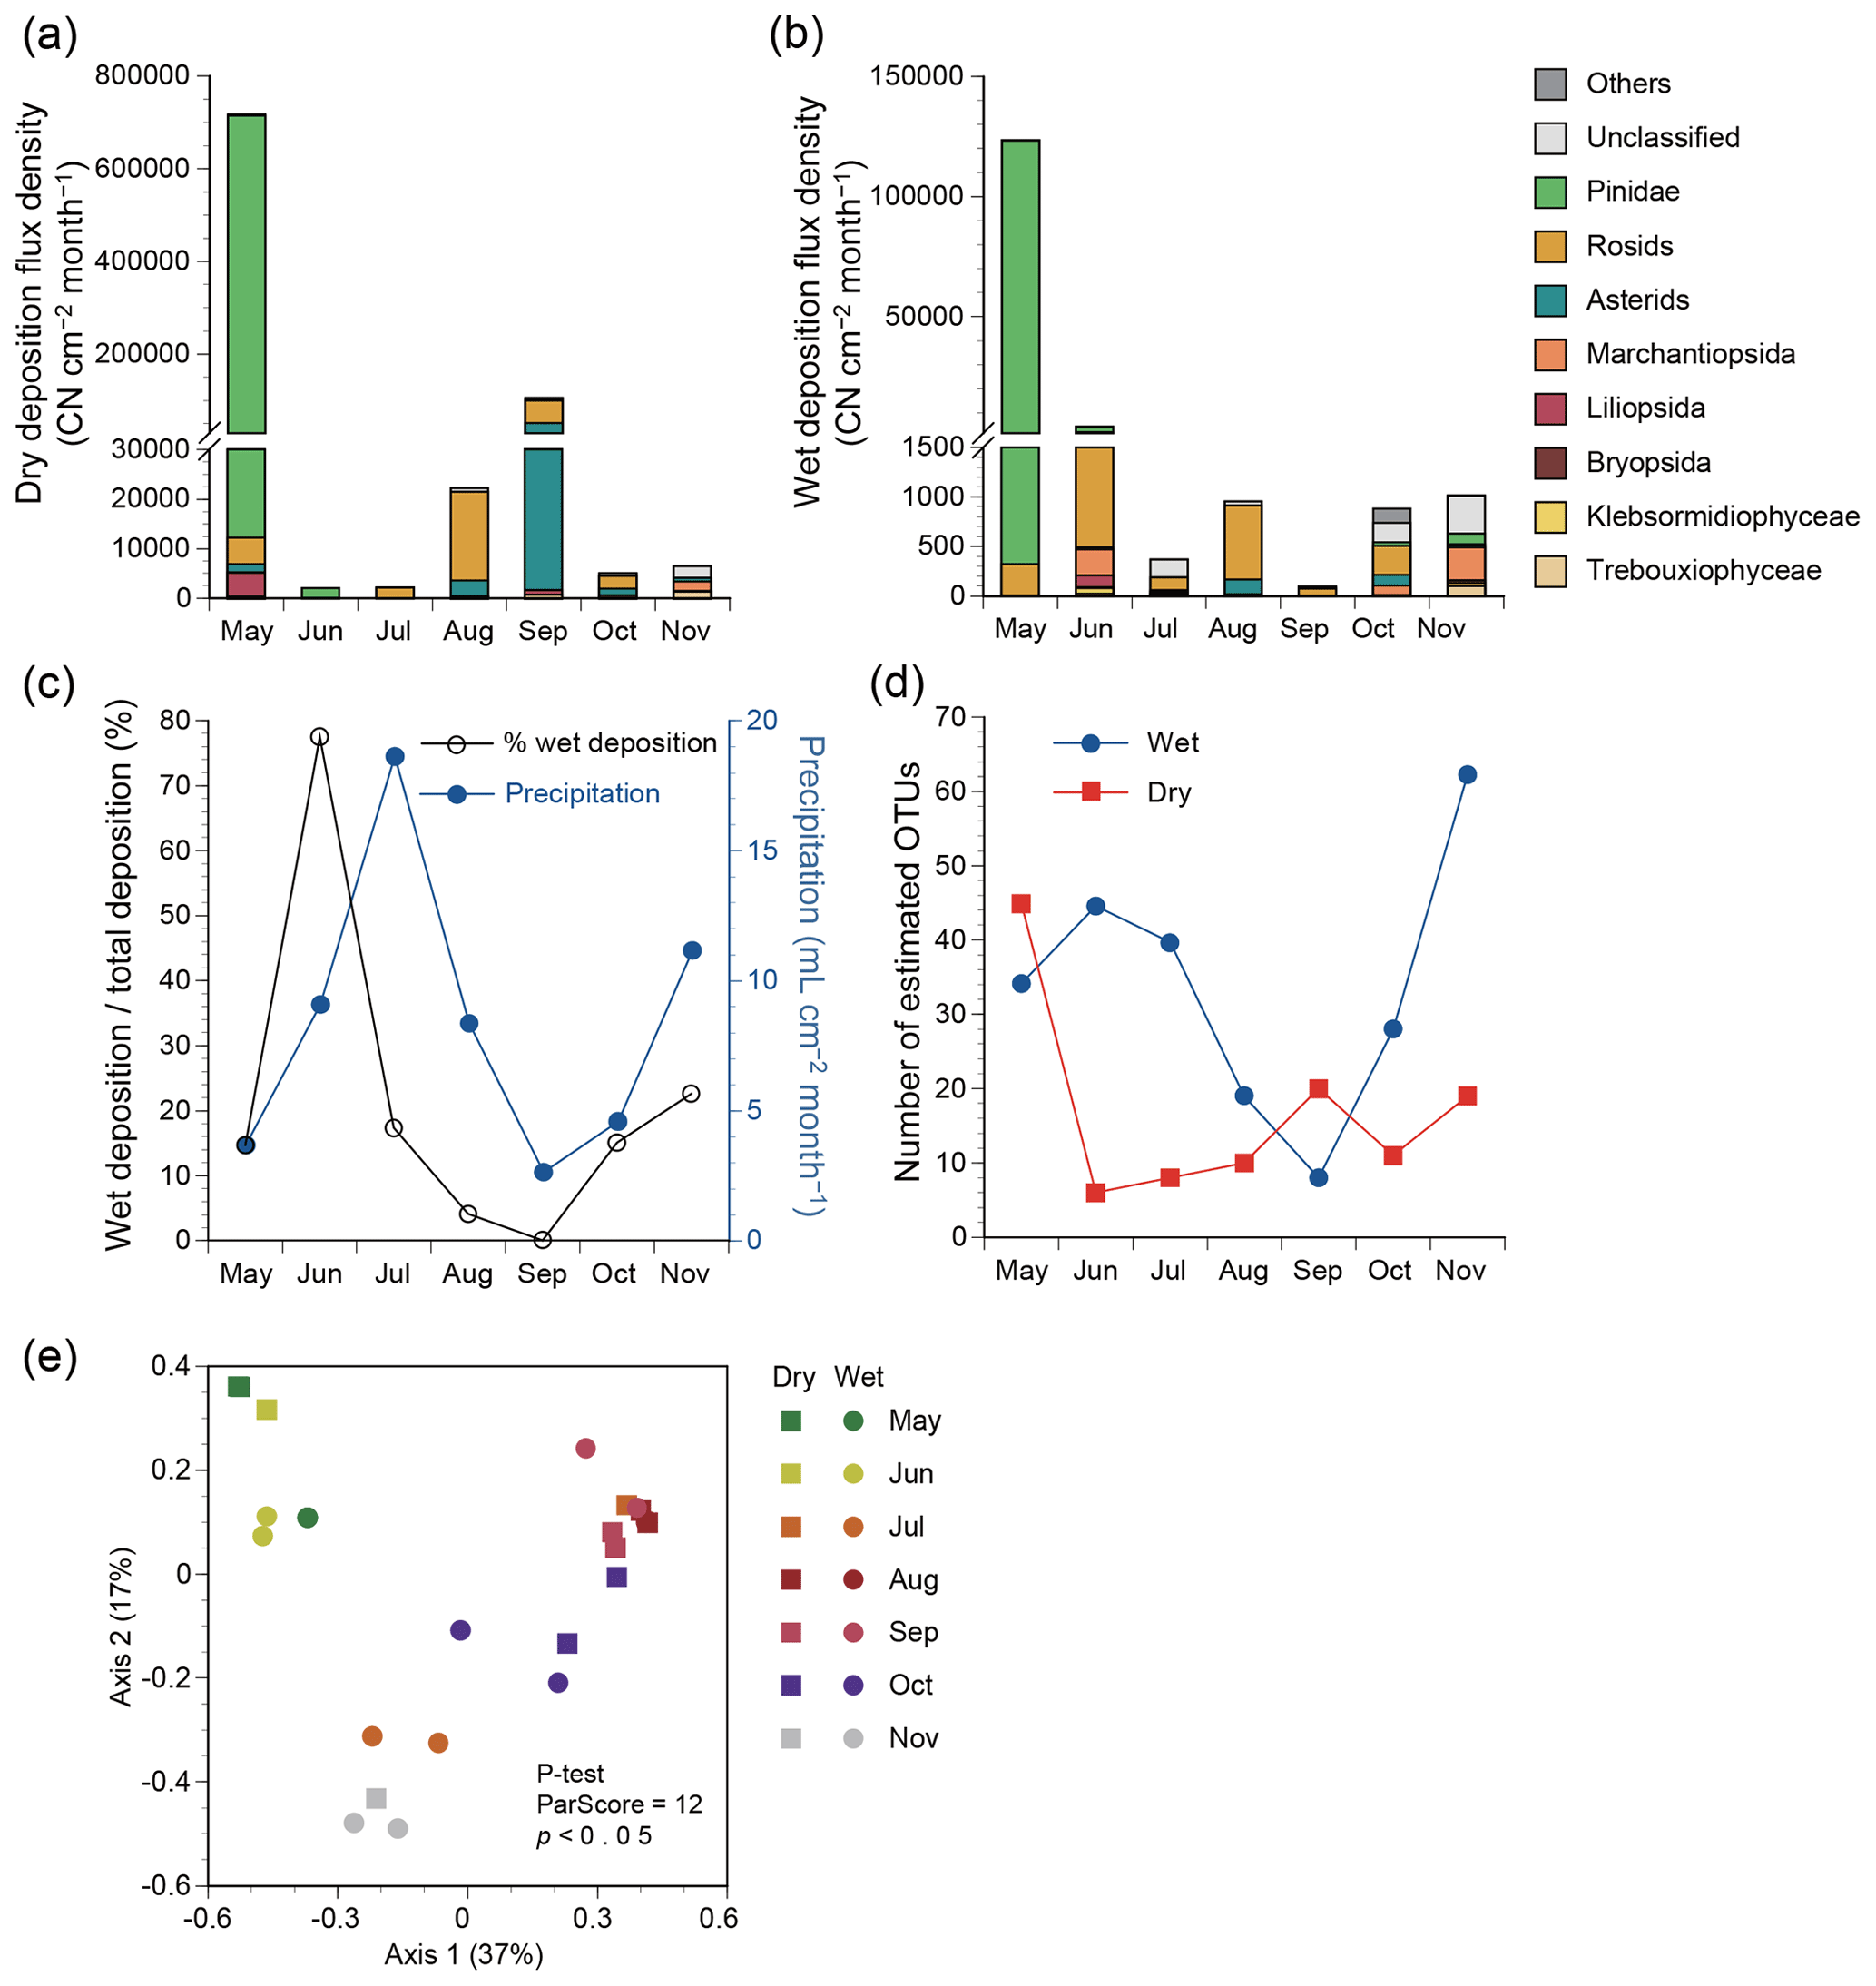
Figure 3Deposition flux densities based on plant classes or clades in terms of copy number (CN) of ITS2 from May to November 2015 in Seoul in South Korea. (a) Dry deposition. (b) Wet deposition. (c) Precipitation and relative contributions of wet deposition to total deposition. (d) Estimated number of 97 % OTUs in dry and wet deposition based on the Chao1 estimator. (e) Principal coordinate analysis plot for plant assemblage structures based on the Bray–Curtis distance.
The annual mean flux densities of all plant taxa were 122 000 and 19 000 CN cm−2 month−1 for dry and wet deposition samples (Fig. 3a, b), comprising 87 % and 13 % of the total plant particle deposits, respectively. The relative contribution of wet deposition to total deposition appeared to be associated with precipitation levels, except for the peak contribution preceding the peak precipitation by 1 month (Fig. 3c). Taxonomic richness in wet deposition increased when precipitation levels were higher, e.g., in June, July, and November (Fig. 3d). By contrast, the taxonomic richness in dry deposition increased when precipitation levels were lower, e.g., in May and September (Fig. 3d). The assemblage structures varied significantly with season (P test, ParScore = 12, p<0.05), but not with atmospheric deposition mode (P test, ParScore = 6, p=0.17) (Fig. 3e).
Class ranking showed that Pinidae was the most abundant class in both dry and wet deposition (Fig. 3a, b), with respective annual mean flux densities of 101 000 and 18 000 CN cm−2 month−1. The second and third most abundant clades were rosids and asterids, respectively, with respective flux densities of 10 900 and 8100 CN cm−2 month−1 for dry deposition and 430 and 50 CN cm−2 month−1 for wet deposition.
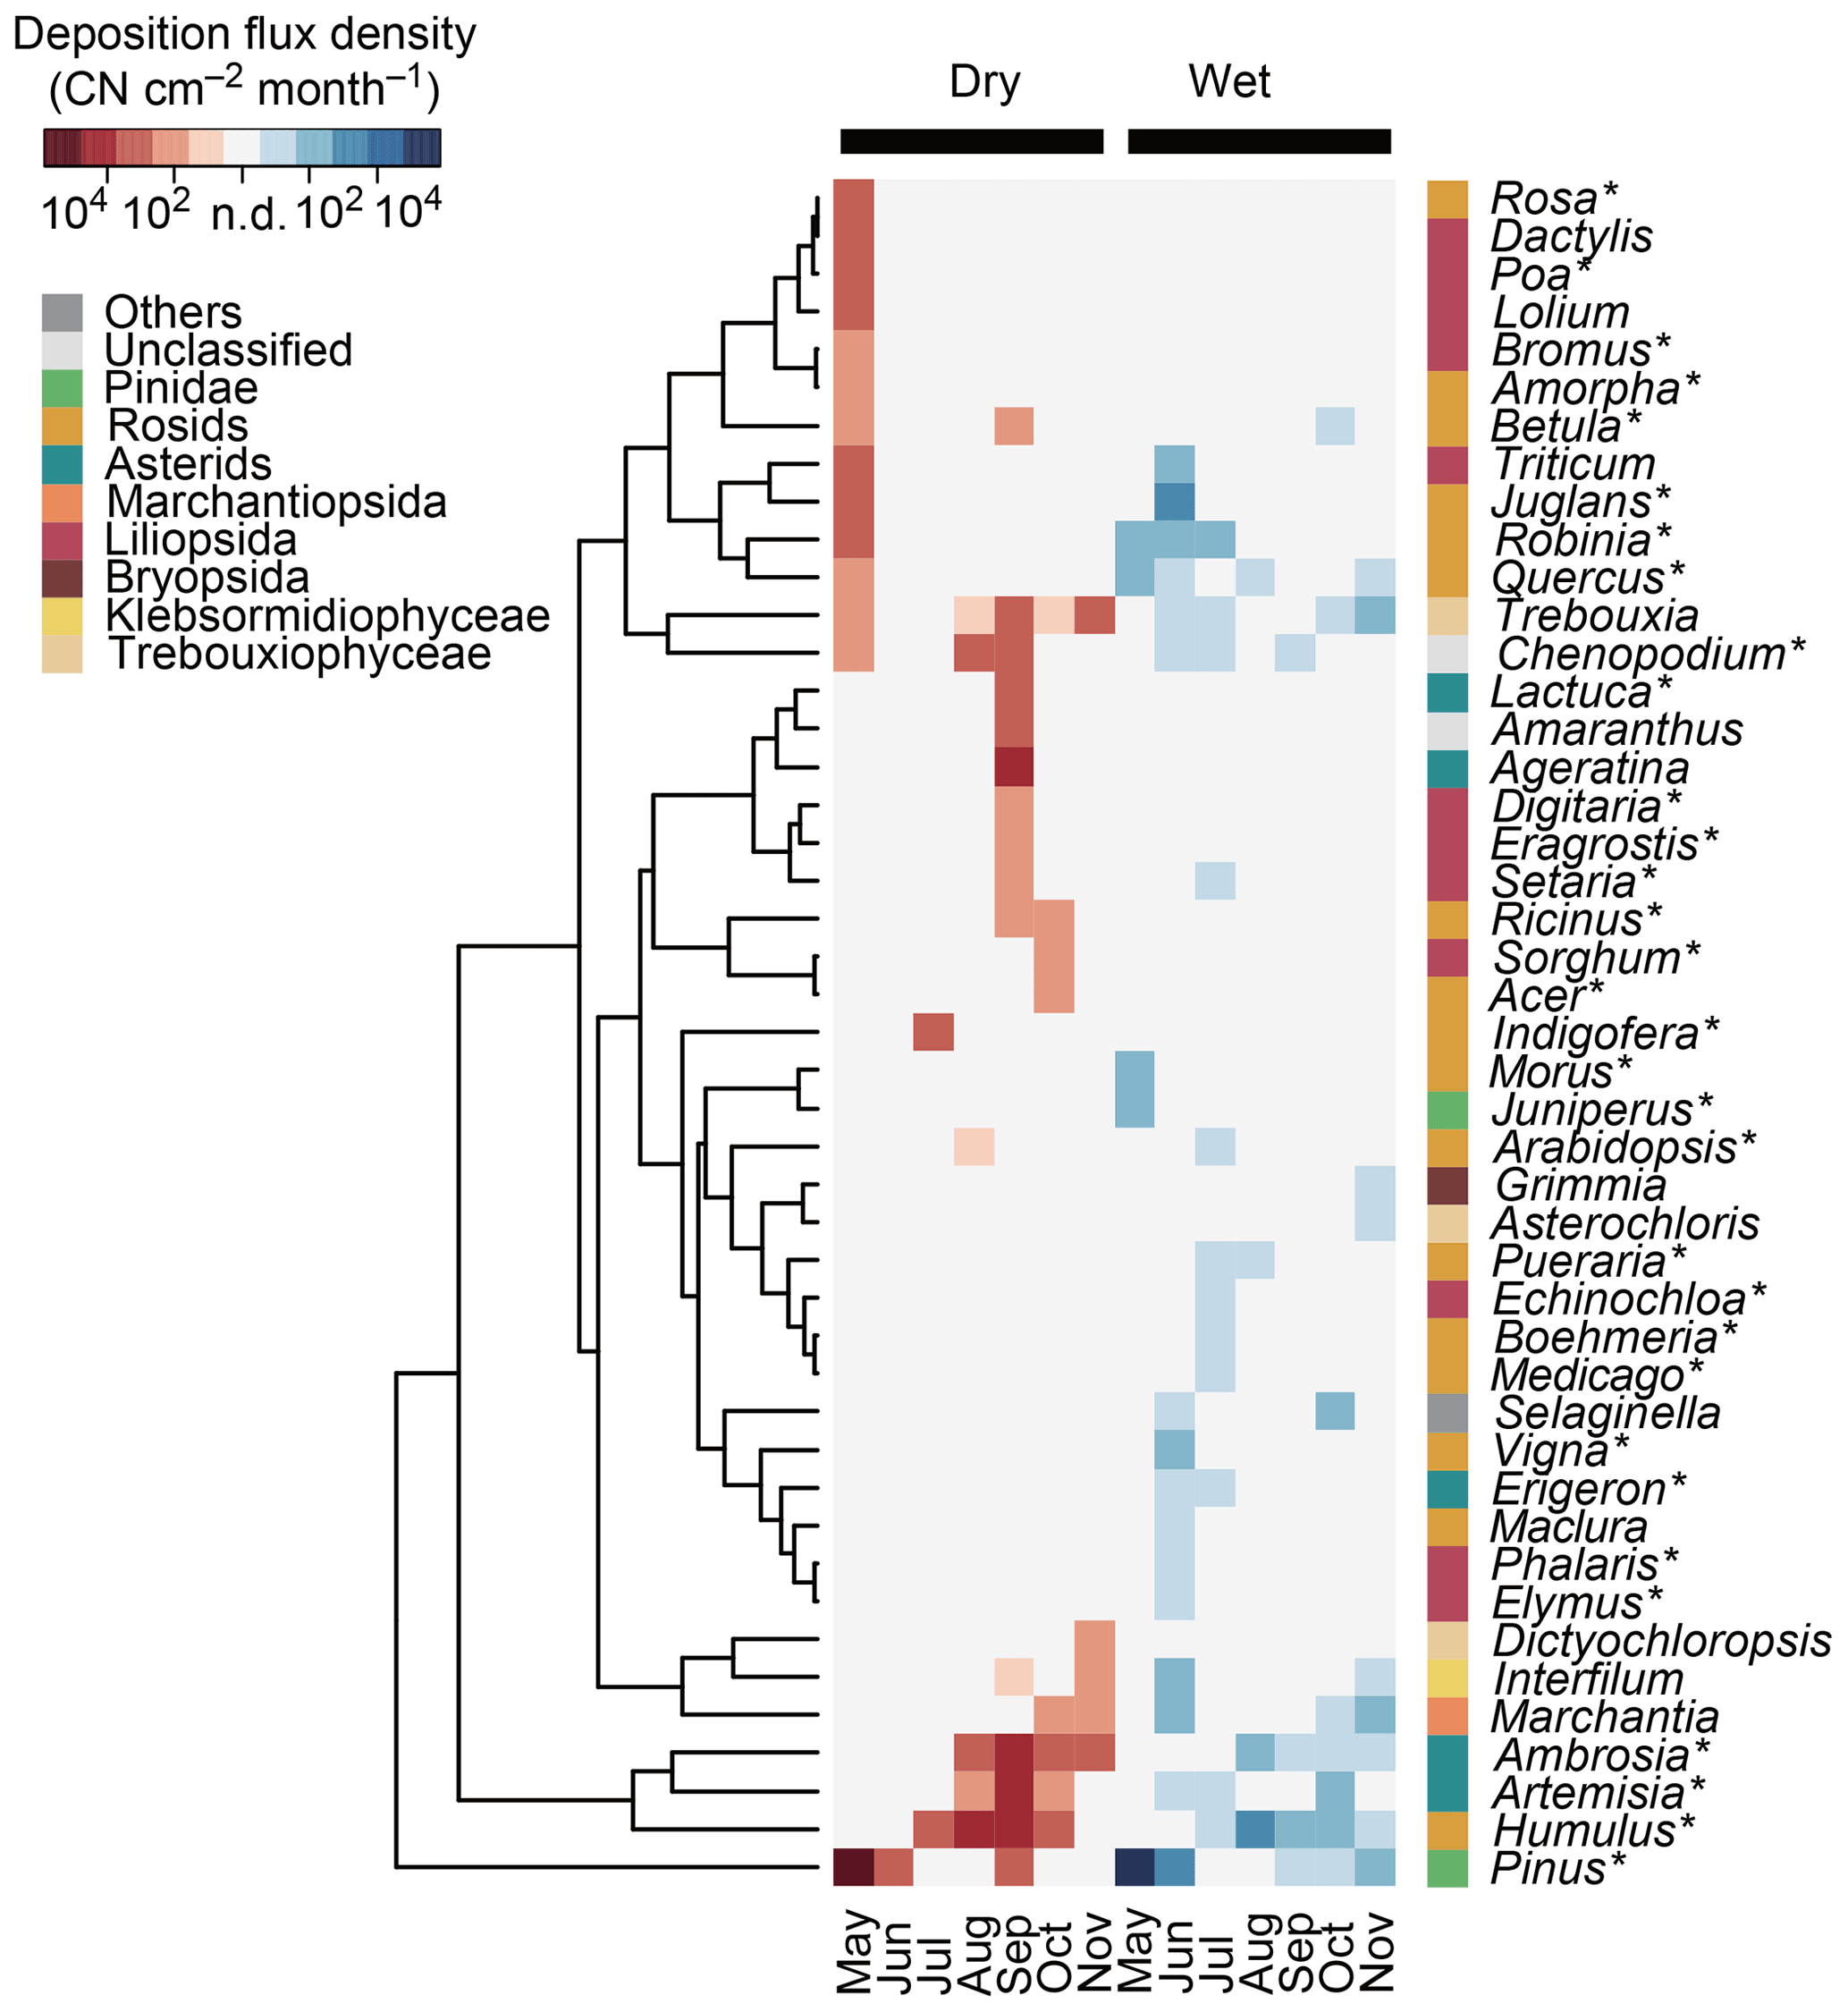
Figure 4Deposition flux densities of plant genera in terms of copy number (CN) of ITS2 in Seoul in South Korea. The 30 most abundant plant genera in dry and/or wet deposition are shown. Asterisks (∗) indicate the spermatophyte genera that are known to inhabit South Korea and that are listed in the databases of the Korea National Arboretum (2017) and/or the Korea Research Institute of Bioscience and Biotechnology (2016). The tree represents the similarities, based on Euclidean distance, of the log-transformed deposition flux densities.
Genus ranking showed that Pinus, Humulus, and Ambrosia were the three dominant genera in dry deposition (Fig. 4), with respective flux densities of 100 600, 9900, and 4300 CN cm−2 month−1. In wet deposition, the three dominant genera were Pinus, Juglans, and Humulus, with respective flux densities of 17 700, 170, and 160 CN cm−2 month−1. Relative dry and wet deposition contributions of selected genera with known allergenic species are shown in Fig. 5. Dry deposition was the predominant mode of atmospheric deposition for allergenic genera: 85.0 % for Pinus, 98.4 % for Humulus, 99.3 % for Ambrosia, 99.6 % for Artemisia, 92.1 % for Robinia, and 68.5 % for Quercus (Fig. 5).

Figure 5Relative contributions of dry and wet deposition for the selected plant genera with known allergenic species. Genera in Table 2 are shown, with information regarding allergenic species available in Table 1.
Table 2Dry deposition velocities and microscopy-based pollen sizes of selected plant generaa.
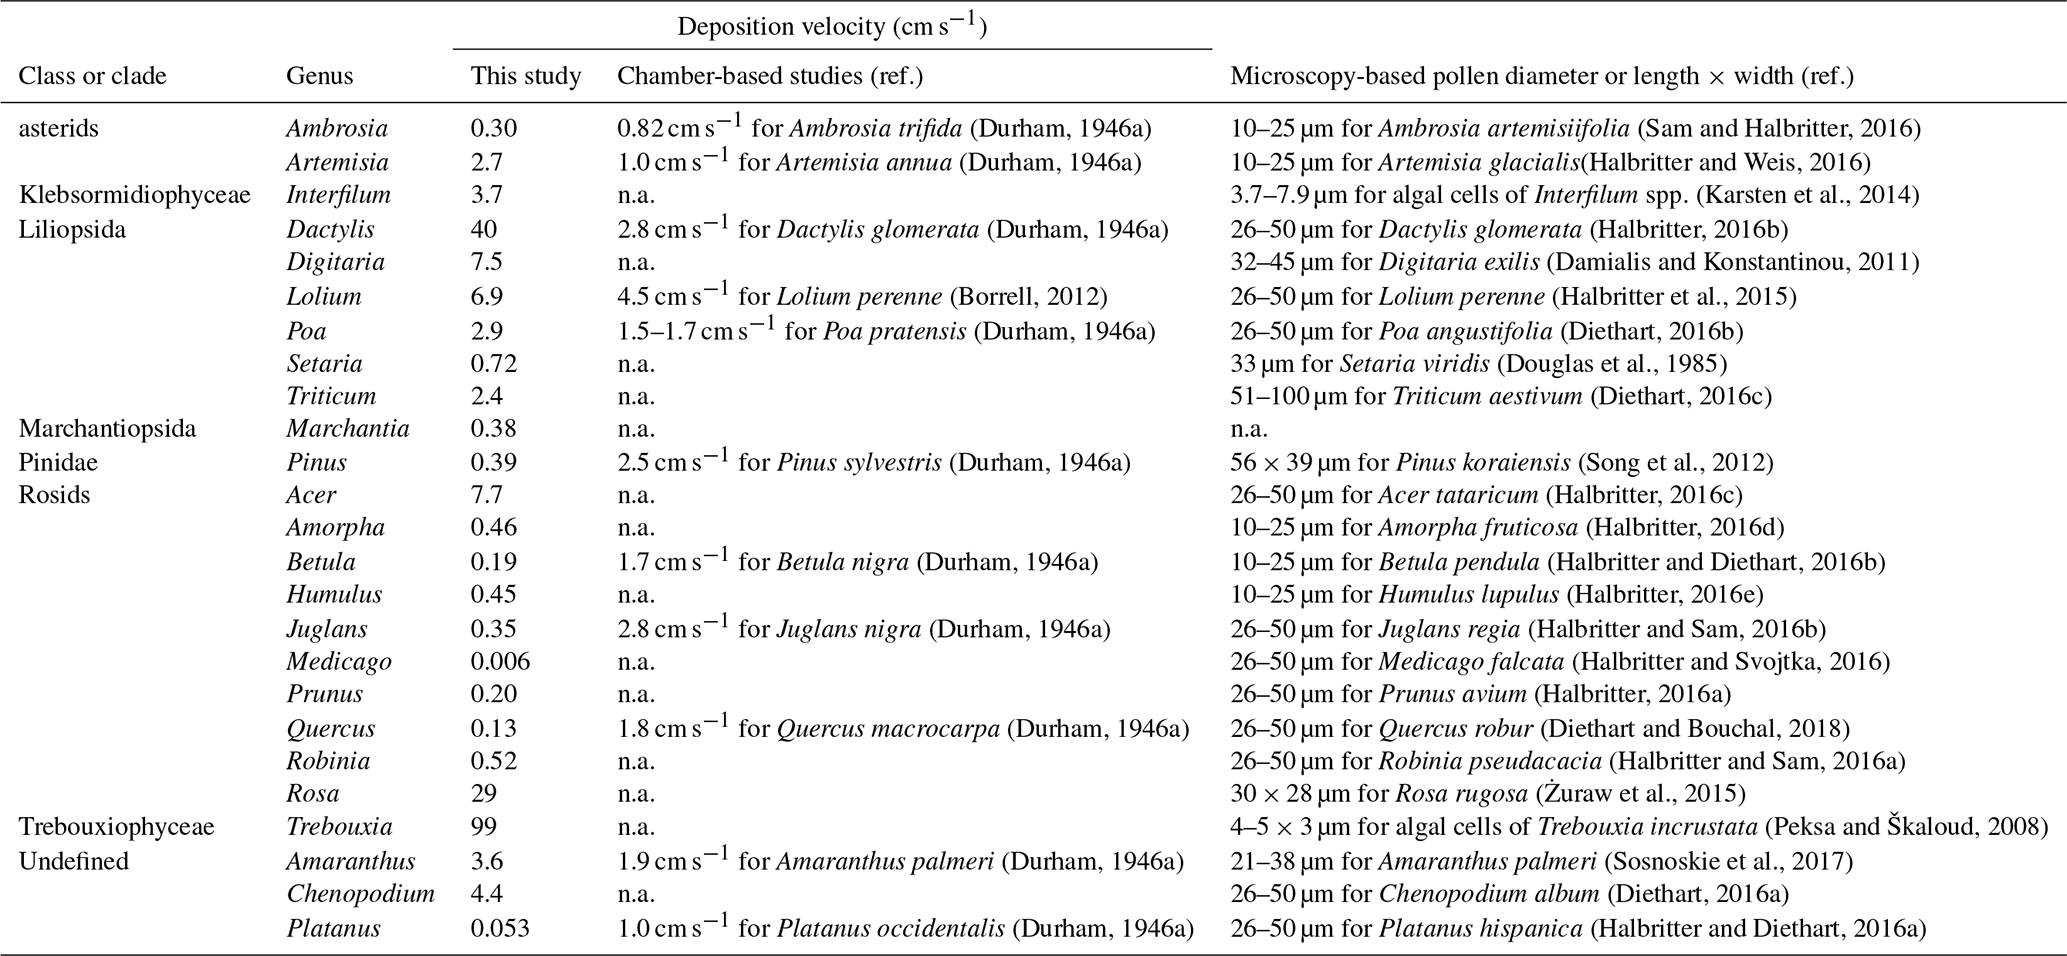
a Genera shown in Figs. 2 and/or 4 are listed. Genera were excluded if they were undetected in dry deposition or air samples. n.a.: not available in the literature.
3.3 Dry deposition velocities
Dry deposition velocities of selected plant genera were calculated according to Eq. (1) (Table 2). The overall velocity of all plant taxa combined was 0.40 cm s−1. Little correlation was found between dry deposition velocities and microscopy-based pollen sizes, with a Pearson correlation coefficient of 0.11 (Fig. 6). At the class level, however, deposition velocities appeared to be taxon-dependent, i.e., 98 cm s−1 for Trebouxiophyceae, 2.8 cm s−1 for Liliopsida, 0.54 cm s−1 for asterids, 0.50 cm s−1 for Klebsormidiophyceae, 0.49 cm s−1 for Marchantiopsida, 0.44 cm s−1 for rosids, 0.39 cm s−1 for Pinidae, and 0.027 cm s−1 for Bryopsida.
The bioprecipitation cycle, in which organisms emit airborne particles (or are emitted as airborne particles) that serve as cloud nuclei and promote precipitation (Morris et al., 2014; Sands et al., 1982), can enhance the environmental conditions for the organisms involved. For example, Woo et al. (2018) reported that fungal basidiospores were deposited predominantly in wet form, while Elbert et al. (2007) indicated that basidiospores were discharged preferentially under humid conditions. This suggests that fungus-mediated bioprecipitation (mycoprecipitation), in which fungi discharge spores that can serve as cloud nuclei and promote precipitation, can create humid conditions that facilitate spore dispersal. In this study, deposition of plant materials from the atmosphere was examined to determine whether similar mechanisms were present for plants.
Seasonal patterns were observed for plant assemblages in the atmosphere (Fig. 1b) and in deposition (Fig. 3e). The highest concentrations were observed in May for Pinus and in September for Humulus and Ambrosia (Fig. 2a). This correlated with the pollen calendar in Korea (Oh et al., 2012) and suggested that most plant DNA detected in this study was likely pollen-derived. Pinus was the most abundant genus (Fig. 2b), consistent with previous microscopy-based studies in Korea (Jung and Choi, 2013; So et al., 2017). However, DNA-based analysis showed that Pinus comprised 87 % of the total plant assemblage (Fig. 2b), higher than the contributions estimated by microscopy-based analysis (42 %–72 %) (Jung and Choi, 2013; So et al., 2017). This difference might be due to between-study variabilities in local floral and meteorological characteristics. Another possibility is quantitation biases in DNA metabarcoding, such as biases associated with variation in the number of ITS copies per pollen grain (Bell et al., 2019). Nonetheless, DNA-based measurements were shown to be reproducible (Fig. S3), and therefore were suitable for accurate between-sample comparisons.
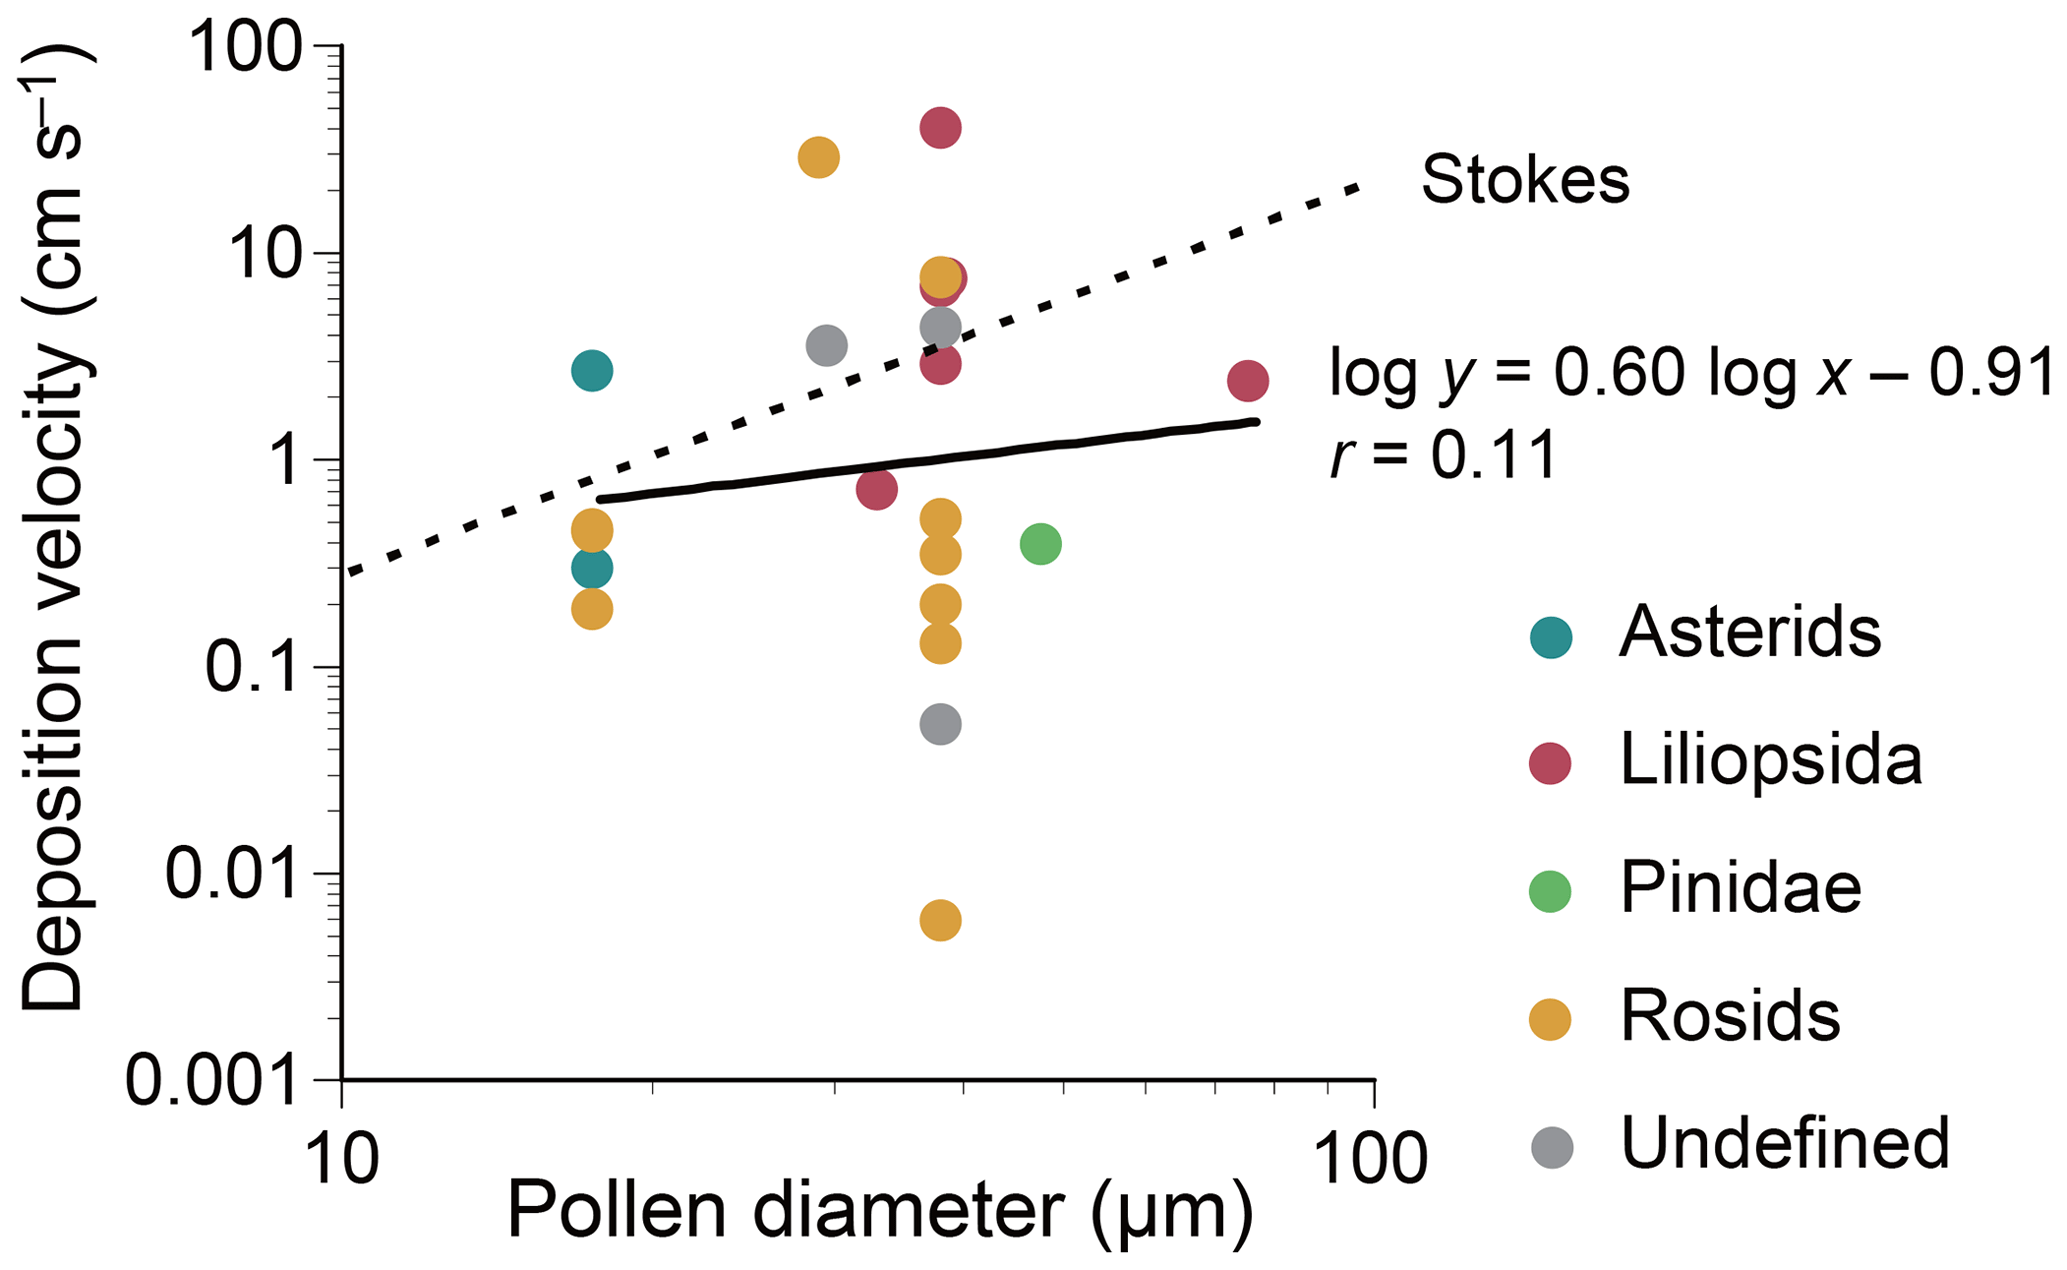
Figure 6Dry deposition velocities of the plant genera listed in Table 1. Each point represents a datum for each genus. Interfilum and Trebouxia, which are algal genera, were excluded. For each genus, a mean value of lower and upper values of reported pollen diameters is used for a representative pollen diameter. In case pollen grains are non-spherical, a mean value of the reported length and width is used. The Stokes terminal gravitational settling velocities are calculated by assuming that pollen grains are spherical and have a standard density of 1.0 g cm−3. The velocities are calculated by: where ρ0 is the standard density (=1.0 g cm−3), d is the pollen diameter, g is the acceleration of gravity (=980 cm s−2), and η is the viscosity of air ( Pa s).
Modes of pollination differ by plant taxa. Abiotic pollination mechanisms, such as wind pollination (anemophily), are employed by approximately 20 % of angiosperms, with biotic pollination such as insect pollination (entomophily) accounting for the remaining 80 % (Ackerman, 2000). Some anemophilous angiosperms are arboreal, with examples including Juglans, Platanus, Quercus, and Acer (Molina et al., 1996). Pinus is a genus of anemophilous gymnosperms. Most of the genera detected in this study were anemophilous land plants, but entomophilous genera including Robinia (Cierjacks et al., 2013) were also detected in small numbers (Table S3). However, ambophily is known to occur for some angiosperm families (Culley et al., 2002). Some bryophytes (mosses), such as Streblotrichum, were also detected (Fig. 2). Bryophytes are known to release spores under desiccated conditions by capsule opening (Gallenmüller et al., 2017).
Dry deposition velocities were calculated according to Eq. (1) under the assumption that deposition was materially balanced with the airborne quantity in a well-mixed closed system with a sufficient deposition time. Calculated dry deposition velocities were not meaningfully correlated with microscopy-based pollen sizes (Fig. 6), and velocities were lower than those reported in chamber-based experiments (Table 2). This discrepancy might be attributable to the mass balance assumption used in this study, as it is possible that pollen emitted locally might have dispersed and settled at a remote location outside the system boundary used for our mass balance assumption. The assumptions used for the physical properties of pollen might also have caused discrepancies. Pollen can be desiccated, ruptured, and/or fragmented (Franchi et al., 2011; Miguel et al., 2006), which can change aerodynamic properties in the air and impact deposition velocities. Irregularly shaped pollen grains, such as spikes of Ambrosia and air-filled sacci of Pinus, might also confound the relationship between their microscopy-based sizes and aerodynamic properties (Schwendemann et al., 2007; Sabban and van Hout, 2011).
The differences in settling velocities between plant classes or clades might be explained by the differences in pollen morphology. For example, the larger settling velocity observed for Liliopsida (2.8 cm s−1) might be because plants belonging to this class produce pollen with monosulcate structures, while the smaller settling velocities observed for rosids (0.44 cm s−1) and asterids (0.54 cm s−1) might be because plants belonging to these clades produce tricolpate pollen structures, which result in larger frictional resistance in the atmosphere. The smallest settling velocity observed for Bryopsida (mosses) (0.027 cm s−1) might be because the spores they produce (8–40 µm) (Zanatta et al., 2016; Hill et al., 2007) are smaller than the pollen grains produced by Spermatophyta (10–100 µm) (Hinds, 1999; Jacobson and Morris, 1976).
Contrasting tendencies were observed in the modes of atmospheric deposition between fungi and plants. Unlike fungal particles, which deposited mostly in wet form (86 %) (Woo et al., 2018), plant particles deposited predominantly in dry form (87 %) (Fig. 3a, b). Moreover, there were no distinct differences in assemblage structures between dry and wet deposition for plants (Fig. 3e), whereas significant differences were observed for fungi (Woo et al., 2018). For example, Woo et al. (2018) reported that spores from mushroom-forming fungi were highly enriched in precipitation, suggesting that such fungal spores served as nuclei in clouds and/or were discharged preferentially during precipitation. The lack of taxon-dependent tendencies for release of plant particles suggests that the majority of plant species are not specifically dependent on or involved in precipitation. Indeed, most plants and bryophytes (mosses) release pollen or spores by anther or capsule opening under dehydrated conditions (Firon et al., 2012; Gallenmüller et al., 2017). This general xerophytic nature of pollen dispersal might partially explain why plants were not generally involved in precipitation.
It should be noted, however, that several genera were detected exclusively from wet deposition (Fig. 4), and some allergenic genera were detected abundantly from wet deposition, e.g., 60 % for Juglans and 32 % for Quercus (Fig. 5), indicating that these genera might be specifically involved in precipitation. Additionally, we observed that Quercus and Juglans were released in the less rainy month of June than in the rainier month of July (Fig. 2a), even though they were detected abundantly in precipitation (Fig. 5), indicating that these genera might be released preferentially on rainy days of the less rainy month of June. We expect that the taxon dependency of seasonal pollen dispersals in conjunction with the taxon dependency of rainfall involvement might partially explain our anomalous observation where the peak contribution of wet deposition preceded the peak precipitation by 1 month (i.e., from July to June) (Fig. 3c).
Wet deposition can occur by washout (below-cloud scavenging), which is likely taxon-independent, and rainout (within-cloud scavenging), which is likely taxon-dependent, as observed previously for deposition by ice nucleation-active bacterial and fungal species (Failor et al., 2017; Pouleur et al., 1992). The minimal differences in plant assemblage structures between dry and wet deposition (Fig. 3e) indicated a possibility that washout, which is possibly taxon-independent, predominated over rainout, which is possibly taxon-dependent, for wet deposition of atmospheric plant particles although it is also possible that there is no taxon dependency in rainout. Large pollen grains might be less likely to reach cloud base altitudes than smaller biological particles such as fungal spores. Cáliz et al. (2018) demonstrated that plant particles were scarce (<10 %), and fungal particles were abundant (>75 %), in precipitation collected at an altitude of 1800 m in Spain. Despite this, pollen is not necessarily insignificant in precipitation as pollen grains can reach cloud base altitudes of 500–2000 m (Damialis et al., 2017), albeit in attenuated quantities (Noh et al., 2013). Small quantities of large pollen grains might contribute to initiating precipitation since they serve as GCCN that can disproportionately efficiently scavenge smaller droplets in clouds (Johnson, 1982; Möhler et al., 2007).
Meteorological conditions such as rainfall are known to be linked to allergic symptoms, for example with so-called thunderstorm asthma in pollinosis patients (D'Amato et al., 2007, 2012), but causality remains unclear. D'Amato et al. (2012) suggested that rainfall can have antagonistic effects, removing allergenic pollen grains from the atmosphere but also increasing the abundance of respirable fragments that are released from ruptured pollen grains by osmotic pressure. The present study showed that precipitation was a minor mode of atmospheric deposition of allergenic pollen grains (Fig. 5). Allergenic pollen might be undispersed and thus depleted from the atmosphere at the time of precipitation since pollen dispersal generally occurs under dry conditions (Firon et al., 2012). However, a small fraction of pollen (∼10 %) was precipitated (Fig. 5), supporting the proposal that pollen can interact with water droplets in the atmosphere and lead to release of allergenic fragments from moisture-ruptured pollen grains.
Trebouxiophyceae was detected in the air and deposition samples (Figs. 1 and 3). The most abundant genus was Trebouxia (Fig. 4), which is a desiccation-tolerant aeroterrestrial alga (Candotto Carniel et al., 2015) that is thought to disperse asexual propagules (Ahmadjian, 1988). Previous reports indicate detection in the air (Schlichting, 1969) and in precipitation (Cáliz et al., 2018). Trebouxiophyceae is also found in seawater (Tragin and Vaulot, 2018) and might therefore also be dispersed in the form of sea spray from aqueous ecosystems (Tesson et al., 2016; Mayol et al., 2014). Cáliz et al. (2018) reported enrichment in rainfall at sample sites where aerosols of marine origin were dominant. Another possibility is that asexual propagules of terrestrial origins might be precipitated by washout and/or rainout as cloud nuclei (Sassen et al., 2003). The present study also showed detection in dry deposits (Fig. 4), indicating the deposition of asexual propagules of terrestrial origins, and/or aqueous cells dispersed as droplets and subsequently desiccated after long-range transport in the atmosphere (Mayol et al., 2017). The high settling velocity (=99 cm s−1) (Table 2) indicated deposition as agglomerates.
This study showed that dry deposition was the predominant mode of atmospheric deposition of plant particles, including allergenic genera (Fig. 5). This was likely due to the general xerophytic nature of pollen dispersal and rapid settlement of large-size pollen grains. A small fraction (∼15 %) precipitated via rainout (in-cloud scavenging) and/or washout (below-cloud scavenging). Plant assemblage structures did not differ significantly between dry and wet deposition, indicating a possibility that washout, which is possibly taxon-independent, predominated over rainout, which is possibly taxon-dependent, for wet deposition of atmospheric plant particles. A small number of plant genera were detected only from wet deposition (Fig. 4), and some genera were detected in wet deposition with relatively large contributions, e.g., 60 % for Juglans and 32 % for Quercus (Fig. 5). This suggests that these particular genera might be involved in precipitation by serving as nucleation-active species in the atmosphere. Indeed, previous reports showed that a small group of plants discharged pollen grains under rain conditions (rain pollination) (Fan et al., 2012; Hagerup, 1950), suggesting the existence of plant-mediated bioprecipitation. Further interannual monitoring will be required to clarify the deposition tendencies of different plants by controlling for the seasonality of atmospheric plant assemblages observed at our sampling site (Fig. 3e). Additionally, chamber-based experiments are needed to test their nucleation potentials. Finally, we propose that global monitoring be employed to explore for the presence of endemic species that might be specifically involved in plant-mediated bioprecipitation in their regional ecological systems.
Raw sequence data are available under the project number PRJNA525749 of the NCBI Sequence Read Archive.
The supplement related to this article is available online at: https://doi.org/10.5194/acp-19-11969-2019-supplement.
NY designed the research. KD and CW performed the research and analyzed data. KD and NY wrote the paper. All authors participated in editing the final version of this paper.
The authors declare that they have no conflict of interest.
This research has been supported by the National Research Foundation of Korea (grant no. 2013R1A1A1004497).
This paper was edited by Alex Huffman and reviewed by two anonymous referees.
Ackerman, J. D.: Abiotic pollen and pollination: Ecological, functional, and evolutionary perspectives, Plant Syst. Evol., 222, 167–185, https://doi.org/10.1007/BF00984101, 2000.
Ahmadjian, V.: The lichen alga Trebouxia: does it occur free-living?, Plant Syst. Evol., 158, 243–247, https://doi.org/10.1007/BF00936348, 1988.
An, C., Woo, C., and Yamamoto, N.: Introducing DNA-based methods to compare fungal microbiota and concentrations in indoor, outdoor, and personal air, Aerobiologia, 34, 1–12, https://doi.org/10.1007/s10453-017-9490-6, 2018.
Ankenbrand, M. J., Keller, A., Wolf, M., Schultz, J., and Förster, F.: ITS2 database V: Twice as much, Mol. Biol. Evol., 32, 3030–3032, https://doi.org/10.1093/molbev/msv174, 2015.
Aylor, D. E.: Settling speed of corn (Zea mays) pollen, J. Aerosol Sci., 33, 1601–1607, https://doi.org/10.1016/S0021-8502(02)00105-2, 2002.
Bell, K. L., Burgess, K. S., Botsch, J. C., Dobbs, E. K., Read, T. D., and Brosi, B. J.: Quantitative and qualitative assessment of pollen DNA metabarcoding using constructed species mixtures, Mol. Ecol., 28, 431–455, https://doi.org/10.1111/mec.14840, 2019.
Borrell, J. S.: Rapid assessment protocol for pollen settling velocity: implications for habitat fragmentation, Biosci. Horizons, 5, hzs002, https://doi.org/10.1093/biohorizons/hzs002, 2012.
Cáliz, J., Triadó-Margarit, X., Camarero, L., and Casamayor, E. O.: A long-term survey unveils strong seasonal patterns in the airborne microbiome coupled to general and regional atmospheric circulations, P. Natl. Acad. Sci. USA, 115, 12229–12234, https://doi.org/10.1073/pnas.1812826115, 2018.
Candotto Carniel, F., Zanelli, D., Bertuzzi, S., and Tretiach, M.: Desiccation tolerance and lichenization: a case study with the aeroterrestrial microalga Trebouxia sp. (Chlorophyta), Planta, 242, 493–505, https://doi.org/10.1007/s00425-015-2319-z, 2015.
Cheng, T., Xu, C., Lei, L., Li, C., Zhang, Y., and Zhou, S.: Barcoding the kingdom Plantae: new PCR primers for ITS regions of plants with improved universality and specificity, Mol. Ecol. Resour., 16, 138–149, https://doi.org/10.1111/1755-0998.12438, 2016.
Christenhusz, M. and Byng, J.: The number of known plant species in the world and its annual increase, Phytotaxa, 261, 201–217, https://doi.org/10.11646/phytotaxa.261.3.1, 2016.
Cierjacks, A., Kowarik, I., Joshi, J., Hempel, S., Ristow, M., von der Lippe, M., and Weber, E.: Biological flora of the British isles: Robinia pseudoacacia, J. Ecol., 101, 1623–1640, https://doi.org/10.1111/1365-2745.12162, 2013.
Cornman, R. S., Otto, C. R. V., Iwanowicz, D., and Pettis, J. S.: Taxonomic characterization of honey bee (Apis mellifera) pollen foraging based on non-overlapping paired-end sequencing of nuclear ribosomal loci, PLoS ONE, 10, e0145365, https://doi.org/10.1371/journal.pone.0145365, 2015.
Culley, T. M., Weller, S. G., and Sakai, A. K.: The evolution of wind pollination in angiosperms, Trends Ecol. Evol., 17, 361–369, https://doi.org/10.1016/S0169-5347(02)02540-5, 2002.
D'Amato, G., Liccardi, G., and Frenguelli, G.: Thunderstorm-asthma and pollen allergy, Allergy, 62, 11–16, https://doi.org/10.1111/j.1398-9995.2006.01271.x, 2007.
D'Amato, G., Cecchi, L., Bonini, S., Nunes, C., Annesi-Maesano, I., Behrendt, H., Liccardi, G., Popov, T., and Van Cauwenberge, P.: Allergenic pollen and pollen allergy in Europe, Allergy, 62, 976–990, https://doi.org/10.1111/j.1398-9995.2007.01393.x, 2007.
D'Amato, G., Cecchi, L., and Annesi-Maesano, I.: A trans-disciplinary overview of case reports of thunderstorm-related asthma outbreaks and relapse, Eur. Respir. Rev., 21, 82–87, https://doi.org/10.1183/09059180.00001712, 2012.
Damialis, A. and Konstantinou, G. N.: Cereal pollen sensitisation in pollen allergic patients: to treat or not to treat?, Eur. Ann. Allergy Clin. Immunol., 43, 36–44, 2011.
Damialis, A., Kaimakamis, E., Konoglou, M., Akritidis, I., Traidl-Hoffmann, C., and Gioulekas, D.: Estimating the abundance of airborne pollen and fungal spores at variable elevations using an aircraft: how high can they fly?, Sci. Rep., 7, 44535–44535, https://doi.org/10.1038/srep44535, 2017.
Dannemiller, K., Lang-Yona, N., Yamamoto, N., Rudich, Y., and Peccia, J.: Combining real-time PCR and next-generation DNA sequencing to provide quantitative comparisons of fungal aerosol populations, Atmos. Environ., 84, 113–121, https://doi.org/10.1016/j.atmosenv.2013.11.036, 2014.
Davies, J. M.: Grass pollen allergens globally: the contribution of subtropical grasses to burden of allergic respiratory diseases, Clin. Exp. Allergy, 44, 790–801, https://doi.org/10.1111/cea.12317, 2014.
Demir, A. U., Karakaya, G., and Kalyoncu, A. F.: Allergy symptoms and IgE immune response to rose: an occupational and an environmental disease, Allergy, 57, 936–939, https://doi.org/10.1034/j.1398-9995.2002.23277.x, 2002.
Després, V. R., Huffman, J. A., Burrows, S. M., Hoose, C., Safatov, A. S., Buryak, G., Fröhlich-Nowoisky, J., Elbert, W., Andreae, M. O., Pöschl, U., and Jaenicke, R.: Primary biological aerosol particles in the atmosphere: A review, Tellus B, 64, 15598, https://doi.org/10.3402/tellusb.v64i0.15598, 2012.
Diethart, B.: Chenopodium album, in: PalDat – A palynological database: available at: https://www.paldat.org/pub/Chenopodium_album/301211 (last access: 28 January 2019), 2016a.
Diethart, B.: Poa angustifolia, in: PalDat – A palynological database: available at: https://www.paldat.org/pub/Poa_angustifolia/301220 (last access: 28 January 2019), 2016b.
Diethart, B.: Triticum aestivum in: PalDat – A palynological database: available at: https://www.paldat.org/pub/Triticum_aestivum/301222 (last access: 28 January 2019), 2016c.
Diethart, B., and Bouchal, J.: Quercus robur, in: PalDat – A palynological database: available at: https://www.paldat.org/pub/Quercus_robur/303318 (last access: 28 January 2019), 2018.
Di-Giovanni, F., Kevan, P. G., and Nasr, M. E.: The variability in settling velocities of some pollen and spores, Grana, 34, 39–44, https://doi.org/10.1080/00173139509429031, 1995.
Doskey, P. V. and Ugoagwu, B. J.: Atmospheric deposition of macronutrients by pollen at a semi-remote site in northern Wisconsin, Atmos. Environ., 23, 2761–2766, https://doi.org/10.1016/0004-6981(89)90556-8, 1989.
Douglas, B. J., Morrison, I. N., Thomas, A. G., and Maw, M. G.: The biology of Canadian weeds.: 70. Setaria viridis (L.) Beauv, Can. J. Plant Sci., 65, 669–690, https://doi.org/10.4141/cjps85-089, 1985.
Durham, O. C.: The volumetric incidence of atmospheric allergens: III. Rate of fall of pollen grains in still air, J. Allergy Clin. Immunol., 17, 70–78, https://doi.org/10.1016/0021-8707(46)90024-X, 1946a.
Durham, O. C.: The volumetric incidence of atmospheric allergens: IV. A proposed standard method of gravity sampling, counting, and volumetric interpolation of results, J. Allergy, 17, 79–86, https://doi.org/10.1016/0021-8707(46)90025-1, 1946b.
Edgar, R. C.: Search and clustering orders of magnitude faster than BLAST, Bioinformatics, 26, 2460–2461, https://doi.org/10.1093/bioinformatics/btq461, 2010.
Edgar, R. C.: Accuracy of taxonomy prediction for 16S rRNA and fungal ITS sequences, PeerJ, 6, e4652, https://doi.org/10.7717/peerj.4652, 2018.
Elbert, W., Taylor, P. E., Andreae, M. O., and Pöschl, U.: Contribution of fungi to primary biogenic aerosols in the atmosphere: wet and dry discharged spores, carbohydrates, and inorganic ions, Atmos. Chem. Phys., 7, 4569–4588, https://doi.org/10.5194/acp-7-4569-2007, 2007.
Failor, K. C., Schmale Iii, D. G., Vinatzer, B. A., and Monteil, C. L.: Ice nucleation active bacteria in precipitation are genetically diverse and nucleate ice by employing different mechanisms, ISME J., 11, 2740–2753 https://doi.org/10.1038/ismej.2017.124, 2017.
Fan, X.-L., Barrett, S. C. H., Lin, H., Chen, L.-L., Zhou, X., and Gao, J.-Y.: Rain pollination provides reproductive assurance in a deceptive orchid, Ann. Bot., 110, 953–958, https://doi.org/10.1093/aob/mcs165, 2012.
Firon, N., Nepi, M., and Pacini, E.: Water status and associated processes mark critical stages in pollen development and functioning, Ann. Bot., 109, 1201–1214, https://doi.org/10.1093/aob/mcs070, 2012.
Franchi, G. G., Piotto, B., Nepi, M., Pacini, E., Baskin, J. M., and Baskin, C. C.: Pollen and seed desiccation tolerance in relation to degree of developmental arrest, dispersal, and survival, J. Exp. Bot., 62, 5267–5281, https://doi.org/10.1093/jxb/err154, 2011.
Gallenmüller, F., Langer, M., Poppinga, S., Kassemeyer, H.-H., and Speck, T.: Spore liberation in mosses revisited, AoB Plants, 10, plx075, https://doi.org/10.1093/aobpla/plx075, 2017.
Gastaminza, G., Lombardero, M., Bernaola, G., Antepara, I., Muñoz, D., Gamboa, P. M., Audicana, M. T., Marcos, C., and Ansotegui, I. J.: Allergenicity and cross-reactivity of pine pollen, Clin. Exp. Allergy, 39, 1438–1446, https://doi.org/10.1111/j.1365-2222.2009.03308.x, 2009.
Gong, X., Wang, Q., Lu, S., Suzuki, M., Nakajima, D., Sekiguchi, K., and Miwa, M.: Size distribution of allergenic Cry j 2 released from airborne Cryptomeria japonica pollen grains during the pollen scattering seasons, Aerobiologia, 33, 59–69, https://doi.org/10.1007/s10453-016-9450-6, 2017.
Guyon, P., Graham, B., Roberts, G. C., Mayol-Bracero, O. L., Maenhaut, W., Artaxo, P., and Andreae, M. O.: Sources of optically active aerosol particles over the Amazon forest, Atmos. Environ., 38, 1039–1051, https://doi.org/10.1016/j.atmosenv.2003.10.051, 2004.
Hagerup, O.: Rain-pollination, Biologiske Meddelelser [Kongelige Danske Videnskabernes Selskab], 18, 1–19, 1950.
Halbritter, H.: Prunus avium, in: PalDat – A palynological database: available at: https://www.paldat.org/pub/Prunus_avium/301736 (last access: 28 January 2019), 2016a.
Halbritter, H.: Dactylis glomerata, in: PalDat – A palynological database: available at: https://www.paldat.org/pub/Dactylis_glomerata/301831 (last access: 28 January 2019), 2016b.
Halbritter, H.: Acer tataricum, in: PalDat – A palynological database: available at: https://www.paldat.org/pub/Acer_tataricum/302708 (last access: 28 January 2019), 2016c.
Halbritter, H.: Amorpha fruticosa, in: PalDat – A palynological database: available at: https://www.paldat.org/pub/Amorpha_fruticosa/301921 (last access: 28 January 2019), 2016d.
Halbritter, H.: Humulus lupulus, in: PalDat – A palynological database: available at: https://www.paldat.org/pub/Humulus_lupulus/302399 (last access: 28 January 2019), 2016e.
Halbritter, H. and Diethart, B.: Platanus hispanica, in: PalDat – A palynological database: available at: https://www.paldat.org/pub/Platanus_hispanica/301217 (last access: 28 January 2019), 2016a.
Halbritter, H. and Diethart, B.: Betula pendula, in: PalDat – A palynological database: available at: https://www.paldat.org/pub/Betula_pendula/300732 (last access: 28 January 2019), 2016b.
Halbritter, H. and Sam, S.: Robinia pseudacacia, in: PalDat – A palynological database: available at: https://www.paldat.org/pub/Robinia_pseudacacia/301261 (last access: 28 January 2019), 2016a.
Halbritter, H. and Sam, S.: Juglans regia, in: PalDat – A palynological database: available at: https://www.paldat.org/pub/Juglans_regia/301279 (last access: 28 January 2019), 2016b.
Halbritter, H. and Svojtka, M.: Medicago falcata, in: PalDat – A palynological database: available at: https://www.paldat.org/pub/Medicago_falcata/300601 (last access: 28 January 2019), 2016.
Halbritter, H. and Weis, B.: Artemisia glacialis, in: PalDat – A palynological database: available at: https://www.paldat.org/pub/Artemisia_glacialis/300293 (last access: 28 January 2019), 2016.
Halbritter, H., Schneider, H., and Weber, M.: Lolium perenne, in: PalDat – A palynological database: available at: https://www.paldat.org/pub/Lolium_perenne/300032 (last access: 28 January 2019), 2015.
Heald, C. L. and Spracklen, D. V.: Atmospheric budget of primary biological aerosol particles from fungal spores, Geophys. Res. Lett., 36, L09806, https://doi.org/10.1029/2009GL037493, 2009.
Hill, M. O., Preston, C. D., Bosanquet, S. D. S., and Roy, D. B.: BRYOATT: attributes of British and Irish mosses, liverworts and hornworts, Centre for Ecology and Hydrology, Cambridge, 2007.
Hinds, W. C.: Aerosol technology: Properties, behavior, and measurement of airborne particles, 2nd ed., John Wiley & Sons, Inc., New York, NY, 1999.
Hirst, J. M.: An automatic volumetric spore trap, Ann. Appl. Biol., 39, 257–265, https://doi.org/10.1111/j.1744-7348.1952.tb00904.x, 1952.
Hoose, C., Kristjánsson, J. E., and Burrows, S. M.: How important is biological ice nucleation in clouds on a global scale?, Environ. Res. Lett., 5, 024009, https://doi.org/10.1088/1748-9326/5/2/024009, 2010.
Hospodsky, D., Yamamoto, N., and Peccia, J.: Accuracy, precision, and method detection limits of quantitative PCR for airborne bacteria and fungi, Appl. Environ. Microbiol., 76, 7004–7012, https://doi.org/10.1128/aem.01240-10, 2010.
Jacobson, A. R. and Morris, S. C.: The primary air pollutants – Viable particles, their occurrence, sources, and effects, in: Air Pollution, 3rd ed., edited by: Stern, A. C., Academic Press, New York, NY, 1976.
Jacobson, M. Z. and Streets, D. G.: Influence of future anthropogenic emissions on climate, natural emissions, and air quality, J. Geophys. Res.-Atmos., 114, D08118, https://doi.org/10.1029/2008jd011476, 2009.
Johnson, D. B.: The role of giant and ultragiant aerosol particles in warm rain initiation, J. Atmos. Sci., 39, 448–460, https://doi.org/10.1175/1520-0469(1982)039<0448:TROGAU>2.0.CO; 2, 1982.
Jung, I. Y., and Choi, K. R.: Relationship between airborne pollen concentrations and meteorological parameters in Ulsan, Korea, J. Ecol. Environ., 36, 65–71, https://doi.org/10.5141/ecoenv.2013.008, 2013.
Karsten, U., Herburger, K., and Holzinger, A.: Dehydration, temperature and light tolerance in members of the aeroterrestrial green algal genus Interfilum (Streptophyta) from biogeographically different temperate soils, J. Phycol., 50, 804–816, https://doi.org/10.1111/jpy.12210, 2014.
Kespohl, S., Merget, R., Overlack, A., and Raulf-Heimsoth, M.: Detection of novel occupational wood allergens in locust wood dust (Robinia pseudoacacia L.), J. Allergy Clin. Immunol., 118, 522–524, https://doi.org/10.1016/j.jaci.2006.03.042, 2006.
Korea National Arboretum: Seed atlas of Korea, Sumeunki Publishing Co., Seoul, Korea, 2017.
Korea Research Institute of Bioscience and Biotechnology: Korea wild plant seed pictorial book: available at: https://www.data.go.kr/dataset/3069839/fileData.do, last access: 19 March 2019, 2016.
Landis, M. S. and Keeler, G. J.: Critical evaluation of a modified automatic wet-only precipitation collector for mercury and trace element determinations, Environ. Sci. Technol., 31, 2610–2615, https://doi.org/10.1021/es9700055, 1997.
Lee, M.: An analysis on the concentration characteristics of PM2.5 in Seoul, Korea from 2005 to 2012, Asia-Pac, J. Atmos. Sci., 50, 585–594, https://doi.org/10.1007/s13143-014-0048-z, 2014.
Leontidou, K., Vernesi, C., De Groeve, J., Cristofolini, F., Vokou, D., and Cristofori, A.: DNA metabarcoding of airborne pollen: new protocols for improved taxonomic identification of environmental samples, Aerobiologia, 34, 63–74, https://doi.org/10.1007/s10453-017-9497-z, 2018.
Levetin, E.: Methods for aeroallergen sampling, Curr. Allergy Asthma Rep., 4, 376–383, https://doi.org/10.1007/s11882-004-0088-z, 2004.
Möhler, O., DeMott, P. J., Vali, G., and Levin, Z.: Microbiology and atmospheric processes: The role of biological particles in cloud physics, Biogeosciences, 4, 1059–1071, https://doi.org/10.5194/bg-4-1059-2007, 2007.
Mariraj Mohan, S.: An overview of particulate dry deposition: measuring methods, deposition velocity and controlling factors, Int. J. Environ. Sci. Technol., 13, 387–402, https://doi.org/10.1007/s13762-015-0898-7, 2016.
Mayol, E., Jiménez, M. A., Herndl, G. J., Duarte, C. M., and Arrieta, J. M.: Resolving the abundance and air-sea fluxes of airborne microorganisms in the North Atlantic Ocean, Front. Microbiol., 5, 557–557, https://doi.org/10.3389/fmicb.2014.00557, 2014.
Mayol, E., Arrieta, J. M., Jiménez, M. A., Martínez-Asensio, A., Garcias-Bonet, N., Dachs, J., González-Gaya, B., Royer, S.-J., Benítez-Barrios, V. M., Fraile-Nuez, E., and Duarte, C. M.: Long-range transport of airborne microbes over the global tropical and subtropical ocean, Nat. Commun., 8, 201, https://doi.org/10.1038/s41467-017-00110-9, 2017.
Miguel, A. G., Taylor, P. E., House, J., Glovsky, M. M., and Flagan, R. C.: Meteorological influences on respirable fragment release from Chinese elm pollen, Aerosol Sci. Technol., 40, 690–696, https://doi.org/10.1080/02786820600798869, 2006.
Molina, R. T., Rodríguez, A. M., Palaciso, I. S., and López, F. G.: Pollen production in anemophilous trees, Grana, 35, 38–46, https://doi.org/10.1080/00173139609430499, 1996.
Monroy-Colín, A., Silva-Palacios, I., Tormo-Molina, R., Maya-Manzano, J. M., Rodríguez, S. F., and Gonzalo-Garijo, Á.: Environmental analysis of airborne pollen occurrence, pollen source distribution and phenology of Fraxinus angustifolia, Aerobiologia, 34, 269–283, https://doi.org/10.1007/s10453-018-9512-z, 2018.
Morris, C. E., Conen, F., Alex Huffman, J., Phillips, V., Pöschl, U., and Sands, D. C.: Bioprecipitation: a feedback cycle linking Earth history, ecosystem dynamics and land use through biological ice nucleators in the atmosphere, Glob. Change Biol., 20, 341–351, https://doi.org/10.1111/gcb.12447, 2014.
Mullaugh, K. M., Byrd, J. N., Avery, G. B., Mead, R. N., Willey, J. D., and Kieber, R. J.: Characterization of carbohydrates in rainwater from the Southeastern North Carolina, Chemosphere, 107, 51–57, https://doi.org/10.1016/j.chemosphere.2014.03.014, 2014.
Núñez, A., Amo de Paz, G., Ferencova, Z., Rastrojo, A., Guantes, R., García, A. M., Alcamí, A., Gutiérrez-Bustillo, A. M., and Moreno, D. A.: Validation of the Hirst-type spore trap for simultaneous monitoring of prokaryotic and eukaryotic biodiversities in urban air samples by next-generation sequencing, Appl. Environ. Microbiol., 83, e00472-00417, https://doi.org/10.1128/aem.00472-17, 2017.
Noh, Y. M., Müller, D., Lee, H., and Choi, T. J.: Influence of biogenic pollen on optical properties of atmospheric aerosols observed by lidar over Gwangju, South Korea, Atmos. Environ., 69, 139–147, https://doi.org/10.1016/j.atmosenv.2012.12.018, 2013.
Noll, K. E. and Khalili, E. K.: Characterization of pollen deposition in a forest environment, Atmos. Environ., 24, 951–957, https://doi.org/10.1016/0960-1686(90)90297-Z, 1990.
Oh, J.-W., Lee, H.-B., Kang, I.-J., Kim, S.-W., Park, K.-S., Kook, M.-H., Kim, B.-S., Baek, H.-S., Kim, J.-H., Kim, J.-K., Lee, D.-J., Kim, K.-R., and Choi, Y.-J.: The revised edition of korean calendar for allergenic pollens, Allergy Asthma Immunol. Res., 4, 5–11, https://doi.org/10.4168/aair.2012.4.1.5, 2012.
Park, Ko, Kim, Jeoung, and Hong: Identification and characterization of the major allergen of the Humulus japonicus pollen, Clin. Exp. Allergy, 29, 1080–1086, https://doi.org/10.1046/j.1365-2222.1999.00615.x, 1999.
Peksa, O. and Škaloud, P.: Changes in chloroplast structure in lichenized algae, Symbiosis, 46, 153–160, 2008.
Pérez-Calderón, R., Gonzalo-Garijo, M. Á., Rodríguez-Velasco, F. J., Sánchez-Vega, S., and Bartolomé-Zavala, B.: Occupational respiratory allergy in peach crop workers, Allergy, 72, 1556–1564, https://doi.org/10.1111/all.13163, 2017.
Pope, F. D.: Pollen grains are efficient cloud condensation nuclei, Environ. Res. Lett., 5, 044015, https://doi.org/10.1088/1748-9326/5/4/044015, 2010.
Pöschl, U., Martin, S. T., Sinha, B., Chen, Q., Gunthe, S. S., Huffman, J. A., Borrmann, S., Farmer, D. K., Garland, R. M., Helas, G., Jimenez, J. L., King, S. M., Manzi, A., Mikhailov, E., Pauliquevis, T., Petters, M. D., Prenni, A. J., Roldin, P., Rose, D., Schneider, J., Su, H., Zorn, S. R., Artaxo, P., and Andreae, M. O.: Rainforest aerosols as biogenic nuclei of clouds and precipitation in the Amazon, Science, 329, 1513–1516, https://doi.org/10.1126/science.1191056, 2010.
Pouleur, S., Richard, C., Martin, J.-G., and Antoun, H.: Ice nucleation activity in Fusarium acuminatum and Fusarium avenaceum, Appl. Environ. Microbiol., 58, 2960–2964, 1992.
Sabban, L. and van Hout, R.: Measurements of pollen grain dispersal in still air and stationary, near homogeneous, isotropic turbulence, J. Aerosol Sci., 42, 867–882, https://doi.org/10.1016/j.jaerosci.2011.08.001, 2011.
Sam, S. and Halbritter, H.: Ambrosia artemisiifolia, in: PalDat – A palynological database: available at: https://www.paldat.org/pub/Ambrosia_artemisiifolia/300425 (last access: 28 January 2019), 2016.
Sands, D., Langhans, V. E., Scharen, A. L., and De Smet, G.: The association between bacteria and rain and possible resultant meteorological implications, J. Hungarian Meteorol. Serv., 86, 148–152, 1982.
Sassen, K., Arnott, W. P., Starr, D. O. C., Mace, G. G., Wang, Z., and Poellot, M. R.: Midlatitude cirrus clouds derived from hurricane Nora: A case study with implications for ice crystal nucleation and shape, J. Atmos. Sci., 60, 873–891, https://doi.org/10.1175/1520-0469(2003)060<0873:MCCDFH>2.0.CO;2, 2003.
Schlichting, H. E.: The importance of airborne algae and protozoa, J. Air Pollut. Control Assoc., 19, 946–951, https://doi.org/10.1080/00022470.1969.10469362, 1969.
Schloss, P. D., Westcott, S. L., Ryabin, T., Hall, J. R., Hartmann, M., Hollister, E. B., Lesniewski, R. A., Oakley, B. B., Parks, D. H., Robinson, C. J., Sahl, J. W., Stres, B., Thallinger, G. G., Van Horn, D. J., and Weber, C. F.: Introducing mothur: Open-source, platform-independent, community-supported software for describing and comparing microbial communities, Appl. Environ. Microbiol., 75, 7537–7541, https://doi.org/10.1128/aem.01541-09, 2009.
Schwendemann, A. B., Wang, G., Mertz, M. L., McWilliams, R. T., Thatcher, S. L., and Osborn, J. M.: Aerodynamics of saccate pollen and its implications for wind pollination, Am. J. Bot., 94, 1371–1381, https://doi.org/10.3732/ajb.94.8.1371, 2007.
Sickel, W., Ankenbrand, M. J., Grimmer, G., Holzschuh, A., Härtel, S., Lanzen, J., Steffan-Dewenter, I., and Keller, A.: Increased efficiency in identifying mixed pollen samples by meta-barcoding with a dual-indexing approach, BMC Ecol., 15, 20, https://doi.org/10.1186/s12898-015-0051-y, 2015.
So, H. J., Moon, S. J., Hwang, S. Y., Kim, J. H., Jang, H. J., Jo, J. H., Sung, T. J., and Lim, D. H.: Characteristics of airborne pollen in Incheon and Seoul (2015–2016), Asia Pacific Allergy, 7, 138–147, https://doi.org/10.5415/apallergy.2017.7.3.138, 2017.
Song, U., Park, J., and Song, M.: Pollen morphology of Pinus (Pinaceae) in northeast China, Forest Sci. Technol., 8, 179–186, https://doi.org/10.1080/21580103.2012.704973, 2012.
Sosnoskie, L. M., Webster, T. M., Dales, D., Rains, G. C., Grey, T. L., and Culpepper, A. S.: Pollen grain size, density, and settling velocity for Palmer Amaranth (Amaranthus palmeri), Weed Sci., 57, 404–409, https://doi.org/10.1614/WS-08-157.1, 2017.
Spänkuch, D., Döhler, W., and Güldner, J.: Effect of coarse biogenic aerosol on downwelling infrared flux at the surface, J. Geophys. Res.-Atmos., 105, 17341–17350, https://doi.org/10.1029/2000jd900173, 2000.
Tesson, S. V. M., Skjøth, C. A., Šantl-Temkiv, T., and Löndahl, J.: Airborne microalgae: insights, opportunities, and challenges, Appl. Environ. Microbiol., 82, 1978–1991, https://doi.org/10.1128/aem.03333-15, 2016.
Tragin, M. and Vaulot, D.: Green microalgae in marine coastal waters: The Ocean Sampling Day (OSD) dataset, Sci. Rep., 8, 14020, https://doi.org/10.1038/s41598-018-32338-w, 2018.
Unfried, I. and Gruendler, P.: Nucleotide sequence of the 5.8S and 25S rRNA genes and of the internal transcribed spacers from Arabidopsis thaliana, Nucleic Acids Res., 18, 4011, 1990.
Watanabe, K. and Ohizumi, T.: Comparability between Durham method and real-time monitoring for long-term observation of Japanese cedar (Cryptomeria japonica) and Japanese cypress (Cryptomeria obtusa) pollen counts in Niigata prefecture, Japan, Aerobiologia, 34, 257–267, https://doi.org/10.1007/s10453-018-9511-0, 2018.
White, J. F. and Bernstein, D. I.: Key pollen allergens in North America, Ann. Allergy Asthma Immunol., 91, 425–435, https://doi.org/10.1016/S1081-1206(10)61509-8, 2003.
Woo, C., An, C., Xu, S., Yi, S.-M., and Yamamoto, N.: Taxonomic diversity of fungi deposited from the atmosphere, ISME J., 12, 2051–2060, https://doi.org/10.1038/s41396-018-0160-7, 2018.
Yamamoto, N., Nazaroff, W. W., and Peccia, J.: Assessing the aerodynamic diameters of taxon-specific fungal bioaerosols by quantitative PCR and next-generation DNA sequencing, J. Aerosol Sci., 78, 1–10, https://doi.org/10.1016/j.jaerosci.2014.08.007, 2014.
Yamamoto, N., Matsuki, Y., Yokoyama, H., and Matsuki, H.: Relationships among indoor, outdoor, and personal airborne Japanese cedar pollen counts, PLoS ONE, 10, e0131710, https://doi.org/10.1371/journal.pone.0131710, 2015.
Yi, S.-M., Holsen, T. M., and Noll, K. E.: Comparison of dry eeposition predicted from models and measured with a water surface sampler, Environ. Sci. Technol., 31, 272–278, https://doi.org/10.1021/es960410g, 1997.
Zanatta, F., Patiño, J., Lebeau, F., Massinon, M., Hylander, K., de Haan, M., Ballings, P., Degreef, J., and Vanderpoorten, A.: Measuring spore settling velocity for an improved assessment of dispersal rates in mosses, Ann. Bot., 118, 197–206, https://doi.org/10.1093/aob/mcw092, 2016.
Żuraw, B., Sulborska, A., Stawiarz, E., and Weryszko-Chmielewska, E.: Flowering biology and pollen production of four species of the genus Rosa L., Acta Agrobot., 68, 267–278, https://doi.org/10.5586/aa.2015.031, 2015.