the Creative Commons Attribution 4.0 License.
the Creative Commons Attribution 4.0 License.
Convective hydration in the tropical tropopause layer during the StratoClim aircraft campaign: pathway of an observed hydration patch
Keun-Ok Lee
Thibaut Dauhut
Jean-Pierre Chaboureau
Sergey Khaykin
Martina Krämer
Christian Rolf
The source and pathway of the hydration patch in the TTL (tropical tropopause layer) that was measured during the Stratospheric and upper tropospheric processes for better climate predictions (StratoClim) field campaign during the Asian summer monsoon in 2017 and its connection to convective overshoots are investigated. During flight no. 7, two remarkable layers are measured in the TTL, namely (1) the moist layer (ML) with a water vapour content of 4.8–5.7 ppmv in altitudes of 18–19 km in the lower stratosphere and (2) the ice layer (IL) with ice content up to 1.9 eq. ppmv (equivalent parts per million by volume) in altitudes of 17–18 km in the upper troposphere at around 06:30 UTC on 8 August to the south of Kathmandu (Nepal). A Meso-NH convection-permitting simulation succeeds in reproducing the characteristics of the ML and IL. Through analysis, we show that the ML and IL are generated by convective overshoots that occurred over the Sichuan Basin about 1.5 d before. Overshooting clouds develop at altitudes up to 19 km, hydrating the lower stratosphere of up to 20 km with 6401 t of water vapour by a strong-to-moderate mixing of the updraughts with the stratospheric air. A few hours after the initial overshooting phase, a hydration patch is generated, and a large amount of water vapour (above 18 ppmv) remains at even higher altitudes up to 20.5 km while the anvil cloud top descends to 18.5 km. At the same time, a great part of the hydrometeors falls shortly, and the water vapour concentration in the ML and IL decreases due to turbulent diffusion by mixing with the tropospheric air, ice nucleation, and water vapour deposition. As the hydration patch continues to travel toward the south of Kathmandu, tropospheric tracer concentration increases up to ∼30 % and 70 % in the ML and IL, respectively. The air mass in the layers becomes gradually diffused, and it has less and less water vapour and ice content by mixing with the dry tropospheric air.
- Article
(5817 KB) - Full-text XML
-
Supplement
(793 KB) - BibTeX
- EndNote
The Asian summer monsoon anticyclone is one of the most pronounced circulation patterns in the Northern Hemisphere, and it is a dominant climatological feature of the global circulation during boreal summer (Mason and Anderson, 1963; Randel and Park, 2006). The monsoon circulation horizontally covers large parts of southern Asia and the Middle East and is located on the edge of the tropics and subtropics. It consists of cyclonic flow and convergence in the lower troposphere together with strong anticyclonic circulation and divergence in the upper troposphere. This circulation is coupled with persistent deep convection over the southern Asia region during summer (June to September; Hoskins and Rodwell, 1995). The monsoon tropopause is relatively high at about 4.2 ppmv; the upper tropospheric anticyclonic circulation extends into the lower stratosphere, spanning from around 300 and 70 hPa, i.e. approximately the whole upper troposphere and lower stratosphere (UTLS; Highwood and Hoskins, 1998; Randel and Park, 2006).
Due to the strong dynamical signature in the UTLS, the influence of the monsoon is evident in chemical constituents; i.e. water vapour is relatively high, at about 4.2 ppmv (Wright et al., 2011); ozone is relatively low (Randel et al., 2001); and methane, nitrogen oxides, and carbon monoxide are relatively high (Park et al., 2004; Liu and Zipser, 2005). Especially, the water vapour in the UTLS is controlled by the troposphere-to-stratosphere transport of moisture across the tropical tropopause layer (TTL), located between ∼150 hPa (355 K, 14 km) and ∼70 hPa (425 K, 18.5 km; Fueglistaler et al., 2009; Rolf et al., 2018). It is mainly driven by the large-scale cold-point tropopause temperature field but also processes involving convection, gravity waves, and cirrus cloud microphysics that modulate TTL humidity.
Convective overshoots that penetrate the tropopause directly inject air and water into the stratosphere. Fundamentally, convection arises from the temperature difference between a parcel of warm air and the cooler air surrounding it. Warm air, which is less dense, i.e. more buoyant, rises through the atmospheric column and adiabatically expands and cools. When the temperature of the rising air parcel has cooled sufficiently, the water vapour it contains will begin to condense and release latent heat. If air parcels within the convective core have enough upward momentum, they continue to rise beyond their equilibrium level of zero buoyancy and form overshoots. They eventually form an overshoot that penetrates into the lowermost stratosphere by crossing the cold-point tropopause. The convective overshoots have the potential to increase the humidity in the stratosphere via rapid sublimation of convectively lofted ice and mixing with dry stratospheric air. This has been demonstrated in previous studies in both modelling and measurement (Dessler and Sherwood, 2004; Chaboureau et al., 2007; Jensen et al., 2007; Homeyer et al., 2014, 2017; Khaykin et al., 2016; Rysman et al., 2016; Smith et al., 2017; Dauhut et al., 2018; Funatsu et al., 2018; among others). Even a small volume of tropospheric air can carry a significant quantity of water in the condensed phase. Mixing of tropospheric air with the surrounding stratosphere, which is typically subsaturated, facilitates the rapid sublimation of lofted ice. Also, the origin of the injected water to the TTL has been studied by backward-trajectory analysis at global scale, and it was found that the convective sources are generally higher over the continental part of the Asian monsoon region in comparison to other tropical regions, with shorter transit times (Tzella and Legras, 2011; Tissier and Legras, 2016). However, the net contribution of convective overshoots to stratospheric water vapour concentration is not well understood at the mesoscale and is not well represented in global models because of the small spatial scales (less than a few kilometres) and short timescales (less than few hours) over which convection occurs.
The tropical aircraft campaign of the Stratospheric and upper tropospheric processes for better climate predictions (StratoClim; http://www.stratoclim.org/, last access: 19 September 2019) took place in summer 2017. It aimed to improve our knowledge of the key processes, i.e. microphysical, chemical, and dynamical processes, which determine the composition of the UTLS, such as the formation, loss, and redistribution of chemical constituents (water vapour, ozone, and aerosol). During the campaign, eight dedicated flights were successfully operated with the objective of documenting the connection between the moisture plumes in the UTLS and the convective sources from south Kathmandu, Nepal, during the summer monsoon season.
Our study focuses on part of flight no. 7 to the south of Kathmandu, measuring the stratospheric hydration in the altitudes between 17 and 19 km. The objective of our work is to investigate the source and pathway of the localized moisture in the TTL that was measured by aircraft in connection to a convective overshoot. This is done using a combination of airborne and spaceborne observations as well as a convection-permitting simulation performed with a fine resolution in the TTL.
A detailed description of the dataset is given in Sect. 2. Section 3 presents the moistened TTL signature captured by airborne and spaceborne observations and the numerical simulation. Section 4 demonstrates the convective origin of the enhanced moisture and shows its evolution along its path in the lower stratosphere. A summary and discussion of the findings of the present study are given in Sect. 5.
M55-Geophysica aircraft deployment in Kathmandu during the Asian summer monsoon in July–August 2017 provided unprecedented sampling of the UTLS region above the southern slopes of Himalayas. More details concerning the observational datasets used in this study together with the airborne and spaceborne measurements and the convection-permitting simulation are provided in the following.
2.1 StratoClim airborne observations
During flight no. 7, the M55-Geophysica aircraft flew back and forth between Kathmandu in Nepal and west Bengal in India (for the track, see the red line in Fig. 1) from 04:30 to 06:50 UTC on 8 August 2017. The in situ sensor aboard the aircraft measures the relative humidity with respect to ice (hereafter called simply “relative humidity” or “RHice”), temperature, and wind speed and direction every 1 s. FLASH (Fluorescent Lyman-α Stratospheric Hygrometer for Aircraft) and FISH (Fast In situ Stratospheric Hygrometer) instruments aboard the Geophysica aircraft sampled the vertical water vapour and ice content distribution every 1 s, respectively.
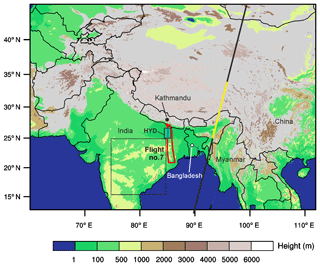
Figure 1Topography and domain considered in the Meso-NH numerical simulation with a resolution of 2.5 km. The trajectory of the Geophysica flight no. 7 to the south of Kathmandu is shown by the red solid line, while the pathway of moist patch (25–26.5∘ N) is depicted by the blue line. A black box “HYD” is a model domain considered in comparison with aircraft measurement. Another box with dashed line is a model domain used to calculate the background water vapour at 06:00 UTC on 8 August 2017. The track of CALIOP at around 20:00 UTC on 7 August 2017 is shown by the black solid line, while its track between 25 and 33∘ N is highlighted in yellow.
FLASH-A is an advanced version of the airborne FLASH instrument (Sitnikov et al., 2007; Khaykin et al., 2013) previously flown aboard the M55-Geophysica aircraft. FLASH-A has a rear-facing inlet allowing measurement of gas-phase water in the altitude range between 12 and 21 km, with the latter being the aircraft ceiling altitude. Total uncertainty of water vapour measurement amounts to 9 %, with a detection limit of 0.2 ppmv, whereas the measurement precision at 1 Hz sampling is better than 6 %.
FISH is a closed-path Lyman-α photo fragment fluorescence hygrometer that measures total water (sum of gas phase and evaporated ice crystals) in the range of 1–1000 ppmv between 50 and 500 hPa levels, with an accuracy and precision of 6 %–8 % and 0.3 ppmv (Zöger et al., 1999; Meyer et al., 2015). The time resolution of the measurements is 1 Hz. Inside of ice clouds, ice water content (IWC) is calculated by subtracting the gas-phase water measured by FLASH from the total water detected by FISH, as described by Afchine et al. (2018). The minimum detectable IWC is ppmv ( mg m−3).
2.2 Spaceborne observation
Calibrated thermal infrared brightness temperature (BT) data at 10.8 µm wavelength, acquired every 15 min by the Spinning Enhanced Visible and Infrared Imager (SEVIRI) aboard the geostationary Meteosat Second Generation satellite (MSG), were employed to investigate the evolution of deep convection. The spatial resolution of the MSG–SEVIRI data used is 0.05∘ in both latitude and longitude. BT minima are generally indicative of the cloud top overshoots associated with deep convection (e.g. Kato, 2006; Lee et al., 2016).
Vertical profiles of backscatter retrieved from the Cloud-Aerosol Lidar with Orthogonal Polarization (CALIOP) aboard CALIPSO (Winker et al., 2009) with a wavelength at 532 nm are used. CALIOP provides observations of particles, including high clouds, with a very high sampling resolution of 30 and 335 m in the vertical and horizontal directions, respectively.
2.3 Cloud-resolving numerical simulation
The target convective overshoots and the moistened TTL were simulated using the non-hydrostatic numerical research model, Meso-NH (Lac et al., 2018). For a fine-scale analysis, the simulation uses about 400 million grid points with horizontal grid spacing of 2.5 km. The vertical grid has 144 stretched levels (Gal-Chen and Somerville, 1975), with a spacing of 250 m in the free troposphere and the stratosphere and a finer resolution of 100 m close to the surface and between 16 and 19.5 km inside the TTL. The simulation domain covers northern India and China (Fig. 1; 5000 km × 3600 km), encompassing the track of flight no. 7 and the overshooting clouds over the Sichuan Basin. The simulation was initialized at 00:00 UTC on 6 August 2017, and the initial and lateral boundary conditions are provided by the operational European Centre for Medium-Range Weather Forecasts (ECMWF) analyses every 6 h. It ran for 3 d, providing outputs every 1 h.
The model employs a one-moment bulk microphysical scheme (Pinty and Jabouille, 1998), which governs the equations of six water categories (water vapour, cloud water, rainwater, pristine ice, snow, and graupel). For each particle type, the sizes follow a generalized gamma distribution, while power-law relationships allow the mass and fall speed to be linked to the diameters. Except for cloud droplets, each condensed water species has a nonzero fall speed. The turbulence parametrization is based on a 1.5-order closure (Cuxart et al., 2000) of the turbulent kinetic energy equation and uses the Bougeault and Lacarrere (1989) mixing length. The transport scheme for momentum variables is the weighted essentially non-oscillatory (WENO) scheme of the 5th order (Shu and Osher, 1988), while other variables are transported with the piecewise parabolic method (PPM) scheme (Colella and Woodward, 1984), a scheme with excellent mass-conservation properties and low numerical diffusion (Müller, 1992).
To assess the simulation, airborne measurement data (along about 25–26.5∘ N, 85.2∘ E; blue line in Fig. 1) between 06:20 and 06:48 UTC on 8 August 2017 are compared to the simulation results averaged in a box (25–26.5∘ N, 85–85.5∘ E; marked by “HYD” in Fig. 1) at 06:00 UTC on the same day. The CALIOP backscatter coefficients are compared to those simulated from the model outputs using the Meso-NH lidar simulator, which takes into account all the predicted scattering particles (Chaboureau et al., 2011). The MSG–SEVIRI BTs are compared to synthetic BTs computed offline using the radiative transfer model for the TIROS Operational Vertical Sounder (RTTOV) code version 11.3 (Saunders et al., 2013) from the simulation outputs (Chaboureau et al., 2008).
In this study, a “hydration patch” is defined as a region with a water vapour amount larger than the background value at the 410 K isentropic level. The background equals 5.2 ppmv, which corresponds to the water vapour averaged in the box (15–25∘ N , 74–84∘ E; shown with dashed line in Fig. 1). Such a hydration patch is located within the moist layer (ML) of 18–19 km altitude (see Fig. 2), corresponding to an enhanced value of water vapour observed during the last descent of flight no. 7 (see Sect. 3.1). Below the hydration patch, the ice layer (IL) is located between 17 and 18 km, where an increase in ice content is observed during the same period. The hydration patch is chased visually back in time every hour from 06:00 UTC on 8 August to 13:00 UTC on 6 August 2017 (for more details, see Fig. S1 in the Supplement), considering the prevailing wind direction and speed at the 410 K isentropic altitude. At 14:00 UTC, a large amount of water vapour (≥6.6 ppmv), which is injected by the convective overshoot in the Sichuan Basin, starts to appear at this altitude, generating a hydration patch. With the dominant north-easterlies (15–20 m s−1), it travels to the south of Kathmandu. The area of the hydration patch is about 6000 km2, but it is reduced by one-fourth to about 1500 km2 during the initial overshooting phase in the convective region. This domain is used to calculate the average values of water vapour, ice content, temperature, and relative humidity displayed in Figs. 9, 10, and 11.
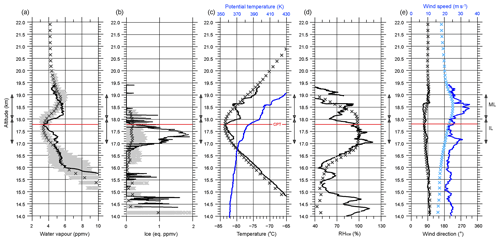
Figure 2Vertical profiles of (a) water vapour (ppmv), (b) ice (eq. ppmv), (c) temperature (∘C) and potential temperature (K), (d) relative humidity respect to ice (RHice; %), and (e) wind direction (degree) and speed (m s−1). In (a)–(e), the measured values along the blue-coloured track between 25 and 26.5∘ N (shown in Fig. 1) from 06:20 to 06:48 UTC on 8 August 2017 are shown as solid line, while the domain-averaged values in the region “HYD” (25–26.5∘ N, 85–85.5∘ E; shown in Fig. 1) from the Meso-NH simulation at 06:00 UTC on the same day are shown as crosses. In (a)–(e), the level of cold-point tropopause (CPT) is indicated by a red line. In (a) and (b), all the values from Meso-NH within the “HYD” are displayed as grey crosses. The layers of the ML and IL are marked by arrows.
To understand the processes along the pathway of the hydration patch, four analysis times are selected: (1) a few hours before the overshoot development at 13:00 UTC on 6 August, (2) the overshoot development time at 21:00 UTC on the same day, (3) a few hours after the overshoots at 12:00 UTC on 7 August, and (4) the aircraft measurement time at 06:00 UTC on 8 August 2017. Several tropopause definitions exist, considering temperature lapse rate, potential vorticity, and static stability (WMO, 1957; Maddox and Mullendore, 2018). In this study, the overshoots are defined as convective cloud tops that reach the lowermost stratosphere above the 380 K level. This simple definition is sufficient enough to study the impact of convective hydration on the TTL as it quickly returns to its undisturbed state (Dauhut et al., 2018). A tracer of tropospheric air is also calculated online during the Meso-NH run. At the simulation initiation, the tropospheric and stratospheric air masses are divided by a boundary at the 380 K level, and the tracer values are set to 1 and 0 below and above the level, respectively. In other words, pure concentration of tropospheric (stratospheric) air has a tracer value equal to 100 % (0 %).
3.1 Moistened layers in the TTL
FISH and FLASH instruments aboard flight no. 7 measure moisture and ice content in the TTL to the south of Kathmandu along the track of 25–26.5∘ N, ∼85.2∘ E (blue line in Fig. 1), from 06:20 to 06:48 UTC on 8 August 2017. The ML and IL were observed. The ML is evident at altitudes of 18–19 km by the water vapour content of 4.8–5.7 ppmv (solid line in Fig. 2a), and the IL is apparent at altitudes of 17–18 km with the ice content of up to 1.9 eq. ppmv (equivalent parts per million by volume; solid line in Fig. 2b) and water vapour of 3.3–5.0 ppmv (solid line in Fig. 2a). The temperature minimum, which defines the cold-point tropopause (CPT; red line in Fig. 2c), equals −83.5 ∘C at 17.8 km in between the ML and IL (black line in Fig. 2c). In the ML, the potential temperature ranges between 394 and 428 K, while in the IL it ranges between 372 and 393 K (blue line in Fig. 2c). Figure 2d shows that RHice increases beyond 70 % in the ML and IL and that the IL is partly supersaturated, with an RHice of up to 118 %. In both the ML and IL, strong easterly wind prevails (black line in Fig. 2e), with wind speed exceeding 20 m s−1 (blue line in Fig. 2e), while easterlies stronger than 30 m s−1 are seen at 17 and 18.5 km altitudes.
Figure 2 also shows that Meso-NH succeeds in reproducing most of the measurements in the TTL. It reproduces the enhanced amount of water vapour in both the ML and IL. In the ML, the simulated water vapour in the range between 4.9 and 6.0 ppmv with an average value (black crosses in Fig. 2a) of 5.5 ppmv reproduces the measured 4.2–5.6 ppmv well. In the IL, the appearance of ice (black crosses in Fig. 2b) is simulated, but with a maximum value of 0.65 eq. ppmv, which is less by a factor of 3 compared to the measured concentrations. The simulation captures the CPT well at 17.8 km altitude and −83.3 ∘C (crosses in Fig. 2c), RHice values of 70 %–100 % between 16.5 and 18.5 km altitudes (crosses in Fig. 2d), and the strong easterly wind (black and blue crosses in Fig. 2e). Despite small vertical variations in water vapour and temperature that are missing around the CPT, the simulation is good enough for being used to investigate the source and the pathways of water in the ML and IL.
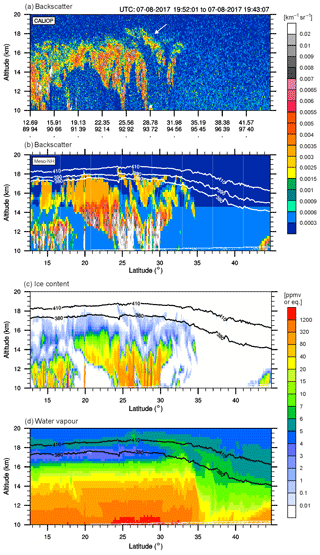
A few hours before the Geophysica measurements and upstream, some clouds were observed in the TTL by CALIOP at around 20:00 UTC on 7 August 2017. Figure 3a shows a V-shaped region of strong backscatter values of 0.001–0.008 km−1 sr−1 from 15 to 18.5 km altitudes over India along the track of 25.5–31.5∘ N (yellow line in Fig. 1). The V-shaped strong backscatter region is successfully reproduced by Meso-NH (Fig. 3b) at 15–18.5 km altitudes between 26.5 and 31∘ N, but with backscatter values lower than measured. The simulated V-shaped region is characterized by low ice content (≥0.1 eq. ppmv; Fig. 3c), while an above-background amount of water vapour of 5–7 ppmv is layered at altitudes higher than 18 km (Fig. 3d), where ML is located. The V-shaped strong backscatter region is possibly induced by waves propagating at these high altitudes, e.g. gravity waves. Investigating the mechanism at its origin is however beyond the scope of this article. It is worth noting that the above-background water vapour concentration and the ice content are already upstream (93–95∘ E) about 10 h before flight no. 7 (∼85.2∘ E) and that Meso-NH is able to resolve clouds in the UTLS.
3.2 Target convective overshoots
In the region where the ML and IL are located, the simulated hydration patch (water vapour ≥5.2 ppmv) is seen at the 410 K level at 06:00 UTC on 8 August 2017 (Fig. 4a). It is positioned above high-level clouds, as shown with BT values lower than −47 ∘C in both the MSG–SEVIRI imagery and the Meso-NH simulation in Fig. 5a and b (pointed by arrows), respectively. This hydration patch is advected from the east by the strong easterlies (about 25 m s−1; see Fig. 2e). At 12:00 UTC on 7 August, it is located around eastern India (Fig. 4c) and is associated with low BT values ( ∘C) in both the MSG–SEVIRI imagery (pointed by an arrow in Fig. 5c) and the Meso-NH simulation (Fig. 5d). This suggests that the hydration patch is generated by the injection of water by convective overshoots. The convective overshoots start to be seen from 14:00 UTC on 6 August over the Sichuan Basin (Fig. 4e), and they develop in this region until 21:00 UTC. During the period between 14:00 and 21:00 UTC, the developing overshoots collectively inject a large water vapour hourly budget of 896 t above the CPT (as the result of integrating the water vapour content between two isentropic altitudes of 380 and 530 K). The signature of overshoots is seen over the Sichuan Basin at 21:00 UTC by the large amount of water vapour in excess of 18 ppmv at the 410 K level (Fig. 4d) and by BT values lower than −80 ∘C (Fig. 5e and f). At 13:00 UTC, before the overshoot development, neither the water vapour mixing ratio larger than 5 ppmv nor BT values lower than −60 ∘C are distinguishable over the Sichuan Basin (box in Fig. 5g and h).
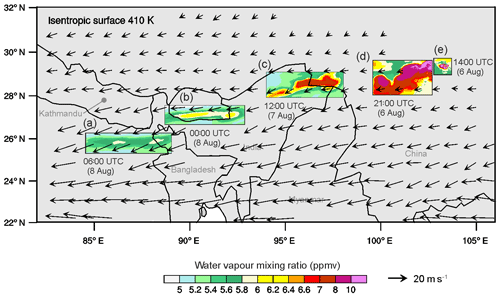
Figure 4Target moist patch. Horizontal distribution of water vapour mixing ratio at 410 K isentropic altitude at (a) 06:00 UTC, and (b) 00:00 UTC on 8 August, (c) 12:00 UTC on 7 August, and (d) 21:00 UTC and (e) 14:00 UTC on 6 August 2017. The horizontal wind at the altitude of 19 km (about 410 K isentrope) at 06:00 UTC on 8 August is displayed by vectors.
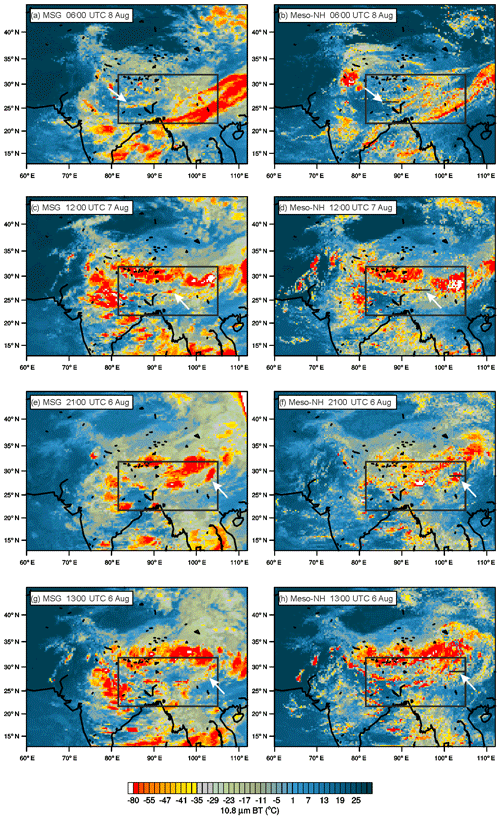
Figure 5BT at 10.8 µm obtained from MSG–SEVIRI (left) and Meso-NH (right) at (a, b) 06:00 UTC on 8 August, (c, d) 12:00 UTC on 7 August, (e, f) 21:00 UTC, and (g, h) 13:00 UTC on 6 August 2017. The domain used in Fig. 4 is marked by a box in each panel, while the location of vertical cross sections used in Figs. 6–9 is marked by a black solid line in the right panels. The location of the hydration patch is depicted by the white arrows.
In summary, a good agreement is achieved between the measurements (airborne and spaceborne) and the Meso-NH simulation. The analysis of the simulation shows that the water-enhanced layers in the ML and IL observed to the south of Kathmandu around 06:30 UTC on 8 August were generated by the injection of water by the convective overshoots produced over the Sichuan Basin during 14:00–21:00 UTC on 6 August.
4.1 Evolution of the hydration patch on its way to the south of Kathmandu
The hydration patch is described on its way from the Sichuan Basin to the south of Kathmandu. In the following, vertical sections of water vapour, ice content, and tropospheric tracer are shown across the hydration patch in the west–east orientation every 2 to 6 h (Figs. 6, 7, and 8). The vertical cross sections are centred over the hydration patch, all with the same size.
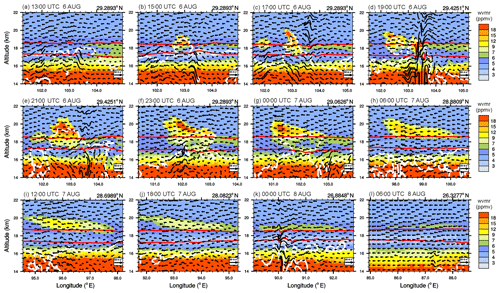
Figure 6Vertical cross sections of water vapour mixing ratio (wvmr) (shading) and wind (vectors) at (a) 13:00 UTC, (b) 15:00 UTC, (c) 17:00 UTC, (d) 19:00 UTC, (e) 21:00 UTC, and (f) 23:00 UTC on 6 August 2017; (g) 00:00 UTC, (h) 06:00 UTC, (i) 12:00 UTC, and (j) 18:00 UTC on 7 August 2017; and (k) 00:00 UTC and (l) 06:00 UTC on 8 August 2017. The isentropic altitudes of 380 and 410 K are depicted by the red lines. The latitude (∘ N) of west–east-oriented cross-section line is indicated at the upper right of each panel. The cloud boundary (mixing ratio of ice content of 10 mg kg−1) is contoured by the white solid line.
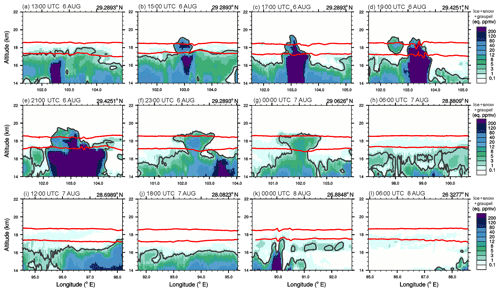
Figure 7Same as Fig. 6 but for the ice content. The isentropic altitudes of 380 and 410 K are depicted by the red lines.
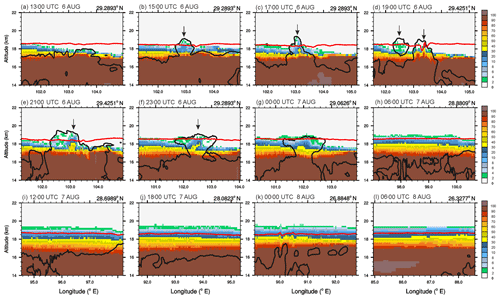
Figure 8Same as Fig. 6 but for the tracer (%). The isentropic altitude of 410 K is depicted by the red line. The changes of the tropospheric tracer by convective overshoots is marked by downward arrows.
4.1.1 Injection of water into the TTL by convective overshoots
The vertical cross sections of water vapour and ice content prove that the large amounts of water vapour and ice are injected above the 380 K level by the convective overshoots that occurred during 15:00–21:00 UTC on 6 August. At 13:00 UTC (Fig. 6a), just before the overshoot development, a strong upward motion is seen at 16–18 km altitudes, while the cloud top (black solid line) is located in the IL (about 17.5 km), just below the CPT. At 15:00 UTC (Fig. 6b), a large amount of water vapour (≥15 ppmv) is seen in the ML above 410 K level, while a large ice content in excess of 120 eq. ppmv is found in the IL, between the 380 and 410 K levels (Fig. 7b). Figure 8a and b show that during 15:00–17:00 UTC the concentration of the tropospheric tracer increases in both the ML and IL, with values of 4 % and 30 %, respectively.
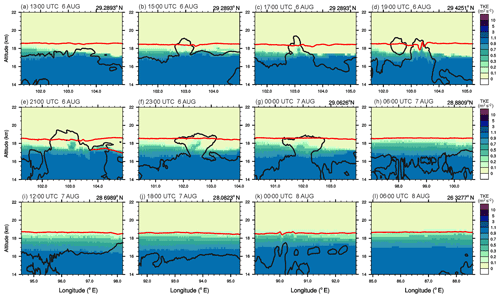
At 17:00 UTC an even higher cloud top is apparent at the ∼19.5 km altitude (Fig. 6c), a large amount of water vapour (≥18 ppmv) rises to ∼20 km, at around 103∘ E, and a large ice content (≥120 eq. ppmv) stays below 18 km altitude (Fig. 7c). The large amount of water is directly injected by convective overshoots mainly in the form of ice, as the ice-laden air within the convective overshoots mixes with the entrained stratospheric air during the collapse of the overshooting top. The warm, subsaturated stratospheric air causes the ice to rapidly sublimate into water vapour at the top of the overshoot, moistening the layer. It is worth noting that the water injected by the convective overshoots at 15:00 UTC is still apparent in the ML at 17:00 UTC at around 102∘ E, with a water vapour mixing ratio above 9 ppmv (Fig. 6c). In a similar way, the convectively injected large moisture at 17:00 UTC at around 103∘ E (Fig. 6c) is found in the ML at 19:00 UTC at around 102.5∘ E, with a water vapour mixing ratio larger than 15 ppmv (Fig. 6d). At 19:00 UTC (Fig. 6d), the strong convective updraughts perturb the isentropic surfaces (red solid lines), descending at the 410 K level largely from about 18.5 to 17.5 km. At 21:00 UTC a higher cloud top is found above ML in a wide area (102.3–103.3∘ E). The injected water vapour (≥18 ppmv) is transported above 20.5 km (Fig. 6e), while the concentration of 0.1 %–0.5 % of the tropospheric tracer is seen in the water vapour pocket. The large ice content exceeding 120 eq. ppmv is distributed mostly in the IL (Fig. 7e). During 15:00–21:00 UTC (Fig. 8b–e), a concentration of 2 %–20 % of the tropospheric tracer is consistently seen in the ML, while a higher concentration of 40 % is found in the IL. During 17:00–21:00 UTC (Fig. 9c–e), the large turbulent kinetic energy (TKE) of 0.2–0.9 m2 s−2 is apparent in a limited area of cloud top (∼103 ∘ E).
4.1.2 Evolution of the hydration patch along its pathway
From 23:00 UTC on 6 August to 06:00 UTC on 8 August 2017, the convective overshoots gradually diminish in the region of ∼28–25∘ N, ∼98–85∘ E (see Fig. 4). At 23:00 and 00:00 UTC, the anvil-shaped cloud above the 16 km altitude presents a rather flat cloud top around 19 km (Fig. 7f and g). The injected large amount of water vapour ≥18 ppmv is evident in the ML, even at higher altitudes up to 20.5 km (Fig. 6f and g), whereas the large ice content ≥120 eq. ppmv is no longer apparent in the IL (Fig. 7f and g). Within the anvil cloud, a still-large TKE value of 0.2–0.9 m2 s−2 is seen (Fig. 9f and g). During 06:00–18:00 UTC on 7 August, the water vapour mixing ratio in the ML gradually decreases from 15 to ∼9 ppmv; meanwhile the air mass in the IL becomes dry, with a water vapour mixing ratio below 4 ppmv (Fig. 6h–j). During the same period, the increase in tropospheric tracer concentration and TKE are evident in both the ML and IL. The air mass with a concentration higher than 40 % is apparent in the IL, while the air mass with a lower tropospheric concentration of around 2 %–30 % is seen in the IL (Fig. 8h–j).
The air mass with a high tropospheric tracer concentration of 2 %–40 % consistently exists in the ML and IL from 00:00 to 06:00 UTC on 8 August 2017 (Fig. 8k and l), while the TKE of 0.2–0.9 m2 s−2 exists in a wide area between the altitudes of 16 and 18 km (Fig. 9k and l). During this period, the hydration patch is further narrowed and widened in the ML (Fig. 6k and l), and the air mass becomes drier in the IL (≤3 ppmv). Note that even the low numerical diffusion of the PPM scheme also contributes to the dispersion of the hydration patch. At 00:00 UTC (Fig. 7k), new convection tops are apparent in altitudes of 16–17 km, and an increase in ice content above 3 eq. ppmv is seen in the IL. Then a decreased ice content of 0.1–1 eq. ppmv distributes in the IL at 06:00 UTC where a large ice content of around 1–1.9 eq. ppmv was measured (see Fig. 2b).
4.2 Processes affecting the hydration patch
The processes that affect the moist and ice layers are further described. To this objective, average quantities are calculated in the ML and IL. The hourly evolution of water vapour, ice content, temperature, and RHice shows the lifetime of the injected water in the ML and IL along the pathway of the hydration patch (Fig. 10). The profiles of tropospheric tracer, temperature, RHice, water vapour, ice content, and wind speed give a vertical view in the column across the tropical tropopause layer (Fig. 11). A scatter plot using tropospheric tracer and water vapour highlights the mixing processes occurring in the hydration patch (Fig. 12).
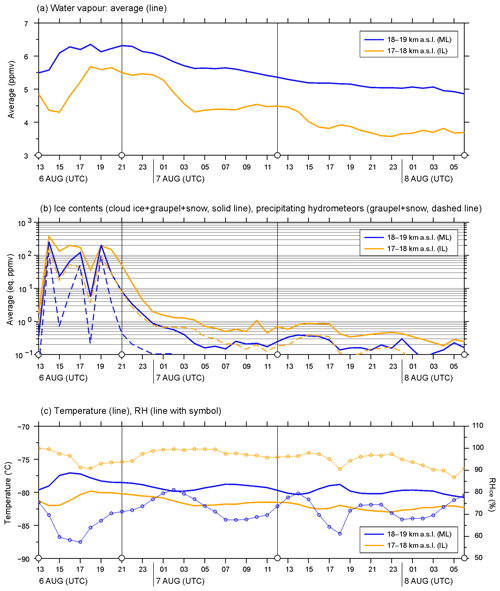
Figure 10Hourly evolution of (a) averaged water vapour (line), (b) averaged ice content (solid line; sum of ice, graupel, and snow) and the precipitating hydrometeor (dashed line; sum of graupel and snow), and (c) averaged temperature (line) and relative humidity (RHice; thin line with circle) in the altitudes of 17–18 km (yellow lines) and 18–19 km (blue lines) from 13:00 UTC on 6 August to 06:00 UTC on 8 August 2017. The four analysis times are marked by open circles on the x axis. Average and maximum values are calculated in the ML and IL.
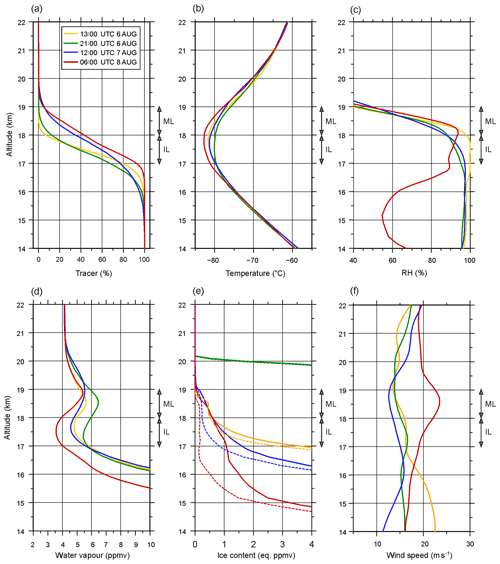
Figure 11Vertical profiles of (a) tracer (%), (b) temperature (∘C), (c) relative humidity (%), mixing ratios of (d) water vapour (ppmv), (e) ice content (eq. ppmv), and (f) wind speed (m s−1) across the hydration patch along the trajectory at 13:00 UTC (yellow line), 21:00 UTC (green line) on 6 August, 12:00 UTC on 7 August (blue line), and 06:00 UTC (red line) on 8 August 2017. The layers of the ML and IL are marked by arrows. In (e), the ice content is depicted by solid lines, while the cloud ice is shown by dashed lines.
4.2.1 Mixing of the overshoots with the stratospheric air
The hourly evolution of the average water vapour and the ice content along the pathway of the hydrated layer demonstrates the hydration in the TTL by the convective overshoots (Fig. 10). During the development of the convective overshoots between 14:00 and 21:00 UTC on 6 August 2017, the average water vapour mixing ratio increases to 5.7 ppmv in the IL (yellow solid line; Fig. 10a), while a large mixing ratio of 6.5 ppmv is seen in the ML (blue solid line in Fig. 10a). The ice content reaches more than 200 eq. ppmv in both layers and more than 300 eq. ppmv in the IL (Fig. 10b). Until 17:00 UTC, the temperature increases in both layers (solid lines in Fig. 10c), indicating the mixing with the warmer stratospheric air. Because of this entrained stratospheric air, RHice decreases largely below 60 % in the ML (blue line with symbols in Fig. 10c) and down to 90 % in the IL (yellow line with symbols). Due to the mixing with entrained warmer stratospheric air, the enriched water vapour layer then remains at this higher isentropic level after the overshoot collapses. The conditions and timescale of the detailed process trapping the enriched water vapour in the TTL were demonstrated by Dauhut et al. (2018). Thanks to a fine temporal resolution of 1 min, they revealed that this process occurs on short timescales within 20 min. The active mixing of the convective overshoots with the stratospheric air between 14:00 and 21:00 UTC is also evidenced by the evolution of vertical profiles of tropospheric tracer (Fig. 11a). The tropospheric tracer concentration increases from 0 % to 5 % in the ML (yellow and green lines in Fig. 11a), while the stratospheric air concentration (1 minus tracer) increases by 5 % in the IL. The temperature increases in both the ML and IL (yellow and green lines in Fig. 11b) where the relative humidity decreases (yellow and green lines in Fig. 11c).
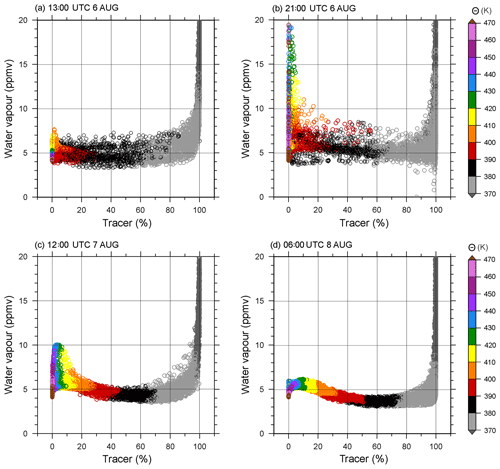
Figure 12Mixing diagram using tropospheric tracer (%) and water vapour (ppmv) across the hydration patch in the altitudes between 14 and 22 km a.s.l. along the trajectory at (a) 13:00 UTC on 6 August, (b) 21:00 UTC on 6 August, (c) 12:00 UTC on 7 August, and (d) 06:00 UTC on 8 August 2017. The potential temperature (K) is shown with colour shading.
The scatter plot of the tropospheric tracer and water vapour mixing ratio (Fig. 12) evidences the large mixing of tropospheric and stratospheric air masses in the TTL (14–22 km altitudes). A large evolution of the tropospheric tracer–water vapour diagram is found from 13:00 to 21:00 UTC on 6 August (Fig. 12a and b). At 13:00 UTC, before the development of the convective overshoots, the air mass with a potential temperature (θ) of 410–420 K (yellow circles), corresponding to ML, is relatively dry with a water vapour mixing ratio of 5–7.2 ppmv (Fig. 12a) and very small compounds of tropospheric air (tracer ≤ 0.1 %). The air mass with a θ of 380–390 K (black circles), corresponding to the IL, has a low water vapour mixing ratio of 3–7.5 ppmv. At 21:00 UTC (Fig. 12b), the air mass with a θ between 410 and 420 K becomes very humid (5.5–13.6 ppmv of water vapour), and the concentration of tropospheric tracer increases to 0.2 %–8 %. Moreover the air mass with a very high θ of 450–460 K (purple circles) is moistened largely, as shown by a water vapour mixing ratio above 15 ppmv. So does the air mass with a θ between 390 and 410 K, which is both moistened and enriched by the tropospheric tracer with a concentration of 5 %–60 % (red and orange circles; Fig. 12b). The convective overshoots also impact the air mass below the CPT by widening the range of the water vapour mixing ratio with a θ between 370 and 380 K (grey circles in Fig. 12a and b) from 3.2–13.9 ppmv at 13:00 UTC (Fig. 12a) to 0–18.8 ppmv at 21:00 UTC (Fig. 12b).
From 17:00 UTC on 6 August to 02:00 UTC on 7 August, Fig. 9c shows that the temperature decreases gradually (solid lines), while the relative humidity increases (lines with symbols). In the ML and IL, a great part of ice contents, especially snow and graupel, falls quickly (dashed line in Fig. 10b), and the rest sublimates. Meanwhile, with the ice sediment out, still there is a low concentration of cloud ice in both the ML and IL, and the water vapour concentration slightly decreases (blue solid line in Fig. 10a). The continued presence of cloud ice in the ML suggests that the ice may have formed in situ in response to wave-driven temperature oscillations that locally drive the RH to ice saturation. The ice microphysics might play a pivotal role in controlling the eventual moisture content, since ice nucleation and the subsequent ice-growth process deplete the ML slowly. In the ML, the relative humidity increases (in range of 65 %–80 %) mainly due to the temperature decrease (in range of −78 and −82 ∘C; solid lines; Fig. 10c). During this period, the easterly wind is nearly constant, with the relatively weak speed of ∼15 m s−1 in the ML and ∼16.5 m s−1 in the IL (yellow and green lines; Fig. 11f). After 7 August, in the ML, the relative humidity of less than 80 % indicates strong subsaturation where a very small amount (0.1–0.3 eq. ppmv) of cloud ice still resides. This is probably induced by the domain-averaged analysis.
4.2.2 Processes occurring in the hydration patch during the advection
After the development of the convective overshoots, the hydration patch travels westward across India and northern Bangladesh from 21:00 UTC on 6 August to 06:00 UTC on 8 August (Fig. 4). During its travel, the air mass in the ML and IL has a smaller and smaller amount of water vapour and ice content (Fig. 10a and b).
Between 21:00 UTC on 6 August and 12:00 UTC on 7 August, the concentration of tropospheric tracer increases at high altitudes, with a θ between 410 and 420 K up to 18 % (yellow circles; Fig. 12b and c). At the same time, the water vapour decreases by a factor of 2, in the range of 5–9.6 ppmv. This can be also seen in the vertical profiles for which the concentration of tropospheric tracer increases at 12:00 UTC on 7 August in both the ML and IL (green and blue lines; Fig. 11a) and the water vapour decreases (green and blue lines; Fig. 11d). The two layers become colder by ∼3 ∘C (green and blue lines in Fig. 11b) and dehydrated compared to the initial state of 13:00 UTC on 6 August (yellow line in Fig. 11d and e). This includes a much-reduced amount of ice content (green and blue solid lines in Fig. 11e), but still ice content ≥1 eq. ppmv and cloud ice ≥0.5 eq. ppmv exist at 12:00 UTC on 7 August (blue dashed line; Fig. 11e). In the IL (Fig. 10c), RHice oscillates, mostly driven by temperature variation. Over time, the air mass in the ML and IL gets colder and less humid by the lowered cloud top below the 17 km altitude. In both the ML and IL, the easterly winds weaken below 15 m s−1. Moreover, the TKE increases from 0.1–0.3 m2 s−2 at 21:00 UTC to 0.2–0.9 m2 s−2 at 12:00 UTC in the ML and IL (Fig. 9e and i). These results suggest that the water vapour concentration in the ML and IL decreases due to the turbulent diffusion in both the vertical and the horizontal direction, consistent with the increase in tropospheric tracer. Also, the vapour-scavenging effect by ice nucleation and particle growth within the IL contributes to reducing the water vapour deriving the dehydration. The rapid decrease in ice content in the IL due to both sublimation and sedimentation (Fig. 7f–i) results in the lowering of the cloud top from 17 to below 16 km at 97–101∘ E at 06:00 UTC (Fig. 7h) and finally to 15 km at around 95.5∘ E at 12:00 UTC (Fig. 7i).
Further increased tropospheric tracer concentration can be seen from 12:00 UTC on 7 August to 06:00 UTC on 8 August 2017 in the ML and IL (blue and red lines; Fig. 11a). Moreover the tropospheric tracer concentration reaches about 30 % and 70 % in the ML and IL, respectively, while the water vapour decreases (Fig. 11a and d). During this time, the cloud top height of convective cloud descends below 14 km (Fig. 6i–l), where RHice dramatically decreases (Figs. 2d and 11c). The entrained cold tropospheric air (and/or colder background air) and the hydrostatic adjustment decrease the temperature in the ML and IL (Fig. 11b). It is worth noting the shape of the temperature profile that becomes straight upward in the altitudes of 17–18.5 km during the overshoot activity (green line; Fig. 11b). Also it is worth noting the decrease in ice content of less than 0.3 eq. ppmv (blue and red line; Fig. 11e) and the large decrease in relative humidity in altitudes below 17.5 km.
The increased tropospheric tracer concentration in the ML and IL is seen as well by the tracer–vapour diagram in Fig. 12c and d. The concentration of tropospheric tracer increases at high altitudes with θ between 410 and 420 K (yellow circles) up to 20 % at 06:00 UTC on 8 August 2017; meanwhile the tropospheric air concentration increases up to 50 % at the altitudes with θ between 390 and 400 K (red circles in Fig. 12d). During the period (12:00 UTC on 7 August to 06:00 UTC on 8 August), the water vapour decreases in all altitudes with a θ value above 380 K (Fig. 12c and d). It decreases from 9.6 to below 6.2 ppmv in the ML (θ between 410 and 430 K; yellow and green circles), while dropping below 5 ppmv in the IL (θ between 380 and 400 K; red and black circles). The reduced ice content in the ML and IL might be induced by sublimation due to the mixing with the dry tropospheric air (RHice ∼ 50 %–70 %) of below the 16 km level (red line in Fig. 11c and crosses in Fig. 2d). The air mixing of tropospheric and stratospheric air masses might be induced by the vertical wind shear, with the maxima wind speeds in excess of 30 m s−1 at ∼17 and 18.5 km altitudes (see Fig. 2e; average value in range of 18–25 m s−1 of red line in Fig. 11f). With the strengthened easterlies, the air mass in the IL is well-mixed rather than conserved in this layer. Also, this wind shear layer with a large gradient of wind speed (25–35 m s−1) is located below and above the CPT (Fig. 2c and e); thus it results in the straight upward temperature profile with the constant value of about −80 ∘C at 06:00 UTC on 8 August, as seen in Fig. 11b (red line). The air mass in the ML and IL has large TKE values of 0.5 m2 s−2 (Fig. 9l).
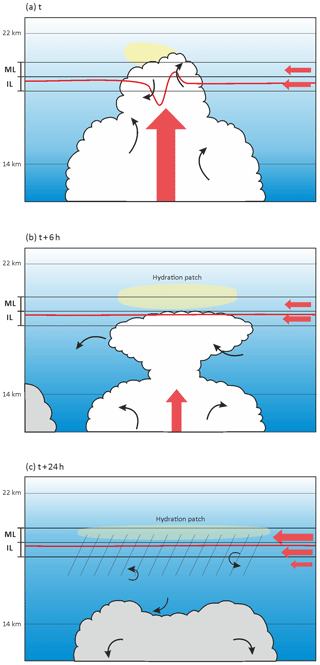
Figure 13Schematic illustration summarizing the hydration process in the TTL during flight no. 7 of the StratoClim 2017 field campaign. (a) Mixing of the overshoots with the stratospheric air, (b) and (c) turbulent mixing of the hydration patch with the tropospheric air by vertical wind shear. The bottom and top of the TTL, at 14 and 22 km, and the moist layer (ML) and ice layer (IL) are represented by the black solid line, and the 410 K isentropic altitude is represented by the red solid line. The main force in the TTL is marked by bold red arrows, while the turbulent eddies in and around the developed and weakened overshoots are described by black arrows. The overreaching water vapour above the cloud top level is indicated by a yellow ellipse in (a). The hydration patch is shaded in yellow in (a) and (b), and the layer of dehydration by turbulent diffusion and water vapour deposition followed by ice sedimentation is hatched in (c). The blue shading illustrates the concentration of tropospheric air, showing the increased tropospheric air in the TTL by the turbulent mixing in (b) and (c).
The source and pathway of the hydration patch in the TTL (tropical tropopause layer) that was measured during flight no. 7 of the StratoClim 2017 field campaign during the Asian summer monsoon and its connection to overshooting convection are investigated. During the Geophysica flight no. 7 at around 06:30 UTC on 8 August 2017, two remarkable layers were observed to the south of Kathmandu, above and below the CPT located at 17.8 km: a moist layer (ML) with a large water vapour content of 4.2–5.6 ppmv in altitudes of 18–19 km in the lower stratosphere and an ice layer (IL) with a large ice content up to 1.9 eq. ppmv at altitudes of 17–18 km in the upper troposphere. The Meso-NH numerical simulation run with a 2.5 km horizontal grid spacing succeeds in reproducing the ML and IL. Through analysis using airborne and spaceborne measurements and the numerical simulation, we show that the measured hydration patch in the ML found in the south of Kathmandu (∼85∘ E) was produced by the convective overshoots that occurred over the Sichuan Basin (∼103∘ E) between 14:00 and 21:00 UTC on 6 August 2017. The key hydration processes are summarized schematically in Fig. 13.
The convective overshoots develop up to 19.5 km altitude in the Sichuan Basin and transport large amounts of water vapour of 6.5 ppmv to ML and ice content in excess of 300 eq. ppmv to the IL. Between 15:00 and 21:00 UTC, the overshooting clouds collectively hydrate the lower stratosphere, resulting in the total amount of water vapour of 6088 t. It is also worth noting the large concentration of water vapour of over 18 ppmv up to 20 km level, which is above the convective cloud top of 19.5 km (a yellow ellipse in Fig. 13a). This feature is similarly seen during the development of Hector the Convector in the Tiwi Islands (Dauhut et al., 2018); however, the magnitude is ∼10 ppmv higher in the present event. The concentration of the tropospheric tracer reaches 8 % and ∼60 % in the ML and IL, respectively, indicating the strong mixing of the convective updraughts with the stratospheric air (black arrows in Fig. 13a). The strong convective updraughts perturb the isentropic surfaces (red line in Fig. 13a), descending to the 410 K level from 18.5 to 17.5 km. During these convective events, the mixing of the tropospheric and stratospheric air masses increases the temperature in the ML and IL. Moreover, the moderate – not intense – easterly wind (∼15 m s−1) prevails constantly in these levels, and it does not interrupt the convection developing vigorously in altitude (19.5 km a.s.l.) and reaching the lower stratosphere.
The injected water by the convective overshoots generates the hydration patch, i.e. large water vapour in the ML (ellipse in Fig. 13b). During its westward travel, its altitude is kept constant by the moderate easterlies of about 15 m s−1 in the ML and IL. The tropospheric tracer concentration is continuously increased in these layers, where the above-background amount of water vapour still remains and where the ice content gradually sediments out and forms again along the pathway. It is highlighted that the large transported amount of water vapour (≥18 ppmv) still remains at high altitudes of up to 20.5 km even when the anvil cloud top descends to 18.5 km. Later on, the cloud top is still seen around 16–17 km level, keeping the large RHice (about 95 %) in these altitudes. A part of the water vapour was lost due to ice formation and sedimentation and the turbulent diffusion in both the vertical and the horizontal direction (black arrows in Fig. 13b). The ice microphysics (e.g. nucleation, growth, and sedimentation of ice particles) might play a pivotal role in controlling the eventual moisture content, since ice nucleation and the subsequent growth process would slowly deplete the water vapour. This falling of ice and a reduced updraught are evident by the partly lowered cloud top height from 17 to ∼15 km (Fig. 13c).
Then the hydration patch continues to travel to the south of Kathmandu, with an even higher tropospheric tracer concentration of ∼30 % and 70 % in the ML and IL, respectively (darker blue shades in Fig. 13c). During the same period, the top of convective clouds further descends below 14 km; thus the layer below the IL, i.e. 15–17 km, becomes dry, with the RHice below 70 %. Due to mixing with the dry tropospheric air, the remaining water vapour in the ML gradually diffused in the horizontal and vertical direction (ellipse). It is also true that the ice content in the IL is locally influenced by new convection with the cloud top in altitudes of 16–17 km about 6 h before flight no. 7. The continuous air mixing might be induced by the vertical wind shear in altitudes of 15–19 km, where the wind speed varies from ∼18 to 25 m s−1 (red bold arrows in Fig. 13c). The vertical mixing due to wind shear modifies the temperature profile to the straight–upward direction at 17–18 km rather than bending. Also, vertical motions caused by gravity waves breaking might play an important role in the transport of tropospheric air into the TTL. In addition, after the strong updraughts of overshooting convection, the remaining horizontal divergence in the lower stratosphere might allow the tropospheric air continue to ascend.
Many previous Lagrangian studies (Tzella and Legras, 2011; Tissier and Legras, 2016) demonstrated the link between the moistened TTL and remote overshoots using large-scale numerical simulations. Thanks to the combination of aircraft measurement and a convection-permitting simulation, this study shed light on the processes along the pathway of a hydration patch from overshooting clouds for 1.5 d, showing the 3-D evolution of water vapour and ice content.
This study focuses on the hydration patch that was measured during the last descending of flight no. 7 and the corresponding convective overshoots over the Sichuan Basin. Here, the average water vapour amount in the lower stratosphere is 6.5 ppmv during the convective event, while water vapour of 6 ppmv is found above western Africa during the monsoon season by Khaykin et al. (2009). By comparison, convection developing during the Asian monsoon over the Sichuan Basin had a similar impact on the stratospheric water budget to that above western Africa. From the hourly budget of 869 t, we can also confirm that the local impact of overshoots developed during the Asian summer monsoon is stronger than that over tropical Africa (300–500 t according to Liu et al., 2010) and is weaker than Hector the Convector over the Tiwi Islands (2776 t according to Dauhut et al., 2015). Because of a large variety in the lifetime and horizontal scale of overshoots, an accumulation of more event-scale analyses is important. In addition, note that the amount of injected moisture is sensitive to the grid spacing of simulation (up to a factor of 2, with horizontal grid spacing varying from 1600 to 100 m; Dauhut et al., 2015) and the convection duration of the target system. The simple set-up of tropospheric tracer of this study, i.e. tropospheric air below the 380 K isentropic altitude, allows the mixture of tropospheric and stratospheric air parcels in the TTL by vigorous convective overshoots to be understood. To estimate the detailed origin, i.e. defining the lower, middle, and upper troposphere, of the air parcel, further analyses using passive tracers (e.g. Mullendore et al., 2005; Hassim and Lane, 2010; Homeyer, 2015; Dauhut et al., 2016) will be required. Also, additional numerical simulation with a two-moment microphysical scheme that considers mass and number concentration of hydrometeors and aerosol together with options in the turbulent scheme (e.g. 1-D against 3-D formulation; Machado and Chaboureau, 2015) will be worthwhile in studying the impact on the results. The amount of water vapour and ice that is generally injected into the TTL through convective overshoots during the Asian summer monsoon is currently being investigated in a follow-up study. Further, it would be interesting to investigate the transport of chemical constituents, e.g. methane, nitrogen oxides, and carbon monoxide, via convective overshoots during this season.
After the StratoClim embargo period, the aircraft data will be available at the DLR database https://halo-db.pa.op.dlr.de/mission/101 (last access: 19 September 2019). Meso-NH output data are available from Jean-Pierre Chaboureau upon request.
The supplement related to this article is available online at: https://doi.org/10.5194/acp-19-11803-2019-supplement.
KOL, TD, and JPC designed the numerical simulation, and JPC performed the simulation. KOL, TD, and JPC designed the paper and analyses. SK provided the FLASH instrument data, and MK and CR provided the FISH instrument data. KOL prepared the paper, with contributions from all co-authors.
The authors declare that they have no conflict of interest.
This article is part of the special issue “StratoClim stratospheric and upper tropospheric processes for better climate predictions (ACP/AMT inter-journal SI)”. It is not associated with a conference.
This study is funded by the StratoClim project by the European Union Seventh Framework Programme under grant agreement no. 603557 and the IDEX TEASAO project. Computer resources were allocated by GENCI through project 90569.
This study is funded by the StratoClim project by the European Union Seventh Framework Programme (grant no. 603557).
This paper was edited by Rolf Müller and reviewed by three anonymous referees.
Afchine, A., Rolf, C., Costa, A., Spelten, N., Riese, M., Buchholz, B., Ebert, V., Heller, R., Kaufmann, S., Minikin, A., Voigt, C., Zöger, M., Smith, J., Lawson, P., Lykov, A., Khaykin, S., and Krämer, M.: Ice particle sampling from aircraft – influence of the probing position on the ice water content, Atmos. Meas. Tech., 11, 4015–4031, https://doi.org/10.5194/amt-11-4015-2018, 2018.
Bougeault, P. and Lacarrère, P.: Parameterization of orography-induced turbulence in a meso-beta-scale model, Mon. Weather Rev., 117, 1872–1890, https://doi.org/10.1175/1520-0493(1989)117<1872:POOITI>2.0.CO;2, 1989.
Chaboureau, J.-P., Cammas, J.-P., Duron, J., Mascart, P. J., Sitnikov, N. M., and Voessing, H.-J.: A numerical study of tropical cross-tropopause transport by convective overshoots, Atmos. Chem. Phys., 7, 1731–1740, https://doi.org/10.5194/acp-7-1731-2007, 2007.
Chaboureau, J.-P. and Coauthors: A midlatitude precipitating cloud database validated with satellite observations, J. Appl. Meteor. Climatol., 47, 1337–1353, https://doi.org/10.1175/2007JAMC1731.1, 2008.
Chaboureau, J.-P., Richard, E., Pinty, J.-P., Flamant, C. Girolamo, P. Di, Kiemle, C., Behrendt, A., Chepfer, H., Chiriaco, M., and Wulfmeyer, V.: Long-range transport of Saharan dust and its radiative impact on precipitation forecast: A case study during the Convective and Orographically-induced Precipitation Study (COPS), Q. J. Roy. Meteorol. Soc., 137, 236–251, https://doi.org/10.1002/qj.719, 2011.
Colella, P. and Woodward, P. R.: The piecewise parabolic method (PPM) for gas dynamical simulations, J. Comput. Phys., 54, 174–201, https://doi.org/10.1016/0021-9991(84)90143-8, 1984.
Cuxart, J., Bougeault, P., and Redelsperger, J. L.: A turbulence scheme allowing for mesoscale and large-eddy simulations, Q. J. Roy. Meteorol. Soc., 126, 1–30, https://doi.org/10.1002/qj.49712656202, 2000.
Dauhut, T., Chaboureau, J. P., Escobar, J., and Mascart, P.: Large-eddy simulations of hector the convector making the stratosphere wetter, Atmos. Sci. Lett., 16, 135–140, https://doi.org/10.1002/asl2.534, 2015.
Dauhut, T., Chaboureau, J. P., Escobar, J., and Mascart, P.: Giga-LES of hector the convector and its two tallest updrafts up to the stratosphere, J. Atmos. Sci., 73, 5041–5060, https://doi.org/10.1175/JAS-D-16-0083.1, 2016.
Dauhut, T., Chaboureau, J. P., Haynes, P. H., and Lane, T. P: The mechanisms leading to a stratospheric hydration by overshooting convection, J. Atmos. Sci., 75, 4383–4398, https://doi.org/10.1175/JAS-D-18-0176.1, 2018.
Dessler, A. E. and Sherwood, S. C.: Effect of convection on the summertime extratropical lower stratosphere, J. Geophys. Res., 109, D23301, https://doi.org/10.1029/2004JD005209, 2004.
Fueglistaler, S., Dessler, A. E., Dunkerton, T. J., Folkins, I., Fu, Q., and Mote, P. W.: Tropical tropopause layer, Rev. Geophys., 47, RG1004, https://doi.org/10.1029/2008RG000267, 2009.
Funatsu, B. M., Rysman, J. F., Claud, C., and Chaboureau, J. P.: Deep convective clouds distribution over the Mediterranean region from AMSU-B/MHS observations, Atmos. Res., 207, 122–135, https://doi.org/10.1016/j.atmosres.2018.03.003, 2018.
Gal-Chen, T. and Somerville, R. C. J.: On the use of a coordinate transformation for the solution of the Navier-Stokes equations, J. Comput. Phys., 17, 209–228, https://doi.org/10.1016/0021-9991(75)90037-6, 1975.
Hassim, M. E. E. and Lane, T. P.: A model study on the influence of overshooting convection on TTL water vapour, Atmos. Chem. Phys., 10, 9833–9849, https://doi.org/10.5194/acp-10-9833-2010, 2010.
Highwood, E. J. and Hoskins, B. J.: The tropical tropopause, Q. J. Roy. Meteorol. Soc., 124, 1579–1604, https://doi.org/10.1002/qj.49712454911, 1998.
Homeyer, C. R.: Numerical simulations of extratropical tropopause penetrating convection, J. Geophys. Res.-Atmos., 120, 7174–7188. https://doi.org/10.1002/2015JD023356, 2015.
Homeyer, C. R., Pan, L. L., Dorsi, S. W., Avallone, L. M., Weinheimer, A. J., O'Brien, A. S., DiGangi, J. P., Zondlo, M. A., Ryerson, T. B., Diskin, G. S., and Campos, T. L.: Convective transport of water vapor into the lower stratosphere observed during double-tropopause events, J. Geophys. Res.-Atmos., 119, 10941–10958, https://doi.org/10.1002/2014JD021485, 2014.
Homeyer, C. R., McAuliffe, J. D., and Bedka, K. M.: On the development of above-anvil cirrus plumes in Extratropical convection, J. Atmos. Sci., 74, 1617–1633, https://doi.org/10.1175/JAS-D-16-0269.1, 2017.
Hoskins, B. J. and Rodwell, M. J.: A model of the Asian summer monsoon, I, The global scale, J. Atmos. Sci, 52, 1329–1340, https://doi.org/10.1175/1520-0469(1995)052<1329:AMOTAS>2.0.CO;2, 1995.
Jensen, E., Ackerman, A. S., and Smith, J. A.: Can overshooting convection dehydrate the tropical tropopause layer?, J. Geophys. Res., 112, D11209, https://doi.org/10.1029/2006JD007943, 2007.
Kato, T.: Structure of the band-shaped precipitation system inducing the heavy rainfall observed over northern Kyushu, Japan on 29 June 1999, J. Meteor. Soc. Japan, 84, 129–153, https://doi.org/10.2151/jmsj.84.129, 2006.
Khaykin, S., Pommereau, J.-P., Korshunov, L., Yushkov, V., Nielsen, J., Larsen, N., Christensen, T., Garnier, A., Lukyanov, A., and Williams, E.: Hydration of the lower stratosphere by ice crystal geysers over land convective systems, Atmos. Chem. Phys., 9, 2275–2287, https://doi.org/10.5194/acp-9-2275-2009, 2009.
Khaykin, S. M., Engel, I., Vömel, H., Formanyuk, I. M., Kivi, R., Korshunov, L. I., Krämer, M., Lykov, A. D., Meier, S., Naebert, T., Pitts, M. C., Santee, M. L., Spelten, N., Wienhold, F. G., Yushkov, V. A., and Peter, T.: Arctic stratospheric dehydration – Part 1: Unprecedented observation of vertical redistribution of water, Atmos. Chem. Phys., 13, 11503–11517, https://doi.org/10.5194/acp-13-11503-2013, 2013.
Khaykin, S. M., Pommereau, J.-P., Riviere, E. D., Held, G., Ploeger, F., Ghysels, M., Amarouche, N., Vernier, J.-P., Wienhold, F. G., and Ionov, D.: Evidence of horizontal and vertical transport of water in the Southern Hemisphere tropical tropopause layer (TTL) from high-resolution balloon observations, Atmos. Chem. Phys., 16, 12273–12286, https://doi.org/10.5194/acp-16-12273-2016, 2016.
Lac, C., Chaboureau, J.-P., Masson, V., Pinty, J.-P., Tulet, P., Escobar, J., Leriche, M., Barthe, C., Aouizerats, B., Augros, C., Aumond, P., Auguste, F., Bechtold, P., Berthet, S., Bielli, S., Bosseur, F., Caumont, O., Cohard, J.-M., Colin, J., Couvreux, F., Cuxart, J., Delautier, G., Dauhut, T., Ducrocq, V., Filippi, J.-B., Gazen, D., Geoffroy, O., Gheusi, F., Honnert, R., Lafore, J.-P., Lebeaupin Brossier, C., Libois, Q., Lunet, T., Mari, C., Maric, T., Mascart, P., Mogé, M., Molinié, G., Nuissier, O., Pantillon, F., Peyrillé, P., Pergaud, J., Perraud, E., Pianezze, J., Redelsperger, J.-L., Ricard, D., Richard, E., Riette, S., Rodier, Q., Schoetter, R., Seyfried, L., Stein, J., Suhre, K., Taufour, M., Thouron, O., Turner, S., Verrelle, A., Vié, B., Visentin, F., Vionnet, V., and Wautelet, P.: Overview of the Meso-NH model version 5.4 and its applications, Geosci. Model Dev., 11, 1929–1969, https://doi.org/10.5194/gmd-11-1929-2018, 2018.
Lee, K. O., Flamant, C., Ducrocq, V., Duffourg, F., Fourrié, N., and Davolio, S.: Convective initiation and maintenance processes of two back-building mesoscale convective systems leading two heavy precipitation events in South Italy during HyMeX IOP 13, Q. J. Roy. Meteorol. Soc., 142, 2623–2635, https://doi.org/10.1002/qj.2851, 2016.
Liu, C. and Zipser, E. J.: Global distribution of convection penetrating the tropical tropopause, J. Geophys. Res., 110, D23104, https://doi.org/10.1029/2005JD006063, 2005.
Liu, X. M., Rivière, E. D., Marécal, V., Durry, G., Hamdouni, A., Arteta, J., and Khaykin, S.: Stratospheric water vapour budget and convection overshooting the tropopause: modelling study from SCOUT-AMMA, Atmos. Chem. Phys., 10, 8267–8286, https://doi.org/10.5194/acp-10-8267-2010, 2010.
Machado, L. A. and Chaboureau, J. P.: Effect of Turbulence Parameterization on Assessment of Cloud Organization, Mon. Weather Rev., 143, 3246–3262, https://doi.org/10.1175/MWR-D-14-00393.1, 2015.
Maddox, E. M. and Mullendore, G. L.: Determination of best tropopause definition for convective transportation studies, J. Atmos. Sci., 75, 3433–3446, https://doi.org/10.1175/JAS-D-18-0032.1, 2018.
Mason, R. and Anderson, C.: The development and decay of the 100-MB. Summertime anticyclone over southern Asia, Mon. Weather Rev., 1, 3–12, 1963.
Meyer, J., Rolf, C., Schiller, C., Rohs, S., Spelten, N., Afchine, A., Zöger, M., Sitnikov, N., Thornberry, T. D., Rollins, A. W., Bozóki, Z., Tátrai, D., Ebert, V., Kühnreich, B., Mackrodt, P., Möhler, O., Saathoff, H., Rosenlof, K. H., and Krämer, M.: Two decades of water vapor measurements with the FISH fluorescence hygrometer: a review, Atmos. Chem. Phys., 15, 8521–8538, https://doi.org/10.5194/acp-15-8521-2015, 2015.
Mullendore, G. L., Durran, D. R., and Holton, J. R.: Cross-Tropopause tracer transport in midlatitude convection, J. Geophys. Res., 110, D06113, https://doi.org/10.1029/2004JD005059, 2005.
Müller, R.: The performance of classical versus modern finite-volume advection schemes for atmospheric modelling in a one-dimensional test-bed, Mon. Weather Rev., 120, 1407–1415, https://doi.org/10.1175/1520-0493(1992)120<1407:TPOCVM>2.0.CO;2, 1992.
Park, M., Randel, W. J., Kinnison, E. J., Garcia, R. R., and Choi, W.: Seasonal variation of methane, water vapor and nitrogen oxides near the tropopause: Satellite observations and model simulation, J. Geophys. Res., 109, D03302, https://doi.org/10.1029/2003JD003706, 2004.
Pinty, J. P. and Jabouille, P.: A mixed-phased cloud parametrization for use in a mesoscale non-hydrostatic model: Simulations of a squall line and of orographic precipitation, in: Proc. Of the Conference on Cloud Physics, Amer. Meteorol. Soc, Boston, Everett, WA, USA, 17–21 August, 217–220, 1998.
Randel, W. J. and Park, M.: Deep convective influence on the Asian summer monsoon anticyclone and associated tracer variability observed with Atmospheric Infrared Sounder (AIRS), J. Geophys, Res., 111, D12314, https://doi.org/10.1029/2005JD006490, 2006.
Randel, W. J., Wu, F., Gettelman, A., Russell, J. M., Zawodny, J. M., and Oltmans, S. J.: Seasonal variation of water vapour in the lower stratosphere observed in Halogen Occultation Experiment data, J. Geophys. Res., 106, 14313–14325, https://doi.org/10.1029/2001JD900048, 2001.
Rysman, J. F., Claud, C., Chaboureau, J. P., Delanoë, J., and Funatsu, B. M.: Severe convection in the Mediterranean from microwave observations and a convection-permitting model, Q. J. Roy. Meteorol. Soc., 142, 43–55, https://doi.org/10.1002/qj.2611, 2016.
Rolf, C., Vogel, B., Hoor, P., Afchine, A., Günther, G., Krämer, M., Müller, R., Müller, S., Spelten, N., and Riese, M.: Water vapor increase in the lower stratosphere of the Northern Hemisphere due to the Asian monsoon anticyclone observed during the TACTS/ESMVal campaigns, Atmos. Chem. Phys., 18, 2973–2983, https://doi.org/10.5194/acp-18-2973-2018, 2018.
Saunders, R., Hocking, J., Rundle, D., Rayer, P., Matricardi, M., Geer, A., Lupu, C., Brunel, P., and Vidot, J.: RTTOV-11 – Science and validation report, NWP SAF Tech. Rep., 62 pp., 2013.
Shu, C. W. and Osher, S.: Efficient implementation of essentially non-oscillatory shock-capturing schemes, J. Comput. Phys., 77, 439–471, https://doi.org/10.1016/0021-9991(88)90177-5, 1988.
Sitnikov, N. M., Yushkov, V. A., Afchine, A. A., Korshunov, L. I., Astakhov, V. I., Elanovskii, A. E., Kraemer, M., Mangold, A., Schiller, C., and Ravegnani, F.: The FLASH instrument for water vapor measurements on board the high-altitude airplane, Instrum. Exp. Tech., 50, 113–121, https://doi.org/10.1134/S0020441207010174, 2007.
Smith, J. B., Wilmouth, D. M., Bedka, K. M., Bowman, K. P., Homeyer, C. R., Dykema, J. A., Sargent, M. R., Clapp, C. E., Leroy, S. S., Sayres, D. S., Dean-Day, J. M., Bui, T. P., and Anderson, J. G.: A case study of convectively sourced water vapor observed in the overworld stratosphere over the United States, J. Geophys. Res, 122, 9529–9554, https://doi.org/10.1002/2017JD026831, 2017.
Tissier, A.-S. and Legras, B.: Convective sources of trajectories traversing the tropical tropopause layer, Atmos. Chem. Phys., 16, 3383–3398, https://doi.org/10.5194/acp-16-3383-2016, 2016.
Tzella, A. and Legras, B.: A Lagrangian view of convective sources for transport of air across the Tropical Tropopause Layer: distribution, times and the radiative influence of clouds. Atmos. Chem. Phys., 11, 12517–12534, https://doi.org/10.5194/acp-11-12517-2011, 2011.
Winker, D. M., Vaughan, M. A., Omar, A., Hu, Y., Powell, K. A., Liu, Z., Hunt, W. H., and Young, S. A.: Overview of the CALIPSO mission and CALIOP data processing algorithms, J. Atmos. Ocean. Tech., 26, 2310–2323, https://doi.org/10.1175/2009JTECHA1281.1, 2009.
WMO: Definition of the tropopause, WMO Bull., 6, 136, 1957.
Wright, J. S., Fu, R., Fueglistaler, S., Liu, Y. S., and Zhang, Y.: The influence of summertime convection over Southeast Asia on water vapor in the tropical stratosphere, J. Geophys. Res., 116, D12302, https://doi.org/10.1029/2010JD015416, 2011.
Zöger, M., Afchine, A., Eicke, N., Gerhards, M.-T., Klein, E., McKenna, D., Mörschel, U., Schmidt, U., Tan, V., Tuitjer, F., Woyke, T., and Schiller, C.: Fast in situ stratospheric hygrometers: A new family of balloon-borne and airborne Lyman-photofragment fluorescence hygrometers, J. Geophys. Res., 104, 1807–1816, https://doi.org/10.1029/1998JD100025, 1999.


