the Creative Commons Attribution 4.0 License.
the Creative Commons Attribution 4.0 License.
Vertical profile observations of water vapor deuterium excess in the lower troposphere
Olivia E. Salmon
Michael E. Baldwin
Kristian D. Hajny
Brian H. Stirm
Paul B. Shepson
We use airborne measurements of water vapor (H2Ov) stable isotopologues and complementary meteorological observations to examine how boundary layer (BL) dynamics, cloud processing, and atmospheric mixing influence the vertical structure of δD, δ18O, and deuterium excess (d excess =δD–8×δ18O) in the BL, inversion layer (INV), and lower free troposphere (FT). Flights were conducted around two continental US cities in February–March 2016 and included vertical profiles extending from near the surface to ≤2 km. We examine observations from three unique case study flights in detail. One case study shows observations that are consistent with Rayleigh isotopic distillation theory coinciding with clear skies, dry adiabatic lapse rates within the boundary layer, and relatively constant vertical profiles of wind speed and wind direction. This suggests that the air mass retained the isotopic fingerprint of dehydration during moist adiabatic processes upwind of the study area. Also, observed d-excess values in the free troposphere were sometimes larger than Rayleigh theory predicts, which may indicate mixing of extremely dehydrated air from higher altitudes. The two remaining case studies show isotopic anomalies in the d-excess signature relative to Rayleigh theory and indicate cloud processes and complex boundary layer development. The most notable case study with stratocumulus clouds present had extremely low (negative) d-excess values at the interface of the inversion layer and the free troposphere, which is possibly indicative of cloud or rain droplet evaporation. We discuss how in situ H2Ov stable isotope measurements, and d excess in particular, could be useful for improving our understanding of water phase changes, transport, and mixing that occurs between the BL, INV, and FT.
- Article
(6499 KB) - Full-text XML
-
Supplement
(1215 KB) - BibTeX
- EndNote
Water vapor (H2Ov) in the lower troposphere modulates processes including cloud formation, precipitation, severe weather development, atmospheric circulation, radiative forcing, and climate feedbacks (Held and Soden, 2000; Kunkel et al., 2012; Tompkins, 2001; Trapp et al., 2007; Trenberth, 2011). Accurately representing these processes in models can be difficult, and efforts to improve parameterizations are ongoing (Gerber et al., 2013; de Lozar and Melledo, 2015; Park et al., 2017; Wood, 2012; Yamaguchi and Feingold, 2013). Some active areas of research include quantifying the inversion layer (INV) entrainment flux (Wood, 2012), refining entrainment–cloud-evaporation relationships (Gerber et al., 2013; Yamaguchi and Feingold, 2013), and updating cloud evaporation schemes with new cloud classes (Park et al., 2017).
Free troposphere (FT) entrainment and cloud evaporation influence the maintenance of the cloud layer, which in turn influences radiative forcing (Gerber et al., 2013; Yamaguchi and Feingold, 2013). The nature of H2Ov as a climate feedback agent adds further complexity to our understanding of H2Ov's role in weather. Anthropogenic greenhouse gas emissions have resulted in increasing global temperatures, enhanced evaporation from soil and the oceans, and higher atmospheric concentrations of H2Ov, the dominant absorber of infrared radiation (Held and Soden, 2006; Hurley and Galewsky, 2010; Willett et al., 2007). Warmer temperatures and more humid conditions have caused a shift towards less frequent but more intense precipitation events, increasing the risk of both floods and droughts (Roque-Malo and Kumar, 2017; Trenberth, 2011). H2Ov also modulates production of the dominant atmospheric oxidant, the hydroxyl radical (Thompson, 1992). Thus, accurately representing H2Ov in mesoscale processes is of great importance in a warming world.
H2Ov stable isotopologue measurements are a potential tool for informing our understanding of the distribution and dynamics of H2Ov in the lower troposphere (see review by Galewsky et al., 2016). H2Ov stable isotopologue ratios, i.e., the ratio of heavy (HDO or ) to light () molecules, capture the origin and mixing of moisture sources as well as the condensation and cloud processes that modified that moisture. The δ notation indicates the sample's heavy-to-light isotope ratio reported relative to an international standard (), where δ is multiplied by 1000 to report in per mil (‰). Both equilibrium fractionation, which separates heavy and light isotopologues based on their unique vapor-pressure differences, and kinetic fractionation, which is controlled by differences in diffusion rates of the isotopologues, modulate the isotopic signature of atmospheric H2Ov (Dansgaard, 1964). Isotopic fractionation processes act to enrich and/or deplete both HDO and relative to in atmospheric waters, resulting in co-varying δD and δ18O signatures. The Rayleigh distillation model describes the equilibrium fractionation between vapor and condensation that dominates the variability of H2Ov isotopes in the troposphere. This model can be used to calculate the degree to which condensate is removed from an air parcel as it cools, such as when it ascends from the surface to higher altitudes. Perturbations in δD and δ18O signatures often co-vary by a factor of approximately 8 because the ratio of the δD and δ18O equilibrium fractionation factors is approximately 8:1 at typical surface temperatures (Dansgaard, 1964). The second-order isotope parameter deuterium excess (d excess =δD–8×δ18O) can be used to help identify the non-equilibrium kinetic fractionation processes. For example, remoistening of the atmosphere by raindrop evaporation imparts a kinetic isotopic fingerprint on H2Ov d excess (Field et al., 2010; Lawrence et al., 2004; Risi et al., 2008; Worden et al., 2007; Wright et al., 2009).
Tropospheric vapor d-excess measurements may provide important information about cloud microphysics, convection processes, precipitation recycling, and FT entrainment. Local-scale studies have examined the role of moisture source, condensation history, and land surface evapotranspiration on d-excess signatures (Benetti et al., 2014; Delattre et al., 2015; Griffis et al., 2016; Kelsey et al., 2018; Lai and Ehleringer, 2011; Uemura et al., 2008; Welp et al., 2012). Measurements of d excess in precipitation have been used to investigate below-cloud evaporation (Aemisegger et al., 2015; Froehlich et al., 2008; Wang et al., 2016) and mixing between the boundary layer (BL) and FT from stationary platforms near the surface or at high-altitude mountain sites (Bailey et al., 2015; Benetti et al., 2015; 2018; Froehlich et al., 2008; Galewsky, 2015; Lowenthal et al., 2016; Samuels-Crow et al., 2014). Kelsey et al. (2018) conducted mobile traverses along leeward and windward slope roads of a mountain in an instrumented vehicle to report vertical profiles of d excess. While high-elevation surface monitoring has the advantage of sampling BL and FT air over a diurnal cycle, it does not provide a complete picture of the H2Ov isotope vertical profile (VP) at a discrete time. Satellites can provide discrete VP measurements of HDOv∕H2Ov but have low vertical resolution and currently cannot give information about d excess, as they cannot retrieve (Herman et al., 2014; Worden et al., 2012). Airborne platforms are capable of δD, δ18O, and d-excess VP measurements at higher spatiotemporal resolution and have been conducted since the 1960s, extending from the lower troposphere to the stratosphere for investigating a variety of scientific questions (overview in Sodemann et al., 2017). Due to either study objectives or limitations of the instrumentation (Dyroff et al., 2015; Herman et al., 2014), however, only one airborne H2Ov isotope study, to our knowledge, has reported d-excess measurements in the lower troposphere to provide high-vertical-resolution snapshots at discrete time points in the boundary later (Sodemann et al., 2017). Additional airborne d-excess observations may improve our understanding of the role that cloud processes and convection have on determining the moisture distribution of the troposphere (Noone, 2012; Bolot et al., 2013).
In this study we present stable H2Ov isotope measurements over two continental sites. These measurements provide a unique data set for understanding variability in the lower-troposphere d-excess profile and what it reveals about lower-troposphere moisture processing on relatively small regional scales. H2Ov stable isotope VP measurements were conducted in the lower troposphere during four flights around the Washington, D.C., and Baltimore, MD, metropolitan area in February 2016 and during five flights around the Indianapolis, IN, metropolitan area in March 2016. We compare and contrast observations of the unique vertical structure of δD, δ18O, and d excess from 3 representative case study days. The case studies provide information about meteorological conditions that produce H2Ov isotopic VP profiles indicative of past Rayleigh dehydration of the air mass and those where other processes must explain the observations. The case study observations reveal d-excess features unique to cloud droplet or rain droplet evaporation and show the influence of synoptic weather patterns and urban versus rural differences on BL development. Interpretations of case study VPs are supported with observations from the remaining flight days in the Washington, D.C., and Baltimore, MD, and Indianapolis areas.
2.1 Study sites
Flights were conducted around the Washington, D.C. to Baltimore, MD, area in February 2016 and around Indianapolis in March 2016. Washington, D.C., and Baltimore, MD, is a metropolitan area of 9.8 million residents that includes the District of Columbia and encompasses parts of Maryland, Virginia, West Virginia, and Pennsylvania (US Census Bureau, 2018). The Appalachian Mountains lie to the west of Washington, D.C., and Baltimore, MD, and the Chesapeake Bay and the Atlantic Ocean lie on the eastern side of Washington, D.C., and Baltimore. By contrast, Indianapolis has a population of 2.0 million and is relatively isolated from other metropolitan areas by agricultural fields (US Census Bureau, 2018). The closest large body of water to Indianapolis is Lake Michigan, over 200 km to the north.
2.2 Instrumentation
2.2.1 Airborne Laboratory for Atmospheric Research (ALAR)
The Purdue Airborne Laboratory for Atmospheric Research (ALAR) is a modified twin-engine Beechcraft Duchess aircraft. The ALAR's two rear passenger seats have been removed to make room for scientific instrumentation. Ambient air at the nose of the aircraft is pulled through a forward-facing unheated 5 cm diameter PFA Teflon inlet called the “main manifold” at a flow rate of 1840 L min−1 using a blower installed at the rear of the aircraft. Residence time in the main manifold is ≤0.1 s. Instruments sample from the main manifold with individual Swagelok “T” connections and Teflon sampling lines. The Purdue ALAR is equipped with a global positioning and internal navigation system (GPS/INS) for 50 Hz geopositional measurements and a Best Air Turbulence (BAT) probe for 50 Hz three-dimensional winds and pressure measurements (Crawford and Dobosy, 1992; Garman et al., 2006, 2008). Temperature measurements are made with a microbead thermistor installed in the center pressure port of the BAT probe (Garman, 2009). Although not the focus of this study, measurements of carbon dioxide, methane, and the H2Ov mole fraction were made with a Picarro G2301-m cavity ring-down spectrometer. The Picarro data frequency was 0.5 Hz, and the flow rate was 850 sccm. This system provides an independent evaluation of H2Ov mole fraction measurements by the isotope analyzer described in the next section. A full description of the ALAR instrumentation suite has been provided by Salmon et al. (2017).
2.2.2 Water vapor mixing ratio and stable isotope measurements
H2Ov, δD, and δ18O measurements (1 Hz) were made with a Los Gatos Research, Inc. (LGR) Triple Water Vapor Isotope Analyzer (TWVIA; model: 911-0034). The TWVIA was configured as a rack-mount, extended-range model, operating with an internal cell pressure of 80 Torr (80 Torr = 10.7 kPa) and is suggested by the manufacturer for isotopic measurements over the H2Ov mole fraction range from 4000 to 60 000 ppmv. The analyzer can make measurements at H2Ov mole fractions below 4000 ppmv, but the instrument precision worsens (discussed below). The TWVIA sampled ambient air from the main manifold at a flow rate of 500 sccm using the analyzer's internal pump. Cavity pressure and temperature were observed to vary (1σ) by ±0.02 Torr and ±0.08 ∘C, respectively, over a vertical profile descent on average, which is within the operating specification given by the manufacturer. Measurements of H2Ov, δD, and δ18O were identically lag adjusted for the sample residence time (average: 8 s) to match geopositional and meteorological measurements. Depending on the ambient air temperature, the cabin of the aircraft was heated to prevent condensation inside tubing and for the comfort of the pilot and mission scientist.
H2Ov mole fractions reported by the LGR TWVIA and the Picarro instrument were calibrated on the ground (not in flight) throughout the campaign (on 7 and 17 March 2016) using a LI-COR dew-point generator (model: LI-610) over the H2Ov mole fraction range from 7000 to 12 000 ppmv. This H2Ov mole fraction range corresponds to saturation vapor pressures for temperatures ranging from approximately 3 to 10 ∘C. The LGR TWVIA (and Picarro) H2Ov mole fraction calibration curve slope, y intercept, and R2 value are 0.9845 (0.94), −280 ppmv (−200 ppmv), and 0.99978 (0.99895), respectively. The calibrated H2Ov mole fractions from the Picarro and LGR analyzers were consistent in flight (Fig. S1 in the Supplement). The slower turnover of air in the LGR compared to the Picarro results in LGR H2Ov measurements that are effectively low-pass filtered when compared to the Picarro measurements.
The LGR TWVIA isotopic measurements were calibrated in the lab for H2Ov concentration dependence before and after the field campaign using an LGR Water Vapor Isotope Standard Source (WVISS; model: 908-0004-9003) with five standards ranging in isotope enrichment from −39.9 ‰ to −573.7 ‰ in δD and −8.7 ‰ to −76.2 ‰ in δ18O (Table S2 in the Supplement). Neither the Teflon sampling line between the WVISS and TWVIA nor the TWVIA aircraft inlet was heated. The range in the standards' δ values brackets the range of δ values measured during the campaign. The concentration dependence was characterized over the H2Ov mole fraction range from 550 to 14 000 ppmv, which corresponds to the lowest H2Ov mole fraction that the WVISS could consistently produce (Sect. S2 in the Supplement) and the highest H2Ov mole fraction observed during the research flights. The TWVIA's H2Ov concentration dependence was monitored between January 2016 and June 2017, with no appreciable instrument drift observed. H2Ov concentration-dependence calibration and residual curves are provided in Fig. S2.1 (δ18O) and Fig. S2.2 (δD) along with a discussion of the nonlinear calibration curve line fitting (Sect. S2). There was no need for an additional correction to normalize to the VSMOW-SLAP (Vienna Standard Mean Ocean Water – Standard Light Antarctic Precipitation) scale (discussed in Sect. S2; Fig. S2.3). Discussion of the instrument precision and calibration uncertainties is provided in Sect. S3. Total uncertainties, the quadrature sums of instrument precision and calibration uncertainties, increase as the H2Ov mole fraction decreases below 4000 ppmv (Fig. 1). Flight measurements of δD, δ18O, and d excess reported here are smoothed using a 20 s moving average which corresponds to the time required for the TWVIA-reported δ values to stabilize after a change in the sample's H2Ov mole fraction or isotopic signature (Sect. S3).
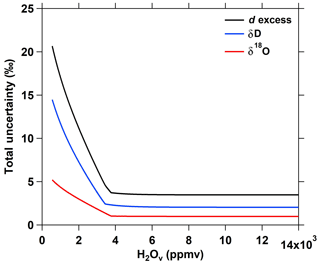
Figure 1Total uncertainty of δD, δ18O, and d excess over the range of H2Ov mole fractions observed in flight.
Table 1Flight date, research flight code, flight time (local time, LT), number of vertical profiles conducted, and the observed range of potential temperature (θ) and ambient temperature (T) during the flights.
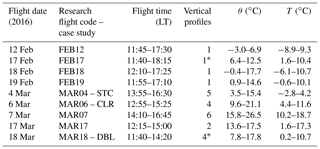
* Measurements of meteorological variables are completely or partially unavailable during one of the vertical profiles due to temporary failure of wind measurement system.
2.3 Flight design
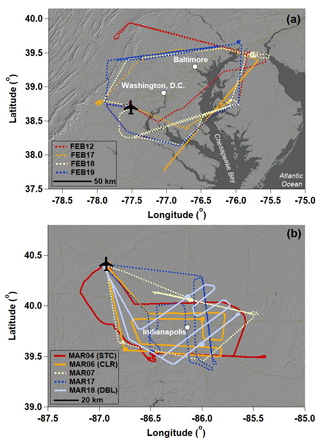
Nine daytime research flights were conducted around Washington, D.C., and Baltimore, MD, and Indianapolis in February and March 2016 (Table 1; Fig. 2). Flight paths were designed to maximize the number of vertical profiles (VPs) conducted while also characterizing upwind–downwind gradients in the H2Ov isotopic signature. VPs were sometimes conducted in a spiral pattern to limit the horizontal spatial coverage of the measurements, while other VPs were conducted in a sawtooth pattern (“porpoising”; Gerber et al., 2013) between the BL and FT. The aircraft flew up to ∼1600 m a.s.l. on average during the VPs. Only data collected on the descents of the VPs, when sampled air transitions from relatively dry to relatively humid are presented here to minimize the potential influence of memory effects. However, similar features were observed on the ascents and descents. The number of VPs (Table 1) conducted on each flight was limited by air traffic and restricted air space (which was worse for the Washington, D.C., and Baltimore, MD, study site), cloud cover, and available flight time. The research aircraft typically does not fly through clouds during experimental flights, as the BAT probe has electronics exposed to air. Flights included other maneuvers, such as transects conducted upwind, intersecting, and downwind of the urban centers, the interpretation of which is beyond the scope of this paper (Fig. 2).
2.4 Atmospheric layer identification
We classify regions of the atmosphere into the boundary layer (BL), INV, and FT to compare and contrast observed isotopic features during the research flights. The altitude at the base of the INV (zINV) is defined as the lowest altitude at which the change in potential temperature (θ) exceeds 0.5 K for a 10 m change in altitude (dθ∕dz>0.05 K m−1). Rates of dθ∕dz>0.05 K m−1 were commonly observed within the INV during the research flights. The altitude at the base of the FT (zFT) is defined as the altitude above zINV at which dθ∕dz transitions to < 0.05 K m−1. A recent evaluation of methods for determining boundary layer height from aircraft measurements indicates that the potential temperature gradient approach is most reliable (Dai et al., 2014). However, if layers are not definable using the dθ∕dz > or < 0.05 K m−1 criterion, the secondary criterion of and ppmv m−1 is used to define zINV and zFT, respectively. These threshold values are appropriate for our wintertime, midlatitude observations but may not be universally appropriate in different locations or seasons. If neither criterion is met, the profiles of θ, dθ∕dz, H2Ov, and d(H2Ov)∕dz are collectively considered, and zINV is visually defined as the point at which H2Ov and θ begin decreasing and increasing, respectively. Similarly, zFT is visually determined as the altitude at which the rate of change of H2Ov and θ with altitude begins to decrease.
2.5 Isotope theory
There are many processes that can influence the isotopic composition of atmospheric H2Ov; here we examine two common ways: condensation and mixing. We use the Rayleigh distillation model to represent condensation of an ascending air parcel and a simple two-member mixing model to represent atmospheric mixing. We calculate the influence of these processes using R notation but present the results by converting to delta notation () using VSMOW as the standard.
The Rayleigh distillation model describes the effects of equilibrium fractionation on the isotopic composition of a dehydrating air parcel, for example during ascent (Dansgaard, 1964). Condensate that is formed as an ascending air parcel expands and cools is enriched in the heavier isotope relative to the vapor, and in the open form of the Rayleigh model, is assumed to be immediately removed from the system (Eq. 1):
Here Ro and RRay are the heavy-to-light isotopologue ratios ( or ) of the parcel prior to the ascent and at any point throughout the ascent, respectively. The remaining fraction of H2Ov left in the ascending parcel relative to initial conditions is given by . We determined the initial Ro and input values for each day from the average BL values measured along the VP descents. The temperature-dependent equilibrium fractionation factor, αe, for each isotopologue is calculated using the temperature of the air parcel's lifting condensation level (LCL) altitude using findings of Horita and Wesolowski (1994) for LCL temperatures greater than 0 ∘C and those of Ellehøj et al. (2013) for LCL temperatures less than 0 ∘C. The LCL is the height at which an air parcel would become saturated along a dry adiabatic ascent and is often used as an estimate of cloud base height (Romps, 2017). The VP observations show that ambient temperatures vary with altitude along the vertical profiles. However, Rayleigh distillation curves calculated with αe values defined by the varying ambient temperatures measured along the vertical profiles are nearly identical to Rayleigh curves calculated with a single LCL-defined αe value (Fig. S4).
The mixing of two air parcels (A and B) results in a heavy-to-light isotopologue ratio of an air parcel, Rmix, given by Eq. (2) using HDOv as an example. Rmix is the ratio of the weighted average of the heavy isotopologue to the weighted average of the light isotopologue. The fractions of air parcel A, fA, and air parcel B, fB, sum to unity. The mixture's H2Ov mole fraction is simply the weighted average of each parcels' individual H2Ov mole fraction. v can replace HDOv in Eq. (2):
We consider mixing processes in our observations by choosing two regions of the VPs as potential end members, for example, the BL and the FT, and use the observed H2Ov and isotopic ratios to define end-member values.
The campaign-wide observations show that values of δD and δ18O decrease as H2Ov mole fractions approach zero (Fig. 3). This relationship results from preferential removal of the heavier isotopologues during condensation processes, which becomes more pronounced at colder temperatures, and is consistent with previous airborne and high-altitude measurements of H2Ov stable isotopologues (Bailey et al., 2013; Galewsky et al., 2007; He and Smith, 1999; Noone et al., 2013; Samuels-Crow et al., 2014; Sodemann et al., 2017). Later we will return to examine individual profiles of δD and δ18O on case study days, but here we focus on identifying common patterns in d-excess signatures observed in the BL, INV, and FT that can be used to understand processes controlling moisture in the lower troposphere.
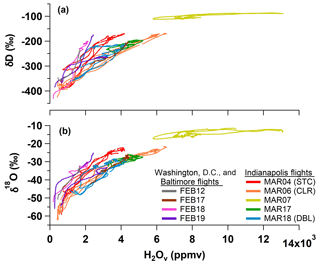
Figure 3Measurements of (a) δD and (b) δ18O versus H2Ov mole fraction made during vertical profile (VP) descents on the nine research flights (Table 1).
The Washington, D.C., and Baltimore, MD, and Indianapolis VP d-excess observations within the FT, INV, and BL are presented as a function of the H2Ov mole fraction in Fig. 4a–c, respectively. Generally, the air became drier and the d-excess signature exhibited greater variability with increasing altitude (Fig. 4). The greatest variability was observed in the INV (Fig. 4b), where the d-excess signature deviated both positively and negatively from the global average precipitation d-excess value of 10 ‰ (which is provided in Fig. 4 for reference only). The FT showed low H2Ov mole fractions as well as large positive d-excess values (Fig. 4a), which are predicted by Rayleigh distillation theory for very low H2Ov mole fractions (Bony et al., 2008). High FT d-excess signatures have been reported by other studies, which hypothesize that extremely dry, depleted air masses in the mid-to-upper troposphere with large positive d-excess signatures mix downward towards flight-level altitudes in the lower FT (Bony et al., 2008; Samuels-Crow et al., 2014; Sodemann et al., 2017). These FT air masses likely originated from another source region and possibly underwent multiple condensation cycles to achieve such isotopic depletion prior to mixing with more humid air across the INV. Thus, FT d-excess values likely act as a record of the condensation and isotopic depletion history of a transported air parcel.
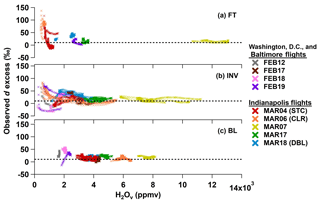
Figure 4Observations of d excess versus H2Ov mole fraction in the (a) free troposphere (FT), (b) inversion (INV), and (c) boundary layer (BL) during all the VP descents. Colors indicate each research flight. BL, INV, and FT observations are defined by the rate of change of atmospheric variables. The dashed lines correspond to the global average precipitation d-excess value of 10 ‰ for reference only.
The 7 March 2016 flight in Indianapolis (MAR07) reveals an unusual set of meteorological conditions because, unlike all other flight days of the campaign, the H2Ov mole fraction increased with altitude in the lower troposphere (Fig. 4a–c; gold trace), and it was the most humid day of the entire campaign (Fig. 3; gold trace). A warm, southerly front moved into the Indianapolis study area on this day, and rain preceded the flight measurements. The relatively high H2Ov mole fractions in the INV and FT likely reflect residual humidity from the storm. Overall, the MAR07 VP observations do not exhibit distinctive d-excess features, i.e., not deviating much from 10 ‰ in the INV and FT (Fig. 4).
We focus on three particular Indianapolis flights as representative case studies based on their distinct features and vertical profiles over large altitude ranges (Table 1). H2Ov isotope measurements conducted within and above the cloudless, well-mixed boundary layer on 6 March (CLR) represent the meteorologically simplest observations of the entire campaign, as no clouds, precipitation, or shifting synoptic conditions were observed. Isotopic observations on 4 March (STC) may reflect moisture processing in a stratocumulus topped BL, and the 18 March (developing boundary layer – DBL) observations may reveal differences in urban versus rural BL development and the influence of changing synoptic conditions.
4.1 Clear-sky observations of a well-mixed boundary layer (CLR)
Four VPs were conducted on 6 March 2016 (“CLR” case study) around Indianapolis during clear-sky conditions (Fig. 5a; weather map is presented in Fig. S5.1). Cloud-top height estimated from the Terra MODIS satellite retrievals (https://worldview.earthdata.nasa.gov/, last access: 5 February 2018) indicates that the sparse cloud cover shown in Fig. 5a corresponds to higher-altitude (> 4800 m) clouds. The CLR measurements were made below 1400 m a.s.l. (Fig. 5b) and, as a result, were likely not impacted by higher-cloud processes. In terms of meteorology, the CLR case study is the simplest flight day of the airborne campaign. It is a useful case study for examining isotopic signatures across the BL, INV, and FT without the influence of complex atmospheric circulations or vapor-condensate interactions from clouds or precipitation.
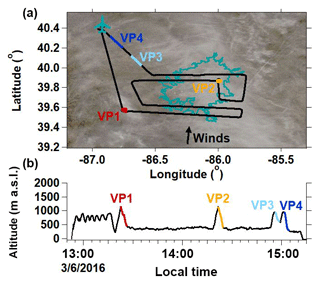
Figure 5(a) CLR flight path overlaying the study site's cloud cover (https://worldview.earthdata.nasa.gov/, last access: 5 February 2018) captured at 12:30 LT. The teal outline indicates the Indianapolis city boundaries. The West Lafayette, IN, Purdue airport is indicated by the airplane marker. (b) CLR case study altitude time series. Colored segments indicate vertical profile (VP) descents.
The VP measurements made during CLR indicate a well-mixed BL and FT, and wind speed and wind direction were relatively constant from the BL to FT, indicating that BL, INV, and FT air parcels shared recent advection histories. δ18O, δD, and d excess are relatively constant with altitude within the BL (surface to zINV), varying by 1.2 ‰, 15.3 ‰, and 10.9 ‰, respectively (Fig. 6a). VP2 observations are presented as a representative example of CLR because VP2 was conducted approximately midway through the flight (Fig. 5b), it covers the largest vertical range, and it was conducted in a spiral formation to minimize the horizontal spatial extent over which the measurements were made (Fig. 5a). The ambient temperature profile approximately follows the dry adiabatic lapse rate to the top of the BL (Fig. 6a), above which temperature increases within the INV layer. The H2Ov mole fraction decreases rapidly in the INV between zINV and zFT before becoming relatively constant in the FT. The δ18O and δD values track the H2Ov profile within the INV, decreasing by 30.8 ‰ and 193.2 ‰, respectively. Observed d-excess values in the INV initially decrease slightly with altitude and then increase, varying overall by 66.6 ‰. Above ∼1100 m in the FT, the H2Ov, δ18O, δD, and d-excess signatures are relatively constant with altitude.
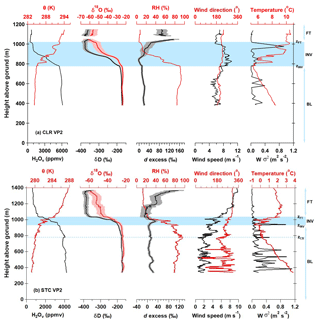
Figure 6Observations of meteorological and isotope variables along the second VP (VP2) conducted on (a) CLR (MAR06) and (b) STC (MAR04). Shading around the δ18O, δD, and d-excess VP measurements defines measurement uncertainty. Altitudes of the boundary layer (BL), inversion layer (INV), and free troposphere (FT) are indicated for reference. The inversion layers, which are bound at the bottom and top by zINV and zFT, respectively, are identified by blue horizontal bands. The dashed blue line in (b) corresponds to stratocumulus cloud base (zCB).
Observations of δD, δ18O, and d excess measured along the CLR VP descents are plotted as a function of the H2Ov mole fraction in Fig. 7 along with predictions from Rayleigh distillation theory (Fig. 7a–c) and different BL–FT mixing scenarios (Fig. 7d–f; Sect. 2.5). The measured δ values more closely match Rayleigh curves than the mixing lines from the BL through the INV (Fig. 7). However, positive deviations relative to Rayleigh d excess exist in the upper INV and lower FT (Fig. 7c). We hypothesize that dry, isotopically depleted FT air parcels carrying large, positive d-excess values can mix downward into more humid air parcels of smaller d-excess values near the top of the INV (Sodemann et al., 2017). As the H2Ov mole fraction approaches zero, Rayleigh-predicted d excess approaches 7000 ‰ (Bony et al., 2008). Thus, dehydrated lower-altitude FT air masses can carry a more positive d-excess signature for a given H2Ov mole fraction than that predicted by Rayleigh theory due to vertical mixing in the FT. The d-excess signature in the upper INV and lower FT more closely follows the FT–INV mixing lines (see VP1- and VP4-defined end-member mixing scenarios in Fig. 7f), which supports this hypothesis. Our results are consistent with Dyroff et al. (2015), who report lower-troposphere δD observations over the Atlantic Ocean and explain the vertical structure of δD at lower altitudes using Rayleigh theory, while mixing scenarios dictate the δD profile based on higher-altitude observations.
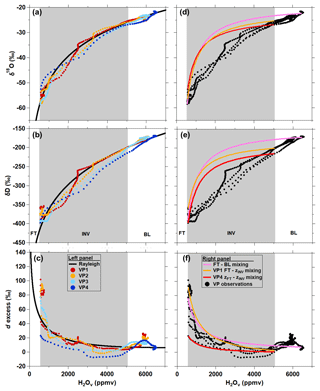
Figure 7Comparison of vertical profile δ18O (a, d), δD (b, e), and d-excess (c, f) measurements to Rayleigh theory (a, b, c) and mixing (d, e, f) curves for CLR (MAR06). Individual VP descents are indicated by the differently colored points. The bounds of the inversion layer (INV), indicated by grey shading, are defined by the average H2Ov mole fractions observed at zINV and zFT.
Despite apparent similarities between observed and Rayleigh d excess in the BL and INV, the meteorological conditions within the BL are contrary to assumptions of the Rayleigh distillation model. Rayleigh distillation theory describes a two-phase system at saturation; however, no clouds (i.e., condensate) were observed at the flight altitudes where the CLR measurements were made. Furthermore, the BL was dry adiabatic (Fig. 6a). The agreement between the CLR observations and the Rayleigh-predicted d excess, however, could be described by upwind condensation consistent with Rayleigh distillation theory followed by subsequent advection to the Indianapolis study site. Given that wind direction and wind speed were observed to be relatively constant throughout the lower troposphere (Fig. 6a), air parcels in the BL, INV, and FT likely share similar trajectories. Thus, the Rayleigh-consistent CLR VP observations at lower flight altitudes likely result from upwind condensation that imprinted an isotopic signature on the air parcels that was maintained during transport, while lower FT observations point to mixing between subsiding FT and INV air. Past studies have also reported on the usefulness of H2Ov stable isotopes as “imprints” of condensation, mixing, and atmospheric transport (Bailey et al., 2013; Brown et al., 2008; Galewsky et al., 2007; Gedzelman, 1988; He and Smith, 1999; Samuel-Crow et al., 2014; Taylor, 1984).
4.2 Stratocumulus-topped boundary layer observations (STC)
The central and eastern portions of the Indianapolis study area were covered by stratocumulus clouds during part of the 4 March 2016 flight (“STC” case study) on which five VPs were conducted (Fig. 8). The cloud cover map in Fig. 8a is provided to show the cloud type and extent during the afternoon of STC; however, it does not necessarily represent the cloud cover conditions throughout the 2.5 h flight. Satellite images (not shown) captured during the early afternoon of STC show that a thick cloud cover was sustained from the beginning into the middle of the flight, particularly over the city of Indianapolis, but eventually transitioned to scattered cover throughout the afternoon. This is consistent with visual observations made by the pilot and mission scientist that thick clouds persisted from the beginning of the flight until approximately 15:30 LT (local time). Vertical profile temperature and RH measurements collected on this day support the presence of a cloud layer (Fig. 6b). BL air was nearly saturated at 788 m (zCB for “cloud base”) along VP2 on STC (Fig. 6b). The ambient temperature lapse rate is 8.8 K km−1 (close to the dry adiabatic lapse rate of 9.8 K km−1) near the surface until an altitude of zCB, where the lapse rate transitions to 2.8 K km−1. These observations are indicative of a stratocumulus cloud layer, which sits directly below the INV and sustains the temperature inversion via radiative cooling (Wood, 2012). Indeed, a sharp decrease in θ is localized at zINV (Fig. 6b). Evidence of a stratocumulus cloud layer was apparent on VP1 and VP2, but a clear change in lapse rate below the INV was not observed on the later STC VPs, indicating the air was not saturated below the INV during the later portion of the flight, consistent with visual observations of the thinning cloud layer. The STC flight is a useful case study to investigate how a stratocumulus cloud layer can influence the vertical structure of H2Ov isotopologues in the lower troposphere.
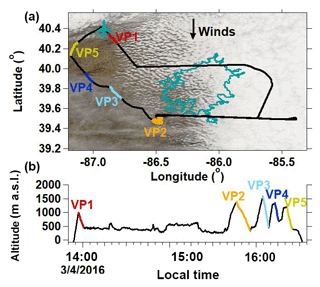
Figure 8(a) STC flight path overlaying the study site's cloud cover (https://worldview.earthdata.nasa.gov/, last access: 5 February 2018) captured at 12:30 LT. The teal outline indicates the Indianapolis city boundaries. The West Lafayette, IN, Purdue airport is indicated by the airplane marker. (b) STC case study altitude time series. Colored segments indicate vertical profile (VP) descents.
Measurements of isotopic and meteorological variables made along VP2 are shown in Fig. 6b. VP2 data are presented because the measurements were conducted approximately mid-flight and in a spiral flight formation. Measurements of δ18O, δD, and d excess within the BL varied by 3.3 ‰, 27.4 ‰, and 19.1 ‰, respectively. This is approximately double the variability in δD, δ18O, and d excess observed within the BL along the CLR VP2 (Fig. 6a). Within the INV, H2Ov, δ18O, and δD values decrease by 1930 ppmv, 17.6 ‰, and 159.7 ‰, respectively from BL values. Similar to CLR, d excess steadily increases with altitude in the FT on STC as H2Ov mole fractions decrease. Despite general similarities in the vertical structure of the δ values on the CLR and STC flight days, there are notable differences in the d-excess structure near the INV (Fig. 6). Contrary to the CLR INV d-excess profile (Fig. 6a), d excess on STC first increases with altitude within the lower INV before decreasing to a minimum at zFT (Fig. 6b). Obvious anomalies in the STC d-excess signature relative to CLR are also apparent when plotted as a function of the H2Ov mole fraction (Figs. 9c and 7c).
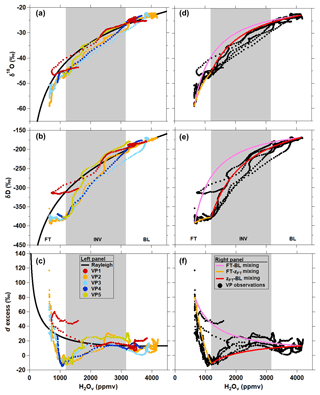
Figure 9Comparison of vertical profile δ18O (a, d), δD (b, e), and d excess (c, f) measurements to Rayleigh theory (a, b, c) and mixing (d, e, f) curves for STC (MAR04). Individual VP descents are indicated by the differently colored points. The bounds of the inversion layer (INV), indicated by grey shading, are defined by the average H2Ov mole fractions observed at zINV and zFT.
While the atmosphere on STC was unsaturated at most flight altitudes (except near the cloud base; Fig. 6b), the comparison to open-system Rayleigh curves is a useful exercise, as we showed above in the discussion of the CLR case study. STC VP δ18O and δD observations deviated negatively from the Rayleigh curve in drier portions of the INV and FT and were more pronounced for δD than δ18O (Fig. 9a–b). Most of the VPs' δD values are more negative relative to Rayleigh in the INV and plateau in the FT, which is unusual in water vapor isotope observations (Fig. 9b). Mixing processes can produce δ18O and δD values that plot very nearly on or above the open-system Rayleigh curve depending on the mixing end members (e.g., Fig. 9d, e, and f), whereas processes involving non-equilibrium liquid–vapor interactions or closed-system Rayleigh processes can plot below the Rayleigh curve. The FT–BL mixing scenario is a poor match to observations, especially for d excess, whereas the FT–zFT and zFT–BL mixing scenarios show remarkable agreement with the VP d-excess observations on STC (Fig. 9d, e, and f). However, the mixing scenarios do not identify the third end-member source responsible for the minimum in d excess at zFT.
The d-excess measurements along VP2 through VP5 (Fig. 9c) reveal two anomalies that yield some insight: (1) the slight increase in d excess in the middle of the inversion layer (particularly for VP2 and VP5) and (2) the d-excess minimum at the INV–FT interface (zFT). From this minimum at zFT, the FT d-excess signature becomes more positive with increasing altitude (as the air becomes drier) and eventually transitions to being more positive than the Rayleigh curve (Fig. 9c).
The d-excess values observed during VP1 represent the only VP measurements on STC that do not exhibit a minimum at the INV–FT interface (Fig. 9c). Only VP1 was conducted before the research aircraft encountered the thick stratocumulus cloud layer over Indianapolis (Fig. 8a). Unlike VP, VP1 d excess tracks the Rayleigh curve at the INV–FT interface. Slightly above zFT, the VP1 H2Ov mole fraction increases and d excess approaches the mixing line (Fig. 9c and f). We believe that this VP represents conditions prior to cloud process influences.
The presence of the stratocumulus cloud layer is a defining meteorological characteristic of the STC case study day; therefore, we evaluate the potential for cloud and rain processes to cause the observed d-excess anomalies. Sodemann et al. (2017) also describe VP observations of a minimum in d excess (negative values) at the BL top and hypothesize that the negative d-excess signal results from rain droplet evaporation directly below cumulus clouds at the top of the boundary layer. Rehydration processes, like cloud and rain droplet evaporation, have been proposed as mechanisms that could produce negative d-excess anomalies (Bolot et al., 2013; Sodemann et al., 2017). HDO molecules preferentially evaporate relative to molecules (Dansgaard, 1964). The result is a relatively positive vapor d excess, while the d-excess signature of the residual droplet becomes progressively more negative as it evaporates (Aemisegger et al., 2015). Therefore, if liquid droplet evaporation occurred in separate atmospheric layers from start to finish, such as from the bottom of the INV to the top of the INV, a positive d-excess anomaly could be transferred to the surrounding vapor as the droplet begins evaporating starting in the lower INV. As the liquid droplet is subsequently transported to the upper INV, a negative d-excess anomaly could be transferred to the surrounding vapor as the evaporation of the liquid droplet nears completion. Evidence exists that stratocumulus cloud droplets can evaporate at different altitudes, specifically within the cloud layer and within the inversion layer (Kollias and Albrecht, 2000; de Lozar and Melledo, 2015). Furthermore, inversion layer depths are not homogeneous above a stratocumulus cloud layer. Observations show inversion layers to be thicker above downdrafts and thinner near updrafts (Kollias and Albrecht, 2000). Differing INV depths, and associated thermodynamic properties, above the stratocumulus cloud layer on STC may in part explain why unique d-excess anomalies were observed near the middle of the INV and at zFT (Fig. 6b and 9).
When evaluating the effect that cloud evaporation could have on VPs of H2Ov isotopologues, we must consider the altitudes at which clouds form and evaporate and the speed of the relevant processes. Stratocumulus cloud tops are typically directly below zINV (Wood, 2012). The top of the INV (zFT) is approximately the upper limit of BL mixing (Wood, 2012). Lofting of cloud droplets into the INV would cause droplet evaporation, as the INV was not saturated (Fig. 6b). This hypothesis requires that a negative d-excess anomaly is retained by an evaporating droplet while it is transported to the upper INV. This requires us to consider two important timescales: first, the timescale at which a liquid droplet isotopically equilibrates with its surrounding vapor, and second, the speed at which droplets move through the INV by vertical winds. Using the method described by Bolot et al. (2013), which is based on prior work by Jouzel (1986), we estimate that the e-folding time required for a cloud droplet with a 15 µm radius to isotopically equilibrate with the surrounding vapor is approximately 2 s under the conditions observed in the middle of the INV or about 5 s at the top of the INV. The time for a droplet to move from the bottom to the top of the INV is 19 s based on vertical wind speed observations. These calculations indicate that a cloud droplet located near the bottom of the INV would approach isotopic equilibrium with surrounding vapor before reaching the top of the INV under the observed flight conditions. Thus, these calculations do not strongly support the hypothesis that evaporation of stratocumulus cloud droplets produced the observed minimum in d excess at zFT.
The question of what process or processes are responsible for the minimum in d excess at the INV–FT interface (zFT) remains. A key characteristic of stratocumulus cloud layers is the longwave cooling at the cloud tops which maintains and enhances in-cloud turbulence (Wood, 2012). If previous INV conditions on STC were colder, had faster vertical wind speeds, or the liquid droplet radii were larger than 50 µm (e.g., rain drizzle), the timescales associated with isotopic equilibrium and transport across the INV could converge. The main difference between the cloud and rain droplet evaporation processes is the size of the liquid droplets: < 50 µm for cloud versus > 50 µm for rain droplets (Kollias and Albrecht, 2000). It is possible that such conditions were present prior to when the STC measurements were made and that the minimum in d excess is the isotopic imprint of rain droplet evaporation under cold, unsaturated, or turbulent conditions. We find discussion of these potential d-excess anomalies in the literature in reference to rain droplets evaporating below the cloud layer (Aemisegger et al., 2015; Gat, 1996), but we believe that the same isotopic fingerprint on vapor could occur as liquid cloud or rain drizzle droplets lofted in drier environments finish evaporating at the top of the INV, or at the top of the BL, as hypothesized by Sodemann et al. (2017).
The negative H2Ov d-excess observations at zFT could also have resulted from kinetic fractionation of vapor during deposition on ice crystals or snow (i.e., in ice-supersaturated conditions; Bolot et al., 2013; Casado et al., 2016; Galewsky, 2015; Lowenthal et al., 2016; Moore et al., 2016; Samuels-Crow et al., 2014; Schmidt et al., 2005). Low d-excess values (relative to Rayleigh curves assuming that RH = 100%) were sometimes observed within the INV layers during the Washington, D.C., and Baltimore, MD, flights (Fig. 4b). Ambient temperatures observed in flight in Washington, D.C., and Baltimore, MD, were sometimes less than 0 ∘C (Table 1); thus vapor deposition on ice crystals could be possible for those scenarios. It is unlikely that vapor deposition on ice occurred during the STC case study flight because temperatures were greater than 0 ∘C (Table 1). However, as an example, Fig. S6 shows the theoretical d-excess values of STC vapor under ice-supersaturated conditions (Sect. S6). We reiterate that ice supersaturation is an unlikely explanation for the STC zFT d-excess minimum because flight altitudes were less than 2 km, and ice (cirrus) clouds are typically present at ∼6 km. It is unlikely that ice hydrometeors falling from higher altitudes could be sustained at the top of the inversion and contribute to the low d-excess signal observed on VP2–VP5 through vapor deposition given the > 0 ∘C temperatures. There was, however, a region of high humidity upwind (northwest) of the study site at altitudes between 3 and 5.5 km, where ice or mixed-phase condensate could have been present (Fig. S5.2). It is possible that condensation under ice-supersaturated conditions occurred prior to the STC flight and that the resulting isotopic imprint was maintained during transport to Indianapolis and subsequently mixed downward via subsiding FT air (Fig. 9f). Both of these explanations for the minimum in d excess at zFT on STC require an advected signal of a prior process (complete cloud droplet evaporation or vapor deposition on ice). This process must have happened relatively close in time to the STC flight, since the minimum in d excess at zFT was not observed on VP1, but the anomaly was observed 2 h later when VP2–VP5 were conducted.
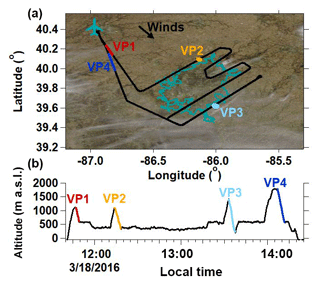
Figure 10(a) DBL flight path overlaying the study site's cloud cover (https://worldview.earthdata.nasa.gov/, last access: 5 February 2018) captured at approximately 12:30 LT. The teal outline indicates the Indianapolis city boundaries. The West Lafayette, IN, Purdue airport is indicated by the airplane marker. (b) DBL case study altitude time series. Colored segments indicate vertical profile (VP) descents.
4.3 Developing boundary layer observations (DBL)
The final airborne case study, conducted on 18 March 2016 in Indianapolis (Fig. 10), is referred to as DBL because measurements on this day reveal considerable spatiotemporal variability in the vertical structure of the observed meteorological and isotopic variables. The boundary layer height increased over the course of the flight and may reflect a combination of a residual layer from the previous day, urban vs. rural differences in BL development, and the effects of a frontal pattern moving across the Indianapolis study area.
A defining characteristic of the DBL case study is the variability in both the meteorological and isotopic variables between each of the four VPs (Fig. 11). Observations along VP1 show an INV layer, marked by a characteristic increase in θ and a corresponding decrease in H2Ov with altitude (Fig. 11a), separating the BL and FT. However, there appears to be two distinct atmospheric layers between the BL and FT in VP2 (Fig. 11b). The layer directly below the FT in VP2 is consistent with a residual layer (RL) from the previous day's boundary layer (Fig. 11b). We define the base of the RL using the same approach described in Sect. 2.4 (dθ∕dz and threshold values) for determining the base of the INV (zINV). Both the RL and the INV (directly below the RL) show characteristic decreases in H2Ov, δ18O, and δD values with altitude. The presence of multiple layers is supported by the increase in the variance of the vertical wind speed (W σ2), indicating wind shear, at the interface of atmospheric layers (Fig. 11b). Similarities in the vertical structure of H2Ov and d excess between VP2 and VP3 give indications that the RL persisted for an additional hour after VP2 was conducted (Fig. 11c). Despite a temporary failure of the aircraft's wind measurement system halfway through the VP3 descent, available measurements show an increase in wind speed and vertical wind variance (W σ2) as well as sharp temperature changes at the base and top of the RL, supporting VP3's d-excess indications of the persisting RL (Fig. 11c).
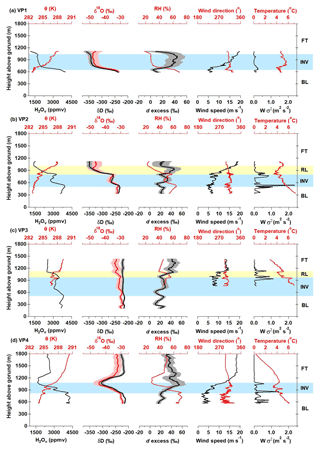
Figure 11DBL vertical profile (VP) measurements from 18 March 2016 in the boundary layer (BL), inversion layer (INV; blue), previous day's residual layer (RL; yellow), and free troposphere (FT). Observations corresponding to VP1–VP4 are shown in (a)–(d), respectively.
This residual layer hypothesis is supported by ambient temperature profiles from the Rapid Refresh model-data assimilation system (Iowa State University, https://mesonet.agron.iastate.edu/archive/, last access: 7 May 2018) for the Indianapolis International Airport (KIND) from the day prior to DBL, 17 March 2016, which follow a nearly dry adiabatic lapse rate all the way to an altitude of 3 km (Fig. S7; archived at https://mesonet.agron.iastate.edu/archive/, last access: 7 May 2018). This was a relatively warm, turbulent day. A cold front moved into the Indianapolis study area on the DBL (18 March 2016). The ambient temperature profile on the DBL shows the previous day's residual layer persisted into the early afternoon, between approximately 1 and 3 km (Fig. S7), before being incorporated into the BL. The distinction between the RL and BL blurs as surface heating progresses throughout the day and the RL is incorporated into the BL. It would also be expected that the downwind edge of the Indianapolis city boundaries (winds were from the northwest; Fig. 11a) would have a more well-mixed BL due to stronger turbulent mixing from the urban heat island and increased surface roughness (Grimmond et al., 2010; Stull, 1988). Support for this is given by measurements made along VP3, which were conducted on the downwind edge of the Indianapolis city boundaries and reveal a considerably more homogenous structure in δD and δ18O relative to VP1 and VP2 (Fig. 11c). The ambient temperatures measured along VP3 in the FT and RL are warmer relative to ambient temperatures along the other three VPs (Fig. 11), demonstrating the influence of the urban heat island. Although the VP3 H2Ov, δD, and δ18O values are relatively more homogenous in the vertical dimension, the d-excess signatures still maintain indications of the RL, as the vertical structure of d excess is similar to VP2 d-excess observations.
Measurements of δ18O and δD values along DBL VP3 are the only observations during our airborne campaign measurements of enriched, and relatively constant, δ values that extend from the BL through to the FT (Fig. 11c). FT H2Ov mole fractions along VP3 only decreased to ∼2500 ppmv, whereas H2Ov mole fractions of 1700 ppmv and less were observed in the FT of VP1 and VP2 (Figs. 11a–c and 12). Relatively humid conditions were also observed at the highest altitudes flown in the FT along VP4 (Fig. 11d). Enriched, vertically unvarying δ18O and δD values are unique to DBL VP3. VP4 δ18O and δD values decrease across the INV (Fig. 11d) and track a δ-H2Ov path similar to VP1 and VP2 from the BL up to the INV–FT interface, which are similar in shape to both Rayleigh predictions or BL–FT mixing scenarios (Fig. 12). Interestingly, VP4 FT δ18O and δD values become enriched at higher altitudes, corresponding to an increase in H2Ov mole fractions (Fig. 11d), and appear to track a mixing line with the VP3 zINV end-member δ values (red trace in Fig. 12d–e). Despite differences in δ-value features along the four DBL VPs, the relationship between d excess and the H2Ov mole fraction appears to be remarkably consistent throughout the day (Fig. 12c).
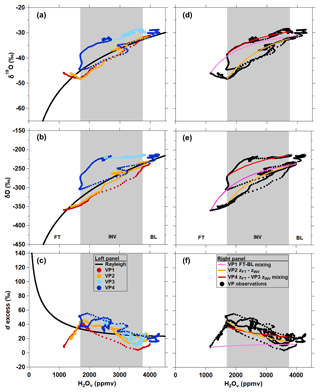
Figure 12Comparison of vertical profile δ18O (a, d), δD (b, e), and d-excess (c, f) measurements to Rayleigh theory (a, b, c) and mixing (d, e, f) curves for DBL (MAR18). Individual VP descents are indicated by the differently colored points. The bounds of the inversion layer (INV), indicated by grey shading, are defined by the average H2Ov mole fractions observed at zINV and zFT.
The relatively humid, isotopically enriched FT air observed along VP3 and VP4 could have been caused by the shortwave trough in the mid-troposphere (3–5 km) which carried moist air into the Indianapolis study air in the late afternoon on this day (Fig. S5.3). The dew-point profile in Fig. S7 shows this relatively moist mid-tropospheric air subsiding over the course of the afternoon, reaching flight altitudes by the time VP3 and VP4 were flown. The vertically unvarying, isotopically enriched VP3 observations likely reflect a combination of enhanced turbulence from the urban area and humid air from the shortwave trough mixing downward into the lower FT. In contrast, VP4 was conducted over a rural area north of Indianapolis and likely did not experience the same degree of vertical mixing as the atmosphere downwind of Indianapolis (where VP3 was flown; Fig. 10a). Potentially due to weaker turbulence in the rural area, a sharp decrease in δD and δ18O was observed at zFT on VP4 before increasing with altitude, reaching enriched δ values observed in the VP4 BL and throughout VP3.
The DBL case study shows how isotopic water vapor measurements can be used as tracers to track the development of different atmospheric structures and circulations, including residual layers, urban heat island impacts, and passing fronts. δD, δ18O, and particularly d excess can support meteorological measurements in identifying distinct atmospheric layers that are difficult to identify solely based on meteorological data.
The aim of this study is to observe and interpret the vertical structure of H2Ov stable isotopic composition, specifically d excess, in the continental lower troposphere. Previous studies presenting d-excess observations are heavily focused on ocean evaporation at coastal or island surface sites (Benetti et al., 2014, 2015, 2018; Delattre et al., 2015; Steen-Larsen et al., 2014; Uemura et al., 2008). Few reported observations of d excess in the INV and FT exist (Galewsky et al., 2015; Lowenthal et al., 2016; Kelsey et al., 2018; Samuels-Crow et al., 2014; Schmidt et al., 2005; Sodemann et al., 2017), and, to our knowledge, only one study has used airborne measurements to provide high-vertical-resolution snapshots of the lower-troposphere d-excess profile at discrete time points (Sodemann et al., 2017). Our stable H2Ov isotope measurements over two continental sites are a starting point in filling the field's gap in understanding variability in the lower-troposphere d-excess profile and what it reveals about lower-troposphere moisture processing on relatively small regional scales.
Our observations reaffirm the dominant role that Rayleigh distillation processes have on H2Ov isotopic signatures and that these isotopic signatures can be retained by air masses as they are advected from previous condensation events. Our measurements indicate that H2Ov isotopologues, and d excess in particular, can act as fingerprints of earlier processes. This is true for the CLR case study, in which Rayleigh distillation curves represent vertical profile observations well from near the surface up through the atmospheric inversion layer despite the temperature profile within the BL following the dry rather than the (Rayleigh-assumed) moist adiabat. Similarly, the evidence of upwind processes was also retained in the H2Ov isotopic signature on STC. The STC measurements give clues that the observed air mass experienced prior evaporation of cloud or rain droplets. Measurements made during the rapidly changing atmospheric conditions on the DBL case study also show that the H2Ov isotopic signature can reflect near-instantaneous changes in the atmosphere.
These new results highlight the potential for H2Ov isotope ratios, especially d excess, to identify complex processes across the atmospheric inversion layer, including cloud condensation, evaporation, and mixing or entrainment of free tropospheric air into the boundary layer. On each case study day, the combination of all three isotope metrics provided additional information that may have been missed from either δD or δ18O alone. For example, our results show that d excess clearly distinguishes Rayleigh from mixing processes in the FT on the CLR case study day. The potential role of cloud or raindrop evaporation is most obvious in the d-excess observations followed by some indication in the δD vertical profile as well on the STC case study day. Our observations of the d-excess profile in a stratocumulus cloud-topped boundary layer and the d-excess observations reported by Sodemann et al. (2017) near marine cumulus clouds represent an opportunity to investigate the sensitivity of the d-excess signature to different classes of clouds and their associated unique cloud processes. Finally, on the DBL case study day, both d excess and the individual isotope ratios were able to distinguish unique air masses mixing at different altitudes evolving throughout the afternoon. These types of measurements may become increasingly valuable as we seek to understand the physical processes that sustain cloud layers and spatiotemporally variable boundary layer mixing depths.
Our interpretation of the d-excess VPs could be further evaluated by isotope-enabled circulation and weather models (Aemisegger et al., 2015; Pfahl et al., 2012; Schmidt et al., 2005). However, the simulation of convective boundary layer processes with isotope-enabled models is complex (Bolot et al., 2013; Benetti et al., 2018). The measurements reported here could help further develop current and forthcoming isotope enabled models, particularly for simulating wintertime, continental lower-troposphere processes or stratocumulus evaporation.
Geopositional, meteorological, greenhouse gas, and water vapor isotope measurements are available for the Washington, D.C., and Baltimore, MD, and Indianapolis flight days (Table 1) are available by request or through the Yale Stable Water Vapor Isotopes Database: https://vapor-isotope.yale.edu/ (Salmon and Welp, 2019). The data have also been archived at the Purdue University Research Repository under https://doi.org/10.4231/1MZN-1C18 (Salmon et al., 2019). The authors request that they be notified if the data are to be used in publication.
The supplement related to this article is available online at: https://doi.org/10.5194/acp-19-11525-2019-supplement.
OES, LRW, and PBS designed the experiments. OES collected the airborne data, with the help of KDH. OES analyzed the data. OES, LRW, MEB, and PBS interpreted the results. OES prepared the paper, with contributions from all co-authors. BHS maintained the experimental aircraft.
The authors declare that they have no conflict of interest.
We thank Bruce Vaughn of the Institute of Arctic and Alpine Research (INSTAAR) for generously sharing a sample of South Pole glacier isotope standard. We are grateful to Tomas Ratkus of Purdue University Science IT for his technological expertise while we prepared for the research flights. We thank LGR tech support for corresponding with us while we characterized the TWVIA's water vapor concentration dependence. We thank Purdue University's Jonathon Amy Facility for Chemical Instrumentation (JAFCI) for their expertise in designing and maintaining ALAR's instrument suite. We also thank reviewers Adriana Bailey and Harald Sodemann for their insight and invaluable suggestions that improved this paper. This is Purdue Climate Change Research Center paper number 1919.
This research has been supported by James Whetstone and the National Institute of Standards and Technology (grant no. 18100025; award number 70NANB14H332).
This paper was edited by Heini Wernli and reviewed by Harald Sodemann and one anonymous referee.
Aemisegger, F., Spiegel, J. K., Pfahl, S., Sodemann, H., Eugster, W., and Wernli, H.: Isotope meteorology of cold front passages: A case study combining observations and modeling, Geophys. Res. Lett., 42, 5652–5660, https://doi.org/10.1002/2015gl063988, 2015.
Bailey, A., Noone, D., Berkelhammer, M., Steen-Larsen, H. C., and Sato, P.: The stability and calibration of water vapor isotope ratio measurements during long-term deployments, Atmos. Meas. Tech., 8, 4521–4538, https://doi.org/10.5194/amt-8-4521-2015, 2015.
Benetti, M., Reverdin, G., Pierre, C., Merlivat, L., Risi, C., Steen-Larsen, H. C., and Vimeux, F.: Deuterium excess in marine water vapor: Dependency on relative humidity and surface wind speed during evaporation, J. Geophys. Res.-Atmos., 119, 584–593, https://doi.org/10.1002/2013JD020535, 2014.
Benetti, M., Aloisi, G., Reverdin, G., Risi, C., and Sèze, G.: Importance of boundary layer mixing for the isotopic composition of surface vapor over the subtropical North Atlantic Ocean, J. Geophys. Res.-Atmos., 120, 2190–2209, https://doi.org/10.1002/2014jd021947, 2015.
Benetti, M., Lacour, J. L., Sveinbjörnsdóttir, A. E., Aloisi, G., Reverdin, G., Risi, C., Peters, A. J., and Steen-Larsen, H. C.: A framework to study mixing processes in the marine boundary layer using water vapor isotope measurements, Geophys. Res. Lett., 45, 2524–2532, https://doi.org/10.1002/2018GL077167, 2018.
Bolot, M., Legras, B., and Moyer, E. J.: Modelling and interpreting the isotopic composition of water vapour in convective updrafts, Atmos. Chem. Phys., 13, 7903–7935, https://doi.org/10.5194/acp-13-7903-2013, 2013.
Bony, S., Risi, C., and Vimeux, F.: Influence of convective processes on the isotopic composition (δ18O and δD) of precipitation and water vapor in the tropics: 1. Radiative-convective equilibrium and Tropical Ocean–Global Atmosphere–Coupled Ocean-Atmosphere Response Experiment (TOGA-COARE) simulations, J. Geophys. Res.-Atmos., 113, D19305, https://doi.org/10.1029/2008JD009942, 2008.
Brown, D., Worden, J., and Noone, D.: Comparison of atmospheric hydrology over convective continental regions using water vapor isotope measurements from space, J. Geophys. Res.-Atmos., 113, D15124, https://doi.org/10.1029/2007jd009676, 2008.
Casado, M., Landais, A., Masson-Delmotte, V., Genthon, C., Kerstel, E., Kassi, S., Arnaud, L., Picard, G., Prie, F., Cattani, O., Steen-Larsen, H. C., Vignon, E., and Cermak, P.: Continuous measurements of isotopic composition of water vapour on the East Antarctic Plateau, Atmos. Chem. Phys., 16, 8521–8538, https://doi.org/10.5194/acp-16-8521-2016, 2016.
Crawford, T. L. and Dobosy, R. J.: A sensitive fast-response probe to measure turbulence and heat flux from any airplane, Bound.-Lay. Meteorol., 59, 257–278, https://doi.org/10.1007/BF00119816, 1992.
Dai, C., Wang, Q., Kalogiros, J. A., Lenschow, D. H., Gao, Z., and Zhou, M.: Determining boundary-layer height from aircraft measurements, Bound.-Lay. Meteorol., 152, 277–302, https://doi.org/10.1007/s10546-014-9929-z, 2014.
Dansgaard, W.: Stable isotopes in precipitation, Tellus, 16, 436–468, https://doi.org/10.1111/j.2153-3490.1964.tb00181.x, 1964.
Delattre, H., Vallet-Coulomb, C., and Sonzogni, C.: Deuterium excess in the atmospheric water vapour of a Mediterranean coastal wetland: regional vs. local signatures, Atmos. Chem. Phys., 15, 10167–10181, https://doi.org/10.5194/acp-15-10167-2015, 2015.
de Lozar, A. and Mellado, J. P.: Evaporative cooling amplification of the entrainment velocity in radiatively driven stratocumulus, Geophys. Res. Lett., 42, 7223–7229, https://doi.org/10.1002/2015gl065529, 2015.
Dyroff, C., Sanati, S., Christner, E., Zahn, A., Balzer, M., Bouquet, H., McManus, J. B., González-Ramos, Y., and Schneider, M.: Airborne in situ vertical profiling of in the subtropical troposphere during the MUSICA remote sensing validation campaign, Atmos. Meas. Tech., 8, 2037–2049, https://doi.org/10.5194/amt-8-2037-2015, 2015.
Ellehøj, M. D., Steen-Larsen, H. C., Johnsen, S. J., and Madsen, M. B.: Ice-vapor equilibrium fractionation factor of hydrogen and oxygen isotopes: Experimental investigations and implications for stable water isotope studies, Rapid Commun. Mass Sp., 27, 2149–2158, https://doi.org/10.1002/rcm.6668, 2013.
Field, R. D., Jones, D. B. A., and Brown, D. P.: Effects of postcondensation exchange on the isotopic composition of water in the atmosphere, J. Geophys. Res.-Atmos., 115, D24305, https://doi.org/10.1029/2010jd014334, 2010.
Froehlich, K., Kralik, M., Papesch, W., Rank, D., Scheifinger, H., and Stichler, W.: Deuterium excess in precipitation of alpine regions – moisture recycling, Isot. Environ. Healt. S., 44, 61–70, https://doi.org/10.1080/10256010801887208, 2008.
Galewsky, J.: Constraining supersaturation and transport processes in a South American cold-air outbreak using stable isotopologues of water vapor, J. Atmos. Sci., 72, 2055–2069, https://doi.org/10.1175/jas-d-14-0352.1, 2015.
Galewsky, J., Strong, M., and Sharp, Z. D.: Measurements of water vapor D/H ratios from Mauna Kea, Hawaii, and implications for subtropical humidity dynamics, Geophys. Res. Lett., 34, L22808, https://doi.org/10.1029/2007gl031330, 2007.
Galewsky, J., Steen-Larsen, H. C., Field, R. D., Worden, J., Risi, C., and Schneider, M.: Stable isotopes in atmospheric water vapor and applications to the hydrologic cycle, Rev. Geophys., 54, 809–865, https://doi.org/10.1002/2015RG000512, 2016.
Garman, K. E.: Precision of airborne wind measurement for atmospheric flight research, Purdue University, 1–239, 2009.
Garman, K. E., Hill, K., Wyss, P., Carlsen, M., Zimmerman, J., Stirm, B., Carney, T., Santini, R., and Shepson, P.: An airborne and wind tunnel evaluation of a wind turbulence measurement system for aircraft-based flux measurements, J. Atmos. Ocean. Technol., 23, 1696–1708, https://doi.org/10.1175/JTECH1940.1, 2006.
Garman, K. E., Wyss, P., Carlsen, M., Zimmerman, J., Stirm, B., Carney, T., Santini, R., and Shepson, P.: The contribution of variability of lift-induced upwash to the uncertainty in vertical winds determined from an aircraft platform, Bound.-Lay. Meteorol., 126, 461–476, https://doi.org/10.1007/s10546-007-9237-y, 2008.
Gat, J. R.: Oxygen and hydrogen isotopes in the hydrologic cycle, Ann. Rev. Earth Planet. Sc., 24, 225–262, https://doi.org/10.1146/annurev.earth.24.1.225, 1996.
Gedzelman, S. D.: Deuterium in water vapor above the atmospheric boundary layer, Tellus B, 40, 134–147, https://doi.org/10.1111/j.1600-0889.1988.tb00217.x, 1988.
Gerber, H., Frick, G., Malinowski, S. P., Jonsson, H., Khelif, D., and Krueger, S. K.: Entrainment rates and microphysics in POST stratocumulus, J. Geophys. Res.-Atmos., 118, 12094–12109, https://doi.org/10.1002/jgrd.50878, 2013.
Griffis, T. J., Wood, J. D., Baker, J. M., Lee, X., Xiao, K., Chen, Z., Welp, L. R., Schultz, N. M., Gorski, G., Chen, M., and Nieber, J.: Investigating the source, transport, and isotope composition of water vapor in the planetary boundary layer, Atmos. Chem. Phys., 16, 5139–5157, https://doi.org/10.5194/acp-16-5139-2016, 2016.
Grimmond, C. S. B., Blackett, M., Best, M. J., Barlow, J., Baik, J.-J., Belcher, S. E., Bohnenstengel, S. I., Calmet, I., Chen, F., Dandou, A., Fortuniak, K., Gouvea, M. L., Hamdi, R., Hendry, M., Kawai, T., Kawamoto, Y., Kondo, H., Krayenhoff, E. S., Lee, S.-H., Loridan, T., Martilli, A., Masson, V., Miao, S., Oleson, K., Pigeon, G., Porson, A., Ryu, Y.-H., Salamanca, F., Shashua-Bar, L., Steeneveld, G.-J., Tombrou, M., Voogt, J., Young, D., and Zhang, N.: The international urban energy balance models comparison project: first results from phase 1, J. Appl. Meteorol. Climatol., 49, 1268–1292, https://doi.org/10.1175/2010JAMC2354.1, 2010.
He, H. and Smith, R. B.: Stable isotope composition of water vapor in the atmospheric boundary layer above the forests of New England, J. Geophys. Res.-Atmos., 104, 11657–11673, https://doi.org/10.1029/1999JD900080, 1999.
Held, I. M. and Soden, B. J.: Water vapor feedback and global warming, Annu. Rev. Energ. Env., 25, 441–475, https://doi.org/10.1146/annurev.energy.25.1.441, 2000.
Held, I. M. and Soden, B. J.: Robust Responses of the Hydrological Cycle to Global Warming, J. Clim., 19, 5686–5699, https://doi.org/10.1175/jcli3990.1, 2006.
Herman, R. L., Cherry, J. E., Young, J., Welker, J. M., Noone, D., Kulawik, S. S., and Worden, J.: Aircraft validation of Aura Tropospheric Emission Spectrometer retrievals of HDO∕H2O, Atmos. Meas. Tech., 7, 3127–3138, https://doi.org/10.5194/amt-7-3127-2014, 2014.
Horita, J. and Wesolowski, D. J.: Liquid-vapor fractionation of oxygen and hydrogen isotopes of water from the freezing to the critical temperature, Geochim. Cosmochim. Ac., 58, 3425–3437, https://doi.org/10.1016/0016-7037(94)90096-5, 1994.
Hurley, J. V. and Galewsky, J.: A last-saturation diagnosis of subtropical water vapor response to global warming, Geophys. Res. Lett., 37, L06702, https://doi.org/10.1029/2009gl042316, 2010.
Jouzel, J.: Chapter 2 – Isotopes in cloud physics: multiphase and multistage condensation processes, in: The Terrestrial Environment, B, edited by: Fritz, P. and Fontes, J. C., Elsevier, Amsterdam, 61–112, 1986.
Kelsey, E., Bailey, A., and Murray, G.: The impact of Mount Washington on the height of the boundary layer and the vertical structure of temperature and moisture, Atmosphere, 9, 293–309, 2018.
Kollias, P. and Albrecht, B.: The turbulence structure in a continental stratocumulus cloud from millimeter-wavelength radar observations, J. Atmos. Sci., 57, 2417–2434, 2000.
Kunkel, K. E., Karl, T. R., Brooks, H., Kossin, J., Lawrimore, J. H., Arndt, D., Bosart, L., Changnon, D., Cutter, S. L., Doesken, N., Emanuel, K., Groisman, P. Y., Katz, R. W., Knutson, T., O'Brien, J., Paciorek, C. J., Peterson, T. C., Redmond, K., Robinson, D., Trapp, J., Vose, R., Weaver, S., Wehner, M., Wolter, K., and Wuebbles, D.: Monitoring and understanding trends in extreme storms: state of knowledge, B. Am. Meteorol. Soc., 94, 499–514, https://doi.org/10.1175/bams-d-11-00262.1, 2012.
Lai, C.-T. and Ehleringer, J. R.: Deuterium excess reveals diurnal sources of water vapor in forest air, Oecologia, 165, 213–223, https://doi.org/10.1007/s00442-010-1721-2, 2011.
Lawrence, J. R., Gedzelman, S. D., Dexheimer, D., Cho, H.-K., Carrie, G. D., Gasparini, R., Anderson, C. R., Bowman, K. P., and Biggerstaff, M. I.: Stable isotopic composition of water vapor in the tropics, J. Geophys. Res.-Atmos., 109, D06115, https://doi.org/10.1029/2003jd004046, 2004.
Lowenthal, D., Hallar, A. G., McCubbin, I., David, R., Borys, R., Blossey, P., Muhlbauer, A., Kuang, Z., and Moore, M.: Isotopic fractionation in wintertime orographic clouds, J. Atmos. Ocean. Technol., 33, 2663–2678, https://doi.org/10.1175/jtech-d-15-0233.1, 2016.
Merlivat, L.: Molecular diffusivities of , HD16O, and in gases, J. Chem. Phys., 69, 2864–2871, https://doi.org/10.1063/1.436884, 1978.
Moore, M., Blossey, P. N., Muhlbauer, A., and Kuang, Z.: Microphysical controls on the isotopic composition of wintertime orographic precipitation, J. Geophys. Res.-Atmos., 121, 7235–7253, https://doi.org/10.1002/2015JD023763, 2016.
Noone, D.: Pairing measurements of the water vapor isotope ratio with humidity to deduce atmospheric moistening and dehydration in the tropical midtroposphere, J. Clim., 25, 4476–4494, https://doi.org/10.1175/jcli-d-11-00582.1, 2012.
Noone, D., Risi, C., Bailey, A., Berkelhammer, M., Brown, D. P., Buenning, N., Gregory, S., Nusbaumer, J., Schneider, D., Sykes, J., Vanderwende, B., Wong, J., Meillier, Y., and Wolfe, D.: Determining water sources in the boundary layer from tall tower profiles of water vapor and surface water isotope ratios after a snowstorm in Colorado, Atmos. Chem. Phys., 13, 1607–1623, https://doi.org/10.5194/acp-13-1607-2013, 2013.
Park, S., Baek, E.-H., Kim, B.-M., and Kim, S.-J.: Impact of detrained cumulus on climate simulated by the Community Atmosphere Model Version 5 with a unified convection scheme, J. Adv. Model. Earth Sy., 9, 1399–1411, https://doi.org/10.1002/2016ms000877, 2017.
Pfahl, S., Wernli, H., and Yoshimura, K.: The isotopic composition of precipitation from a winter storm – a case study with the limited-area model COSMOiso, Atmos. Chem. Phys., 12, 1629–1648, https://doi.org/10.5194/acp-12-1629-2012, 2012.
Rambo, J., Lai, C.-T., Farlin, J., Schroeder, M., and Bible, K.: On-site calibration for high precision measurements of water vapor isotope ratios using off-axis cavity-enhanced absorption spectroscopy, J. Atmos. Ocean. Technol., 28, 1448–1457, https://doi.org/10.1175/jtech-d-11-00053.1, 2011.
Risi, C., Bony, S., and Vimeux, F.: Influence of convective processes on the isotopic composition (δ18O and δD) of precipitation and water vapor in the tropics: 2. Physical interpretation of the amount effect, J. Geophys. Res.-Atmos., 113, D19306, https://doi.org/10.1029/2008jd009943, 2008.
Romps, D. M.: Exact expression for the lifting condensation level, J. Atmos. Sci., 74, 3891–3900, https://doi.org/10.1175/jas-d-17-0102.1, 2017.
Roque-Malo, S. and Kumar, P.: Patterns of change in high frequency precipitation variability over North America, Sci. Rep., 7, 10853, https://doi.org/10.1038/s41598-017-10827-8, 2017.
Salmon, O. and Welp, L.: Flight Cruise: Indianapolis and Flight Cruise, Washington, DC, available at: https://vapor-isotope.yale.edu, last access: August 21, 2019.
Salmon, O. E., Shepson, P. B., Ren, X., Marquardt Collow, A. B., Miller, M. A., Carlton, A. G., Cambaliza, M. O. L., Heimburger, A., Morgan, K. L., Fuentes, J. D., Stirm, B. H., Grundman, R., and Dickerson, R. R.: Urban emissions of water vapor in winter, J. Geophys. Res.-Atmos., 122, 9467–9484, https://doi.org/10.1002/2016jd026074, 2017.
Salmon, O. E., Welp, L. R., Baldwin, M. E., Hajny, K., Stirm, B. H., and Shepson, P. B.: Vertical profile observations of water vapor deuterium excess in the lower troposphere, Purdue University Research Repository, https://doi.org/10.4231/1MZN-1C18, 2019.
Samuels-Crow, K. E., Galewsky, J., Sharp, Z. D., and Dennis, K. J.: Deuterium excess in subtropical free troposphere water vapor: Continuous measurements from the Chajnantor Plateau, northern Chile, Geophys. Res. Lett., 41, 8652–8659, https://doi.org/10.1002/2014gl062302, 2014.
Schmidt, G. A., Hoffmann, G., Shindell, D. T., and Hu, Y.: Modeling atmospheric stable water isotopes and the potential for constraining cloud processes and stratosphere-troposphere water exchange, J. Geophys. Res.-Atmos., 110, D21314, https://doi.org/10.1029/2005jd005790, 2005.
Sodemann, H., Aemisegger, F., Pfahl, S., Bitter, M., Corsmeier, U., Feuerle, T., Graf, P., Hankers, R., Hsiao, G., Schulz, H., Wieser, A., and Wernli, H.: The stable isotopic composition of water vapour above Corsica during the HyMeX SOP1 campaign: insight into vertical mixing processes from lower-tropospheric survey flights, Atmos. Chem. Phys., 17, 6125–6151, https://doi.org/10.5194/acp-17-6125-2017, 2017.
Steen-Larsen, H. C., Sveinbjörnsdottir, A. E., Peters, A. J., Masson-Delmotte, V., Guishard, M. P., Hsiao, G., Jouzel, J., Noone, D., Warren, J. K., and White, J. W. C.: Climatic controls on water vapor deuterium excess in the marine boundary layer of the North Atlantic based on 500 days of in situ, continuous measurements, Atmos. Chem. Phys., 14, 7741–7756, https://doi.org/10.5194/acp-14-7741-2014, 2014.
Stull, R. B.: An introduction to boundary layer meteorology, Springer Science & Business Media, 1–671, 1988.
Taylor, C. B.: Vertical distribution of deuterium in atmospheric water vapour: problems in application to assess atmospheric condensation models, Tellus B, 36, 67–70, https://doi.org/10.1111/j.1600-0889.1984.tb00053.x, 1984.
Thompson, A. M.: The oxidizing capacity of the earth's atmosphere: probable past and future changes, Science, 256, 1157–1165, https://doi.org/10.1126/science.256.5060.1157, 1992.
Tompkins, A. M.: Organization of tropical convection in low vertical wind shears: the role of cold pools, J. Atmos. Sci., 58, 1650–1672, 2001.
Trapp, R. J., Diffenbaugh, N. S., Brooks, H. E., Baldwin, M. E., Robinson, E. D., and Pal, J. S.: Changes in severe thunderstorm environment frequency during the 21st century caused by anthropogenically enhanced global radiative forcing, P. Natl. Acad. Sci. USA, 104, 19719–19723, https://doi.org/10.1073/pnas.0705494104, 2007.
Trenberth, K. E.: Changes in precipitation with climate change, Clim. Res., 47, 123–138, 2011.
Uemura, R., Matsui, Y., Yoshimura, K., Motoyama, H., and Yoshida, N.: Evidence of deuterium excess in water vapor as an indicator of ocean surface conditions, J. Geophys. Res.-Atmos., 113, D19114, https://doi.org/10.1029/2008JD010209, 2008.
US Census Bureau, Population Division: Annual estimates of the resident population: 1 April 2010 to 1 July 2017, https://www.census.gov/programs-surveys/popest/technical-documentation/methodology.html, last access: 9 March 2018.
Wang, S., Zhang, M., Che, Y., Zhu, X., and Liu, X.: Influence of below-cloud evaporation on deuterium excess in precipitation of arid central Asia and its meteorological controls, J. Hydrometeorol., 17, 1973–1984, https://doi.org/10.1175/jhm-d-15-0203.1, 2016.
Welp, L. R., Lee, X., Griffis, T. J., Wen, X.-F., Xiao, W., Li, S., Sun, X., Hu, Z., Val Martin, M., and Huang, J.: A meta-analysis of water vapor deuterium-excess in the midlatitude atmospheric surface layer, Global Biogeochem. Cy., 26, GB3021, https://doi.org/10.1029/2011gb004246, 2012.
Willett, K. M., Gillett, N. P., Jones, P. D., and Thorne, P. W.: Attribution of observed surface humidity changes to human influence, Nature, 449, 710–712, 2007.
Wood, R.: Stratocumulus clouds, Mon. Weather Rev., 140, 2373–2423, https://doi.org/10.1175/mwr-d-11-00121.1, 2012.
Worden, J., Noone, D., and Bowman, K.: The Tropospheric Emission Spectrometer science team and data contributors: Importance of rain evaporation and 528–532, https://doi.org/10.1038/nature05508, 2007.
Worden, J., Kulawik, S., Frankenberg, C., Payne, V., Bowman, K., Cady-Peirara, K., Wecht, K., Lee, J. E., and Noone, D.: Profiles of CH4, HDO, H2O, and N2O with improved lower tropospheric vertical resolution from Aura TES radiances, Atmos. Meas. Tech., 5, 397–411, https://doi.org/10.5194/amt-5-397-2012, 2012.
Wright, J. S., Sobel, A. H., and Schmidt, G. A.: Influence of condensate evaporation on water vapor and its stable isotopes in a GCM, Geophys. Res. Lett., 36, L12804, https://doi.org/10.1029/2009gl038091, 2009.
Yamaguchi, T. and Feingold, G.: On the size distribution of cloud holes in stratocumulus and their relationship to cloud-top entrainment, Geophys. Res. Lett., 40, 2450–2454, https://doi.org/10.1002/grl.50442, 2013.


