the Creative Commons Attribution 4.0 License.
the Creative Commons Attribution 4.0 License.
 | 12 Sep 2019
Rapid transition in winter aerosol composition in Beijing from 2014 to 2017: response to clean air actions
Haiyan Li
Jing Cheng
Qiang Zhang
Yuxuan Zhang
Guangjie Zheng
Kebin He
The clean air actions implemented by the Chinese government in 2013 have led to significantly improved air quality in Beijing. In this work, we combined the in situ measurements of the chemical components of submicron particles (PM1) in Beijing during the winters of 2014 and 2017 and a regional chemical transport model to investigate the impact of clean air actions on aerosol chemistry and quantify the relative contributions of anthropogenic emissions, meteorological conditions, and regional transport to the changes in aerosol chemical composition from 2014 to 2017. We found that the average PM1 concentration in winter in Beijing decreased by 49.5 % from 2014 to 2017 (from 66.2 to 33.4 µg m−3). Sulfate exhibited a much larger decline than nitrate and ammonium, which led to a rapid transition from sulfate-driven to nitrate-driven aerosol pollution during the wintertime. Organic aerosol (OA), especially coal combustion OA, and black carbon also showed large decreasing rates, indicating the effective emission control of coal combustion and biomass burning. The decreased sulfate contribution and increased nitrate fraction were highly consistent with the much faster emission reductions in sulfur dioxide (SO2) due to phasing out coal in Beijing compared to reduction in nitrogen oxides emissions estimated by bottom-up inventory. The chemical transport model simulations with these emission estimates reproduced the relative changes in aerosol composition and suggested that the reduced emissions in Beijing and its surrounding regions played a dominant role. The variations in meteorological conditions and regional transport contributed much less to the changes in aerosol concentration and its chemical composition during 2014–2017 compared to the decreasing emissions. Finally, we speculated that changes in precursor emissions possibly altered the aerosol formation mechanisms based on ambient observations. The observed explosive growth of sulfate at a relative humidity (RH) greater than 50 % in 2014 was delayed to a higher RH of 70 % in 2017, which was likely caused by the suppressed sulfate formation through heterogeneous reactions due to the decrease in SO2 emissions. Thermodynamic simulations showed that the decreased sulfate and nitrate concentrations have lowered the aerosol water content, particle acidity, and ammonium particle fraction. The results in this study demonstrate the response of aerosol chemistry to the stringent clean air actions and identify that the anthropogenic emission reductions are a major driver, which could help to further guide air pollution control strategies in China.
- Article
(961 KB) - Full-text XML
-
Supplement
(4582 KB) - BibTeX
- EndNote


Beijing, the capital of China, is one of the most heavily polluted cities in the world (Lelieveld et al., 2015), and it frequently experiences severe and persistent haze pollution episodes in winter (Guo et al., 2014). For example, in January 2013, the daily concentration of ambient particles with an aerodynamic diameter less than 2.5 µm (PM2.5) reached a record high of 569 µg m−3 in Beijing (Ferreri et al., 2018), which was over 20 times higher than the World Health Organization standard (25 µg m−3 for daily average PM2.5). As a complex mixture of many different components, ambient aerosols have a range of chemical compositions and originate from various emission sources and formation processes in the atmosphere (Seinfeld and Pandis, 2012). The adverse effects of aerosols on visibility (Pui et al., 2014), climate (IPCC, 2013), and human health (Pope et al., 2009) are intrinsically related to the chemical composition of particles.
To tackle severe aerosol pollution, the Chinese State Council implemented the Air Pollution Prevention and Control Action Plan (denoted as clean air actions) in September 2013, which is the most stringent pollution mitigation policy ever in China. As a consequence, China's anthropogenic emissions have declined by 59 % for SO2, 21 % for NOx, 32 % for organic carbon (OC), and 28 % for black carbon (BC) during 2013–2017 (Zheng et al., 2018). The annual average PM2.5 concentration in Beijing decreased by 35.6 % from 2013 to 2017, reaching 58 µg m−3 in 2017. Combining the bottom-up emission inventory and chemical transport model simulations, our recent study (Cheng et al., 2019) quantified the relative contributions of meteorological conditions, emission reductions from surrounding regions, and emission reductions from local sources to the decrease in PM2.5 concentration in Beijing during 2013–2017. While changes in meteorological conditions partially explained air quality improvement in Beijing in 2017, local and regional emission controls played major roles. In addition, the aerosol chemical composition is expected to change correspondingly due to the rapid reductions in precursor emissions, which is not well understood yet because the chemical components of PM2.5 are not measured by China's monitoring network. A few studies have examined the change in aerosol composition in Beijing after 2013, including a semicontinuous measurement of carbonaceous aerosols during 2013–2018 (Ji et al., 2019) and an aerosol mass spectrometry study comparing aerosol composition and size distribution between 2014 and 2016 (Xu et al., 2019). However, neither performed a comprehensive assessment of all the main factors affecting aerosol concentration and its composition. A deep understanding of how the aerosol composition has changed since the clean air actions were activated and the possible linkage between them is urgently needed.
The chemical composition of PM2.5 is mainly affected by the following factors: precursor emissions, meteorological conditions, atmospheric chemical reactions, and regional transport and deposition. Emissions are typically the main driver of aerosol composition changes. During 2005–2012, the sulfate concentration in China decreased, while the nitrate concentration increased, which was caused by the considerable reduction in SO2 emissions but limited control of NOx (Geng et al., 2017). Based on the measurements of organic aerosol (OA) composition in Beijing, a larger decrease in secondary OA than primary OA was found during the 2014 Asia-Pacific Economic Cooperation summit due to the strict emission controls (Y. L. Sun et al., 2016). Meteorological conditions affect aerosol composition by changing emissions, chemical reactions, and transport and deposition processes (Mu and Liao, 2014). For example, increases in relative humidity (RH) enhance the secondary formation of sulfate through heterogeneous reactions (B. Zheng et al., 2015; Cheng et al., 2016), and decreases in temperature favor particulate nitrate formation by facilitating gas-to-particle partitioning (Pye et al., 2009; Li et al., 2018). With chemical transport model simulations in China for the years 2004–2012, Mu and Liao (2014) demonstrated that due to the large variations in meteorological parameters in northern China, all aerosol species showed large corresponding interannual variations. Furthermore, aerosol characteristics in Beijing are influenced by regional transport from adjacent polluted regions. Polluted air masses from the southern regions contributed more secondary inorganic aerosols (SIAs) than primary aerosols in Beijing (Zhang et al., 2014; Du et al., 2019).
Following our previous work (Cheng et al., 2019), the main objective of this study is to investigate the impact of clean air actions on changes in aerosol chemical composition from 2014 to 2017. With both in situ observations of aerosol species in Beijing during the winters of 2014 and 2017 and model simulations for the corresponding periods, this work provides the opportunity for a detailed evaluation of the underlying drivers. First, changes in aerosol characteristics are illustrated for inorganics and organics by comparing aerosol measurements in 2014 and 2017. Then, the relative importance of different factors in varying aerosol composition is assessed by combining direct observations and model simulations, including synoptic conditions, emission changes, regional transport, and formation mechanisms. Last, we show that the transition in aerosol characteristics influenced particle properties, such as aerosol water content (AWC) and particle acidity, which in turn affects secondary aerosol formation.
2.1 Ambient sampling and instrumentation
Online aerosol measurements were performed in urban Beijing during the winters of 2014 (from 6 December 2014 to 27 February 2015) and 2017 (from 11 December 2017 to 2 February 2018). The sampling site is located on the roof of a three-story building on the campus of Tsinghua University (40.0∘ N, 116.3∘ E), which is surrounded by school and residential areas. No major industrial sources are situated nearby. An Aerodyne aerosol chemical speciation monitor (ACSM) was deployed for the real-time chemical observations of nonrefractory PM1 (NR-PM1), including organics, sulfate, nitrate, ammonium, and chloride. A detailed description of the instrument can be found in Ng et al. (2011a). The mass concentration of BC in PM1 was measured using a multiangle absorption photometer (MAAP, model 5012; Petzold and Schönlinner, 2004). In addition, the total PM2.5 mass was simultaneously recorded with a PM-712 monitor based on the β-ray absorption method (Kimoto Electric Co., Ltd., Japan). For gaseous species, the mixing ratios of SO2, NOx, CO, and O3 were monitored by a suite of commercial gas analyzers (Thermo Scientific). The meteorological parameters, including temperature, RH, wind speed (WS), and wind direction (WD), were obtained from an automatic meteorological observation instrument (MILOS520, Vaisala Inc., Finland).
2.2 ACSM data analysis
The ACSM data were analyzed using the standard analysis software within Igor Pro (WaveMetrics, Inc., Oregon USA). Default relative ionization efficiencies (RIEs) were applied to organics (1.4), nitrate (1.1), and chloride (1.3), while the RIEs of ammonium and sulfate were experimentally determined through calibrations with pure ammonium nitrate and ammonium sulfate, respectively. A composition-dependent collection efficiency (CE) algorithm was used to account for the incomplete detection of aerosol particles (Middlebrook et al., 2012). As shown in Fig. S1 in the Supplement, the total measured PM1 mass (NR-PM1 plus BC) correlated well with the PM2.5 obtained from PM-712 (r2=0.80 and 0.87 for 2014 and 2017, respectively). On average, PM1 accounted for 68 % and 80 % of the total PM2.5 in Beijing during the winters of 2014 and 2017.
The ACSM provides unit-mass-resolution mass spectra of submicron particles, facilitating source apportionment via factor analysis. In this study, positive matrix factorization (PMF) was implemented to resolve OA into various sources using a multilinear engine (ME-2; Paatero, 1999) via the SoFi toolkit (Source Finder; Canonaco et al., 2013). The so-called a value approach allows for the introduction of a priori factor profile or time series to reduce the rotational ambiguity and obtain a unique solution. The spectra and error matrices of organics were pretreated based on the procedures given by Ulbrich et al. (2009) and Zhang et al. (2011). Ions larger than m∕z 120 were not considered in this study given the interferences of the internal standard of naphthalene at m∕z 127–129, the low signal-to-noise ratio of larger ions, and their low contributions to OA loading. For the winter of 2014, a reference hydrocarbon-like OA (HOA) profile from Ng et al. (2011b) was introduced into the ME-2 analysis to constrain the model performance, varying a values from 0 to 1. Following the guidelines by Canonaco et al. (2013) and Crippa et al. (2014), an optimal solution with four factors was finally accepted, with an a value of 0. Detailed evaluation of the factor time series, mass spectra, and diurnal patterns with different a values can be found in the Supplement (Figs. S2–S10). Figure S11 shows the source apportionment results with three primary factors, i.e., HOA, coal combustion OA (CCOA), and biomass burning OA (BBOA), and one secondary factor, i.e., oxygenated OA (OOA). For the 2017 dataset, the mass spectral profiles of HOA, CCOA, and BBOA from the ME-2 analysis of 2014 were adopted to constrain the model performance. Similarly, a four-factor solution with HOA, BBOA, CCOA, and OOA was selected for the winter of 2017, which allowed a better comparison of the OA sources between 2014 and 2017.
2.3 WRF-CMAQ model
The Weather Research and Forecasting (WRF) model, version 3.8, and the Community Multiscale Air Quality (CMAQ) model, version 5.1, were applied to evaluate the impact of meteorological changes, regional transport, and emission variations on the PM2.5 concentration in Beijing in winter. The simulated area was designed as three nested domains, and the innermost area covered Beijing and its surrounding regions (including Tianjin, Hebei, Shanxi, Henan, Shandong, and Inner Mongolia), with a horizontal resolution of 4 km × 4 km. The simulated period basically followed the observation time, which covered December 2014–February 2015 and December 2017–February 2018. A 1-month spin-up was applied in each simulation.
The WRF model is driven by the National Centers for Environmental Prediction Final Analysis (NCEP-FNL) reanalysis data, which then provided the meteorological fields for the CMAQ model. We used CB05 and AERO6 as the gas and particulate matter chemical mechanisms, respectively. The in-line windblown dust and photolytic rate calculation modules were also adopted to improve the simulation. The chemical initial and boundary conditions originated from the interpolated outputs of the Goddard Earth Observing System with chemistry (GEOS-Chem) model (Bey et al., 2001).
The anthropogenic emission inventory for Beijing was taken from the Beijing Municipal Environmental Monitoring Center (BMEMC), which was documented and analyzed in Cheng et al. (2019), while the emission inventory outside Beijing was provided by the Multi-resolution Emission Inventory for China (MEIC) (http://www.meicmodel.org, last access: 4 September 2019; Zheng et al., 2018) and the MIX emission inventory for the other Asian countries (M. Li et al., 2017). The biogenic emissions were obtained by the Model of Emission of Gases and Aerosols from Nature (MEGAN v2.1); however, open biomass burning was not considered in this work. Detailed model configurations and validations can be found in Cheng et al. (2019), and the simulated results well reproduced the temporal and spatial distributions and variations in PM2.5 in Beijing and its surrounding areas. In this study, we evaluated the model performance by comparing the simulated PM2.5 concentrations and compositions in Beijing with observation data. The hourly observed PM2.5 concentrations were collected from the Beijing Municipal Environmental Protection Bureau; the observed PM2.5 compositions came from the Surface PARTiculate mAtter Network (SPARTAN, https://www.spartan-network.org/, last access: 4 September 2019). We also compared the simulated PM2.5 compositions with the observed PM1 species from this work. The average simulated PM2.5 in Beijing decreased from 91.5 (winter of 2014) to 52.5 (winter of 2017) µg m−3, with a total decrease of 39 µg m−3, while the observed PM2.5 varied from 81.9 to 40.6 µg m−3, decreasing by 41.3 µg m−3. Generally, the simulated and observed PM2.5 (24 h averages) in Beijing agreed well. The time series comparison and detailed monthly descriptive statistics of the observed and CMAQ-simulated PM2.5 concentrations can be found in Fig. S12 and Table S1. For PM2.5 compositions, the Pearson correlation coefficients between simulated PM2.5 and observed PM1 components were all above 0.7 (Table S2a), indicating that the model simulations could well reproduce the species variations. Detailed comparisons of the simulated and observed PM2.5 components are listed in Table S2b.
We designed six simulation cases to investigate the impact of meteorological and emission variations. Two base cases were driven by the actual emission inventory and meteorological conditions in the winter of 2014 (case A) and winter of 2017 (case B). Cases C and D were designed to quantify the impact of meteorological changes; case C was simulated with the emissions in 2014 and meteorological conditions of 2017, while case D used the 2017 emissions and 2014 meteorological conditions. Therefore, the differences between A and C or between B and D show the influence of meteorological conditions, and the differences between A and D or between B and C correspond to the contributions of emission variations. We used the averaged differences as the final impacts. Cases E and F were developed to evaluate the effect of regional transport on PM2.5 variations in Beijing in the winter of 2014 (E) and winter of 2017 (F). In these two cases, the emissions in Beijing were set to zero, while the regional emissions remained at the actual level. The balances between A and E or between B and F represent the contributions of regional transport to the PM2.5 concentration in Beijing during the corresponding periods.
2.4 Clustering analysis of back trajectories
The Hybrid Single Particle Lagrangian Integrated Trajectory (HYSPLIT) model was conducted to calculate the back trajectories of air masses arriving in Beijing during the observation periods in 2014 and 2017. The meteorological input was downloaded from the National Oceanographic and Atmospheric Administration (NOAA) Air Resource Laboratory Archived Global Data Assimilation System (GDAS) (ftp://arlftp.arlhq.noaa.gov/pub/archives/, last access: 4 September 2019). Each trajectory was run for 3 d with a time resolution of 1 h, and the initialized height was 100 m above ground level. In total, 2108 and 1292 trajectories were obtained for the winters of 2014 and 2017, respectively. Based on the built-in clustering calculation, the trajectories were then classified into different groups to represent the main airflows influencing the receptor site. Finally, the optimal five-cluster and seven-cluster solutions were adopted for the winters of 2014 and 2017, respectively. Details are shown in Fig. S13.
2.5 ISORROPIA-II equilibrium calculation
The ISORROPIA-II thermodynamic model was used to investigate the effects of particle chemical composition on aerosol properties, i.e., particle pH, AWC, and the partitioning of semivolatile species (Fountoukis and Nenes, 2007). The model computes the equilibrium state of an ---Cl−-Na+-Ca2+-K+-Mg2+-H2O inorganic aerosol system with its corresponding gases (Fountoukis and Nenes, 2007). When running the ISORROPIA-II model, it is assumed that aerosols are internally mixed and composed of a single aqueous phase. The validity of these assumptions has been evaluated by a number of studies in various locations (Guo et al., 2015; Weber et al., 2016; Liu et al., 2017; Li et al., 2018).
The model was run in the forward mode by assuming that aerosol solutions were metastable. The forward mode calculates the gas–particle equilibrium partitioning with the total concentrations of both gas and particle phase species. Compared to the reverse mode using only aerosol-phase compositions, calculations with the forward mode are affected much less by the measurement errors (Hennigan et al., 2015; Guo et al., 2017a; Song et al., 2018). Particle water associated with OA was not considered in this study given its minor effects. Liu et al. (2017) showed that organic matter (OM)-induced particle water accounted for only 5 % of the total AWC in Beijing. Up to now, there are no observational data showing whether aerosols are in a metastable (only liquid) or stable (solid plus liquid) state in Beijing in winter (Song et al., 2018). According to previous studies, at low RH (RH < 20 % or 30 %), aerosols are less likely to be in a completely liquid state (Fountoukis and Nenes, 2007; Guo et al., 2016, 2017a). Therefore, periods with RH < 30 % were excluded in this study. The effects of nonvolatile cations (i.e., Na+, K+, Ca2+, Mg2+) are not considered in this study because the fraction of nonvolatile cations in PM1 in Beijing is generally negligible compared to , , and (Sun et al., 2014). Although nonvolatile nitrate may exist in ambient particles as Ca(NO3)2 and Mg(NO3)2, Ca2+ and Mg2+ are mainly abundant at sizes above 1 µm (Zhao et al., 2017). In addition, the mixing state of PM1 nonvolatile cations with , , and remains to be investigated (Guo et al., 2016, 2017a). Previous studies showed that including the nonvolatile cations in ISORROPIA-II does not significantly affect the pH calculations unless the cations become important relative to anions (Guo et al., 2016; Song et al., 2018). The sensitivity test for Beijing winter conditions suggested that with nonvolatile cations, the predicted pH values increase by about 0.1 units.
In this study, the transition in aerosol composition was mainly reflected in the variations in nitrate and sulfate concentrations. For the sensitivity analysis of aerosol properties to particle composition, a selected sulfate concentration combined with the average temperature, RH, and total ammonia concentration (NH3 + ) during the winters of 2014 and 2017 was input into the ISORROPIA-II model, where the total nitrate concentration (HNO3 + ) was left as the free variable. The gaseous HNO3 and NH3 concentrations were not directly measured during our campaign. But long-term measurements in Beijing showed that gaseous NH3 concentration correlated well with NOx concentration in winter (Meng et al., 2011). Therefore, the empirical equation derived from Meng et al. (2011), NH3 (ppb) = 0.34 × NOx (ppb) + 0.63, was applied to estimate the gaseous NH3 concentration. On average, the NH3 concentration was approximated to be 14.0 µg m−3 during the winters of 2014 and 2017, consistent with previous observations in the same season of Beijing (Meng et al., 2011; Zhao et al., 2016; Zhang et al., 2018). The total nitrate concentration, including both gaseous HNO3 and particulate nitrate, varied from 0.2 to 75 µg m−3 for the sensitivity study.
3.1 Overall variations in aerosol characteristics from 2014 to 2017
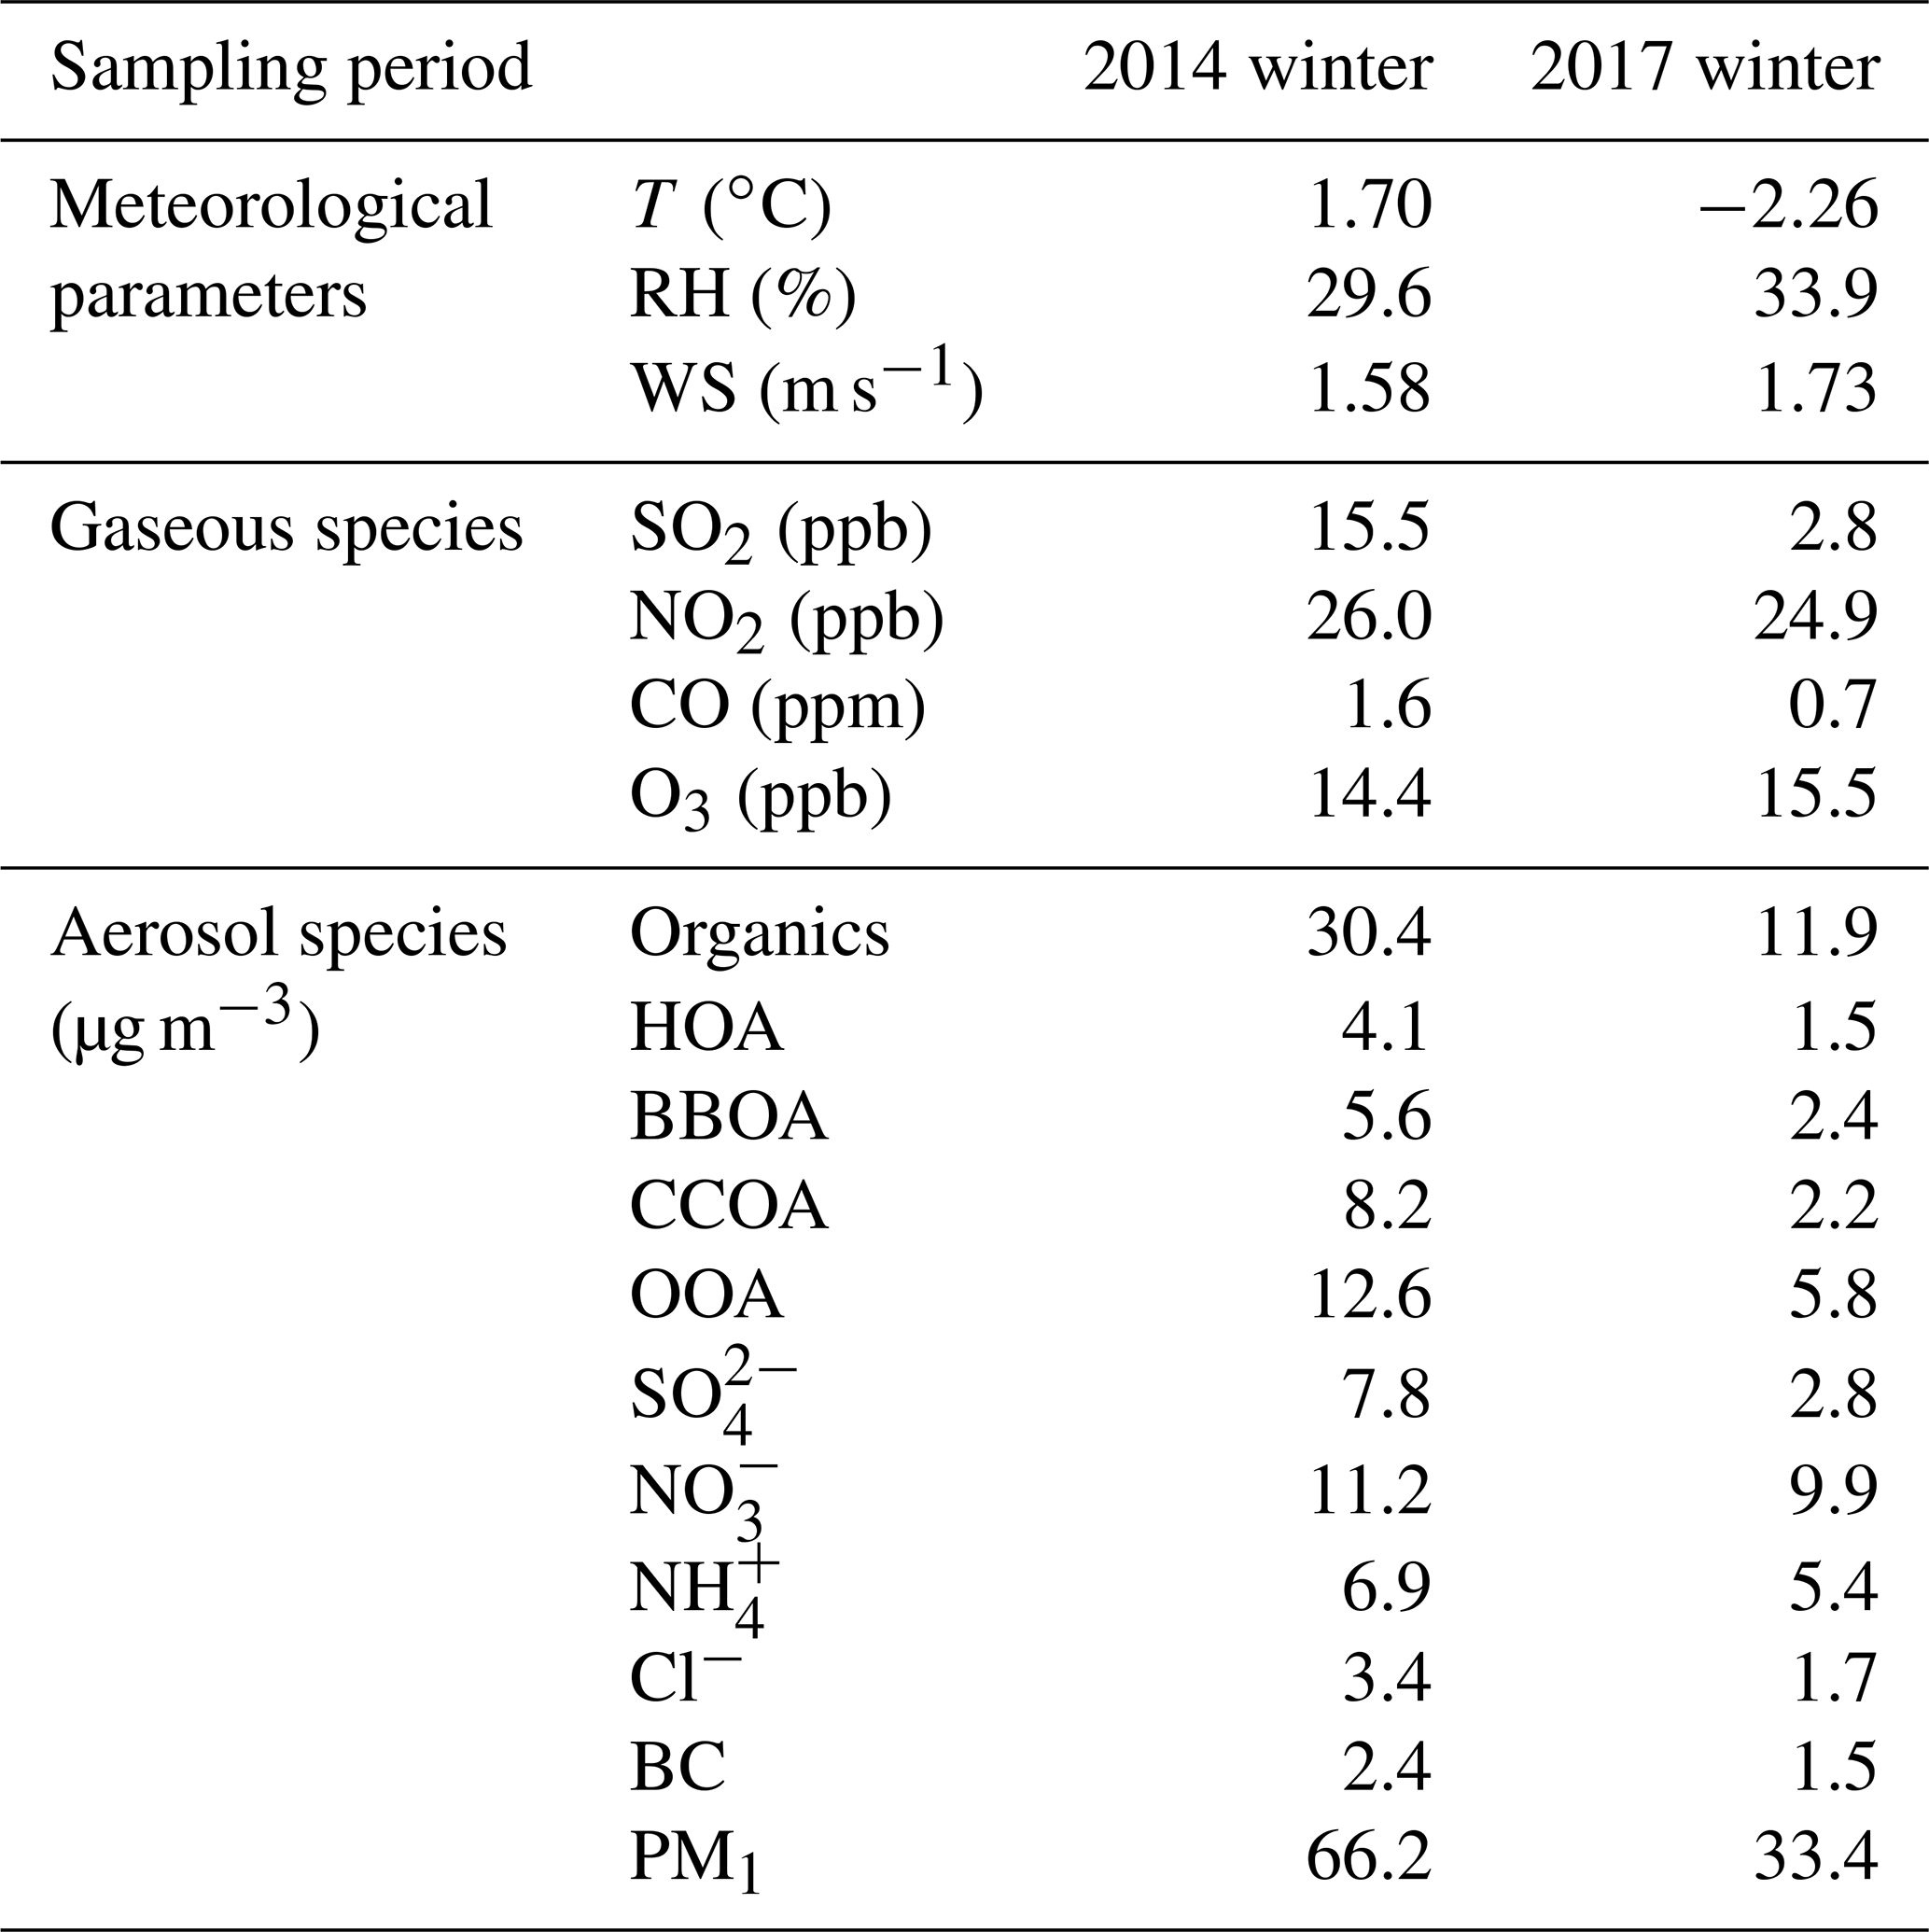
Figures S14 and S15 display the temporal variations in meteorological parameters, trace gases, and aerosol species during the two winter campaigns, with the average values shown in Table 1. Compared to the frequently occurring haze episodes in the winter of 2014, more clean days with lower PM1 concentrations were observed in the winter of 2017. On average, the PM1 concentrations were 66.2 and 33.4 µg m−3 during the winters of 2014 and 2017, respectively. The large reduction in PM1 concentration reflects the effectiveness of pollution abatement strategies. Satellite-derived estimates also showed an evident decrease in PM2.5 concentration in northern China in recent years (Gui et al., 2019).
Table 1Summary of the average meteorological parameters, mixing ratios of gaseous species, and mass concentrations of the PM1 chemical components observed during the winters of 2014 and 2017.
3.1.1 Changes in SIA characteristics
Sulfate, nitrate, and ammonium are the dominant components in SIAs and are generally recognized as ammonium sulfate and ammonium nitrate in PM2.5. With the implementation of clean air actions, sulfate underwent the largest decline in the mass concentration among all SIA species (from 7.7 to 2.8 µg m−3 during 2014–2017). The decreases in particulate nitrate and ammonium during this period were 1.3 and 1.5 µg m−3, respectively. Different changes in the mass concentration of SIA species led to variations in the PM1 chemical composition. As illustrated in Fig. 1, nitrate exhibited an increasing mass fraction in PM1 from 18 % to 30 %, whereas the mass contribution of sulfate decreased from 12 % to 8 %. Correspondingly, the mass ratio of nitrate to sulfate increased from 1.4 in 2014 to 3.5 in 2017. Based on the measurements in Beijing from November to December, Xu et al. (2019) also observed a higher nitrate to sulfate ratio in 2016 (1.36) than in 2014 (0.72). Similar annual variations in aerosol chemical composition were found in North America over 2000–2016 with an increased proportion of nitrate and a decreased contribution of sulfate (van Donkelaar et al., 2019). The diurnal cycles of SIAs are displayed in Fig. 2. All SIA species showed similar diel trends in the two winters with increasing concentrations after noon due to enhanced photochemical processes and peak concentrations at night caused by a lower boundary layer height. The CO-scaled diurnal plots for SIA species are shown in Fig. S16 to eliminate the influence of different dilution and/or mixing conditions. However, the absolute variations in the SIA mass concentration differed greatly between 2014 and 2017. While the mass concentration of sulfate decreased by a factor of 2–3 in 2017, nitrate and ammonium showed much smaller reductions of 15 %–40 % in their mass concentrations throughout the day.
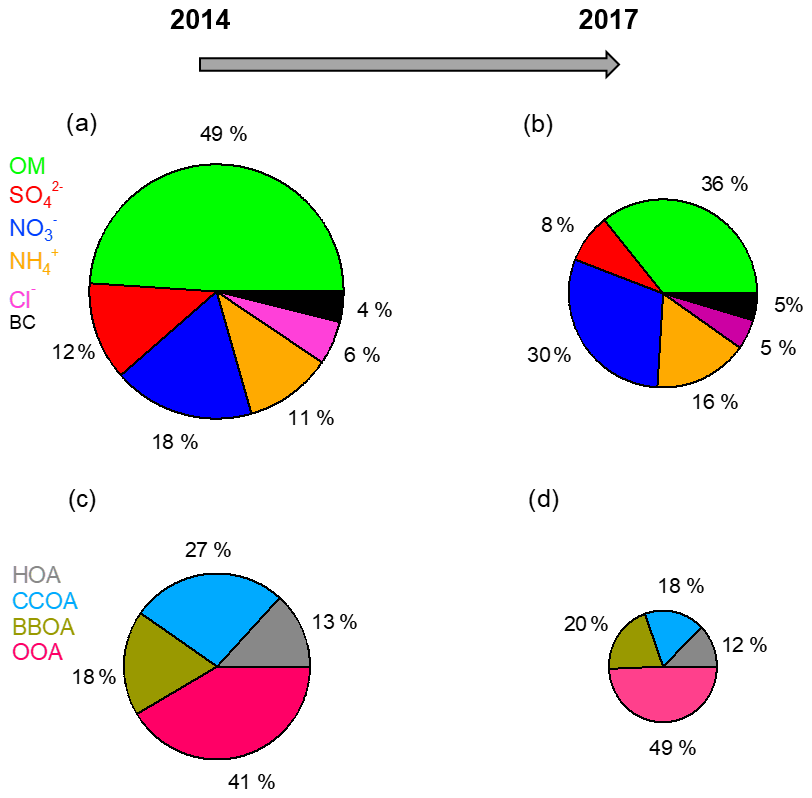
Figure 1Average chemical compositions of PM1 and OA in (a, c) winter of 2014 and (b, d) winter of 2017. The decreases in the mass concentrations of different components from 2014 to 2017 are as follows: 60.9 % for organics, 64.1 % for sulfate, 11.6 % for nitrate, 21.7 % for ammonium, 50.0 % for chloride, and 37.5 % for BC.
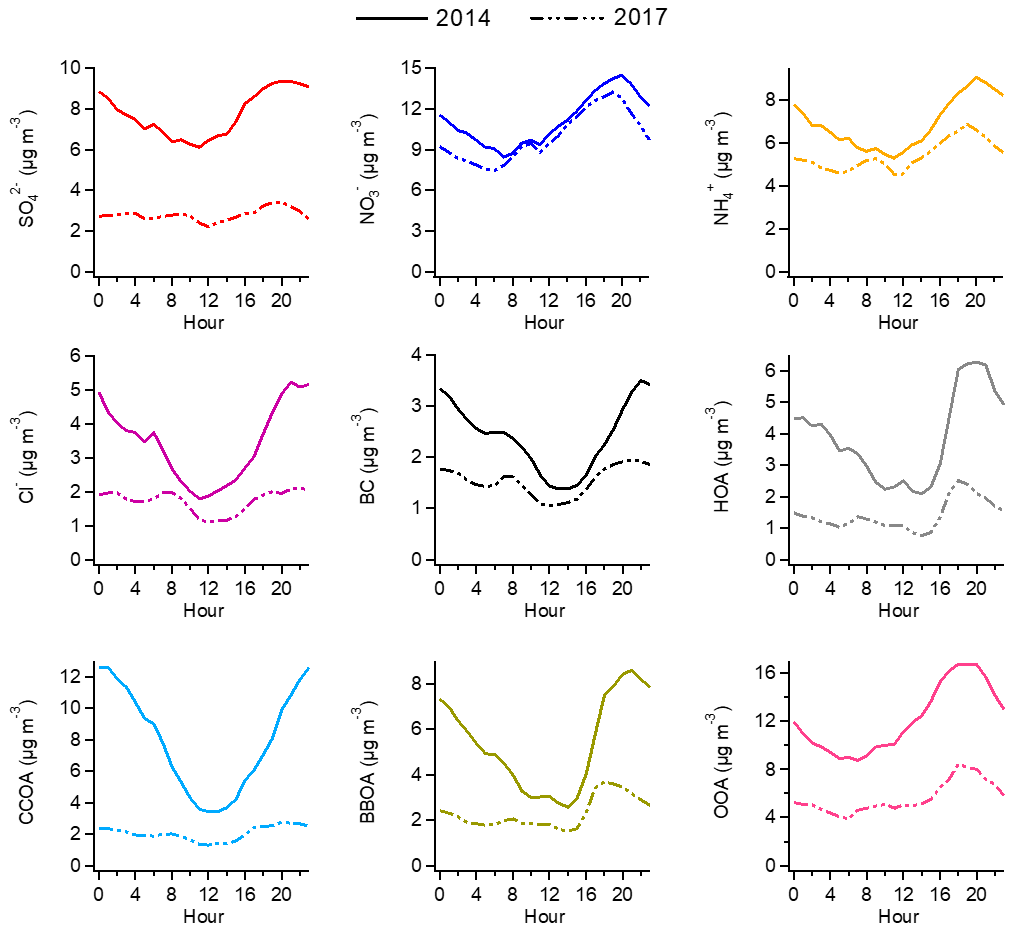
Figure 2Average diurnal cycles of different aerosol species in the winter of 2014 (solid line) and winter of 2017 (dashed line).
Previous studies have concluded that the dramatically enhanced contribution of sulfate was a main driving factor of winter haze pollution in China (Wang et al., 2014, 2016; H. Li et al., 2017). However, with the emission mitigation efforts, the role of SIA species in aerosol pollution changed significantly. Aerosol pollution was classified into three categories in this study: clean (PM1 ≤ 35 µg m−3), slightly polluted (35 < PM1 ≤ 115 µg m−3), and polluted (PM1 > 115 µg m−3). The contributions of different pollution levels and the PM1 chemical compositions at each pollution level are shown in Fig. 3 for the winters of 2014 and 2017. While the polluted level accounted for 38 % of the observation period in the winter of 2014, only 14 % of the observation period was recognized as being polluted in the winter of 2017. In 2014, the mass fraction of sulfate in PM1 was 16.1 % during clean periods. With the increase in pollution level, the contribution of sulfate increased from 10.6 % in slightly polluted periods to 13.6 % in polluted periods, while the mass fraction of nitrate decreased. In contrast, sulfate comprised a smaller fraction of haze development in 2017 compared to 2014. It was nitrate that exhibited a substantially increased mass fraction at higher PM1 loadings in the winter of 2017. From clean to polluted periods, the nitrate contribution to PM1 increased from 22.6 % to 34.9 %. These results demonstrate that aerosol pollution in Beijing has gradually changed from sulfate-driven to nitrate-driven in recent years.
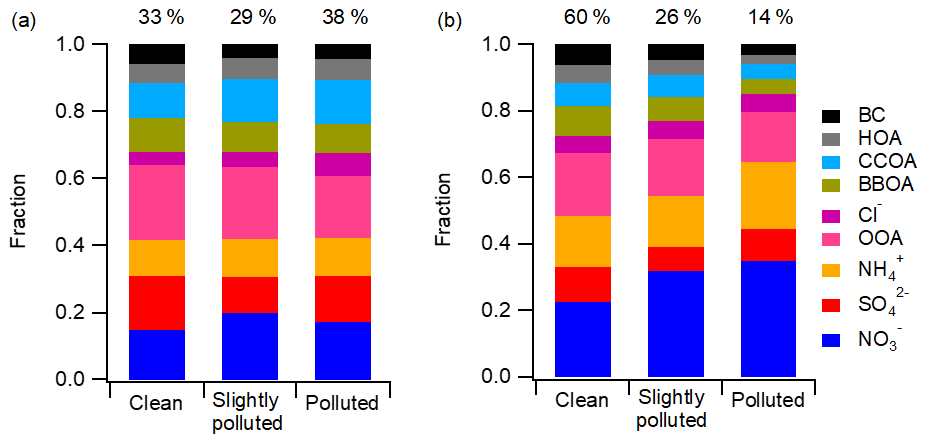
Figure 3Aerosol chemical composition at different pollution levels in the (a) winter of 2014 and (b) winter of 2017. The contributions of each pollution level are shown at the top of each bar.
3.1.2 Changes in OA characteristics
In response to the strict emission controls, the mass concentration of organics declined by ∼18.5 µg m−3 from 2014 (30.4 µg m−3) to 2017 (11.9 µg m−3), which was mainly caused by OOA (∼6.8 µg m−3) and CCOA (∼6.0 µg m−3). The decrease in the mass concentration of HOA was 2.6 µg m−3, which was associated with the strengthened controls on vehicle emissions. BBOA decreased by 3.2 µg m−3 because the use of traditional biofuels, such as wood and crop residuals, was forbidden in Beijing by the end of 2016. Generally, the concentrations of all OA factors declined substantially throughout the day in 2017. For primary factors, the reductions in their mass concentrations were much higher at night than during the day (Fig. 2). Compared to 2014, CCOA decreased by a factor of 4–5 at night in 2017 and a factor of 1.5 during the day.
Overall, the mass fraction of organics in PM1 declined from 49 % to 36 % over the period (Fig. 1). The source apportionment results demonstrated that coal combustion was largely accountable for the reduced contribution of organics. During 2014–2017, the mass fraction of CCOA in the total OA decreased from 27 % to 18 %. Reports from the Beijing Municipal Environmental Protection Bureau (MEPB) also revealed that the contribution of coal combustion to aerosol pollution showed a large decrease during 2013–2017. The decline in CCOA was largely driven by the reduced emissions of organics from coal combustion with the implementation of clean air actions. In contrast, the mass contribution of OOA in the total OA increased from 41 % to 49 % during 2014–2017. OOA is formed in the atmosphere through various oxidation reactions of volatile organic compounds (VOCs). From 2013 to 2017, VOC emissions decreased by approximately half in Beijing but remained constant in the surrounding regions. Large amounts of OOA brought to Beijing via regional transport weakened the efforts of local emission cuts. Therefore, stronger emission controls of VOCs need to be implemented in both local Beijing and adjacent areas in the future.
3.2 Factors affecting aerosol characteristics from 2014 to 2017
3.2.1 Meteorological conditions
To evaluate the influence of weather conditions on air quality improvement, we compared the daily changes in meteorological parameters during the winters of 2014 and 2017 (Fig. S17). Compared to 2014, the temperature in 2017 was slightly lower throughout the whole day, which may have facilitated gas–particle conversion for semivolatile species, such as ammonium nitrate. Although the RH was similar between 2014 and 2017 during the daytime, the nighttime RH in 2017 was slightly higher than that in 2014, which was favorable for the heterogeneous reactions of secondary species. On average, the observed RH was 29.6 % in the winter of 2014 and 33.9 % in the winter of 2017. Diurnal cycles of WS showed that the WS in winter of 2017 was somewhat higher, implying beneficial conditions for the dispersal of air pollutants. To illustrate the variations in WD, the observed data were classified into four groups: from north to east (N–E; 0∘ ≤ WD < 90∘), east to south (E–S; 90∘ ≤ WD < 180∘), south to west (S–W; 180∘ ≤ WD < 270∘), and west to north (W–N; 270∘ ≤ WD ≤ 360∘). As displayed in Fig. S17d, the winters of 2014 and 2017 were both dominated by the W–N and N–E groups, which usually bring clean air masses. After noon, the contribution of winds from S–W started to increase. According to previous studies, southerly winds arriving in Beijing generally carry higher levels of air pollutants from the southern regions (Sun et al., 2006; Zhao et al., 2009).
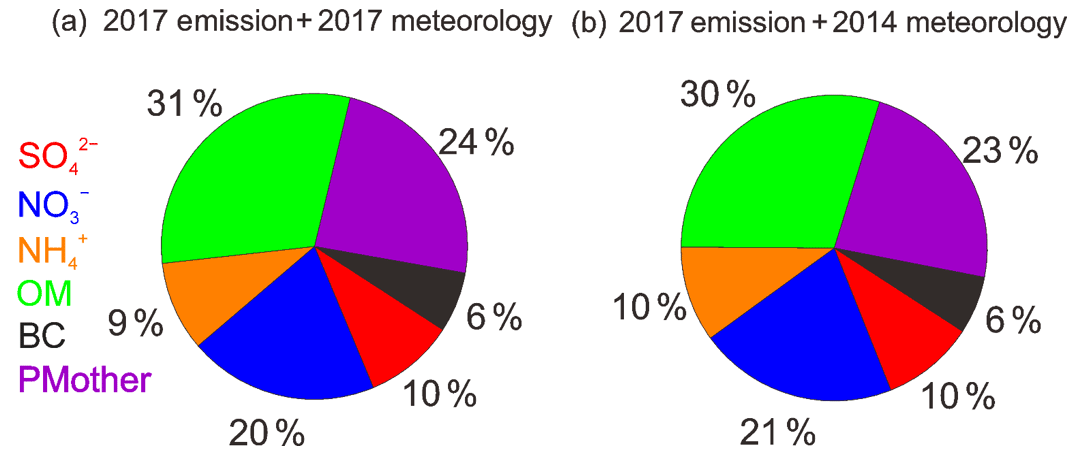
Figure 4The average PM2.5 chemical composition simulated by the WRF-CMAQ model for the observation periods in 2017: (a) base scenario with the 2017 emissions and the 2017 meteorological conditions; (b) simulation with the 2017 emissions and 2014 meteorological conditions.
Simulations with the WRF-CMAQ model helped to assess the relative importance of meteorology for changes in aerosol concentration and chemical composition. The effects of meteorology were quantified by comparing cases A and C or cases B and D. The differences between A and D or B and C reflected the effectiveness of emission controls. For the total PM2.5 concentration, the simulation results clearly demonstrated that variations in meteorology from 2014 to 2017 had a much lower influence on the PM2.5 reduction than the changes in air pollutant emissions (Fig. S18). On average, changes in weather conditions resulted in a PM2.5 decrease of 9.6 µg m−3, which explained 24.8 % of the total PM2.5 reduction. These results suggest that meteorological variations are far from sufficient to explain PM2.5 abatement during 2014–2017. In terms of aerosol composition, we compared the simulated results of cases B and D and found that meteorological changes from 2014 to 2017 had a negligible influence on the chemical composition of PM2.5 (Fig. 4). Therefore, we conclude that weather conditions in 2017 marginally favored air quality improvement in Beijing, and emission reductions in air pollutants played a dominant role in the variations in aerosol concentration and composition.
3.2.2 Emission changes
According to both the observations (Fig. 1) and simulation results (Fig. 5a), sulfate and organics experienced the largest decreases among different components in Beijing from 2014 to 2017, which is consistent with the considerable emission reductions in SO2 and primary OC in local Beijing and its surrounding regions (Fig. 6; i.e., Tianjin, Hebei, Shandong, Henan, Shanxi, and Inner Mongolia). Comparatively, the wintertime nitrate concentration showed the lowest reduction during 2014–2017, which was expected from the smaller emission cut of NOx in Beijing and its surrounding areas.
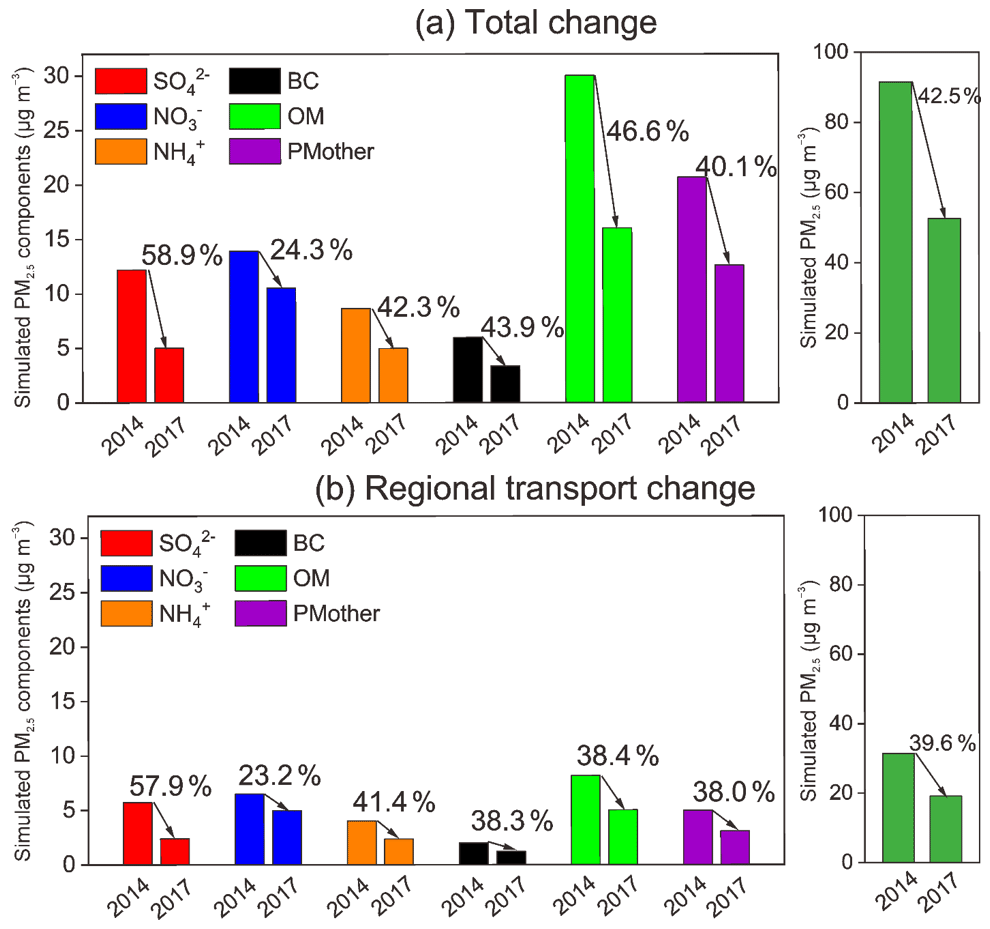
Figure 5Simulated concentrations of PM2.5 and its chemical components during the observation periods of 2014 and 2017: (a) total changes in Beijing and (b) changes due to regional transport.
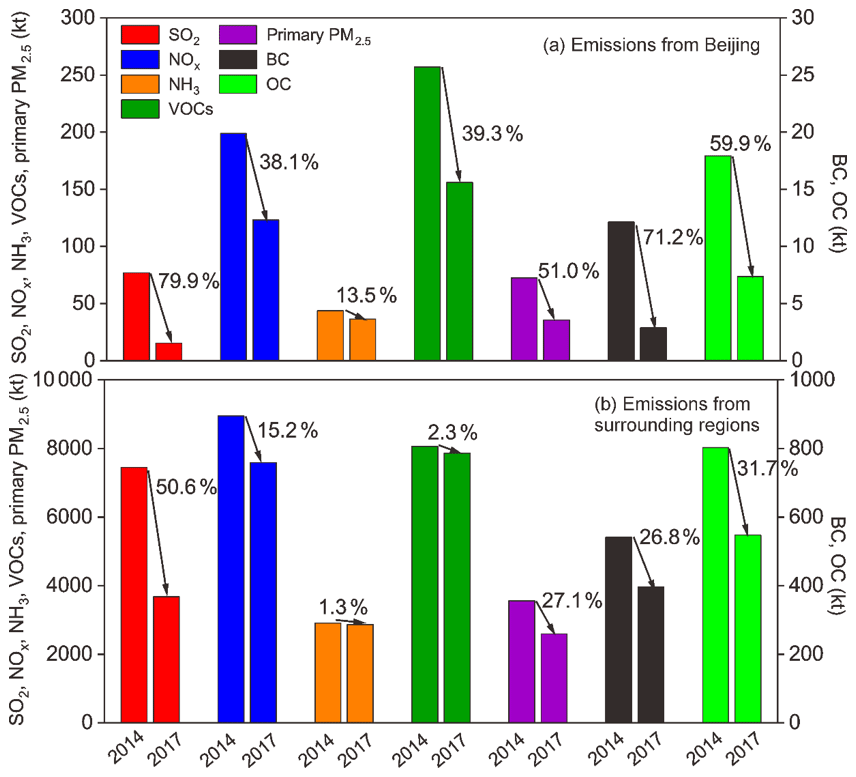
Figure 6Changes in the anthropogenic emissions of SO2, NOx, NH3, VOCs, primary PM2.5, BC, and OC in (a) Beijing and (b) its surrounding regions from 2014 to 2017.
Based on the bottom-up emission inventories (Zheng et al., 2018; Cheng et al., 2019), SO2 emissions decreased by 79.9 % in Beijing during 2014–2017, mainly due to the effective control of coal combustion sources and the optimization of the energy structure. By the end of 2017, all coal-fired power units were shut down and small coal-fired boilers with capacities of < 7 MW were eliminated in Beijing, which reduced coal use by more than 17×106 t. In addition, most of the clustered and highly polluted enterprises and factories were phased out during this period. These control measures remarkably reduced SO2 emissions from the power and industry sectors. Enhanced energy restructuring was also implemented in the residential sector. During 2013–2017, more than 2×10⁶ t of residential coal was replaced by cleaner natural gas and electricity, involving 900 000 households in Beijing. Apart from coal burning, the use of traditional biomass, such as wood and crops, was thoroughly forbidden in Beijing by the end of 2016. The strict governance of residential fuel also made substantial contributions to the BC and OC emission reductions in Beijing, which decreased by 71.2 % and 59.9 %, respectively, during 2014–2017. In comparison, NOx showed a lower emission reduction of 38.1 % from 2014 to 2017 in Beijing. The decline in NOx emissions was mainly caused by the strengthened emission control of on-road and off-road transportation, the shutdown of all coal-fired power plants, and the application of low-nitrogen-burning (LNB) technologies in industrial boilers. However, due to the insufficient end-of-pipe control of widespread gas-fired facilities and the rapid increase in the vehicle population (the number of vehicles in Beijing increased by nearly 10 % during 2013–2017), the NOx emission reduction in Beijing was not as significant as the SO2 emission reduction.
In adjacent regions, SO2 emissions decreased by 50.6 % from 2014 to 2017, while NOx emissions showed a much smaller reduction of 15.2 %. Comparatively, the energy structure adjustments in surrounding areas were less intense than those in Beijing. Emission reductions in SO2 and NOx in surrounding regions were mainly attributed to ultralow power plant emissions and the reinforced end-of-pipe control of key industries. Because of the looser emission standards for vehicles and the lack of vehicle management, control measures on transportation in adjacent regions were highly insufficient for NOx emission reduction compared with those in Beijing. Overall, the observed transition in PM1 chemical composition with increasing nitrate contribution and decreasing sulfate fraction was in agreement with the emission changes in their precursors.
3.2.3 Regional transport
Variations in regional weather patterns and emission changes in air pollutants in surrounding regions influenced the effect of regional transport on aerosol characteristics in Beijing. Statistical analysis of air mass trajectories was performed using the HYSPLIT model. Based on the clustering technique, back trajectories were classified into groups of similar length and curvature to identify the main airflows affecting the site. The five-cluster solution and seven-cluster solution were adopted for the winters of 2014 and 2017, respectively. The PM1 mass concentration and mass composition for each cluster are shown in Fig. S19. For a better comparison between 2014 and 2017, clusters were further grouped into two categories according to PM1 loadings. Clusters arriving in Beijing when the local PM1 concentration was less than 35 µg m−3 were recognized as clean clusters, while clusters with PM1 concentrations greater than 35 µg m−3 were defined as polluted clusters. As displayed in Fig. 7, the average PM1 concentration in local Beijing was 114 µg m−3 in 2014 when the polluted clusters arrived, which was much higher than that in 2017 (74 µg m−3). While the contribution of polluted clusters in 2014 was 47 %, polluted air masses transported from surrounding regions influenced Beijing approximately 20 % of the time in 2017. The results here indicate that compared to 2014, Beijing was less influenced by polluted air masses transported from surrounding areas in 2017 during the wintertime, which benefited air quality improvement. In addition, air masses in 2017 brought more nitrate and less sulfate to Beijing than those in 2014.
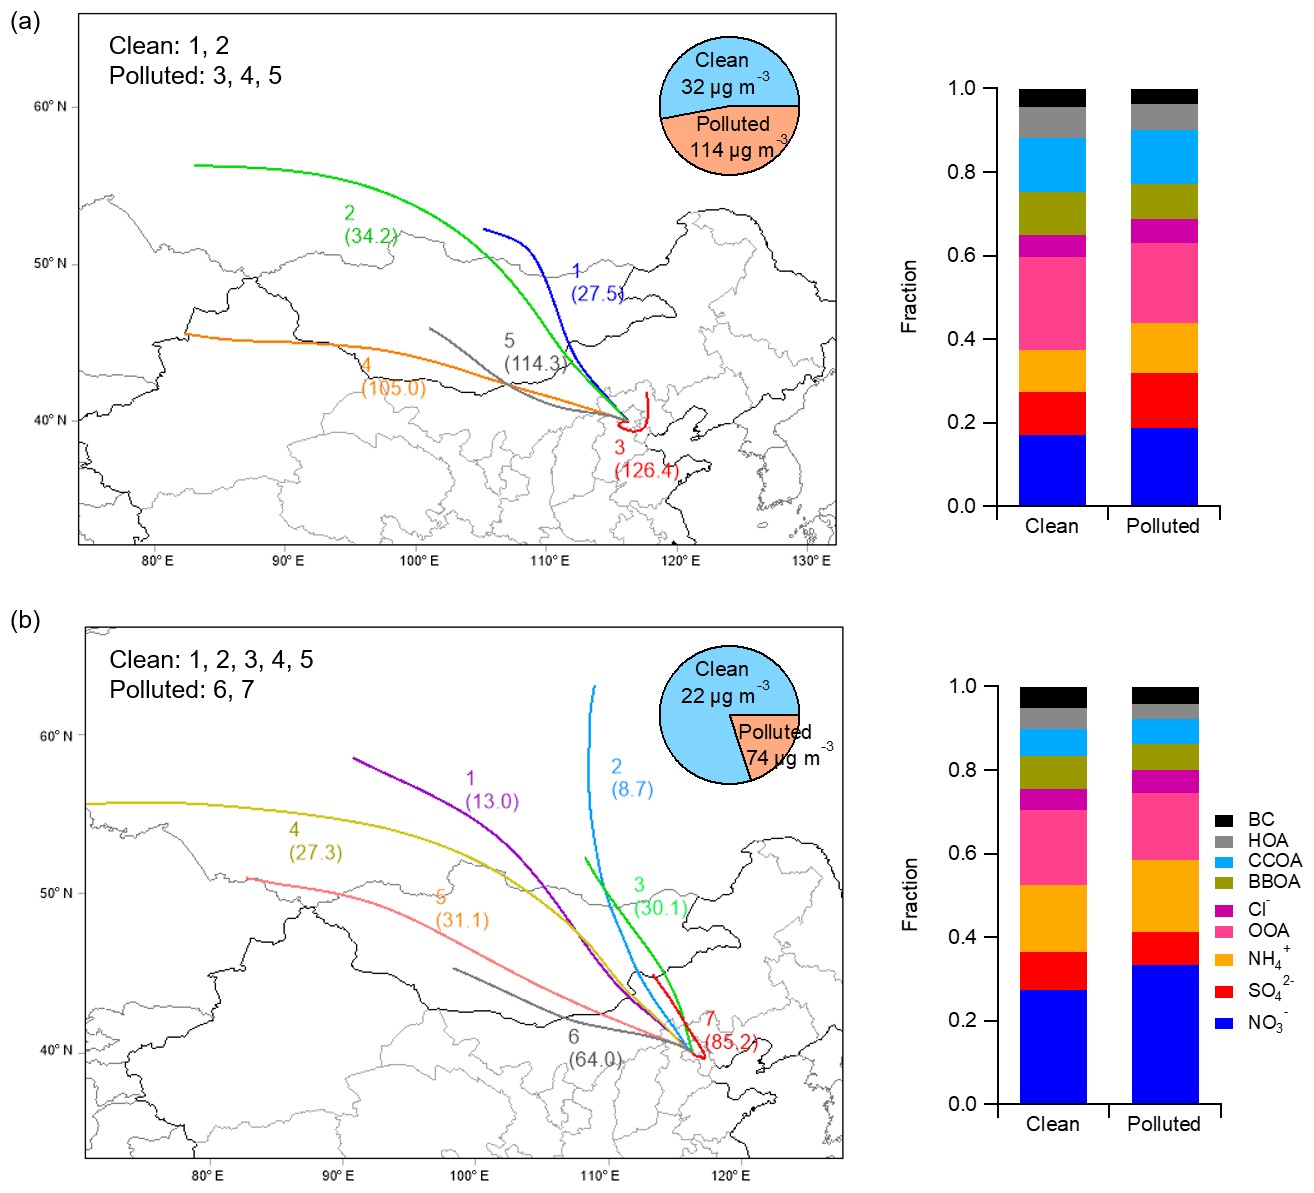
Figure 7Comparison of the air masses arriving in Beijing between 2014 and 2017. Panels (a) and (b) show the clustering analysis of the back trajectories in the winters of 2014 and 2017, respectively, with pie charts displaying the contributions of the clean and polluted air masses. The stacked bar charts on the right show the average aerosol compositions for the clean and polluted clusters.
The WRF-CMAQ model simulations showed that the contributions of regional transport to the PM2.5 concentration in Beijing were 31.4 and 19.0 µg m−3 in the winters of 2014 and 2017, respectively (Fig. 5b). Although the proportion of regional transport (relative to the total PM2.5 concentration in Beijing) remained at approximately 35 % in the two winters (34.4 % in the winter of 2014 and 36.4 % in the winter of 2017), the absolute amount decreased by 39.6 %. This result further supported that less PM2.5 transported from surrounding regions indeed helped with PM2.5 abatement in Beijing. Compared with 2014, the variations in PM2.5 components due to regional transport (Fig. 5b) in 2017 were basically consistent with the total aerosol composition changes that were observed (Fig. 1) and simulated (Fig. 5a) in Beijing. Sulfate had the most notable decrease with a decrease of 57.9 % in its mass concentration and the regional transport of OM and BC decreased by over 38 %. The significant reduction in sulfate was mainly attributed to the effective SO2 emission controls in the surrounding regions, such as the special emission limits for power plants and the innovative technology of industrial boilers. The decreasing rate of regional transport OM was obviously lower than the total change, suggesting that the local emission controls of VOCs and primary OM in Beijing had a dominant contribution to the decrease in OM. The reduction in nitrate from regional transport was much smaller than that in other components. This was not only due to the insufficient NOx emission controls in the surrounding areas but also the relatively rich ammonium environment in northern China, which might have weakened the effects of NOx reductions. Therefore, the collaborative reductions in NOx and NH3 are important for future air pollution control strategies (Liu et al., 2019).
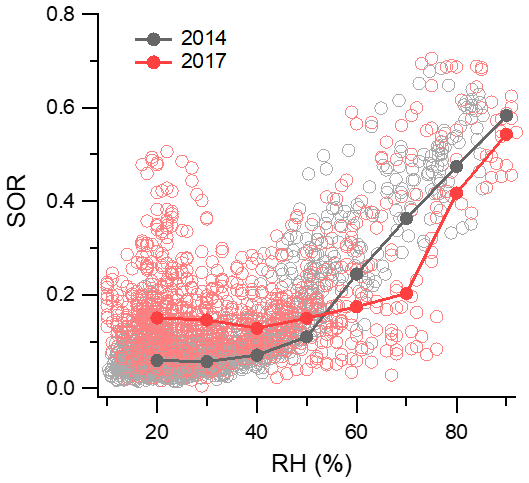
Figure 8Variations in sulfur oxidation ratio (SOR) plotted against increasing RH. The data are also binned according to RH values, with the median value shown for each bin.
3.2.4 Formation mechanisms
From a traditional viewpoint, sulfate formation mainly includes SO2 oxidation by OH in the gas phase and SO2 oxidation in cloud droplets by H2O2 and O3 in the aqueous phase (Seinfeld and Pandis, 2012). This is actually the case for global sulfate production (Roelofs et al., 1998). The formation rate of sulfate through aqueous reactions is typically much faster than that through gas-phase oxidations. Recently, studies have found that SO2 oxidation by NO2 in aerosol water with near-neutral aerosol acidity, which is usually ignored in current model simulations, plays an important role in the persistent formation of sulfate during haze events in northern China (B. Zheng et al., 2015; Cheng et al., 2016; Wang et al., 2016). Others pointed out that regardless of the high NH3 levels, aerosols are always moderately acidic in northern China, and there are probably other alternative formation pathways contributing to fast sulfate production in haze pollution (Guo et al., 2017b; Liu et al., 2017; Song et al., 2018). As the SO2 emissions decreased substantially with the clean air actions, the importance of heterogeneous chemistry in sulfate formation is highly uncertain.
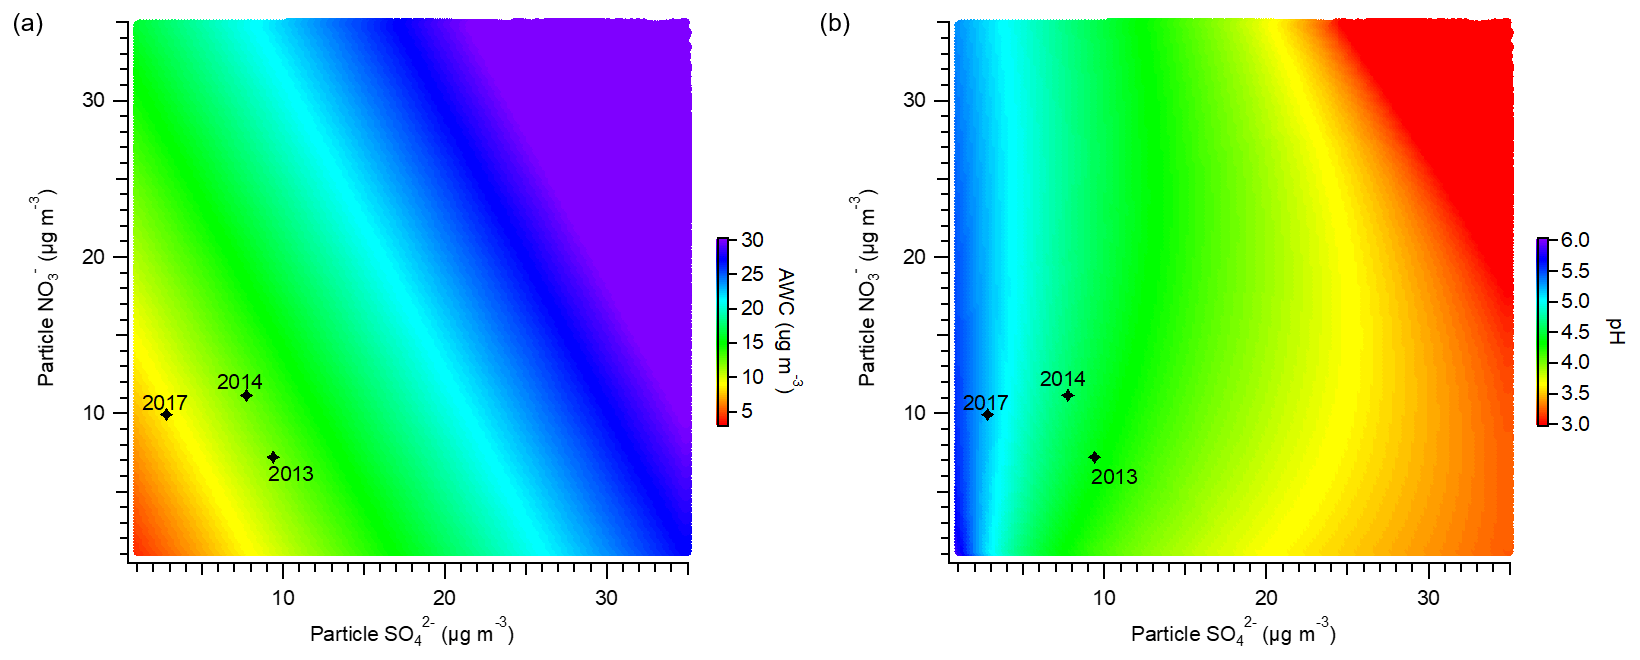
Figure 9Sensitivity of (a) AWC and (b) particle pH to the mass concentrations of particulate sulfate and nitrate. The stars indicate the average winter conditions for the years 2013, 2014, and 2017.
To shed light on this query, the formation of sulfate with increasing RH was compared between 2014 and 2017 (Fig. 8). The sulfur oxidation ratio (SOR) was estimated as the molar ratio of sulfate to the sum of sulfate and SO2 to quantify the degree of SO2 oxidations (G. J. Zheng et al., 2015; Li et al., 2016). Median values were used for comparison between 2014 and 2017 to avoid bias caused by outliers. When the RH > 50 %, SOR started to increase significantly with the enhancement in RH in 2014, which was consistent with previous observations in Beijing in 2013 (G. J. Zheng et al., 2015). A year-long study in Beijing from 2012 to 2013 also revealed that a rapid increase in SOR was found at a RH threshold of ∼45 % (Fang et al., 2019). However, the starting point of SOR growth was clearly delayed in 2017 with a higher RH of 70 %. Considering the decrease in the SO2 mixing ratio from 15.5 ppb in the winter of 2014 to 2.8 ppb in the winter of 2017 (Table 1), we speculated that with the large reduction in gaseous precursors, the rapid formation of sulfate through heterogeneous reactions is more difficult to occur. In addition to emission reduction, reduced regional transport from southern polluted regions in 2017 helped to lower SO2 concentrations in Beijing. Previous studies have revealed the positive feedback between aerosols and boundary layers as high aerosol loadings could decrease the boundary layer height and further increase aerosol concentrations (Petäjä et al., 2016; Z. Li et al., 2017). With a lower PM2.5 concentration in 2017, the interactions between aerosols and the boundary layer were weakened, which in turn also favored a decrease in the SO2 concentration. At a lower RH, the SOR in 2017 (∼0.14) was unexpectedly higher than that in 2014 (∼0.06), demonstrating a higher sulfate production rate in 2017. Similar results have been observed over the eastern United States, where a considerable decrease in SO2 resulted in a more efficient formation of particulate sulfate during wintertime (Shah et al., 2018). Combining airborne measurements, ground-based observations, and GEOS-Chem simulations, Shah et al. (2018) explained that sulfate production in winter is limited by the availability of oxidants and particle acidity. At lower concentrations of precursor gases, the oxidant limitation on SO2 oxidation weakened, leading to a higher formation rate of sulfate.
3.3 Influence of the transition in aerosol characteristics on particle properties
According to thermodynamic calculations, various aerosol properties were affected by changes in aerosol characteristics associated with clean air actions. As shown in Fig. 9a, nitrate and sulfate play key roles in determining the AWC in PM2.5. The decreasing mass concentrations of nitrate and sulfate result in a lower AWC. Similar observations have been reported previously across northern China, revealing that nitrate and sulfate are dominant anthropogenic inorganic salts driving AWC (Wu et al., 2018). With the clean air actions enacted, the mass concentrations of nitrate and sulfate decreased during 2013–2017, leading to an average decline in AWC from 12.0 to 8.5 µg m−3. Data for the winter of 2013 were acquired from Y. Sun et al. (2016). The reduced AWC further helped air quality improvement by lowering the ambient aerosol mass and enhancing visibility. Because aqueous-phase reactions contribute largely to sulfate formation in winter, the decrease in AWC decelerated the formation of sulfate. In addition, the lower AWC slowed down the uptake coefficient of N2O5 for heterogeneous processing, thereby suppressing the formation of particulate nitrate.
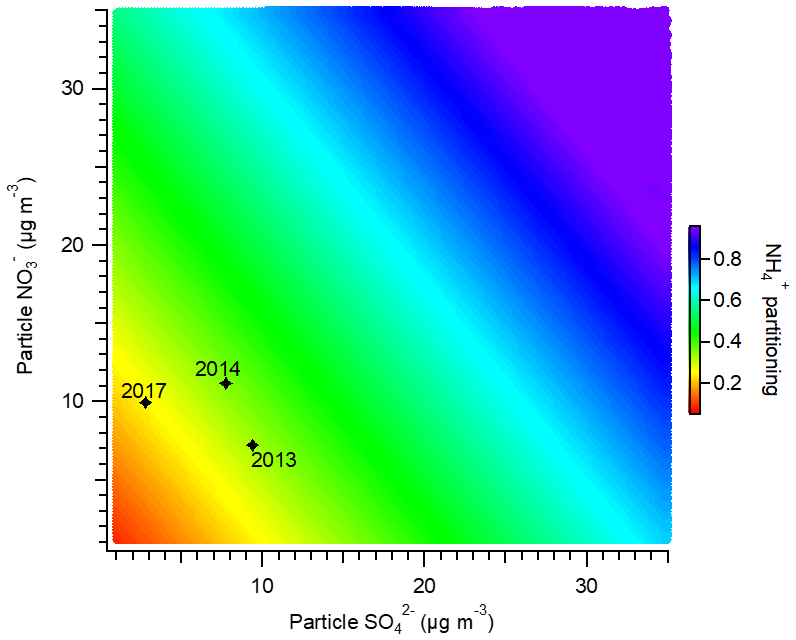
Figure 10Sensitivity of the ammonium partitioning ratio to the mass concentrations of particulate sulfate and nitrate. The stars indicate the average winter conditions for the years 2013, 2014, and 2017.
Figure 9b displays the effects of nitrate and sulfate concentrations on particle acidity. Particle acidity is largely driven by the mass concentration of sulfate and is less sensitive to the variation in nitrate. Particle pH substantially decreases with increasing sulfate concentration. Ding et al. (2019) suggested that sulfate is one of the common driving factors influencing particle acidity in Beijing across all four seasons. In contrast, more particulate nitrate leads to a slightly higher pH by increasing the particle liquid water and diluting aqueous H+ concentrations. Through the comparison of pH predictions among various locations worldwide, Guo et al. (2018) also found that a higher particle pH was generally associated with higher concentrations of nitrate. During 2013–2017, the average particle pH varied from 4.5 to 5.3 with a significant decrease in sulfate concentration. The pH values here agree reasonably with previous ISORROPIA-II calculations, showing that fine particles are moderately acidic in northern China during wintertime (Guo et al., 2017a; Liu et al., 2017; Song et al., 2018; Ding et al., 2019). When pH > 5.0, aqueous-phase productions of sulfate are dominated by SO2 oxidation with H2O2, O3, and NO2 under haze conditions in Beijing (Cheng et al., 2016). The sulfate oxidation rates by O3 and NO2 increase with increasing particle pH. Therefore, a more neutral atmosphere would favor aqueous-phase sulfate formation in Beijing. Particle acidity also influences the gas–particle partitioning of nitrate. The rising particle pH would result in a higher fraction of particulate nitrate () (Guo et al., 2016). Figure S20a displays the variations in as a function of particle pH under typical Beijing winter conditions (temperature of approximately 0∘C). With a particle pH below 3, increases sufficiently with the enhancement in particle pH. However, when the particle pH is larger than 3, remains relatively stable (approaching 1), consistent with previous findings by Guo et al. (2018). From 2013 to 2017, with the particle pH remaining above 3 in Beijing, no clear change in was observed (Fig. S20b).
The variations in nitrate and sulfate concentrations also affected the gas–particle partitioning of total ammonium (NHx = NH3 + ). As expected, the decreased concentrations of nitrate and sulfate led to a reduction in the ammonium particle fraction (; Fig. 10). From 2013 to 2017, in Beijing always stayed below 0.4, indicating that most ammonium existed in the gas phase. Therefore, a minor reduction in NHx would not be sufficient for air quality improvement. Guo et al. (2018) revealed that for winter haze conditions in Beijing, an approximate 60 % decrease in NHx was required to achieve an effective reduction in PM2.5. Due to the close linkage between ammonia emissions and agricultural activities, it may be difficult to attain substantial ammonia reduction in China.
This study investigated the variations in aerosol characteristics in Beijing during the winters of 2014 and 2017 by combining the online measurements of aerosol chemical composition with a comprehensive model analysis of meteorological conditions, anthropogenic emissions, and regional transport. The average PM1 concentration decreased from 66.2 µg m−3 in the winter of 2014 to 33.4 µg m−3 in the winter of 2017 with decreasing concentrations of organics, sulfate, nitrate, and ammonium by 18.5, 4.9, 1.3, and 1.5 µg m−3, respectively. These changes reduced the mass fractions of organics and sulfate from 59 % to 36 % and from 13 % to 9 %, respectively, whereas increased the nitrate contribution from 19 % to 32 %. Consequently, the winter haze pollution changed from sulfate-driven to nitrate-driven in Beijing from 2014 to 2017, implicating the increasing role of nitrate in aerosol pollution.
The chemical transport model simulations suggest that the rapidly declining emissions in Beijing and its adjacent regions account for ∼75 % of PM2.5 abatement in Beijing, and the remaining portion can be explained by the favorable weather conditions in 2017. The faster reductions in SO2 emissions compared to NOx emissions are in line with the decreased sulfate contribution and increased nitrate fraction in observed aerosols, and the model simulations with these emission estimates can reproduce the relative changes in aerosol composition. Regional transport contributed moderately to the variations in aerosol concentration and its chemical composition, with less polluted air masses transported from surrounding regions to Beijing in the winter of 2017. The air masses were observed to have brought more nitrate and less sulfate to Beijing. Furthermore, the fast SO2-to-sulfate conversion through heterogeneous reactions was observed to increase promptly at a RH threshold of ∼50 % in 2014, while a higher RH of 70 % was observed in 2017. Based on these ambient observations, the suppressed sulfate formation during wintertime was possibly caused by the considerable decrease in SO2 emissions.
Thermodynamic calculations showed that the decreased sulfate and nitrate concentrations in 2017 caused a lower AWC in PM2.5, which further decreased the ambient aerosol mass and weakened the formation rates of sulfate and nitrate through aqueous-phase reactions. Particle acidity displayed a decline during 2014–2017, mostly driven by the declining sulfate concentration. In turn, the more neutral ambient environment would favor the aqueous oxidation of sulfate in Beijing. Analysis of the ammonium particle fraction indicated that most ammonium in Beijing existed in the gas phase. Therefore, increased efforts are needed to achieve an effective reduction in particle ammonium in the future.
Data are available from the corresponding author upon request (qiangzhang@tsinghua.edu.cn).
The supplement related to this article is available online at: https://doi.org/10.5194/acp-19-11485-2019-supplement.
QZ and KH conceived the study. HL conducted the field measurements and carried out the data analysis. JC provided the emission data and performed the model simulations. BZ participated the data analysis. HL, JC, and QZ wrote the paper with inputs from all coauthors.
The authors declare that they have no conflict of interest.
This work was funded by the National Natural Science Foundation of China (41571130035, 41571130032, and 41625020).
This research has been supported by the National Natural Science Foundation of China (grant nos. 41571130035, 41571130032, and 41625020).
This paper was edited by Steven Brown and reviewed by Rodney Weber and one anonymous referee.
Bey, I., Jacob, D. J., Yantosca, R. M., Logan, J. A., Field, B. D., Fiore, A. M., Li, Q., Liu, H., Mickley, L. J., and Schultz, M. G.: Global modeling of tropospheric chemistry with assimilated meteorology: Model description and evaluation, J. Geophys. Res., 106, 23073–23095, https://doi.org/10.1029/2001JD000807, 2001.
Canonaco, F., Crippa, M., Slowik, J. G., Baltensperger, U., and Prévôt, A. S. H.: SoFi, an IGOR-based interface for the efficient use of the generalized multilinear engine (ME-2) for the source apportionment: ME-2 application to aerosol mass spectrometer data, Atmos. Meas. Tech., 6, 3649–3661, https://doi.org/10.5194/amt-6-3649-2013, 2013.
Cheng, J., Su, J., Cui, T., Li, X., Dong, X., Sun, F., Yang, Y., Tong, D., Zheng, Y., Li, Y., Li, J., Zhang, Q., and He, K.: Dominant role of emission reduction in PM2.5 air quality improvement in Beijing during 2013–2017: a model-based decomposition analysis, Atmos. Chem. Phys., 19, 6125–6146, https://doi.org/10.5194/acp-19-6125-2019, 2019.
Cheng, Y. F., Zheng, G. J., Wei, C., Mu, Q., Zheng, B., Wang, Z. B., Gao, M., Zhang, Q., He, K. B., Carmichael, G., Pöschl, U., and Su, H.: Reactive nitrogen chemistry in aerosol water as a source of sulfate during haze events in China, Sci. Adv., 2, e1601530, https://doi.org/10.1126/sciadv.1601530, 2016.
Crippa, M., Canonaco, F., Lanz, V. A., Äijälä, M., Allan, J. D., Carbone, S., Capes, G., Ceburnis, D., Dall'Osto, M., Day, D. A., DeCarlo, P. F., Ehn, M., Eriksson, A., Freney, E., Hildebrandt Ruiz, L., Hillamo, R., Jimenez, J. L., Junninen, H., Kiendler-Scharr, A., Kortelainen, A.-M., Kulmala, M., Laaksonen, A., Mensah, A. A., Mohr, C., Nemitz, E., O'Dowd, C., Ovadnevaite, J., Pandis, S. N., Petäjä, T., Poulain, L., Saarikoski, S., Sellegri, K., Swietlicki, E., Tiitta, P., Worsnop, D. R., Baltensperger, U., and Prévôt, A. S. H.: Organic aerosol components derived from 25 AMS data sets across Europe using a consistent ME-2 based source apportionment approach, Atmos. Chem. Phys., 14, 6159–6176, https://doi.org/10.5194/acp-14-6159-2014, 2014.
Ding, J., Zhao, P., Su, J., Dong, Q., Du, X., and Zhang, Y.: Aerosol pH and its driving factors in Beijing, Atmos. Chem. Phys., 19, 7939–7954, https://doi.org/10.5194/acp-19-7939-2019, 2019.
Du, H., Li, J., Chen, X., Wang, Z., Sun, Y., Fu, P., Li, J., Gao, J., and Wei, Y.: Modeling of aerosol property evolution during winter haze episodes over a megacity cluster in northern China: roles of regional transport and heterogeneous reactions of SO2, Atmos. Chem. Phys., 19, 9351–9370, https://doi.org/10.5194/acp-19-9351-2019, 2019.
Fang, Y., Ye, C., Wang, J., Wu, Y., Hu, M., Lin, W., Xu, F., and Zhu, T.: RH and O3 concentration as two prerequisites for sulfate formation, Atmos. Chem. Phys. Discuss., https://doi.org/10.5194/acp-2019-284, in review, 2019.
Ferreri, J. M., Peng, R. D., Bell, M. L., Ya, L., Li, T., and Brooke Anderson, G.: The January 2013 Beijing “Airpocalypse” and its acute effects on emergency and outpatient visits at a Beijing hospital, Air Qual. Atmos. Hlth., 11, 301–309, https://doi.org/10.1007/s11869-017-0538-0, 2018.
Fountoukis, C. and Nenes, A.: ISORROPIA II: a computationally efficient thermodynamic equilibrium model for K+–Ca2+–Mg2+––Na+–––Cl−–H2O aerosols, Atmos. Chem. Phys., 7, 4639–4659, https://doi.org/10.5194/acp-7-4639-2007, 2007.
Geng, G., Zhang, Q., Tong, D., Li, M., Zheng, Y., Wang, S., and He, K.: Chemical composition of ambient PM2.5 over China and relationship to precursor emissions during 2005–2012, Atmos. Chem. Phys., 17, 9187–9203, https://doi.org/10.5194/acp-17-9187-2017, 2017.
Gui, K., Che, H., Wang, Y., Wang, H., Zhang, L., Zhao, H., Zheng, Y., Sun, T., and Zhang, X.: Satellite-derived PM2.5 concentration trends over Eastern China from 1998 to 2016: Relationships to emissions and meteorological parameters, Environ. Pollut., 247, 1125–1133, https://doi.org/10.1016/j.envpol.2019.01.056, 2019.
Guo, H., Xu, L., Bougiatioti, A., Cerully, K. M., Capps, S. L., Hite Jr., J. R., Carlton, A. G., Lee, S.-H., Bergin, M. H., Ng, N. L., Nenes, A., and Weber, R. J.: Fine-particle water and pH in the southeastern United States, Atmos. Chem. Phys., 15, 5211–5228, https://doi.org/10.5194/acp-15-5211-2015, 2015.
Guo, H., Sullivan, A. P., Campuzano-Jost, P., Schroder, J. C., Lopez-Hilfiker, F. D., Dibb, J. E., Jimenez, J. L., Thornton, J. A., Brown, S. S., Nenes, A., and Weber, R. J.: Fine particle pH and the partitioning of nitric acid during winter in the northeastern United States, J. Geophys. Res.-Atmos., 121, 355–376, https://doi.org/10.1002/2016JD025311, 2016.
Guo, H., Liu, J., Froyd, K. D., Roberts, J. M., Veres, P. R., Hayes, P. L., Jimenez, J. L., Nenes, A., and Weber, R. J.: Fine particle pH and gas–particle phase partitioning of inorganic species in Pasadena, California, during the 2010 CalNex campaign, Atmos. Chem. Phys., 17, 5703–5719, https://doi.org/10.5194/acp-17-5703-2017, 2017a.
Guo, H., Weber, R. J., and Nenes, A.: High levels of ammonia do not raise fine particle pH sufficiently to yield nitrogen oxide-dominated sulfate production, Sci. Rep., 7, 12109, https://doi.org/10.1038/s41598-017-11704-0, 2017b.
Guo, H., Otjes, R., Schlag, P., Kiendler-Scharr, A., Nenes, A., and Weber, R. J.: Effectiveness of ammonia reduction on control of fine particle nitrate, Atmos. Chem. Phys., 18, 12241–12256, https://doi.org/10.5194/acp-18-12241-2018, 2018.
Guo, S., Hu, M., Zamora, M. L., Peng, J., Shang, D., Zheng, J., Du, Z., Wu, Z., Shao, M., Zeng, L., Molina, M. J., and Zhang, R.: Elucidating severe urban haze formation in China, P. Natl. Acad. Sci. USA, 111, 17373, https://doi.org/10.1073/pnas.1419604111, 2014.
Hennigan, C. J., Izumi, J., Sullivan, A. P., Weber, R. J., and Nenes, A.: A critical evaluation of proxy methods used to estimate the acidity of atmospheric particles, Atmos. Chem. Phys., 15, 2775–2790, https://doi.org/10.5194/acp-15-2775-2015, 2015.
Intergovernmental Panel on Climate Change (IPCC): Climate Change 2013: The Physical Science Basis, Contribution of Working Group I to the Fifth Assessment Report of the Intergovernmental Panel on Climate Change, Cambridge University Press, Cambridge, UK, and New York, 1535 pp., 2013.
Ji, D., Gao, W., Maenhaut, W., He, J., Wang, Z., Li, J., Du, W., Wang, L., Sun, Y., Xin, J., Hu, B., and Wang, Y.: Impact of air pollution control measures and regional transport on carbonaceous aerosols in fine particulate matter in urban Beijing, China: Insights gained from long-term measurement, Atmos. Chem. Phys. Discuss., 2019, 1–49, https://doi.org/10.5194/acp-2019-42, 2019.
Lelieveld, J., Evans, J. S., Fnais, M., Giannadaki, D., and Pozzer, A.: The contribution of outdoor air pollution sources to premature mortality on a global scale, Nature, 525, 367, https://doi.org/10.1038/nature15371, 2015.
Li, H., Zhang, Q., Zhang, Q., Chen, C., Wang, L., Wei, Z., Zhou, S., Parworth, C., Zheng, B., Canonaco, F., Prévôt, A. S. H., Chen, P., Zhang, H., Wallington, T. J., and He, K.: Wintertime aerosol chemistry and haze evolution in an extremely polluted city of the North China Plain: significant contribution from coal and biomass combustion, Atmos. Chem. Phys., 17, 4751–4768, https://doi.org/10.5194/acp-17-4751-2017, 2017.
Li, H., Zhang, Q., Zheng, B., Chen, C., Wu, N., Guo, H., Zhang, Y., Zheng, Y., Li, X., and He, K.: Nitrate-driven urban haze pollution during summertime over the North China Plain, Atmos. Chem. Phys., 18, 5293–5306, https://doi.org/10.5194/acp-18-5293-2018, 2018.
Li, M., Zhang, Q., Kurokawa, J.-I., Woo, J.-H., He, K., Lu, Z., Ohara, T., Song, Y., Streets, D. G., Carmichael, G. R., Cheng, Y., Hong, C., Huo, H., Jiang, X., Kang, S., Liu, F., Su, H., and Zheng, B.: MIX: a mosaic Asian anthropogenic emission inventory under the international collaboration framework of the MICS-Asia and HTAP, Atmos. Chem. Phys., 17, 935–963, https://doi.org/10.5194/acp-17-935-2017, 2017.
Li, T.-C., Yuan, C.-S., Huang, H.-C., Lee, C.-L., Wu, S.-P., and Tong, C.: Inter-comparison of Seasonal Variation, Chemical Characteristics, and Source Identification of Atmospheric Fine Particles on Both Sides of the Taiwan Strait, Sci. Rep., 6, 22956, https://doi.org/10.1038/srep22956, 2016.
Li, Z., Guo, J., Ding, A., Liao, H., Liu, J., Sun, Y., Wang, T., Xue, H., Zhang, H., and Zhu, B.: Aerosol and boundary-layer interactions and impact on air quality, Natl. Sci. Rev., 4, 810–833, https://doi.org/10.1093/nsr/nwx117, 2017.
Liu, M. X., Song, Y., Zhou, T., Xu, Z. Y., Yan, C. Q., Zheng, M., Wu, Z. J., Hu, M., Wu, Y. S., and Zhu, T.: Fine particle pH during severe haze episodes in northern China, Geophys. Res. Lett., 44, 5213–5221, 2017.
Liu, M, X., Huang, X., Song, Y., Tang, J., Cao, J., Zhang, X., Zhang, Q., Wang, S., Xu, T., Kang, L., Cai, X., Zhang, H., Yang, F., Wang, H., Yu, J., Lau, Alexis K, H., He, L., Huang, X., Duan, L., Ding A., Xue, L., Gao, J., Liu, B., and Zhu, T.: Ammonia emission control in China would mitigate haze pollution and nitrogen deposition, but worsen acid rain, P. Natl. Acad. Sci., 116, 7760–7765, https://doi.org/10.1073/pnas.1814880116, 2019.
Meng, Z. Y., Lin, W. L., Jiang, X. M., Yan, P., Wang, Y., Zhang, Y. M., Jia, X. F., and Yu, X. L.: Characteristics of atmospheric ammonia over Beijing, China, Atmos. Chem. Phys., 11, 6139–6151, https://doi.org/10.5194/acp-11-6139-2011, 2011.
Middlebrook, A. M., Bahreini, R., Jimenez, J. L., and Canagaratna, M. R.: Evaluation of Composition-Dependent Collection Efficiencies for the Aerodyne Aerosol Mass Spectrometer using Field Data, Aerosol Sci. Tech., 46, 258–271, 2012.
Mu, Q. and Liao, H.: Simulation of the interannual variations of aerosols in China: role of variations in meteorological parameters, Atmos. Chem. Phys., 14, 9597–9612, https://doi.org/10.5194/acp-14-9597-2014, 2014.
Ng, N. L., Herndon, S. C., Trimborn, A., Canagaratna, M. R., Croteau, P. L., Onasch, T. B., Sueper, D., Worsnop, D. R., Zhang, Q., Sun, Y. L., and Jayne, J. T.: An Aerosol Chemical Speciation Monitor (ACSM) for Routine Monitoring of the Composition and Mass Concentrations of Ambient Aerosol, Aerosol Sci. Tech., 45, 780–794, 2011a.
Ng, N. L., Canagaratna, M. R., Jimenez, J. L., Zhang, Q., Ulbrich, I. M., and Worsnop, D. R.: Real-Time Methods for Estimating Organic Component Mass Concentrations from Aerosol Mass Spectrometer Data, Environ. Sci. Technol., 45, 910–916, 2011b.
Paatero, P.: The multilinear engine – A table-driven, least squares program for solving multilinear problems, including the n-way parallel factor analysis model, J. Comput. Graph. Stat., 8, 854–888, 1999.
Petäjä, T., Järvi, L., Kerminen, V. M., Ding, A. J., Sun, J. N., Nie, W., Kujansuu, J., Virkkula, A., Yang, X., Fu, C. B., Zilitinkevich, S., and Kulmala, M.: Enhanced air pollution via aerosol-boundary layer feedback in China, Sci. Rep., 6, 18998, https://doi.org/10.1038/srep18998, 2016.
Petzold, A. and Schonlinner, M.: Multi-angle absorption photometry – a new method for the measurement of aerosol light absorption and atmospheric black carbon, J. Aerosol Sci., 35, 421–441, 2004.
Pope, C. A., Ezzati, M., and Dockery, D. W.: Fine-Particulate Air Pollution and Life Expectancy in the United States., New Engl. J. Med., 360, 376–386, 2009.
Pui, D. Y. H., Chen, S. C., and Zuo, Z. L.: PM2.5 in China: Measurements, sources, visibility and health effects, and mitigation, Particuology, 13, 1–26, 2014.
Pye, H. O. T., Liao, H., Wu, S., Mickley, L. J., Jacob, D. J., Henze, D. K., and Seinfeld, J. H.: Effect of changes in climate and emissions on future sulfate-nitrate-ammonium aerosol levels in the United States, J. Geophys. Res.-Atmos., 114, https://doi.org/10.1029/2008JD010701, 2009.
Roelofs, G.-J. A. N., Lelieveld, J. O. S., and Ganzeveld, L.: Simulation of global sulfate distribution and the influence on effective cloud drop radii with a coupled photochemistry sulfur cycle model, Tellus B, 50, 224–242, https://doi.org/10.1034/j.1600-0889.1998.t01-2-00002.x, 1998.
Seinfeld, J. H. and Pandis, S. N.: Atmospheric chemistry and physics: from air pollution to climate change, 2nd edn., John Wiley & Sons, New York, USA, 2012.
Shah, V., Jaegle, L., Thornton, J. A., Lopez-Hilfiker, F. D., Lee, B. H., Schroder, J. C., Campuzano-Jost, P., Jimenez, J. L., Guo, H. Y., Sullivan, A. P., Weber, R. J., Green, J. R., Fiddler, M. N., Bililign, S., Campos, T. L., Stell, M., Weinheimer, A. J., Montzka, D. D., and Brown, S. S.: Chemical feedbacks weaken the wintertime response of particulate sulfate and nitrate to emissions reductions over the eastern United States, P. Natl. Acad. Sci. USA, 115, 8110–8115, 2018.
Song, S., Gao, M., Xu, W., Shao, J., Shi, G., Wang, S., Wang, Y., Sun, Y., and McElroy, M. B.: Fine-particle pH for Beijing winter haze as inferred from different thermodynamic equilibrium models, Atmos. Chem. Phys., 18, 7423–7438, https://doi.org/10.5194/acp-18-7423-2018, 2018.
Sun, K., Qu, Y., Wu, Q., Han, T., Gu, J., Zhao, J., Sun, Y., Jiang, Q., Gao, Z., Hu, M., Zhang, Y., Lu, K., Nordmann, S., Cheng, Y., Hou, L., Ge, H., Furuuchi, M., Hata, M., and Liu, X.: Chemical characteristics of size-resolved aerosols in winter in Beijing, J. Environ. Sci., 26, 1641–1650, https://doi.org/10.1016/j.jes.2014.06.004, 2014.
Sun, Y., Du, W., Fu, P., Wang, Q., Li, J., Ge, X., Zhang, Q., Zhu, C., Ren, L., Xu, W., Zhao, J., Han, T., Worsnop, D. R., and Wang, Z.: Primary and secondary aerosols in Beijing in winter: sources, variations and processes, Atmos. Chem. Phys., 16, 8309–8329, https://doi.org/10.5194/acp-16-8309-2016, 2016.
Sun, Y. L., Zhuang, G. S., Tang, A. H., Wang, Y., and An, Z. S.: Chemical characteristics of PM2.5 and PM10 in haze-fog episodes in Beijing, Environ. Sci. Technol., 40, 3148–3155, https://doi.org/10.1021/es051533g, 2006.
Sun, Y. L., Wang, Z., Wild, O., Xu, W., Chen, C., Fu, P., Du, W., Zhou, L., Zhang, Q., Han, T., Wang, Q., Pan, X., Zheng, H., Li, J., Guo, X., Liu, J., and Worsnop, D. R.: “APEC Blue”: Secondary Aerosol Reductions from Emission Controls in Beijing, Sci. Rep., 6, 20668, https://doi.org/10.1038/srep20668, 2016.
Ulbrich, I. M., Canagaratna, M. R., Zhang, Q., Worsnop, D. R., and Jimenez, J. L.: Interpretation of organic components from Positive Matrix Factorization of aerosol mass spectrometric data, Atmos. Chem. Phys., 9, 2891–2918, https://doi.org/10.5194/acp-9-2891-2009, 2009.
van Donkelaar, A., Martin, R. V., Li, C., and Burnett, R. T.: Regional Estimates of Chemical Composition of Fine Particulate Matter Using a Combined Geoscience-Statistical Method with Information from Satellites, Models, and Monitors, Environ. Sci. Technol., 53, 2595–2611, https://doi.org/10.1021/acs.est.8b06392, 2019.
Wang, G. H., Zhang, R. Y., Gomez, M. E., Yang, L. X., Zamora, M. L., Hu, M., Lin, Y., Peng, J. F., Guo, S., Meng, J. J., Li, J. J., Cheng, C. L., Hu, T. F., Ren, Y. Q., Wang, Y. S., Gao, J., Cao, J. J., An, Z. S., Zhou, W. J., Li, G. H., Wang, J. Y., Tian, P. F., Marrero-Ortiz, W., Secrest, J., Du, Z. F., Zheng, J., Shang, D. J., Zeng, L. M., Shao, M., Wang, W. G., Huang, Y., Wang, Y., Zhu, Y. J., Li, Y. X., Hu, J. X., Pan, B., Cai, L., Cheng, Y. T., Ji, Y. M., Zhang, F., Rosenfeld, D., Liss, P. S., Duce, R. A., Kolb, C. E., and Molina, M. J.: Persistent sulfate formation from London Fog to Chinese haze, P. Natl. Acad. Sci. USA, 113, 13630–13635, 2016.
Wang, Y., Zhang, Q., Jiang, J., Zhou, W., Wang, B., He, K., Duan, F., Zhang, Q., Philip, S., and Xie, Y.: Enhanced sulfate formation during China's severe winter haze episode in January 2013 missing from current models, J. Geophys. Res.-Atmos., 119, 10425–10440, https://doi.org/10.1002/2013JD021426, 2014.
Weber, R. J., Guo, H. Y., Russell, A. G., and Nenes, A.: High aerosol acidity despite declining atmospheric sulfate concentrations over the past 15 years, Nat. Geosci., 9, 282–285, https://doi.org/10.1038/ngeo2665, 2016.
Wu, Z. J., Wang, Y., Tan, T. Y., Zhu, Y. S., Li, M. R., Shang, D. J., Wang, H. C., Lu, K. D., Guo, S., Zeng, L. M., and Zhang, Y. H.: Aerosol Liquid Water Driven by Anthropogenic Inorganic Salts: Implying Its Key Role in Haze Formation over the North China Plain, Environ. Sci. Tech. Let., 5, 160–166, 2018.
Xu, W., Sun, Y., Wang, Q., Zhao, J., Wang, J., Ge, X., Xie, C., Zhou, W., Du, W., Li, J., Fu, P., Wang, Z., Worsnop, D. R., and Coe, H.: Changes in Aerosol Chemistry From 2014 to 2016 in Winter in Beijing: Insights From High-Resolution Aerosol Mass Spectrometry, J. Geophys. Res.-Atmos., 124, 1132–1147, https://doi.org/10.1029/2018JD029245, 2019.
Zhang, J. K., Sun, Y., Liu, Z. R., Ji, D. S., Hu, B., Liu, Q., and Wang, Y. S.: Characterization of submicron aerosols during a month of serious pollution in Beijing, 2013, Atmos. Chem. Phys., 14, 2887–2903, https://doi.org/10.5194/acp-14-2887-2014, 2014.
Zhang, Q., Jimenez, J. L., Canagaratna, M. R., Ulbrich, I. M., Ng, N. L., Worsnop, D. R., and Sun, Y. L.: Understanding atmospheric organic aerosols via factor analysis of aerosol mass spectrometry: a review, Anal. Bioanal. Chem., 401, 3045–3067, 2011.
Zhang, Y., Tang, A., Wang, D., Wang, Q., Benedict, K., Zhang, L., Liu, D., Li, Y., Collett Jr., J. L., Sun, Y., and Liu, X.: The vertical variability of ammonia in urban Beijing, China, Atmos. Chem. Phys., 18, 16385–16398, https://doi.org/10.5194/acp-18-16385-2018, 2018.
Zhao, M., Wang, S., Tan, J., Hua, Y., Wu, D., and Hao, J.: Variation of Urban Atmospheric Ammonia Pollution and its Relation with PM2.5 Chemical Property in Winter of Beijing, China, Aerosol Air Qual. Res., 16, 1378–1389, https://doi.org/10.4209/aaqr.2015.12.0699, 2016.
Zhao, P., Chen, Y., and Su, J.: Size-resolved carbonaceous components and water-soluble ions measurements of ambient aerosol in Beijing, J. Environ. Sci., 54, 298–313, https://doi.org/10.1016/j.jes.2016.08.027, 2017.
Zhao, X. J., Zhang, X. L., Xu, X. F., Xu, J., Meng, W., and Pu, W. W.: Seasonal and diurnal variations of ambient PM2.5 concentration in urban and rural environments in Beijing, Atmos. Environ., 43, 2893–2900, https://doi.org/10.1016/j.atmosenv.2009.03.009, 2009.
Zheng, B., Zhang, Q., Zhang, Y., He, K. B., Wang, K., Zheng, G. J., Duan, F. K., Ma, Y. L., and Kimoto, T.: Heterogeneous chemistry: a mechanism missing in current models to explain secondary inorganic aerosol formation during the January 2013 haze episode in North China, Atmos. Chem. Phys., 15, 2031–2049, https://doi.org/10.5194/acp-15-2031-2015, 2015.
Zheng, B., Tong, D., Li, M., Liu, F., Hong, C., Geng, G., Li, H., Li, X., Peng, L., Qi, J., Yan, L., Zhang, Y., Zhao, H., Zheng, Y., He, K., and Zhang, Q.: Trends in China's anthropogenic emissions since 2010 as the consequence of clean air actions, Atmos. Chem. Phys., 18, 14095–14111, https://doi.org/10.5194/acp-18-14095-2018, 2018.
Zheng, G. J., Duan, F. K., Su, H., Ma, Y. L., Cheng, Y., Zheng, B., Zhang, Q., Huang, T., Kimoto, T., Chang, D., Pöschl, U., Cheng, Y. F., and He, K. B.: Exploring the severe winter haze in Beijing: the impact of synoptic weather, regional transport and heterogeneous reactions, Atmos. Chem. Phys., 15, 2969–2983, https://doi.org/10.5194/acp-15-2969-2015, 2015.