the Creative Commons Attribution 4.0 License.
the Creative Commons Attribution 4.0 License.
 | 04 Sep 2019
The impact of measures to reduce ambient air PM10 concentrations originating from road dust, evaluated for a street canyon in Helsinki
Ana Stojiljkovic
Mari Kauhaniemi
Jaakko Kukkonen
Kaarle Kupiainen
Ari Karppinen
Bruce Rolstad Denby
Anu Kousa
Jarkko V. Niemi
Matthias Ketzel
We have numerically evaluated how effective selected potential measures would be for reducing the impact of road dust on ambient air particulate matter (PM10). The selected measures included a reduction of the use of studded tyres on light-duty vehicles and a reduction of the use of salt or sand for traction control. We have evaluated these measures for a street canyon located in central Helsinki for four years (2007–2009 and 2014). Air quality measurements were conducted in the street canyon for two years, 2009 and 2014. Two road dust emission models, NORTRIP (NOn-exhaust Road TRaffic Induced Particle emissions) and FORE (Forecasting Of Road dust Emissions), were applied in combination with the Operational Street Pollution Model (OSPM), a street canyon dispersion model, to compute the street increments of PM10 (i.e. the fraction of PM10 concentration originating from traffic emissions at the street level) within the street canyon. The predicted concentrations were compared with the air quality measurements. Both road dust emission models reproduced the seasonal variability of the PM10 concentrations fairly well but under-predicted the annual mean values. It was found that the largest reductions of concentrations could potentially be achieved by reducing the fraction of vehicles that use studded tyres. For instance, a 30 % decrease in the number of vehicles using studded tyres would result in an average decrease in the non-exhaust street increment of PM10 from 10 % to 22 %, depending on the model used and the year considered. Modelled contributions of traction sand and salt to the annual mean non-exhaust street increment of PM10 ranged from 4 % to 20 % for the traction sand and from 0.1 % to 4 % for the traction salt. The results presented here can be used to support the development of optimal strategies for reducing high springtime particulate matter concentrations originating from road dust.
- Article
(2750 KB) - Full-text XML
- BibTeX
- EndNote


During the last couple of decades, strict regulations and technological innovations have led to a significant decrease in exhaust particulate emissions from road traffic. However, at the same time, the decreases in non-exhaust traffic emissions have been much more moderate or even negligible, partly caused by the fact that these emissions have remained mostly unregulated (e.g. Kukkonen et al., 2018). The estimated relative contribution of non-exhaust emissions to PM10 emissions from road transport increased from 30 % in 2000 to 60 % in 2016 (EEA, 2018).
Non-exhaust emissions of respirable particles, PM10, include particles formed due to the wear of road surface, brakes and tyres, and the suspension of particles that have been accumulated on the road surface and are commonly referred to as road dust. The latter category originates from (i) the wear of the road surface and tyres, (ii) traction control materials (sand and salt), and (iii) a range of other miscellaneous sources, such as deposited material from e.g. road and building construction sites or the surrounding environment, as well as the deposition of materials to the surface from the ambient air.
In northern European countries, non-exhaust emissions have been one of the most important causes of high ambient air PM10 concentrations for several decades (e.g. Kukkonen et al., 1999, 2018; Kauhaniemi et al., 2014). These have also resulted in exceedances of the daily PM10 limit values set by the European Union (EU; no more than 35 occurrences of daily mean values exceeding 50 µg m−3), especially during spring. In brief, the mechanisms leading to such exceedances are (i) the accumulation of road dust on the road surfaces in winter, (ii) the melting of snow and ice in spring, and (iii) the release of substantial amounts of suspended dust to the atmosphere from the road surfaces during dry periods.
In the Nordic countries, it is necessary to use traction control measures (winter tyres, traction sanding and salting) during the colder seasons to ensure traffic safety in snowy and icy weather.
Road wear associated with the use of studded winter tyres has been found to be the most significant source of road dust (Kupiainen, 2007; Denby et al., 2013a; Kupiainen et al., 2016) that contributes to high PM10 concentrations. The use of traction sanding and salting contributes to a lesser degree to the amount of suspended street dust; however, these contributions may also be significant (Denby et al., 2013a; Kupiainen et al., 2016).
Salt is commonly the preferred of the two traction control materials, but sanding has to be used in specific weather conditions. These include, in particular, the conditions under which ambient temperatures are below −5 ∘C. Salting would then result in the freezing of the salt–water solution and would not contribute to improving the friction between tyres and the street surface. Traction sand can directly contribute to suspendible road dust if it contains particulate material that has specific grain sizes. There are also other processes by which traction sand can contribute: (i) via the crushing of larger sand grains into smaller particles due to the passage of a tyre and (ii) via the abrasion of the road surface by crushed stone and sand under the tyres of passing vehicles. The latter is commonly called the sandpaper effect (Kupiainen, 2007). According to Denby et al. (2016), approximately 0.5 % of the total salt distributed on the roads can be released to the air as PM10. As approximately 200 000 t of salt is spread out every year on the roads and streets in Finland, road salt can be a significant source of elevated PM10 concentrations.
For the design of successful mitigation strategies for road dust, it would be valuable to assess the contributions of different sources to PM10 concentrations. Then it would also be possible to evaluate the efficiency and impacts of potential abatement measures. Various modelling tools have been developed to facilitate such analyses.
The aim of this study is to evaluate the effectiveness of selected potential measures for reducing the emissions and concentrations of PM10 originating from road dust. These measures include a reduction of the use of studded tyres and the minimization of traction control material use. We have evaluated the effects of these measures for a street canyon location in central Helsinki for four years (2007–2009 and 2014). We have also compared the predictions of the modelling system with the measured concentrations in the street canyon for two years, 2009 and 2014. The non-exhaust PM10 emissions associated with vehicular traffic were computed using the road dust emission models NORTRIP (NOn-exhaust Road TRaffic Induced Particle emissions; Denby et al., 2013a, b) and FORE (Forecasting Of Road dust Emissions; Kauhaniemi et al., 2011). Both emission estimates were then implemented in the OSPM street canyon dispersion model (Berkowicz, 2000) to simulate the concentrations of PM10 at the street level.
2.1 Measurements
2.1.1 Study site description
The study was carried out for a segment of a major street called Hämeentie, located in central Helsinki. The street segment extends from south-west to north-east (at an angle of 56 ∘ clockwise from the north). The building block that surrounds the air quality measurement site extends over a distance of 91 m. The air quality measurement site was at distances of 56 and 35 m from the nearest junctions to the north-east and to the south-west, respectively. The average height of the surrounding buildings in the studied segment of the street is 26 m. The location of the study site in the city and the applied meteorological and air quality stations are presented in Fig. 1a. The location of buildings and park areas in the immediate vicinity of this street segment is presented in Fig. 1b. There is an open area and a small park to the north-east of the measurement site at distances of approximately 60 and 200 m, respectively. There are several high trees in those areas that were estimated to be approximately 10 m high. The street canyon is 32 m wide and it contains four lanes, two in each direction.
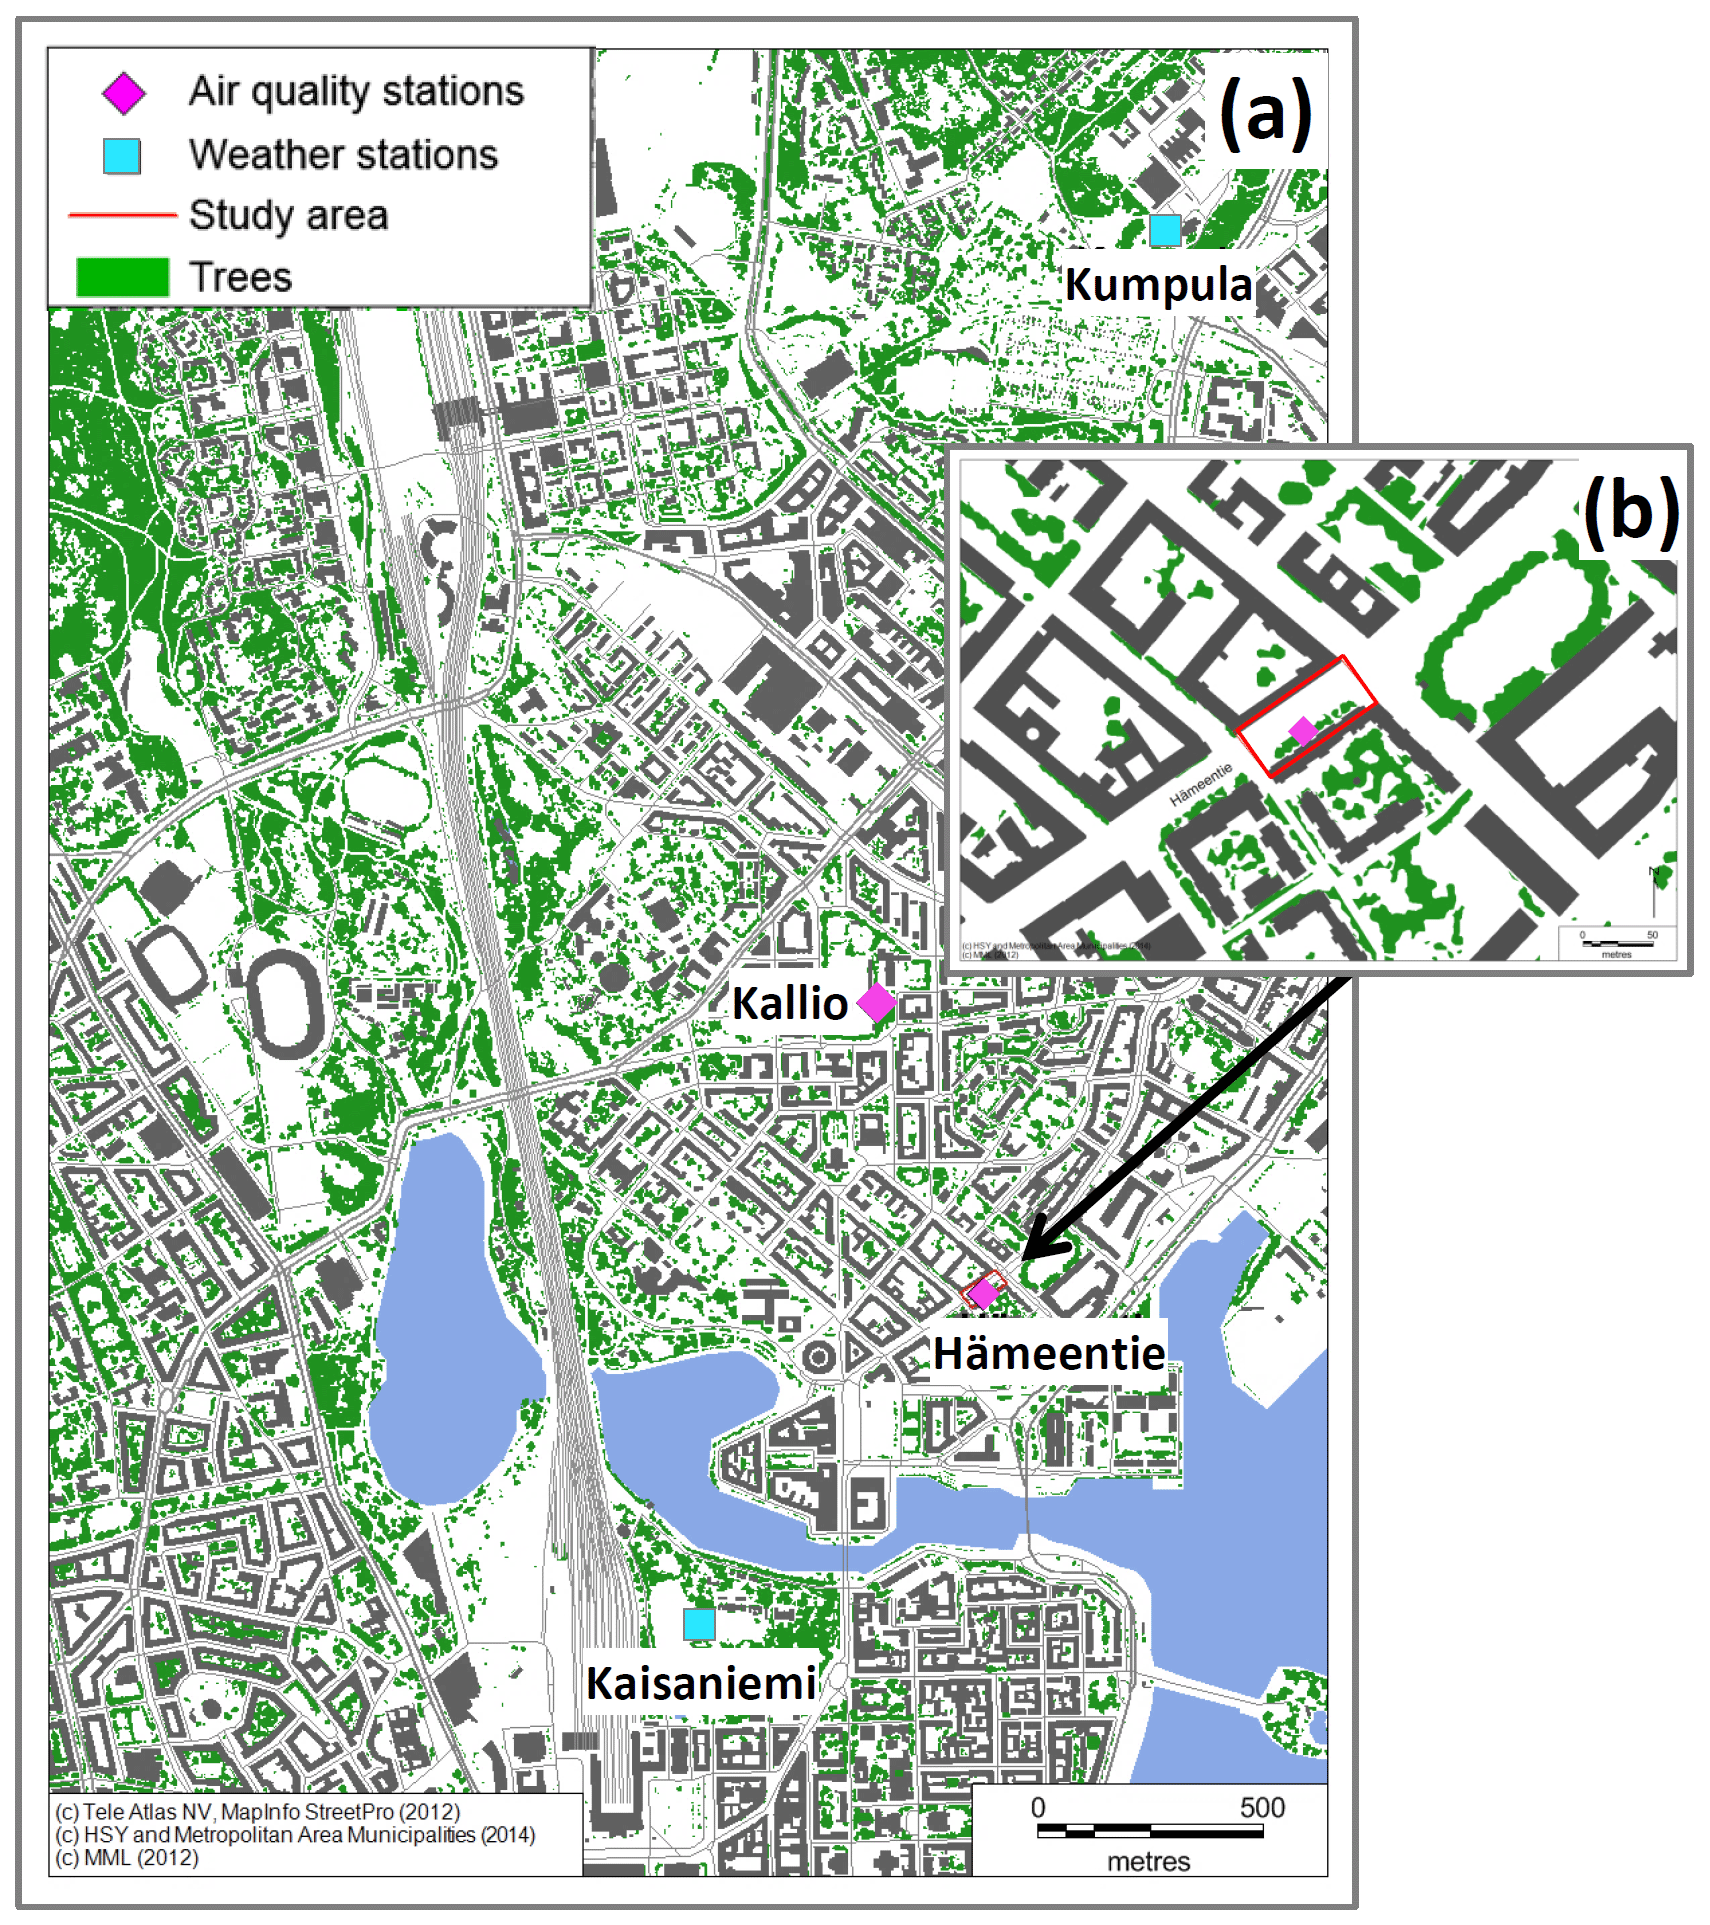
Figure 1(a) The locations of the studied street segment (red rectangle) at Hämeentie, kerbside (Hämeentie) and urban background (Kallio) air quality stations (pink diamond), as well as weather stations (Kumpula and Kaisaniemi) (blue square) in central Helsinki. Trees have been marked with green circles. (b) Close-up view showing building blocks (marked with grey) and trees in the vicinity of the studied street segment.
2.1.2 Traffic data and the use of studded tyres
Traffic volume data and weekly and monthly variations in traffic volume were based on estimations made by the Helsinki City Planning Department. The measured annual average weekday traffic volume is available for 2015 for Hämeentie and for 2007, 2008, 2009 and 2014 for a street that is a continuation of Hämeentie, located 600 m south-west from the site, called Pitkäsilta. The annual average weekday traffic volume measured at Hämeentie in 2015 was adopted for the year 2014. For other considered years, we have used measured traffic volumes at Pitkäsilta, scaled by the ratio of annual average weekday traffic volumes at Hämeentie in 2015 and at Pitkäsilta in 2014.
Average hourly weekday daytime vehicle speeds are based on values measured during monitoring campaigns in Hämeentie in 2007, 2009 and 2011. Measured values for 2007 and 2011 were adopted for the years 2008 and 2014, respectively. The vehicle speeds for night-time hours and weekend days were evaluated using the measured diurnal and weekly cycles of vehicle speeds in Runeberginkatu (located 2 km south-west from Hämeentie) in 2004. The traffic data for Hämeentie for the years 2007–2009 and 2014 are summarized in Table 1. The average speeds of vehicles are clearly below the speed limit (40 km h−1) due to several junctions and frequently occurring traffic congestion. This street is one of the major routes for public transport to the centre of the city; the proportion of heavy-duty vehicles is therefore high, ranging from 29 % to 30 % annually.

The use of winter tyres (studded or non-studded) is mandatory from December to February (inclusive) by legislation in Finland. Studded tyres are allowed from November until the last day of March or until Monday 1 week after Easter if it falls on a later date. However, studded tyres can also be used outside of this period if required by the weather conditions. Studded tyres are used only on light-duty vehicles. The maximum annual share of light-duty vehicles using studded tyres during the study period was 80 %. For the year 2014, the transition from summer to winter tyres is based on the weekly counting of vehicles with studded tyres in Helsinki (REDUST, 2014). For other considered years (2007–2009), such detailed information was not available, and the winter tyre season was therefore set to last from 23 October until 30 April. The transition between winter and summer tyres is assumed to be linear over a 1-month period at the beginning and at the end of the winter tyre season.
2.1.3 Meteorological data
Meteorological data were obtained from two weather stations located in Kaisaniemi and Kumpula (Fig. 1a) at distances of 1.0 and 2.4 km from the Hämeentie site, respectively. The data include ambient temperature, relative humidity, precipitation, wind speed, wind direction, total cloud cover and global radiation. The monthly mean temperature and total precipitation values for the study period are presented in Fig. 2. In terms of the meteorological conditions relevant for suspension emissions and dispersion conditions, all the years addressed in this study can be considered typical for this climate zone.
Using meteorological data at two urban stations could result in the reduced representatives of micrometeorological processes. Particularly, small-scale rain showers could be detected at the urban meteorological stations but not at the study site (or the other way around).

Figure 2Monthly mean temperature (∘C) and total precipitation (mm) for four years, measured at the meteorological station of Kaisaniemi.
2.1.4 Road maintenance data
The total number of relevant road maintenance activities is presented in Table 2 for different years during the study period. Salting and sanding events are the most and the second most frequent ones, respectively. Street cleaning is commonly done only once per year. The approximate seasonal timing of these activities is presented in Fig. 3. Complete data for the period from October to December were available only for the year 2008. Most of the traction control measures (i.e. sanding and salting) were done in winter and early spring from January to March. Dust binding was done mostly in spring during March and April.
Information on the timing of road maintenance activities was available within an accuracy of 6 h. The estimated dry masses of sand, traction salt (NaCl) and dust binding salt (CaCl2) per application were 100, 10 and 6 g m−2, respectively.
Table 2The number of road maintenance measures in Hämeentie for four years. The number of ploughing events was computed using the NORTRIP model.
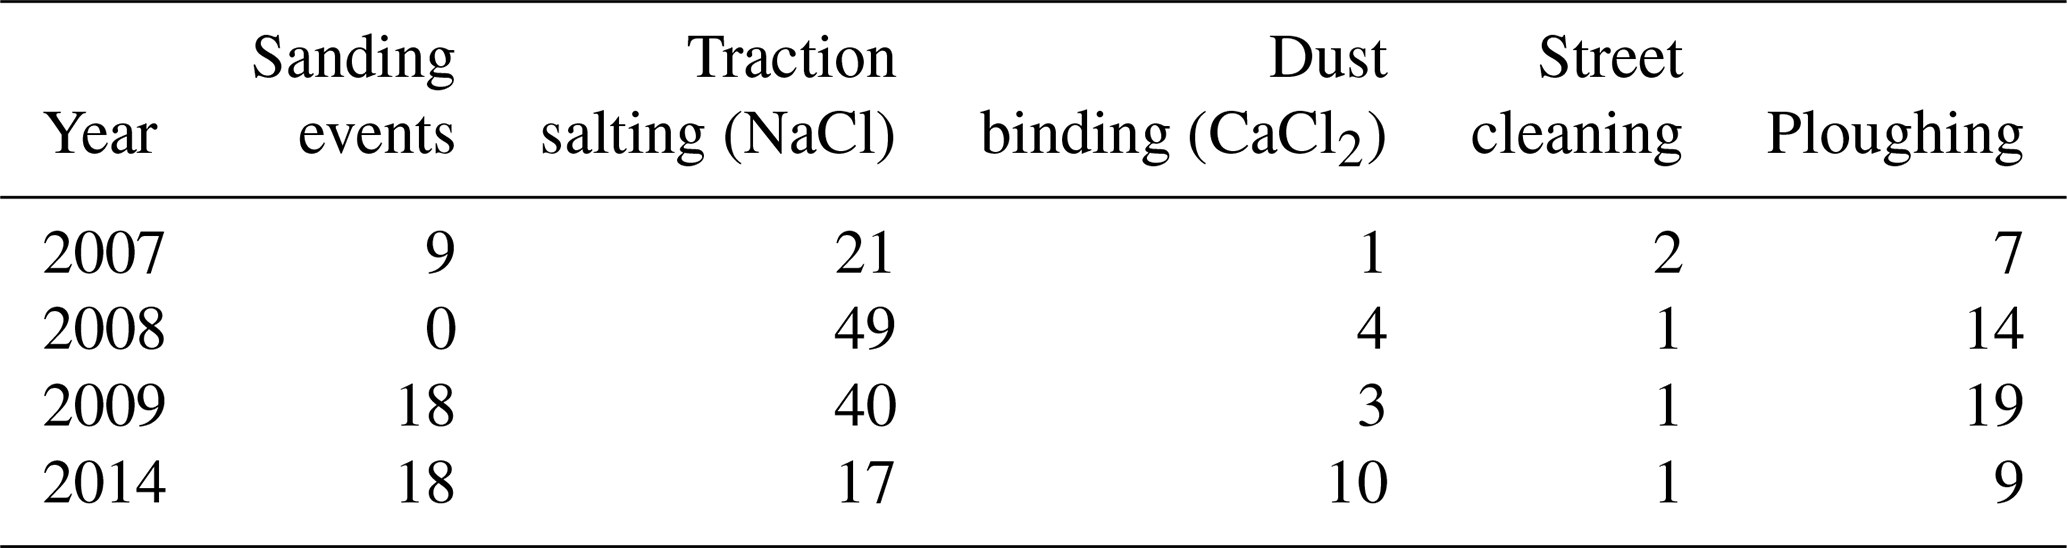
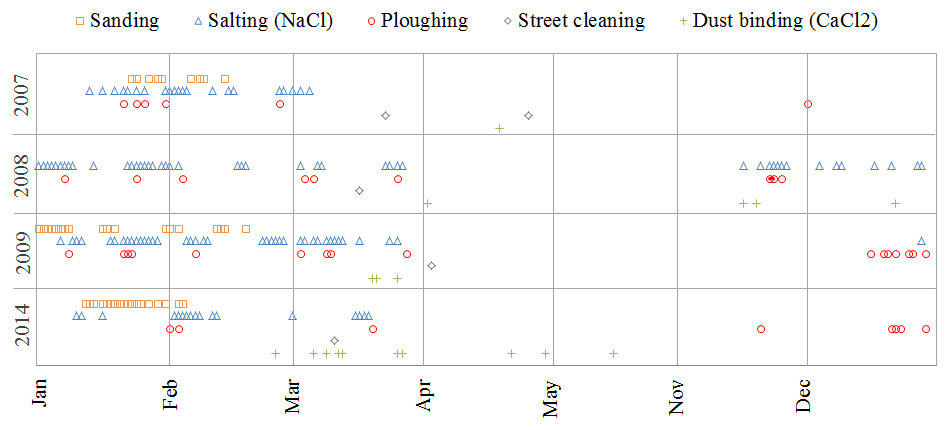
Figure 3The approximate timing of road maintenance measures at Hämeentie for four years. All the relevant information for the latter part of the year (from October to December) was available only for 2008.
2.1.5 Air quality measurements
Kerbside air quality measurements were conducted in Hämeentie in 2009 and 2014. Urban background air quality measurements were made at the station of Kallio, which is located at a distance of 700 m north-west from the Hämeentie site.
2.2 Models
2.2.1 Models for evaluating suspension emissions
Non-exhaust PM10 emissions for 2007–2009 and 2014 were computed using the NORTRIP and FORE models. A brief overview of the models' structure and their application in this study is presented in this section. The reader is referred to Denby et al. (2013a, b) (NORTRIP) and Kauhaniemi et al. (2011, 2014) (FORE) for a comprehensive description of the models and parameter definitions.
The road dust emission model NORTRIP
The NORTRIP model (NOn-exhaust Road TRaffic Induced Particle emissions) is described in Denby et al. (2013a, b) and comprises two sub-models that describe the road dust and surface moisture mass balance. Coupled, they are used to predict emissions of road dust which result from direct emissions of vehicle-related wear (road, brakes and tyre) as well as the suspension of wear products, salt and sand accumulated on the road surface.
The road dust emission calculation is based on the total wear rates and the size distributions of the different wear sources. The basis road wear rate for studded tyres is determined using the Swedish road wear model (Jacobson and Wågberg, 2007) and can be adjusted for different road surface types. The basis brake and tyre wear rates and size distributions used in this study are taken from Boulter (2005). The suspension of road dust induced by passing vehicles is accounted for in the NORTRIP model using a suspension factor. The suspension factor in NORTRIP was initially derived by optimizing the model against ambient air measurements that clearly show the decay in PM emissions at the end of the studded tyre season, as described in Denby et al. (2013a). Application of the model to many datasets since then has not indicated a need for significant changes to this suspension factor.
Table 3 shows parameters relevant for the calculation of emissions from wear and suspension for light-duty vehicles that are valid for vehicle speeds of 70 km h−1 for wear and 50 km h−1 for PM10 fraction and suspension. These speeds are significantly higher than the speeds encountered in this study, and the values are presented for reference only. Road wear and suspension are considered to be linearly dependent on vehicle speed. The wear and suspension rates for heavy-duty vehicles are assumed to be 5 and 10 times larger than those for light-duty vehicles, respectively.
Table 3Wear and suspension rates for light-duty vehicles and the fraction of wear material in the size range of PM10 used in the NORTRIP model. The reference speed is 70 km h−1 for wear and 50 km h−1 for PM10 fraction and suspension.
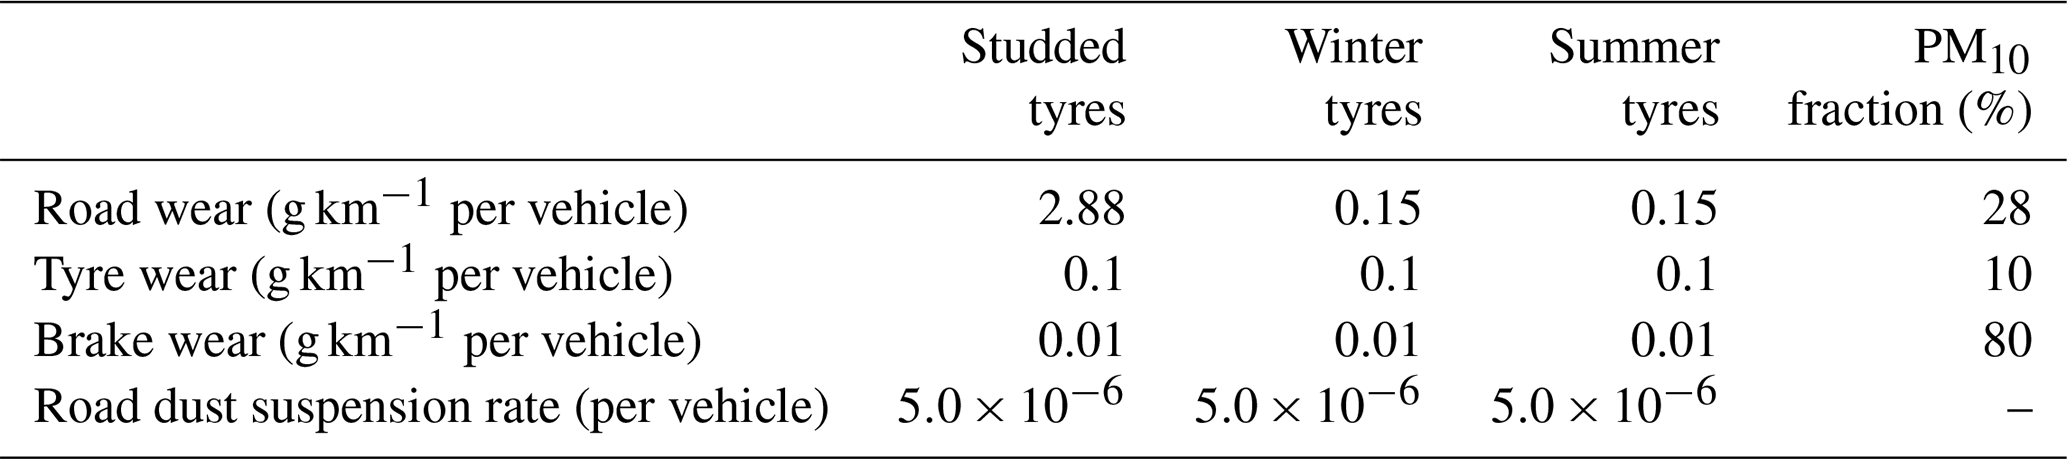
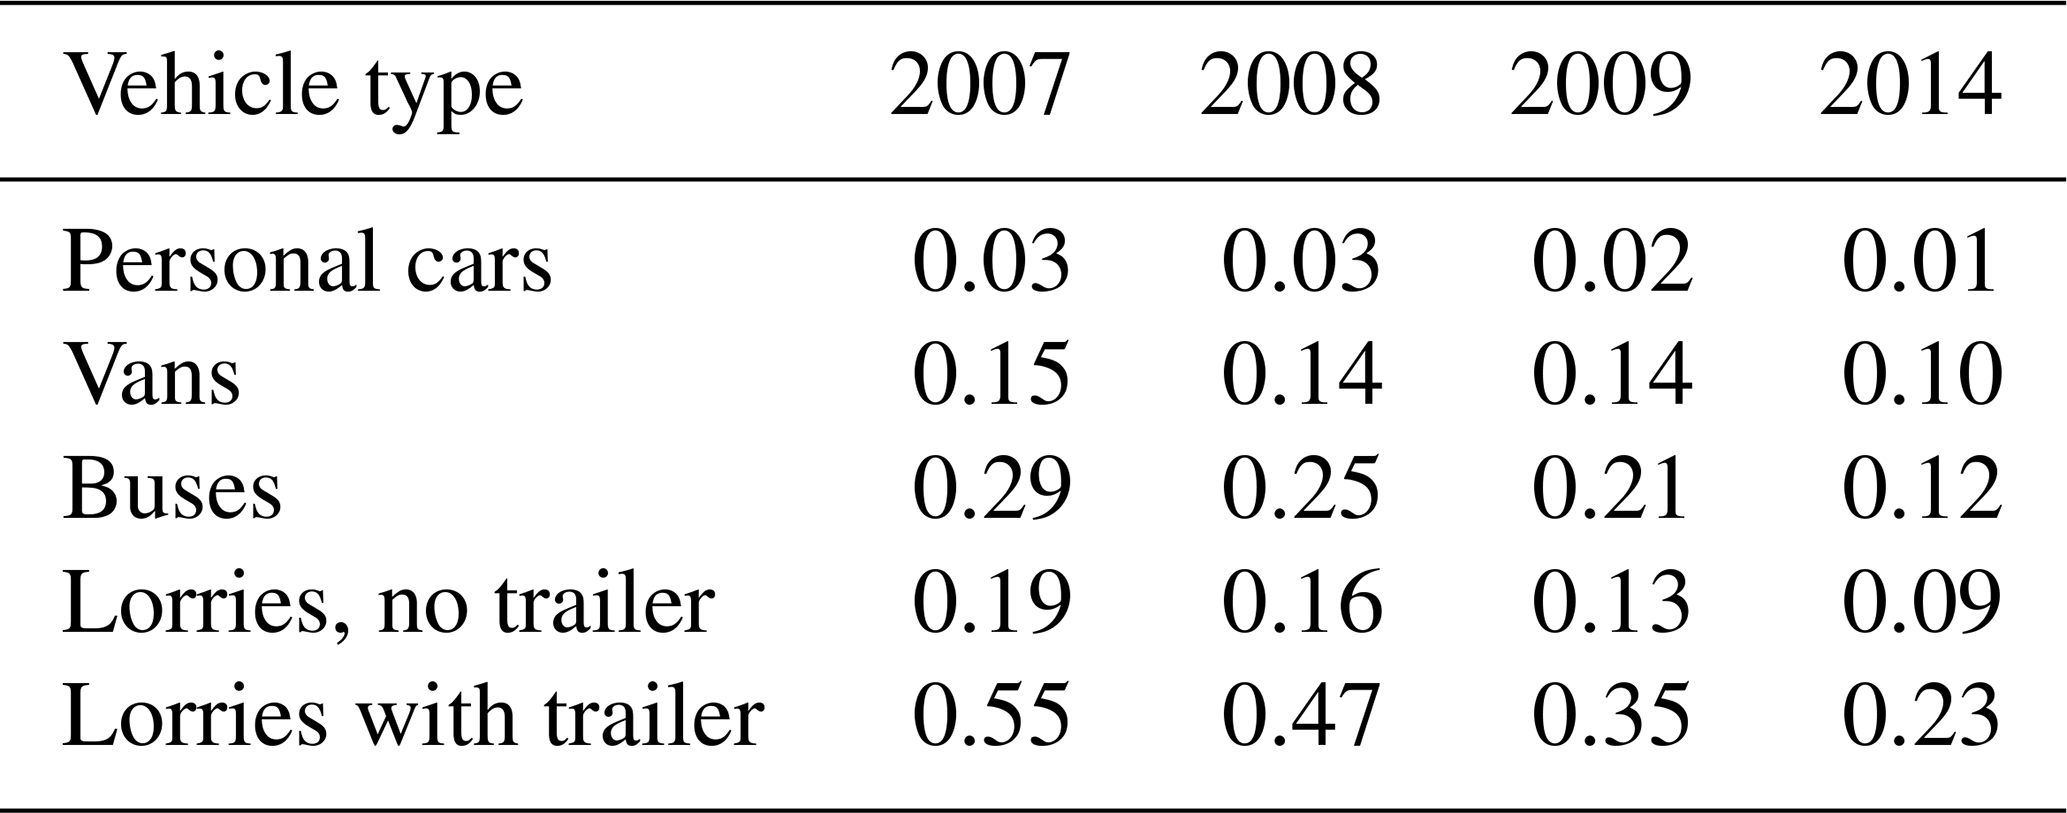
Table 4Vehicular exhaust particulate matter emission factors (g km−1 per vehicle) for four years based on the LIPASTO emission modelling system.
Surface moisture, as calculated by the surface moisture model, determines the suspension and retention of road dust and salt. Surface moisture is a product of precipitation, condensation and wetting, whereas the removal of surface moisture happens through drainage, evaporation and spray. Additionally, drainage and spray will contribute to the removal of dust and salt from the road surface. The energy balance model is used to predict condensation and evaporation from the road surface.
The NORTRIP model input data include information on street configurations, traffic data (traffic volume and composition, vehicle speed and tyre type), meteorological data (solid and liquid precipitation, wind speed, temperature, radiation, cloud cover and humidity) and road maintenance activity data.
Road maintenance activities included in the NORTRIP model are traction salting and sanding, dust binding, cleaning, and ploughing. Traction sand directly contributes to the suspendible road dust mass, depending on its particle size distribution. Size distribution measurements of traction sand used in the Helsinki metropolitan area showed that 0.4 %–2.5 % of the sanding material is in the suspendible fraction (defined as the size fraction <200 µm) (Kulovuori et al., 2019). In this study, the amount of suspendible material in sand was set equal to 2 %. Salt contributes directly to dust loading, when not in solution, and impacts the predicted surface conditions via surface vapour pressure depression, which reduces evaporation (Denby et al., 2013b). In the model, cleaning and ploughing reduce the amount of road dust and salt on the road surface with a predefined efficiency. The effect of street cleaning will depend on the method used and the initial amount of road dust available on the street surface (e.g. REDUST, 2014). In this study, the assumed removal efficiency for cleaning and ploughing is set to 1 % and 0.1 % for the non-suspendible and suspendible fraction of road dust, respectively.
The output of the model consists of hourly time series for emissions from wear sources and from salt and sand in the size fraction of PM10.
The road dust emission model FORE
The FORE model (Forecasting Of Road dust Emissions) has been developed to evaluate particulate matter emissions from road and street surfaces. It is based on the particle suspension emission model developed by Omstedt et al. (2005). The model considers emissions formed by the wear of the road surface, from traction sand and the suspension of road dust particles into the atmosphere. The model version does not address emissions caused by the wear of vehicle components (e.g. brake and tyre wear).
The use of the model requires as input hourly meteorological data (i.e. total precipitation, temperature, dew point temperature, relative humidity, wind speed, radiation and cloud cover), the roughness length, the share of studded tyres and the dates of the street sanding.
The model uses empirical reference emission factors, which have different values depending on the time of the year, the size fraction of particles (PM10 or PM2.5) and the traffic environment (urban or highway). The reference emission factor will be higher for the time of the year when sanding and studded tyres are commonly used (referred to as the “sanding period”) compared to the rest of the year (referred to as the “non-sanding period”).
We have adopted the reference emission factors evaluated for Stockholm estimated and further explained by Omstedt et al. (2005), i.e. 1200 and 200 µg per vehicle per metre, for the sanding (October–May) and non-sanding (June–September) period, respectively. The climatic conditions, studded tyre shares and procedures for using traction sand are fairly similar in Stockholm and Helsinki, although the difference in the amounts of sand and salt used can be significant.
The dust layer, which will accumulate on the street surface during wet conditions, depends on traction sanding and road wear. In the FORE model, equal contributions are assumed for the dust layers on the street originating from road wear and from traction sand. The dust layer is reduced by the suspension of particles due to airflow and by runoff due to precipitation.
The suspension of road dust particles in the air is controlled by road surface moisture, which is based on the modelling of precipitation, runoff and evaporation. The effect of terrain on wind is defined by roughness length, which is needed for the evaluation of evaporation (Omstedt et al., 2005). In the present case, the roughness length was derived from the average building height (26 m) in the studied street section. This resulted in a roughness length value of 2.6 m.
The model does not allow for the dependencies of emissions on vehicle speed and fleet composition. In the FORE model, we have used as input the studded tyre share of the whole traffic fleet of Hämeentie, including both light-duty and heavy-duty vehicles. As studded tyres are only used on light-duty vehicles at the study site, the corresponding share of studded tyres in the total traffic fleet is relatively lower. For instance, assuming that 80 %, 50 %, 30 % and 0 % of light-duty vehicles use studded tyres, the studded tyre share of the whole traffic fleet is approximately 57 %, 35 %, 21 % and 0 %, respectively.
2.2.2 Evaluation of vehicular exhaust emissions
The exhaust emission factors were obtained from the LIPASTO emission modelling system (Mäkelä, 2015). The LIPASTO emission factors are defined separately for five vehicle categories (personal cars, vans, buses, lorries without a trailer and lorries with a trailer). The dependencies of emission factors on vehicle speeds were not explicitly taken into account; however, they allow for urban driving conditions, i.e. a non-continuous driving style. The vehicular exhaust emission factors for particulate matter used in this study are presented in Table 4. As expected, the emission factors were the largest for lorries equipped with a trailer. The emission factors are an order of magnitude larger for heavy-duty vehicles and vans compared with personal cars.
2.2.3 The street canyon dispersion model OSPM
The street canyon dispersion model OSPM (Operational Street Pollution Model) is based on a combination of a Gaussian plume model and an empirical box model. For a detailed description of this model, the reader is referred to Berkowicz (2000). A brief overview of the model structure and its application in this study is presented here.
The OSPM requires as input data information on the street configuration, hourly time series of the traffic data, exhaust and non-exhaust emissions, meteorological parameters (wind speed and direction), and urban background concentrations.
The input information on the street configuration includes the geometry of the studied street segment introduced in Sect. 2.1.1. The ratio of canyon height (26 m) and width (32 m) gives an aspect ratio of 0.8. Thus, the studied street is considered a wide street canyon. The aspect ratio of the studied street is close to an ideal value in view of the performance of the OSPM; the model was developed for street canyons with an aspect ratio close to unity.
We have also taken into account the geometries of nine street crossings and two parks that are outside of the studied street segment. These so-called exceptions on canyon walls need to be considered, although they are outside of the studied street segment, as they are situated less than 200 m from the receptor points. Otherwise, the OSPM will assume that the row of buildings continues over a very large distance (Berkowicz et al., 2003). The geometries of street crossings and parks are set in the model by wind sectors and so-called building height exceptions.
Trees add porosity to a street canyon and thus have an influence on dispersion and deposition conditions. However, the OSPM does not consider any obstacles in the street canyon.
The completeness of the meteorological and background concentration data used as input for the OSPM calculations was excellent. Average data coverage for wind speed, wind direction and background concentrations was 98 %.
Traffic-induced turbulence depends in the model on traffic flow and composition (light and heavy vehicles), as well as on the traffic speed. The hourly average traffic volume and speed data were used separately as input for light-duty vehicles (i.e. passenger cars and vans) and heavy-duty vehicles (i.e. buses and lorries).
Two road dust emission models, NORTRIP and FORE, were applied to compute vehicular non-exhaust PM10 emissions that were, together with exhaust emissions, then used as input in the OSPM street canyon dispersion model to simulate street-level PM10 concentrations.
We have (i) compared predictions of the models to the measured PM10 concentrations (Sect. 3.1), (ii) evaluated key uncertainties in the road dust and dispersion modelling for the study site (Sect. 3.2), and (iii) simulated the effects of changes in studded tyre share and the impacts of traction sanding and salting on ambient air PM10 concentrations (Sect. 3.3).
For the comparison with the measured concentrations we have focused on the street increments of PM10. The measured and predicted street increments were obtained by subtracting the measured urban background concentrations from the measured and predicted concentrations in the street canyon, respectively. The effects of measures intended to reduce road dust emissions were subsequently estimated for the non-exhaust part of the street increments as a relative difference compared to the reference case. The non-exhaust street increment is a fraction of the modelled street increment PM10 concentration that originates from non-exhaust traffic-induced particle emissions. The results are presented as annual and seasonal mean values. Seasons are defined as follows: winter (1 January to 14 March), spring (15 March to 31 May), summer (1 June to 30 September) and autumn (1 October to 31 December).
3.1 Comparison of predicted and measured PM10 concentrations
Kerbside air quality measurements in Hämeentie were performed in 2009 and 2014. The total observed annual mean concentrations of PM10 were 24 and 23 µg m−3 in 2009 and 2014, respectively, and were slightly above the World Health Organization (WHO) guidelines (annual mean PM10 concentration should not exceed 20 µg m−3). The EU daily limit value (50 µg m−3) was exceeded on 16 d in 2009 and on 21 d in 2014 (Malkki et al., 2010; Malkki and Loukkola, 2015). Although the number of exceedances was below the allowed number of 35 d, elevated PM10 concentrations caused by road dust in spring can cause adverse health impacts and reduce the comfort of living. The urban background contribution to the concentrations measured at the street level in Hämeentie was substantial, i.e. 64 %, averaged over the two years with available data (2009 and 2014).
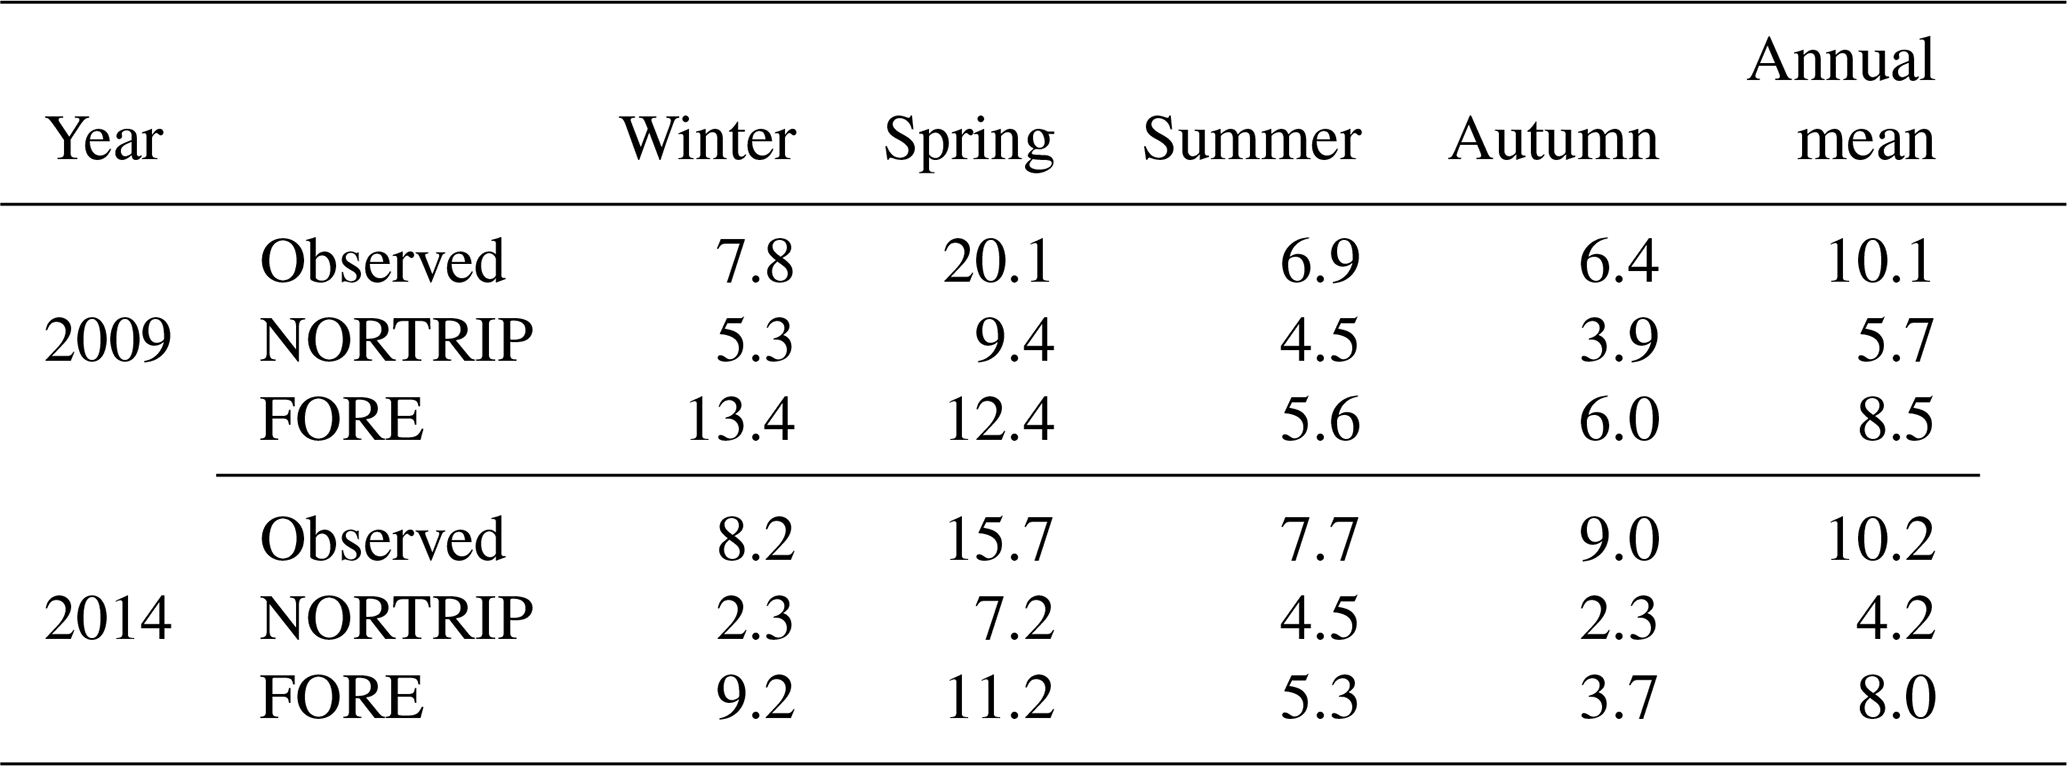
Time series of modelled and observed daily mean street increment concentrations of PM10 for the years 2009 and 2014 are presented in Fig. 4. The annual and seasonal mean values are presented in Table 5. In 2009, the observed seasonal variation was more pronounced compared with the corresponding results for 2014, as shown by the results in Fig. 4 and Table 5. The observed street increment in spring was clearly the highest for both years compared with that in the other seasons.
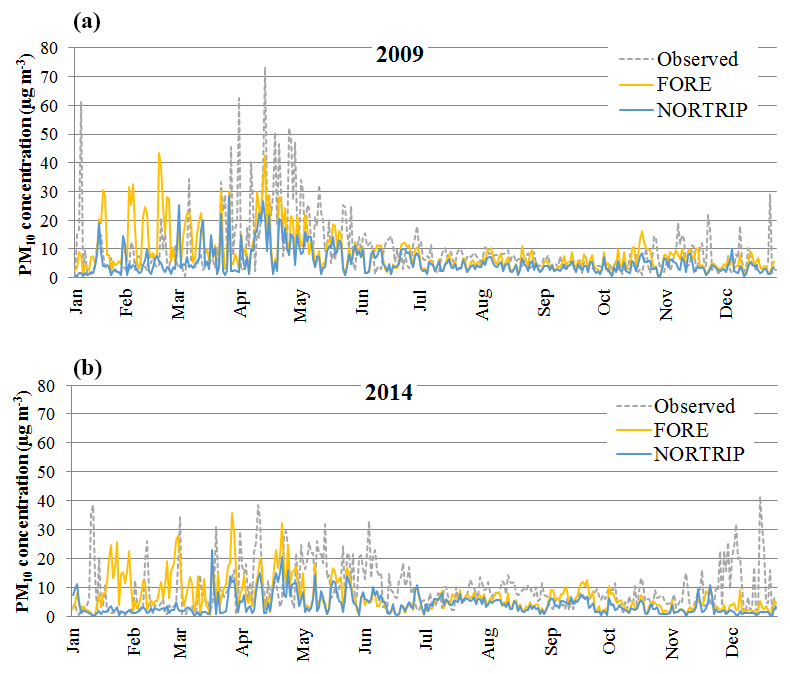
Figure 4Time series of daily mean observed and modelled street increments of PM10 for Hämeentie for 2009 (a) and 2014 (b).
Table 5Annual and seasonal mean observed and modelled street increments of PM10 (µg m−3) for Hämeentie in 2009 and 2014.
In 2009, a snow layer was formed on the street in the second half of January and lasted until the end of March. The month of April was warmer than average with less precipitation. The observed daily mean PM10 concentrations started to increase in the latter part of March and continued at a relatively high level until the end of April. Night frosts postponed the street cleaning that commonly starts in March to the beginning of April. This contributed, together with the lack of precipitation, to the existence of a prolonged road dust season.
On the other hand, the winter of 2014 was milder than average. The snow cover lasted only for a short time between January and February, and the thermal spring started early. The observed PM10 concentrations were on average substantially lower during spring compared with those in 2009, caused by both early spring cleaning procedures and fortunately timed precipitation events.
Both models can be considered to have reproduced the seasonal variability fairly well, but they under-predict the annual mean values. The street increments of PM10 predicted by the FORE model are higher than the observed values in winter and lower in spring for both years. The NORTRIP model systematically under-predicts the measured concentrations. The NORTRIP model reproduced the observed variation of the daily mean street increment concentrations reasonably well, with coefficients of determination R2 of 0.51 and 0.32 for 2009 and 2014, respectively. The corresponding correlations for the FORE model were slightly lower (R2=0.25 and 0.20 for 2009 and 2014). The correlation of the hourly mean street increment concentrations, compared with the corresponding values for the daily means, was substantially lower in the case of the NORTRIP computations (R2=0.38 and 0.25 for 2009 and 2014, respectively). This was probably due to the higher uncertainties in evaluating the hourly variation of the street surface conditions. In the case of the FORE model (R2=0.26 and 0.20 for 2009 and 2014, respectively), the daily and hourly correlations were very similar to each other. Additional results of the statistical analyses for the daily mean street increments of PM10 are presented in Appendix A.
3.2 Evaluation of the uncertainties of the modelling
There are significant uncertainties in road dust and dispersion modelling associated with the numerous model input values and parameters used for the model computations. Additionally, uncertainties that can affect the accuracy of the whole modelling system are potentially missing road dust sources or source categories. Such sources could be the migration of dust from adjoining streets, off-road sources (such as sidewalks and parking lots) and the traction sand used by trams.
We have analysed and numerically evaluated selected key uncertainties related to the application of the two road dust emission models and to the street canyon modelling for the Hämeentie site.
3.2.1 Uncertainties of the NORTRIP model
Denby et al. (2013b) previously extensively studied the sensitivity of the NORTRIP model to a wide range of input parameters and demonstrated the ability of the model to reproduce the mean concentrations of PM10 within a range of ±35 % of observations for a number of datasets. However, the results of the present study were outside of the above-mentioned range of uncertainties.
The results presented in Sect. 3.1 show that the NORTRIP model systematically under-predicts observed PM10 concentrations for Hämeentie. Road wear particles created by studded tyres dominate the road dust emissions. In the NORTRIP model, the wear rate caused by studded tyres depends on the properties of asphalt road surface (such as stone sizes and wear resistance) and vehicle speed. In this study, we have used wear rates derived for the reference road surface type (ABS16 with porphyry from Älvdalen) in the Swedish road wear model (Jacobson and Wågberg, 2007), which is one of the most wear-resistant road surfaces used in Sweden. The wear rates in the Swedish road wear model are based on laboratory and field experiments and provide an average under both prevailing dry and wet conditions. However, the influence of surface moisture, which increases wear, is not directly considered in the model calculations. Denby et al. (2013a) estimated the typical wear rates to be from 2 to 5 g km−1 per vehicle and acknowledged the significant variation of these values depending on the material used, with increased wear rates for roads with poor-quality surfaces. Hämeentie is paved with stone matrix asphalt, but further detailed information about road surface parameters was not available, which is a source of uncertainty in evaluating studded tyre wear rates.
We found that numerically doubling the studded tyre wear rate would increase the mean street increment concentrations of PM10 computed with the NORTRIP model by 34 %. This would therefore result in model predictions that would be in better agreement with the measurements. However, an increasing wear rate will not significantly affect the coefficient of determination (R2) because this parameter is a measure of correlation between modelled and measured values not a measure of bias in mean values.
The studded tyre wear rate is also assumed to be linearly dependent on vehicle speed (Denby et al., 2013a). In all previous calculations using the NORTRIP model (Denby et al., 2013b), the vehicle speeds have been higher than 40 km h−1. The dependency on vehicle speed may be non-linear for the lower traffic speeds encountered in this study (<30 km h−1) due to congestion. The NORTRIP model also does not account for the influences of congested driving conditions, in which acceleration and deceleration will likely result in increased road wear.
In summary, it is possible that an underestimation of the studded tyre wear rate in congested low-speed conditions for this particular road surface could contribute to the under-predictions by the NORTRIP model.
3.2.2 Uncertainties of the FORE model
The key parameter in the FORE model is the reference emission factor, which sets a baseline value for the predicted suspension emissions. In this study, we have used the reference emission factors estimated by Omstedt et al. (2005) based on the measurements in Hornsgatan in Stockholm. Although the climatic conditions were similar during the Hornsgatan measurement campaign and the present study, the different traffic conditions could in principle have caused differences that will be reflected in the values of the baseline emissions.
We have therefore numerically estimated how using the largest physically feasible values for reference emissions would increase the predictions of the FORE model. The base case PM10 reference emission factors for the sanding and non-sanding periods in Omstedt et al. (2005) were 1200 and 200 µg per vehicle per metre, respectively. The assumed numerical cases used higher PM10 reference emission factors for the sanding and non-sanding periods (i.e. 1500 and 300; 3200 and 400). For the assumed numerical cases, the annual mean street increment concentrations of PM10 would increase from 23 % to 118 %.
The FORE model does not address the influences of salting, street cleaning and dust binding. The suspension emissions are also, for simplicity, modelled for the whole vehicle fleet. This approach does not take into account the details of vehicle speed and the composition of the vehicle fleet.
In summary, an under-prediction of the baseline emissions could have contributed to the under-prediction of suspended PM10 concentrations found in this study. Neglecting the effects of salting, street cleaning and dust binding could cause a reduced correlation of the measured and predicted concentration values.
3.2.3 Uncertainties of the OSPM
The OSPM contains the so-called roof parameter (fRoof), which is used to relate the measured or modelled wind speed at a meteorological mast with the wind speed at roof level. The value of this parameter depends on building and roughness situations around the meteorological station. In this study, we have used a roof parameter value of 0.4, which is based on the model–measurement studies conducted in Copenhagen by Ketzel et al. (2012).
However, some other studies have suggested a higher value of 0.6 (OSPM FAQ, 28 March 2017). The numerical computations showed that using a higher value of the fRoof parameter would not improve agreement between model predictions and measurements for the Hämeentie site. The mean street increment PM10 concentration over the two years (2009 and 2014) was approximately 26 % lower using this higher value of the roof parameter compared to that with an fRoof value of 0.4.
3.3 Impact of reductions in studded tyre use and road maintenance measures
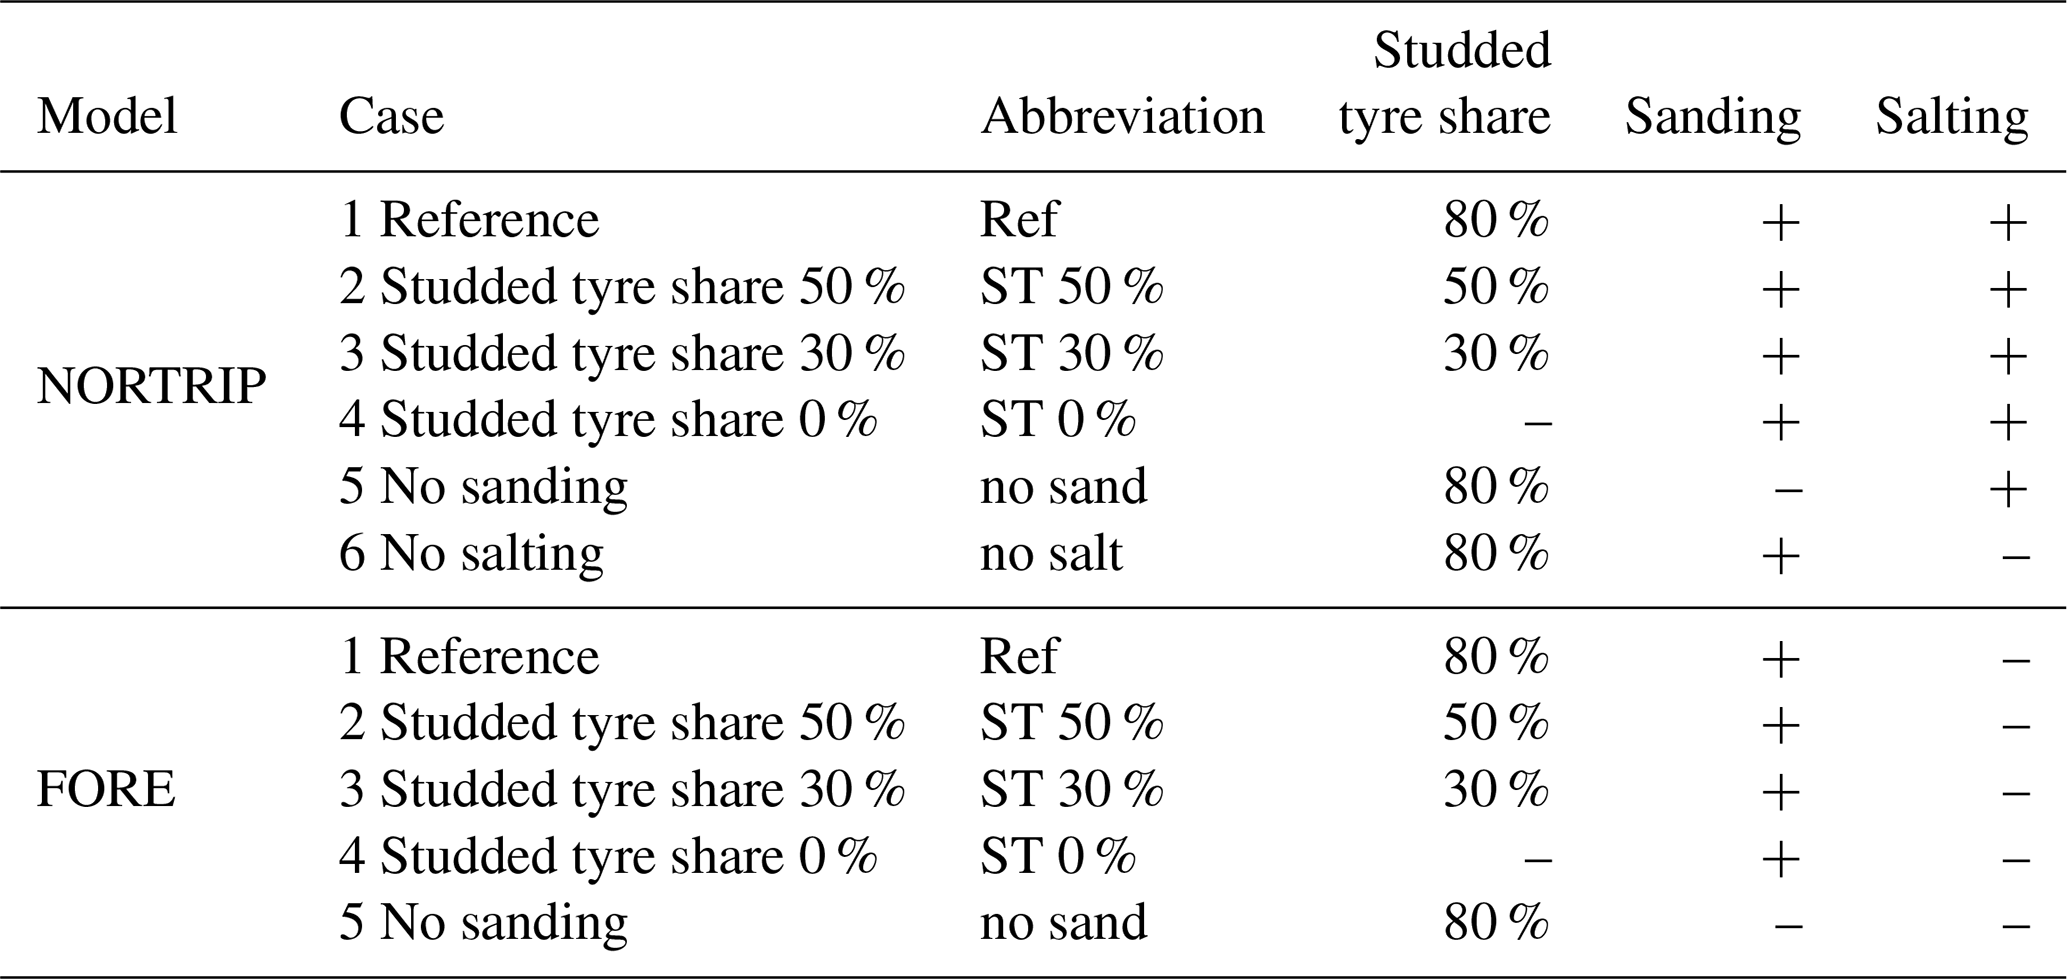
We have numerically assessed the impact of changes in selected traction control measures on the non-exhaust street increments of PM10. The selected numerical cases are presented in Table 6. In the so-called reference case, we have assumed that all reported road maintenance activities have been done, and the maximum share of light-duty vehicles using studded tyres is equal to the observed value. The maximum observed share of vehicles using studded tyres (80 %) was numerically reduced to 50 % (ST 50 %), 30 % (ST 30 %) and 0 % (no ST). We also assumed that all recorded sanding and salting events would not have been done in the “no sand” and “no salt” cases, respectively. Both road dust emission models (NORTRIP and FORE) were applied to assess the impacts of the reduced fraction of studded tyres and the impact of traction sanding. The impact of traction salt was studied only using the NORTRIP model.
Table 6The selected numerical cases with maximal shares of light-duty vehicles using studded tyres and road maintenance measures for traction control considered by the two road dust emission models. The symbol + refers to “included” and – to “not included”.
The computed changes in the modelled non-exhaust increments of PM10 relative to the reference case are presented in Fig. 5. The largest reductions of concentrations can be achieved by reducing the use of studded tyres in favour of non-studded winter tyres. For the most extreme case with no studded tyres in traffic, the average decreases in the non-exhaust street increments of PM10 over the four years were 39 % and 40 % for the NORTRIP and FORE model, respectively. In cases in which the reference maximum studded tyre share was reduced by 30 %, average decreases in modelled annual non-exhaust street increments of PM10 were 16 % (NORTRIP) and 17 % (FORE). The varying effect of the same studded tyre reduction between different years can be attributed to the changing meteorological conditions that influence suspension emissions and road dust removal processes as well as the dispersion conditions.
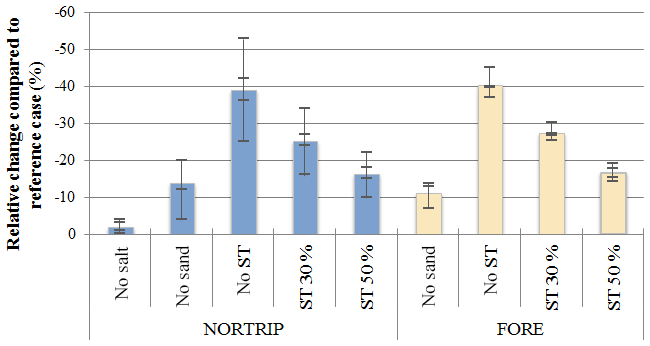
Figure 5Modelled relative changes in the non-exhaust street increment of PM10 for the cases described in Table 6, averaged over the four years (2007–2009 and 2014). Line markers show values for the individual years.
The impact of studded tyre reductions can be further enhanced by improving the quality of road surfaces. Larger aggregate sizes that are made from rocks more resistant to wear on asphalt roads or the use of alternative road surfaces can reduce PM10 emissions (Gustafsson et al., 2009; Gustafsson and Johansson, 2012).
The number of reported sanding events in Hämeentie was 9 in 2007 and 18 in 2009 and 2014 (Table 2). In the year 2008, all traction control was done by salting. All sanding events occurred during January and February. Salting was extensively used between January and March during the study period, with 17 to 49 salting events per year. The results for the “no sand” and “no salt” cases give an indication of the overall contribution of implemented sanding and salting to the non-exhaust street increments of PM10 in Hämeentie. Without taking into account reported sanding events, both road dust emission models predict similar changes in the modelled street increment concentrations averaged over the four years but with different seasonal variation. The modelled contribution of sanding to the annual mean non-exhaust street increment of PM10 ranges from 4 % to 20 %, depending on the year and the model considered. The NORTRIP model predicts the highest impact of sanding in spring months and indicates that the sanding influence extends throughout summer. The impact of sanding predicted by the FORE model is limited to winter, spring and autumn owing to the model's concept regarding sanding implementation.
Traction salt is efficiently removed from the street surfaces through drainage and vehicle spray processes, which are affected by precipitation (Denby et al., 2016). In dry conditions, traction salt can significantly contribute to PM10 concentrations. The predicted change in annual mean non-exhaust street increments of PM10 after the exclusion of reported salting events ranges from −0.1 % to −4 %.
The results demonstrate that traction sanding and salting are potentially significant sources of the road dust. However, immediate restrictions in their use could jeopardize traffic fluency and safety. Spatially and temporally optimizing the use of traction control materials can reduce the impacts of road dust on PM10 concentrations. The impact of traction sand on suspended road dust will depend on the frequency of sanding operations and the amount and quality of sanding material. The use of sanding material with high resistance to fragmentation and with removed fine particulate fractions will reduce the contribution of sanding to suspendible road dust (Tervahattu et al., 2006). From an air quality perspective, substituting sand for less dust-forming materials, such as salt, would be beneficial. However, this may not be always possible due to the prevailing weather conditions and also in areas which need to be protected from the negative environmental effects of the conventional traction salt, sodium chloride (NaCl). Alternatives to sodium chloride, such as other chlorine-based salts and organic salts, have been tested for use in sensitive groundwater areas in Finland (e.g. Hellstén et al., 2001, 2002); however, their widespread use has not been introduced.
We have conducted numerical computations regarding the effectiveness of potential measures to reduce the impact of road dust on ambient air PM10 concentrations. The selected measures included a reduction of the use of studded tyres on light-duty vehicles and a reduction of the use of traction sanding and salting. The effects of these measures were analysed for a street canyon in central Helsinki. Two road dust emission models, NORTRIP and FORE, were used in combination with the street canyon dispersion model OSPM. We have compared predictions of the modelling system with the available street canyon measurements for two years and evaluated variability and uncertainties associated with various modelling approaches. The impact of selected traction control measures was estimated for the non-exhaust street increments of PM10.
The NORTRIP model is a process-based model that describes wear processes, the traffic-induced suspension of accumulated road dust and the impact of road maintenance activities (salting, sanding, dust binding, cleaning and ploughing) on both dust load and road surface moisture. It includes dependences on vehicle speed, tyre type, vehicle category (light- and heavy-duty vehicles) and road surface properties that enable a comprehensive evaluation of road dust abatement measures. However, the model requires extensive input data that may not be available (such as road maintenance data and the properties of the road surface). This may present a challenge in the application of the NORTRIP model. On the other hand, the FORE model requires relatively fewer input data. However, it relies on the reference emission factors, which need to be computed based on local air quality measurements. The FORE model considers two road dust sources: road wear and traction sand. The model takes into account neither the dependence of emissions on vehicle speed and traffic fleet composition nor the influence of traction salting and dust control measures (i.e. dust binding and street cleaning). These factors limit the application of the FORE model for the evaluation of a wider range of measures to reduce road dust.
Both road dust emission models reproduced the seasonal variability of the concentrations of PM10 fairly well but under-predicted the annual mean values. The street increments of PM10 predicted by the FORE model tended to be higher than the observed values in winter and lower in spring, whereas the NORTRIP model systematically somewhat under-predicted the measured concentrations. The daily mean street increment concentrations predicted by NORTRIP correlated reasonably well with the measured values; the correlation was better than the corresponding one for the FORE model. An underestimation of the studded tyre wear rate in congested low-speed conditions, which are common for the Hämeentie site, could contribute to the under-predictions by the NORTRIP model. In the case of the FORE model, the main uncertainties were the underestimation of the baseline emission factor and neglecting the effect of salting, street cleaning and dust binding.
There are substantial differences in the structure and mathematical treatments of various processes in the NORTRIP and FORE models. Despite the differences, these models predicted a very similar distribution of changes in the PM10 concentrations for the studied cases.
The results demonstrate that changes in the current traction control measures can significantly reduce the impact of road dust on ambient air PM10 concentrations. The largest reductions in PM10 concentrations can be achieved by reducing studded tyre use in favour of non-studded winter tyres. For instance, in cases in which the reference maximum studded tyre share was reduced by 50 %, the average decrease in the non-exhaust street increment of PM10 was from 16 % to 34 %, depending on the model used and the year considered. However, the effectiveness of studded tyre reductions is also dependent on other factors, such as the quality of the road surfaces, vehicle speed and vehicle driving cycles. In addition, both the fluency and safety of vehicular traffic and the implementation of street maintenance measures are substantial economic issues. A reduction of the use of studded tyres would also be beneficial due to reduced costs for the repair of road surfaces.
The modelled contribution of traction sanding to the annual mean non-exhaust street increment of PM10 during the study period ranged from 4 % to 20 %. The impact of traction salting was estimated using only the NORTRIP model. Completely removing street salting reduced the non-exhaust street increment of PM10 from 1 % to 4 % on an annual level.
Based on the results, optimizing the use of traction control materials can reduce the impact of road dust on PM10 concentrations. For example, substituting sanding for less dust-forming materials, such as salt, whenever possible would reduce the amount of road dust, but this measure would not completely eliminate road dust emissions. Additionally, the contribution of sanding can further be reduced by choosing sand materials that are wear resistant and do not contain the finer grain fractions.
We have demonstrated that there is substantial potential for reducing the impact of road dust on ambient air PM10 concentrations by changing the traction control measures for both vehicles (studded tyre use) and street and road maintenance (sanding and salting). The results presented here can be used to support the development of feasible strategies for reducing high springtime particulate matter concentrations originating from road dust.
Data are available by contacting the corresponding author.
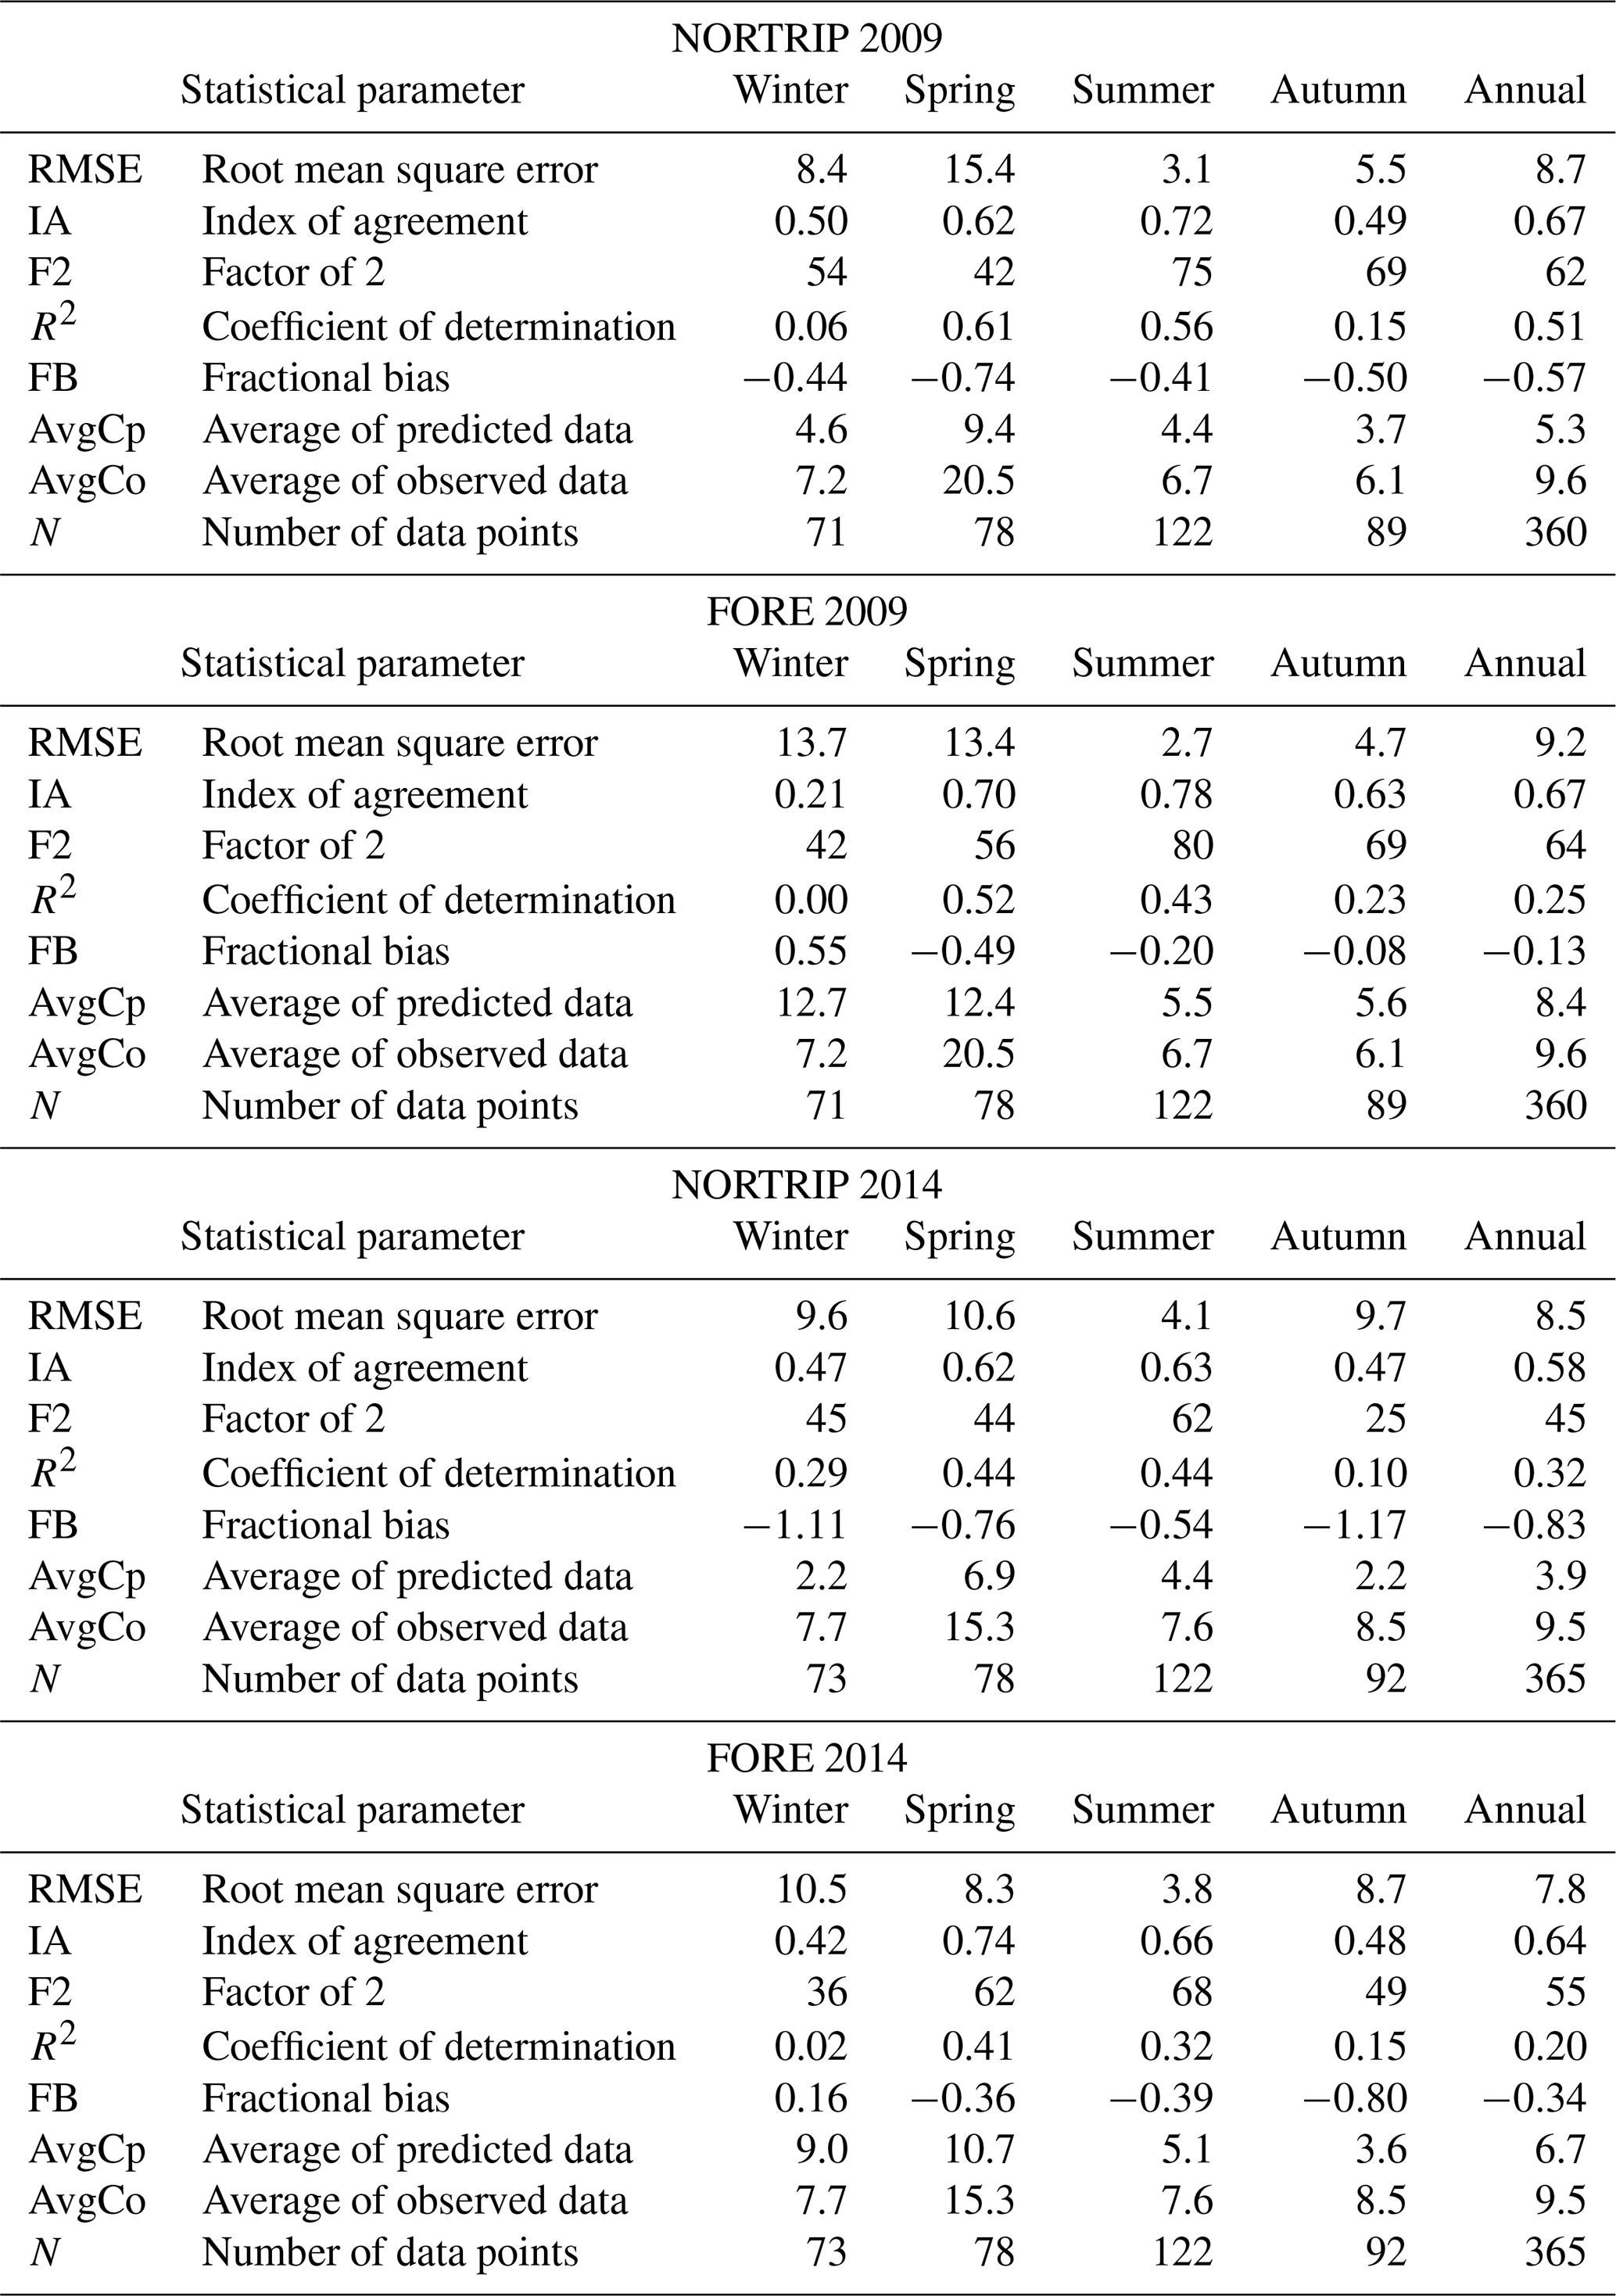
Table A1 presents the statistical values for daily mean street increment PM10 concentrations for 2009 and 2014 calculated on an annual and seasonal level. The error of both models is lowest during summer and highest for winter (FORE) or spring (NORTRIP). The RMSE indicates substantial inaccuracies in daily PM10 street increment concentrations for both models.
Table A1Statistical values for the modelled daily mean street increment of PM10 for the NORTRIP and FORE models for 2009 and 2014, calculated on an annual and seasonal level.
AS, MKa, JK and KK designed this study. AS performed NORTRIP model calculations, performed numerical analyses and wrote a first draft of the paper. MKa performed FORE and OSPM model calculations and statistical analysis. JK and MKa significantly contributed to the revision of the paper. AnK and JVN provided supporting air quality data. KK, BRD, ArK and MKe provided professional comments to improve the paper.
The authors declare that they have no conflict of interest.
This study has been a part of the research projects “Non-exhaust road traffic induced particle emissions – Evaluating the effect of mitigation measures on air quality and exposure (NORTRIP-2)”, funded by the Nordic Council of Ministers (project number KOL-1408), “Understanding the link between Air pollution and Distribution of related Health Impacts and Welfare in the Nordic countries (NordicWelfAir)”, funded by Nordforsk (project no. 75007), “Global health risks related to atmospheric composition and weather (GLORIA)”, and “Environmental impact assessment of airborne particulate matter: the effects of abatement and management strategies (BATMAN)”, funded by the Academy of Finland.
This research has been supported by the Nordic Council of Ministers (grant no. KOL-1408), NordForsk (grant no. 75007) and the Academy of Finland, Luonnontieteiden ja Tekniikan Tutkimuksen Toimikunta (grant no. 286751).
This paper was edited by Rob MacKenzie and reviewed by two anonymous referees.
Berkowicz, R.: OSPM-a parameterised street pollution model, Environ. Monit. Assess., 65, 323–331, 2000.
Berkowicz, R., Olesen, R. H., and Jensen, S. S.: User's Guide to WinOSPM Operational Street Pollution Model Draft – March 2003, NERI Technical Report, no. &&, Ministry of the Environment, National Environmental Research Institute, 2003.
Boulter, P. G.: A review of emission factors and models for road vehicle non-exhaust particulate matter, Wokingham, UK, TRL Limited, TRL Report PPR065, available at: http://uk-air.defra.gov.uk/reports/cat15/0706061624_Report1__Review_of_Emission_Factors.PDF (last access: 3 May 2019), 2005.
Denby, B. R., Sundvor, I., Johansson, C., Pirjola, L., Ketzel, M., Norman, M., Kupiainen, K., Gustafsson, M., Blomqvist, G., and Omstedt, G.: A coupled road dust and surface moisture model to predict non-exhaust road traffic induced particle emissions (NORTRIP). Part 1: road dust loading and suspension modelling, Atmos. Environ., 77, 283–300, https://doi.org/10.1016/j.atmosenv.2013.04.069, 2013a.
Denby, B. R., Sundvor, I., Johansson, C., Pirjola, L., Ketzel, M., Norman, M., Kupiainen, K., Gustafsson, M., Blomqvist, G., Kauhaniemi, M., and Omstedt, G.: A coupled road dust and surface moisture model to predict non-exhaust road traffic induced particle emissions (NORTRIP). Part 2: Surface moisture and salt impact modelling, Atmos. Environ., 81, 485–503, https://doi.org/10.1016/j.atmosenv.2013.09.003, 2013b.
Denby, B. R., Ketzel, M., Ellermann, T., Stojiljkovic, A., Kupiainen, K., Niemi, J. V., Norman, M., Johansson, C., Gustafsson, M., Blomqvist, G., Janhäll, S., and Sundvor, I.: Road Salt Emissions: A comparison of measurements and modelling using the NORTRIP road dust emission model, Atmos. Environ., 141, 508–522, https://doi.org/10.1016/j.atmosenv.2016.07.027, 2016.
EEA, Emissions of air pollutants from transport, available at: https://www.eea.europa.eu/data-and-maps/indicators/transport-emissions-of-air-pollutants-8/transport-emissions-of-air-pollutants-6 (last access: 8 May 2019), 2018.
Gustafsson, M. and Johansson, C.: Road pavements and PM10, Summary of the results of research funded by the Swedish Transport Administration on how the properties of road pavements influence emissions and the properties of wear particles, Trafikverket, Report 2012:241, available at: https://trafikverket.ineko.se/Files/sv-SE/11167/RelatedFiles/2012_241_Road_pavements_and_PM10.pdf (last access: 7 June 2019), 2012.
Gustafsson, M., Blomqvist, G., Gudmundsson, A., Dahl, A., Jonsson, P., and Swietlicki, E.: Factors influencing PM10 emissions from road pavement wear, Atmos. Environ., 43, 4699–4702, https://doi.org/10.1016/j.atmosenv.2008.04.028, 2009.
Hellstén, P. and Nystén, T.: Vaihtoehtoisten liukkaudentorjunta-aineiden kemialliset reaktiot pohjaveteen kulkeutumisessa, Helsinki, Finnish Environmental Institute, The Finnish Environment, 515, 77p., ISBN 952-11-0996-3 (PB.), ISBN 952-11-0997-1 (PDF), ISSN 1238-7312, 2001 (in Finnish, summary in English).
Hellstén, P., Nystén, T., Kokkonen, P., Valve, M., Laaksonen, T., Määttä, T., and Miettinen, I.: Vaihtoehtoisten liukkaudentorjunta-aineiden kulkeutuminen pohjaveteen. Helsinki, Finnish Environmental Institute, The Finnish Environment, 552, 63 p., ISBN 952-11-1126-7 (PB.), ISBN 952-11-1127-5 (PDF), ISSN 1238-7312, 2002 (in Finnish, summary in English).
HSY and Metropolitan Area Municipalities: Regional Land Cover Dataset: tree data, File service of open data, Helsinki Region Environmental Services Authority (HSY), available at: https://www.hsy.fi/en/experts/regional-data/Pages/default.aspx, https://kartta.hsy.fi/ (in Finnish, last access: 13 May 2019), 2014.
Jacobson, T. and Wågberg, L. G.: Developing and upgrading of a prediction model of wear caused by studded tyres and an overview of the knowledge of the factors influencing the wear – Version 3.2.03, Linköping, The Swedish National Road and Transport Research Institute, VTI notat 7-2007, available at: https://www.vti.se/en/Publications/Publication/utveckling-och-uppgradering-av-prognosmodell-for-b_670344 (last access: 3 August 2019), 2007 (in Swedish, summary in English).
Kauhaniemi, M., Kukkonen, J., Härkönen, J., Nikmo, J., Kangas, L., Omstedt, G., Ketzel, M., Kousa, A., Haakana, M., and Karppinen, A.: Evaluation of a road dust suspension model for predicting the concentrations of PM10 in a street canyon, Atmos. Environ., 45, 3646–3654, https://doi.org/10.1016/j.atmosenv.2011.04.055, 2011.
Kauhaniemi, M., Stojiljkovic, A., Pirjola, L., Karppinen, A., Härkönen, J., Kupiainen, K., Kangas, L., Aarnio, M. A., Omstedt, G., Denby, B. R., and Kukkonen, J.: Comparison of the predictions of two road dust emission models with the measurements of a mobile van, Atmos. Chem. Phys., 14, 9155–9169, https://doi.org/10.5194/acp-14-9155-2014, 2014.
Ketzel, M., Jenssen, S. S., Brandt, J., Ellermann, T., Olesen, H. R., Berkowich, R., and Hertel, O.: Evaluation of the Street Pollution Model OSPM for Measurements at 12 Streets Stations Using a Newly Developed and Freely Available Evaluation Tool, J. Civil Environ. Eng., S1:004, https://doi.org/10.4172/2165-784X.S1-004, 2012.
Kukkonen, J., Salmi, T., Saari, H., Konttinen, M., and Kartastenpää, R.: Review of urban air quality in Finland, Boreal Environ. Res., 4, 55–65, 1999.
Kukkonen, J., Kangas, L., Kauhaniemi, M., Sofiev, M., Aarnio, M., Jaakkola, J. J. K., Kousa, A., and Karppinen, A.: Modelling of the urban concentrations of PM2.5 on a high resolution for a period of 35 years, for the assessment of lifetime exposure and health effects, Atmos. Chem. Phys., 18, 8041–8064, https://doi.org/10.5194/acp-18-8041-2018, 2018.
Kulovuori, S., Ritola, R., Stojiljkovic, A., Kupiainen, K., and Malinen, A.: Katupölyn lähteet, päästövähennyskeinot ja ilmanlaatuvaikutukset – Tuloksia KALPA-tutkimushankkeesta 2015–2018, HSY publications 1/2019, available at: https://www.hsy.fi/sites/Esitteet/EsitteetKatalogi/Julkaisusarja/1-2019-katupolyn-lahteet-paastovahennyskeinot-ja (last access: 16 August 2019), 2019 (in Finnish, summary in English).
Kupiainen, K.: Road dust from pavement wear and traction sanding, Monogr. Boreal Environ. Res., 26, 50 p., 2007.
Kupiainen, K., Ritola, R., Stojiljkovic, A., Pirjola, L., Malinen, A., and Niemi, J.: Contribution of mineral dust sources to street side ambient and suspension PM10 samples, Atmos. Environ., 147, 178–189, https://doi.org/10.1016/j.atmosenv.2016.09.059, 2016.
Malkki, M. and Loukkola, K.: Ilmanlaatu pääkaupunkiseudulla vuonna 2014, HSY publications 6/2015, available at: https://www.hsy.fi/sites/Esitteet/EsitteetKatalogi/Julkaisusarja/6_2015_Ilmanlaatu_paakaupunkiseudulla_vuonna_2014.pdf (last access: 7 May 2019), 2015 (in Finnish, summary in English).
Malkki, M., Niemi, J., Lounasheimo, J., Myllynen, M., Julkunen, A., and Loukkola, K.: Ilmanlaatu pääkaupunkiseudulla vuonna 2009, HSY publications 2/2010, available at: https://www.hsy.fi/sites/Esitteet/EsitteetKatalogi/Julkaisusarja/2_2010_ilmanlaatu_paakaupunkiseudulla_vuonna2009_web.pdf (last access: 7 May 2019), 2010 (in Finnish).
Mäkelä, K.: LIPASTO. Tieliikenne kunnittaiset päästöt, Road traffic emissions for municipalities, available at: http://lipasto.vtt.fi/liisa/kunnat.htm, last access: 30 October 2015 (in Finnish).
MML: Land scanning data, File service of open data, National Land Survey of Finland, available at: http://www.maanmittauslaitos.fi/en, last access: 7 November 2012.
Omstedt, G., Bringfelt, B., and Johansson, C.: A model for vehicle-induced non-tailpipe emissions of particles along Swedish roads, Atmos. Environ., 39, 6088–6097, https://doi.org/10.1016/j.atmosenv.2005.06.037, 2005.
OSPM FAQ: available at: http://envs.au.dk/en/knowledge/air/models/ospm/faq/, last access: 28 March 2017.
REDUST: Demonstration test final report: Main results and conclusions, Deliverable product of the REDUST LIFE+ project Actions 1 and 2, http://www.ymk-projektit.fi/redust//files/2015/02/REDUST-Action-1-2-final-report.pdf, last access: 15 October 2014.
Tele Atlas NV: Mapinfo, StreetPro, Pitney Bowes Software Limited, United Kingdom, 2012.
Tervahattu, H., Kupiainen, K. J., Räisänen, M., Mäkelä, T., and Hillamo, R.: Generation of Urban Road Dust from Anti-Skid and Asphalt Concrete Aggregates, J. Hazard. Mater., 132, 30–46, https://doi.org/10.1016/j.jhazmat.2005.11.084, 2006.
- Abstract
- Introduction
- Materials and methods
- Results and discussion
- Conclusions
- Data availability
- Appendix A: Results of the statistical analyses for daily mean street increments of PM10 for Hämeentie in 2009 and 2014
- Author contributions
- Competing interests
- Acknowledgements
- Financial support
- Review statement
- References