the Creative Commons Attribution 4.0 License.
the Creative Commons Attribution 4.0 License.
 | 03 Sep 2019
New estimate of particulate emissions from Indonesian peat fires in 2015
Laura Kiely
Dominick V. Spracklen
Christine Wiedinmyer
Luke Conibear
Carly L. Reddington
Scott Archer-Nicholls
Douglas Lowe
Stephen R. Arnold
Christoph Knote
Md Firoz Khan
Mohd Talib Latif
Mikinori Kuwata
Sri Hapsari Budisulistiorini
Lailan Syaufina
Indonesia contains large areas of peatland that have been drained and cleared of natural vegetation, making them susceptible to burning. Peat fires emit considerable amounts of carbon dioxide, particulate matter (PM) and other trace gases, contributing to climate change and causing regional air pollution. However, emissions from peat fires are uncertain, due to uncertainties in emission factors and fuel consumption. We used the Weather Research and Forecasting model with chemistry and measurements of PM concentrations to constrain PM emissions from Indonesian fires during 2015, one of the largest fire seasons in recent decades. We estimate primary PM2.5 (particles with diameters less than 2.5 µm) emissions from fires across Sumatra and Borneo during September–October 2015 were 7.33 Tg, a factor 3.5 greater than those in the Fire Inventory from NCAR (FINNv1.5), which does not include peat burning. We estimate similar dry fuel consumption and CO2 emissions to those in the Global Fire Emissions Database (GFED4s, including small fires) but PM2.5 emissions that are a factor of 1.8 greater, due to updated PM2.5 emission factors for Indonesian peat. Fires were responsible for an additional 3.12 Tg of secondary organic aerosol formation. Through comparing simulated and measured PM concentrations, our work provides independent support of these updated emission factors. We estimate peat burning contributed 71 % of total primary PM2.5 emissions from fires in Indonesia during September–October 2015. We show that using satellite-retrieved soil moisture to modify the assumed depth of peat burn improves the simulation of PM, increasing the correlation between simulated and observed PM from 0.48 to 0.56. Overall, our work suggests that peat fires in Indonesia produce substantially greater PM emissions than estimated in current emission inventories, with implications for the predicted air quality impacts of peat burning.
- Article
(1107 KB) - Full-text XML
-
Supplement
(857 KB) - BibTeX
- EndNote


Vegetation and peatland fires across Indonesia and Malaysia result in habitat and biodiversity loss, large emissions of carbon and regional haze episodes. Fire events cause regional reductions in visibility and severe air pollution (Reddington et al., 2014; Gaveau et al., 2014b; Kim et al., 2015; Lee et al., 2017) with associated morbidity and mortality (Crippa et al., 2016; Marlier et al., 2012; Reddington et al., 2015).
Indonesia contains 36 % of the worlds tropical peatland, the largest of any country in the tropics (Dargie et al., 2017; Page et al., 2011). Undisturbed peatlands typically have high moisture content, making them naturally resilient to fire (Wösten et al., 2008). Indonesian peatlands are experiencing deforestation and conversion to agriculture, oil palm and timber plantations (Hansen et al., 2013; Gaveau et al., 2014a; Miettinen et al., 2017). During this conversion, drainage canals are installed, lowering the water table and making the peatland more susceptible to burning (Konecny et al., 2016). Fire is also used as an agricultural tool to clear vegetation (Carlson et al., 2012; Page et al., 2002). These human disturbances can make peatlands particularly prone to fire. In 2015, 53 % of fires in Indonesia occurred on peatland, which made up only 12 % of the land area (Miettinen et al., 2017).
Peatlands have thick organic soil layers up to 10 m deep (Hu et al., 2018). Fires on peatland can burn into these underground organic layers and smoulder for weeks after the surface fire has gone out (Roulston et al., 2018), resulting in substantially greater emissions compared to surface vegetation fires (Heil et al., 2007). Peat fires are estimated to contribute 3.7 % of global fire carbon emissions (van der Werf et al., 2017). In Indonesia, peatland fires are the largest contributor to fire emissions in the region (Reddington et al., 2014; van der Werf et al., 2010). For the fires in 2015, Wooster et al. (2018) found that 95 % of the particulate matter (PM2.5) emissions came from peatland fires, and Wiggins et al. (2018) estimated that 85 % of smoke plumes detected in Singapore originated from peat fires.
Whilst it is known that emissions from peatland fires are substantial, current emissions estimates have large uncertainties. Emission estimates are typically based on remotely sensed information from satellites on the area burned by the fires. Burned area may be underestimated in Southeast Asia due to extensive cloud cover (Ge et al., 2014). Furthermore, estimates of burned area are limited to surface fires and may miss fires that burn underground (Kaiser et al., 2012). For peat fires, the amount of biomass consumed by the fire depends on how deep into the peat the fire burns (Hu et al., 2018). Burn depth is variable, with some fires recorded as burning to a depth of 0.85 m, resulting in carbon emissions of 31.5 kg C m−2 (Page et al., 2002). Burn depth depends on the level of the water table and the water content of the peat, with increased burn depth when the water table is lowered and the peat dries out (Ballhorn et al., 2009; Huang and Rein, 2015; Rein et al., 2008). Konecny et al. (2016) also suggest that burn depth changes based on the frequency of fire, with reduced burn depth for repeat fires at the same location. Information on the spatial and temporal variability of burn depth is limited and current emission inventories make broad assumptions regarding these parameters. Emission factors (EFs), estimated from field or laboratory measurements, are used to convert mass of fuel consumed by the fire to the emitted mass of gas-phase and particulate pollutants (e.g. Andreae and Merlet, 2001; Akagi et al., 2011). Compared to flaming combustion, smouldering peat fires have colder combustion temperatures and typically higher EFs for products of incomplete combustion including CO, CH4, CO2, HCN, NH3 and particulate matter (PM; Stockwell et al., 2016). Until recently, there have been few specific measurements of EFs for tropical peat fires. Roulston et al. (2018) and Wooster et al. (2018) found that EFs for tropical peat fires could be underestimated by a factor of three (PM2.5 EF from peat fires is assumed to be 9.1 g kg−1 in the Global Fire Emissions Database (GFED4), compared to 24 g kg−1 suggested by Roulston et al., 2018, and 28 g kg−1 suggested by Wooster et al., 2018). There are large variations in EFs for peat in Indonesia. In one study measuring emissions from peat fires in central Kalimantan during 7 d in 2015, PM2.5 EFs were found to vary between 6 and 30 g kg−1 (Jayarathne et al., 2018). Kuwata et al. (2018) used measurements from Indonesian peatland fires to estimate EFs of PM10 of 13±2 g kg−1 in 2013 and 19±2 g kg−1 in 2014.
These uncertainties cause corresponding uncertainty in estimates of emissions from peat fires and impacts on the regional air pollution. Previous studies underestimate measured and aerosol optical depth (AOD) or PM and scale particulate fire emissions from global fire emissions inventories or simulated fire-derived aerosol by a factor of 1.36–3.00 in order to match observations (Johnston et al., 2012; Koplitz et al., 2016; Marlier et al., 2012; Reddington et al., 2016; Tosca et al., 2013; Ward et al., 2012). This suggests that particulate emissions from tropical peatland regions are underestimated in current fire emission inventories.
Severe fire events in Indonesia occur during periods of drought (van der Werf et al., 2008; Tosca et al., 2011; Gaveau et al., 2014b; Field et al., 2016), resulting in strong seasonal and interannual variability. Severe droughts lower the water table, exposing more peat and increasing susceptibility to burning. Extensive fires and regional haze episodes across Indonesia occurred in 1982–1983, 1997–1998, 2006, 2009, 2013 and 2015. During September–October 2015, dry conditions caused by a strong El Niño resulted in large fires across Sumatra and Kalimantan. This fire episode was the largest in Indonesia since 1997 (Huijnen et al., 2016), releasing an estimated 188±67 Tg C (Huijnen et al., 2016) as CO2 and 149±71 Tg C from peat fires (Jayarathne et al., 2018). The fires also emitted substantial amounts of PM2.5, estimated at 9.1±3.2 Tg (Wooster et al., 2018), with 6.5±5.5 Tg from peat fires (Jayarathne et al., 2018). Particulate air pollution from these fires may have caused between 6513 and 17 270 excess premature deaths through short-term exposure to fire-sourced PM2.5 (Crippa et al., 2016) and as many as 100 300 excess premature deaths over the longer term due to exposure to this pollution (Koplitz et al., 2016).
Given the importance of peatland fires as the main contributor to fire emissions in Indonesia, there is a high priority in reducing the large uncertainties in these emissions. In this study we aim to improve our understanding of the emissions from peat fires in Indonesia by combining fire emission inventories, a regional air quality model and extensive measurements of PM. We focus on the large fires of September–October 2015. We updated an existing fire emissions inventory to include emissions from peat fires, applying updated information on emission factors from tropical peat combustion and using satellite-retrieved information on soil moisture to control assumed depth of peat burn. We used the existing and new emissions inventories with an air quality model and evaluated simulated PM concentrations against observations. The new emissions inventory demonstrates a substantial improvement in simulating regional PM2.5 concentrations.
We used a regional atmospheric model to simulate PM concentrations during August–October 2015, with different combinations of peat and vegetation fire emissions, described below. Our study region included Borneo, Sumatra and mainland Malaysia (Fig. 1, 10∘ S–10∘ N and 95–120∘ E), which is at the centre of the model domain. We used surface observations of PM and AOD to assess the performance of the model with the different fire emissions. Atmospheric PM concentrations are impacted by a range of atmospheric processes, including atmospheric transport and deposition and secondary production of aerosol. Evaluating the fire emissions is complicated by the treatment of these processes in the model.
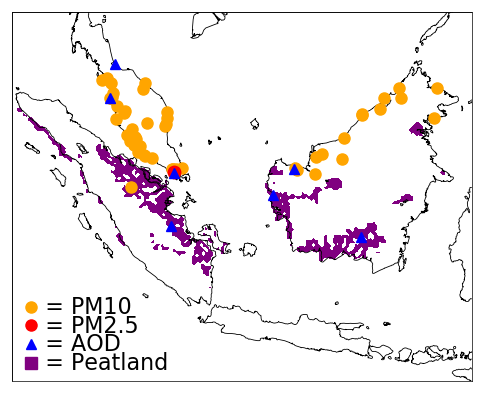
Figure 1The study area showing the locations of PM10 measurements in yellow circles, PM2.5 in red circles and AOD in blue triangles. Peatland is shown in purple.
2.1 WRF-chem model
We used the Weather Research and Forecasting model with Chemistry (WRF-chem), version 3.7.1. WRF-chem simulates gas-phase chemistry and aerosol processes fully coupled to the meteorology (Grell et al., 2005). The model was run at 30 km horizontal resolution with 33 vertical levels over 140×140 grid points centred at 0∘ N, 110∘ E (17∘ S–18∘ N, 90–130∘ E), using the Mercator projection. Simulations were run over the period from 18 July until 1 November. The MOZART (Model for Ozone and Related Chemical Tracers, version 4; Emmons et al., 2010) chemistry scheme was used to calculate gas-phase chemical reactions, with aerosol dynamics and processes represented by MOSAIC (Model for Simulating Aerosol Interactions and Chemistry; Zaveri et al., 2008; Hodzic and Knote, 2014). This includes a secondary organic aerosol (SOA) scheme based on Hodzic and Jimenez (2011). Primary organic aerosols (POAs) are considered non-volatile in the model. Within MOSAIC, four aerosol bin sizes were used: 0.039–0.156, 0.156–0.625, 0.625–2.5 and 2.5–10 µm. Anthropogenic emissions were from EDGAR-HTAP2 (Janssens-Maenhout et al., 2015) for 2010, and biogenic emissions were from MEGAN (Model of Emissions of Gases and Aerosols from Nature; Guenther et al., 2006). A similar model setup has been used for studies in India (Conibear et al., 2018), the United States (Knote et al., 2014) and Indonesia (Crippa et al., 2016). The meteorology was re-initialized each month with NCEP GFS (NCEP, 2007), with a 24 h spin-up, and was then free running for the rest of the month. More information on the chemistry and physics options used can be found in Table S1 in the Supplement.
2.2 Fire emissions
We applied four different emission inventories in the WRF-chem model, all based on the Fire Inventory from NCAR (FINNv1.5). All emission inventories included emissions from vegetation fires as treated in FINNv1.5 but with different treatment of peat combustion, as described below.
-
FINN (FINN).
The Fire Inventory from NCAR (FINNv1.5) combines data on active fires, biomass burned and EFs to give daily fire emissions at 1 km resolution (Wiedinmyer et al., 2011). Vegetation burned is assigned based on the MODIS Land Cover Type and Vegetation Continuous Field (VCF) products. Fire area burned is assumed to be 1 km2 (100 ha) per hotspot detected (scaled back by any non-vegetated area assigned by the VCF product). Fuel loading is from Hoelzemann et al. (2004) and EFs are from Akagi et al. (2011), Andreae and Merlet (2001), and McMeeking et al. (2009). FINNv1.5 includes emissions from combustion of above-ground vegetation but does not include emissions from combustion of peat.
-
FINN with GFED4s peat (FINN+GFEDpeat).
In this inventory we combined vegetation emissions from FINNv1.5 with emissions from peat fires from the Global Fire Emissions Database (version 4, including small fires; GFED4s). GFED combines burned area from Giglio et al. (2013) with assumed combustion completeness and EFs. For peat fires the depth burned is dependent on the soil moisture, with a maximum depth of 0.5 m. GFED4s peat EFs come from studies on Indonesian peat fires for CO2, CO and CH4 and from deforestation fires for all other species.
GFED4s data are available daily at 0.25∘ resolution. GFED emissions are available split by fuel type, allowing us to combine GFED4s emissions from peat fires with FINN emissions from other fuel types.
-
FINN with peat emissions (FINNpeat).
We created a new emissions inventory (FINNpeat), based on FINNv1.5 emissions with the addition of emissions from combustion of peat. Emissions from vegetation fires in FINNpeat are identical to those in FINN. For those fire detections occurring on peat, as identified using a peatland distribution map (WRI), additional emissions from the peat burning were calculated using Eq. (1):
where Es is the emissions of a species, s, from a fire, BA is the burned area and BD is the burn depth for the fire, ρ is the peat density, and EFs is the emissions factor for species, s. The peatland map only includes peatlands in Indonesia, so emissions from Malaysian peat fires are not included. For each fire, the corresponding emissions are released on the day that the fire was detected, with no long-term smouldering effects, which may be important for peat fires.
Tansey et al. (2008) used an analysis of MODIS hotspots and MODIS burned area in a peat swamp in Indonesia to estimate 15–16 ha of burned area per hotspot. However, 60 % of burned areas did not have an identified hotspot, implying an area burned per MODIS hotspot of approximately 40 ha. Over areas defined as peatland, we therefore assumed a burned area of 40 ha of peat burnt per hot spot, smaller than the 100 ha assumed for vegetation fires.
The mass of peat burned during peat fires was calculated from an assigned burned area, peat density and burn depth (Table 1). We assumed a peat density of 0.11 g cm−3 (Driessen and Rochimah, 1976; Neuzil, 1997; Shimada et al., 2001; Warren et al., 2012) and a burn depth of 37 cm for all fires detected (Page et al., 2002; Usup et al., 2004; Ballhorn et al., 2009). We assumed that all peat within the burned area and depth is combusted, as is assumed in GFED3 (van der Werf et al., 2006). This gives a fuel consumption of 40.7 kg dry matter m−2, consistent with van Leeuwen et al. (2014), who found the average fuel consumption for Indonesian peatland fire to be 31.4 kg dry matter m−2 (from studies by Page et al., 2002; Usup et al., 2004; Ballhorn et al., 2009).
We assigned the average EFs from previous studies (Table 2) (Christian et al., 2003; Hatch et al., 2015; Stockwell et al., 2016; Wooster et al., 2018; Jayarathne et al., 2018; Nara et al., 2017; Smith et al., 2018): CO2 (1670 g kg−1), PM2.5 (22.3 g kg−1), organic carbon (OC) (11.5 g kg−1) and black carbon (BC) (0.07 g kg−1). By comparison, GFED4s assumes similar EFs for CO2 (1703 g kg−1) and BC (0.04 g kg−1) but substantially lower EFs for PM2.5 (9.1 g kg−1) and OC (6.02 g kg−1). Some of the EFs used have been calculated from fires on peatland that also contain vegetation burning.
The variation in measured EFs vary widely depending on the emitted pollutant, 20 % for CO2 (1507–1775 g kg−1), a factor 2–3 for PM2.5 (17.3–28.0 g kg−1) and OC (6.02–16.0 g kg−1) and an order of magnitude for BC (0.006–0.134 g kg−1). The EFs used by Wooster et al. (2018) for PM2.5 and CO2 are at the upper end of the ranges of EFs considered for this study. Substantial uncertainty in BC emissions has implications for the climate impacts of the aerosol, but since BC only makes a minor contribution to overall mass it has less importance for simulation of PM2.5.
-
FINN new peat with soil moisture (FINNpeatSM).
As peat dries out, the burn depth increases (Rein et al., 2008; Usup et al., 2004; Wösten et al., 2008). However, FINNpeat assumes a constant peat burn of 37 cm depth regardless of soil moisture. FINNpeatSM emissions were calculated in the same way as FINNpeat emissions but with peat burn depth varying depending on surface soil moisture.
Daily soil moisture from the European Space Agency (ESA CCI SMv04.4) was used to estimate the burn depth of peat (Dorigo et al., 2017; Gruber et al., 2017; Liu et al., 2012). Frequent cloud cover leads to numerous missing values in the daily soil moisture data at 0.25∘ resolution. To help account for this, soil moisture was averaged to 2∘ resolution. In 2015, average daily soil moisture across peatlands in the study area declined from around 0.24 m3 m−3 in August, to 0.23 m3 m−3 in September to a minimum of around 0.22 m3 m−3 in October 2015, then increasing to 0.25 m3 m−3 in November (Fig. S1). By comparing the temporal change in soil moisture over high fire regions in Sumatra and Kalimantan, we chose upper and lower limits of 0.25 and 0.15 m3m−3, which reflected the soil moisture in these regions before and during the dry season (Fig. S2).
We scaled burn depth linearly from a minimum of 5 cm for a soil moisture of 0.25 m3 m−3 to a maximum of 37 cm for soil moisture of 0.15 m3 m−3. Under these assumptions, mean peat burn depth across peatland areas in Indonesia increased from 15.0 cm in August to 23.6 cm in September and 24.8 cm in October.
The PM2.5 EF used for FINNpeat and FINNpeatSM is at the higher end of the range of values used in other studies. The same emissions combined with a lower EF would require a greater burn depth or area burned per fire hotspot.
Table 1Values for peat burn depth and peat density found in previous studies and the average value across studies. All studies were based in Kalimantan, Indonesia.
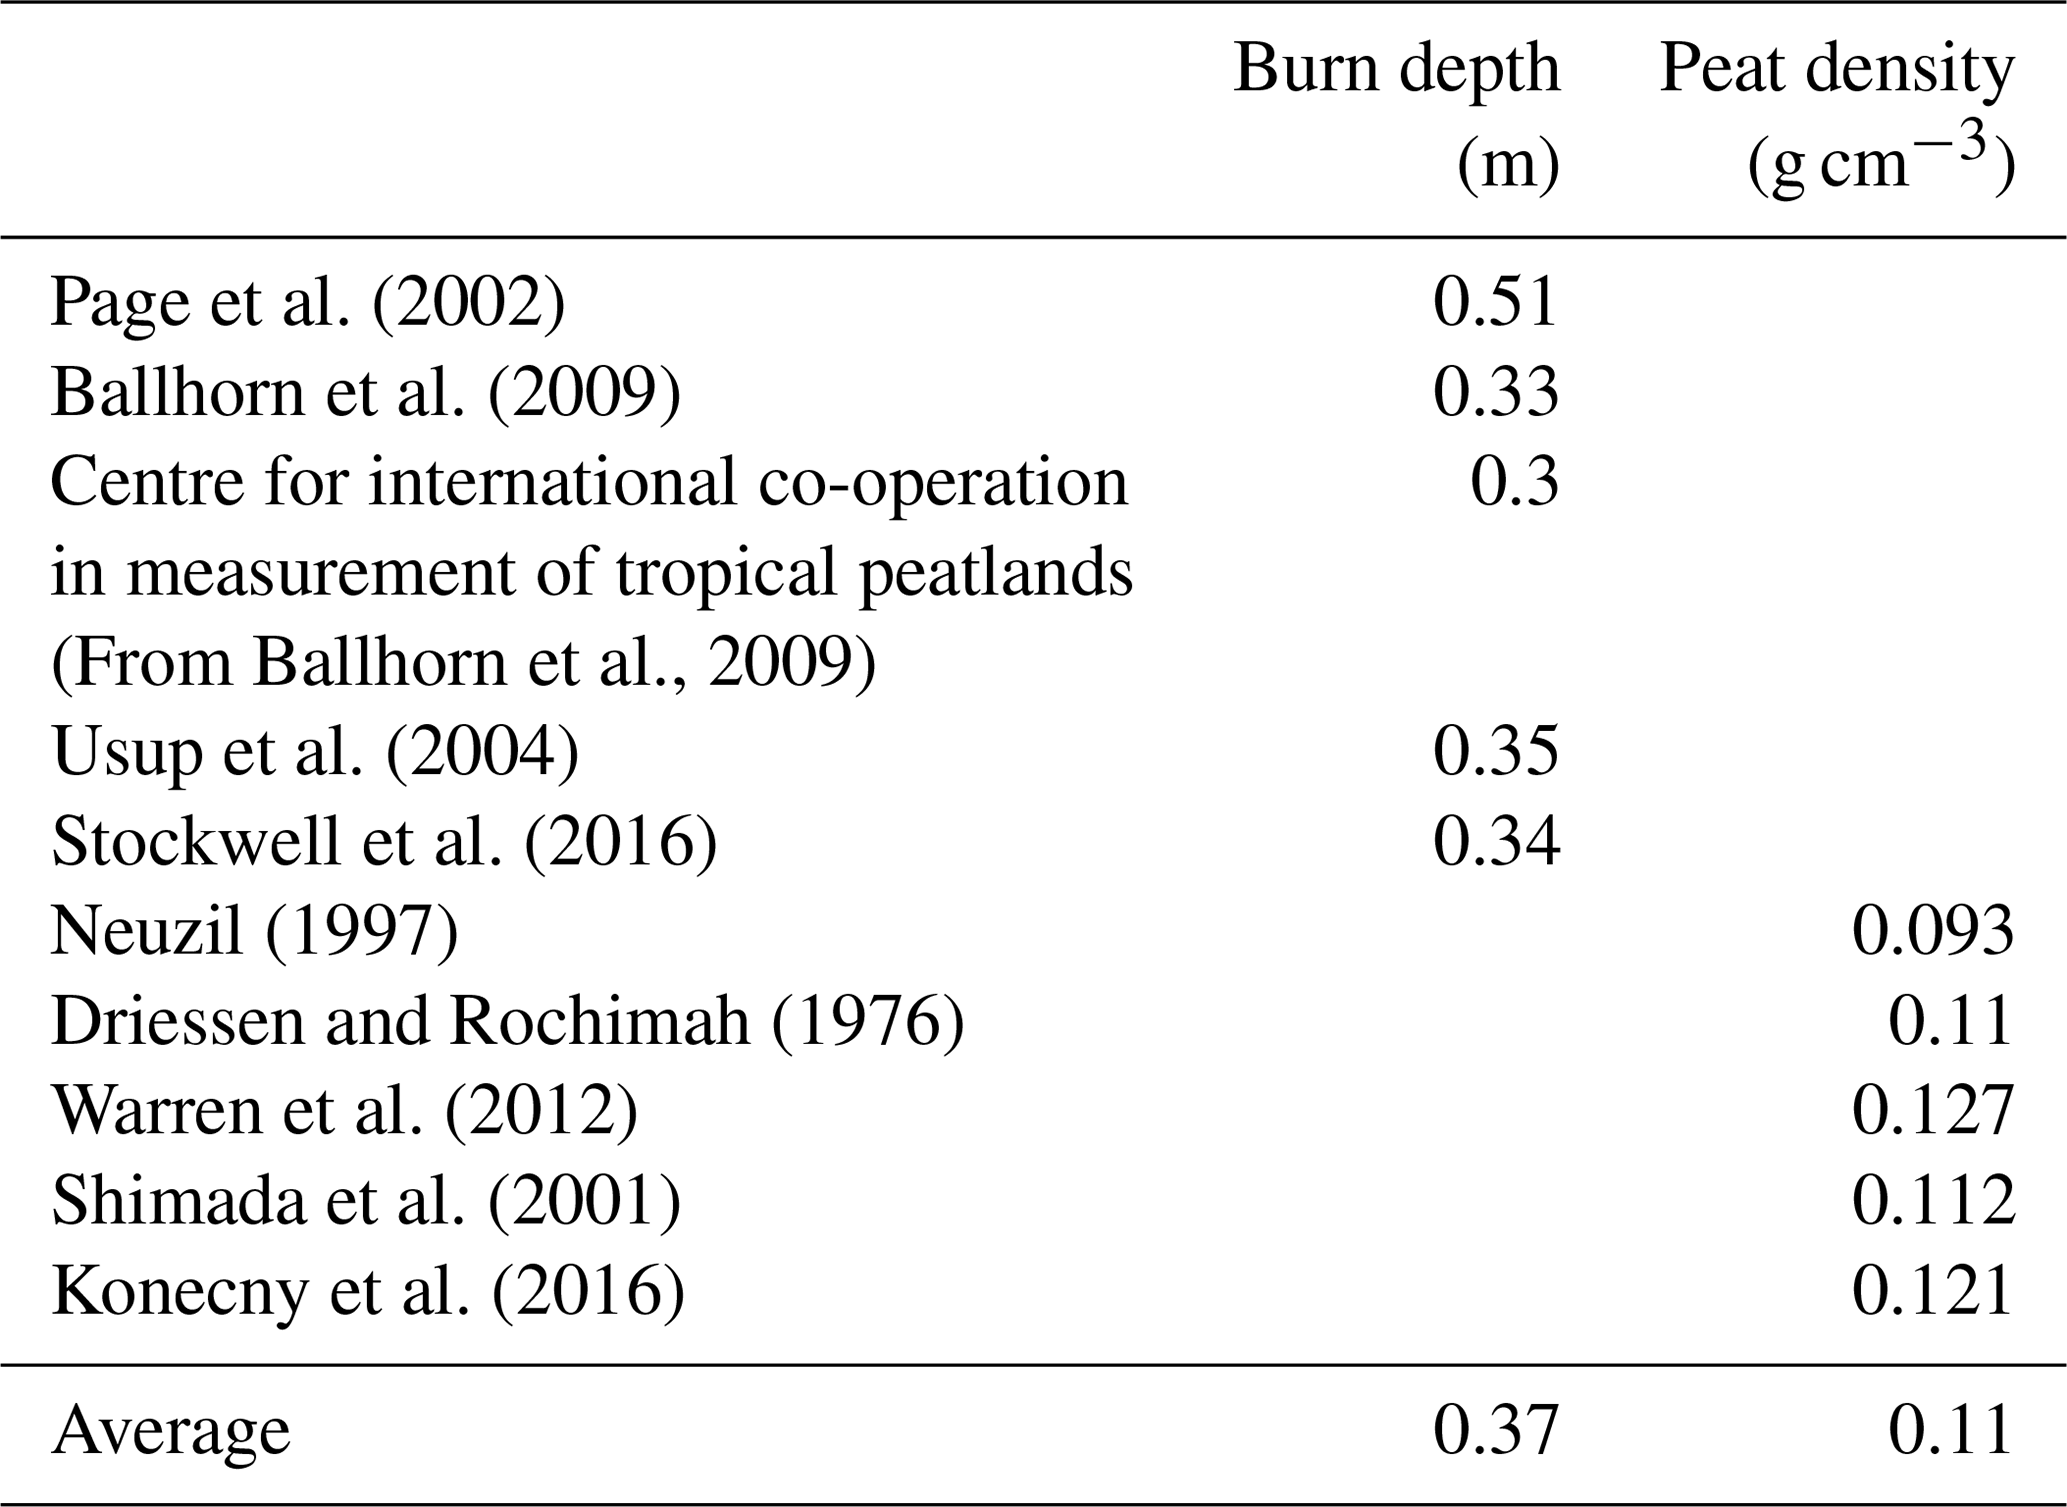
Table 2Emission factors from previous studies (g kg−1) and an average value across all studies.
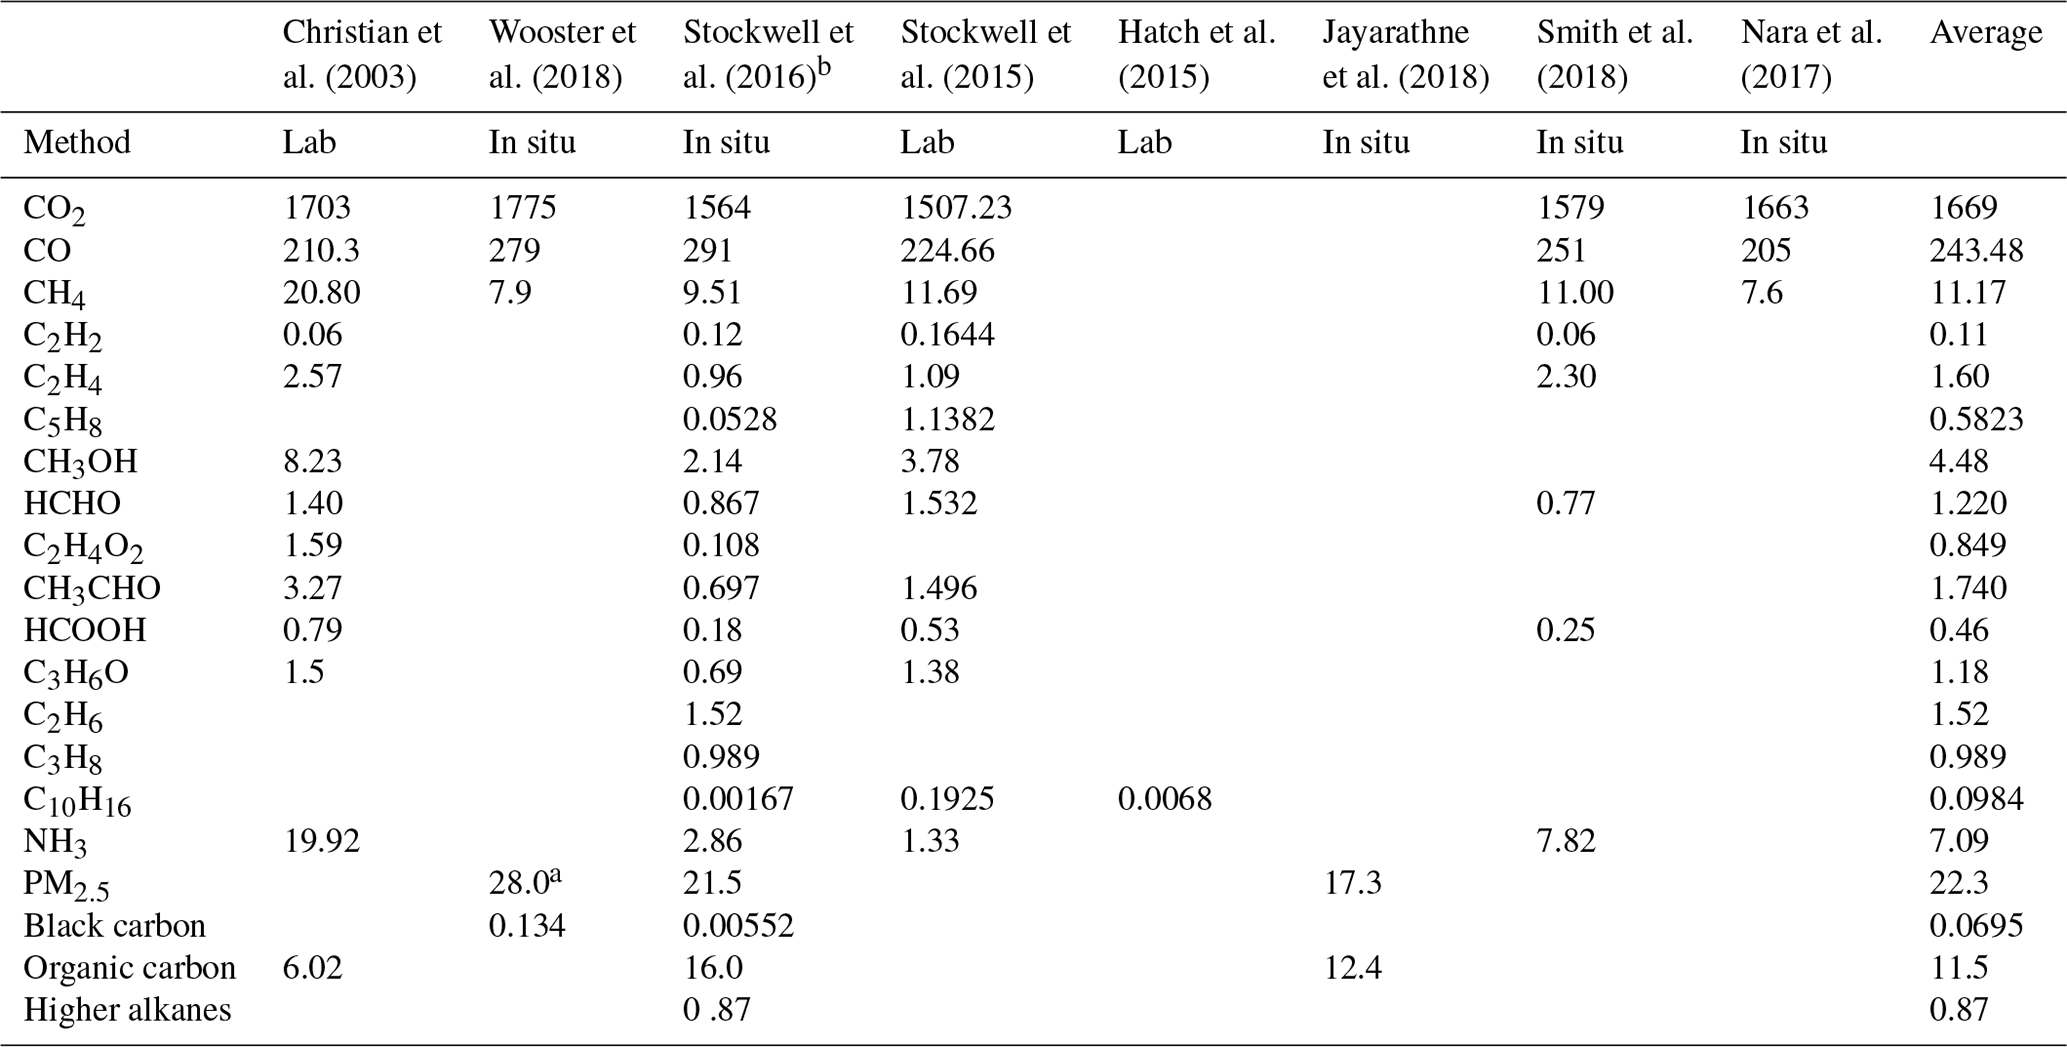
a Contains both peat and vegetation burning. b Stockwell et al. (2016) and Jayarathne et al. (2018) are based on the same measurements.
Vertical profile of fire emissions
Fires can inject emissions into air above the surface layer of the model, which in this model setup is about 70 m. By default in WRF-chem, the vertical distribution of fire emissions uses a plume rise parameterization based on a 1d cloud model (Freitas et al., 2007). However, smoke from smouldering peat fires can be emitted close to the ground. Recent work suggests that tropical fires mostly inject emissions into the boundary layer (BL) and the WRF-chem scheme may overestimate fire injection heights. Tosca et al. (2011) found that the average plume height for fires in Sumatra and Borneo was 729 m, with 96 % of plumes confined to within 500 m of the boundary layer. Martin et al. (2018) found that 90 % of fire emissions in South Asia in September–November were injected below 1500 m. Archer-Nicholls et al. (2015) found that the WRF-chem plume rise parameterization overestimated the injection height for fires in South America. For this reason we chose not to use the plume injection option and instead tested two alternate approaches to control the vertical profile of fire emissions:
-
All of the emissions were added to the surface model layer (surface injection).
-
Half of the emissions were added to the surface model layer and the other half of the emissions were spread evenly into model layers throughout the boundary layer (boundary layer injection).
2.3 Particulate measurements
Measurements of particulate matter with a diameter of less than 2.5 µm (PM2.5), less than 10 µm (PM10) and less than 1 µm (PM1) and measurements of AOD (Table 3) were used to evaluate the model. Figure 1 shows the locations of measurements. Hourly measurements of PM2.5 concentrations are available from the National Environment Agency of Singapore for five sites in Singapore during October 2015. We averaged concentrations across the five sites to produce mean PM2.5 concentrations for Singapore. From Singapore, there are also measurements of non-refractory, composition-resolved sub-micron PM from an aerosol chemical speciation monitor (ACSM) (Budisulistiorini et al., 2018). We summed the chemically resolved masses to give PM1. Betha et al. (2014) found that for fire-induced haze in Singapore in 2013, 96 %–99 % of the PM2.5 was PM1.
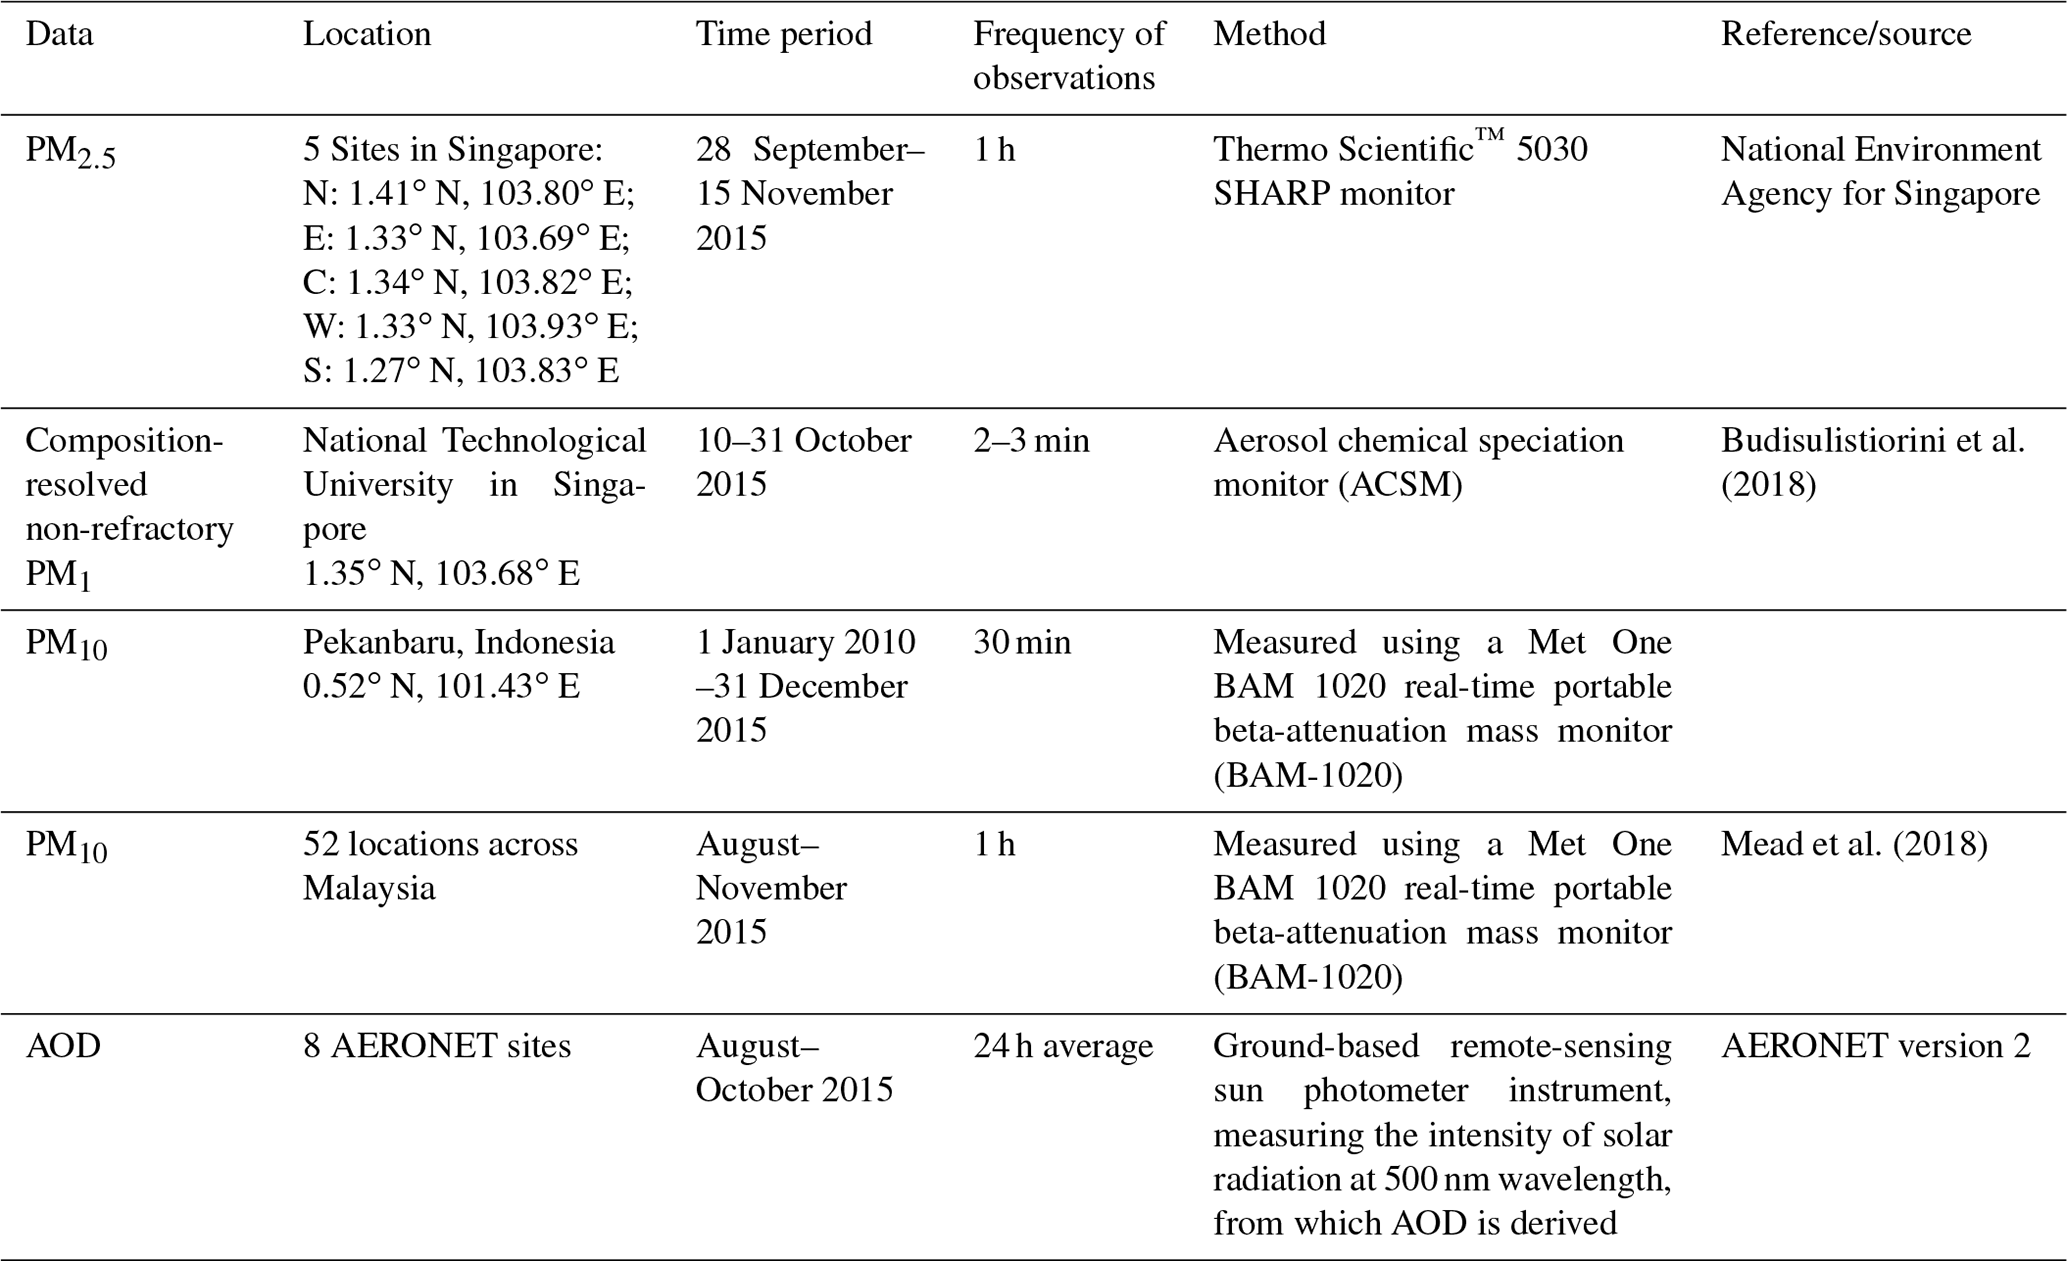
In October 2015, measured PM1 agreed to within 20 % of the mean PM2.5 concentration from the NEA. Ground-based AOD measurements were available from seven Aerosol Robotic Network (AERONET) sites for August–October. Measurements of hourly PM10 were available from 52 locations across Malaysia (Mead et al., 2018) and 1 location in Indonesia during August–October 2015. We compared daily mean observations at each site with simulated PM and AOD in Sect. 3.2. The fractional bias (defined in the Supplement) and correlation coefficients were used to evaluate the simulations. We did not use AOD data from MODIS retrievals, which significantly underestimated AOD over the region during this period, due to excluding smoke plumes that were mistaken for clouds (Shi et al., 2019).
3.1 Fire emissions
Table 4 shows total dry matter consumption, PM2.5, CO2, CO and SOA emissions from fires across Sumatra and Borneo in September–October 2015. The dry fuel consumption is lowest for FINN (230 Tg), which does not include peat fires. Dry matter consumption is similar for GFED, FINN+GFEDpeat and FINNpeatSM (455, 514, 465 Tg, respectively) and is highest for FINNpeat (612 Tg). This is likely due to the peat burn depth being greatest for FINNpeat. Wooster et al. (2018) estimated 358±107 Tg of dry matter consumption for Kalimantan and Sumatra in September–October using satellite CO emissions (from the MOPITT instrument) and a CO EF. This dry matter estimate is in reasonable agreement with GFED and FINNpeatSM. FINN estimates a smaller dry matter consumption compared to Wooster et al. (2018), whereas FINNpeat estimates greater dry matter consumption. Whitburn et al. (2016), have estimated dry matter fuel consumption of 525 Tg, calculated using satellite CO emissions (from the IASI instrument) from peatlands and the CO EF for peat from GFAS. This estimate is larger than that found for GFED or FINNpeatSM and smaller than that found for FINNpeat.
Table 4Total dry matter fuel consumption, PM2.5, CO2, CO and SOA fire emissions for September–October 2015. Totals are for the area shown in Fig. 1. The percentage contribution from peat fires is indicated.
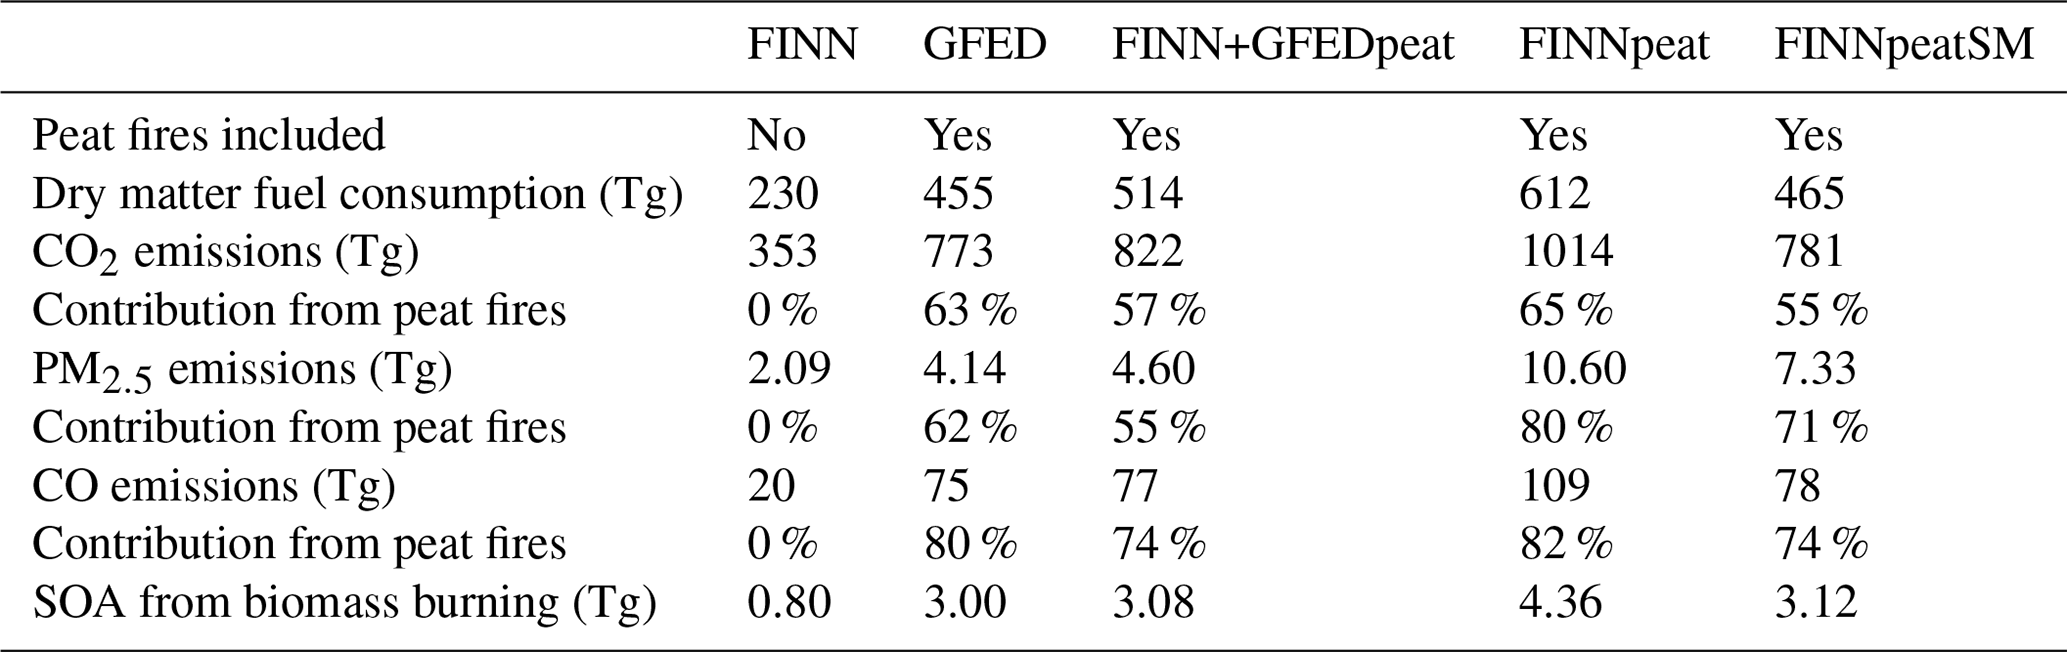
Total September–October 2015 emissions of CO2 follow a similar pattern to dry matter consumption, with similar values for GFED, FINN+GFEDpeat and FINNpeatSM (773, 822 and 781 Tg). The largest emissions are for FINNpeat (1014 Tg) and the smallest emissions for FINN (353 Tg). CO2 EFs are similar for GFED and FINNpeat (1703 and 1669 g kg −1), explaining the similarity between dry matter consumption and CO2 emissions for these inventories. The total CO2 emissions for September–October estimated by Wooster et al. (2018) were 692±213 Tg, matching GFED, FINN+GFEDpeat and FINNpeatSM. Jayarathne et al. (2018) estimated 547±259 Tg of CO2 were emitted from peat fires over southern Sumatra and Kalimantan, a range which includes the total CO2 emissions from peat fires for FINN+GFEDpeat (469 Tg), FINNpeat (661 Tg) and FINNpeatSM (428 Tg).
Total emissions of PM2.5 vary across simulations due to differences in assumed PM2.5 EFs. FINN has the smallest total PM2.5 emissions for September–October (2.09 Tg; Table 4). GFED and FINN+GFEDpeat have similar total PM2.5 emissions (4.14 and 4.60 Tg), smaller than those for FINNpeatSM (7.33 Tg) despite these inventories having similar dry matter consumption and CO2 emissions. This is due mainly to the difference in the assumed EFs for PM2.5 from peat fires, with 9.1 g kg −1 used in GFED and 22.26 g kg −1 used in FINNpeatSM. Wooster et al. (2018), assumed a PM2.5 EF of 28±6 g kg −1 and estimated that 9.1±3.2 Tg of PM2.5 was emitted over the whole of Sumatra and Kalimantan for September–October 2015, similar to that found in FINNpeat (10.60 Tg) and FINNpeatSM (7.33 Tg). In contrast, FINN and FINN+GFED, which use the lower EF, produce smaller PM2.5 emissions by a factor of 2 and 4, respectively. Jayarathne et al. (2018) found that, for a smaller study area in Sumatra and Kalimantan, the total PM2.5 emission from peat fires was 6±5.5 Tg, a range which covers the total PM2.5 emissions from peat fires from FINN+GFEDpeat (2.51 Tg), FINNpeat (8.51 Tg) and FINNpeatSM (5.24 Tg).
GFED, FINN+GFED and FINNpeatSM all emit similar total amounts of CO over September–October (75, 77 and 78 Tg, respectively). This is likely due to the similar EFs used for peat fires (243 g kg −1 in FINNpeatSM, 210 g kg −1 in GFED). The total CO emissions from FINN are smaller (20 Tg) and are larger from FINNpeat (109 Tg). The contribution from peat fires to total CO emissions (74 %–82 %) is larger than for CO2 (55 %–65 %) and PM2.5 (55 %–80 %). For every 1 g of CO emitted from fires, 0.04 g of SOA is assumed, and the total SOA from each fire emission inventory is shown in Table 4. The SOA increases the total PM emitted from fires to 2.89 Tg from FINN, 7.14 Tg from GFED, 7.68 Tg from FINN+GFED, 14.96 Tg from FINNpeat and 10.45 Tg from FINNpeatSM.
Table 4 also shows the fraction of emissions that are estimated to come from peat fires. Across the inventories that include peat burning, peat fires contribute 51 %–62 % of dry matter consumption, 55 %–65 % of CO2 emissions and 55 %–80 % of PM2.5 emissions. The emission inventories with updated PM2.5 emission factors result in a greater contribution from peat burning (71 %–80 %) compared to emission inventories with the older EFs (55 %–62 %). Wooster et al. (2018) found that peatland fires contributed 85 % of the dry matter fuel consumption and 95 % of the PM2.5 emissions in September–October 2015, greater than our estimates with updated EFs.
Figure 2 shows the spatial variations in the total PM2.5 emissions during September–October 2015. In all inventories, the greatest emissions occur in southern Kalimantan and central and southern Sumatra, matching the locations of peatlands (Fig. 1). For the FINNpeatSM emissions, Sumatra contributes 42 % of the total PM2.5 emissions; for FINNpeat, FINN+GFEDpeat and FINN, the contribution is 39 %, 40 % and 32 %, respectively. Wooster et al. (2018) found that 33 % of the total PM2.5 emissions came from Sumatra, while Koplitz et al. (2016) found that 47 % of OC and BC emitted in June to October 2015 came from Sumatra. Our estimates exclude fire emissions from eastern Indonesia. Nechita-banda et al. (2018) estimated that fires in eastern Indonesia and Papua New Guinea contributed around 15 %–20 % of total CO emissions from fires across the region, highlighting the need for future work to quantify PM emissions in this region.
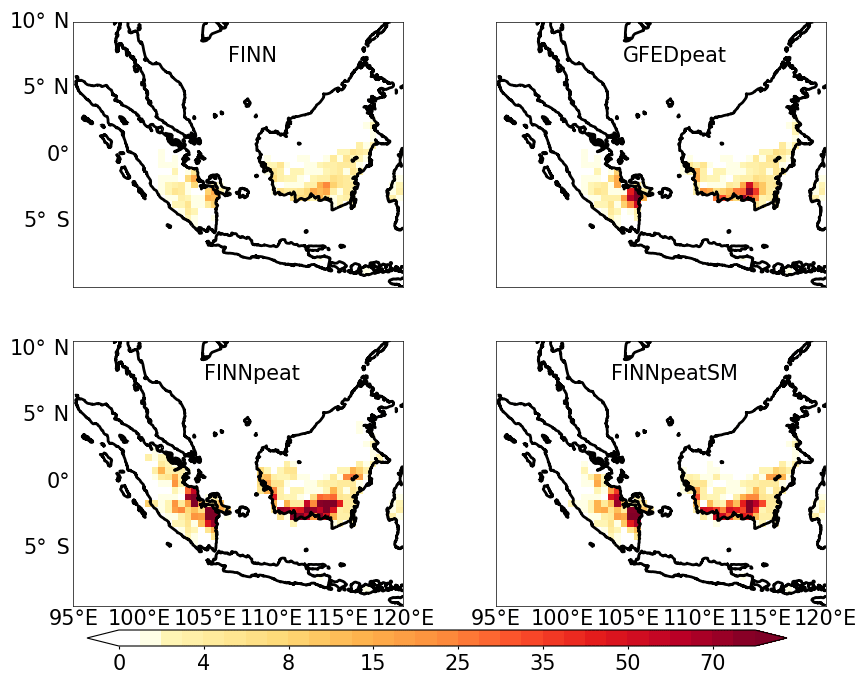
Figure 2Total PM2.5 fire emissions during September–October 2015 (g m−2).
FINN and GFED underestimate total emitted PM2.5 and FINN underestimates total emitted CO2 compared to the emissions found by Wooster et al. (2018) and Jayarathne et al. (2018), suggesting that peat fires are important contributors to these emissions. FINNpeatSM is the only emissions inventory that is consistent with these previous studies for both PM2.5 and CO2.
Figure 3 shows daily total PM2.5 emissions from the different inventories over the study area. Temporally, the inventories follow a similar pattern, with 80 %–90 % of the total PM2.5 emissions for 2015 occurring in August–October. For all the emissions inventories the majority of emissions are in September, followed by October and then August. GFED has the largest difference between September and October emissions (58 % in September and 17 % in October), followed by FINN+GFEDpeat (47 % and 24 %), FINNpeat (36 % and 30 %) and finally FINN (33 % and 29 %) and FINNpeatSM (36 % and 32 %), which have the smallest differences between the 2 months. The reduced ratio of the fraction of emissions in September compared to October for FINNpeatSM is due to greater soil moisture in September resulting in a reduced peat burn depth.
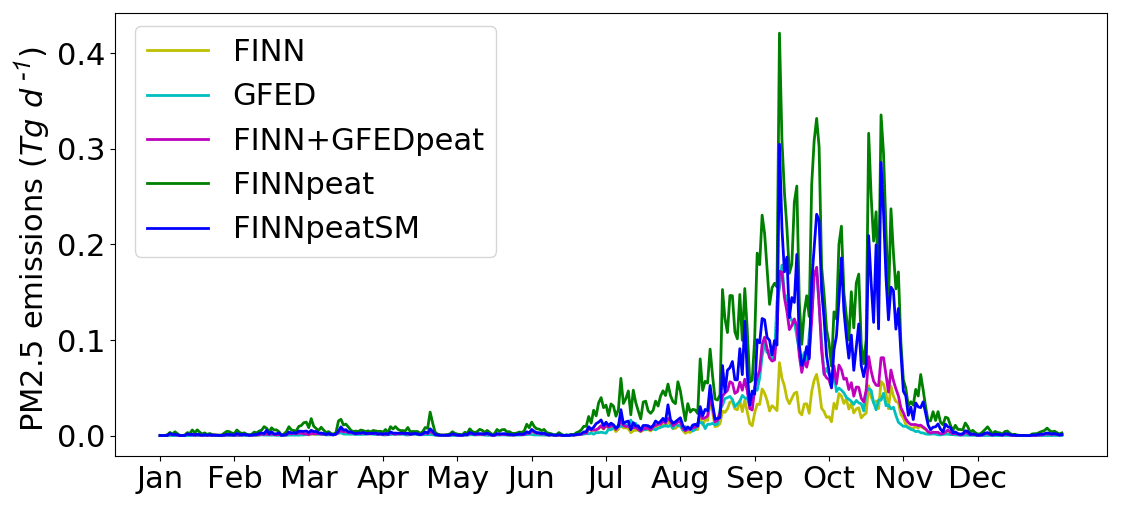
Figure 3Total daily PM2.5 emissions from fires during 2015. Total shown for the area in Fig. 1: 10∘ S–10∘ N, 95–120∘ E.
Another commonly used emissions inventory is the Global Fire Assimilation System (GFAS1). This uses satellite fire radiative power to detect fires, combined with EFs to calculate daily emissions (Kaiser et al., 2012). For peat fires, some EFs are from studies of Indonesian peat, although the PM2.5 EF (9.1 g kg−1) is from tropical vegetation, as is used in GFED. Reddington et al. (2016) found that GFAS1 requires the same scaling as GFEDv3 to match observations in Indonesia. It is therefore likely that GFAS1 would show similar results to GFED in our assessment.
3.2 Comparison of model and observational data
We evaluated the WRF-chem simulations with the different emissions inventories and injection options against measured PM10, PM2.5 and PM1 concentrations. Figures 4 and 5 show the comparison of simulated and observed PM concentrations. Comparisons of PM2.5 and PM1 measurements only, which were restricted to Singapore, are shown in Fig. S3.
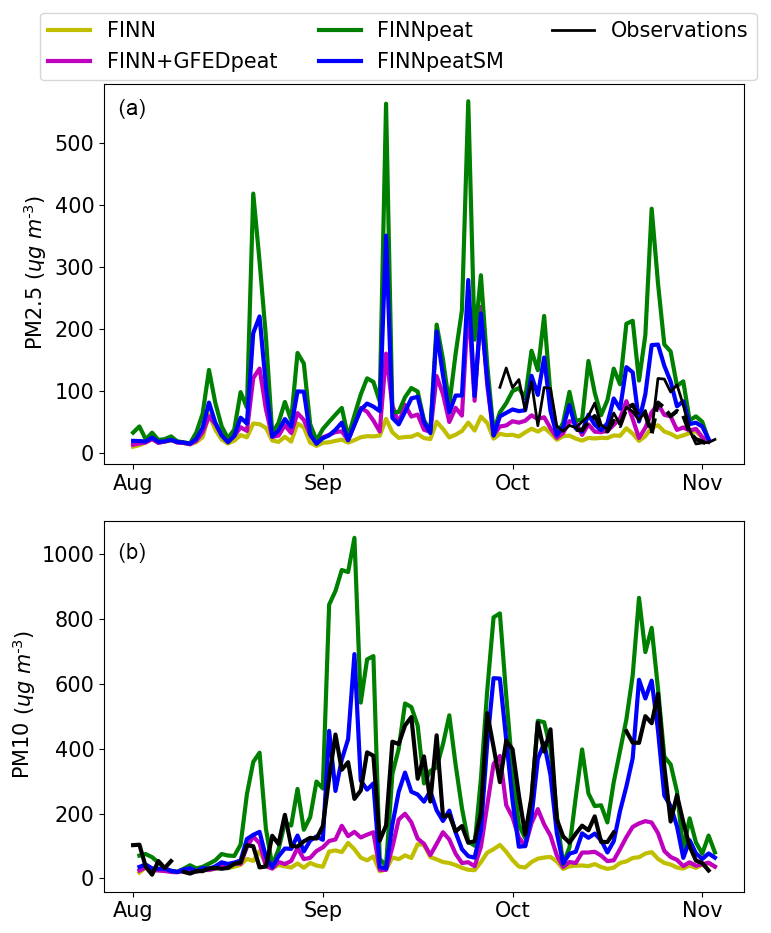
Figure 4Daily observed and modelled (a) PM2.5 in Singapore and (b) PM10 in Pekanbaru for WRF-chem runs using different fire emissions inventories and the surface injection option. Panel (a) shows observations of PM2.5 (solid) and PM1 (dashed). The Pearson's correlation (r) for panel (a) is 0.47, 0.73, 0.52 and 0.50 and for panel (b) is 0.63, 0.60, 0.65 and 0.73 for FINN, FINN+GFEDpeat, FINNpeat and FINNpeatSM, respectively.
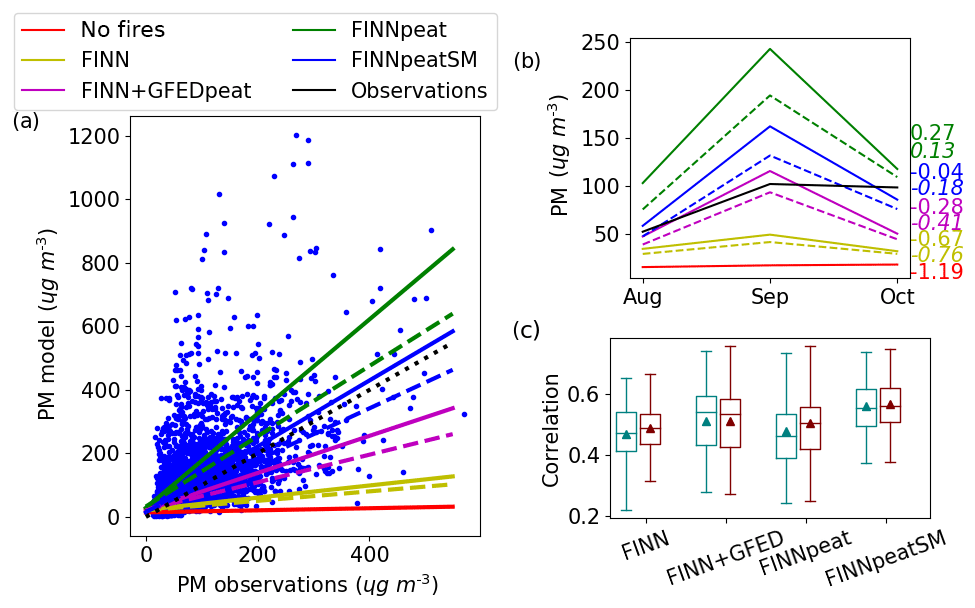
Figure 5Comparison of simulated and observed PM concentrations during August–October 2015. Observations of PM10, PM2.5 and PM1 from 55 sites in Indonesia, Singapore and Malaysia. (a) Simulated and observed daily mean PM concentrations for FINNpeatSM emissions and surface injection (blue dots). Lines show the linear fit for the model with different emissions: solid lines are when emissions are emitted at the surface and dashed lines are used when emissions are injected into the boundary layer. The 1 : 1 line is shown with black dots. (b) The average monthly simulated and observed PM concentrations. The fractional bias for August–October is shown to the right of each line. (c) The correlation coefficient (r) for comparisons of daily mean simulated and observed PM concentrations for all 55 sites. For each simulation the box plots show the median (middle line of box) and upper and lower quartiles (top and bottom of box). The range of correlations (whiskers extend to min and max) across all sites are shown by the box plots, and the mean correlations are shown as triangles. Simulations with the surface injection are in light blue, and simulations with the boundary layer injection are in red.
PM concentrations are underestimated by the model with FINN emissions, with a fractional bias (FB) of −0.67 with surface injection and −0.77 with boundary layer injection of emissions with an average across both simulations of −0.72. The model with FINN+GFEDpeat emissions also underestimates PM concentrations (average FB = −0.35), whilst the model with FINNpeat emissions overestimates PM concentrations (average FB = 0.2). The model with FINNpeatSM emissions has the smallest bias (average FB = −0.11), suggesting mean emissions from this inventory are closest to reality.
The temporal pattern of measured PM is generally matched by the simulations, as shown in Fig. 4. However, for many sites, the greatest PM concentrations were measured in October, whereas the model simulates the greatest PM concentrations in September. This results in the model underestimating PM concentrations the most in October, with a smaller underestimate, or an overestimate, in September (Fig. 5b).
Using a burn depth dependant on soil moisture alters the temporal pattern of simulated emissions, reducing the overestimation in September compared to October. When burn depth is constant, as in FINNpeat, 37 % of regional PM2.5 emissions for 2015 occur in September and 30 % in October. In FINNpeatSM, where we assume a linear relationship between soil moisture and burn depth, the percentage of annual PM2.5 emissions in September is 39 % and 36 % in October. A non-linear relationship between soil moisture and burn depth would result in shallower burn depth in September and deeper burn depth in October, decreasing emissions in September and increasing emissions in October, which might further improve simulated PM concentrations. There is little information available on the measured relationship between soil moisture and burn depth.
The overestimation of modelled PM concentrations in September may also be due to our assumption that all the emissions from a fire are emitted on the day the fire was detected. In reality, peat fires can smoulder for weeks and the emissions should be released over a longer time period. This could also reduce the simulated PM concentration in September and increase them in October. The overestimation in September could also be due to an issue with fire detection. Syaufina and Sitanggang (2018) found that only hotspots which last for at least 3 consecutive days indicate fires, something which is not considered when calculating the emissions. However, despite our simplified assumptions the model captures individual peaks in measured PM reasonably well (Fig. 4). Alternately, an underestimation in October could be due to clouds, or haze caused by previous fires, blocking the detection of fires by the satellite.
Putriningrum et al. (2017) found that WRF-chem with FINNv1 or GFEDv4 emissions underestimated PM concentrations across Indonesia during October 2015, with GFEDv4 resulting in a better match compared to FINNv1. Putriningrum et al. (2017), suggested that emissions were underestimated due to haze from fires blocking the detection of burned area. While this is likely to affect the emissions, our work suggests that PM emissions in GFED4 could also be underestimated because EFs for peat combustion are too small.
Figure 5 also shows the correlation coefficients between modelled and measured PM concentrations across all the observation sites. The FINN simulation has the lowest average correlation across all sites (r=0.47 and 0.49 with surface and boundary layer injection, respectively), followed by FINNpeat (r=0.48 and 0.51) and FINN+GFEDpeat (r=0.51 for both injections). FINNpeatSM has the highest average correlation across all the sites (r=0.56 to 0.57). Both FINN+GFEDpeat and FINNpeatSM assume variable peat burn depth depending on soil moisture. This comparison therefore suggests that varying depth of peat burn based on surface soil moisture, as in FINNpeatSM and FINN+GFEDpeat, results in improved estimate of emissions. The height at which emissions are injected has little impact on the correlation, so there is limited evidence from this comparison to support either option.
Comparison with PM2.5 concentrations measured in Singapore during October 2015 further supports the above analysis. WRF-chem underestimates PM2.5 concentrations in Singapore both with FINN emissions (FB = −0.6 for surface emissions and −0.69 for boundary layer emissions) and FINN+GFED emissions (FB = −0.28 for both injections). With FINNpeat emissions the model overestimates PM2.5 concentrations (FB = 0.45 to 0.53) and the best agreement with observations is with FINNpeatSM emissions (FB = 0.06 to 0.16).
Chemically resolved PM1 measurements from Singapore are available for 10–31 October 2015. Organic aerosols (OAs) contributed 79 % of the observed PM1 between 10 and 31 October (Budisulistiorini et al., 2018). The FINN simulation underestimates the contribution of OA to PM1 with 64 % with BL injection (69 % with surface injection). For the simulations with peat emissions, the model is improved with the contribution of OA to PM1 varying (Fig. S4). With FINNpeatSM, 78 % of PM1 is OA with the boundary layer injection (82 %, surface injection). For the simulations with FINNpeat it is 80 % (84 %), for FINN+GFED 78 % (79 %).
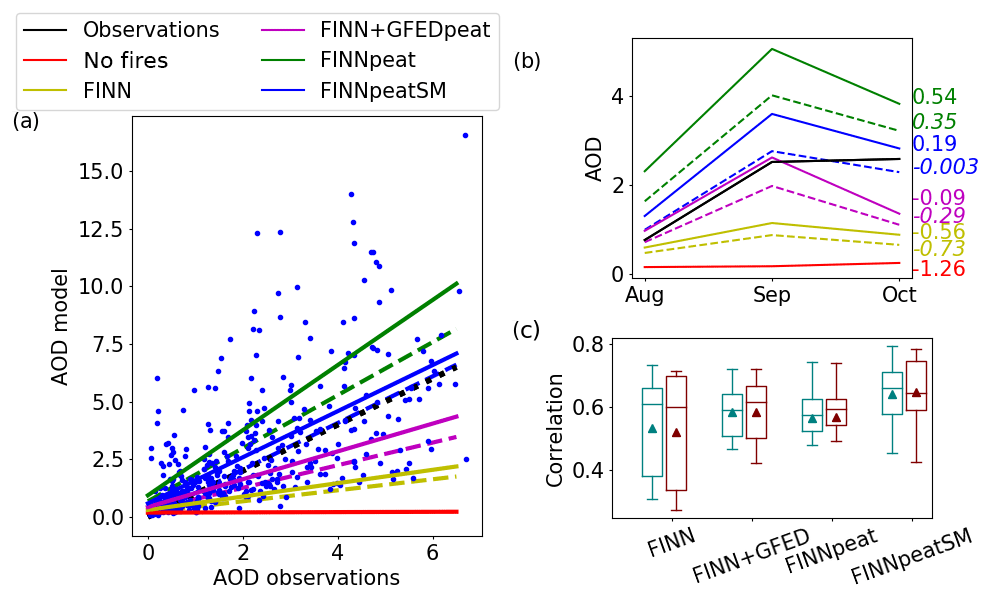
Figure 6Comparison of simulated and observed AOD during August–October 2015, from eight AERONET sites in Indonesia, Singapore and Malaysia. Observed AOD is at 500 nm and simulated AOD is at 550 nm. Panels (a), (b) and (c) are the same as in Fig. 5 but for AOD.
Figure 6 shows comparison of simulated and measured AOD. The comparisons are consistent with those seen for PM. The model with FINN emissions underestimates AOD (FB = −0.56 for surface emissions and −0.73 for boundary layer), as does the model with FINN+GFED emissions (FB = −0.09 and −0.29). FINNpeat overestimates for both injection options (FB = 0.54 and 0.35), and FINNpeatSM gives the lowest FB of −0.003 with boundary layer injection (0.19 with surface injection). The correlation coefficients between simulated and measured AOD are highest for simulations with FINNpeatSM (r=0.64 with surface and 0.65 with BL injection) followed by FINN+GFEDpeat (r=0.58 and 0.59), FINNpeat (r=0.57 for both injections) and FINN (r=0.53 and 0.52). The AOD simulated by the model exceeded 10 during September–October, similar to the values estimated by Eck et al. (2019) for the same period. Previous work has found that models tend to better simulate PM2.5 compared to AOD in regions influenced by fire emissions (Aouizerats et al., 2015; Crippa et al., 2016).
3.3 PM2.5 concentrations and AOD
Figure 7 shows simulated surface PM2.5 concentrations due to fires during September–October (Fig. S5 shows results for the boundary layer injection). Simulated PM2.5 concentrations from fires are greatest over Sumatra and southern Kalimantan, with simulated September–October mean concentrations exceeding 1800 µg m−3 in some grid cells in FINNpeatSM emissions. Enhanced regional PM2.5 concentrations are simulated to the northeast of the fires across Peninsular Malaysia (50–150 µg m−3) caused by regional transport of pollution. Simulated surface PM2.5 concentrations from fires during September–October over Sumatra and Borneo are greatest with FINNpeat emissions (267 µg m−3), followed by FINNpeatSM (183 µg m−3), FINN+GFEDpeat (98 µg m−3) and FINN (45 µg m−3), matching the PM2.5 emissions from the different inventories (Table 4).
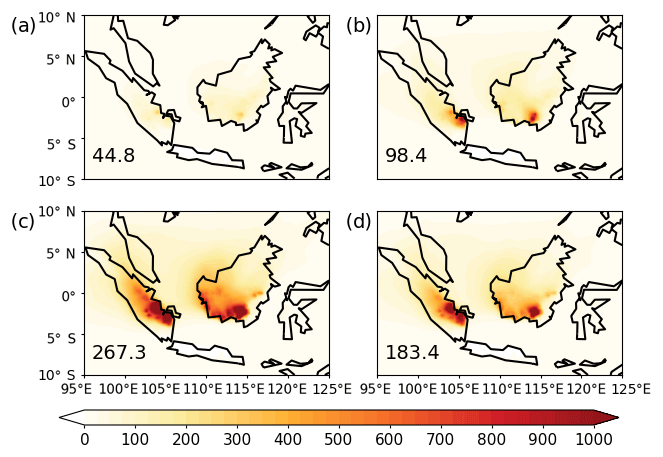
Figure 7Mean simulated surface PM2.5 concentration (µg m−3) from fires for September–October 2015 with the surface injection and (a) FINN emissions, (b) FINN+GFEDpeat, (c) FINNpeat and (d) FINNpeatSM. The surface PM2.5 concentration from fires, averaged over Borneo and Sumatra, is indicated on each panel.
Peat combustion contributes a substantial fraction of simulated PM2.5 concentrations from fires, ranging from 55 % in the model with FINN+GFEDpeat emissions, to 76 % with FINNpeatSM emissions and to 83 % with FINNpeat emissions. Figure 8 shows the fraction of the simulated surface PM2.5 concentration from peat fires for September–October 2015 using the FINNpeatSM emissions. The majority of simulated PM2.5 concentrations across the study area are due to emissions from peat fires. Across Sumatra and Borneo, 96 % of surface PM2.5 concentrations are from fires with 73 % from peat combustion. Peat fires therefore account for 76 % of the fire contribution to PM2.5. This is slightly larger than the contribution of peat fires to primary PM2.5 emissions (71 % in FINNpeatSM), likely due to atmospheric production of secondary organic aerosol from fire-emitted precursors. Reddington et al. (2014) used a combination of models to demonstrate that regional fire-derived PM concentrations during haze episodes are dominated by emissions from peatland regions. For 2015, Wiggins et al. (2018) suggest that ∼85 % of the smoke reaching Singapore was from peat fires, slightly higher than the contribution of peat fires to the simulated PM2.5 concentration shown in Fig. 8 (67 %). Engling et al. (2014) found that, in 2006, 76 % of particulate matter in Singapore was from peat fires. At the Palangkaraya AERONET site in Kalimantan, Eck et al. (2019) found that 80 %–85 % of AOD came from peat burning, consistent with the contribution of peat fires to PM2.5 simulated by the model at that location (Fig. 8).
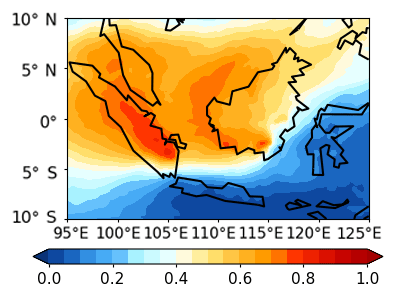
Figure 8Fraction of simulated PM2.5 concentrations originating from peat fire emissions. Simulations use the new FINNpeatSM fire emissions with surface injection.
Inclusion of emissions from peat fires gives the largest fire emissions in Sumatra and western Kalimantan, where previously emissions were substantially lower (Fig. 2). This leads to higher PM2.5 concentrations across Singapore (Fig. 5), which has a large impact on the population exposure to the PM2.5. The location of fires can be an important factor of their contribution to air pollution in populated areas. Lee et al. (2017) found that the 2015 fires in Sumatra accounted for 50 % of fire-derived PM2.5 in Kuala Lumpur and 41 % in Singapore, and Hansen et al. (2019) found that during August–October fires in southern Sumatra and central Kalimantan are the largest contributors to PM2.5 in Singapore. Reddington et al. (2014) and Kim et al. (2015) found that for the 2006 fires Sumatran fires were responsible for the worst air quality across Equatorial Asia.
Injecting all fire emissions at the surface increases the average simulated surface PM2.5 concentration by a factor of 1.34 to 1.36, compared to injecting 50 % at the surface and 50 % through the boundary layer. However, this factor varies spatially (Fig. 9). Close to the fire locations, the surface injection option results in an increase in PM2.5 concentrations by up to a factor of 2. Further away from the fires, however, the injection option has less impact on simulated PM2.5 concentrations. Despite these differences in simulated PM, the available measurements of PM do not allow us to better constrain the vertical profile of fire emissions (Sect. 3.2).

Figure 9Ratio of simulated (a) surface PM2.5 concentration and (b) AOD at 550 nm from fires for September–October, when using the surface injection option compared to the boundary layer injection option. Results are shown for the model with FINNpeatSM emissions. Zero values of average PM2.5 and AOD have been removed.
Simulated AOD in Sumatra and Borneo during September–October (Fig. S6) follows a similar pattern to simulated PM2.5, with the highest value for the model with FINNpeat (1.42) followed by FINNpeatSM (1.06), FINN+GFEDpeat (0.62) and FINN (0.31). Injecting fire emissions at the surface also results in greater simulated AOD compared to when emissions are spread through the boundary layer. The average AOD across Borneo and Sumatra increases by a factor of 1.32 for surface-injected emissions compared to the boundary layer, which is similar to the difference seen in average PM2.5 concentrations. However, spatially the difference between the injection options is different from that seen for PM2.5 (Fig. 8). Rather than seeing a larger increase around the fires in Sumatra and Kalimantan, the factor difference between the two injection options remains between 1.1 and 1.5 across the area affected by fires. Majdi et al. (2019) also found that the sensitivity of simulated surface PM2.5 to injection method (up to 50 %), was greater than the sensitivity of AOD (up to 20 %), which is consistent with the differences seen here close to fires.
Vegetation and peat fires in Indonesia emit substantial amounts of trace gases and aerosol resulting in serious air pollution episodes. The magnitude of emissions from these fires is very uncertain, particularly for peat fires, which are more difficult to detect using Earth observation methods. New measurements of tropical peat combustion have led to an upward revision of particulate emission factors, leading to a suggestion that some fire emission inventories may underestimate particulate emissions from peat fires. Here we used the WRF-chem model along with extensive observations of PM to make a revised estimate of PM emissions from Indonesian fires during August–October 2015.
Current fire emission inventories either do not include peat fires, (FINNv1.5), or do not use updated peat emission factors (GFEDv4s). The WRF-chem model underestimated PM concentrations measured in Indonesia and Malaysia during August–October 2015, both with FINNv1.5 emissions (fractional bias = −0.7) and with a combination of FINN vegetation emissions and GFED4s peat emissions (fractional bias = −0.35). We created a new emissions inventory for Indonesia using updated emission factors for peat combustion and with variable assumptions relating the depth of peat burn to soil moisture (FINNpeatSM). Our best emissions estimate, FINNpeatSM, leads to an improved simulation of PM concentrations (fractional bias = −0.11). Estimated PM2.5 emissions from fires across Sumatra and Borneo during September–October 2015 are 7.33 Tg (with FINNpeatSM), a factor 1.8 greater than in GFED4 (4.14 Tg) and a factor 3.5 greater than FINN1.5 (2.1 Tg). Our total emissions agree with estimations by Wooster et al. (2018) (9.1±3.2) and Jayaranthe et al. (2018) (6±5.5 Tg from peat fires). Further work is needed to assess the impacts of secondary processes within the model on PM2.5 concentrations, and how this may affect the comparisons between model and observations made in this study. We estimate that fires contributed an additional 3.12 Tg of secondary organic aerosol emissions, equivalent to 31 % of total emissions from fires. This brings the total PM from fire emissions to 10.45 Tg. Since updated CO2 EFs for peat fires are similar to previous measurements, our estimated CO2 emissions are consistent with GFED4s.
We find that emissions from peat combustion make up a substantial fraction of total fire emissions from the region. We estimate that peat combustion contributed 55 % of total CO2 emissions and 71 % of primary PM2.5 emissions during September–October 2015. Peat combustion contributed 76 % of fire-derived surface PM2.5 concentrations over Sumatra and Borneo during this period. This highlights the importance of peat fires and the need for better estimates of emissions from peat combustion.
The depth of peat burn is a crucial factor controlling emissions from peat fires but it is poorly constrained. We found that using satellite remotely sensed soil moisture to control the assumed depth of peat burn improved the simulation of PM, with the correlation between simulated and measured PM increasing from 0.48 with fixed peat burn depth to 0.56 with soil moisture control. There is little data available on the relationship between surface soil moisture and burn depth, more work on this could lead to further improvement in the simulation. Work is also needed to examine whether this is consistent for years other than 2015.
Our work suggests that existing emission inventories (GFED4 and FINN1.5) underestimate particulate emissions from Indonesian fires, due to an underestimation of particulate emissions from peat combustion. Including updated emission factors from tropical peat combustion results in substantially increased PM emissions from Indonesian fires. Measurements of emission factors from tropical peat combustion are still very limited, and therefore additional measurements are required. Our comparison of simulated and measured PM concentrations across the region provides an additional and independent confirmation of updated emission factors from peat combustion. Our work suggests that previous studies may have underestimated the contribution of Indonesian fires on particulate air quality. We estimate that vegetation and peat fires increased PM2.5 concentrations over Sumatra and Borneo during September–October 2015 by an average of 127 µg m−3. Future work needs to explore the impact of these fires on public health.
Code and data used in this study are available from authors upon request.
The supplement related to this article is available online at: https://doi.org/10.5194/acp-19-11105-2019-supplement.
Conceptualization by LK and DVS, with support from SRA and LS. LK carried out modelling work and analysis, with help from DVS and extra supervision from SRA. CK provided WRFotron modelling scripts, and SAN and DL provided model code and technical support with modelling. LC and CLR provided technical support with modelling. LK and CW provided fire emissions, and MK, SHB, MFK and MTL all provided observations. LK prepared the manuscript with help from all authors.
The authors declare that they have no conflict of interest.
Laura Kiely was funded by a studentship from the NERC SPHERES Doctoral Training Partnership (NE/L002574/1) and by the United Bank of Carbon (UBoC). This work was supported by an Institutional Links grant (ID 332397925), under the Newton-Indonesia partnership. The grant is funded by the UK Department of Business, Energy and Industrial Strategy (BEIS) and delivered by the British Council. Lailan Syaufina is supported by Directorate of Research and Community Service General Director of Strengthening Research and Development Ministry of Research, Technology and Higher Education (no. 4097/IT3.1.1/PN/2019). We acknowledge the use of the WRFotron scripts developed by Christoph Knote to automatize WRF-chem runs with re-initialized meteorology. We would like to acknowledge Soo Chin Liew and Santo Valentin Salinas Cortijo at National University Singapore, who run the Singapore AERONET site, Syahrial Sumin, who provided us with PM10 data from Pekanbaru, and the National Environment Agency of Singapore, for collecting and providing PM2.5 data (https://www.haze.gov.sg/resources/1-hr-pm2.5-readings; accessed in real time in 2015.
This research has been supported by UBOC and NERC (grant no. NE/L002574/1), Institutional Links (grant no. 332397925), and the Ministry of Research, Technology and Higher Education – Indonesia (grant no. 4097/IT3.1.1/PN/2019).
This paper was edited by Delphine Farmer and reviewed by Robert Yokelson and one anonymous referee.
Akagi, S. K., Yokelson, R. J., Wiedinmyer, C., Alvarado, M. J., Reid, J. S., Karl, T., Crounse, J. D., and Wennberg, P. O.: Emission factors for open and domestic biomass burning for use in atmospheric models, Atmos. Chem. Phys., 11, 4039–4072, https://doi.org/10.5194/acp-11-4039-2011, 2011.
Andreae, M. O. and Merlet, P.: Emissions of trace gases and aerosols from biomass burning, Global Biogeochem. Cy., 15, 955–966, https://doi.org/10.1029/2000GB001382, 2001.
Aouizerats, B., van der Werf, G. R., Balasubramanian, R., and Betha, R.: Importance of transboundary transport of biomass burning emissions to regional air quality in Southeast Asia during a high fire event, Atmos. Chem. Phys., 15, 363–373, https://doi.org/10.5194/acp-15-363-2015, 2015.
Archer-Nicholls, S., Lowe, D., Darbyshire, E., Morgan, W. T., Bela, M. M., Pereira, G., Trembath, J., Kaiser, J. W., Longo, K. M., Freitas, S. R., Coe, H., and McFiggans, G.: Characterising Brazilian biomass burning emissions using WRF-Chem with MOSAIC sectional aerosol, Geosci. Model Dev., 8, 549–577, https://doi.org/10.5194/gmd-8-549-2015, 2015.
Ballhorn, U., Siegert, F., Mason, M., and Limin, S.: Derivation of burn scar depths and estimation of carbon emissions with LIDAR in Indonesian peatlands, P. Natl. Acad. Sci. USA, 106, 21213–21218, https://doi.org/10.1073/pnas.0906457106, 2009.
Betha, R., Behera, S., and Balasubramanian, R.: 2013 Southeast Asian Smoke Haze: Fractionation of Particulate-Bound Elements and Associated Health Risk, Environ. Sci. Technol., 48, 4327–4335, https://doi.org/10.1021/es405533d, 2014.
Budisulistiorini, S. H., Riva, M., Williams, M., Miyakawa, T., Chen, J., Itoh, M., Surratt, J. D., and Kuwata, M.: Dominant contribution of oxygenated organic aerosol to haze particles from real-time observation in Singapore during an Indonesian wildfire event in 2015, Atmos. Chem. Phys., 18, 16481–16498, https://doi.org/10.5194/acp-18-16481-2018, 2018.
Carlson, K. M., Curran, L. M., Ratnasari, D., Pittman, A. M., Soares-Filho, B. S., Asner, G. P., Trigg, S. N., Gaveau, D. A., Lawrence, D., and Rodrigues, H. O.: Committed carbon emissions, deforestation, and community land conversion from oil palm plantation expansion in West Kalimantan, Indonesia, P. Natl. Acad. Sci. USA, 109, 7559–7564, https://doi.org/10.1073/pnas.1200452109, 2012.
Christian, T. J., Kleiss, B., Yokelson, R. J., Holzinger, R., Crutzen, P. J., Hao, W. M., Saharjo, B. H., and Ward, D. E.: Comprehensive laboratory measurements of biomass-burning emissions: 1. Emissions from Indonesian, African, and other fuels, J. Geophys. Res., 108, 4719, https://doi.org/10.1029/2003JD003704, 2003.
Conibear, L., Butt, E. W., Knote, C., Arnold, S. R., and Spracklen, D. V.: Residential energy use emissions dominate health impacts from exposure to ambient particulate matter in India, Nat. Commun., 9, 1–9, https://doi.org/10.1038/s41467-018-02986-7, 2018.
Crippa, P., Castruccio, S., Archer-Nicholls, S., Lebron, G. B., Kuwata, M., Thota, A., Sumin, S., Butt, E., Wiedinmyer, C., and Spracklen, D. V.: Population exposure to hazardous air quality due to the 2015 fires in Equatorial Asia, Sci. Rep., 6, 37074, https://doi.org/10.1038/srep37074, 2016.
Dargie, G. C., Lewis, S. L., Lawson, I. T., Mitchard, E. T. A., Page, S. E., Bocko, Y. E., and Ifo, S. A.: Age, extent and carbon storage of the central Congo Basin peatland complex, Nat. Publ. Gr., 542, 86–90, https://doi.org/10.1038/nature21048, 2017.
Dorigo, W., Wagner, W., Albergel, C., Albrecht, F., Balsamo, G., Brocca, L., Chung, D., Ertl, M., Forkel, M., Gruber, A., Haas, E., Hamer, P. D., Hirschi, M., Ikonen, J., Jeu, R. De, Kidd, R., Lahoz, W., Liu, Y. Y., Miralles, D., Mistelbauer, T., Nicolai-shaw, N., Parinussa, R., Pratola, C., Reimer, C., Schalie, R. Van Der, Seneviratne, S. I., Smolander, T., and Lecomte, P.: ESA CCI Soil Moisture for improved Earth system understanding?: State-of-the art and future directions, Remote Sens. Environ., 203, 185–215, https://doi.org/10.1016/j.rse.2017.07.001, 2017.
Driessen, M. P. and Rochimah, L.: The physical properties of lowland peats from Kali-mantan, Indonesia, in: Peat and Podzolic Soils and their Potential for Agriculture inIndonesia, Soil Research Institute, Bogor, Indonesia, 56–73, 1976.
Eck, T. F., Holben, B. N., Giles, D. M., Slutsker, I., Sinyuk, A., Schafer, J. S., Smirnov, A., Sorokin, M., Reid, J. S., Sayer, A. M., Hsu, N. C., Shi, Y. R., Levy, R. C., Lyapustin, A., Rahman, M. A., Liew, S. C., Salinas Cortijo, S. V., Li, T., Kalbermatter, D., Keong, K. L., Yuggotomo, M. E., Aditya, F., Mohamad, M., Mahmud, M., Chong, T. K., Lim, H. S., Choon, Y. E., Deranadyan, G., Kusumaningtyas, S. D. A., and Aldrian, E.: AERONET Remotely Sensed Measurements and Retrievals of Biomass Burning Aerosol Optical Properties During the 2015 Indonesian Burning Season, J. Geophys. Res.-Atmos., 124, 4722–4740, https://doi.org/10.1029/2018JD030182, 2019.
Emmons, L. K., Walters, S., Hess, P. G., Lamarque, J.-F., Pfister, G. G., Fillmore, D., Granier, C., Guenther, A., Kinnison, D., Laepple, T., Orlando, J., Tie, X., Tyndall, G., Wiedinmyer, C., Baughcum, S. L., and Kloster, S.: Description and evaluation of the Model for Ozone and Related chemical Tracers, version 4 (MOZART-4), Geosci. Model Dev., 3, 43–67, https://doi.org/10.5194/gmd-3-43-2010, 2010.
Engling, G., He, J., Betha, R., and Balasubramanian, R.: Assessing the regional impact of indonesian biomass burning emissions based on organic molecular tracers and chemical mass balance modeling, Atmos. Chem. Phys., 14, 8043–8054, https://doi.org/10.5194/acp-14-8043-2014, 2014.
Field, R. D., van der Werf, G. R., Fanin, T., Fetzer, E. J., Fuller, R., Jethva, H., Levy, R., Livesey, N. J., Luo, M., Torres, O., and Worden, H. M.: Indonesian fire activity and smoke pollution in 2015 show persistent nonlinear sensitivity to El Niño-induced drought, P. Natl. Acad. Sci. USA, 113, 9204–9209, https://doi.org/10.1073/pnas.1524888113, 2016.
Freitas, S. R., Longo, K. M., Chatfield, R., Latham, D., Silva Dias, M. A. F., Andreae, M. O., Prins, E., Santos, J. C., Gielow, R., and Carvalho Jr., J. A.: Including the sub-grid scale plume rise of vegetation fires in low resolution atmospheric transport models, Atmos. Chem. Phys., 7, 3385–3398, https://doi.org/10.5194/acp-7-3385-2007, 2007.
Gaveau, D. L. A., Sloan, S., Molidena, E., Yaen, H., Sheil, D., Abram, N. K., Ancrenaz, M., Nasi, R., Quinones, M., Wielaard, N., and Meijaard, E.: Four decades of forest persistence, clearance and logging on Borneo, PLoS One, 9, 1–11, https://doi.org/10.1371/journal.pone.0101654, 2014a.
Gaveau, D. L. A., Salim, M. A., Hergoualc'H, K., Locatelli, B., Sloan, S., Wooster, M., Marlier, M. E., Molidena, E., Yaen, H., DeFries, R., Verchot, L., Murdiyarso, D., Nasi, R., Holmgren, P., and Sheil, D.: Major atmospheric emissions from peat fires in Southeast Asia during non-drought years: Evidence from the 2013 Sumatran fires, Sci. Rep., 4, 6112, https://doi.org/10.1038/srep06112, 2014b.
Ge, C., Wang, J., and Reid, J. S.: Mesoscale modeling of smoke transport over the Southeast Asian Maritime Continent: coupling of smoke direct radiative effect below and above the low-level clouds, Atmos. Chem. Phys., 14, 159–174, https://doi.org/10.5194/acp-14-159-2014, 2014.
Giglio, L., Randerson, J. T., and Van Der Werf, G. R.: Analysis of daily, monthly, and annual burned area using the fourth-generation global fire emissions database (GFED4), J. Geophys. Res.-Biogeo., 118, 317–328, https://doi.org/10.1002/jgrg.20042, 2013.
Grell, G. A., Peckham, S. E., Schmitz, R., Mckeen, S. A., Frost, G., Skamarock, W. C., and Eder, B.: Fully coupled “online” chemistry within the WRF model, Atmos. Environ., 39, 6957–6975, https://doi.org/10.1016/j.atmosenv.2005.04.027, 2005.
Gruber, A., Dorigo, W. A., Crow, W., and Wagner, W.: Triple Collocation-Based Merging of Satellite Soil Moisture Retrievals, IEEE T. Geosci. Remote, 55, 6780–6792, https://doi.org/10.1109/TGRS.2017.2734070, 2017.
Guenther, A., Karl, T., Harley, P., Wiedinmyer, C., Palmer, P. I., and Geron, C.: Estimates of global terrestrial isoprene emissions using MEGAN (Model of Emissions of Gases and Aerosols from Nature), Atmos. Chem. Phys., 6, 3181–3210, https://doi.org/10.5194/acp-6-3181-2006, 2006.
Hansen, A. B., Witham, C. S., Chong, W. M., Kendall, E., Chew, B. N., Gan, C., Hort, M. C., and Lee, S.-Y.: Haze in Singapore – source attribution of biomass burning PM10 from Southeast Asia, Atmos. Chem. Phys., 19, 5363–5385, https://doi.org/10.5194/acp-19-5363-2019, 2019.
Hansen, M. C. C., Potapov, P. V, Moore, R., Hancher, M., Turubanova, S. A. A., Tyukavina, A., Thau, D., Stehman, S. V. V, Goetz, S. J. J., Loveland, T. R. R., Kommareddy, A., Egorov, A., Chini, L., Justice, C. O. O., and Townshend, J. R. G. R. G.: High-Resolution Global Maps of 21st-Century Forest Cover Change, Science, 342, 850–854, https://doi.org/10.1126/science.1244693, 2013.
Hatch, L. E., Luo, W., Pankow, J. F., Yokelson, R. J., Stockwell, C. E., and Barsanti, K. C.: Identification and quantification of gaseous organic compounds emitted from biomass burning using two-dimensional gas chromatography–time-of-flight mass spectrometry, Atmos. Chem. Phys., 15, 1865–1899, https://doi.org/10.5194/acp-15-1865-2015, 2015.
Heil, A., Langman, B., and Aldrian, E.: Indonesian peat and vegetation fire emissions?: Study on factors influencing large-scale smoke haze pollution using a regional atmospheric chemistry model Indonesian peat and vegetation fire emissions?: Study on factors influencing large-scale smoke haze, Mitig. Adapt. Strat. Gl., 12, 113–133, https://doi.org/10.1007/s11027-006-9045-6, 2007.
Hodzic, A. and Jimenez, J. L.: Modeling anthropogenically controlled secondary organic aerosols in a megacity: a simplified framework for global and climate models, Geosci. Model Dev., 4, 901–917, https://doi.org/10.5194/gmd-4-901-2011, 2011.
Hodzic, A. and Knote, C.: WRF-Chem 3.6.1: MOZART gas-phase chemistry with MOSAIC aerosols, Atmospheric Chemistry Division, National Centre for Atmospheric research (NCAR), available at: https://www2.acom.ucar.edu/sites/default/files/wrf-chem/MOZART_MOSAIC_V3.6.readme_dec2016.pdf (last access: 22 August 2019), 2014.
Hoelzemann, J. J., Schultz, M. G., Brasseur, G. P., Granier, C., and Simon, M.: Global Wildland Fire Emission Model (GWEM): Evaluating the use of global area burnt satellite data, J. Geophys. Res.-Atmos., 109, D14S04, https://doi.org/10.1029/2003JD003666, 2004.
Hu, Y., Fernandez-Anez, N., Smith, T. E. L., and Rein, G.: Review of emissions from smouldering peat fires and their contribution to regional haze episodes, Int. J. Wildl. Fire, i, 293–312, 2018.
Huang, X. and Rein, G.: Computational study of critical moisture and depth of burn in peat fires, Int. J. Wildl. Fire, 24, 798–808, 2015.
Huijnen, V., Wooster, M. J., Kaiser, J. W., Gaveau, D. L. A., Flemming, J., Parrington, M., Inness, A., Murdiyarso, D., Main, B., and Van Weele, M.: Fire carbon emissions over maritime southeast Asia in 2015 largest since 1997, Sci. Rep., 6, 1–8, https://doi.org/10.1038/srep26886, 2016.
Janssens-Maenhout, G., Crippa, M., Guizzardi, D., Dentener, F., Muntean, M., Pouliot, G., Keating, T., Zhang, Q., Kurokawa, J., Wankmüller, R., Denier van der Gon, H., Kuenen, J. J. P., Klimont, Z., Frost, G., Darras, S., Koffi, B., and Li, M.: HTAP_v2.2: a mosaic of regional and global emission grid maps for 2008 and 2010 to study hemispheric transport of air pollution, Atmos. Chem. Phys., 15, 11411–11432, https://doi.org/10.5194/acp-15-11411-2015, 2015.
Jayarathne, T., Stockwell, C. E., Gilbert, A. A., Daugherty, K., Cochrane, M. A., Ryan, K. C., Putra, E. I., Saharjo, B. H., Nurhayati, A. D., Albar, I., Yokelson, R. J., and Stone, E. A.: Chemical characterization of fine particulate matter emitted by peat fires in Central Kalimantan, Indonesia, during the 2015 El Niño, Atmos. Chem. Phys., 18, 2585–2600, https://doi.org/10.5194/acp-18-2585-2018, 2018.
Johnston, F. H., Henderson, S. B., Chen, Y., Randerson, J. T., Marlier, M., DeFries, R. S., Kinney, P., Bowman, D. M. J. S., and Brauer, M.: Estimated global mortality attributable to smoke from landscape fires, Environ. Health Perspect., 120, 695–701, https://doi.org/10.1289/ehp.1104422, 2012.
Kaiser, J. W., Heil, A., Andreae, M. O., Benedetti, A., Chubarova, N., Jones, L., Morcrette, J.-J., Razinger, M., Schultz, M. G., Suttie, M., and van der Werf, G. R.: Biomass burning emissions estimated with a global fire assimilation system based on observed fire radiative power, Biogeosciences, 9, 527–554, https://doi.org/10.5194/bg-9-527-2012, 2012.
Kim, P. S., Jacob, D. J., Mickley, L. J., Koplitz, S. N., Marlier, M. E., DeFries, R. S., Myers, S. S., Chew, B. N., and Mao, Y. H.: Sensitivity of population smoke exposure to fire locations in Equatorial Asia, Atmos. Environ., 102, 11–17, https://doi.org/10.1016/j.atmosenv.2014.09.045, 2015.
Knote, C., Hodzic, A., Jimenez, J. L., Volkamer, R., Orlando, J. J., Baidar, S., Brioude, J., Fast, J., Gentner, D. R., Goldstein, A. H., Hayes, P. L., Knighton, W. B., Oetjen, H., Setyan, A., Stark, H., Thalman, R., Tyndall, G., Washenfelder, R., Waxman, E., and Zhang, Q.: Simulation of semi-explicit mechanisms of SOA formation from glyoxal in aerosol in a 3-D model, Atmos. Chem. Phys., 14, 6213–6239, https://doi.org/10.5194/acp-14-6213-2014, 2014.
Konecny, K., Ballhorn, U., Navratil, P., Jubanski, J., Page, S. E., Tansey, K., Hooijer, A., Vernimmen, R., and Siegert, F.: Variable carbon losses from recurrent fires in drained tropical peatlands, Glob. Change Biol., 22, 1469–1480, https://doi.org/10.1111/gcb.13186, 2016.
Koplitz, S. N., Mickley, L. J., Marlier, M. E., Buonocore, J. J., Kim, P. S., Liu, T., Sulprizio, M. P., DeFries, R. S., Jacob, D. J., Schwartz, J., Pongsiri, M., and Myers, S. S.: Public health impacts of the severe haze in Equatorial Asia in September–October 2015: Demonstration of a new framework for informing fire management strategies to reduce downwind smoke exposure, Environ. Res. Lett., 11, 1748–9326, https://doi.org/10.1088/1748-9326/11/9/094023, 2016.
Kuwata, M., Neelam-Naganathan, G., Miyakawa, T., Khan, F., Kozan, O., Kawasaki, M., Sumin, S., and Latif, T.: Constraining the Emission of Particulate Matter From Indonesian Peatland Burning Using Continuous Observation Data, J. Geophys. Res., 123, 9828–9842, https://doi.org/10.1029/2018JD028564, 2018.
Lee, H.-H., Bar-Or, R. Z., and Wang, C.: Biomass burning aerosols and the low-visibility events in Southeast Asia, Atmos. Chem. Phys., 17, 965–980, https://doi.org/10.5194/acp-17-965-2017, 2017.
Liu, Y. Y., Dorigo, W. A., Parinussa, R., de Jeu, R., Wagner, W., McCabe, M., Evans, J., and van Dijk, A.: Trend-preserving blending of passive and active microwave soil moisture retrievals, Remote Sens. Environ., 123, 280–297, 2012.
Majdi, M., Turquety, S., Sartelet, K., Legorgeu, C., Menut, L., and Kim, Y.: Impact of wildfires on particulate matter in the Euro-Mediterranean in 2007: sensitivity to some parameterizations of emissions in air quality models, Atmos. Chem. Phys., 19, 785–812, https://doi.org/10.5194/acp-19-785-2019, 2019.
Marlier, M. E., DeFries, R. S., Voulgarakis, A., Kinney, P. L., Randerson, J. T., Shindell, D. T., Chen, Y., and Faluvegi, G.: El Niño and health risks from landscape fire emissions in southeast Asia, Nat. Clim. Change, 3, 131–136, https://doi.org/10.1038/nclimate1658, 2012.
Martin, M., Kahn, R. A., and Tosca, M. G.: A Global Analysis of Wildfire Smoke Injection Heights Derived from Space-Based Multi-Angle Imaging, Remote Sens., 10, 1609, https://doi.org/10.3390/rs10101609, 2018.
McMeeking, G. R., Kreidenweis, S. M., Baker, S., Carrico, C. M., Chow, J. C., Collett, J. L., Hao, W. M., Holden, A. S., Kirchstetter, T. W., Malm, W. C., Moosmüller, H., Sullivan, A. P., and Cyle, E. W.: Emissions of trace gases and aerosols during the open combustion of biomass in the laboratory, J. Geophys. Res.-Atmos., 114, 1–20, https://doi.org/10.1029/2009JD011836, 2009.
Mead, M. I., Castruccio, S., Latif, M. T., Nadzir, M. S. M., Dominick, D., Thota, A., and Crippa, P.: Impact of the 2015 wildfires on Malaysian air quality and exposure?: a comparative study of observed and modeled data, Environ. Res. Lett., 13, 044023, https://doi.org/10.1088/1748-9326/aab325, 2018.
Miettinen, J., Shi, C., and Liew, S. C.: Fire Distribution in Peninsular Malaysia, Sumatra and Borneo in 2015 with Special Emphasis on Peatland Fires, Environ. Manage., 60, 747–757, https://doi.org/10.1007/s00267-017-0911-7, 2017.
Nara, H., Tanimoto, H., Tohjima, Y., Mukai, H., Nojiri, Y., and Machida, T.: Emission factors of CO2, CO and CH4 from Sumatran peatland fires in 2013 based on shipboard measurements, Tellus B, 69, 1399047, https://doi.org/10.1080/16000889.2017.1399047, 2017.
NCEP: NCEP Global Forecast System (GFS) Analyses and Forecasts, https://doi.org/10.5065/D65Q4TSG, 2007.
Nechita-banda, N., Krol, M., Werf, G. R. Van Der, Kaiser, J. W., Pandey, S., Huijnen, V., Clerbaux, C., Coheur, P., Deeter, M. N., and Rockmann, T.: Monitoring emissions from the 2015 Indonesian fires using CO satellite data, Philos. T. R. Soc. B, 373, https://doi.org/10.1098/rstb.2017.0307, 2018.
Neuzil, G. S.: Onset and rate of peat and carbon accumulation in four domed ombrogenous peat deposits, Indonesia, in: Rieley, J. O. and Page, S. E., Biodiversity and Sustainable Management of Tropical Peatlands, Samara Publishing, Cardigan, UK, 55–72, 1997.
Page, S. E., Siegert, F., Rieley, J. O., Boehm, H. D. V., Jaya, A., and Limin, S.: The amount of carbon released from peat and forest fires in Indonesia during 1997, Nature, 420, 61–65, https://doi.org/10.1038/nature01131, 2002.
Page, S. E., Rieley, J. O., and Banks, C. J.: Global and regional importance of the tropical peatland carbon pool, Glob. Change Biol., 17, 798–818, https://doi.org/10.1111/j.1365-2486.2010.02279.x, 2011.
Putriningrum, D. A., Boersma, F., van der Molen, M., and Krol, M.: Simulating Air Pollution in the Severe Fires Event during 2015 El-Niño in Indonesia using WRF-Chem, Wageningen University and Research Center, Wageningen, the Netherlands, 2017.
Reddington, C. L., Yoshioka, M., Balasubramanian, R., Ridley, D., Toh, Y. Y., Arnold, S. R., and Spracklen, D. V: Contribution of vegetation and peat fires to particulate air pollution in Southeast Asia, Environ. Res. Lett., 9, 094006, https://doi.org/10.1088/1748-9326/9/9/094006, 2014.
Reddington, C. L., Butt, E. W., Ridley, D. A., Artaxo, P., Morgan, W. T., Coe, H., and Spracklen, D. V: Air quality and human health improvements from reductions in deforestation-related fire in Brazil, Nat. Geosci., 8, 768–771, https://doi.org/10.1038/ngeo2535, 2015.
Reddington, C. L., Spracklen, D. V., Artaxo, P., Ridley, D. A., Rizzo, L. V., and Arana, A.: Analysis of particulate emissions from tropical biomass burning using a global aerosol model and long-term surface observations, Atmos. Chem. Phys., 16, 11083–11106, https://doi.org/10.5194/acp-16-11083-2016, 2016.
Rein, G., Cleaver, N., Ashton, C., Pironi, P., and Torero, J. L.: The severity of smouldering peat fires and damage to the forest soil, Catena, 74, 304–309, https://doi.org/10.1016/j.catena.2008.05.008, 2008.
Roulston, C., Paton-Walsh, C., Smith, T. E. L., Guérette, A., Evers, S., Yule, C. M., Rein, G., and Van der Werf, G. R.: Fine Particle Emissions From Tropical Peat Fires Decrease Rapidly With Time Since Ignition, J. Geophys. Res.-Atmos., 123, 5607–5617, https://doi.org/10.1029/2017JD027827, 2018.
Shi, Y. R., Levy, R. C., Eck, T. F., Fisher, B., Mattoo, S., Remer, L. A., Slutsker, I., and Zhang, J.: Characterizing the 2015 Indonesia fire event using modified MODIS aerosol retrievals, Atmos. Chem. Phys., 19, 259–274, https://doi.org/10.5194/acp-19-259-2019, 2019.
Shimada, S., Takahashi, H., Haraguchi, A., and Kaneko, M.: The carbon content characteristics of tropical peats in Central Kalimantan, Indonesia?: Estimating their spatial variability in density The carbon content characteristics of tropical peats in Central Kalimantan, Indonesia?: Estimating their spatial vari, Biogeochemistry, 53, 249–267, https://doi.org/10.1023/A:1010618807469, 2001.
Smith, T. E. L., Evers, S., Yule, C. M., and Gan, J. Y.: In Situ Tropical Peatland Fire Emission Factors and Their Variability, as Determined by Field Measurements in Peninsula Malaysia, Global Biogeochem. Cy., 32, 18–31, https://doi.org/10.1002/2017GB005709, 2018.
Stockwell, C. E., Veres, P. R., Williams, J., and Yokelson, R. J.: Characterization of biomass burning emissions from cooking fires, peat, crop residue, and other fuels with high-resolution proton-transfer-reaction time-of-flight mass spectrometry, Atmos. Chem. Phys., 15, 845–865, https://doi.org/10.5194/acp-15-845-2015, 2015.
Stockwell, C. E., Jayarathne, T., Cochrane, M. A., Ryan, K. C., Putra, E. I., Saharjo, B. H., Nurhayati, A. D., Albar, I., Blake, D. R., Simpson, I. J., Stone, E. A., and Yokelson, R. J.: Field measurements of trace gases and aerosols emitted by peat fires in Central Kalimantan, Indonesia, during the 2015 El Niño, Atmos. Chem. Phys., 16, 11711–11732, https://doi.org/10.5194/acp-16-11711-2016, 2016.
Syaufina, L. and Sitanggang, I. S.: Peatland Fire Detection Using Spatio-Temporal Data Mining Analysis In Kalimantan, Indonesia, Journal of Tropical Forest Science, 30, 154–162, https://doi.org/10.26525/jtfs2018.30.2.154162, 2018.
Tansey, K., Beston, J., Hoscilo, A., Page, S. E., and Paredes Hernández, C. U.: Relationship between MODIS fire hot spot count and burned area in a degraded tropical peat swamp forest in Central Kalimantan, Indonesia, J. Geophys. Res., 113, D23112, https://doi.org/10.1029/2008JD010717, 2008.
Tosca, M. G., Randerson, J. T., Zender, C. S., Nelson, D. L., Diner, D. J., and Logan, J. A.: Dynamics of fire plumes and smoke clouds associated with peat and deforestation fires in Indonesia, J. Geophys. Res.-Atmos., 116, 1–14, https://doi.org/10.1029/2010JD015148, 2011.
Tosca, M. G., Randerson, J. T., and Zender, C. S.: Global impact of smoke aerosols from landscape fires on climate and the Hadley circulation, Atmos. Chem. Phys., 13, 5227–5241, https://doi.org/10.5194/acp-13-5227-2013, 2013.
Usup, A., Hashimoto, Y., Takahashi, H., and Hayasaka, H.: Combustion and thermal characteristics of peat fire in tropical peatland in Central Kalimantan, Indonesia, Tropics, 14, 1–19, https://doi.org/10.3759/tropics.14.1, 2004.
van der Werf, G. R., Randerson, J. T., Giglio, L., Collatz, G. J., Kasibhatla, P. S., and Arellano Jr., A. F.: Interannual variability in global biomass burning emissions from 1997 to 2004, Atmos. Chem. Phys., 6, 3423–3441, https://doi.org/10.5194/acp-6-3423-2006, 2006.
van der Werf, G. R., Dempewolf, J., Trigg, S. N., Randerson, J. T., Kasibhatla, P. S., Giglio, L., Murdiyarso, D., Peters, W., Morton, D. C., Collatz, G. J., Dolman, A. J., and DeFries, R. S.: Climate regulation of fire emissions and deforestation in equatorial Asia, P. Natl. Acad. Sci. USA, 105, 20350–20355, https://doi.org/10.1073/pnas.0803375105, 2008.
van der Werf, G. R., Randerson, J. T., Giglio, L., Collatz, G. J., Mu, M., Kasibhatla, P. S., Morton, D. C., DeFries, R. S., Jin, Y., and van Leeuwen, T. T.: Global fire emissions and the contribution of deforestation, savanna, forest, agricultural, and peat fires (1997–2009), Atmos. Chem. Phys., 10, 11707–11735, https://doi.org/10.5194/acp-10-11707-2010, 2010.
van der Werf, G. R., Randerson, J. T., Giglio, L., van Leeuwen, T. T., Chen, Y., Rogers, B. M., Mu, M., van Marle, M. J. E., Morton, D. C., Collatz, G. J., Yokelson, R. J., and Kasibhatla, P. S.: Global fire emissions estimates during 1997–2016, Earth Syst. Sci. Data, 9, 697–720, https://doi.org/10.5194/essd-9-697-2017, 2017.
van Leeuwen, T. T., van der Werf, G. R., Hoffmann, A. A., Detmers, R. G., Rücker, G., French, N. H. F., Archibald, S., Carvalho Jr., J. A., Cook, G. D., de Groot, W. J., Hély, C., Kasischke, E. S., Kloster, S., McCarty, J. L., Pettinari, M. L., Savadogo, P., Alvarado, E. C., Boschetti, L., Manuri, S., Meyer, C. P., Siegert, F., Trollope, L. A., and Trollope, W. S. W.: Biomass burning fuel consumption rates: a field measurement database, Biogeosciences, 11, 7305–7329, https://doi.org/10.5194/bg-11-7305-2014, 2014.
Ward, D. S., Kloster, S., Mahowald, N. M., Rogers, B. M., Randerson, J. T., and Hess, P. G.: The changing radiative forcing of fires: global model estimates for past, present and future, Atmos. Chem. Phys., 12, 10857–10886, https://doi.org/10.5194/acp-12-10857-2012, 2012.
Warren, M. W., Kauffman, J. B., Murdiyarso, D., Anshari, G., Hergoualc'h, K., Kurnianto, S., Purbopuspito, J., Gusmayanti, E., Afifudin, M., Rahajoe, J., Alhamd, L., Limin, S., and Iswandi, A.: A cost-efficient method to assess carbon stocks in tropical peat soil, Biogeosciences, 9, 4477–4485, https://doi.org/10.5194/bg-9-4477-2012, 2012.
Whitburn, S., Damme, M. Van, Clarisse, L., Turquety, S., Clerbaux, C., and Coheur, P.: Peat fires doubled annual ammonia emissions in Indonesia during the 2015 El Niño, Geophys. Res. Lett., 43, 11007–11014, https://doi.org/10.1002/2016GL070620, 2016.
Wiedinmyer, C., Akagi, S. K., Yokelson, R. J., Emmons, L. K., Al-Saadi, J. A., Orlando, J. J., and Soja, A. J.: The Fire INventory from NCAR (FINN): a high resolution global model to estimate the emissions from open burning, Geosci. Model Dev., 4, 625–641, https://doi.org/10.5194/gmd-4-625-2011, 2011.
Wiggins, E. B., Czimczik, C. I., Santos, G. M., Chen, Y., Xu, X., Holden, S. R., Randerson, J. T., Harvey, C. F., Ming, F., and Yu, L. E.: Smoke radiocarbon measurements from Indonesian fires provide evidence for burning of millennia- aged peat, P. Natl. Acad. Sci. USA, 115, 12419–12424, https://doi.org/10.1073/pnas.1806003115, 2018.
Wooster, M., Gaveau, D., Salim, M., Zhang, T., Xu, W., Green, D., Huijnen, V., Murdiyarso, D., Gunawan, D., Borchard, N., Schirrmann, M., Main, B., and Sepriando, A.: New Tropical Peatland Gas and Particulate Emissions Factors Indicate 2015 Indonesian Fires Released Far More Particulate Matter (but Less Methane) than Current Inventories Imply, Remote Sens., 10, 495, https://doi.org/10.3390/rs10040495, 2018.
Wösten, J. H. M., Clymans, E., Page, S. E., Rieley, J. O., and Limin, S. H.: Peat – water interrelationships in a tropical peatland ecosystem in Southeast Asia, Catena, 73, 212–224, https://doi.org/10.1016/j.catena.2007.07.010, 2008.
WRI (World Resources Institute): Peat lands, Accessed through Global Forest Watch, available at: https://www.globalforestwatch.org/, last access: 17 April 2017.
Zaveri, R. A., Easter, R. C., Fast, J. D., and Peters, L. K.: Model for Simulating Aerosol Interactions and Chemistry (MOSAIC), J. Geophys. Res., 113, 1–29, https://doi.org/10.1029/2007JD008782, 2008.